june 2008 lrfd bridge design 6-1 · in addition, a design example for a two-span plate girder...
TRANSCRIPT

JUNE 2008 LRFD BRIDGE DESIGN 6-1
6. STEEL STRUCTURES
6.1 Materials
Structural steel, in the form of rolled steel beams or welded plate girders, is used for bridge superstructures. In rare instances integral pier caps or substructures will be designed using steel. This section is intended to provide general design guidance and information on detailing practices. In addition, a design example for a two-span plate girder superstructure is included. Structural Steels Steel bridges are fabricated and constructed with steel elements that are produced at two different types of steel mills; shape mills and plate mills. In addition to different products, the grades of steel available from each type of mill differ slightly. Shape mills produce bars, angles, tubes, pipes, channels, “W” sections (wide flange), “S” sections (American Standard), and piling that satisfy a variety of material specifications. Standard mill lengths available for these sections range from 30 to 60 feet. With sufficient quantities and sufficient lead time, longer lengths may be available. AISC’s Modern Steel Construction yearly January issue provides information on different shapes available domestically from various mills. The designer shall check the availability of shapes before specifying their use in a structure. Plate mills produce flat sections that are used to fabricate plate girders, connections, gusset plates, etc. Plate steel is also produced in a number of different material specifications. Larger plate mills have a width limitation of 150 inches. The maximum available plate length varies by mill and cross sectional dimensions of the plate. The LRFD Specifications identify a number of steels that can be incorporated into bridge structures. They are identified in Tables 6.4.1-1 and 6.4.2-1 of the LRFD Specifications with both AASHTO and ASTM designations. Weathering steels have a “W” appended to the grade designation (e.g. 50W, 70W, 100W). Note that the AASHTO and ASTM designations are not identical. Use weathering steel (Mn/DOT 3309, 3316, or 3317) for rolled beams, plate girders, and diaphragms on all steel bridges. The AASHTO Specifications require additional tests (Charpy testing) to verify the toughness of the material. Mn/DOT Spec. 3308 requires this testing be conducted for steel incorporated into major structural components. Mn/DOT Spec. 2471.2 lists the specification numbers for
JUNE 2008 LRFD BRIDGE DESIGN 6-2
[6.4.3]
standard structural metals used in bridge projects. Structural steel of primary members shall satisfy the toughness requirements for Zone 3. Shape sections, other than pipe and tubing, are typically available in 36, 50, or 50W grades. Steel plate is available in 36, 50, and 50W grades. High Performance Steel (HPS) is available in Grades HPS50W and HPS70W. The typical steels for Mn/DOT bridge designs are Grade 50W and HPS70W. Hybrid sections may be the most cost effective, with the bottom flange in positive moment regions and both flanges near piers consisting of HPS70W, and all other steel 50W. Additional information regarding steel shapes and plates may be found in Properties of Bridge Steels, Vol. I, Chapter 3, Highway Structures Design Handbook, May 1994. The unit weight of steel is 0.490 kcf. The coefficient of thermal expansion for steel is 6105.6 −× in/in-°F. Bolts, Nuts, and Washers For most steel bridge applications ASTM A325 high strength bolts per Mn/DOT 3391.2B are to be used. The LRFD specifications also include ASTM A490 high strength bolts. Due to reduced availability and higher cost, A490 bolts should not be used without first consulting the Bridge Design Engineer. A490 bolts cannot be sold with plating, galvanizing, or mechanical zinc coating, so their use as field bolts is problematic. For applications where strength is not the primary design consideration, ASTM A307 bolts per Mn/DOT Spec. 3391.2A may be used. See Mn/DOT Spec. 3391 for additional information on fasteners. Additional fastener information may be found in Mechanical Fasteners for Steel Bridges, Vol. I, Chapter 4A, Highway Structures Design Handbook, April 1996. Dimensional and weight information for bolts, nuts, and washers is provided in Appendix Figures 6-A1 through 6-A5. Shear Connectors (Stud Welded Fasteners) The material requirements for shear connectors are listed in Mn/DOT Spec. 3391. They shall satisfy ASTM material requirements, have a yield strength of 50 ksi, and an ultimate tensile strength of 60 ksi.

JUNE 2008 LRFD BRIDGE DESIGN 6-3
Welds A variety of welding processes and materials are available to fabricators for different weld types. In most cases, designers need not concern themselves with the welding process selected by the fabricator. Typically, only fillet welds and full penetration welds are permitted. Designs using partial penetration weld details can only be used with approval from the Fabrication Methods Engineer. Base weld designs on E70 filler material. With the exception of pile splices, shear connectors, and railroad ballast plate splices, field welding is not used or permitted. Additional information on welding can be obtained from the Structural Metals Unit or Fabrication Methods Unit of the Bridge Office. Additional references are the ANSI/AASHTO/AWS Bridge Welding Code - D1.5, and Welding of Steel Bridges, Vol. I, Chap 15, Highway Structures Design Handbook. Appendix Figures 6-A6 through 6-A8 contain information on the proper construction of weld symbols and the proper application of the symbols to different types of details. Bearings Steel plates used in the fabrication of bearings shall meet Mn/DOT Spec. 3306, 3309, or 3310. Bearings made from castings shall satisfy ASTM A148, GR. 80-40. Paint Systems Use of weathering steel in Minnesota bridges has proven effective against continuous corrosion and section loss. Therefore, painting of weathering steel will only be considered under the following conditions: • Near expansion joints (within 7 feet of the joint). • Low level water crossings. • Wide grade separations that may create tunnel-like conditions
with persistent high humidity. • Where warranted as an aesthetic treatment (limited to the outside
surface and bottom flange of fascia beams). All steel bridges will be reviewed during the preliminary design process to identify whether painting is required. Preferred practice for painting is to have the primer applied in the fabrication shop and the intermediate and top or finish coat applied in the

MAY 2009 LRFD BRIDGE DESIGN 6-4
6.2 General Dimensions and Details [2.5.2.6.3]
field. Use the inorganic zinc-rich paint system (Mn/DOT Spec. 2479) for new steel designs. For maintenance painting projects, use the organic zinc-rich paint system (Mn/DOT Spec.2478). As a rule-of-thumb for the preliminary design of continuous structures, try a steel section depth of L033.0 , where L is the span length. In no case should the steel section be less than L0285.0 , unless approved by the Bridge Design Engineer. Typically a member taller than the minimum will be the most efficient. The most efficient depth of girder will vary with span and girder spacing. For large structures, perform a web depth study to arrive at the optimal girder height. Locate field splices at or near points of dead load contraflexure. Provide adequate spacing (2'-0" minimum) between field splices and diaphragm connection plates and stiffeners. Identify “Area A” on the beam or girder plan sheets. “Area A” is the portion of the top flange that is in tension due to total dead load. Identifying the tension flange is important for a number of reasons:
• For complex bridge types or curved girders where a grid or 3-D analysis is needed, a bolted tab plate connection must be used to connect connection plates to tension flanges. A fillet weld is used for the connection to the compression flange. See Details B402 (bolted diaphragms), B407 (cross frame diaphragms), B408 (cross frame diaphragms for curved beams), and B410 (bolted stiffener to flange detail).
• During fabrication, identification of the tension flange is needed to complete the nondestructive testing requirements of MN/DOT Spec. 2471.
• During construction, the contractor is allowed per Mn/DOT Spec. 2402.3D to weld screed rail supports to the top flange of steel girders, except in “Area A”.
For straight girders and those with slight curvature that meet the criteria given in LRFD Article 4.6.1.2.4b, connection plates may be connected to both the tension and compression flange using a fillet weld. Note that Standard Detail B407 allows for the use of either a welded or bolted connection. Because of its lower cost, the welded connection is preferred. The designer should first check the fatigue limit state at the diaphragm stiffener connections to determine if a welded detail is acceptable. If

MAY 2009 LRFD BRIDGE DESIGN 6-5
[C6.7.4.1]
stresses in the flange are too high to permit the welded detail, the designer should consider increasing the flange thickness to lower the stress range for fatigue or moving the diaphragm. Compare costs between the bolted option with initial flange thickness and the welded option with a thicker flange to determine the most economical option to show on the plan.
The LRFD Specifications do not explicitly give a maximum diaphragm spacing as was previously given in the Standard Specifications. Diaphragms are used for bracing the compression flange and the diaphragm spacing is used to determine allowable compressive stresses. Choose the diaphragm spacing in the positive moment area based on the maximum allowed for the bracing of the top compression flange during construction of the deck (typically 25 to 30 feet). In the negative moment area, the resistance of the bottom compression flange is based on the diaphragm spacing. The spacing in negative moment regions is usually 15 to 20 feet. When choosing the distance from the centerline of bearing to the end of beam, use a minimum of nine times the web thickness. For a steel superstructure, identify the following items on the framing plan:
• beam spacing • staging • distance between diaphragms along each beam • type of diaphragms used in different locations • centerline of bearing at piers and abutments • Working Line and Working Points • beam marks (B1, B2, etc.) • type and location of bearings • the location of intermediate stiffeners
The plate girder details shall identify plate sizes, length of plate segments, location of “Area A”, spacing of shear studs, sole plate size, bearing and intermediate stiffener size, connection plate size, splice location and type, a table showing top of field splice elevations, and all pertinent notes. Standard notes are contained in Appendix 2-H of Section 2. Structural steel plans and details must clearly describe the material to be used for each structural steel component. Even for projects where structural steel is paid for on a lump sum basis, provide informational

MAY 2009 LRFD BRIDGE DESIGN 6-6
[AISC Steel Construction Manual, 13th Edition, Table 7-16]
quantities in the plan set to quantify the amounts of different steels to be used. This is particularly true for projects with fracture critical members. Fracture critical members are fabricated to a higher quality standard to reduce the potential for defects and thus are more expensive. Do not specify members as fracture critical unless necessary and appropriate. Structural steel quantities are computed by finding the weight of steel beams or girders, diaphragms, cross frames, and all other plates (e.g., sole and gusset plates). Increase the calculated weight by 11/2% to account for the weight of steel for welds and bolt stick-through when computing structural steel quantities. Designers should provide simple details that are easily fabricated and do not sacrifice the integrity of the bridge. Details that trap water or produce an environment that is conducive to corrosion should be avoided. In addition, details with inadequate clearances are difficult to fabricate and erect. The equipment used to weld and bolt steel pieces together requires room to operate. The AISC Manual of Steel Construction contains tables with minimum clearances for bolted connections. Figure 6.2.1 describes minimum clearances that must be provided for welded components.
Figure 6.2.1
Show the type of weld to be used for each connection in the plans. The welding code (AWS-D1.5) specifies the minimum size of fillet welds. Identify the required weld size only if the minimum weld size does not have adequate capacity.

MAY 2009 LRFD BRIDGE DESIGN 6-7
6.3 General Design Philosophy
All connection details for lateral wind bracing systems shall be bolted. For box pier caps and tub girders, make access holes and manholes through diaphragms as large as possible and locate for ease of passage. The minimum opening is 2'-0" x 2'-6". Provide an access door near each end of box piers for inspection purposes. Locate the door for ladder access off the roadway, if possible, and hinge the door to swing away from traffic. Place access doors in the side of the box where protected from superstructure runoff and in the bottom of the box where exposed. Use Mn/DOT Detail B942 for the door. Door frames shall be bolted to box. Where single conduits pass through steel diaphragms and require a passage hole with a diameter greater than 3 inches, reinforce the opening with a section of pipe or curved steel plate. In general, structural steel superstructures are shallower and lighter than concrete superstructures. In addition to long span and specialty structures, steel superstructures should be considered where foundations are expensive or where a change in superstructure height has significant cost implications on the approaches. Design girders to be composite with the concrete deck throughout the entire girder length. Provide shear connectors, in the form of shear studs, in both positive and negative moment areas and over field splices. Stools are used with steel superstructures to provide a construction tolerance for the profile of the deck. The stools shall have vertical edges that are flush with the edges of the top flange. For plate girders the stool is defined as the distance between the bottom of the deck and the top of the web. For rolled beams the stool height is defined as the distance between the bottom of the deck and the bottom of the top flange. Stool heights are to be given at the centerline of the beam. The minimum height for the concrete portion of the stool is 1½ inches. This minimum is measured at the edge of the flange taking into account the cross slope of the deck. At field splices check that the top plates do not penetrate the bottom of the deck. During design, it may be assumed that the dead load of the steel beam or girder is 15% larger than that computed using only the flanges and web. This is a reasonable estimate for the weight of stiffeners, diaphragms or cross frames, and connections.

MAY 2009 LRFD BRIDGE DESIGN 6-8
6.3.1 Shear Connectors [6.10.7.4.1]
6.3.2 Fatigue
Use of the moment redistribution provisions of LRFD Appendix B is not allowed. The maximum nominal flexural resistance Fn allowed by Mn/DOT for design of steel beams is equal to Fy. Do not exceed the moment at first yield. Use a limited number of thicknesses when sizing stiffeners and connection plates. To permit two lines of bolts, connection plates must be a minimum of 7" in width. For steel superstructures with uplift at the abutments, the end diaphragms and/or counterweight shall be cast prior to deck construction and the deck shall be cast beginning at the abutment with the greatest uplift. Temporary tie-downs at the abutments may be necessary for the deck pour. Provide bent plate diaphragms (Mn/DOT Detail B402) for the following cases:
• rolled beam superstructures • plate girders with depths less than 40 inches • beam depth to lateral spacing ratio less than 0.40
In other cases, use cross frame diaphragms (Mn/DOT Detail B407). Railroad bridges designed in accordance with the AREMA Specifications may have slightly different criteria than AASHTO for high strength bolts, pin bolts, and welding. Check with the railroad in question for specific criteria. Provide 7/8 inch diameter stud connectors that extend a minimum of 2 inches above the bottom of the deck and a maximum of 3 inches below the top of the deck. Studs must be applied in the field after girder erection. Fatigue cracks are generally classified as either load induced or displacement induced. Load and stress limits are placed on members to minimize load induced fatigue cracks from forming. Proper detailing practices are used to prevent displacement induced fatigue cracks. Designers must check connections for fatigue resistance. For all Trunk Highway bridges, check details for an infinite fatigue life level regardless of ADT level.

MAY 2009 LRFD BRIDGE DESIGN 6-9
[6.10.8.1.1]
6.3.3 Deflections
Figure 6.3.2.1 identifies the appropriate fatigue category to be used for typical plate girder connections. Check all fatigue categories that apply. For discussion of “Area A” and welding vs. bolting connection plates to the tension flange, see Article 6.2 of this manual.
Figure 6.3.2.1 Detailing practices that prevent displacement induced fatigue cracks from forming include coping stiffeners and terminating welds slightly before reaching the end of an element. Tops and bottoms of transverse stiffeners and connection plates are typically coped 11/2 inches from face of web and 21/2 inches from face of flange. (See Mn/DOT Detail B411.) To ensure that bridges are constructed with a proper vertical profile, the deflections associated with selfweight, deck placement, and composite superstructure dead loads shall be presented in the plan set. Split the dead load deflection into two categories: selfweight (including diaphragms), and dead load due to deck and all superimposed loads (excluding future wearing course). Display deflections in feet with a precision of three decimal places.

JUNE 2008 LRFD BRIDGE DESIGN 6-10
6.3.4 Camber
Live load deflection shall be limited to 800/L for typical bridges and
1000/L for bridges carrying pedestrians. Calculate the live load distribution for deflection by taking the number of lanes times the multiple presence factor and divide by the number of beams. The multiple presence factor used with this calculation shall not be less than 0.85. For most steel bridges, camber is fabricated into the beam to match the profile grade and offset the deflections due to applied dead loads. In some cases, residual camber (extra camber added for architectural reasons) is also added to eliminate the possible appearance of a sag in a span. For rolled beams introducing camber can be a relatively expensive operation. It is usually accomplished with cold bending and/or with heat straightening techniques. Camber rolled beams for bridges only if the dead load deflection exceeds the maximum mill tolerance for camber, which is equal to 1/8 inch per 10 feet of length. If the deflection is less, state that the beam shall be placed “natural camber up”. Plate girders shall always be cambered. Vertical cambers are introduced by cutting the web plates into the desired profile. Horizontal curvature is introduced (if necessary) by cutting flange plates with the proper horizontal shape. During fabrication, the web and flanges are attached to each other to produce a member with the proper geometric characteristics. Camber for vertical curvature, anticipated dead load deflections, and residual camber (if required). Do not include the deflection due to future wearing course (FWC). Provide residual camber only in girders with straight grades with lengths in excess of 100 feet. Use approximately 11/2 inches of residual camber for a 100 foot span. Increase the residual camber by 1/8 inch for each 10 foot change in span length. Use a maximum residual camber of 21/2 inches. Choose a stool height that will be constant throughout the length of the girder for girders without residual camber. For girders where residual camber is used, the stool height will vary. For these situations, the stool height will have its largest value at substructure locations and smaller values near midspan. In no case is the thickness of concrete in the stool to be less than 11/2 inches. The following procedure may be used to develop a camber diagram:

JUNE 2008 LRFD BRIDGE DESIGN 6-11
1) The camber curve, a line located at the bottom of top flange for rolled beams and at the top of web for plate girders, defines the cambered shape of the member. Geometric camber, dead load camber, and residual camber (if required) are the components that make up the camber curve. Start by determining the geometric camber profile due to the vertical geometry of the roadway. To do this: • Calculate profile grade elevations at tenth points along the
member as well as at field splice and/or point of contraflexure locations.
• Calculate top of deck elevations at centerline of member by adjusting for cross slopes and offset from profile grade.
• Calculate geometric camber profile by subtracting the deck thickness and stool height.
2) Determine total dead load (minus future wearing course) deflections for the member. Downward deflections are considered negative and upward deflections are considered positive. The dead load camber profile is the opposite sign (downward +, upward -) of the total dead load deflections.
3) If there is no residual camber, add the dead load camber profile to the geometric camber profile to get the final camber curve.
4) If residual camber is required, calculate residual camber profile assuming a maximum value at midspan and parabolic distribution over the rest of the span. Then, add the residual camber profile and the dead load camber profile to the geometric profile to get the final camber curve.
5) Establish a horizontal line at the substructure centerline of bearing with the lowest camber curve elevation.
6) Establish chord lines, which are defined as straight lines between the end of each beam segment at the camber curve.
7) Determine all vertical and horizontal dimensions to be entered on camber diagram to the nearest 1/8 inch. These include: • Dimensions from horizontal line to camber curve at all support
points, field splices, and contraflexure points. • Dimensions from horizontal line to camber curve for at least three
points intermediate to those in the first bullet for each curved section. Locate one of these points at the point of maximum camber within the curved section.
• Maximum camber dimensions from chord line to camber curve for each curved section.
• Span lengths, segment lengths, and dimensions from supports to field splices and contraflexure points.
• Locations of camber dimensions along the member. Refer to Figure 6.3.4.1 for a sample camber diagram.

JUNE 2008 LRFD BRIDGE DESIGN 6-12
Figure 6.3.4.1 Sample Camber Diagram and Table

JUNE 2008 LRFD BRIDGE DESIGN 6-13
6.4 Rolled Beams
6.5 Plate Girders
[6.13.6.1.5]
[C6.10.3.4]
Rolled beams may be difficult to obtain in lengths over 90 feet. Check with the Fabrication Methods Unit prior to incorporating beams with lengths over 90 feet into a design. Use rolled beam sections with a minimum flange width of 14 inches. This will allow four lines of bolts to be used in the field splice design. For shipping purposes, limit the length between field splices to 145 feet. Select plate thickness in 1/16 inch increments for thicknesses up to 1 inch. For thicknesses between 1 and 2 1/2 inches, use 1/8 inch increments. Use 1/4 inch increments for thicknesses between 2 1/2 and 4 inches. In general, additional web thickness increases shear capacity. An increase in web height or flange area increases moment capacity and reduces live load deflections. In general, follow these guidelines in plate size selection for plate girders: Flanges For plate girder flanges, the minimum size is 3/4" x 14". The 14 inch flange permits four lines of bolts for field splices. Limit the ratio of segment length to top flange width to 85 for stability during shipping and erection. The change in flange area at butt weld splices shall not exceed 100%. In general, it is economical to provide a butt splice if 1000 to 1200 pounds or more of steel can be saved. Further discussion on this issue can be found in Article 1.5.2 of G12.1 - 2003 Guidelines for Design for Constructibility. Where practical, keep the bottom flange at a constant width over the entire girder length. Top flanges should be kept at a constant width within each field piece. Use a 24 inch radius for the taper detail where flanges need to be tapered in width. When changing the flange width and thickness at a butt splice, first taper the width and then taper the thickness. If changing the top flange width at a field splice, do not taper the flange width. When thick fill plates are required at field splices, additional rows of bolts will be required to transfer the force to the member.

JUNE 2008 LRFD BRIDGE DESIGN 6-14
6.5.1 High Performance Steel Girders
6.6 Horizontally Curved Steel Girders
[6.10.6-6.10.8]
Web For web plates the minimum thickness is 1/2 inch. The 1/2 inch web reduces the potential for warping during fabrication. Select maximum web height while still meeting clearance requirements. When choosing a web thickness, first determine the thickness at which no intermediate stiffeners are required for shear. Reduce the web thickness in 1/16 inch increments and calculate the weight of web steel saved per stiffener added. Generally, it is economical to reduce the web thickness when the weight of web steel saved per stiffener added is greater than 1000 pounds. Web thickness changes are allowed at field splices. For a thickness change of 1/16 inch, detail the web splice with a 16 gauge fill plate on one side of the web only. Longitudinal stiffeners should only be considered for girders over 84 inches deep. Terminate longitudinal stiffeners at a low stress point with a fatigue resistant detail. Generally, detail longitudinal stiffeners as continuous through transverse and bearing stiffeners. Use of High Performance Steel (HPS) Grade HPS 70W ( 70Fy = ksi) may be an economical alternative to 50 ksi steel. Typically, a hybrid design that utilizes HPS steel for the bottom flange in positive moment areas and both flanges in negative moment areas is most economical. The 2005 Interim Specifications unified Section 6 to include both straight and horizontally curved steel bridges. This article highlights some of the issues particular to curved steel design. Flexure The preliminary depth and girder spacing shown in the Preliminary Plan is determined using a straight line girder analysis with a maximum bending stress limit of 0.85Fy. Use the Preliminary Plan to develop a framing plan for review with the Design Unit Leader and Bridge Design Engineer. Once the framing plan has been approved, analyze the bridge as a system using an appropriate structural analysis program.

JUNE 2008 LRFD BRIDGE DESIGN 6-15
[6.10.9]
[6.7.4]
[4.6.1.2.4b]
[6.13.1]
Design considerations unique to horizontally curved steel girders include: • The span, radius, and skew of the girder determine whether the
curvature must be considered in the analysis. • Curved steel girders are always considered noncompact in the
positive moment region. Therefore the maximum nominal bending stress is Fy.
• Use of Appendix A or Appendix B is not allowed. • Lateral flange bending stresses due to torsion must be taken into
account. As a result, curved steel plate girder bridges usually have wider flanges than straight steel bridges.
• Horizontal curvature causes a variable load distribution that increases from inside to outside of the curve. Theoretically, flange and web sizes could be different for each girder. The designer must consider the economic benefits associated with grouping plate sizes. In other words, consider grouping the girders, using identical flange sizes for the fascia and first interior beam, the second and third interior beam, etc. Also consider carefully whether to incrementally increase the web depth from inside to outside of the curve. This practice may cause the outside beams to become too stiff, drawing too much moment to the outside fascia beam.
Shear Web shear capacity is treated the same for both straight and horizontally curved steel girders. Diaphragms Diaphragms are considered primary structural members in curved bridges. Intermediate diaphragms may be either cross frame or bent plate type (Detail B408 or B402). Use the following guidance for design and detailing of diaphragms: • Maximum diaphragm spacing given in the LRFD Bridge Design
Specifications is the lesser of R/10 or 30 feet for curved steel girders. Mn/DOT more conservatively limits the diaphragm spacing to 25 feet.
• Design diaphragms and their connections for the factored forces
and moments determined by analysis. Unlike beam splices, design for higher loads is not required. If the analysis software allows, include the deck in the analysis model to reduce diaphragm stresses.

JUNE 2008 LRFD BRIDGE DESIGN 6-16
[4.6.2.5]
• Generally, provide radial lines of diaphragms which extend across the entire width of the bridge. Diaphragms may be discontinued near the obtuse corner of skewed abutments or over skewed piers to provide flexibility between supports and adjacent members.
• Place cross frame members such that their lines of action intersect
at the center of gravity of the bolt group or produce the smallest possible moment on the bolt group that connects the gusset plate to the connection plate. If the lines of action must move, balance the forces such that moments on the connection are minimized.
• Due to the high cost of WT shapes, use angles for all cross frame
members. Place all angles with the vertical leg projection down to prevent debris from collecting in the angle.
• Due to the high cost of bolting, connect angle members to the
gusset plate with welds. Also, use a connection at the intersection of cross frame diaphragm diagonals. Use all-around welds to prevent moisture and debris from collecting between members. Consider weld details for diaphragms as Fatigue Category E, but allow a fatigue overstress of 15% per Mn/DOT policy.
• Design welds for the shear force and moment (caused by the
member eccentricity) in the plane of the weld. Neglect the out-of-plane moment caused by the vertical eccentricity of the angle. When designing welds, check if the minimum weld size is adequate and increase as needed. The weld length may also be increased depending on the connection geometry.
• Design the gusset plate for the moment induced by the connected
members. A reduction in the height of the gusset plate may be required as the full gusset plate may not aid in resisting the applied forces. Also, check the axial stress induced in the gusset plate by the connected members.
• Design cross frame members for factored axial forces. When in
compression, slenderness of the members shall be computed using an effective length factor K = 1.0.

JUNE 2008 LRFD BRIDGE DESIGN 6-17
6.7 Box or Tub Girders
[6.10.10] Miscellaneous The design of shear connectors in horizontally curved steel beams accounts for shear forces produced in the longitudinal direction by beam bending, and shear forces produced in the radial direction by the cross frames. The available curved girder analysis programs do not clearly specify the direction of cross frame forces under fatigue loadings. Since this makes it difficult to obtain an accurate net fatigue force range, cross frame forces can conservatively be added for simplicity. Design curved steel girder splices for vertical bending, lateral bending and shear. Composite section properties shall be used. Calculate camber based on dead load deflection, vertical curvature, and residual camber (if required). Compute deflections assuming the deck is poured in a 7 inch lift followed by a 2 inch wearing course. For shipping purposes, limit the length between field splices to 100 feet when the offset from the chord connecting the ends is between 3 and 6 feet. A shipping length of 145 feet can be used when the offset is less than 3 feet. Check with the Fabrication Methods Engineer for specific situations. For unusual circumstances, consider requiring the contractor to use erection shoring. Prior to using this design assumption, discuss the project with the Bridge Design Engineer and the Regional Bridge Construction Engineer. Full assembly should be considered for curved steel superstructures. Discuss use of full assembly vs. special assembly with the Fabrication Methods Engineer or Structural Metals Engineer before specifying on the Plan. Box or tub girders have rarely been used in Minnesota, but may be an economical choice for longer span bridges. Typically, they are trapezoidal in shape, with two top flanges, two webs, and a single wide bottom flange. The top flanges have shear connectors attached to them that are used to develop composite action with a cast-in-place deck. Once the deck is in place the closed shape of the cross section is effective in carrying torsional loads in addition to flexural loads. Ensure that the structure has adequate capacity prior to the development of composite action with the deck. The lateral bracing system for the top flanges must be considered during construction.

JUNE 2008 LRFD BRIDGE DESIGN 6-18
6.8 Bolted Connections and Splices
Bolted connections are used mainly in field splices, diaphragms, and metal railings. Check details to ensure that there are no bolting access or assembly problems. Splices Use 7/8 inch diameter ASTM A325 bolts. The standard bolt pattern is a 3 inch grid with edge distances of 11/2 inch. Use a maximum gap equal to 3/8 inch between the ends of spliced beams. Provide a minimum of 3 inches from the inside of the inside flange splice plates to the center of the first row of bolts in the web splice. The change in flange area at bolted splices shall not exceed 100%. The splice plates must be of the same steel as the elements being connected. The minimum thickness of splice plates is 5/16 inches. Design bolted field splices as slip-critical connections. Assume that a Class B surface coating or condition is available for slip resistance (Slip Coefficient 0.50). Include the standard plan note concerning field splice elevations on the detailed drawings. Where splice plates are 3/8 inch thick or greater, connections may be designed assuming threads are excluded from the shear plane.

JUNE 2008 LRFD BRIDGE DESIGN 6-19
6.9 Two-Span Plate Girder Design Example
A. Materials and Geometry
[6.10.1.1.1b]
This example illustrates the design of a two-span welded plate girder bridge with a 20 degree skew. The bridge is on a constant grade of 1.5% and has two equal spans of 175'-0". Mn/DOT standard details and drawings for diaphragms (B402 and B407) and railings (Fig. 5-397.117) should be referenced when reviewing this example. This example includes the detail design of a typical interior girder at the critical sections in flexure and shear for AASHTO HL-93 loading. Design of the stiffeners, end diaphragm, shear connectors, and field splice is also included. Fatigue is checked at critical locations. The superstructure consists of five girders spaced at 11'-4" centers. Girders are designed to act compositely with a 91/2 inch deck. A 1/2 inch of wear is assumed and a deck thickness of 9 inches is used for composite section properties. The following material and geometric parameters are used in this example: Concrete (deck and overlay)
Dead load unit weight 150.0wc = kcf Compressive strength 4fc =′ ksi Elastic modulus 3644Ec = ksi
Steel
Dead load unit weight 490.0wst = kcf Yield strength 50Fy = ksi Tensile strength 70Fu = ksi Elastic modulus 000,29Es = ksi
Composite Section Properties
Short-term modular ratio 8n == Long-term modular ratio 24n3 == Average Daily Truck Traffic 2000 per day
The overall geometry for the example is presented in Figures 6.9.1 and 6.9.2. Girder geometry is presented in the next section (see Figures 6.9.3 and 6.9.4) where section properties are assembled. A typical section for the bridge is shown in Figure 6.9.1. The deck is supported on five lines of girders. The girders are spaced on 11'-4" centers and the roadway is 48'-0" wide (two 12'-0" traffic lanes and two 12'-0" shoulders). A Type F-rail is provided on each side of the bridge.

JUNE 2008 LRFD BRIDGE DESIGN 6-20
The framing of the superstructure is presented in Figure 6.9.2. The structure has a 20 degree skew. Due to the symmetric span arrangement, only a half-framing plan is provided. Rolled beam end diaphragms are located at the abutments. Cross frames are used for interior diaphragms.

JUNE 2008 LRFD BRIDGE DESIGN 6-21
Figure 6.9.1

JUNE 2008 LRFD BRIDGE DESIGN 6-22
Figure 6.9.2 Partial Framing Plan

JUNE 2008 LRFD BRIDGE DESIGN 6-23
B. Determine Cross Section Properties
[6.10.2.1.1]
[6.10.2.2]
[C6.10.3.4]
Non-Composite Section Properties The minimum depth of the steel girder (see Section 6.2 of this manual) in a continuous span is L0285.0 . Mn/DOT typically considers a preliminary depth of L033.0 . For 175L = ft:
9.95L0285.0 =⋅ in 9.36L033.0 =⋅ in
A member deeper than the minimum is usually the most economical. Adequate clearance is assumed available for the example, so try a 70 inch deep web. Webs without longitudinal stiffeners must be proportioned such that:
150tD
w
≤
Then, the minimum web thickness wt is:
47.015070
150D
tw ==≥ in
Section 6.5 of this manual requires a minimum web thickness of 1/2 inch. Try a web thickness of 5/8 inch. The minimum flange width fb and flange thickness ft is:
7.11670
6D
bf ==≥ in
( ) 6875.0625.01.1t1.1t wf ==≥ in
The minimum flange size specified by Section 6.5 of this manual is 3/4" x 14". For stability during shipping and erection the minimum compression flange width cfb is:
( )
in1.1785
1212185L
bfc =⋅
=≥

JUNE 2008 LRFD BRIDGE DESIGN 6-24
[6.10.2.2]
Based on experience and the minimum proportions given above, preliminary web and flange plate sizes were chosen and are shown in Figure 6.9.3. The girder is symmetric about the pier with a 1" x 20" top flange and a 11/4" x 22" bottom flange in the positive moment region. In the negative moment region, the top flange is 13/4" x 20" near the field splice and 31/4" x 20" over the pier. The bottom flange is 13/4" x 22" near the field splice and 31/4" x 22" over the pier. For the web, a 5/8" x 70" plate is used throughout. Two additional flange proportion checks are required:
0.12t2
b
f
f ≤ and 0.10I
I1.0
yt
yc ≤≤
Make each check using the most critical section:
For 1" x 20" flange, ( ) 0.120.100.12
20t2
b
f
f <=⋅
= OK
For Design Section 1,
( )7.666
122000.1
I3
yc=
⋅= in 4
( )2.1109
122225.1
I3
yt=
⋅= in 4
60.02.11097.666
I
I
yt
yc == 0.1060.01.0 << OK
The non-composite section properties of the girder are provided in Table 6.9.1.

JUNE 2008 LRFD BRIDGE DESIGN 6-25
Figure 6.9.3 Preliminary Beam Layout – Half Elevation

JUNE 2008 LRFD BRIDGE DESIGN 6-26
[4.6.2.6]
[6.10.1.1.1b]
Table 6.9.1 Non-Composite Section Properties
Parameter Design
Section 1 * Design
Section 2 ** Design
Section 3 ***
ncd (in) 72.25 73.50 76.50
A (in 2 ) 91.25 117.25 180.25
I (in 4 ) 77,179 112,345 200,770
ty (in) 38.96 37.82 39.57
by (in) 33.29 35.68 36.93
tS (in 3 ) 1981 2970 5074
bS (in 3 ) 2318 3149 5437
* Design Section 1 is from abutment to field splice ** Design Section 2 is from field splice to flange butt splice
*** Design Section 3 is section over pier Effective Flange Width For simplicity, and in order to be conservative, the beams are designed assuming the full 91/2 inches of deck thickness is placed in a single pour instead of the actual two pours. For section property computations the deck thickness is reduced by 1/2 inch to account for wear. The width of deck effb assumed to act compositely with the girder and resist external loads is the smallest of three values:
⋅= 25.0beff (Effective span length) ( ) 368121757.025.0 =⋅⋅⋅= in
or
( ) ( )width flange Top5.0thicknessDeck 12beff ⋅+⋅= 118205.0912 =⋅+⋅= in GOVERNS
or
=effb Average beam spacing 136= in
Positive Moment Region Composite Section Properties Using the modular ratios provided earlier ( 8n = , 24n3 = ) results in:
Transformed
neff
b for transient, short-term loads
75.148
118b
neff== in

JUNE 2008 LRFD BRIDGE DESIGN 6-27
Transformed n3
effb for permanent, long-term loads
92.424118
bn3eff
== in
Choose a stool height for the girder, which is defined as the distance from the bottom of the deck to the top of the web. Because the top flange thickness varies along the girder length, the concrete portion of the stool will vary. The minimum required thickness of the concrete portion of the stool is 11/2" at the edge of the flange. Therefore, the stool height is dependent on the thickest top flange plate, which is located at the pier. The largest top flange plate is 31/4" x 20" and the deck cross slope is 2%. Then, the minimum required concrete portion of the stool height along the girder centerline is:
70.1205.002.050.1tools concmin =⋅⋅+= in Use 75.1= in
The minimum required total stool height along the girder centerline at the pier is:
0.575.125.3toolspierinm
=+= in
This bridge is on a straight grade, so residual camber is required, which “eats” into the stool at midspan. Therefore, check the minimum required stool height at midspan also to see if it governs. The required residual camber is:
44.2125.010
10017550.1amberc
esr=⋅⎟
⎠
⎞⎜⎝
⎛ −+= in
Use 50.2ambercesr
= in
The top flange plate at midspan is 1" x 20". Then, the minimum required total stool height along the girder centerline at midspan is:
25.550.275.100.1toolsmidspaninm
=++= in GOVERNS

JUNE 2008 LRFD BRIDGE DESIGN 6-28
[6.10.1.7]
[6.10.1.1.1c]
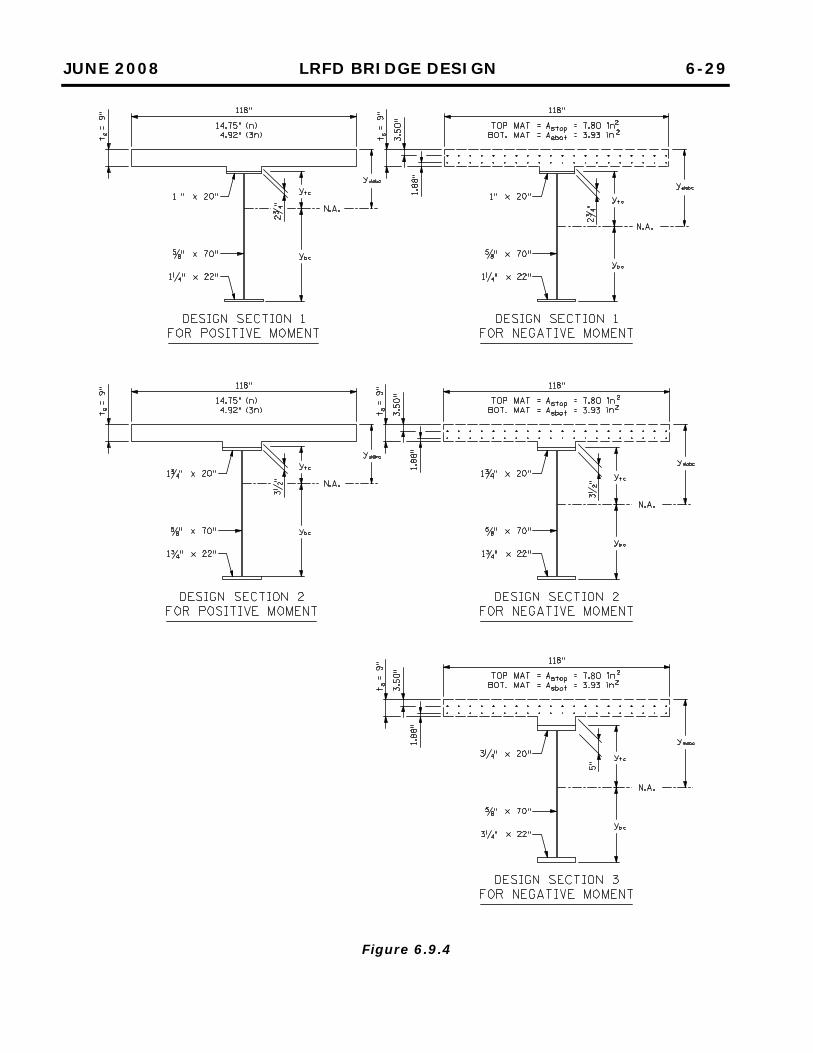
Choose a stool height of 5.25 inches. For calculation of the girder section properties, use the minimum concrete stool height cstoolt equal to 1.75 inches. See Figure 6.9.4 and Table 6.9.2 for the composite sections and computed properties used for design in the positive moment region. Note that only Design Sections 1 and 2 fall in the positive moment region. Negative Moment Region Composite Section Properties For negative moment regions, the section assumed effective in resisting external loads is the steel girder section plus the reinforcement within an effective width of the slab. In negative moment regions, the longitudinal reinforcing steel in the deck is approximately 1% of the area of the deck. Two thirds of this steel is to be placed in the top mat of reinforcement. Referring to Figure 9.2.1.7, the area of steel within the effective flange width is:
Top mat: #16 bars @ 18" with 2- #19 bars in between
( ) 80.718118
44.0231.0Atops
=⎟⎠
⎞⎜⎝
⎛⋅⋅+= in 2
Bottom mat: #13 bars @ 6"
93.36
11820.0A
bots=⎟
⎠
⎞⎜⎝
⎛⋅= in 2
The top mat is located 3.50 inches from the top of the deck (based on 3 inches clear, 1/2 inch wear, and #16 transverse bars) and the bottom mat is located 1.88 inches from the bottom (based on 1 inch clear, and #16 transverse bars). See Figure 6.9.4 and Table 6.9.2 for the composite sections and computed properties used for design in the negative moment region.
JUNE 2008 LRFD BRIDGE DESIGN 6-29
Figure 6.9.4

JUNE 2008 LRFD BRIDGE DESIGN 6-30
C. Select Applicable Load Combinations and Load Factors [1.3.3-1.3.5] [3.4.1]
Table 6.9.2 Composite Section Properties for Design
Design Section 1 for Positive Moment
*
Design Section 2 for Positive Moment
** Parameter
n 3n
Design Section 1
for Negative Moment
* n 3n
Design Section 2
for Negative Moment
**
Design Section 3
for Negative Moment
***
cA (in 2 ) 228.38 136.96 102.98 254.38 162.96 128.98 191.98
cI (in 4 ) 189,316 139,281 98,220 235,171 176,064 132,855 223,679
slabcY (in) 22.67 34.68 44.58 24.91 36.26 44.58 47.53
tcY (in) 11.92 23.93 33.83 14.16 25.51 33.83 36.78
bcY (in) 60.33 48.32 38.42 59.34 47.99 39.67 39.72
tcS (in 3 ) 15,882 5820 2903 16,608 6902 3927 6082
bcS (in 3 ) 3138 2882 2556 3963 3669 3349 5631
* Design Section 1 is from abutment to field splice ** Design Section 2 is from field splice to flange butt splice
*** Design Section 3 is section over pier The following load multipliers will be used for this example.
00.1D =η 00.1R =η 00.1I =η
Standard HL-93 loading will be used. The load combinations considered applicable to the design example are identified below: STRENGTH I: LL75.1DC25.1 ⋅+⋅ Primary applications include:
• maximum bottom flange stress in positive moment location • maximum top and bottom flange stress in negative moment
locations STRENGTH IV: DC5.1 ⋅ Primary applications include:
• maximum bottom flange stress in positive moment location • maximum top and bottom flange stress in negative moment
locations SERVICE II: LL3.1DC0.1 ⋅+⋅ Corresponds to the overload provisions in the AASHTO Standard Specifications pertaining to yield control and to slip-critical connections.

JUNE 2008 LRFD BRIDGE DESIGN 6-31
[3.4.2]
D. Live Load Distribution Factors (LLDF) for Moment [4.6.2.2.2b] [C4.6.2.2.1-1]
[4.6.2.2.1]
FATIGUE: rangeLL75.0 ⋅ Checks to limit the potential for fatigue cracks to form in a structure. CONSTRUCTION LOAD COMBINATION: temptemp LL5.1DC25.1 ⋅+⋅ During erection, the girder will need to resist stresses associated with the steel section alone. In addition, the need for diaphragms or cross frames will be determined at this stage. Due to the continuous configuration, maximum and minimum ( pγ ) load factor values will be used. IM = 15% when evaluating fatigue and fracture IM = 33% when evaluating all other limit states 1. Interior Beam Moment LLDFs For LRFD Table 4.6.2.2.1-1, a Type (a) superstructure describes the structural system used in this example. Per LRFD Table 4.6.2.2.2b-1, the approximate distribution equations can be used if these geometric constraints are met: Type (a) Cross Section Range of Applicability Limits for Flexure
Parameter Design Example Minimum Maximum
Beam Spacing (S) 11.33' 3.5' 16.0'
Slab Thickness ( st ) 9.0" 4.5" 12"
Number of Beams ( bN ) 5 4 -
Span Length (L) 175' 20' 240'
In addition to S, st , and L, the distribution equations for live load moment area also based on gK , a longitudinal stiffness parameter defined as:
( )2gg eAInK ⋅+⋅=
where n is the modular ratio, I is the non-composite girder moment of inertia, A is the non-composite area of the girder, and ge is the distance between the centers of gravity of the non-composite girder and the deck. Positive Moment Region For the positive moment region,
17977, I = in 4
25.91A = in 2

JUNE 2008 LRFD BRIDGE DESIGN 6-32
[Table 4.6.2.2.2b-1]
[3.6.1.1.2] [3.6.1.4]
0.9ts = in
96.38yt= in
21.4596.3820.9
75.1y2
t stool concrete e
t
s
g=++=++= in
( ) 62
g1011.221.4525.9177,1798K ×=⋅+⋅= in 4
Moment LLDF for one design lane loaded:
( )
1.0
3s
g3.04.0
tL12
K
LS
14S
06.0gM ⎟⎟⎠
⎞⎜⎜⎝
⎛
⋅⋅⎟⎠
⎞⎜⎝
⎛⎟⎠
⎞⎜⎝
⎛+=
( )
1.0
3
63.04.0
917512
1011.2175
33.1114
33.1106.0 ⎟
⎟⎠
⎞⎜⎜⎝
⎛
⋅⋅
⋅⎟⎠
⎞⎜⎝
⎛⎟⎠
⎞⎜⎝
⎛+=
477.0= lanes/girder
Moment LLDF for two or more design lanes loaded:
( )
1.0
3s
g2.06.0
tL12
K
LS
5.9S
075.0gM ⎟⎟⎠
⎞⎜⎜⎝
⎛
⋅⋅⎟⎠
⎞⎜⎝
⎛⎟⎠
⎞⎜⎝
⎛+=
( )
1.0
3
62.06.0
917512
1011.2175
33.115.933.11
075.0 ⎟⎟⎠
⎞⎜⎜⎝
⎛
⋅⋅
⋅⎟⎠
⎞⎜⎝
⎛⎟⎠
⎞⎜⎝
⎛+=
739.0= lanes/girder GOVERNS
Moment LLDF for fatigue: The design fatigue truck is a single lane vehicle that does not include the multiple presence factor. The tabulated approximate distribution factor equations for moment include the multiple presence factors. Therefore, remove the single lane multiple presence factor (1.2) from the LLDF for one lane loaded to get the fatigue LLDF.
398.02.1
477.0gM
f== lanes/girder
Negative Moment Region For the negative moment region (defined as between the dead load contraflexure points) use a single LLDF based on the largest negative moment section (located over the pier).
200,770 I = in 4

JUNE 2008 LRFD BRIDGE DESIGN 6-33
[Table 4.6.2.2.2b-1]
[Table 4.6.2.2.2b-1]
[4.6.2.2.2d]
180.25 A = in 2
0.9ts = in
57.39yt= in
.824557.3920.9
75.1y2
t stool concrete e
t
s
g=++=++= in
( ) 62
g10634.482.4525.180200,7708K ×=⋅+⋅= in 4
Moment LLDF for one design lane loaded:
( )
1.0
3s
g3.04.0
tL12
K
LS
14S
06.0gM ⎟⎟⎠
⎞⎜⎜⎝
⎛
⋅⋅⎟⎠
⎞⎜⎝
⎛⎟⎠
⎞⎜⎝
⎛+=
( )
1.0
3
63.04.0
917512
10634.4175
33.1114
33.1106.0 ⎟
⎟⎠
⎞⎜⎜⎝
⎛
⋅⋅
⋅⎟⎠
⎞⎜⎝
⎛⎟⎠
⎞⎜⎝
⎛+=
512.0= lanes/girder
Moment LLDF for two or more design lanes loaded:
( )
1.0
3s
g2.06.0
tL12
K
LS
5.9S
075.0gM ⎟⎟⎠
⎞⎜⎜⎝
⎛
⋅⋅⎟⎠
⎞⎜⎝
⎛⎟⎠
⎞⎜⎝
⎛+=
( )
1.0
3
62.06.0
917512
10634.4175
33.115.933.11
075.0 ⎟⎟⎠
⎞⎜⎜⎝
⎛
⋅⋅
⋅⎟⎠
⎞⎜⎝
⎛⎟⎠
⎞⎜⎝
⎛+=
793.0= lanes/girder GOVERNS
Moment LLDF for fatigue:
426.02.1
512.0gM
f== lanes/girder
2. Exterior Beam Moment LLDFs Table 4.6.2.2.2d-1 contains the approximate distribution factor equations for exterior beams. Check the value of ed to ensure they are valid.
33.167.100.3de =−= ft (see Figure 6.9.5)
0.1− ft 33.1< ft 5.5< ft OK

JUNE 2008 LRFD BRIDGE DESIGN 6-34
[Table 4.6.2.2.2d-1]
Moment LLDF for one design lane loaded: Use the lever rule and refer to Figure 6.9.5. Exterior beam reaction or distribution factor is:
5.0WW 21 == lanes
( ) ( )2.1
33.1167.633.115.067.033.115.0
gM ⋅⎥⎦
⎤⎢⎣
⎡ −⋅+−⋅=
811.0= lanes/girder
Figure 6.9.5 Moment LLDF for two or more design lanes loaded:
916.01.9
33.177.0
1.9d
77.0e e =+=+=
677.0739.0916.0gMegMint
=⋅=⋅= lanes/girder for pos. moment
726.0793.0916.0gMegMint
=⋅=⋅= lanes/girder for neg. moment

JUNE 2008 LRFD BRIDGE DESIGN 6-35
[4.6.2.2.2e]
E. Live Load Distribution Factors (LLDF) for Shear
[Table 4.6.2.2.3a-1]
[4.6.2.2.3a]
[Table 4.6.2.2.3a-1]
[4.6.2.2.3b]
Moment LLDFs for fatigue:
676.02.1
811.0gMf == lanes/girder
3. Skew Reduction Factor for Moment The framing plan is skewed 20 degrees. Although there is no modification to the moments for skew until the skew angle is 30 degrees or greater, note that Mn/DOT has set this factor to 1.0 for all steel bridges in order to boost the load rating. 1. Interior Beam Shear LLDFs Check range of applicability for use of the simplified distribution equations.
Type (a) Cross Section Range of Applicability Limits for Shear
Parameter Design Example Minimum Maximum
Beam Spacing (S) 11.33' 3.5' 16.0'
Slab Thickness ( st ) 9.0" 4.5" 12"
Number of Beams ( bN ) 5 4 -
Span Length (L) 175' 20' 240'
Pos. Mom. Long. Stiffness ( gK )
2.110 x 10 6 10,000 7.0 x 10⁶
Neg. Mom. Long. Stiffness ( gK )
4.634 x 10 6 10,000 7.0 x 10⁶
All parameters for the design example are within permissible limits. Shear LLDF for one design lane loaded:
813.025
33.1136.0
25S
36.0gV =+=+= lanes/girder
Shear LLDF for two or more design lanes loaded:
039.135
33.1112
33.112.0
35S
12S
2.0gV22
=⎟⎠
⎞⎜⎝
⎛−+=⎟⎠
⎞⎜⎝
⎛−+= lanes/girder
2. Exterior Beam Shear LLDFs Shear LLDF for one design lane loaded: Use the lever rule, which results in the same factor that was computed for flexure.

JUNE 2008 LRFD BRIDGE DESIGN 6-36
[4.6.2.2.3c]
[Table 4.6.2.2.3c-1]
811.0gV = lanes/girder
Shear LLDF for two or more design lanes loaded:
733.01033.1
6.010d
6.0e e =+=+=
762.0039.1733.0gVegV int =⋅=⋅= lanes/girder
3. Skew Correction Factor for Shear There is a modification to the shear at the obtuse corners for bridges with skewed lines of support. This example has a skew angle of 20 degrees. Type (a) Cross Sections Range of Applicability Limits for Skew Correction (Shear)
Parameter Design Example Minimum Maximum
Skew Angle ( θ ) 20 degrees 0 degrees 60 degrees
Beam Spacing (S) 11.33' 3.5' 16.0'
Number of Beams ( bN ) 5 4 -
Span Length (L) 175' 20' 240'
( ) ( )θ⋅⎟⎟⎠
⎞⎜⎜⎝
⎛ ⋅⋅⋅+= tan
KtL12
2.00.1CF
3.0
g
3s
( ) ( )20tan10110.2
9175122.00.1
3.0
6
3
⋅⎟⎟⎠
⎞⎜⎜⎝
⎛
⋅⋅⋅
⋅+=
07.1= lanes/girder at the abutment
( ) ( )20tan10634.4
9175122.00.1CF
3.0
6
3
⋅⎟⎟⎠
⎞⎜⎜⎝
⎛
⋅⋅⋅
⋅+=
05.1= lanes/girder at the pier
For simplicity, only the larger correction factor will be used to modify the live load distribution factors for shear. The adjusted shear distribution factors are: Interior Girders For one lane loaded:
870.007.1813.0gV =⋅= lanes/girder

JUNE 2008 LRFD BRIDGE DESIGN 6-37
For two or more design lanes loaded:
112.107.1039.1gV =⋅= lanes/girder
For fatigue:
725.02.1
870.0gVf == lanes/girder
Exterior Girders For one lane loaded:
868.007.1811.0gV =⋅= lanes/girder
For two or more design lanes loaded:
815.007.1762.0gV =⋅= lanes/girder
For fatigue:
723.02.1
868.0gVf == lanes/girder
Table 6.9.3 Distribution Factor Summary (Lanes/Girder)
Girder/Force Component One Lane
LLDF Multiple Lane
LLDF Governing
LLDF
+ Moment 0.477 0.739 0.739
- Moment 0.512 0.793 0.793
Shear 0.870 1.112 1.112
+ Fatigue Moment 0.398 0.398
- Fatigue Moment 0.426 0.426
Interior Girder
Fatigue Shear 0.725 0.725
+ Moment 0.811 0.677 0.811
- Moment 0.811 0.726 0.811
Shear 0.868 0.815 0.868
+ Fatigue Moment 0.676 0.676
- Fatigue Moment 0.676 0.676
Exterior Girder
Fatigue Shear 0.723 0.723

JUNE 2008 LRFD BRIDGE DESIGN 6-38
F. Calculate Force Effects
[6.10.1.5]
Axial loads generated as a result of creep, shrinkage, and thermal movements will not be considered for the design of the girders. These loads are considered in the bearing and substructure design examples. From this point forward only the design of an interior girder subject to dead load and HL-93 live loads will be presented. Unfactored bending moments, shears, and reactions at different locations along the girder are presented in Tables 6.9.5 through 6.9.12. They are based on applying the loads as follows:
• DC1 loads are applied to a continuous beam model with varying non-composite section properties (see Table 6.9.1).
• DC2 loads are applied to a composite continuous beam model consisting of the steel girder plus the concrete deck where a modular ratio of n3 is used for the section properties.
• Live loads are applied to a composite continuous beam model consisting of the steel girder plus the concrete deck with a modular ratio of n.
Table 6.9.4 presents the areas and moments of inertia used for analysis. Table 6.9.4 Composite Section Properties for Analysis
Design Section 1 *
Design Section 2 **
Design Section 3 *** Parameter
n 3n n 3n n 3n
cA (in 2 ) 228.38 136.96 254.38 162.96 317.38 225.96
cI (in 4 ) 189,316 139,281 235,171 176,064 364,078 277,092
* Design Section 1 is from abutment to field splice ** Design Section 2 is from field splice to flange butt splice
*** Design Section 3 is section over pier DC1 consists of the following loads: girder selfweight, concrete deck and wearing course, stool, and form loads. Note that Mn/DOT includes the wearing course load with DC1 loads (not DW). A 15% detail factor (based on the selfweight of the girder) is used to account for the dead load of connection and cross frame elements. A 0.010 ksf load is considered during construction to account for the weight of deck formwork.
( )⎟⎟⎟
⎠
⎞
⎜⎜⎜
⎝
⎛=⋅⋅=
3 Section - k/ft 705.02 Section - k/ft 459.01 Section - k/ft 357.0
15.1490.0144
Aw beam
beam

JUNE 2008 LRFD BRIDGE DESIGN 6-39
( ) 150.0Stool Area Deck Areawdeck ⋅+=
15.01220
12flangetop25.5
125.9
33.11 ⋅⎟⎠
⎞⎜⎝
⎛ ⋅−
+⋅=
⎟⎟⎟
⎠
⎞
⎜⎜⎜
⎝
⎛
−−−
=3Sectionft/k387.12Sectionft/k418.11Sectionft/k434.1
113.033.11010.0wforms =⋅= k/ft
A 0.020 ksf temporary construction live loading is also considered. It is assumed to be acting full length on a single span concurrent with wet concrete placement. In Table 6.9.6, DCconst consists of girder selfweight, form load, and one span of concrete. LLconst consists of one span of construction liveload. DC2 consists of long-term dead loads, barrier, and future wearing course (FWC). Note that Mn/DOT uses a FWC of 0.020 ksf and includes the FWC load with DC2 loads (not DW).
439.0wbarrier = k/ft 176.0girders 5barriers 2
=⋅ k/ft
020.0wfwc
= ksf 192.0548
=⋅ k/ft
The field splice is located 121 feet from the abutment bearing, approximately 0.69 of the span. This location was chosen as the nearest even foot along the span to the noncomposite dead load inflection point during the initial sizing. All of the DC1 loads presented in the example include the 0.010 ksf load associated with the formwork. This increases the strength design loads by 2% but greatly simplifies the calculations. In reality, the load is applied to the non-composite section but is removed from the composite section. The actual stresses are also dependent on the pour sequence for the deck. In the following tables, Girder Point 0.0 is the centerline of bearing at the abutment. Girder Point 1.0 is centerline of bearing at the pier. Due to the symmetry of the span arrangement, only data for Girder Points 0.0 to 1.0 is provided for most loads. However, due to the asymmetric loading

JUNE 2008 LRFD BRIDGE DESIGN 6-40
considered during construction, values are provided for both spans in Tables 6.9.6 and 6.9.13. Table 6.9.5 Dead Load Bending Moments (Unfactored)
DC1 Moment (k-ft) DC2 Moment (k-ft) Girder Point Girder
Slab and Stool
Forms Total Barrier FWC Total
0.0 0 0 0 0 0 0 0
0.1 329 1297 102 1728 163 178 341
0.2 549 2154 170 2873 273 297 570
0.3 659 2573 202 3434 328 357 685
0.4 659 2552 202 3413 329 359 688
0.5 550 2092 165 2807 277 302 579
0.6 331 1194 94 1619 170 186 356
0.691(1) 32 -13 -1 18 26 28 54
0.7 -2 -145 -11 -158 10 11 21
0.742(2) -186 -853 -67 -1106 -75 -82 -157
0.8 -470 -1922 -152 -2544 -204 -222 -426
0.807(3) -510 -2066 -163 -2738 -221 -242 -463
0.860(4) -819 -3197 -252 -4268 -358 -391 -749
0.871(5) -894 -3458 -272 -4624 -390 -425 -815
0.9 -1092 -4134 -326 -5552 -472 -515 -987
0.936(6) -1364 -5029 -396 -6790 -581 -633 -1214
1.0 -1918 -6778 -535 -9231 -794 -866 -1660
(1) Field splice (2) Second diaphragm away from pier (3) Midway point between first and second diaphragms away from pier (4) Flange butt splice (5) First diaphragm away from pier (6) Midway point between centerline of pier and first diaphragm away from pier

JUNE 2008 LRFD BRIDGE DESIGN 6-41
For this design example, the LRFD 6.10.3.2 constructibility checks use the values provided in Table 6.9.6. Table 6.9.6 Construction Load Bending Moments (Unfactored)
DCconst Moment (kip-ft)
Girder Point Girder
Slab and Stool
Forms Total
LLconst
Moment (kip-ft)
0.0 0 0 0 0 0
0.1 329 1677 102 2108 259
0.2 549 2902 170 3621 448
0.297(1) 657 3663 202 4522 566
0.3 659 3679 202 4540 568
0.365(2) 670 3957 205 4832 612
0.4 659 4003 202 4864 618
0.446(3) 623 4003 189 4815 618
0.5 550 3879 165 4594 599
0.6 331 3305 94 3730 511
0.691(4) 32 2385 -1 2416 369
0.7 -2 2279 -11 2266 353
0.8 -470 808 -152 186 126
0.860(5) -819 -289 -252 -1360 -43
0.9 -1092 -1109 -326 -2527 -170
1.0 -1918 -3471 -535 -5924 -538
1.1 -1092 -3124 -326 -4542 -483
1.2 -470 -2777 -152 -3399 -429
1.3 -2 -2430 -11 -2443 -376
1.309(4) 32 -2400 -1 -2369 -371
1.4 331 -2082 94 -1657 -322
1.5 550 -1736 165 -1021 -268
1.6 659 -1390 202 -529 -215
1.7 659 -1041 202 -180 -162
1.8 549 -695 170 24 -108
1.9 329 -347 102 84 -54
2.0 0 0 0 0 0
(1) Second diaphragm away from abutment (2) Midway point between second and third diaphragm away from abutment (3) Third diaphragm away from abutment (4) Field splice (5) Flange butt splice
JUNE 2008 LRFD BRIDGE DESIGN 6-42
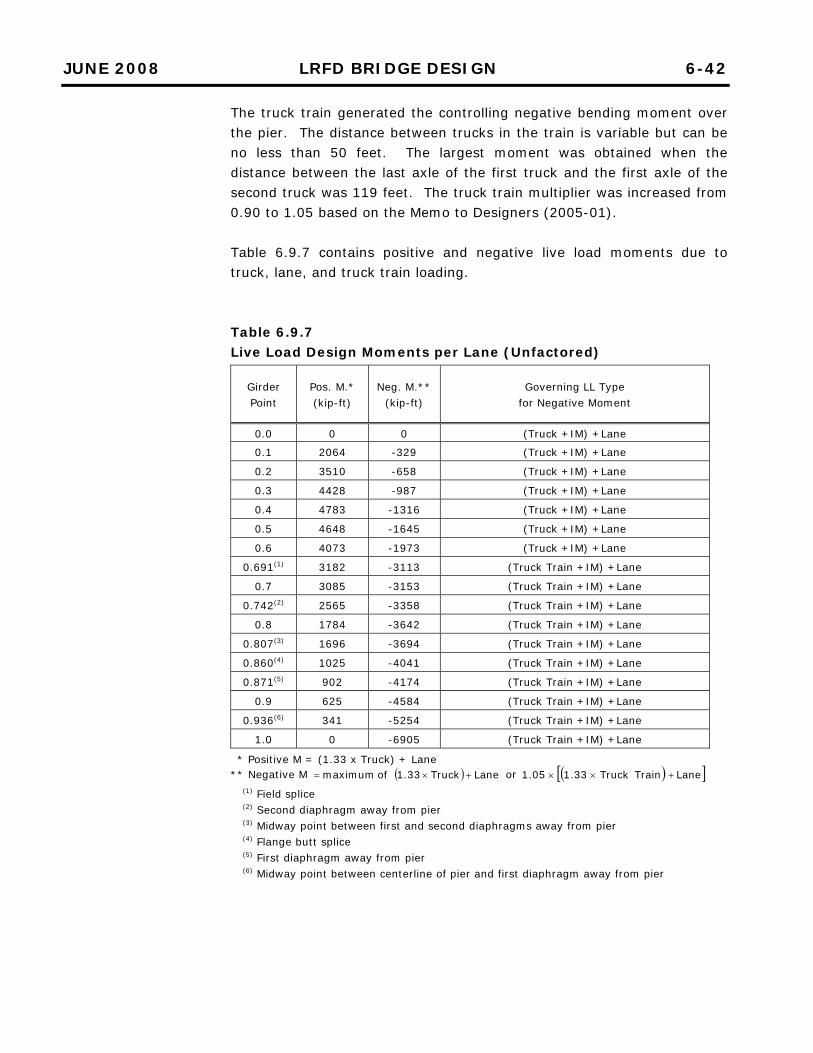
The truck train generated the controlling negative bending moment over the pier. The distance between trucks in the train is variable but can be no less than 50 feet. The largest moment was obtained when the distance between the last axle of the first truck and the first axle of the second truck was 119 feet. The truck train multiplier was increased from 0.90 to 1.05 based on the Memo to Designers (2005-01). Table 6.9.7 contains positive and negative live load moments due to truck, lane, and truck train loading. Table 6.9.7 Live Load Design Moments per Lane (Unfactored)
Girder Point
Pos. M.* (kip-ft)
Neg. M.** (kip-ft)
Governing LL Type for Negative Moment
0.0 0 0 (Truck +IM) +Lane
0.1 2064 -329 (Truck +IM) +Lane
0.2 3510 -658 (Truck +IM) +Lane
0.3 4428 -987 (Truck +IM) +Lane
0.4 4783 -1316 (Truck +IM) +Lane
0.5 4648 -1645 (Truck +IM) +Lane
0.6 4073 -1973 (Truck +IM) +Lane
0.691(1) 3182 -3113 (Truck Train +IM) +Lane
0.7 3085 -3153 (Truck Train +IM) +Lane
0.742(2) 2565 -3358 (Truck Train +IM) +Lane
0.8 1784 -3642 (Truck Train +IM) +Lane
0.807(3) 1696 -3694 (Truck Train +IM) +Lane
0.860(4) 1025 -4041 (Truck Train +IM) +Lane
0.871(5) 902 -4174 (Truck Train +IM) +Lane
0.9 625 -4584 (Truck Train +IM) +Lane
0.936(6) 341 -5254 (Truck Train +IM) +Lane
1.0 0 -6905 (Truck Train +IM) +Lane
* Positive M = (1.33 x Truck) + Lane ** Negative M ( ) Lane Truck33.1 of maximum +×= or ( )[ ]LaneTrainTruck33.105.1 +××
(1) Field splice (2) Second diaphragm away from pier (3) Midway point between first and second diaphragms away from pier (4) Flange butt splice (5) First diaphragm away from pier (6) Midway point between centerline of pier and first diaphragm away from pier
JUNE 2008 LRFD BRIDGE DESIGN 6-43
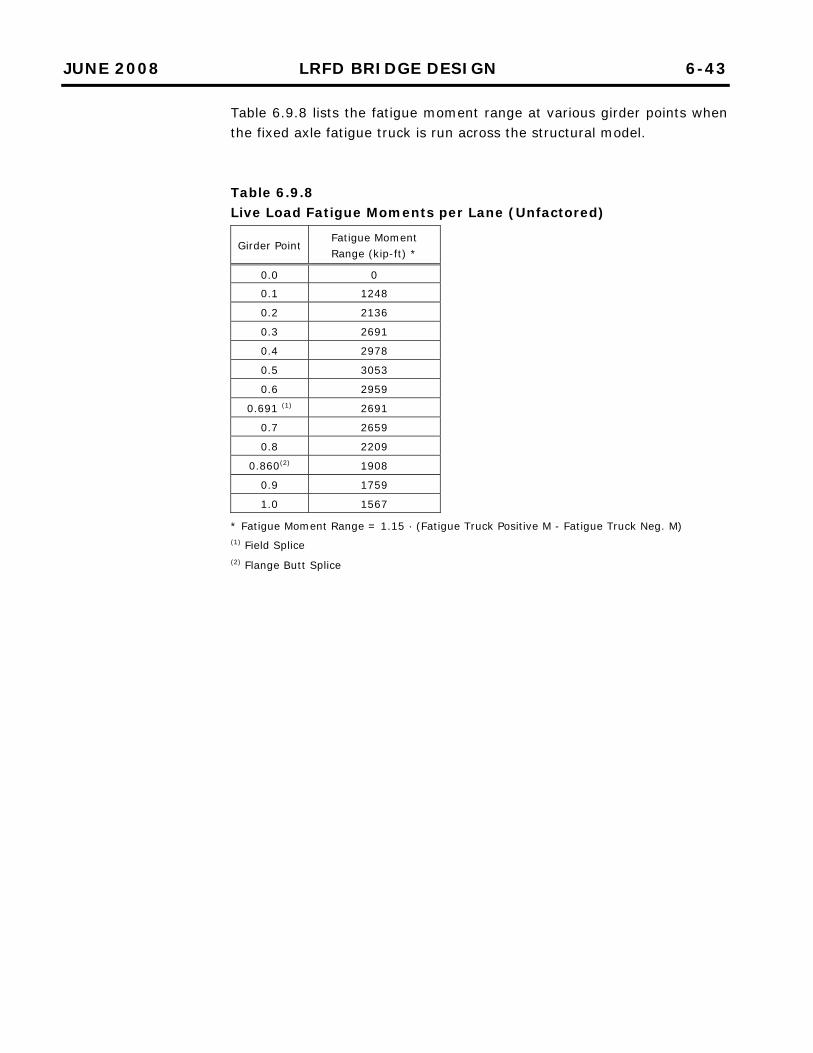
Table 6.9.8 lists the fatigue moment range at various girder points when the fixed axle fatigue truck is run across the structural model. Table 6.9.8 Live Load Fatigue Moments per Lane (Unfactored)
Girder Point Fatigue Moment Range (kip-ft) *
0.0 0
0.1 1248
0.2 2136
0.3 2691
0.4 2978
0.5 3053
0.6 2959
0.691 (1) 2691
0.7 2659
0.8 2209
0.860(2) 1908
0.9 1759
1.0 1567
* Fatigue Moment Range = 1.15 · (Fatigue Truck Positive M - Fatigue Truck Neg. M) (1) Field Splice (2) Flange Butt Splice

JUNE 2008 LRFD BRIDGE DESIGN 6-44
Table 6.9.9 presents the unfactored dead load shear forces at different girder locations for different load components. Table 6.9.9 Dead Load Shear (Unfactored)
DC1 Shear (kips) DC2 Shear (kips) Girder Point Girder
Slab and Stool
Forms Total Barrier FWC Total
0.0 22 87 7 115 11 12 23
0.1 16 62 5 82 8 8 16
0.2 9 36 3 49 5 5 10
0.3 3 11 1 15 1 2 3
0.4 -3 -14 -1 -18 -1 -2 -3
0.5 -9 -39 -3 -51 -4 -5 -9
0.6 -16 -64 -5 -85 -8 -8 -16
0.691(1) -22 -87 -7 -116 -11 -11 -22
0.7 -23 -89 -7 -119 -11 -11 -22
0.742(2) -26 -100 -8 -134 -12 -13 -25
0.8 -31 -114 -9 -154 -14 -15 -29
0.860(3) -37 -129 -10 -176 -16 -17 -33
0.871(4) -38 -132 -10 -180 -16 -17 -33
0.9 -41 -139 -11 -191 -17 -18 -35
1.0 -53 -163 -13 -230 -20 -22 -42
(1) Field splice (2) Second diaphragm away from pier (3) Flange butt splice (4) First diaphragm away from pier
Table 6.9.10 contains the dead load reactions at Abutment, (Girder Point 0.0) and Pier (Girder Point 1.0). The reactions at Girder Point 1.0 are larger than the shear at Girder Point 0.0 because the reaction includes the load from both spans. Table 6.9.10 Dead Load Reactions (Unfactored)
Girder Point DC1 Reaction (kips) DC2 Reaction (kips)
0.0 115 23
1.0 459 83
Table 6.9.11 contains the live load shear extremes for the various live load components. Per LRFD Article 3.6.1.3.1, truck train loading is not to be used for shear.

JUNE 2008 LRFD BRIDGE DESIGN 6-45
Table 6.9.11 Live Load Design Shear per Lane and Fatigue Shear (Unfactored)
Girder Point Truck + Lane
Positive Shear* (kips)
Truck + Lane Negative Shear*
(kips)
Fatigue Truck Shear Range**
(kips)
0.0 137 -19 78
0.1 116 -20 67
0.2 95 -31 57
0.3 75 -47 56
0.4 58 -63 58
0.5 43 -80 60
0.6 30 -98 62
0.691(1) 20 -114 64
0.7 19 -115 65
0.742(2) 15 -122 66
0.8 10 -132 69
0.860(3) 6 -142 71
0.871(4) 5 -144 71
0.9 4 -149 72
1.0 0 -166 76
* = (1.33 · (Truck Shear)) + Lane Shear ** = 1.15 · (Fatigue Truck Positive V - Fatigue Truck Negative V)
(1) Field splice (2) Second diaphragm away from pier (3) Flange butt splice (4) First diaphragm away from pier
Table 6.9.12 presents the live load reactions at the abutment (Girder Point 0.0) and the pier (Girder Point 1.0). Similar to the dead load reactions presented in Table 6.9.10, the reactions at Girder Point 1.0 are larger than the shear at Girder Point 0.0 because the reaction includes the load from both spans. Per LRFD Article 3.6.1.3.1 the truck train loading needs to be considered for reactions at interior supports. Table 6.9.12 Live Load Reactions per Lane (Unfactored)
Girder Point LL + IM Reaction
(kips) LL Only Reaction
(kips)
0.0 137 115
1.0 341* 294
* HL-93 Truck Train + Lane Reaction governs

JUNE 2008 LRFD BRIDGE DESIGN 6-46
Table 6.9.13 presents shear values due to construction loads. Table 6.9.13 Construction Load Shear (Unfactored)
DCconst Shear (kips) Girder Point Girder Slab+Stool Forms Total
LLconst
Shear (kips)
0.0 22 108 7 137 18
0.1 16 82 5 103 13
0.2 9 57 3 69 9
0.3 3 32 1 36 4
0.4 -3 6 -1 2 1
0.5 -9 -20 -3 -32 -3
0.6 -16 -45 -5 -66 -8
0.691(1) -22 -69 -7 -98 -11
0.7 -23 -71 -7 -101 -11
0.8 -31 -97 -9 -137 -15
0.860(2) -37 -112 -10 -159 -18
0.9 -41 -122 -11 -174 -19
1.0 Left -53 -148 -13 -214 -23
1.0 Right 53 20 13 86 3
1.1 41 20 11 72 3
1.140(2) 37 20 10 67 3
1.2 31 20 9 60 3
1.3 23 20 7 50 3
1.309(1) 22 20 7 49 3
1.4 16 19 5 40 3
1.5 9 20 3 32 3
1.6 3 20 1 24 3
1.7 -3 20 -1 16 3
1.8 -9 20 -3 8 3
1.9 -16 20 -5 -1 3
2.0 -22 20 -7 -9 3
(1) Field splice (2) Flange butt splice
The checks in this example begin with the strength checks on the preliminary layout. Designers should be aware that deflections may control the design. The deflection checks for this example are presented in Section M.

JUNE 2008 LRFD BRIDGE DESIGN 6-47
G. Flexure – Investigate Strength Limit State
G.1 Design Section 1 – Positive Moment
At the strength limit state the girder is designed to carry factored dead and live loads. The resisting section in the positive moment regions is the girder plus deck composite section. In the negative moment regions, resistance is provided by the girder plus deck reinforcement composite section. The maximum factored positive moment uM is at 0.70L4.0 = ft from each abutment.
( ) ( ) 739.0478375.1688341325.1Mu
⋅⋅++⋅=
1131261865126 =+= kip-ft
The maximum factored stresses are at 0.4L for top and bottom flanges. Refer back to Tables 6.9.1 and 6.9.2 for section properties and Tables 6.9.5 & 6.9.7 for moments. For top flange:
( )LLDFSM
75.1SM
SM
25.1f)n(tc
ILL
)n3(tc
2DC
t
1DCbuc ⎟
⎟⎠
⎞⎜⎜⎝
⎛+⎟
⎟⎠
⎞⎜⎜⎝
⎛+= +
( ) ( )( )739.012158824783
75.1125820688
19813413
25.1 ⎟⎠
⎞⎜⎝
⎛+⎟⎠
⎞⎜⎝
⎛ +=
ksi3.32=
For bottom flange:
( )LLDFSM
75.1SM
SM
25.1f)n(bc
ILL
)n3(bc
2DC
b
1DCbut ⎟
⎟⎠
⎞⎜⎜⎝
⎛+⎟
⎟⎠
⎞⎜⎜⎝
⎛+= +
( ) ( ) ( ) ( )739.01231384783
75.1122882688
23183413
25.1 ⎟⎠
⎞⎜⎝
⎛+⎟
⎠
⎞⎜⎝
⎛+=
ksi3.49= Since the bridge only has a minor skew, and the beam is an interior beam, lateral bending does not need to be considered. 0.0f =
l

JUNE 2008 LRFD BRIDGE DESIGN 6-48
[6.10.7.2.2]
[6.10.2.1.1]
[6.10.1.10.2]
[6.10.1.10.1]
[6.10.7.2.1]
The procedure for evaluating the flexural strength of a girder in accordance with the LRFD Specifications is quite involved. To clarify the steps involved, flow charts are included in LRFD Appendix C, Article C6.4. Follow the procedure shown in LRFD Figures C6.4.4-1 and C6.4.5-1. The span under consideration is continuous, but Mn/DOT does not allow design using the moment redistribution provisions of LRFD Appendix B. In addition, Mn/DOT does not permit exceeding the moment at first yield for all sections at positive moment region. Therefore, there is no need to check section compactness criteria and the check will be made in accordance with LRFD 6.10.7.2 (see LRFD Figure C6.4.5-1). Compression Flange in Positive Flexure The nominal flexural resistance of the compression flange shall be taken as: ychbnc FRRF =
First determine
bR :
150112625.070
tD
w
<== OK
The section is composite in positive flexure. Therefore web load-shedding factor Rb = 1.0. The section is homogenous. Therefore hybrid factor Rh = 1.0. Fyc = 50 ksi Then, Fnc = (1.0) (1.0) (50.0) = 50 ksi Compression flange shall satisfy:
ncfbucFf φ≤ 0.1
f=φ
( ) ( ) ksi0.500.500.1ksi3.32f
buc=<= OK

JUNE 2008 LRFD BRIDGE DESIGN 6-49
[D6.1]
[6.10.7.2.2]
[6.10.7.3]
[6.10.7.2.1]
Tension Flange in Positive Flexure
The nominal flexure resistance of tension flange shall be taken as:
ythnt FRF =
The section is homogenous, so Rh = 1.0
ksi0.50Fyt =
( ) ( ) ksi0.500.500.1Fnt == Tension flange shall satisfy:
ntfbut
Ff31
f φ≤+l
ksi3.49f
but= ksi0.0f =
l 0.1
f=φ
( ) ( ) ksi0.500.500.1ksi3.490.03.49f31
fbut
=<=+=+l
OK
The positive moment section has adequate flexural strength.
Check ductility of the section: To determine
pD use Appendix D from Section 6. The figure for load
components for positive bending sections is presented in Figure 6.9.6.
Figure 6.9.6
To simplify computations neglect the rtP and rbP terms.
=cP Force in the top flange 1000200.150 =⋅⋅= kips

JUNE 2008 LRFD BRIDGE DESIGN 6-50
=wP Force in the web 218870625.050 =⋅⋅= kips
=tP Force in the bottom flange 13752225.150 =⋅⋅= kips
=sP Force in the slab ( ) 37302075.11189485.0 =⋅+⋅⋅⋅= kips
Begin by checking Case I (PNA in the web of the girder).
356321881375PPwt
=+=+ kips
3563473037301000PPsc
>=+=+
Therefore, the PNA is not in the web. Try Case II (PNA in the top flange)
4563100021881375PPPcwt
=++=++ kips
45633730Ps
<= kips
Therefore, the PNA is in the top flange. Use the equation in LRFD Table D6.1-1 to locate the position of the PNA in the top flange.
42.011000
37301375218820.1
1P
PPP
2
ty
c
stwc
tfl=⎟
⎠
⎞⎜⎝
⎛+
−+⋅=
⎟⎟
⎠
⎞
⎜⎜
⎝
⎛+
−+⋅= in
25.7275.19dttDnccstoolst
++=++= in 0.83= in
42.075.19yttD tflcstoolsp++=++= 17.11= in
86.340.8342.0D42.0t
=⋅=⋅ in
17.11Dp= in 86.34< in OK

JUNE 2008 LRFD BRIDGE DESIGN 6-51
G.2 Design Section 3 – Negative Moment
[6.10.8.2.2]
[C6.10.8.2.2]
First, determine the maximum factored stresses at pier for the top and bottom flange. Referring back to Tables 6.9.1 and 6.9.2 for section properties and Tables 6.9.5 and 6.9.7 for moments:
For top flange:
( )LLDFS
M75.1
S
M
S
M25.1f
tc
ILL
tc
2DC
t
1DC
but⋅
⎟⎟
⎠
⎞
⎜⎜
⎝
⎛⋅+
⎟⎟
⎠
⎞
⎜⎜
⎝
⎛+⋅= +
3.50793.01260826905
75.11260821660
50749231
25.1 =⋅⋅⎟⎠
⎞⎜⎝
⎛⋅+⋅⎟⎠
⎞⎜⎝
⎛ +⋅= ksi
For bottom flange:
( )LLDFS
M75.1
S
M
S
M25.1f
bc
ILL
bc
2DC
b
1DC
buc⋅
⎟⎟
⎠
⎞
⎜⎜
⎝
⎛⋅+
⎟⎟
⎠
⎞
⎜⎜
⎝
⎛+⋅= +
3.50793.01256316905
75.11256311660
54379231
25.1 =⋅⋅⎟⎠
⎞⎜⎝
⎛⋅+⋅⎟⎠
⎞⎜⎝
⎛ +⋅= ksi
Since bridge only has minor skew, and it is an interior beam, no lateral bending needs to be considered ksi0.0f =
l
Next, determine flexural resistance of top and bottom flanges. Refer to the flow chart shown in LRFD Figure C6.4.4.-1. Mn/DOT does not use the optional provisions of Appendix A, so there is no need to check the web slenderness ratio and flange inertia ratio of LRFD Article 6.10.6.2.3. Our check will be made in accordance with LRFD 6.10.8. (See LRFD Figure C6.4.6-1.) Begin with the compression (bottom) flange, which is discretely braced. The flexural resistance of the compression flange ncF is the smaller of the local buckling resistance ( )FLBncF and the lateral torsional buckling resistance ( )LTBncF . First, check local buckling resistance.
38.3)25.3(2
22t2
bλ
fc
fc
f=
⋅==
For 50Fyc = ksi, 2.9pf =λ Then,
pffλλ < and compression flange is compact.
For a compact compression flange, flexural resistance ncF is
( ) ychbFLBncFRRF =

JUNE 2008 LRFD BRIDGE DESIGN 6-52
[6.10.1.10.2]
[D6.3.1]
[6.10.8.2.3]
[C6.10.1.10.2]
For a negative moment section, bR is dependent on the web slenderness
ratio w
c
tD2 ⋅
.
For composite negative moment sections, cD is based on the section consisting of the steel girder plus the longitudinal reinforcement. Then, 47.3625.372.39tyD
fcbcc=−=−= in
( )7.116
625.047.362
t
D2
w
c =⋅
=⋅
For 50Fy = ksi, 137rw =λ . Therefore,
rww
c
tD2
λ<⋅
and 0.1Rb = .
The girder is homogeneous (not a hybrid), so 0.1Rh = The flange local buckling resistance is:
( ) 0.500.500.10.1F FLBnc =⋅⋅= ksi
Now, determine the lateral torsional buckling resistance. At the pier, the unbraced length bL is:
5.22Lb= ft 270= in
This is to be compared with the compact bracing limit pL .
yctp F
Er0.1L ⋅⋅=
04.6
25.3223625.047.36
112
22
tb3
tD112
br
fcfc
wc
fc
t=
⎟⎠⎞
⎜⎝⎛
⋅⋅⋅
+⋅
=
⎟⎟
⎠
⎞
⎜⎜
⎝
⎛+⋅
= in
Then, ( ) 5.14550000,29
04.60.1Lp
=⋅⋅= in 270< in

JUNE 2008 LRFD BRIDGE DESIGN 6-53
Therefore, pb LL > , so check noncompact bracing limit rL .
yrtr F
ErL ⋅⋅= π
( ) 0.350.507.0F7.0F ycyr =⋅=⋅= ksi
Then, ( ) 2.5460.35
000,2904.6L
r=⋅⋅π= in 270> in
Therefore,
rbpLLL <<
And, ( ) ychbpr
pb
ych
yrbLTBnc FRR
LL
LL
FR
F11CF ⋅⋅⋅
⎥⎥⎦
⎤
⎢⎢⎣
⎡⎟⎟⎠
⎞⎜⎜⎝
⎛
−
−⎟⎟⎠
⎞⎜⎜⎝
⎛
⋅−−⋅=
Cb, moment gradient modifier, can be calculated as follows (refer to Figure 6.9.7 and LRFD C6.4.10):
Figure 6.9.7 f2 is the compression stress at centerline of pier diaphragm: f2 = 50.3 ksi fo is the compression stress at first brace point (diaphragm) away from pier:
( ) ( ) ( ) ( )793.01256314174
75.1125631815
54374624
25.1fo
⎟⎠
⎞⎜⎝
⎛+⎟
⎠
⎞⎜⎝
⎛+=
ksi3.27=

JUNE 2008 LRFD BRIDGE DESIGN 6-54
midf is the compression stress at the point midway between the centerline
of pier and first brace point away from pier:
( ) ( ) ( ) ( )793.01256315254
75.11256311214
54376790
25.1fmid
⎟⎠
⎞⎜⎝
⎛+⎟⎠
⎞⎜⎝
⎛ +=
ksi5.37=
Check if moment envelope is concave between f2 and fo. The stress at the middle of the unbraced length, '
midf , assuming a linear variation
between f2 and fo is:
ksi5.37ksi8.382
3.273.502
fff o2'
mid>=
+=
+=
Therefore, moment envelope is concave and f1 = fo = 27.3 ksi
54.03.503.27
f
f
2
1 ==
2
2
1
2
1
b f
f3.0
f
f05.175.1C
⎟⎟
⎠
⎞
⎜⎜
⎝
⎛+
⎟⎟
⎠
⎞
⎜⎜
⎝
⎛−=
( ) ( ) ( ) ( )254.03.054.005.175.1 +−= 3.227.1 <= OK
Then,
( ) 0.500.10.15.1452.546
5.145270500.1
351127.1F
LTBnc⋅⋅⋅⎥
⎦
⎤⎢⎣
⎡⎟⎠
⎞⎜⎝
⎛−−
⎟⎠
⎞⎜⎝
⎛⋅
−−⋅=
6.57= ksi > 50 ksi
Therefore,
ksi0.50F)LTB(nc=
The compression flange flexural resistance ncF is the smaller of ( )FLBncF and ( )LTBncF .
( ) 0.50FFLTBncnc
== ksi
Then, 0.500.500.1F
nc=⋅=φ ksi

JUNE 2008 LRFD BRIDGE DESIGN 6-55
[6.10.8.1.3]
G.3 Design Section 2 – Negative Moment
ksi0.50≈ksi3.50=0.0+3.50=f31
+fbuc l OK
Now, consider the tension (top) flange, which is continuously braced by the deck in its final state. Then, ( ) ( ) 0.500.500.10.1FRF ythnt =⋅⋅=⋅⋅φ=φ ksi ksi0.503.50f
but≈= OK
First, determine the maximum factored stresses at L860.0 (flange butt splice location) for the top and bottom flange. Referring back to Tables 6.9.1 and 6.9.2 for section properties and Tables 6.9.5 and 6.9.7 for moments:
For top flange:
( )LLDFS
M75.1
S
M
S
M25.1f
tc
ILL
tc
2DC
t
1DC
but⋅
⎟⎟
⎠
⎞
⎜⎜
⎝
⎛⋅+
⎟⎟
⎠
⎞
⎜⎜
⎝
⎛+⋅= +
6.41793.01239274041
75.1123927749
29704268
25.1 =⋅⋅⎟⎠
⎞⎜⎝
⎛⋅+⋅⎟
⎠
⎞⎜⎝
⎛+⋅= ksi
For bottom flange:
( )LLDFS
M75.1
S
M
S
M25.1f
bc
ILL
bc
2DC
b
1DC
buc⋅
⎟⎟
⎠
⎞
⎜⎜
⎝
⎛⋅+
⎟⎟
⎠
⎞
⎜⎜
⎝
⎛+⋅= +
8.43793.01233494041
75.1123349749
31494268
25.1 =⋅⋅⎟⎠
⎞⎜⎝
⎛⋅+⋅⎟⎠
⎞⎜⎝
⎛ +⋅= ksi
Since bridge only has minor skew, and it is an interior beam, no lateral bending needs to be considered: ksi0.0f =
l
Next, determine the flexural resistance of top and bottom flanges. Refer to the flow chart shown in LRFD Figure C6.4.4.-1. Mn/DOT does not use the optional provisions of Appendix A, so there is no need to check the web slenderness ratio and flange inertia ratio of LRFD Article 6.10.6.2.3. The check will be made in accordance with LRFD 6.10.8. (See LRFD Figure C6.4.6-1) Begin with the compression (bottom) flange, which is discretely braced. The flexural resistance of the compression flange ncF is the smaller of the local buckling resistance ( )FLBncF and the lateral torsional buckling resistance ( )LTBncF .

JUNE 2008 LRFD BRIDGE DESIGN 6-56
[6.10.8.2.2]
[C6.10.8.2.2]
[6.10.1.10.2]
[C6.10.1.10.2]
[D6.3.1]
[6.10.8.2.3]
First, check local buckling resistance.
29.6)75.1(2
22t2
b
fc
fc
f=
⋅==λ
For 50Fyc = ksi, 2.9pf =λ Then, pff λ<λ and compression flange is compact. For a compact compression flange, flexural resistance ncF is
( ) ychbFLBnc FRRF =
For a negative moment section, bR is dependent on the web slenderness
ratio, w
c
t
D2 ⋅.
For composite negative moment sections, cD is based on the section consisting of the steel girder plus the longitudinal reinforcement.
in92.3775.167.39tyD fcbcc =−=−=
( )34.121
625.092.372
t
D2
w
c =⋅
=⋅
For 50Fy = ksi, 137rw =λ . Therefore,
rww
c
tD2
λ<⋅
and 0.1Rb = .
The girder is homogeneous so 0.1Rh = The flange local buckling resistance is:
( ) 0.500.500.10.1F FLBnc =⋅⋅= ksi
Now, determine the lateral torsional buckling resistance.

JUNE 2008 LRFD BRIDGE DESIGN 6-57
[6.10.8.2.3-4]
[6.10.8.2.3]
At the flange butt splice, the unbraced length bL is:
5.22Lb= ft 270= in
This is to be compared with the compact bracing limit pL .
yctp F
Er0.1L ⋅⋅=
79.5
75.1223625.092.37
112
22
tb3
tD112
br
fcfc
wc
fc
t=
⎟⎠⎞
⎜⎝⎛
⋅⋅⋅
+⋅
=
⎟⎟
⎠
⎞
⎜⎜
⎝
⎛+⋅
= in
Then, ( ) 4.13950000,29
79.50.1Lp
=⋅⋅= in 270< in
Therefore, pb LL > , so check noncompact bracing limit rL .
yrtr F
ErL ⋅⋅π=
( ) 0.350.507.0F7.0F yyr =⋅=⋅= ksi
Then, ( ) 6.5230.35
000,2979.5L
r=⋅⋅π= in 270> in
Therefore, rbp LLL <<
And, ( ) ychbpr
pb
ych
yrbLTBnc FRR
LL
LL
FR
F11CF ⋅⋅⋅
⎥⎥⎦
⎤
⎢⎢⎣
⎡⎟⎟⎠
⎞⎜⎜⎝
⎛
−
−⎟⎟⎠
⎞⎜⎜⎝
⎛
⋅−−⋅=
bC , moment gradient modifier, can be calculated as follows:
2f is the compression stress at first brace point (diaphragm) off the pier:
ksi3.27f
2=

JUNE 2008 LRFD BRIDGE DESIGN 6-58
[6.10.8.1.3]
of is the compression stress at second diaphragm away from pier:
( ) ( ) ( )793.01233493358
75.1123349157
31491106
25.1fo
⎟⎠
⎞⎜⎝
⎛+⎟⎠
⎞⎜⎝
⎛ +=
ksi7.22= fmid is the compression stress at the point midway between the first and second diaphragm away from pier:
( ) ( ) ( )793.01233493694
75.1123349463
31492738
25.1fmid
⎟⎠
⎞⎜⎝
⎛+⎟
⎠
⎞⎜⎝
⎛+=
ksi5.33=
0.1C,Therefore123.13.275.33
f
fb
2
mid =>==
( ) 0.500.10.14.1396.523
4.139270500.1
35110.1F
LTBnc⋅⋅⋅⎥
⎦
⎤⎢⎣
⎡⎟⎠
⎞⎜⎝
⎛−−
⎟⎠
⎞⎜⎝
⎛⋅
−−⋅=
90.44= ksi
The compression flange flexural resistance ncF is the smaller of ( )FLBncF and ( )LTBncF .
( ) 90.44FFLTBncnc
== ksi
Then, 90.4490.440.1F
nc=⋅=φ ksi
ksi9.448.43f31
fbuc
<=⋅+l
OK
Now consider the tension (top) flange, which is continuously braced by the deck in its final state. Then ( ) ( ) ksi6.41ksi0.500.500.10.1FRF
ythnt>=⋅⋅=⋅⋅φ=φ OK

JUNE 2008 LRFD BRIDGE DESIGN 6-59
H. Flexure – Investigate Constructibility
H.1 Design Section 1 -Positive Moment
G.4 Design Section 1 - Negative Moment
G.5 Design Section 2 - Positive Moment
Design Section 1 was checked for negative moment following the same procedure used for Design Section 2 and found to be adequate. Design Section 2 was checked for positive moment following the same procedure used for Design Section 1 and found to be adequate. The capacity of the girders must be evaluated during construction, prior to composite action carrying the loads. For this example, the check consists of placing selfweight and formwork on both spans, while deck dead loads and a 20 psf construction live load is placed on one span. Load factors for this check are based on the values provided in LRFD Article 3.4.2, where 1.25 is used on dead loads and 1.5 is used on live loads. The maximum factored construction moment for Section 1 occurs at 0.4L:
temptemptemp u LL5.1DC25.1M ⋅+⋅=
( ) ( ) 70076185.1486425.1 =⋅+⋅= k-ft
For top flange:
( )ksi4.42
1981127007
S
Mf
t
utemp
buc=
⋅==
For bottom flange:
( ) ( )ksi3.36
2318127007
S
Mf
b
utemp
but=
⋅==
The flange lateral bending stress, lf , is assumed equal to 0.0 ksi.
The flow chart to evaluate the constructibility of the girder is shown in Appendix C6.4, Figure C6.4.1-1. Begin by checking compression (top) flange. During construction, the top flange is discretely braced.

JUNE 2008 LRFD BRIDGE DESIGN 6-60
[6.10.8.2.2]
[C6.10.8.2.2]
[6.10.3.2.1] Check flange nominal yielding:
ychfbucFRff ⋅⋅φ≤+
l
ksi0.50F0.1R0.1ychf
===φ
0.500.500.10.1FR ychf =⋅⋅=⋅⋅φ ksi
ksi0.50ksi4.420.04.42ffbuc
<=+=+l
OK
Check flexural resistance:
ncfbucFf
31
f ⋅φ≤⋅+l
0.1f =φ
ncF shall be taken as the smaller of the local buckling resistance and the lateral torsional buckling resistance. Local buckling resistance:
( ) 0.100.12
20t2
b
fc
fcf =
⋅=
⋅=λ
2.9pf =λ , for 0.50Fyc = ksi
Then, pffλλ > and compression flange is noncompact.
ychbpfrf
pff
ych
yr
)FLB(ncFRR
FR
F11F ⋅⋅⋅
⎥⎥
⎦
⎤
⎢⎢
⎣
⎡
⎟⎟
⎠
⎞
⎜⎜
⎝
⎛
−
−⎟⎟
⎠
⎞
⎜⎜
⎝
⎛
⋅−−=
λλ
λλ
=yr
F smaller of ( )
⎪⎩
⎪⎨⎧
=
=⋅=⋅
ksi0.50F
ksi0.350.507.0F7.0
yw
yc
But minimum =yr
F 0.25F5.0yc
=⋅ ksi
Therefore, ksi0.35Fyr
=
1.1635000,29
56.0FE
56.0yr
rf =⋅=⋅=λ

JUNE 2008 LRFD BRIDGE DESIGN 6-61
[6.10.8.2.3]
When checking constructability, 0.1Rb=
The girder is homogeneous, so 0.1Rh=
3.480.500.10.12.91.162.90.10
500.135
11F)FLB(nc
=⋅⋅⋅⎥⎦
⎤⎢⎣
⎡⎟⎠
⎞⎜⎝
⎛−−
⎟⎠
⎞⎜⎝
⎛⋅
−−= ksi
Lateral Torsional Buckling Resistance:
26Lb= ft 312= in
yctp F
Er0.1L ⋅⋅=
in96.370.196.38tyDfctc
=−=−=
89.4
0.1203625.096.37
112
20
tb3
tD112
br
fcfc
wc
fct
=
⎟⎠⎞
⎜⎝⎛
⋅⋅⋅
+⋅
=
⎟⎟
⎠
⎞
⎜⎜
⎝
⎛+⋅
= in
( ) 8.1170.50
000,2989.40.1L
p=⋅⋅= in
( ) 2.4420.35
000,2989.4
FE
rLyr
tr=⋅⋅π=⋅⋅π= in
Therefore, rbp LLL <<
Then ychb
pr
pb
ych
yr
b)LTB(ncFRR
LL
LL
FR
F11CF ⋅⋅⋅
⎥⎥
⎦
⎤
⎢⎢
⎣
⎡
⎟⎟
⎠
⎞
⎜⎜
⎝
⎛
−
−⎟⎟
⎠
⎞
⎜⎜
⎝
⎛
⋅−−⋅=
First determine b
C :
f2 is the compression stress at the third diaphragm away from the abutment:
( ) ( ) ( )[ ] ( )ksi1.42
1981126185.1481525.1
f2
=+
=
fo is the compression stress at the second diaphragm away from the abutment:
( ) ( ) ( ) ( )[ ]4.39
1981125665.1452225.1
f0
=⋅+
= ksi

JUNE 2008 LRFD BRIDGE DESIGN 6-62
[6.10.1.9.1]
fmid is the compression stress at the midway point between the second and third diaphragm away from the abutment:
( ) ( ) ( ) ( )[ ]1.42
1981126125.1483225.1
fmid
=⋅+
= ksi
2midff =
Therefore, 0.1Cb=
( ) 0.500.10.18.1172.442
8.1173120.500.1
0.35110.1F
)LTBnc⋅⋅⋅⎥
⎦
⎤⎢⎣
⎡⎟⎠
⎞⎜⎝
⎛−−
⎟⎠
⎞⎜⎝
⎛⋅
−−⋅=
0.41= ksi
Then, 0.41Fnc
= ksi
ksi4.42ksi0.410.411F
ncf<=⋅=⋅φ (3.4% overstress)
The top flange compression stress is greater than 3% over the factored resistance. The 20 psf construction live load was placed over the entire first span for simplicity and to be conservative. Since this is an unlikely loading case and the overstress is only at 3.4%, by engineering judgement the flexural resistance is considered adequate. Check web bend buckling. First, determine the nominal elastic web bend buckling resistance.
2
w
crw
tD
kE9.0F
⎟⎟⎠
⎞⎜⎜⎝
⎛
⋅⋅= not to exceed the smaller of ych FR and 7.0
Fyw .
6.3096.37
700.9
DD
0.9k22
c
=⎟⎠
⎞⎜⎝
⎛⋅=⎟⎟
⎠
⎞
⎜⎜
⎝
⎛⋅=
Substituting values into Equation 6.10.1.9.1-1 results in
7.63
625.070
6.3029,0009.0F
2crw=
⎥⎥⎥⎥⎥
⎦
⎤
⎢⎢⎢⎢⎢
⎣
⎡
⎟⎠
⎞⎜⎝
⎛
⋅⋅= ksi

JUNE 2008 LRFD BRIDGE DESIGN 6-63
I. Investigate the Service Limit State [6.10.4]
[6.10.3.2.1]
H.2 Design Sections 2 & 3 - Negative Moment
[6.10.3.2.2]
0.500.500.1FR ych =⋅= ksi
4.717.00.50
7.0
Fyw == ksi
Set limit at 0.50Fcrw = ksi
ksi4.42ksi0.500.500.1Frwcf
>=⋅=φ OK
Now check tension (bottom) flange:
ythfbu FRff φ≤+ l
ksi0.50F0.1R0.1 ythf ===φ
0.500.500.10.1FR ythf =⋅⋅=φ ksi
Assuming 0.0f =l ksi for constructibility check
3.36ffbut
=+l
ksi 0.50< ksi OK
The sections for negative moment were checked following the same procedure and found to be adequate. Overload provisions control the amount of permanent deflection. Refer to the flow chart shown in LRFD Figure C6.4.2-1. The Service II load combination shall apply. Flange Stress Limitations Mn/DOT limits the maximum flange stress to Fy under the Strength Limit State. LRFD Article 6.10.4.2.2 limits the maximum flange stress to 0.95 Fy under the Service II load combination:
yLLDCF95.0f3.1f0.1 ≤+
Dividing through by 0.95,
yLLDCFf37.1f05.1 ≤+

JUNE 2008 LRFD BRIDGE DESIGN 6-64
[6.10.1.9.1]
[6.10.2.1.1]
Compare the load factors above with those of the Strength Limit State. By inspection, you can see that the flanges will pass this check due to the smaller load factors associated with the Service II load combination. Bend Buckling Resistance For the composite section in positive flexure,
150112625.070
tD
w
<== no checking of bend buckling required
For the composite section in negative flexure, the compression flange stress due to the Service II Loads, cf , shall satisfy LRFD Equation 6.10.4.2.2-4. Compression stress of bottom flange at Section 3:
( ) ( ) ( ) ( ) ( ) ksi1.39793.01256316905
3.11256311660
54379231
0.1fc
=⎟⎠
⎞⎜⎝
⎛+⎟
⎠
⎞⎜⎝
⎛+=
Compression stress of bottom flange at Section 2:
( ) ( ) ( ) ( ) ( ) ksi9.33793.01233494041
3.1123349749
31494268
0.1fc
=⎟⎠
⎞⎜⎝
⎛+⎟⎠
⎞⎜⎝
⎛ +=
2
w
crw
tD
kE9.0F
⎟⎟⎠
⎞⎜⎜⎝
⎛
⋅⋅=
For Section 3:
2.3347.36
700.9
DD
0.9k2
2
c
=⎟⎠
⎞⎜⎝
⎛⋅=⎟
⎟
⎠
⎞
⎜⎜
⎝
⎛⋅=
Substituting values to arrive at the limiting stress results in
1.69
625.070
2.3329,0009.02
=
⎥⎥⎥⎥⎥
⎦
⎤
⎢⎢⎢⎢⎢
⎣
⎡
⎥⎦
⎤⎢⎣
⎡
⋅⋅ ksi

JUNE 2008 LRFD BRIDGE DESIGN 6-65
J. Investigate the Fatigue Limit State [6.10.5]
J.1 Fatigue Loading [3.6.1.4]
[6.6.1.2.2]
For Section 2:
ksi9.63
tD
kE9.0and7.30k 2
w
=
⎟⎟
⎠
⎞
⎜⎜
⎝
⎛
⋅⋅=
The upper limit is capped by the smaller of
0.50FRych= and 4.717.0
Fyw = .ksi. So, 0.50F rwc = ksi.
For Section 3:
1.39fc= ksi 0.50F rwc =< ksi OK
For Section 2:
9.33fc= ksi 0.50F rwc =< ksi OK
The web bend-buckling resistance is adequate. Although LRFD 6.6.1.2.3 states that only details with fatigue resistance Category C or lower resistance need to be evaluated during design, details that are classified as Category B′ and above should be checked. The HL-93 truck is used to generate the fatigue loads that are used to evaluate different components of a design. For fatigue, the HL-93 truck has a fixed rear axle spacing of 30 feet. In addition, a load factor of 0.75 is applied to calibrate the stresses to those observed in field studies. The dynamic load allowance for fatigue loading is 15%. Distribution for fatigue is equal to the one design lane loaded distribution, with the multiple presence factor removed (if approximate equations are used for one lane loaded).
( ) ( )nFf Δ≤Δ⋅γ
=γ load factor for fatigue 75.0=
( ) =Δf live load stress range
( ) =Δ nF nominal fatigue resistance

JUNE 2008 LRFD BRIDGE DESIGN 6-66
J.2 Check Largest Stress Range Location
J.3 Check Fatigue Details [6.6.1.2] [Table 6.6.1.2.3-1] [Table 6.6.1.2.5-3]
The unfactored fatigue moments in Table 6.9.8 are multiplied by the fatigue load factor (0.75) and the appropriate distribution factor to arrive at the design moment ranges for fatigue. In Table 6.9.14 the stresses at the positive flexure section are computed by dividing the design moment range by the composite (n) section modulus assuming the deck is effective for both positive and negative moment. Designers should note that the fatigue distribution factor for the exterior girder is significantly larger (0.676 versus 0.398/0.426) than that of the interior girders. Table 6.9.14 Fatigue Range
Fatigue
Girder Point
* Fatigue Moment Range Per Lane
(kip-ft)
** Factored Design Moment Range (kip-ft)
Top Stress Range (kip)
Bottom Stress Range (kip)
0.0 0 0 0.00 0.00
0.1 1248 373 0.28 1.42
0.2 2136 638 0.48 2.44
0.3 2691 803 0.61 3.07
0.4 2978 889 0.67 3.40
0.5 3053 911 0.69 3.48
0.6 2959 883 0.67 3.38
0.691(1) 2691 860 0.65 3.29
0.7 2659 850 0.61 2.57
0.8 2209 706 0.51 2.14
0.860(2) 1908 610 0.44 1.85
0.9 1759 562 0.37 1.05
1.0 1567 501 0.33 0.94
* Includes 15% Dynamic Load Allowance ** Girder Point 691.01.0 − : ( ) 398.075.0RangeomentMFatigue ××
Girder Point 0.1691.0 − : ( ) 426.075.0RangeomentMFatigue ×× (1) Field Splice (2) Flange butt splice
For this example, the details that should be investigated for fatigue are: the welded flange butt splices, the web to flange welds, the toe of stiffener to web welds, the toe of stiffener to flange welds, and the shear stud to top flange welds. Fatigue at the bolted field splice should also be

JUNE 2008 LRFD BRIDGE DESIGN 6-67
J.4 Fatigue Requirements for Web [6.10.5.3]
[6.10.9.3.3]
[6.10.9.2]
investigated and will be considered later. Details subject to stress ranges less than 1/2 the infinite life fatigue threshold are assumed to have infinite life. The 1/2 factor accounts for the probability that some vehicles larger than the HL-93 fatigue truck will cross the bridge. The worst case detail for fatigue is the shear stud to top flange weld which is a Category C detail. Category C details have a constant amplitude fatigue threshold (∆F)TH of 10.0 ksi. From Table 6.9.14 the largest flange stress range is 3.48 ksi. This value is below 1/2 of the constant amplitude fatigue threshold (5.0 ksi). Therefore, all of the details have an infinite fatigue life. To control out-of-plane flexing of the web under repeated live loading the following constraints are placed on webs. Interior panels of webs with transverse stiffeners, with or without longitudinal stiffeners, shall satisfy
cruVV ≤ , where uV is the maximum
elastic shear stress in the web due to unfactored permanent load and factored fatigue load. The live load used for this check is twice that presented in LRFD Table 3.4.1-1. The computations for the shear buckling resistance of the web in shear is based on the following equation:
prc CVV =
( )( ) ( ) ( )( ) 8.1268625.0700.5058.0tDF58.0Vwywp
=⋅⋅=⋅= kip
C is the ratio of shear buckling stress to shear yield strength. Since the transverse stiffener spacing exceeds 3D=17.5 ft, the web is unstiffened.
112625.070
tD
w
==
5k =
wywtD
4.750.50
0.529,00040.1
FkE
40.1 <=⋅
⋅=⋅
⋅

JUNE 2008 LRFD BRIDGE DESIGN 6-68
K. Strength Limit State Shear Resistance [6.10.9]
[Eqn. 6.10.9.3.2-6]
Then,
( )363.0
0.500.5000,29
112
57.1F
kE
tD
57.1C
2
yw
2
w
=⎟⎠
⎞⎜⎝
⎛ ⋅⋅=⎟
⎟
⎠
⎞
⎜⎜
⎝
⎛ ⋅⋅
⎟⎟
⎠
⎞
⎜⎜
⎝
⎛=
( ) 6.4608.1268363.0CVV
pcr=⋅== kip
Table 6.9.15 Shear Fatigue
Fatigue (per lane, no impact)
Girder Point
DC1 Shear (kips)
DC2 Shear (kips)
Minimum Shear (ksi)
Maximum Shear (ksi)
*
uV
(kips)
0.0 115 23 69 224
0.1 82 16 58 171
0.2 49 10 48 119
0.3 15 3 39 67
0.4 -18 -3 -30 -59
0.5 -51 -9 -38 -108
0.6 -85 -16 -47 -160
0.691(1) -116 -22 -54 -206
0.7 -119 -22 -56 -211
0.8 -154 -29 -64 -263
0.860(2) -176 -33 -68 -294
0.9 -191 -35 -70 -314
1.0 -230 -42 -76 -367
* ( ) 15.10.275.0725.0Shear Minimumor Shear aximumM2DC1DC ××××++ (1) Field Splice (2) Flange butt splice
The shear stresses at all girder points are well below the 460.6 kip permitted. The web satisfies the shear fatigue checks. Within the commentary to LRFD Article 6.10.9.1 a flow chart identifies the steps for the shear design of I-sections. A copy of the flow chart is provided below in Figure 6.9.8.

JUNE 2008 LRFD BRIDGE DESIGN 6-69
[6.10.9.2]
[6.10.9.3.2]
[C6.10.9.1]
Figure 6.9.8
Determine the maximum shear capacity of the section with an unstiffened web and compare that to the required shear resistance.
pn VCV =
( )( ) ( ) ( )( ) 8.1268625.0700.5058.0tDF58.0Vwywp
=⋅⋅=⋅⋅= kips
C is dependent on the web depth to thickness ratio.
112625.070
tD
w
==
The appropriate equation for C is selected based on how slender the web is: for unstiffened web, 0.5k =

JUNE 2008 LRFD BRIDGE DESIGN 6-70
K.1 Pier Region
[6.10.9.3.2]
[6.5.4.2]
[6.10.9.1]
wywtD
4.750.50
0.529,00040.1
FkE
40.1 <=⋅
⋅=⋅
⋅
Then,
( )363.0
0.500.5000,29
112
57.1F
kE
tD
57.1C
2
yw
2
w
=⎟⎠
⎞⎜⎝
⎛ ⋅⋅=⎟
⎟
⎠
⎞
⎜⎜
⎝
⎛ ⋅⋅
⎟⎟
⎠
⎞
⎜⎜
⎝
⎛=
The capacity of the unstiffened web is:
6.4608.1268363.0Vn
=⋅= kips
0.1v =φ
( ) ( ) 6.4606.4600.1VVnvr
==φ= kips
Assume the critical section for shear is at Girder Point 1.0. Based on Tables 6.9.3, 6.9.9, and 6.9.11, the factored shear force over the pier is:
( ) 663112.116675.14223025.1V)0.1(u
=⋅⋅++⋅= kips nVφ>
The resistance of an unstiffened web is less than the demand of 663 kips; therefore, transverse stiffeners are required near the pier. In order to qualify as a stiffened web, the maximum spacing for transverse stiffeners is three times the depth of the web:
( ) 210703D3 =⋅= in = 17.5 ft
The diaphragms in the region of the pier are spaced at 22.5 feet. The diaphragm connection plates act as web stiffeners. Try adding a stiffener midway between the pier and the first diaphragm away from the pier. Then do = 11.25 ft = 135 in Compute k:
3.6
70135
55
D
d
55k
22
o
=
⎥⎦⎤
⎢⎣⎡
+=
⎥⎥⎦
⎤
⎢⎢⎣
⎡+=

JUNE 2008 LRFD BRIDGE DESIGN 6-71
1126.840.50
3.629,00040.1
FkE
40.1yw
<=⋅
⋅=⋅
⋅
457.00.50
3.6000,29
625.070
57.1F
kE
tD
57.1C
2
yw
2
w
=⎟⎠
⎞⎜⎝
⎛ ⋅⋅
⎟⎠⎞
⎜⎝⎛
=⎟⎟
⎠
⎞
⎜⎜
⎝
⎛ ⋅⋅
⎟⎟
⎠
⎞
⎜⎜
⎝
⎛=
For an interior panel at Girder Point 1.0,
( ) ( )ftftfcfc
w
tbtbtD2
⋅+⋅⋅ ( )( )
( )( ) ( )( ) 5.264.025.32025.322
625.0702<=
+=
Then,
( )
⎥⎥⎥⎥⎥⎥⎥
⎦
⎤
⎢⎢⎢⎢⎢⎢⎢
⎣
⎡
⎟⎟⎠
⎞⎜⎜⎝
⎛+
−⋅+⋅=
2
o
pn
D
d1
C187.0CVV
( )8.855
70135
1
457.0187.0457.08.1268
2=
⎥⎥⎥⎥⎥⎥
⎦
⎤
⎢⎢⎢⎢⎢⎢
⎣
⎡
⎟⎠⎞
⎜⎝⎛+
−⋅+⋅= kips
( ) ( ) 8.8558.8550.1VVnvr
=⋅=φ= kips 663> kips OK
Check if an additional stiffener is required midway between the first and second diaphragm away from the pier by checking the shear at the first diaphragm (0.871 girder point).
( ) kips6.460kips5.546112.114475.13318025.1V)871.0(u
>=⋅⋅++⋅=
Therefore an additional stiffener is needed. Check if another stiffener is needed between the second and third diaphragm by checking the shear at the second diaphragm (0.742 girder point).
( ) ( ) 112.112275.12513425.1Vu(0.742)
⋅⋅++⋅=

JUNE 2008 LRFD BRIDGE DESIGN 6-72
K.2 Abutment Region
[6.10.9.2-1]
K.3 Transverse Stiffener Design [6.10.11.1]
[6.10.11.1.2]
kips6.460kips2.436 <= OK
Therefore, stiffeners are not required between the second and third diaphragms away from the pier. From previous calculations, the capacity of the unstiffened web is
kips6.460Vr=
At Girder Point 0.0 the shear demand is:
( ) ( ) 6.4601.439112.113775.12311525.1V)0.0(u
<=⋅⋅++⋅= kips
The web has adequate capacity at the abutment without stiffeners. Ideally the size of the stiffener should be coordinated with the cross frame connection plates. Fabrication of the girder will be simplified if only one plate size and thickness is welded to the web at non-bearing locations. In addition, transverse stiffeners and diaphragm connection plates should be detailed with widths that are in 1/4 inch increments. This provides the fabricator additional flexibility. They can either cut the stiffeners and connection plates out of large mill plate or utilize standard flat bar stock. Transverse stiffeners are required near the pier. Mn/DOT Detail B411 (Stiffener Details) addresses the constraints placed on stiffeners in LRFD Article 6.10.11.1.1. The dimensions of transverse stiffeners are required to fall within geometric constraints based on section depth, flange width, and projecting element thickness. Begin with the projecting width constraint:
33.43070
0.230D
0.2bt
=+=+≥ in
Try a single 8" x 1/2" stiffener.
8bt= in in50.0t
p=

JUNE 2008 LRFD BRIDGE DESIGN 6-73
[6.10.11.1.3]
Check flange width constraint:
in0.850.00.16t0.16p
=⋅=⋅ OK
( ) in0.8in5.52225.0b25.0f
<=⋅=⋅ OK
In addition to good aspect ratios, stiffeners must also have an adequate moment of inertia.
5.033.10.213570
5.20.2dD
5.2J22
o
<−=−⎟⎠
⎞⎜⎝
⎛⋅=−
⎟⎟
⎠
⎞
⎜⎜
⎝
⎛⋅=
Therefore, 5.0J = . For a transverse stiffener spacing of 135 inches, the shear buckling resistance of the web Vcr is: kips663kips8.5798.1268457.0CVV
pcr<=⋅==
Because the factored shear force Vu (1.0) is greater than Vcr, the required stiffness It of the stiffeners shall satisfy:
5.1
yw
3.1
t
4
t E
F
40
DI.Min ⎟
⎟
⎠
⎞
⎜⎜
⎝
⎛⋅
ρ≥
=ρt larger of ⎩⎨⎧
0.1
FF rscyw
1.35
5.08
000,2931.0F
t
b
E31.0F
2ys2
p
t
rsc=
⎟⎠⎞
⎜⎝⎛
⋅=≤
⎟⎟
⎠
⎞
⎜⎜
⎝
⎛
⋅= ksi ksi50F
ys=<
42.11.35
50F
F
crs
yw ==
42.1t=ρ
( ) ( )8.67
000,290.50
0.4042.10.70
I.Min5.13.14
t=⎟⎟
⎠
⎞⎜⎜⎝
⎛⋅
⋅≥ in 4

JUNE 2008 LRFD BRIDGE DESIGN 6-74
K.4 Bearing Stiffener Design [6.10.11.2.1]
[6.10.11.2.2]
[6.10.11.2.3]
[6.10.11.2.4b]
[6.10.11.2.4]
The stiffener moment of inertia taken about the edge in contact with the web is:
Actual 8.673.8585.031
I 3
t>=⋅⋅= in 4 OK
For welded plate girders, bearing stiffeners are needed at both the abutments and piers. Abutment Bearing The reaction to be carried by the bearing stiffeners is:
( ) ( ) 439112.113775.12311525.1Ru
=⋅⋅++⋅= kips
Similar to transverse stiffeners, there are constraints on the geometry of bearing stiffeners. The bearing stiffeners should extend close to the outside edges of the narrower flange, which is 20 inches in width. Try a 1" x 9" wide bearing stiffener on each side of the web. Begin by checking the projecting width.
( ) in00.9in56.1150
29,0000.148.0
FE
t48.0ys
p>=⋅⋅=⋅⋅ OK
The bearing resistance check is based on the net area of steel in contact with the flange. Assume a 11/2 inch cope at the bottom of the stiffener in accordance with Mn/DOT Detail B411.
( ) ( )[ ] ( ) 10500.5025.10.900.14.1FA4.1Ryspnnsb
=⋅⋅−⋅⋅=⋅⋅= kips
( ) ( ) 105010500.1Rsbb
=⋅=⋅φ kips 439> kips OK
Now check the axial resistance of the bearing stiffeners. The stiffeners will act like a column while supporting the bearing reaction. The effective section consists of the stiffeners, plus wt9 (thickness of the girder web) on each side of the stiffeners (see Figure 6.9.9). The area for this column is:
03.25625.025.1120.90.1A =⋅+⋅⋅= in 2

JUNE 2008 LRFD BRIDGE DESIGN 6-75
[6.9.4.2]
The moment of inertia about the girder web is:
( ) 433 in6.538625.180.1121
625.00.125.11121
I =⋅⋅+⋅−⋅=
The radius of gyration is:
in64.403.256.538
AI
r ===
Check the width/thickness limits of Article 6.9.4.2
84.100.50
29,00045.0
FE
ky
=⋅=⋅
84.100.90.10.9
tb
<== OK
Figure 6.9.9 “Column” for Bearing Stiffener at Abutment

JUNE 2008 LRFD BRIDGE DESIGN 6-76
[6.9.3]
L. Design Shear Connectors [6.10.10]
[6.9.4.1]
K.5 Shear Resistance During Construction [6.10.3.3]
[6.9.2.1]
[6.10.11.2.4a] Check slenderness ratio: The effective length ( lK ) of the column is ( ) 5.527075.0D75.0 =⋅= in
1203.1164.45.52
rK
<==l OK
Determine factored axial resistance:
02.029,000
0.5064.4
5.52E
F
rK
2ys
2
=⋅⎟⎠
⎞⎜⎝
⎛π⋅
=⋅⎟⎠
⎞⎜⎝
⎛π⋅
=λl
Since 25.2<λ ,
( ) ( ) 124103.250.5066.0AF66.0P 0.02
syn=⋅⋅=⋅⋅= λ kips
( ) ( ) 1117124190.0PPncr
=⋅=φ= kips > 439 kips OK
Therefore, use a pair of 1" x 9" bearing stiffeners at the abutments. Using the same design procedure, a pair of 11/2" x 9" bearing stiffeners were found adequate to carry the factored pier reaction of 1341 kips. The web is to be investigated for the sum of factored permanent loads and factored construction loads applied to the non-composite section during construction. The web shall satisfy
crvuVV φ< . The normal shear
resistance for this check is limited to the shear yielding or shear buckling resistance per Article 6.10.9.3.3. Using the same procedure used above, calculations show that the web has adequate capacity during construction. Shear connectors are to be placed along the full length of the girder, including negative moment regions, because the girder is designed as composite for negative moment. Shear connectors are designed to satisfy fatigue constraints after which a strength check is performed. Assume that 7/8 inch diameter shear connectors will be used. The minimum transverse spacing for connectors is 4.0 stud diameters. For 7/8 inch diameter studs, this translates into a minimum spacing of

JUNE 2008 LRFD BRIDGE DESIGN 6-77
[6.10.10.2]
L.1 Fatigue Limit State [6.10.10.1.2]
31/2 inches. The minimum clear distance from a stud to the edge of a flange is 1.0 inch. With a 20 inch top flange width, the maximum number of stud spaces placed in a line across the flange is:
( )9.4
5.3875.01220
=−⋅− spaces
Five studs across the flange is permissible, but use four shear studs at each location. The studs must extend a minimum of 2 inches into the deck and have a minimum of 3 inches of cover. At midspan, the amount of concrete stool is 1.75 inches. At the pier, the amount of concrete stool is 2 inches. Choose a stud height of 5 inches. The pitch P (longitudinal spacing) of each set of studs shall satisfy:
sr
r
VZn
p Max⋅
≤
The shear fatigue resistance of an individual connector is based on the
number of fatigue cycles anticipated: 22r d
25.5
d=Z ≥α .
where α = 34.5 – 4.28·log N The lower bound corresponds to the resistance for a stud subjected to approximately 26,200,000 cycles. For sections near pier: ADTT = 2000 Design Life = 75 years From LRFD Table 6.6.12.5-2, use 1.5 cycles per truck passage. Then cycles000,200,26cycles000,125,827536520005.1N >=⋅⋅⋅=
The lower bound governs:
11.2875.025.5
d25.5
Z 22
r=⋅=⋅= kips
For sections away from pier:

JUNE 2008 LRFD BRIDGE DESIGN 6-78
From Table 6.6.12.5-2, 1.0 cycles per truck passage shall be used.
cycles000,200,26cycles000,750,547536520000.1N >=⋅⋅⋅=
The lower bound governs:
11.2Zr= kips
Vsr is to be computed as follows:
( ) ( )2fat2
fatsr FVV +=
For a straight span, fatF may be taken as 0.
Then I
QVVV f
fatsr==
The inertia values are taken from Table 6.9.2: For the positive moment region, 189,316I = in 4 . For the negative moment region, 132,855I = in 4 (value for the smaller negative moment section). Now compute the “Q” values. For the positive moment region:
241229
75.192.11911881
2
ttytb
n1
Q s
cstooltcseff=⎟
⎠
⎞⎜⎝
⎛++⋅⋅⋅=⎟
⎟⎠
⎞⎜⎜⎝
⎛++⋅⋅⋅= in 3
For the negative moment region, only the area of steel in the concrete deck is considered.
( ) ( ) ( ) ( )( ) 29.4
93.380.788.193.35.580.7
dr_avg
=++
= inches from bottom of deck
( ) ( ) ( ) ( )29.475.183.3393.380.7dtyAAQr_avgcstooltcrbrt
+++=+++=
468= in 3
Knowing n, rZ , I, and Q leaves the pitch to be a function of the fatigue shear force range Vf. For the positive moment region
fff
r
V662
1224V189,31611.24
QV
IZnp Max =
⋅⋅⋅
=⋅
⋅⋅≤

JUNE 2008 LRFD BRIDGE DESIGN 6-79
L.2 Strength Limit State [6.10.10.4]
[6.10.10.4.3]
[6.5.4.2]
For the negative moment region the required pitch is
fff
r
V2396
468V,85513211.24
QV
IZnp Max =
⋅⋅⋅
=⋅
⋅⋅≤
Table 6.9.16 Shear Connector Spacing For Fatigue
Girder Point
* Fatigue Shear LLDF
** Factored Fatigue Shear
Range Vf (kips)
Max p (Positive)
(in)
Max p (Negative)
(in)
*** Max p Limit (in)
0.0 0.725 42 16 24
0.1 0.725 36 18 24
0.2 0.725 31 21 24
0.3 0.725 31 22 24
0.4 0.725 31 21 24
0.5 0.725 33 20 24
0.6 0.725 34 20 24
0.7 0.725 35 19 24
0.8 0.725 37 64 24
0.9 0.725 39 61 24
1.0 0.725 41 58 24
* See Table 6.9.3 ** 0.75 · LLDF · Fatigue Truck Shear Range from Table 6.9.11
*** Per LRFD 6.10.10.1.2, the maximum limit for spacing of shear connectors is 24 inches and minimum limit is 6d 25.5875.06 =⋅= in
By inspection, the negative moment fatigue requirements are satisfied if 2 studs are placed on a 20 inch spacing. In addition to fatigue, adequate studs are needed to ensure that the cross sections can generate the flexural resistance computed earlier. The factored shear resistance of a single shear connector rQ , shall be taken as:
nscr QQ φ=
=φsc resistance factor 85.0= The nominal resistance of a shear connector Qn is:
kips2.363644460.05.0EfA5.0Qccscn
=⋅⋅⋅=⋅′⋅⋅=

JUNE 2008 LRFD BRIDGE DESIGN 6-80
[6.10.10.4.2]
[6.10.10.4.1]
But, 366060.0FAQuscn
=⋅=⋅≤ kips
6.303685.0QQ nr =⋅=φ= kips
The minimum number of shear connectors, n , shall be taken as:
rQP
n =
where, =P total nominal shear force (Article 6.10.10.4.2). For the region between the point of maximum positive ILL + moment and the abutment:
2p
2p FPP +=
pF may taken as 0.0 for straight spans.
Pp is taken as the lesser of the capacity of the deck or the capacity of the steel section. The capacity of the deck is:
36119118485.0tbf85.0PsscP1
=⋅⋅⋅=⋅⋅′⋅= kips
The capacity of the steel section is:
fcfcycftftytwywP2tbFtbFtDFP ⋅⋅+⋅⋅+⋅⋅=
( ) 45630.12025.122625.07050 =⋅+⋅+⋅⋅= kips
So, 3611PP
P1P== kips
3611PPP== kip
1186.30
3611QP
nr
=== studs
For the region between the point of maximum positive ILL + moment and the centerline of an adjacent interior support:
2T
2T FPP +=

JUNE 2008 LRFD BRIDGE DESIGN 6-81
M. Investigate the Field Splice Design [6.13]
TF may taken as 0.0 for straight spans.
nPT PPP +=
nP is total longitudinal shear force in the concrete deck over an interior support taken as the lesser of either:
fcfcycftftytwywn1 tbFtbFtDFP ⋅⋅+⋅⋅+⋅⋅=
( ) 901325.32225.320625.07050 =⋅+⋅+⋅⋅= kips
or
19120.91180.445.0tbf45.0Psscn2
=⋅⋅⋅=⋅⋅′⋅= kips
So, 1912PPn2n== kips
552336111912PPP PnT =+=+= kips
5523PP T == kips
1806.30
5523QP
nr
=== studs
The final details for the shear studs need to satisfy the constraints of both the fatigue design and the strength design. After reviewing the constraints, the layout provided in Figure 6.9.16 was chosen. Several items need to be considered when locating and designing field splices for steel girders. Typically, splices are located near inflection points to minimize the flexural resistance required of the connection. In addition, designers need to ensure that adequate clearance is provided to transverse stiffeners, cross frame connection plates, etc. As a general rule, designers should limit the number of plate thicknesses used in a splice. The splice used for this example has four plate thicknesses (3/8", 1/2", 5/8", and 3/4") used for the splice and fill plates. The number of limit states and loading conditions to consider in the design of a splice is significant. Construction, Service II (permanent deflection), Fatigue, and Strength limit states should all be evaluated. In most cases, the Strength limit state will dictate the plate sizes and the

JUNE 2008 LRFD BRIDGE DESIGN 6-82
number of bolts. The bolted connections used in the splice are Category B details. Typically, three splice plates are used for each flange and two splice plates are used for the web. This permits all of the bolts to function in double shear and minimizes the number of bolts required. As the size of splice plates are considered, it is prudent to look at the change in plate sizes on both sides of the splice. The thickness of fill plates can be determined prior to any design of the connection. For this example, the top flange on the left is 1" x 20" and on the right is 13/4 x 20". The fill plate for the top flange splice will have a thickness of 3/4". The web on both sides of the splice is 5/8". No fill plate will be necessary for the web. The bottom flange on the left is 11/4" x 22". The bottom flange on the right is 13/4" x 22". A 1/2" fill plate will be required for the bottom flange splice. Using splice plates with a 3/4" or 1/2" thickness will minimize the number of plate thicknesses required for the splice. The splice will be designed as a slip-critical connection. The bolted connections will be proportioned: 1) to provide shear and bearing resistance under the governing strength
limit state 2) to prevent slip at the Service II limit state 3) to have adequate fatigue resistance
The resistance of the bolts will be designed based on threads excluded from the shear plane for plates which are 3/8 inch thick or greater. The loads at the location of the splice are shown in Table 6.9.17. Table 6.9.17 Loads at Girder Point 0.69 (Unfactored)
Component Moment (k-ft) Shear (k)
DC1 18 -116
DC2 54 -22
Pos. M LL + I 2351 22
Neg. M LL + I -2469 -126
Pos. M DCCONST 2416 -98
Neg. M DCCONST -2369 49
Pos. M LLCONST 369 -11
Neg. M LLCONST -371 3
Fatigue LL + I Range 2691 64

JUNE 2008 LRFD BRIDGE DESIGN 6-83
The loads are applied to the non-composite, short-term composite (n), and long-term composite ( n3 ) cross sections. Table 6.9.18 shows the section properties used for the splice design. To arrive at design stresses for the splice plates, the loads are applied to the appropriate section. The stresses from the load components are then factored to arrive at design stresses. Table 6.9.19 lists the unfactored component stresses and the factored design stresses for the flanges and the web. Flange splices are based on mid-flange stresses. Web splices can conservatively be based on mid-flange stresses or can use the stresses at the top and bottom of the web. The strength of the splice is based on the capacity of the smaller girder framing into the connection. For this example, the positive moment section is the smaller capacity member. Table 6.9.18 Section Properties for Splice Design
Design Section 1
Positive Moment
Parameter Non-composite
Long-Term Composite
( )n3 ⋅
Short-Term Composite
( )n
Neg. Moment
Moment of Inertia (in 4 ) 77,179 139,281 189,316 98,220
ty 38.96 23.93 11.92 33.83
by 33.29 48.32 60.33 38.42
Top Flange Thickness (in) 1 1 1 1
Bottom Flange Thickness (in)
1.25 1.25 1.25 1.25
midS top flange 2007 5945 16,578 2947
topS web 2033 6074 17,337 2992
ottombS web 2409 2959 3204 2642
midS bottom flange 2363 2920 3171 2599

JUNE 2008 LRFD BRIDGE DESIGN 6-84
M.1 Controlling Flange [C6.13.6.1.4c]
Table 6.9.19 Flexural Stress Components at Splice
Loading Stress at Mid-depth of (1)
Top Flange (ksi)
Stress at Mid-depth of (1) Bottom Flange
(ksi)
DC1 -0.11 0.09
DC2 -0.11 0.22
Pos. M (LL + I) -1.70 8.90
Neg. M (LL + I) 10.05 -11.40
Pos. M DCconst -14.45 12.27
Neg. M DCconst 14.16 -12.03
Pos. M LLconst -2.21 1.87
Neg. M LLconst 2.22 -1.88
Pos. M Strength I -3.25 15.96
Neg. M Strength I 17.39 -19.67
Pos. M Service II -2.43 11.88
Neg. M Service II 12.85 -14.51
Pos. M Service II Const. -17.32 14.70
Neg. M Service II Const. 17.05 -14.47
Fatigue LL + I Range(2) 0.65 3.29
(1) Positive number denotes tension stress. (2) Factored stress range.
At the strength limit state, the controlling flange is defined as the flange with the maximum ratio of factored flexure stress to factored resistance. Table 6.9.19 indicates that the bottom flange is the controlling flange for both positive and negative live load of the Strength I Limit State. The splice must be capable of resisting both positive and negative live load moment conditions. Bottom Flange Splice Plates When the combined area of the inner splice plates is within 10 percent of the area of the outer splice plate, both the inner and outer splice plate may be designed for one-half the flange design force. In addition, the area of the outer plate and the sum area of the inner plates each need to have a cross sectional area which is approximately half that of the flange. Try an outer splice plate that is 5/8" x 22". Try inner splice plates that are 3/4 " x 10". Gross area of inner splice plates:
2in_g in00.151075.02A =⋅⋅=

JUNE 2008 LRFD BRIDGE DESIGN 6-85
[6.13.6.1.4c]
Gross area of outer splice plate:
2out_g in75.1322625.0A =⋅=
The difference in area is 8%. Therefore equal distribution of the flange force to the splice plates can be assumed. Note that if the areas of the inner and outer splice plates had differed by more than 10%, the splice plate design force would be calculated by multiplying the flange design force by the ratio of the area of the splice plate under consideration to the total area of the splice plates. Load Case I - Positive Live Load for Strength I Limit State Bottom Flange is in tension. The flange splice shall be designed to provide a minimum design resistance equal to the greater of:
2
FR
f
Fyff
h
cf
cf
⎥⎥⎦
⎤
⎢⎢⎣
⎡⋅φ⋅α+
=
or
yffcfF75.0F ⋅φ⋅α⋅=
From Table 6.9.19 ksi96.15f
cf=
0.332
5011196.15
Fcf
=⎥⎦
⎤⎢⎣
⎡⋅⋅+
= ksi
or
50.37501175.0Fcf =⋅⋅⋅= ksi GOVERNS
Design force, ecftcfdes AFT ⋅=
Bottom flange is a tension flange under positive live load moment.
n
yty
uu
eA
F
FA ⎟
⎟
⎠
⎞
⎜⎜
⎝
⎛
φ
φ=

JUNE 2008 LRFD BRIDGE DESIGN 6-86
[6.8.2.2]
[6.13.5.2]
where, 8.0
u=φ
ksi0.70Fu=
95.0y=φ
ksi50Fy=
7/8" diameter bolts will be used for the splice design. For An calculation, assume 6 bolts per row with a 1" diameter. ( )( ) 2
nin00.20162225.1A =⋅−=
( ) ( )( ) ( ) ( ) 2
g
2
ein5.27Ain58.2300.20
5095.0708.0
A =<==
( ) ( ) kips3.88458.2350.37T
tcfdes==
Maximum Tension Design force for inner plates and outer plate:
kips2.4422
3.884TT
tcfdes_outtcfdes_in===
The factored tensile resistance, Pr, shall be taken as the lesser of the following: Yield on the gross section:
gyy1rAFP φ=
Fracture on the net section: 1UandA85.0AwhereUAFP
gnnuu2r=<φ=
For Outer Splice Plate: ( ) ( ) 2
gin75.13625.022A ==
Assuming 6 holes per row with a 1" diameter: ( ) ( )[ ] ( ) 2
g
2
nin69.11A85.0in00.10625.01622A =⋅<=−=
( ) ( ) ( ) kips1.65375.135095.0AFP
gyy1r==⋅⋅φ=
( ) ( ) ( ) ( ) kips0.560100.10708.0UAFP
nuu2r==⋅⋅⋅φ= GOVERNS
kips2.442kips0.560P
r>= OK

JUNE 2008 LRFD BRIDGE DESIGN 6-87
[6.13.6.1.4c]
For Inner Splice Plates: ( ) ( ) ( ) 2
gin00.1575.0102A ==
( ) ( ) ( )[ ] ( ) 2
g
2
nin75.12A85.0in50.1075.013102A =⋅<=−=
( ) ( ) ( ) kips5.712155095.0AFP
gyy1r==⋅⋅φ=
( ) ( ) ( ) ( ) kips0.588150.10708.0UAFP
nuu2r==⋅⋅⋅φ= GOVERNS
kips2.442kips0.588P
r>= OK
Load Case 2 - Negative Live Load at Strength I Limit State Bottom Flange is in compression. The flange splice shall be designed to provide a minimum design resistance equal to the greater of:
2
FR
f
Ffyf
n
fc
fc
⎥⎥
⎦
⎤
⎢⎢
⎣
⎡φα+
=
or
fyffcF75.0F ⋅φ⋅α⋅=
From Table 6.9.19, fcf = -19.67 ksi
( ) ( ) ( )
ksi8.342
0.500.10.10.167.19
Ffc
=+
−
=
or ( ) ( ) ( ) ( ) ksi5.370.500.10.175.0F
fc== GOVERNS
Design force:
ecfccfdesAFT ⋅=
geAA = for compression flange
( ) ( ) ( ) kips3.103125.1225.37Tccfdes ==

JUNE 2008 LRFD BRIDGE DESIGN 6-88
[6.13.6.1.5]
Since the combined area of the inner splice plates is within 10% of the area of the outer splice plate, both the inner and outer splice plate can be designed for one-half the flange design force. Maximum Compression design force for inner plate and outer plate is taken as:
kips7.5152
3.1031TT
ccfdes_outccfdes_in===
The factored resistance of splice plates subjected to compression, Rr, shall be taken as:
sycrAFR φ=
Where: =
sA gross area of the splice plate
9.0c=φ
For Outer Splice Plate: ( ) ( ) ( ) ( ) kips7.515kips8.618625.022509.0R
r>== OK
For Inner Splice Plate: ( ) ( ) ( ) ( ) ( ) kips7.515kips0.675275.00.10509.0R
r>== OK
Load Case 3 - Fatigue The fatigue detail category for a bolted connection is Category B. The splice is to be designed for infinite fatigue life and the Category B constant amplitude fatigue threshold (∆F)TH is 16 ksi. Then ( ) ksi0.8165.0F5.0F THn
=⋅=Δ⋅=Δ
Actual range γ ( ) ksi0.8ksi29.3f <=Δ⋅ OK
Bolt Shear Resistance Now compute the resistance of a 7/8" diameter A325 bolt and determine the number of bolts for the bottom flange splice plate. The fill plate for the bottom flange is 1/2 inch. Consequently, the fillers need to be extended or the capacity of the bolts reduced. For this example, the capacity of the bolts will be reduced (using LRFD Equation 6.13.6.1.5-1). Use a filler plate that is as wide as the flange. pA is the smaller of:
( ) ( ) 5.272225.1Ap
== in 2 GOVERNS

JUNE 2008 LRFD BRIDGE DESIGN 6-89
[6.13.2.7]
or
( ) ( ) ( ) ( ) ( ) 2
pin75.28625.02275.0102A =+=
Fill plate reduction factor:
( ) ( )40.0
5.275.022
AA
p
f =⋅
==γ
( )( )
( )( ) 78.0
40.02140.01
211
R =⎥⎦
⎤⎢⎣
⎡⋅+
+=⎥
⎦
⎤⎢⎣
⎡⋅+
+=
γγ
The shear resistance of a 7/8" diameter A325 bolt without threads in the shear plane with reduction of a filler is:
0.5478.02120601.048.0RNFA48.0Rsubbn
=⋅⋅⋅⋅=⋅⋅⋅⋅= kips
kips2.430.5480.0Rns
=⋅=φ
The maximum design force for Strength I, Tccfdes = 1031.3 kips
The number of bolts, N, required on the fill plate side of the connection is:
9.232.433.1031
R
TN
ns
ccfdes ==⋅φ
= bolts
Use 4 rows of 6 bolts on each side of the splice. Bolt Bearing Resistance Check the bearing on the smaller flange plate (element carrying the double shear load).
Average design force of each bolt 0.4324
3.1031== kips
Bolts will be spaced at 3 inches with an edge distance of 1.5 inches. Clear distance between holes = 3 · 1 = 2.0 inches Clear end distance = 1.5 - 0.5 = 1.0 in < 2.0d
0.1057025.120.1
5.12.1FtL2.1Rucn
=⋅⋅⎟⎠
⎞⎜⎝
⎛ −⋅=⋅⋅⋅= kips
[6.13.2.9]

JUNE 2008 LRFD BRIDGE DESIGN 6-90
[6.13.4]
[6.13.2.2]
0.840.1058.0RRnbbr
=⋅=⋅φ= kips 0.43> kips OK
Bolt Slip Resistance Slip resistance of bolts in a slip-critical connection shall be taken as:
tsshn PNKKR =
where:
0.1Kh = 5.0Ks = 2Ns = 0.39Pt = kips
0.390.3925.00.1Rn =⋅⋅⋅= kips/bolt
0.39RR nr == kips/bolt
LRFD 6.13.6.1.4a requires that connections be proportioned to prevent slip during construction as well as under service loads. Based on Table 6.9.19, maximum design force on gross section of Service II load combination shall be taken as:
( ) ( ) ( ) 3.40425.12270.14FII
== kips
Average design force of each bolt:
8.1624
3.404== kips 0.39< kips OK
Block Shear Rupture Resistance All tension connections must be investigated to ensure that adequate connection material is provided to develop the factored resistance of the connection. Check block shear on a transverse section through the smaller flange plate with the design force for the flange. Possible block shear failure mode 1 on the inner and outer splice plates is shown below in Figure 6.9.10.
[6.13.2.8]

JUNE 2008 LRFD BRIDGE DESIGN 6-91
Figure 6.9.10 Block Shear Failure Mode 1 – Bottom Flange Splice Plates
Check Outer Splice Plate
tnA is the net area along the planes resisting the tensile stress:
( ) ( )[ ] 25.6625.000.15.2325.12Atn
=⋅−⋅+⋅= in 2
vnA is the net area along the planes resisting the shear stress:
( )[ ] 75.8625.000.15.3335.12Avn
=⋅−⋅+⋅= in 2
58.071.075.825.6
AA
vn
tn >==
( )tnuvgybsr AFAF58.0R +⋅⋅φ=
where:
8.0bs =φ
vgA is the gross area along the plane resisting shear stress:

JUNE 2008 LRFD BRIDGE DESIGN 6-92
( ) ( ) 2
vgin13.13625.0335.12A =⋅+=
( ) 6.65425.67013.135058.08.0Rr
=⋅+⋅⋅⋅= kips 2.442> kips OK
Check inner splice plates
( ) ( ) ( )( )[ ] 50.775.00.15.2325.12Atn
=⋅−+⋅= in 2
( )( ) ( )[ ] 50.1075.00.15.3335.12Avn
=⋅−+⋅= in 2
58.071.050.1050.7
A
A
vn
tn >==
( ) 75.1575.0335.12Avg
=⋅⋅+⋅= in 2
( )tnuvgybsr AFAF58.0R +⋅⋅φ=
( ) 4.78550.77075.155058.08.0 =⋅+⋅⋅⋅= kips 2.442> kips OK
The possible block shear failure mode 2 on the outer splice plate is shown below in Figure 6.9.11. Since the outer splice plate controlled for block shear failure mode 1, it can be seen that it will control for failure mode 2 also.
Figure 6.9.11
Block Shear Failure Mode 2 - Bottom Flange Splice Plates For the outer splice plate, ( )( ) ( ) ( )( )[ ] ( )625.015.57345.1A
tn−++=
2in38.9=

JUNE 2008 LRFD BRIDGE DESIGN 6-93
[6.13.6.1.4c]
M.2 Noncontrolling Flange
( ) ( ) ( ) ( )[ ] ( )625.015.3335.1Avn
−+=
2in38.4=
58.014.238.438.9
A
A
vn
tn >==
( ) ( ) 2
vgin56.6625.0335.1A =⋅+=
( )tnuvgybsr AFAF58.0R +φ=
( ) ( ) ( ) ( ) ( ) ( )[ ] kips5.67738.97056.60.5058.08.0 =+= > kips2.442 OK Table 6.9.19 indicates that the top flange is the noncontrolling flange for both positive and negative live load for the Strength I Limit State. The noncontrolling flange at the strength limit state shall be proportioned to provide a minimum design resistance for both positive and negative live load moments equal to the greater of:
yfh
ncf
cfncfF75.0or
R
fRF αφ=
where:
cf
cfcf f
FR =
Load Case 1 - Positive Live Load for Strength I Limit State Top flange is in compression From Table 6.9.19:
ksi96.15fcf= ksi25.3f
ncf−= ksi5.37Fcf =
35.296.155.37
f
FR
cf
cf
cf===
( ) ksi64.70.125.3
35.2Fncf
=−
⋅=
or
( ) ( ) ( ) ( ) ksi5.37500.10.175.0Fncf
== GOVERNS

JUNE 2008 LRFD BRIDGE DESIGN 6-94
Maximum compression design force in top flange is:
flangencompressioforAAwhere,AFT geencfcncfdes =⋅=
( ) ( ) ( ) kips0.7500.1205.37 == Load Case 2 - Negative Live Load for Strength I Limit State Top flange is in tension. From Table 6.9.19: ksi67.19f
cf−=
ksi39.17fncf = ksi5.37Fcf =
91.167.195.37
f
FR
cf
cf
cf===
n
ncf
cfncf R
fRF = ( )
0.139.17
91.1= ksi20.33=
or ( ) ( ) ( ) ( ) ksi5.37500.10.175.0F
ncf== GOVERNS
Effective area of top flange:
nyty
uue A
FF
A ⎟⎟⎠
⎞⎜⎜⎝
⎛
φφ
=
( ) ( )( ) ( ) ( ) ( ) ( )( )0.14200.1
5095.0708.0
−⎟⎟⎠
⎞⎜⎜⎝
⎛=
2
g2 in20Ain86.18 =<=
Maximum tension design force of top flange at splice location: ( ) ( ) kips3.70786.185.37T
tncfdes==
The design of the top flange splice is not included in this design example for brevity. However, the top flange splice is designed using the same procedures and methods presented in this example for the bottom flange splice. The size of the resulting top flange splice plates are as follows.

JUNE 2008 LRFD BRIDGE DESIGN 6-95
M.3 Web Splice [6.13.6.1.4b]
The outer plate is 1/2" x 20" (area = 10.00 in2) and the inner plates are 5/8" x 9" (area = 5.625 in2 per plate). The web is designed to carry the entire factored vertical shear force. In addition, it must carry the moment due to the eccentricity of the shear force and the flexural moment which the web was assumed to carry. The flexural stresses in the web are resolved into flexural and axial (horizontal) components about mid-depth of the web. This allows the bolt group on each side of the splice to be designed for the vertical shear, the moment associated with the eccentricity of the vertical shear, the web flexural moment, and the resultant horizontal force in the web. In this example, Muw and Huw are computed by conservatively using the stresses at the midthickness of the flanges. By utilizing the stresses at the midthickness of the flanges, the same stress values can be used for the design of both the flange and web splices, which simplifies the calculations. The design forces will be computed under the Strength I Limit State and Service II Limit State. Strength I Limit State: From Tables 6.9.9 and 6.9.11, the vertical shear force to be carried is: For positive live load shear:
( ) ( )[ ] ( ) kips3.8520112.175.1221169.0Vu
=⋅+−+−⋅=
For negative live load shear:
( ) ( ) ( )[ ] ( ) kips3.394114112.175.12211625.1Vu
=−⋅+−+−= GOVERNS
The nominal shear resistance of the unstiffened web, Vn, is 460.6 kips. Then
kips3.394kips3.230V5.0nv
<=φ
Therefore, the design shear force is taken as:
( )2
VVV nvu
uw
φ+= kips
( )( )( )
kips5.4272
0.16.4603.394=
+=

JUNE 2008 LRFD BRIDGE DESIGN 6-96
[C6.13.6.1.4b]
Next, determine the design moment and the design horizontal force resultant. Load Case 1 - Strength I Limit State With Positive Live Load
ncfcfcfh
2
wuw
fRFR12
DtM −=
where: 625.0t
w= in
70D = in 0.1R
h=
ksi5.37Fcf = 35.2R
cf=
ksi25.3fncf
−=
( ) ( ) ( ) ( ) ( ) ( ) ( )12
125.335.25.370.112
70625.0M
2
uw−−=
0.960= k-ft
( )ncfcfcfhw
uw fRFR2Dt
H +=
( ) ( ) ( ) ( ) ( ) ( )[ ]25.335.25.370.1
270625.0
−+=
kips2.653=
Assume a horizontal bolt pitch of 3 inches and two vertical rows of bolts on each side of the splice. The eccentricity of the shear is the distance from the center of the bolt pattern to the center of the splice:
25.325.3
23
ev
=+= in
The moment associated with the vertical shear is:
( ) 8.1151215.42725.3VeM
uwvv=⋅=⋅= k-ft
Total design moment: 8.10758.1150.960M
pos_uw=+= k-ft

JUNE 2008 LRFD BRIDGE DESIGN 6-97
The design forces for the web splice under positive live load condition are:
5.427Vuw
= kips
2.653Huw
= kips
8.1075Mpos_uw
= k-ft
Load Case 2 - Strength I Limit State With Negative Live Load 625.0t
w= in
70D = in 0.1Rh = ksi5.37F
cf−= (compression)
91.1Rcf=
ksi39.17fncf
=
ncfcfcfh
2
wuw
fRFR12
DtM −=
( ) ( ) ( ) ( ) ( ) ( ) ( )12
139.1791.15.370.112
70625.0 2
−−=
9.1503= k-ft
( )ncfcfcfh
wuw
fRFR2
DtH +=
=( ) ( ) ( ) ( ) ( ) ( )[ ]39.1791.15.370.1
270625.0
+−
kips7.93−= 8.115M
v= k-ft
Total design moment 7.16198.1159.1503M
neguw=+=
−k-ft
The design forces for the web splice under negative live load condition are: kips5.427V
uw=
kips7.93Huw
−=
7.1619Mneguw
=−
k-ft

JUNE 2008 LRFD BRIDGE DESIGN 6-98
[C6.13.6.1.4b]
Load Case 3 - Service II Limit State With Positive Live Load From Tables 6.9.9 and 6.9.11, the factored shear with positive live load is: ( ) ( ) ( )[ ] ( ) ( ) ( )20112.13.1221160.1V
pos+−+−= kips1.109−=
Determine the design moment and the design horizontal force resultant. From Table 6.9.19: ksi88.11f
s=
ksi43.2fos
−=
oss
2
wwser
f0.1f0.112
DtM −=
−
( ) ( ) ( ) ( ) ( ) ftk3.30412
143.2188.11112
70625.0 2
−=−⋅−⋅=
( )oss
wwser
f0.1f0.12
DtH +=
−
( ) ( ) ( ) ( )[ ] k7.20643.2188.111
270625.0
=−⋅+⋅=
The moment from eccentricity of the shear:
( ) ( ) ( )12125.31.109eVM
vwserv=⋅=
− 5.29= k-ft
Total design moment: 5.293.304M
wser+=
− ftk8.333 −=
The design force for the web splice under Service II Limit State with Positive Live Load is: kips1.109V
w_ser=
kips7.206Hw_ser= (compression)
8.333Mw_ser= k-ft
The design force values for the other Service II load cases are shown in Table 6.9.20.

JUNE 2008 LRFD BRIDGE DESIGN 6-99
[C6.13.6.1.4b]
Load Case 4 - Fatigue The fatigue detail category for a bolted connection is Category B. The splice is to be designed for infinite fatigue life and the Category B constant amplitude fatigue threshold (∆F)TH is 16 ksi. Then ( ) ksi0.8165.0F5.0F THn
=⋅=Δ⋅=Δ
Max Actual range γ ( ) ksi0.8ksi29.3f <=Δ⋅ OK
Bolt Shear Resistance The vertical shear and the horizontal force are assumed to be resisted equally by all bolts in the fastener group. The force carried by each of the bolts to resist flexure is assumed to be proportional to its distance from the center of the fastener group. The force in each of the bolts can be found with the following equations:
p
AxxmxpxA I
yM
nm
PRRR
⋅+=+=
p
Ay
ymypyA I
xM
nm
PRRR
⋅+=+=
2yA
2xAA RRR +=
( ) ( )[ ]1mg1ns12nm
I 2222
p−+−=
where:
uwxHP =
uwyVP =
uwMM =
xxA= coordinate of bolt
yyA= coordinate of bolt
=pI polar moment of inertia of the bolt group
=n number of bolts per row =m number of vertical rows of bolts =s vertical pitch =g horizontal pitch Assume two vertical rows of 22 bolts on each side of the splice, a horizontal pitch g of 3 inches and a vertical pitch s of 3 inches. The bolts at the corners of the fastener group will be subject to the largest forces. Conservatively, the corner bolts will be checked only. The coordinates at the corners are ±=x 11/2 and ±=y 31.5 inches.

JUNE 2008 LRFD BRIDGE DESIGN 6-100
[6.13.2.7]
Substituting values in the above equations, Table 6.19.20 shows the design force in the corner bolts under the Strength I Limit State and Service II Limit State. Table 6.9.20 Design Force of the Corner Bolts
Parameter Strength I Service II Service II Const.
M(+) M(-) M(+) M(-) M(+) M(-)
Muw (k-ft) 1075.8 1619.7 333.9 663.9 710.5 684.4
Huw (kip) * 653.2 -93.7 206.7 -36.3 -57.3 56.4
Vuw (kip) 427.5 427.5 109.1 302.8 109.0 52.0
n 22 22 22 22 22 22
m 2 2 2 2 2 2
s (in) 3 3 3 3 3 3
g (in) 3 3 3 3 3 3
y (in) 31.5 -31.5 1.5 1.5 1.5 1.5
x (in) 1.5 1.5 31.5 -31.5 -31.5 31.5
lp (in2) 16038 16038 16038 16038 16038 16038
Rx (kip) 40.2 -40.3 12.6 -16.5 -18.0 17.4
Ry (kip) 10.9 11.5 2.9 7.6 3.3 1.9
R (kip) 41.7 41.9 12.9 18.2 18.3 17.5
* Huw is a signed quantity, positive for tension and negative for compression.
The nominal shear resistance of a 7/8"diameter A325 bolt without threads in the shear plane and without fill plates used is:
subbnNFA48.0R =
( ) ( ) ( ) ( )2120601.048.0= kips2.69=
nrRR φ=
( ) ( )2.698.0= kips4.55=
From Table 6.9.20, the maximum design force on the bolt at Strength I Limit State kips4.55kips9.41R
STRI<= OK
JUNE 2008 LRFD BRIDGE DESIGN 6-101
[6.13.2.8]
[6.13.2.9-2]
Bolt Slip Resistance The nominal slip resistance of a 7/8" diameter A325 bolt is:
tsshnPNKKR =
( ) ( ) ( ) ( )0.3925.00.1= kips0.39= kips0.39RR nr == From Table 6.9.20, the maximum design force on the bolt at Service II Limit State is: kips0.39kips3.18R
SII<= OK
Bolt Bearing Resistance Nominal bearing resistance of interior or end bolt holes at the Strength I Limit State depends on the clear distance between the holes or clear end distance. Clear distance between holes "75.1d2"213 =>=−= Clear end distance "75.1d2"25.15.075.1 =<=−= ucn tFL2.1R = "0.20.10.3L
1c=−= for interior bolts
"25.15.075.1L2c
=−= for end bolts
( ) ( ) ( ) ( ) kips10570625.00.22.1R
int_n==
( ) ( ) ( ) ( ) kips6.6570625.025.12.1Rend_n
== GOVERNS
end_nbbrRR φ=
( ) ( )6.658.0= kips5.52= From Table 6.9.20, maximum design force at Strength I Limit State kips5.52kips9.41R
STRI<= OK
The plates used in the web splice must have adequate resistance to carry the vertical shear. Two 3/8" thick plates are being used for the splice. Assume the plates are 66 inches tall ( ⋅+⋅ 2321 11/2) Gross area of the plates:
50.49375.0266Ag
=⋅⋅= in 2

JUNE 2008 LRFD BRIDGE DESIGN 6-102
[6.13.5.3-2]
[6.13.5.3-1]
[6.13.4]
Assumed vertical shear resistance:
5.143550.495058.0AF58.0Rgyn
=⋅⋅=⋅⋅= kips
( ) ( ) kips5.427Vkips5.14355.14350.1RRuwnvr
=>==φ= OK
Block Shear Rupture Resistance Check block shear failure mode shown in Figure 6.9.12 for web splice plates.
Figure 6.9.12 Net area along the plane resisting shear: ( ) ( ) ( )( ) ( )375.00.15.215.1662A
vn−−= 2in25.32=
Net area along the plane resisting tension: ( ) ( ) ( )( ) ( )375.00.15.10.35.12A
tn−+= 2in25.2=
58.007.025.3225.2
A
A
vn
tn <==

JUNE 2008 LRFD BRIDGE DESIGN 6-103
[6.13.6.1.4b]
( )tgyvnubsr
AFAF58.0R +φ=
( ) ( ) ( )375.00.35.12A
tg+= 2in38.3=
( ) ( ) ( ) ( ) ( ) ( )[ ]38.35025.327058.08.0R
r+=
kips5.427Vskip7.1182uw
=>= OK
At Strength I Limit State the flexure stress in the web splice plates shall not exceed
yfFφ :
yf
pl
uw
g
uw FS
M
A
Hφ≤+=σ
Section modulus of the web splice plates is:
5.5443
66375.03
Dt
2/D1
12
Dt2S
22spw
sp
3spw
pl =⋅
=⋅
=⋅⋅
⋅= in 3
0.1f=φ
For positive liveload moment of Strength I limit State:
kips2.653Huw
=
8.1075Muw
= k-ft
( ) ( )
ksi50ksi9.365.544
128.107550.492.653
<=+=σ OK
For negative liveload moment of Strength I limit State: kips7.93H
uw−=
ftk7.1619Muw
−=
( ) ( )
ksi50ksi6.375.544
127.161950.497.93
<=+=σ OK
The assumed web splice details have adequate capacity. The field splice is detailed in Figure 6.9.13.

JUNE 2008 LRFD BRIDGE DESIGN 6-104
N. Investigate Deflection
[3.6.1.3.2]
[2.5.2.6.2]
Figure 6.9.13 Consider with the Service I load combination. No sidewalk or bicycle path is provided on the bridge. In accordance with Mn/DOT policy, the live load deflection limit is 800/L . The maximum deflection permitted for this example is:
( ) 63.2800/12175800/L =⋅= in
Two live loads are applied to the bridge and evaluated for the deflection check. Take the larger of:
• Design Truck alone • 25% of Design Truck + Lane Loading
When computing deflections a separate distribution factor is used. It is simply the number of design lanes divided by the number of girders. Mn/DOT practice is to use a multiple presence factor for deflections of no less than 0.85 (See Section 3.4.2). For this example, the distribution factor is:
68.085.054
Girders ofNumber Lanes Design ofNumber
gMPF
=⋅=Δ⋅=Δ
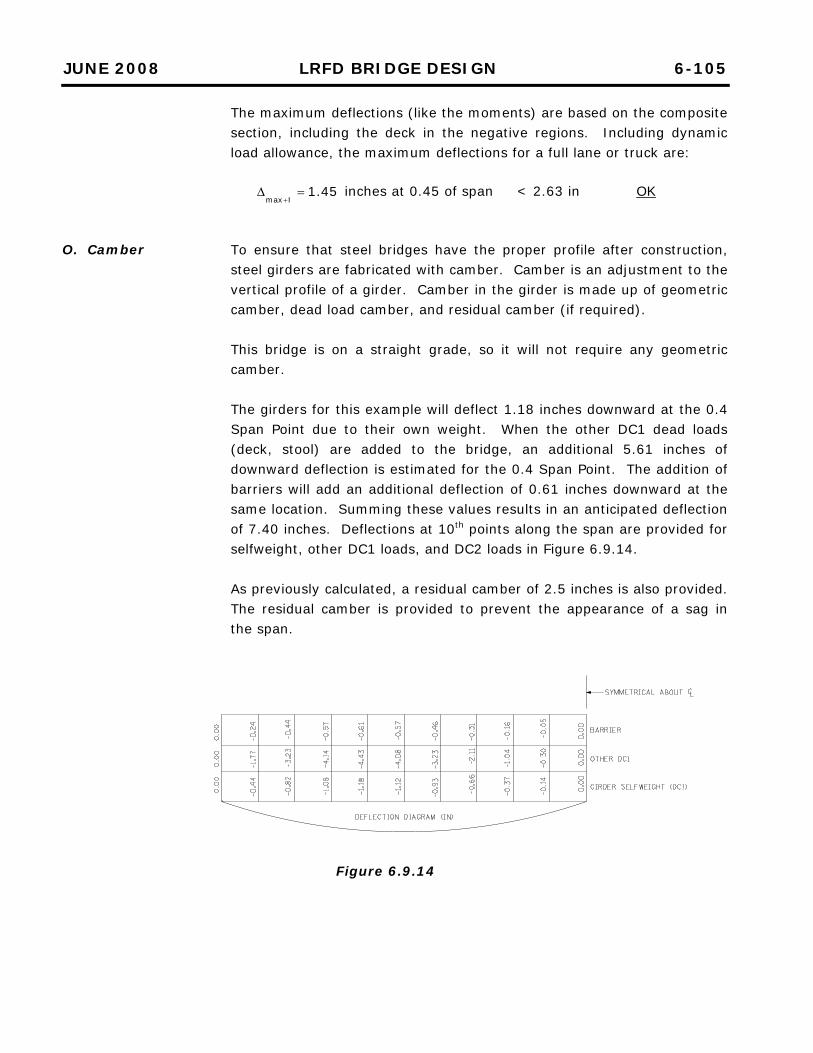
JUNE 2008 LRFD BRIDGE DESIGN 6-105
O. Camber
The maximum deflections (like the moments) are based on the composite section, including the deck in the negative regions. Including dynamic load allowance, the maximum deflections for a full lane or truck are:
45.1Imax=Δ
+ inches at 0.45 of span < 2.63 in OK
To ensure that steel bridges have the proper profile after construction, steel girders are fabricated with camber. Camber is an adjustment to the vertical profile of a girder. Camber in the girder is made up of geometric camber, dead load camber, and residual camber (if required). This bridge is on a straight grade, so it will not require any geometric camber. The girders for this example will deflect 1.18 inches downward at the 0.4 Span Point due to their own weight. When the other DC1 dead loads (deck, stool) are added to the bridge, an additional 5.61 inches of downward deflection is estimated for the 0.4 Span Point. The addition of barriers will add an additional deflection of 0.61 inches downward at the same location. Summing these values results in an anticipated deflection of 7.40 inches. Deflections at 10th points along the span are provided for selfweight, other DC1 loads, and DC2 loads in Figure 6.9.14. As previously calculated, a residual camber of 2.5 inches is also provided. The residual camber is provided to prevent the appearance of a sag in the span.
Figure 6.9.14

JUNE 2008 LRFD BRIDGE DESIGN 6-106
By following the procedure in 6.3.4, the camber diagram is developed and shown on Figure 6.9.15. Figure 6.9.16 contains a half elevation of the girder that summarizes the design.

JUNE 2008 LRFD BRIDGE DESIGN 6-107
Figure 6.9.15

JUNE 2008 LRFD BRIDGE DESIGN 6-108
Figure 6.9.16 Half Elevation
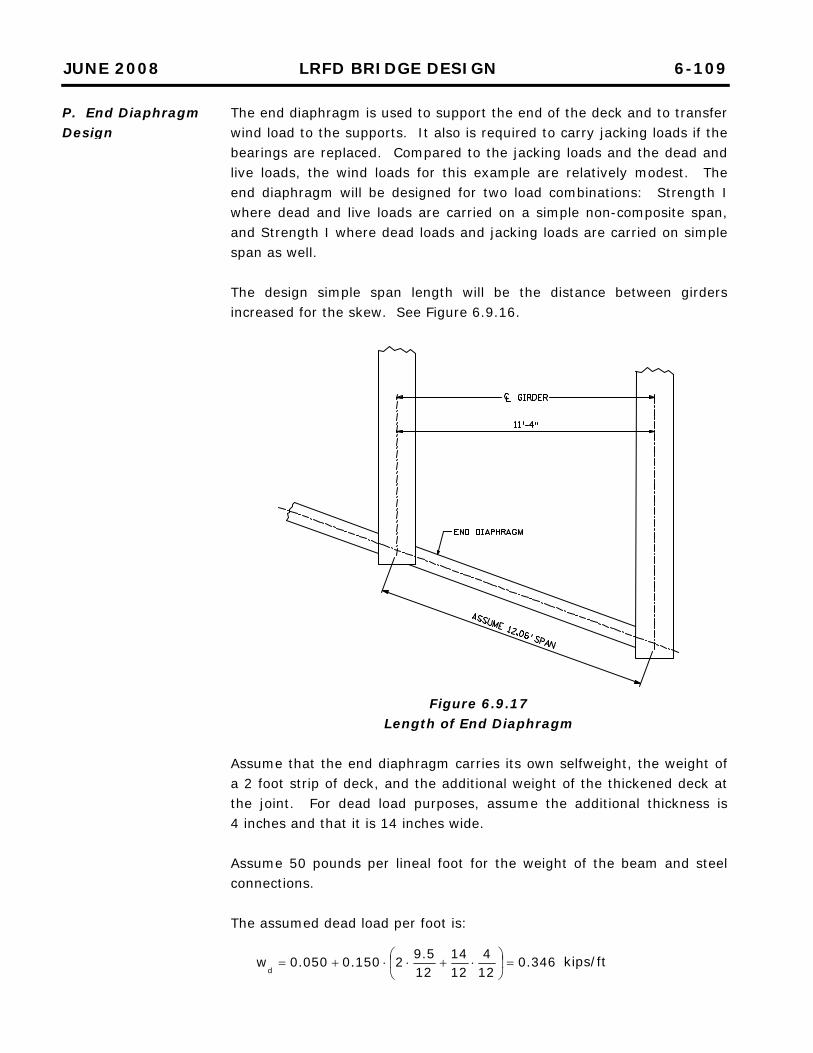
JUNE 2008 LRFD BRIDGE DESIGN 6-109
P. End Diaphragm Design
The end diaphragm is used to support the end of the deck and to transfer wind load to the supports. It also is required to carry jacking loads if the bearings are replaced. Compared to the jacking loads and the dead and live loads, the wind loads for this example are relatively modest. The end diaphragm will be designed for two load combinations: Strength I where dead and live loads are carried on a simple non-composite span, and Strength I where dead loads and jacking loads are carried on simple span as well. The design simple span length will be the distance between girders increased for the skew. See Figure 6.9.16.
Figure 6.9.17 Length of End Diaphragm
Assume that the end diaphragm carries its own selfweight, the weight of a 2 foot strip of deck, and the additional weight of the thickened deck at the joint. For dead load purposes, assume the additional thickness is 4 inches and that it is 14 inches wide. Assume 50 pounds per lineal foot for the weight of the beam and steel connections. The assumed dead load per foot is:
346.0124
1214
125.9
2150.0050.0wd
=⎟⎠
⎞⎜⎝
⎛ ⋅+⋅⋅+= kips/ft

JUNE 2008 LRFD BRIDGE DESIGN 6-110
Dead load shear is:
1.22
06.12346.02
Lwd =
⋅=
⋅ kips
Dead load moment is
3.68
06.12346.08
Lw 22
d =⋅
=⋅
kips-ft
Consider two live load cases, one where the lane of traffic is centered between the girders and a second one where one of the truck wheels is placed at the center of the diaphragm. The two cases are presented in Figure 6.9.18. This assumes two feet of lane load and includes dynamic load allowance on the wheel load. For Case 1, the live load is centered between the girders and the shear force is:
9.21210
2064.03.21V =⋅⋅+= kips
The moment at mid span for this case is:
2.598
06.122064.067.23.21M
2
=⋅⋅
+⋅≈ k-ft
For Case 2, assume that the left wheel is just to the right of the interior girder. This will produce a conservative design shear. The shear force for this case is:
[ ] 7.32064.02806.1206.8
3.2106.1206.6
3.21V =⋅⋅⋅+⋅+= kips
The moment at mid span for this case is:
[ ] [ ] ( )203.6
2064.003.682064.006.1206.8
03.63.2106.1206.6
M2
⋅⋅−⋅⋅⋅⋅+⋅⋅≈
ftk0.71 −=

JUNE 2008 LRFD BRIDGE DESIGN 6-111
[3.4.3.1] Assuming lane closed during jacking operation, the shear force in the end diaphragms during jacking can be estimated from the abutment reactions for the DC1 and DC2 loads. Jacking forces have a 1.3 load factor. Assume that two jacks are used to lift each interior girder and that they are placed two feet away from the center of the girder to clear the bearings.
( ) ( )7.89
2231151.3
2DC2DC11.3
V3.1 ackj =+⋅
=+⋅
= kips

JUNE 2008 LRFD BRIDGE DESIGN 6-112
Figure 6.9.18 Live Load Placement on End Diaphragm

JUNE 2008 LRFD BRIDGE DESIGN 6-113
[6.10.9.2-2]
With each jack positioned two feet from the girder the moment at mid span in the end diaphragm is:
4.17927.89M3.1 ackj =⋅= k-ft
By inspection, the jacking operation governs the design of the end diaphragm. Begin by sizing a rolled beam based on shear capacity. Assume the rolled section will satisfy the slenderness ratio to permit that
pV equals 58% of the yield stress to be used.
jackDLurV3.1V25.1VV +==
( ) ( ) 7.891.225.1 += 3.92= kips pvnvr CVVV φ=φ=
where: 0.1
v=φ
0.1C = Therefore, ( ) ( ) ( )58.00.10.1V
r=
wyAF
18.3500.583.92
F58.0V
Ay
rw =
⋅== in 2 web area required
Assume that the rolled beam can reach yM . The required section modulus for the beam is:
( ) ( ) ( )9.44
50124.1793.625.1
F
M3.1M25.1S
y
ackjDL
equiredr=
⋅+⋅=
+= in 3
Based on review of section properties in the AISC Manual of Steel Construction, try a W12x40 section:

JUNE 2008 LRFD BRIDGE DESIGN 6-114
[6.10.9.2-1]
[6.10.8.2]
Area A = 11.8 in2
Depth D = 12.0 in Web Thickness tw = 5/16 in Flange Width bf = 8 in Flange Thickness tf = 1/2 in Section Modulus S = 51.9 in3
Radius of Gyration rt = 1.9 in Determine the nominal shear capacity with LRFD Article 6.10.9.2.
( )5.35
31.05.0212
tD
w
=⋅−
=
5.353.6050
5000,2912.1
FkE
12.1y
>=⋅
⋅=⋅
⋅
Therefore, 0.1C = and the shear capacity of the beam is:
[ ] 9.9831.05.02125058.01VCV pn =⋅⋅−⋅⋅⋅=⋅= kips
( )DLjacku
V25.1V3.1V +=
( ) ( ) kips9.989.980.1Vkips3.92 nv ==φ<= OK
Check Compression flange flexural resistance Local Buckling
2.985.02
8t2
bpf
f
ff
=≤=⋅
=⋅
= λλ
ksi0.50FFycnc
==
Section is subject to compact section. Lateral Torsional Buckling
( ) ( ) in5.4650000,29
93.10.1FE
r0.1Lyc
tp=⎟
⎟⎠
⎞⎜⎜⎝
⎛==
( ) ( ) in0.17435000,29
93.114.3FE
rLyrtu
r =⎟⎟⎠
⎞⎜⎜⎝
⎛=π=
The distance between gusset plates is approximately 60 inches.

JUNE 2008 LRFD BRIDGE DESIGN 6-115
[6.10.8.2.3-6]
[6.10.1.10.2-4]
[6.10.1.10.2-2]
in60Lb=
rbp
LLL <<
ychbpr
pb
ych
yrbnc FRR
LL
LL
FR
F11CF
⎥⎥⎦
⎤
⎢⎢⎣
⎡⎟⎟⎠
⎞⎜⎜⎝
⎛
−
−⎟⎟⎠
⎞⎜⎜⎝
⎛−−=
0.1R
h=
ksi35F7.0Fycyr
==
( ) ( ) ( ) ( )500.10.15.461745.4660
5035
110.1Fnc ⎥
⎦
⎤⎢⎣
⎡⎟⎠
⎞⎜⎝
⎛−−
⎟⎠
⎞⎜⎝
⎛ −−=
ksi4.48= 0.1C,Therefore0f b2 ==
137FE
7.5yc
rw==λ
In order to determine web load-shedding factor, Rb, the web shall satisfy:
( ) ( )( )
rww
c 7131.0
25.0122tD2
λ<=−
=
0.1Rb=
Flexural Resistance ( ) ( ) 3.209ink25129.514.48SFM yn =−==⋅= k-ft
( ) ( ) 4.1883.2099.0MM nr ==φ= k-ft
jackDLuM3.1M25.1M +=
( ) ( ) 4.1793.625.1 +=
rMftk3.187 <−= OK
Therefore, use a W12x40 for the end diaphragm.

JUNE 2008 LRFD BRIDGE DESIGN 6-116
[ This Page Intentionally Left Blank ]

JUNE 2008 LRFD BRIDGE DESIGN 6-117
APPENDIX 6-A
Figure 6-A1 Dimensions of Common Heavy Hex Structural Bolts
Mn/DOT 3391.2A (ASTM A307)

JUNE 2008 LRFD BRIDGE DESIGN 6-118
APPENDIX 6-A (Continued)
Figure 6-A2 Washers for High Strength Structural Bolts
Mn/DOT 3391.2B (ASTM A325)

JUNE 2008 LRFD BRIDGE DESIGN 6-119
APPENDIX 6-A (Continued)
Figure 6-A3 High Strength Heavy Hex Structural Bolts and Nuts
Mn/DOT 3391.2B (ASTM A325)

JUNE 2008 LRFD BRIDGE DESIGN 6-120
APPENDIX 6-A (Continued)
Figure 6-A4 Dimensions of Common Heavy Hex Nuts and Heavy Hex Jam Nuts
Mn/DOT 3391.2A (ASTM A307)

JUNE 2008 LRFD BRIDGE DESIGN 6-121
APPENDIX 6-A (Continued)
Figure 6-A5 Hardware Details

JUNE 2008 LRFD BRIDGE DESIGN 6-122
APPENDIX 6-A (Continued)
Figure 6-A6 Welding symbols and Notes

JUNE 2008 LRFD BRIDGE DESIGN 6-123
APPENDIX 6-A (Continued)
Figure 6-A7 Welding Notes and Joints

JUNE 2008 LRFD BRIDGE DESIGN 6-124
APPENDIX 6-A (Continued)
Figure 6-A8 Welding Joints