july 2017 redondo beach real estate market trends update
TRANSCRIPT

Table of
Contents
Key Statistics for July
Sales 2017 Residential Sales Stats Year-to-Year Total Sales by Map Area Median 2017 Median Sales Stats Year-to-Year Median Sales by Map Area Listings 2017 Active Listings by Map Area 2017 Total Active Listings vs. Total Sales Year-to-Year Active Listings by Map Area Inventory 2017 Months of Inventory by Map Area Year-to-Year Months of Inventory
Summary
About Hady Chahine Contact Information
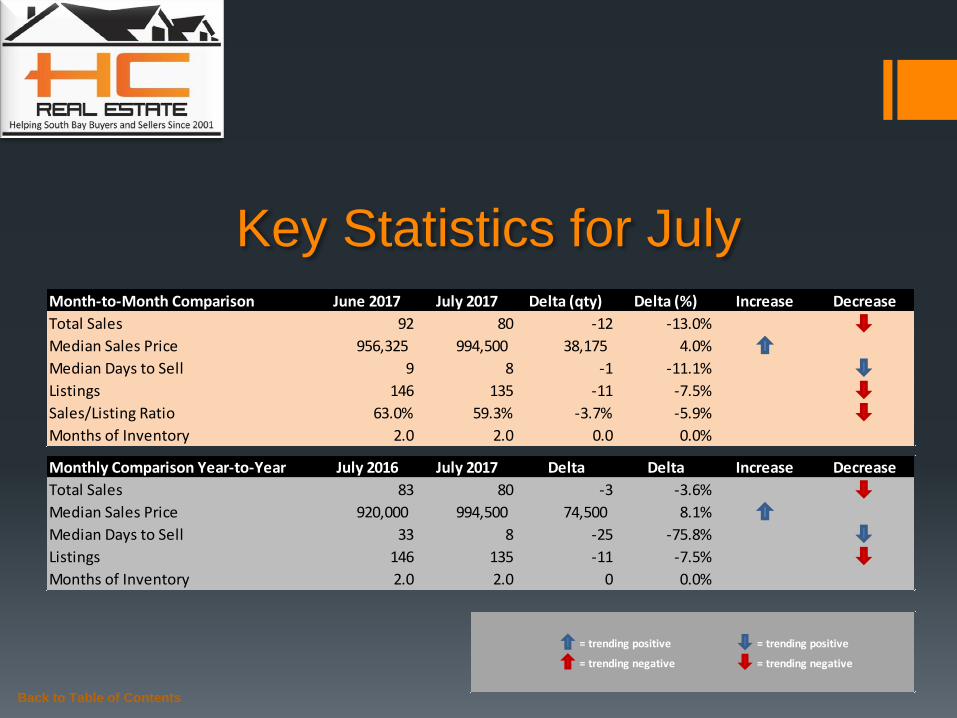
Key Statistics for July
Back to Table of Contents
= trending positive = trending positive
= trending negative = trending negative
Month-to-Month Comparison June 2017 July 2017 Delta (qty) Delta (%) Increase Decrease
Total Sales 92 80 -12 -13.0%
Median Sales Price 956,325 994,500 38,175 4.0%
Median Days to Sell 9 8 -1 -11.1%
Listings 146 135 -11 -7.5%
Sales/Listing Ratio 63.0% 59.3% -3.7% -5.9%
Months of Inventory 2.0 2.0 0.0 0.0%
Monthly Comparison Year-to-Year July 2016 July 2017 Delta Delta Increase Decrease
Total Sales 83 80 -3 -3.6%
Median Sales Price 920,000 994,500 74,500 8.1%
Median Days to Sell 33 8 -25 -75.8%
Listings 146 135 -11 -7.5%
Months of Inventory 2.0 2.0 0 0.0%
Back to Table of Contents
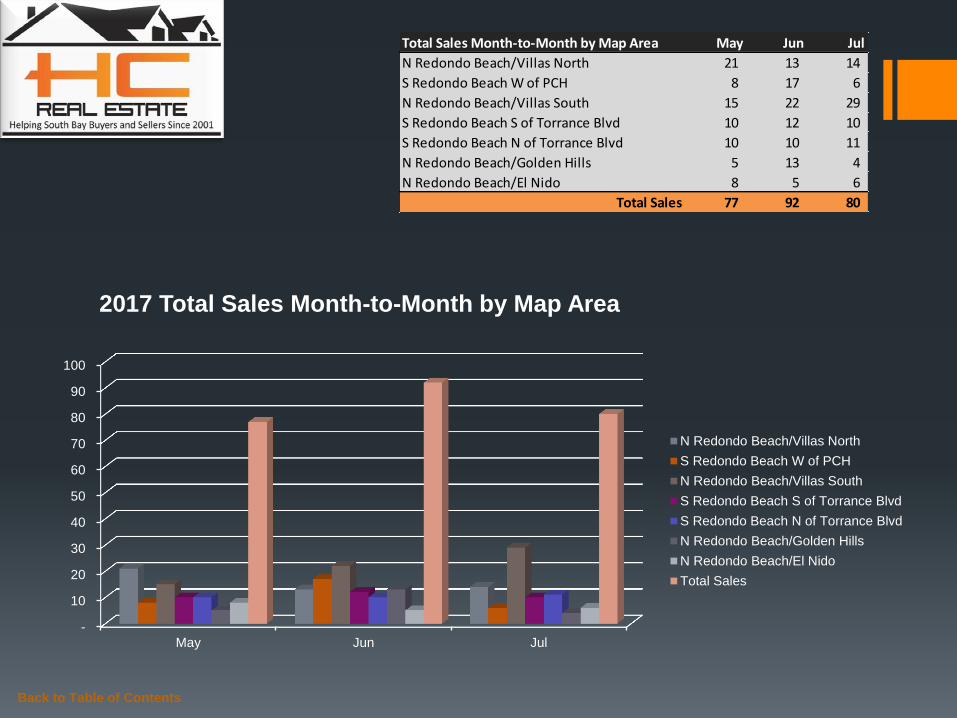
Total Sales Month-to-Month by Map Area May Jun Jul
N Redondo Beach/Villas North 21 13 14
S Redondo Beach W of PCH 8 17 6
N Redondo Beach/Villas South 15 22 29
S Redondo Beach S of Torrance Blvd 10 12 10
S Redondo Beach N of Torrance Blvd 10 10 11
N Redondo Beach/Golden Hills 5 13 4
N Redondo Beach/El Nido 8 5 6
Total Sales 77 92 80
-
10
20
30
40
50
60
70
80
90
100
May Jun Jul
2017 Total Sales Month-to-Month by Map Area
N Redondo Beach/Villas North
S Redondo Beach W of PCH
N Redondo Beach/Villas South
S Redondo Beach S of Torrance Blvd
S Redondo Beach N of Torrance Blvd
N Redondo Beach/Golden Hills
N Redondo Beach/El Nido
Total Sales

Back to Table of Contents
Total Sales Year-to-Year by Map Area 2015 2016 2017
N Redondo Beach/Villas North 26 16 14
S Redondo Beach W of PCH 12 11 6
N Redondo Beach/Villas South 16 23 29
S Redondo Beach S of Torrance Blvd 9 13 10
S Redondo Beach N of Torrance Blvd 16 10 11
N Redondo Beach/Golden Hills 14 8 4
N Redondo Beach/El Nido 6 2 6
Total Sales 99 83 80
-
10
20
30
40
50
60
70
80
90
100
2015 2016 2017
Total Sales Year-to-Year by Map Area: July
N Redondo Beach/Villas North
S Redondo Beach W of PCH
N Redondo Beach/Villas South
S Redondo Beach S of Torrance Blvd
S Redondo Beach N of Torrance Blvd
N Redondo Beach/Golden Hills
N Redondo Beach/El Nido
Total Sales
Back to Table of Contents
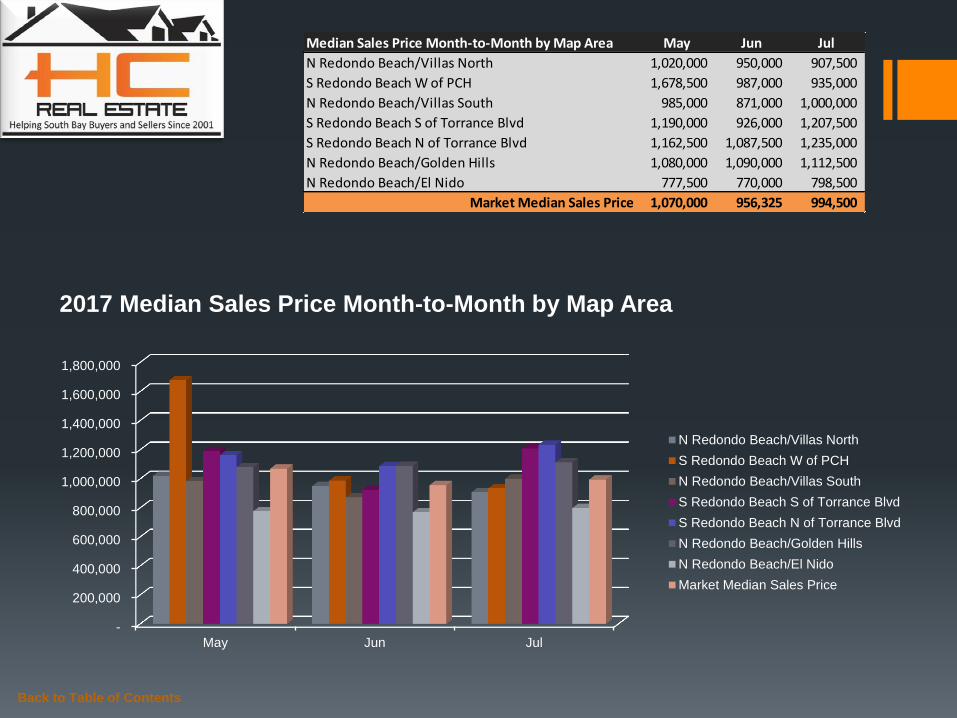
Median Sales Price Month-to-Month by Map Area May Jun Jul
N Redondo Beach/Villas North 1,020,000 950,000 907,500
S Redondo Beach W of PCH 1,678,500 987,000 935,000
N Redondo Beach/Villas South 985,000 871,000 1,000,000
S Redondo Beach S of Torrance Blvd 1,190,000 926,000 1,207,500
S Redondo Beach N of Torrance Blvd 1,162,500 1,087,500 1,235,000
N Redondo Beach/Golden Hills 1,080,000 1,090,000 1,112,500
N Redondo Beach/El Nido 777,500 770,000 798,500
Market Median Sales Price 1,070,000 956,325 994,500
-
200,000
400,000
600,000
800,000
1,000,000
1,200,000
1,400,000
1,600,000
1,800,000
May Jun Jul
2017 Median Sales Price Month-to-Month by Map Area
N Redondo Beach/Villas North
S Redondo Beach W of PCH
N Redondo Beach/Villas South
S Redondo Beach S of Torrance Blvd
S Redondo Beach N of Torrance Blvd
N Redondo Beach/Golden Hills
N Redondo Beach/El Nido
Market Median Sales Price
Back to Table of Contents
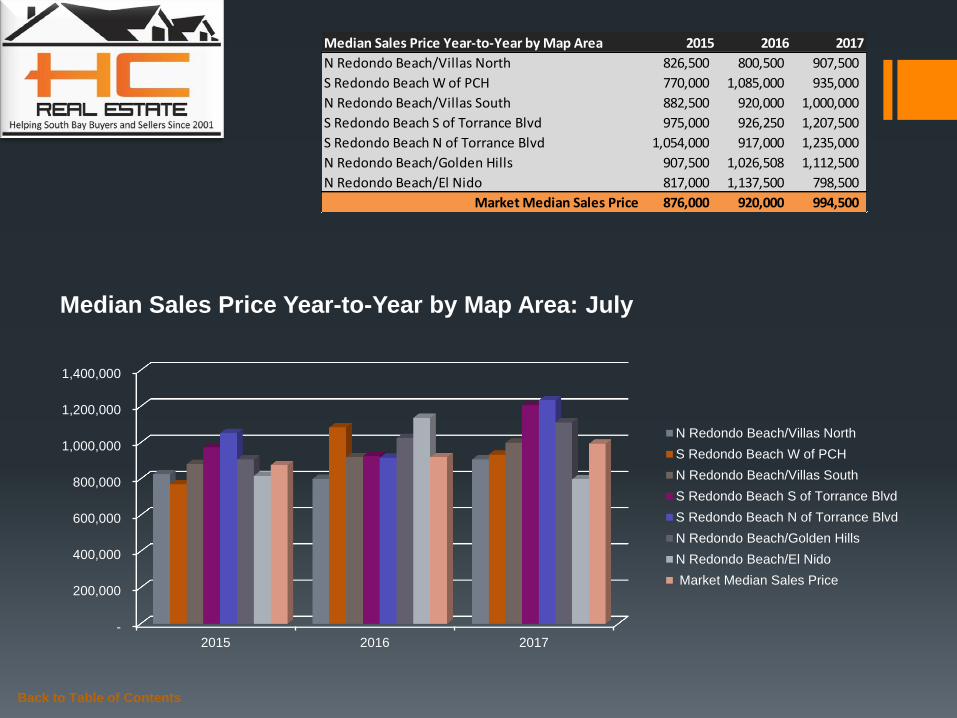
Median Sales Price Year-to-Year by Map Area 2015 2016 2017
N Redondo Beach/Villas North 826,500 800,500 907,500
S Redondo Beach W of PCH 770,000 1,085,000 935,000
N Redondo Beach/Villas South 882,500 920,000 1,000,000
S Redondo Beach S of Torrance Blvd 975,000 926,250 1,207,500
S Redondo Beach N of Torrance Blvd 1,054,000 917,000 1,235,000
N Redondo Beach/Golden Hills 907,500 1,026,508 1,112,500
N Redondo Beach/El Nido 817,000 1,137,500 798,500
Market Median Sales Price 876,000 920,000 994,500
-
200,000
400,000
600,000
800,000
1,000,000
1,200,000
1,400,000
2015 2016 2017
Median Sales Price Year-to-Year by Map Area: July
N Redondo Beach/Villas North
S Redondo Beach W of PCH
N Redondo Beach/Villas South
S Redondo Beach S of Torrance Blvd
S Redondo Beach N of Torrance Blvd
N Redondo Beach/Golden Hills
N Redondo Beach/El Nido
Market Median Sales Price
Back to Table of Contents
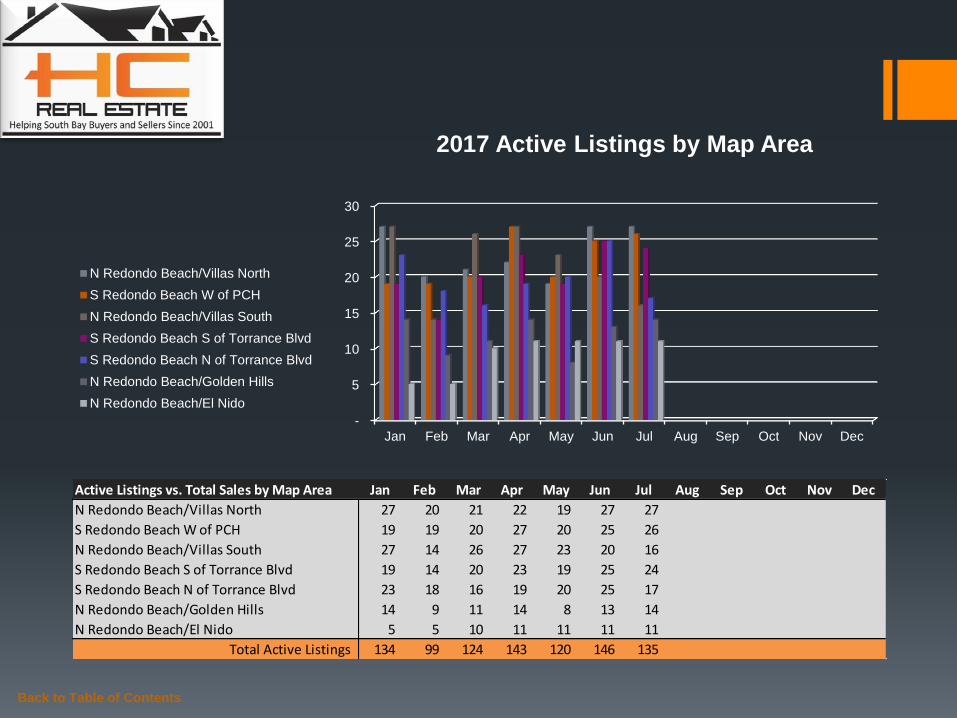
Active Listings vs. Total Sales by Map Area Jan Feb Mar Apr May Jun Jul Aug Sep Oct Nov Dec
N Redondo Beach/Villas North 27 20 21 22 19 27 27
S Redondo Beach W of PCH 19 19 20 27 20 25 26
N Redondo Beach/Villas South 27 14 26 27 23 20 16
S Redondo Beach S of Torrance Blvd 19 14 20 23 19 25 24
S Redondo Beach N of Torrance Blvd 23 18 16 19 20 25 17
N Redondo Beach/Golden Hills 14 9 11 14 8 13 14
N Redondo Beach/El Nido 5 5 10 11 11 11 11
Total Active Listings 134 99 124 143 120 146 135
-
5
10
15
20
25
30
Jan Feb Mar Apr May Jun Jul Aug Sep Oct Nov Dec
2017 Active Listings by Map Area
N Redondo Beach/Villas North
S Redondo Beach W of PCH
N Redondo Beach/Villas South
S Redondo Beach S of Torrance Blvd
S Redondo Beach N of Torrance Blvd
N Redondo Beach/Golden Hills
N Redondo Beach/El Nido
Back to Table of Contents
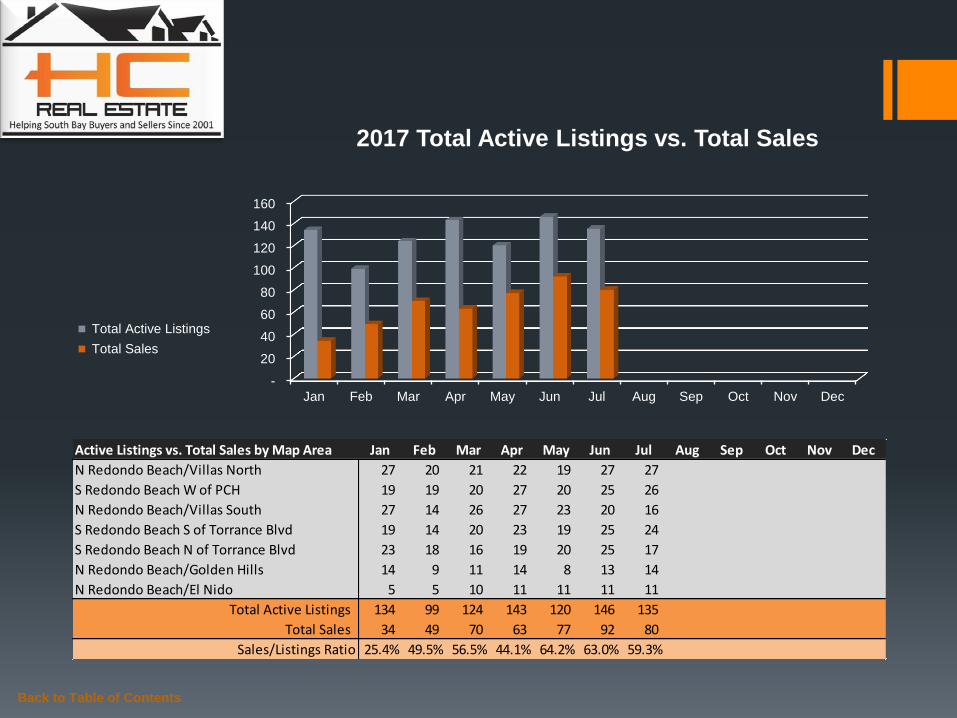
Active Listings vs. Total Sales by Map Area Jan Feb Mar Apr May Jun Jul Aug Sep Oct Nov Dec
N Redondo Beach/Villas North 27 20 21 22 19 27 27
S Redondo Beach W of PCH 19 19 20 27 20 25 26
N Redondo Beach/Villas South 27 14 26 27 23 20 16
S Redondo Beach S of Torrance Blvd 19 14 20 23 19 25 24
S Redondo Beach N of Torrance Blvd 23 18 16 19 20 25 17
N Redondo Beach/Golden Hills 14 9 11 14 8 13 14
N Redondo Beach/El Nido 5 5 10 11 11 11 11
Total Active Listings 134 99 124 143 120 146 135
Total Sales 34 49 70 63 77 92 80
Sales/Listings Ratio 25.4% 49.5% 56.5% 44.1% 64.2% 63.0% 59.3%
-
20
40
60
80
100
120
140
160
Jan Feb Mar Apr May Jun Jul Aug Sep Oct Nov Dec
2017 Total Active Listings vs. Total Sales
Total Active Listings
Total Sales

Back to Table of Contents
Active Listings Year-to-Year by Map Area 2015 2016 2017
N Redondo Beach/Villas North 30 28 27
S Redondo Beach W of PCH 20 39 26
N Redondo Beach/Villas South 29 29 16
S Redondo Beach S of Torrance Blvd 23 25 24
S Redondo Beach N of Torrance Blvd 17 19 17
N Redondo Beach/Golden Hills 10 11 14
N Redondo Beach/El Nido 7 6 11
Total Active Listings 136 157 135
-
20
40
60
80
100
120
140
160
2015 2016 2017
Active Listings Year-to-Year by Map Area: July
N Redondo Beach/Villas North
S Redondo Beach W of PCH
N Redondo Beach/Villas South
S Redondo Beach S of Torrance Blvd
S Redondo Beach N of Torrance Blvd
N Redondo Beach/Golden Hills
N Redondo Beach/El Nido
Total Active Listings
Back to Table of Contents
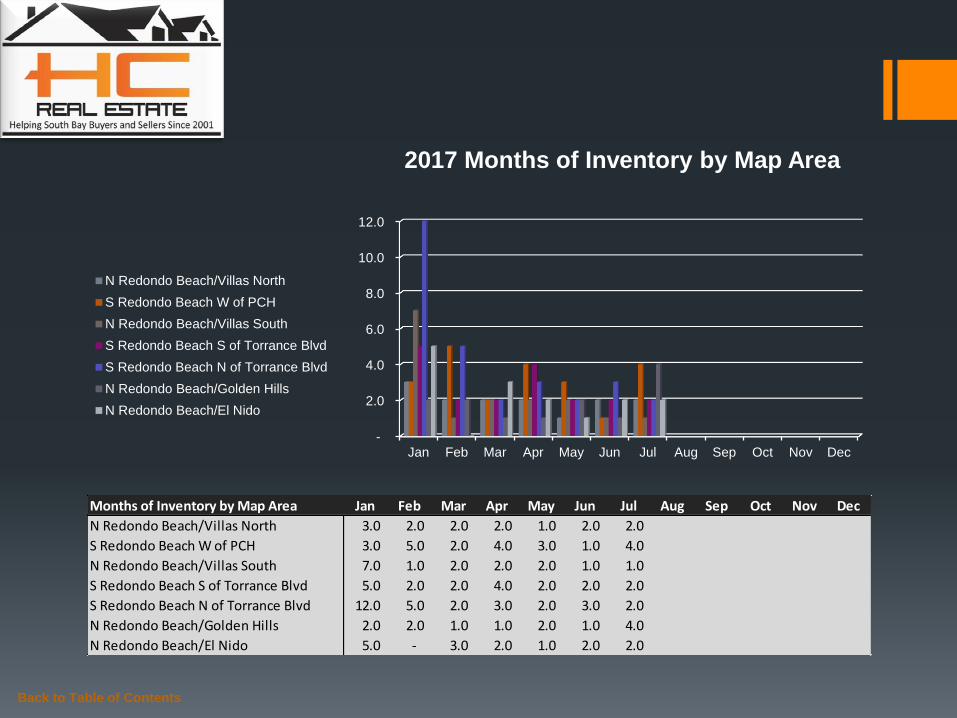
Months of Inventory by Map Area Jan Feb Mar Apr May Jun Jul Aug Sep Oct Nov Dec
N Redondo Beach/Villas North 3.0 2.0 2.0 2.0 1.0 2.0 2.0
S Redondo Beach W of PCH 3.0 5.0 2.0 4.0 3.0 1.0 4.0
N Redondo Beach/Villas South 7.0 1.0 2.0 2.0 2.0 1.0 1.0
S Redondo Beach S of Torrance Blvd 5.0 2.0 2.0 4.0 2.0 2.0 2.0
S Redondo Beach N of Torrance Blvd 12.0 5.0 2.0 3.0 2.0 3.0 2.0
N Redondo Beach/Golden Hills 2.0 2.0 1.0 1.0 2.0 1.0 4.0
N Redondo Beach/El Nido 5.0 - 3.0 2.0 1.0 2.0 2.0
-
2.0
4.0
6.0
8.0
10.0
12.0
Jan Feb Mar Apr May Jun Jul Aug Sep Oct Nov Dec
2017 Months of Inventory by Map Area
N Redondo Beach/Villas North
S Redondo Beach W of PCH
N Redondo Beach/Villas South
S Redondo Beach S of Torrance Blvd
S Redondo Beach N of Torrance Blvd
N Redondo Beach/Golden Hills
N Redondo Beach/El Nido
Back to Table of Contents
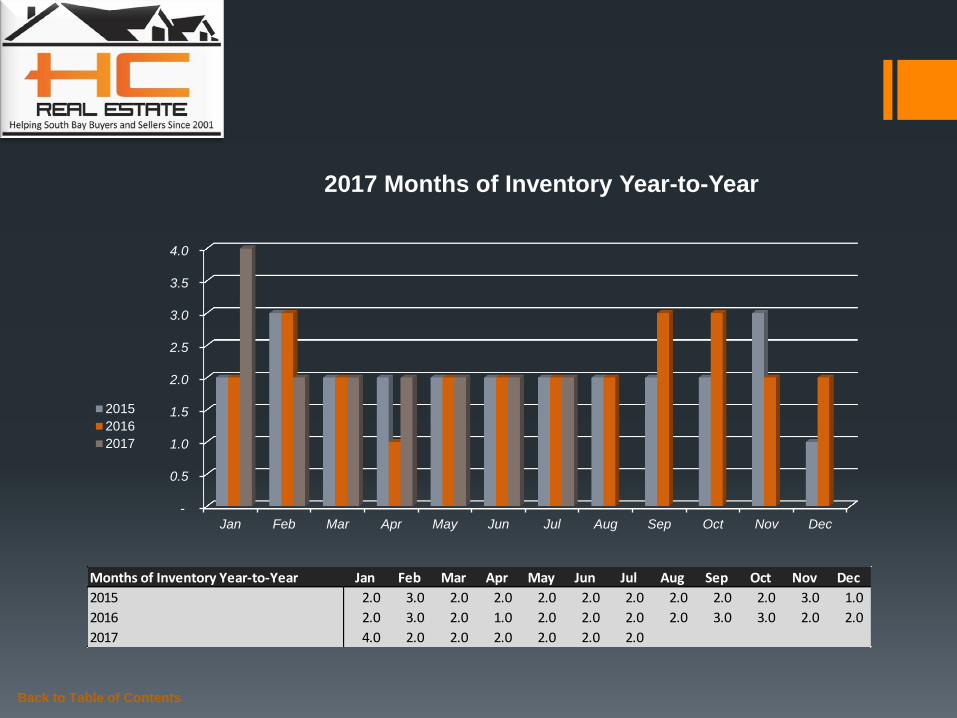
Months of Inventory Year-to-Year Jan Feb Mar Apr May Jun Jul Aug Sep Oct Nov Dec
2015 2.0 3.0 2.0 2.0 2.0 2.0 2.0 2.0 2.0 2.0 3.0 1.0
2016 2.0 3.0 2.0 1.0 2.0 2.0 2.0 2.0 3.0 3.0 2.0 2.0
2017 4.0 2.0 2.0 2.0 2.0 2.0 2.0
-
0.5
1.0
1.5
2.0
2.5
3.0
3.5
4.0
Jan Feb Mar Apr May Jun Jul Aug Sep Oct Nov Dec
2017 Months of Inventory Year-to-Year
2015
2016
2017
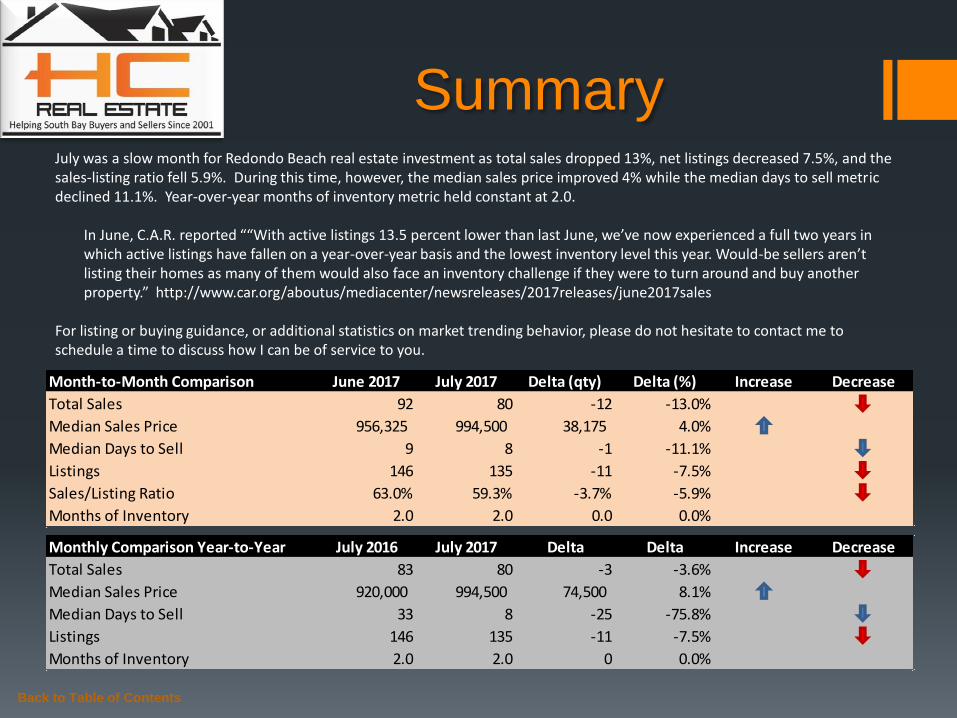
Summary July was a slow month for Redondo Beach real estate investment as total sales dropped 13%, net listings decreased 7.5%, and the sales-listing ratio fell 5.9%. During this time, however, the median sales price improved 4% while the median days to sell metric declined 11.1%. Year-over-year months of inventory metric held constant at 2.0.
In June, C.A.R. reported ““With active listings 13.5 percent lower than last June, we’ve now experienced a full two years in which active listings have fallen on a year-over-year basis and the lowest inventory level this year. Would-be sellers aren’t listing their homes as many of them would also face an inventory challenge if they were to turn around and buy another property.” http://www.car.org/aboutus/mediacenter/newsreleases/2017releases/june2017sales
For listing or buying guidance, or additional statistics on market trending behavior, please do not hesitate to contact me to schedule a time to discuss how I can be of service to you.
Back to Table of Contents
Monthly Comparison Year-to-Year July 2016 July 2017 Delta Delta Increase Decrease
Total Sales 83 80 -3 -3.6%
Median Sales Price 920,000 994,500 74,500 8.1%
Median Days to Sell 33 8 -25 -75.8%
Listings 146 135 -11 -7.5%
Months of Inventory 2.0 2.0 0 0.0%
Month-to-Month Comparison June 2017 July 2017 Delta (qty) Delta (%) Increase Decrease
Total Sales 92 80 -12 -13.0%
Median Sales Price 956,325 994,500 38,175 4.0%
Median Days to Sell 9 8 -1 -11.1%
Listings 146 135 -11 -7.5%
Sales/Listing Ratio 63.0% 59.3% -3.7% -5.9%
Months of Inventory 2.0 2.0 0.0 0.0%

Serving South Bay Home Buyers and Sellers Since 2001
RE/MAX Top 4 Team in California – 2012
RE/MAX 100% Club - 2011
Shorewood Realtors Top 5% in Overall Sales 2001-2006, 2008-2010
Back to Table of Contents
About
Hady Chahine…

The information being provided by CARETS (CLAW, CRISNet MLS, DAMLS, CRMLS, i-Tech MLS, and/or VCRDS) is for the visitor’s personal, non-commercial use and may not be used for
any purpose other than to identify prospective properties visitor may be interested in purchasing. Any information relating to a property referenced on this web site comes from the Internet
Data Exchange (IDX) program of CARETS. This web site may reference real estate listing(s) held by a brokerage firm other than the broker and/or agent who owns this web site. The accuracy
of all information, regardless of source, including but not limited to square footages and lot sizes, is deemed reliable but not guaranteed and should be personally verified through personal
inspection by and/or with the appropriate professionals.
Back to Table of Contents
Listings MLS BLOG Website
Hady Chahine
• 310-404-5361