joint research project - physikalisch-technische … thermal diffusivity characterizes the diffusion...
TRANSCRIPT
1
Joint Research Project
EMRP ENG53 - ThinErgy
Traceable characterisation of thin-film materials for energy
applications
Deliverable D 4.1.9
Good practice guide for the calibration of IR photothermal
radiometry device dedicated to the measurement of thermal
transport properties of thin films
Nolwenn FLEURENCE January 2017
2
Contents 1. Scope ............................................................................................................................................... 3
2. Normative references ...................................................................................................................... 3
3. Terms and definitions ...................................................................................................................... 3
4. Principle of thermal properties measurement using photothermal radiometry technique ........... 5
4.1. General .................................................................................................................................... 5
4.2. Modulated photothermal radiometry ..................................................................................... 5
4.3. Pulsed photothermal radiometry ............................................................................................ 6
4.4. Modelling ................................................................................................................................. 6
4.5. Test specimen .......................................................................................................................... 6
5. Apparatus ........................................................................................................................................ 6
5.1. Sample handling stage............................................................................................................. 7
5.2. Thermal excitation stage ......................................................................................................... 7
5.3. Thermal response detection stage .......................................................................................... 7
5.4. Electronics and signal processing stage .................................................................................. 8
5.5. LNE’s photothermal radiometry apparatus ............................................................................. 8
6. Measurement conditions ................................................................................................................ 9
7. Protocol for frequency calibration of photothermal radiometry device ........................................ 9
7.1. Purpose of the frequency calibration protocol: ...................................................................... 9
7.2. Literature review: .................................................................................................................... 9
7.3. Procedure for frequency calibration: ...................................................................................... 9
7.4. Validation of the frequency calibration: ............................................................................... 10
8. Protocol for temperature calibration of photothermal radiometry device .................................. 11
8.1. Purpose of the temperature calibration of photothermal radiometry device ..................... 11
8.2. Procedure for temperature calibration of photothermal radiometry device: ...................... 11
Bibliographie.......................................................................................................................................... 14
3
1. Scope
This document is a guide for thermal properties measurements on thin films as a function of
temperature by Photothermal Radiometry techniques (PTR) and proposes procedures for
temperature calibration and frequency calibration of the apparatus. PTR techniques are robust
methods to measure thermal properties on two layered sample, where the top and bottom layers
are referred to as the thin film and substrate, respectively. With appropriate modelling of the heat
transfer through the sample, the thermal properties of the thin film can be deduced to the sample
thermal response.
The following paragraphs describe the terms and definitions used in this document, the principle of
measurement, the required equipment for this method, the procedure of frequency calibration and the
procedure of temperature calibration.
2. Normative references
The following referenced documents are required for the application of this document. For dated
references, only the edition cited applies. For undated references, the latest edition of the
referenced document (including any amendments) applies.
ISO 22007-1, Determination of thermal conductivity and thermal diffusivity - Part 1: General principles
ISO 22007-3, Determination of thermal conductivity and thermal diffusivity - Part 3: Temperature wave
analysis method
ISO 22007-4, Determination of thermal conductivity and thermal diffusivity - Part 4: Laser flash method
3. Terms and definitions
For the purpose of this document, the following terms and definitions apply.
Amplitude
Magnitude of the oscillating component of the thermal response.
Calibration sample
Homogeneous, opaque and thermally thick specimen to obtain a one-dimensional solution of
-45 degrees during MPTR measurements.
Front face
Face excited by the light beam.
Instrumental transfer function
Some equipment (detector, amplifier) significantly alter the measured signal at high frequency so the
lag introduced by the equipment needs to be evaluated. The lag curve describing the effects of the
instrumental chain is called instrumental transfer function.
Measured temperature [°C]
Raw data from temperature measurement device without any correction
4
Melting temperature [°C]
The melting temperature of a material is the temperature at which the material changes from a solid to a liquid state. A pure substance melts at a precisely defined temperature as reference materials constituting the International Temperature Scale of 1990 (ITS-90) [1].
Modulated Photothermal Radiometry technique (MPTR)
PTR technique where the sample is excited by an intensity modulated light beam and the oscillating
component of the thermal response is recorded by an infrared detector connected to a lock-in
amplifier.
Onset temperature [°C]
The onset temperature is defined as the intercept between the base line and the tangent at the
inflexion point on a phase versus temperature or a gain versus temperature.
Phase [°]
Phase shift between the exciting modulated light beam and the oscillating component of the thermal
response.
Photothermal Radiometry technique (PTR)
Technique where the sample is excited by shaped light beam and the thermal emission of the sample
is recorded by a monolithic infrared sensor.
Pulsed Photothermal Radiometry technique (PPTR)
PTR technique where the sample is excited by a pulsed light beam with a time duration for which the
laser pulse intensity is larger than half of its maximum value (ISO 22007-4) and the thermal response
is recorded by an infrared detector as a function of time to build the thermogram.
Thermal conductivity [W.m-1.K-1]
The thermal conductivity is the quantity of heat transmitted, due to unit temperature gradient, in unit time under steady conditions in a direction normal to a surface of unit area, when the heat transfer is dependent only on the temperature gradient. The thermal conductivity of a system is determined by how molecules comprising the system interact. Thermal conductivity = heat flow rate × distance / (area × temperature gradient).
𝜆(𝑇) = −Φ
𝑆.𝜕𝑥
𝜕𝑇 [ 1 ]
Thermal diffusion length [m]
Depth beyond which the amplitude of the periodic thermal oscillation decays to 1 𝑒⁄ of the
amplitude at the heated surface. The thermal diffusion length is determined as the square root of the
ratio between twice of the thermal diffusivity [m².s-1] and the angular frequency [rad.s-1].
𝜇 = √2𝑎
𝜔 [ 2 ]
Thermal diffusivity [m².s-1]
The thermal diffusivity characterizes the diffusion speed of heat in the material. It is defined as the
ratio of the thermal conductivity and the volumetric heat capacity.
𝑎 =𝜆
𝜌. 𝐶𝑝 [ 3 ]
5
Thermogram
Temperature versus time curve
Rear face
Opposite face to the excited face (front face).
Volumetric heat capacity [J.m-3.K-1]
Product of the mass density [kg.m3] and the heat capacity [J.kg-1.K-1]
𝑉𝑐 = 𝜌. 𝐶𝑝 [ 4 ]
4. Principle of thermal properties measurement using photothermal
radiometry technique
4.1.General
Photothermal radiometry techniques are based on the study of the thermal response of a sample to
an induced thermal perturbation [2]. The thermal excitation of the sample is induced by light (in
most cases the excitation is provided by a laser beam).
4.2.Modulated photothermal radiometry
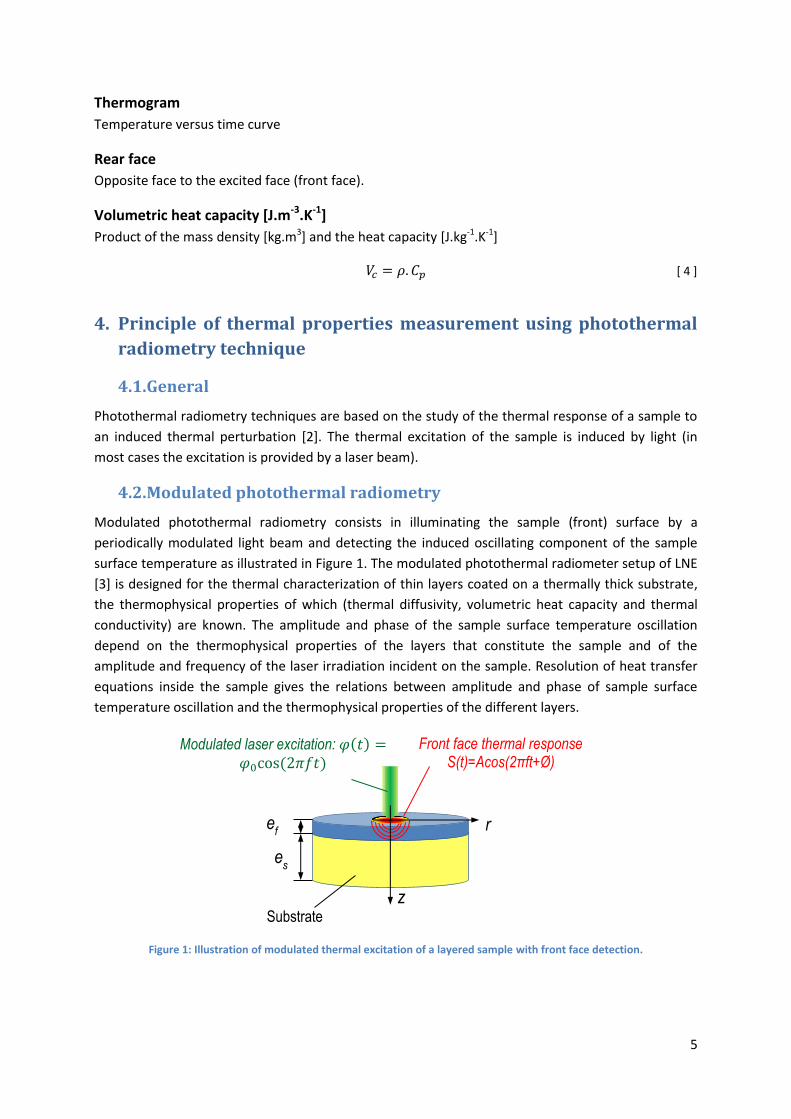
Modulated photothermal radiometry consists in illuminating the sample (front) surface by a
periodically modulated light beam and detecting the induced oscillating component of the sample
surface temperature as illustrated in Figure 1. The modulated photothermal radiometer setup of LNE
[3] is designed for the thermal characterization of thin layers coated on a thermally thick substrate,
the thermophysical properties of which (thermal diffusivity, volumetric heat capacity and thermal
conductivity) are known. The amplitude and phase of the sample surface temperature oscillation
depend on the thermophysical properties of the layers that constitute the sample and of the
amplitude and frequency of the laser irradiation incident on the sample. Resolution of heat transfer
equations inside the sample gives the relations between amplitude and phase of sample surface
temperature oscillation and the thermophysical properties of the different layers.
Figure 1: Illustration of modulated thermal excitation of a layered sample with front face detection.
z
r
es
ef
Substrate
Modulated laser excitation: 𝜑(𝑡) =𝜑0cos(2𝜋𝑓𝑡)
Front face thermal response
S(t)=Acos(2πft+Ø)
6
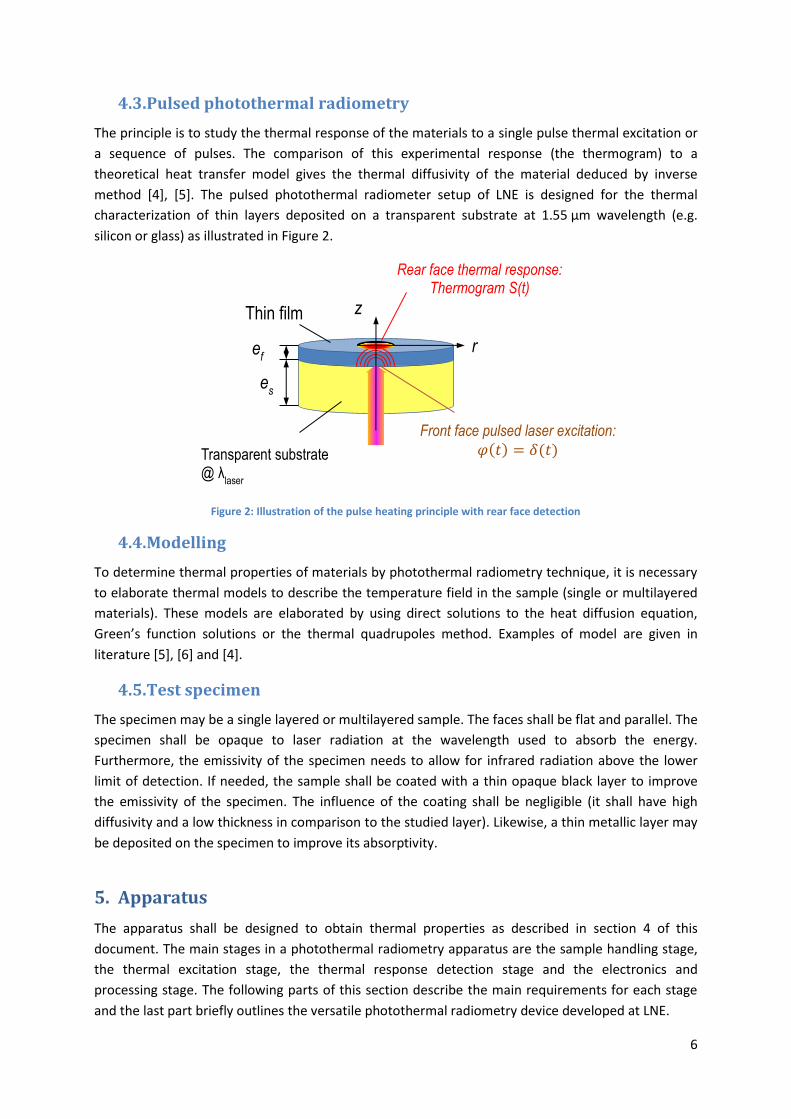
4.3.Pulsed photothermal radiometry
The principle is to study the thermal response of the materials to a single pulse thermal excitation or
a sequence of pulses. The comparison of this experimental response (the thermogram) to a
theoretical heat transfer model gives the thermal diffusivity of the material deduced by inverse
method [4], [5]. The pulsed photothermal radiometer setup of LNE is designed for the thermal
characterization of thin layers deposited on a transparent substrate at 1.55 µm wavelength (e.g.
silicon or glass) as illustrated in Figure 2.
Figure 2: Illustration of the pulse heating principle with rear face detection
4.4.Modelling
To determine thermal properties of materials by photothermal radiometry technique, it is necessary
to elaborate thermal models to describe the temperature field in the sample (single or multilayered
materials). These models are elaborated by using direct solutions to the heat diffusion equation,
Green’s function solutions or the thermal quadrupoles method. Examples of model are given in
literature [5], [6] and [4].
4.5.Test specimen
The specimen may be a single layered or multilayered sample. The faces shall be flat and parallel. The
specimen shall be opaque to laser radiation at the wavelength used to absorb the energy.
Furthermore, the emissivity of the specimen needs to allow for infrared radiation above the lower
limit of detection. If needed, the sample shall be coated with a thin opaque black layer to improve
the emissivity of the specimen. The influence of the coating shall be negligible (it shall have high
diffusivity and a low thickness in comparison to the studied layer). Likewise, a thin metallic layer may
be deposited on the specimen to improve its absorptivity.
5. Apparatus
The apparatus shall be designed to obtain thermal properties as described in section 4 of this
document. The main stages in a photothermal radiometry apparatus are the sample handling stage,
the thermal excitation stage, the thermal response detection stage and the electronics and
processing stage. The following parts of this section describe the main requirements for each stage
and the last part briefly outlines the versatile photothermal radiometry device developed at LNE.
z
r
es
ef
Transparent substrate @ λ
laser
Thin film
Rear face thermal response: Thermogram S(t)
𝜑(𝑡) = 𝛿(𝑡) Front face pulsed laser excitation:
7
5.1.Sample handling stage
The sample handling stage shall be composed by a specimen holder (as ceramic crucible) and if
required a furnace to heat and maintain the specimen at study temperature (the environment in the
furnace shall be vacuum or an inert-gas atmosphere to avoid oxidative degradation during heating
and testing of the specimen). For pulsed photothermal radiometry configuration, the furnace shall be
equipped with two windows, one transparent to the pulse radiation (in front of the front face of the
sample) and the other transparent to the working wavelength range of the infrared detector (in the
front of the rear face of the sample).
The test temperature (temperature of the sample during measurements) shall be measured using a
calibrated temperature measurement device. A protocol for temperature calibration of the
temperature measurement device is described in this document.
5.2.Thermal excitation stage
In most cases the thermal excitation is provided by a laser beam. The laser beam shall be shaped by
dedicated devices to provide the required shape (either for its temporal shape or its size or its
profile).
As an example, to create an approximate 1-D heating condition, a Gaussian laser beam profile may
be homogenised using a flat-top beam shaper and a set of lenses may be used to increase the size of
the laser beam to heat the entire surface of the sample at best. If the spot size is lower than the
sample size, the heating regime still follows a one dimensional solution if the heating spot size higher
than 20 times the thermal diffusion length [7].
For the temporal shape, an optoacoustic modulator drives by dedicated devices (drivers, function
generator) shapes the laser beam to provide the required shape for the excitation (modulated or
pulsed).
5.3.Thermal response detection stage
The thermal response of the sample (on the front face or the rear face depending on selected
configuration: MPTR or PPTR) shall be measured with an infrared photon detector (e.g. photovoltaic
or photoconductor detector). The response of the detector shall be linear with temperature over
temperature range equal or higher than the temperature rise produced by the excitation. In most
cases, the signal delivered by the detector is really small as the amount of radiation emitted by the
sample is small (due to small increase of temperature and/or low emissivity of the sample as the
measured flux φm is proportional to the emissivity of the material and the temperature as describe
in relation [ 5 ] (with ε average emissivity to 10 µm and T0 room temperature), for temperatures
close to room temperature φm is very low.).
𝜑𝑚 ∝ 휀 ∙ 𝜎 ∙ 𝑇03 ∙ 𝑇 [ 5 ]
The signal output (current output of a photovoltaic detector or voltage output of a photoconductive
detector) is generally quite small and needs to be amplified. A dedicated preamplifier has to be
selected depending on the detector (photoconductive or photovoltaic) with an impedance that
matches the detector and with low noise. Special attention will paid to the frequency response of the
8
detection device (detector and its associated preamplifier) that should be faster than the studied
phenomena.
5.4.Electronics and signal processing stage
The electronics and signal processing stage records and analyses the signal from the detector and its
preamplifier (the output signal is usually voltage). For PPTR configuration, the data acquisition
system shall be able to sample enough data points to draw the thermogram (ISO 22007-4
recommends more than 1000 data points on the thermogram). For MPTR configuration, the signal
from the detector and its amplifier (response signal) and the exciting beam (reference signal) are
recorded by a lock-in device. The lock-in amplifies the response signal and compares it to the
reference signal. The lock-in then extracts accurate data to determine the amplitude of the signal and
the phase relative to the reference.
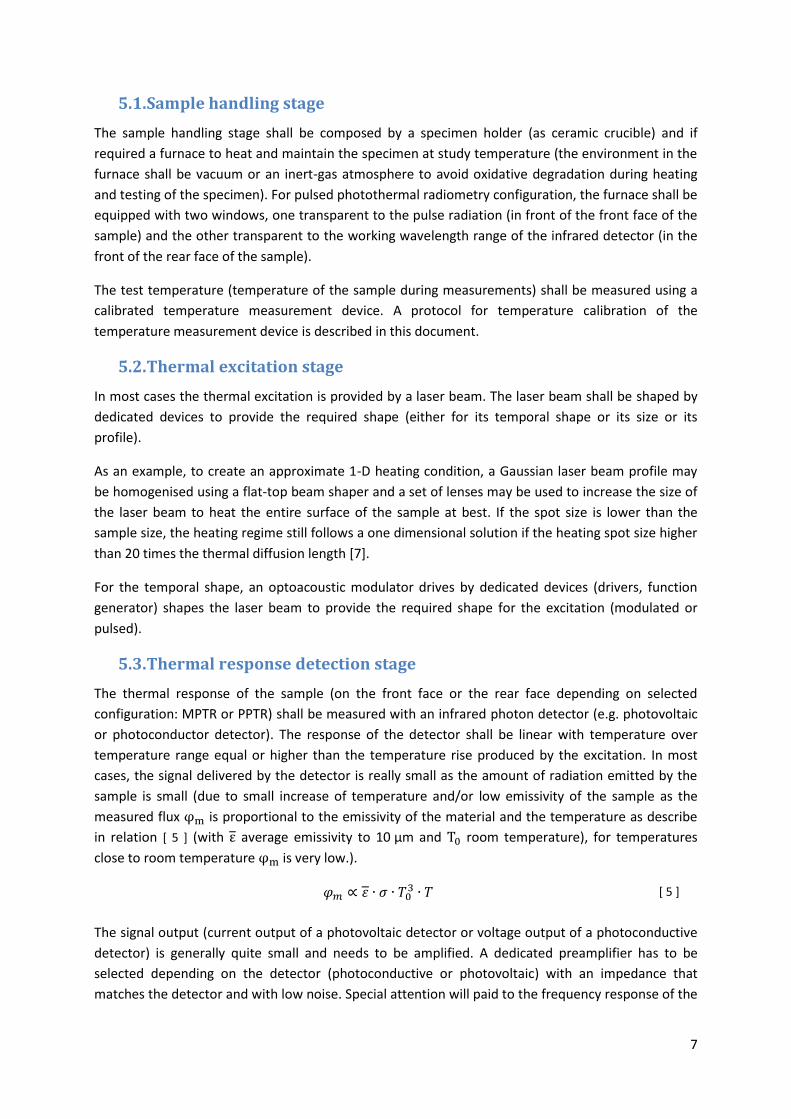
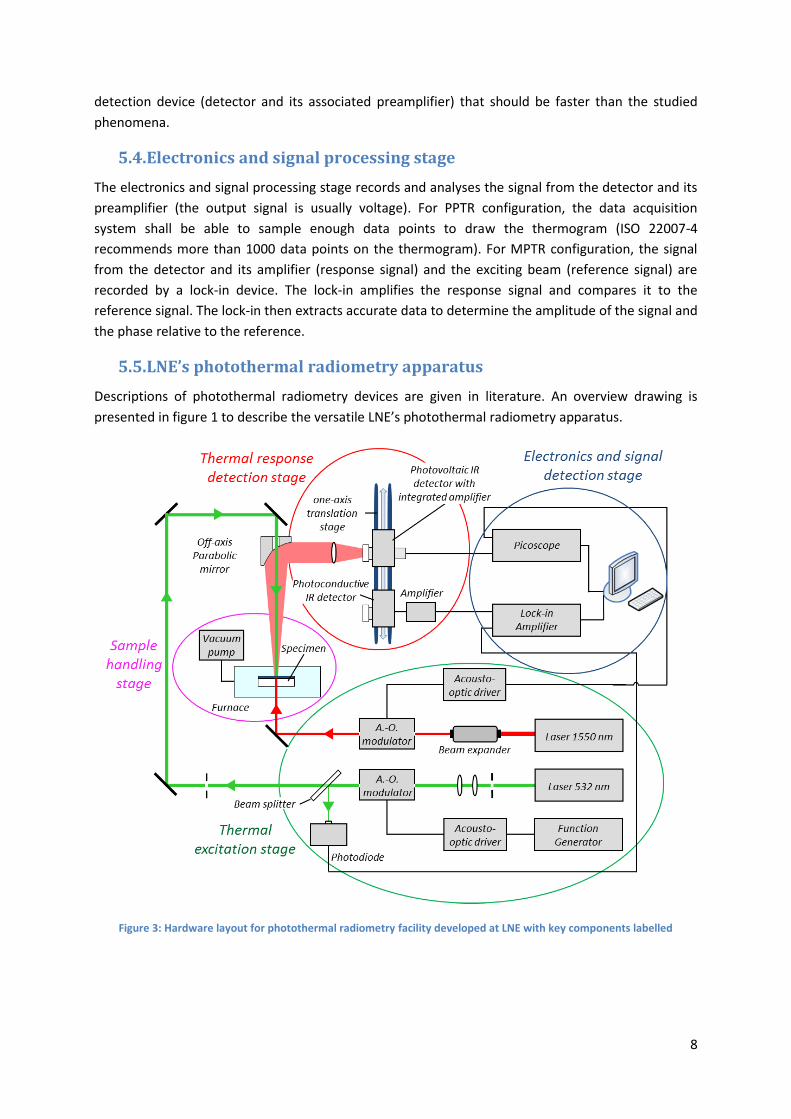
5.5.LNE’s photothermal radiometry apparatus
Descriptions of photothermal radiometry devices are given in literature. An overview drawing is
presented in figure 1 to describe the versatile LNE’s photothermal radiometry apparatus.
Figure 3: Hardware layout for photothermal radiometry facility developed at LNE with key components labelled
9
6. Measurement conditions
As measurements are performed in range of room temperature to 1000 °C, the sample shall be
maintained and operated in inert gas atmosphere or vacuum suitable for the intended measurement.
The experimental conditions must be strictly identical for the calibration and the measurement steps.
The user must record all the experimental parameters (process temperature, atmosphere, gas flow
or pressure, power of laser,…) needed in his modelling.
7. Protocol for frequency calibration of photothermal radiometry
device
7.1. Purpose of the frequency calibration protocol: The following protocol describes the frequency calibration procedure used at LNE to determine the
instrumental transfer function of the detection/acquisition stage in its modulated photothermal
radiometry configuration. The instrumental transfer function of the system should be determined for
phase and amplitude response modes.
7.2. Literature review: In the literature review a few methods have been proposed to determine corrected frequency
instrumental factor [8]:
Use of calibration sample [9]: this method relies on sample homogeneity and a one
dimensional heating regime. The main difficulty of this method is that at low frequencies, the
two dimensional heat transfer occurs and causes the sample’s response to deviate from the
one dimensional theory.
Direct measurement of the laser by the detector to determine the instrumental transfer
function [10]: The instrument transfer function method is to detect the exciting laser beam
intensity by the same detector as used in the measurement. This method needs that the
detector is sensitive to the laser wavelength.
Self-normalization procedure based on the signal ratio for front face and rear face. This
method may be used for a homogenous single-layered thick sample [11] (for example a
5 mm thickness stainless 304L sample).
7.3. Procedure for frequency calibration: LNE has selected the second method for frequency calibration as our detector is sensitive to the laser
wavelength (532 nm). The detector is directly irradiated by the reflected beam of the laser on a
reflective material. A bandpass filter, centring on 532 nm is placed in front of the detector to filter IR
emission from the sample. The response of the detector and its preamplifier is recorded by the lock-
in detection as well as the reference laser beam. By theory the phase lag between the two signals is
the instrumental transfer function of the detection/acquisition system. This calibration is performed
for each instrumental configuration depending on frequency study domain:
Low frequency range (<200 Hz): first stage preamplifier configuration used
High frequency range (>200 Hz): first or second stage preamplifier configuration used
10
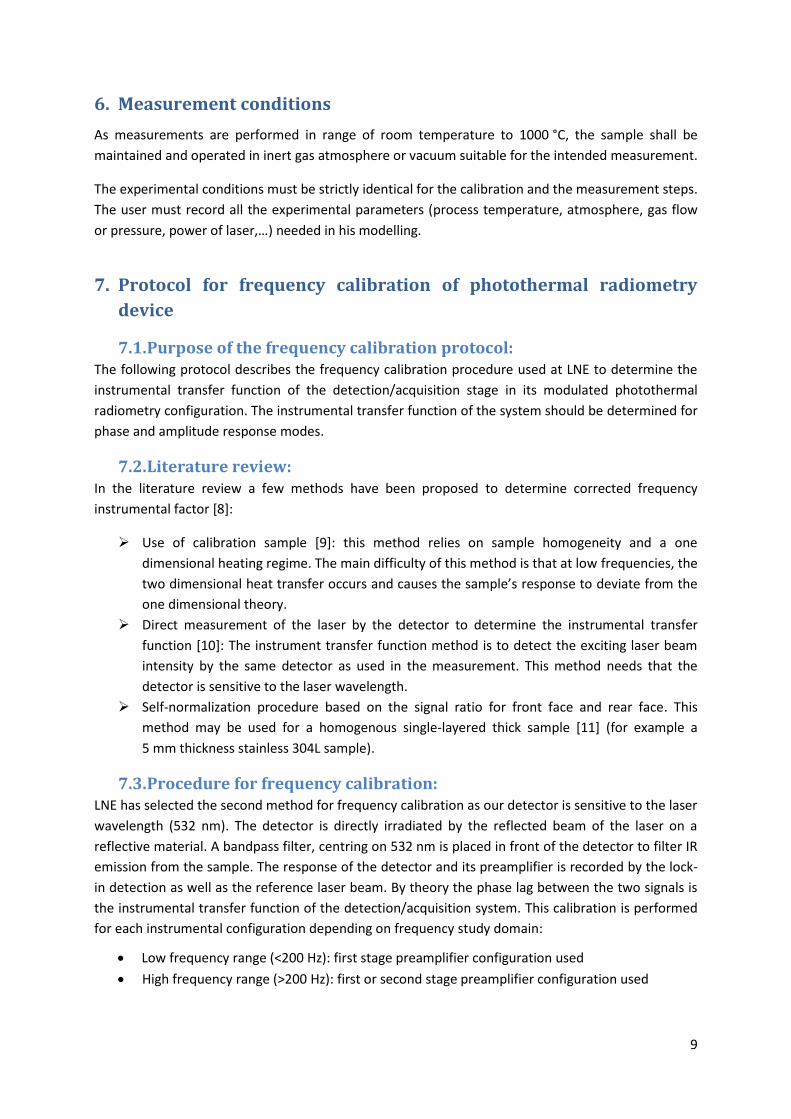
Figure 4: Instrumental transfer function measured for LNE's device
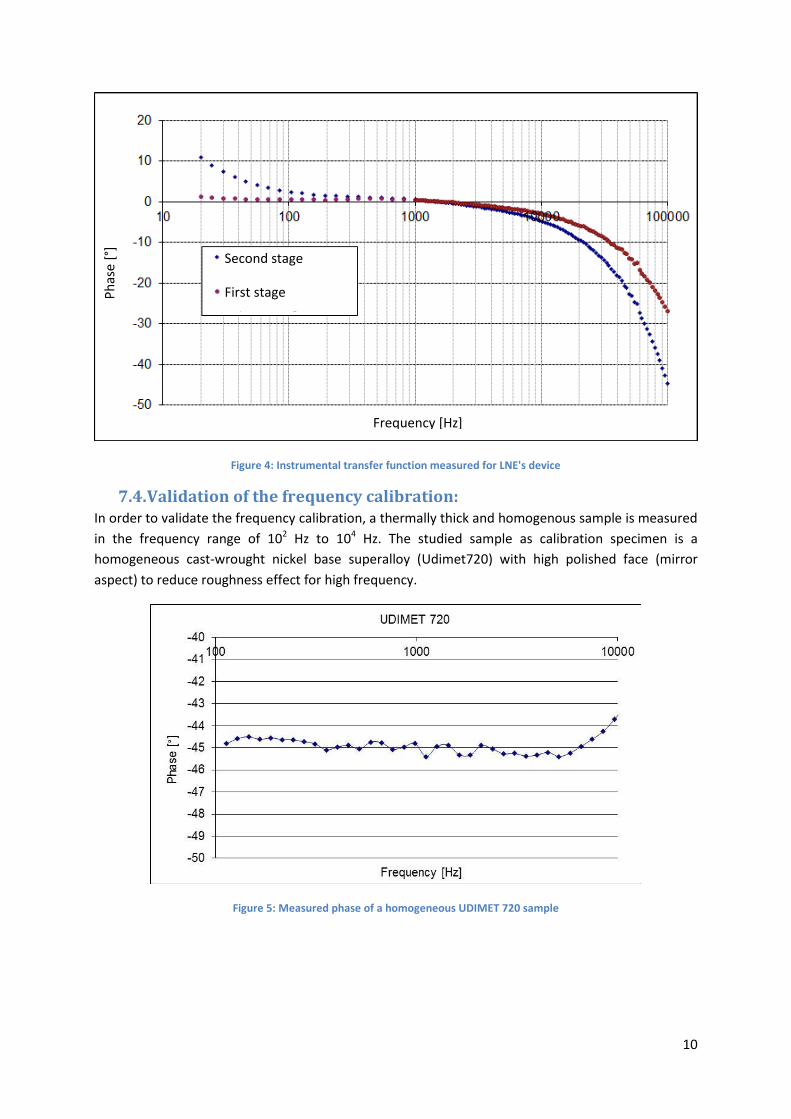
7.4. Validation of the frequency calibration: In order to validate the frequency calibration, a thermally thick and homogenous sample is measured
in the frequency range of 102 Hz to 104 Hz. The studied sample as calibration specimen is a
homogeneous cast-wrought nickel base superalloy (Udimet720) with high polished face (mirror
aspect) to reduce roughness effect for high frequency.
Figure 5: Measured phase of a homogeneous UDIMET 720 sample
Frequency [Hz]
Ph
ase
[°]
Second stage
First stage
11
8. Protocol for temperature calibration of photothermal radiometry
device
8.1. Purpose of the temperature calibration of photothermal radiometry
device As thermal properties are function of temperature, it is necessary to accurately control the
temperature of the sample during measurements. The sample temperature may be disturbed by the
crucible heating, the energy deposited by the exciting laser beam and by heat losses. For these
reasons, LNE has developed a specific temperature calibration procedure dedicated to its
photothermal radiometry measurements.
8.2.Procedure for temperature calibration of photothermal radiometry
device:
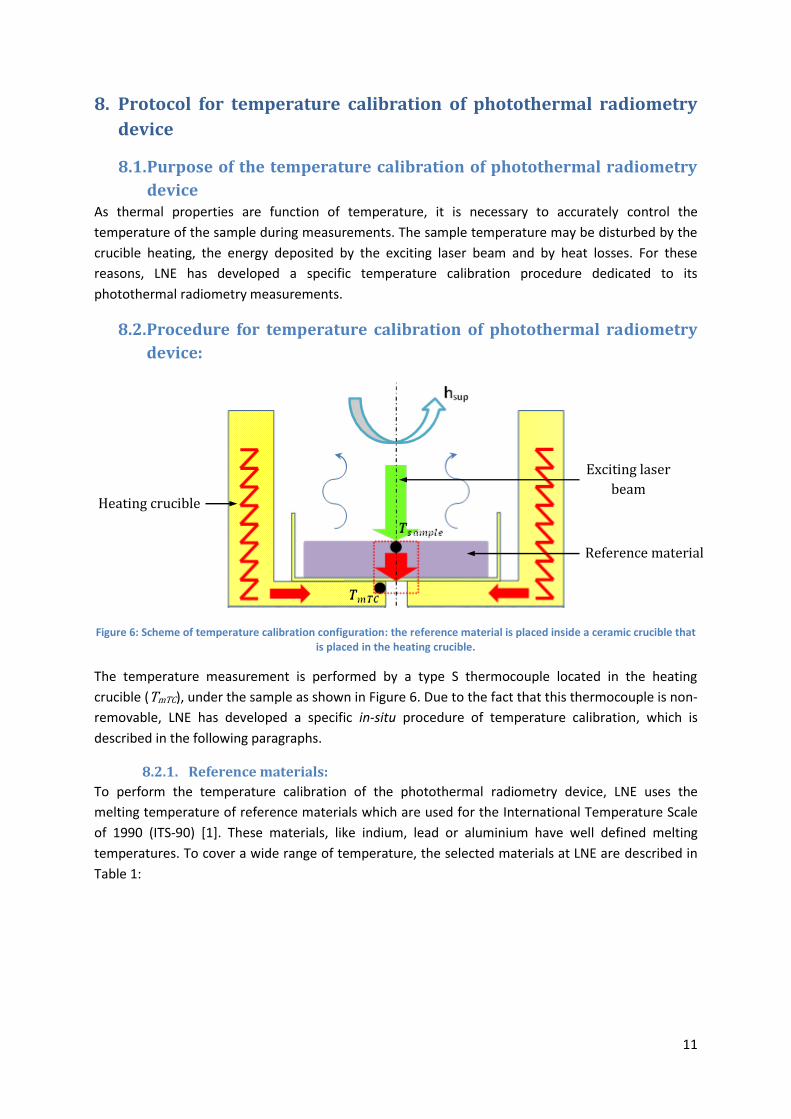
Figure 6: Scheme of temperature calibration configuration: the reference material is placed inside a ceramic crucible that is placed in the heating crucible.
The temperature measurement is performed by a type S thermocouple located in the heating
crucible (TmTC), under the sample as shown in Figure 6. Due to the fact that this thermocouple is non-
removable, LNE has developed a specific in-situ procedure of temperature calibration, which is
described in the following paragraphs.
8.2.1. Reference materials:
To perform the temperature calibration of the photothermal radiometry device, LNE uses the
melting temperature of reference materials which are used for the International Temperature Scale
of 1990 (ITS-90) [1]. These materials, like indium, lead or aluminium have well defined melting
temperatures. To cover a wide range of temperature, the selected materials at LNE are described in
Table 1:
Heating crucible
Reference material
Exciting laser
beam
12
Table 1: Reference materials used at LNE to perform the temperature calibration of PTR device
Material Bi/In Indium Tin Lead Zinc Aluminium
Tmelting [°C] 72.71 156.6 231.9 327.5 419.5 660.3
The Bi/In is an eutectic alloy made at LNE and composed of 66.7% of mass of bismuth and 33.7% of
mass of indium. The composition is drawn from the bismuth-indium phase diagram [12]. The alloy
was made from high purity metals (≥ 99,999%).
8.2.2. Heating of reference materials:
The reference material is placed inside a thin ceramic crucible (to avoid chemical interaction
between reference material and crucible during melting). The material is slowly heated with a rate of
1°C/min at maximum from 20°C under its melting temperature to 10°C above its melting
temperature. It is better to perform the heating of reference material under inert gas conditions, to
select the same gas as later on during sample measurement to avoid oxidation and to ensure the
same convective heat transfer between calibration and measurement.
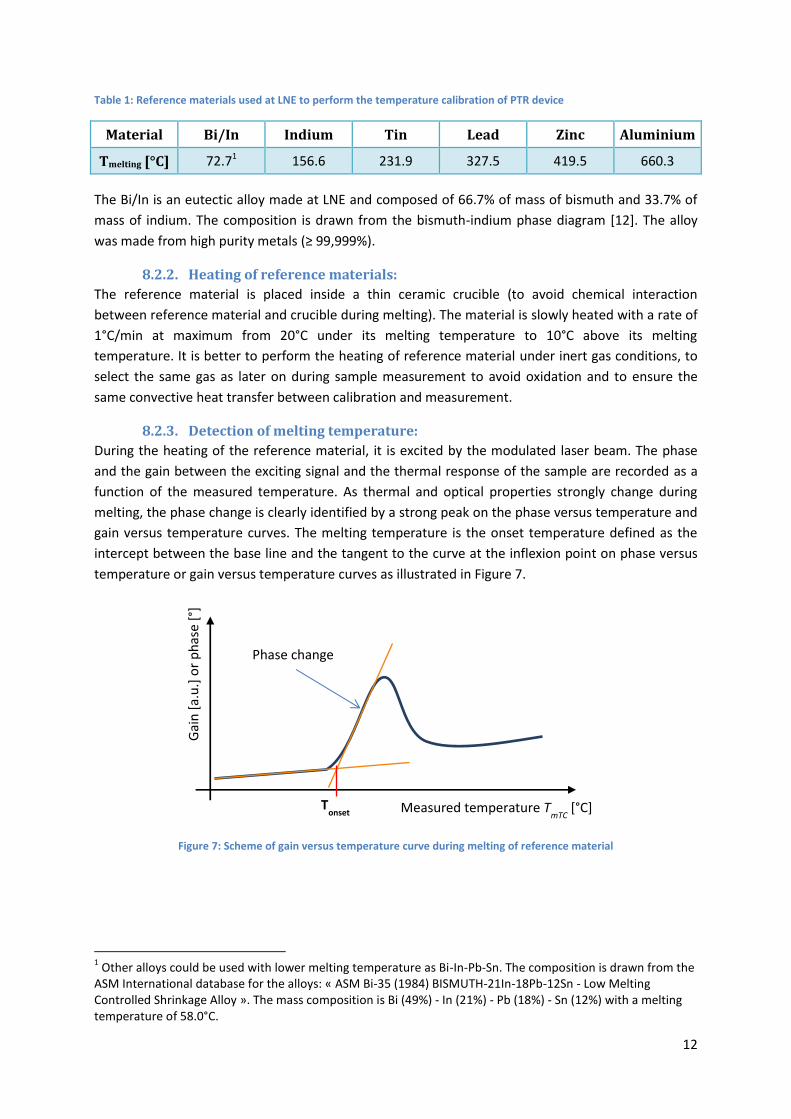
8.2.3. Detection of melting temperature:
During the heating of the reference material, it is excited by the modulated laser beam. The phase
and the gain between the exciting signal and the thermal response of the sample are recorded as a
function of the measured temperature. As thermal and optical properties strongly change during
melting, the phase change is clearly identified by a strong peak on the phase versus temperature and
gain versus temperature curves. The melting temperature is the onset temperature defined as the
intercept between the base line and the tangent to the curve at the inflexion point on phase versus
temperature or gain versus temperature curves as illustrated in Figure 7.
Figure 7: Scheme of gain versus temperature curve during melting of reference material
1 Other alloys could be used with lower melting temperature as Bi-In-Pb-Sn. The composition is drawn from the
ASM International database for the alloys: « ASM Bi-35 (1984) BISMUTH-21In-18Pb-12Sn - Low Melting Controlled Shrinkage Alloy ». The mass composition is Bi (49%) - In (21%) - Pb (18%) - Sn (12%) with a melting temperature of 58.0°C.
Measured temperature TmTC
[°C]
Gai
n [
a.u
.] o
r p
has
e [°
]
Phase change
Tonset
13
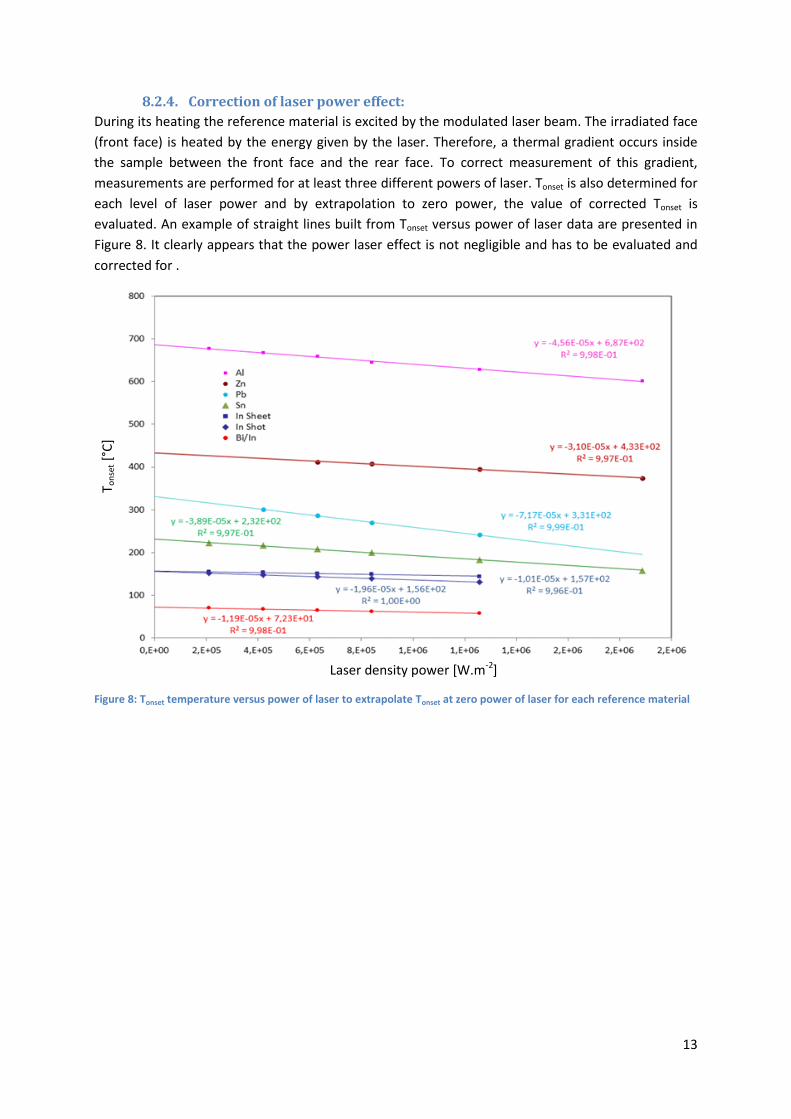
8.2.4. Correction of laser power effect:
During its heating the reference material is excited by the modulated laser beam. The irradiated face
(front face) is heated by the energy given by the laser. Therefore, a thermal gradient occurs inside
the sample between the front face and the rear face. To correct measurement of this gradient,
measurements are performed for at least three different powers of laser. Tonset is also determined for
each level of laser power and by extrapolation to zero power, the value of corrected Tonset is
evaluated. An example of straight lines built from Tonset versus power of laser data are presented in
Figure 8. It clearly appears that the power laser effect is not negligible and has to be evaluated and
corrected for .
Figure 8: Tonset temperature versus power of laser to extrapolate Tonset at zero power of laser for each reference material
T on
set [
°C]
Laser density power [W.m-2]
14
Bibliographie
[1] H. Preston-Thomas, «The International Temperature Scale of 1990 (ITS-90)», Metrologia, vol. 27,
p. 3, 1990.
[2] P. E. Nordal et S. O. Kanstad, «Photothermal radiometry», Phys. Scr., vol. 20, n°15-6, p. 659-662,
1979.
[3] N. Fleurence, B. Hay, G. Davée, A. Cappella et E. Foulon, «Thermal conductivity measurements of
thin films at high temperature by modulated photothermal radiometry at LNE», physica status
solidi (a), vol. 212, p. 535–540, 2015.
[4] D.-C. Balagea, J.-C. Krapez et P. Cielo, «Pulsed photothermal modeling of layered materials», J.
Appl. Phys., vol. 59, p. 348-357, January 1986.
[5] D. Maillet, S. André, J.-C. Batsale, A. Degiovanni et C. Moyne, «Thermal quadrupoles: Solving the
heat equation through integral transforms», Wiley, 2000.
[6] J.-L. Battaglia et A. Kusiak, «Thermophysical characterization of a CuO thin deposit», Int. J.
Therm, vol. 28, n°15, p. 1563-1577, october 2007.
[7] D. P. Almond et P. M. Patel, «Photothermal Science and Techniques», London: Chapman & Hall,
1996.
[8] R. Fuente, E. Apinaniz, A. Mendioroz et A. Salazar, «Simultaneous measurement of thermal
diffusivity and optical absorption coefficient using photothermal radiometry. I. Homogeneous
solids», J. Appl. Phys., vol. 110, n°13, p. 33515-33519, 2011.
[9] M. Munidasa, F. Funak et A. Mandelis, «Application of a generalized methodology for
quantitative thermal diffusivity depth profile reconstruction in manufactured inhomogeneous
steel-based materials», J. Appl. Phys, vol. 83, p. 3495, 1998.
[10] A. Fleming, «Uncertainty qualification of photothermal radiometry measurements using Monte
Carlo simulation and experimental repeatability», paper 3299, Utah state university, 2014.
[11] J. A. Balderas-Lopez et A. Mandelis, «Self-normalized photothermal technique for accurate
thermal diffusivity measurements in thin metal layers», Rev. Sci. Instrum., vol. 74, n°112, p.
5219-5225, december 2003.
[12] J. Martan, «Optical layer development for thin films thermal conductivity measurement by
pulsed photothermal radiometry», Rev. Sci. Instrum., vol. 86, p. 014902, 2015.
[13] H. Okamoto, «Alloy phase diagrams», vol. 3, ASM Metal Handbook, 1992.