jobsite security on commercial construction...
TRANSCRIPT
JOBSITE SECURITY ON COMMERCIAL CONSTRUCTION PROJECTS
By
ROBERT BERG
A THESES PRESENTED TO THE GRADUATE SCHOOL OF THE UNIVERSITY OF FLORIDA IN PARTIAL FULFILLMENT
FOR THE DEGREE OF MASTER OF SCIENCE IN BUILDING CONSTRUCTION
UNIVERSITY OF FLORIDA
2003

Copyright 2003
by
Robert Berg

This document is dedicated to my parents.
ACKNOWLEDGMENTS
I thank my parents for giving me the support to attend the University of Florida. I
also thank Dr. Jimmie Hinze of the M.E. Rinker Sr. School of Building Construction who
offered the guidance, knowledge, and patience that was needed to complete this research.
Lastly, I would like to thank Xinyu Huang, Ph.D. candidate in the School of Building
Construction, whose time and assistance in this endeavor were invaluable.
iv
TABLE OF CONTENTS Page ACKNOWLEDGMENTS ................................................................................................. iv
LIST OF TABLES............................................................................................................. vi
LIST OF FIGURES .......................................................................................................... vii
CHAPTER 1 INTRODUCTION ...........................................................................................................1
2 LITERATURE REVIEW ................................................................................................3
3 RESEARCH METHODOLOGY...................................................................................14
4 RESULTS ......................................................................................................................17
Theft............................................................................................................................20 Vandalism...................................................................................................................35
5 CONCLUSIONS AND RECOMMENDATIONS ........................................................40
Conclusions.................................................................................................................40 Recommendations.......................................................................................................42
APPENDIX A MAILED QUESTIONAIRE COVER LETTER ..........................................................45
B JOBSITE SECURITY QUESTIONAIRE ....................................................................46
LIST OF REFERENCES...................................................................................................46
BIOGRAPHICAL SKETCH .............................................................................................51
v
LIST OF TABLES
Table page 4-1 Measures used to ensure jobsite security on the construction site (percentages out
of 100 responses)......................................................................................................28
4-2 Measures used to prevent the theft of tools on the construction site (percentages out of 93 responses)........................................................................................................28
4-3 Measures used to prevent the theft of machinery and equipment on the construction site (percentages out of 93 responses)......................................................................29
4-4 Measures commonly used to ensure security on the construction site as related to annual theft loss per million dollars of construction effort ......................................31
4-5 Measures commonly used to the theft of tools as related to annual theft loss per million dollars of construction effort .......................................................................32
4-6 Estimated annual dollar loss of theft incidents as related to the size of the company32
4-7 Average loss experienced by each company as related to the size of the company.33
4-8 Annual dollar value of theft loss per million dollars of work performed as related to company size. ...........................................................................................................33
4-9 Number of measures checked by participants as being used to ensure jobsite security as related to the size of the company..........................................................33
4-10 Minimum value of loss reported to law enforcement in incidents of theft as related to the size of the company........................................................................................34
4-11 The deductible of the company’s builders risk insurance policy as related to the size of the company .........................................................................................................34
4-12 Annual dollar value of vandalism loss per million dollars of work performed as related to company size. ...........................................................................................39
vi
LIST OF FIGURES
Figure page 4-1 Annual dollar volume of work performed (n=100) .....................................................17
4-2 Type of respondent firm (n=100) ................................................................................18
4-3 Type of projects undertaken (n=100) ..........................................................................19
4-4 Percentage of work subcontracted to others (n=86) ....................................................19
4-5 Number of thefts per year (n=88) ................................................................................20
4-6 Estimated total dollar loss resulting from theft in the last three years (n=81).............21
4-7 Theft loss per $1 million of work performed (n=79)...................................................21
4-8 Percentage of theft incidents reported to law enforcement (n=95) .............................22
4-9 Number of tool theft incidents experienced in the last three years (n=33)..................23
4-10 Average value of loss per theft incident ....................................................................24
4-11 Minimum value of theft loss reported to law enforcement (n=84)............................25
4-12 Deductible amount on the company’s builders risk insurance policy (n=67) ...........25
4-13 Percentage of theft incidents in which stolen items have been recovered (n=92).....26
4-14 Percentage of thefts thought to be caused by employees/former employees (n=84) 27
4-15 Number of vandalism incidents (n=76) .....................................................................35
4-16 Estimated annual loss due to vandalism (n=63) ........................................................36
4-17 Annual vandalism loss per $1 million of work performed (n=63) ............................36
4-18 Suspected identity of vandals ....................................................................................38
vii
Abstract of Dissertation Presented to the Graduate School of the University of Florida in Partial Fulfillment of the
Requirements for the Degree of Master of Science in Building Construction
JOBSITE SECURITY ON COMMERCIAL CONSTRUCTION PROJECTS
By
Robert Berg
August 2003
Chair: Jimmie Hinze Major Department: Building Construction
Theft and vandalism on construction sites in the commercial construction industry
is a problem that can affect productivity and drain profits. To explore the impact of theft
and vandalism in the commercial construction industry, a survey was sent to commercial
construction firms to gather information by which the magnitude of the problem of theft
and vandalism could be estimated; and to determine what techniques have been
successfully used to deter thieves and vandals. The responses were analyzed and the
following conclusions were developed:
• Firms engaging in all types of projects are susceptible to theft and vandalism.
• Theft and vandalism is more costly to small to medium sized firms (less than $100 million annual volume of construction work) than larger firms.
• Larger firms use a greater number of measures to combat theft and vandalism on their construction sites.
viii
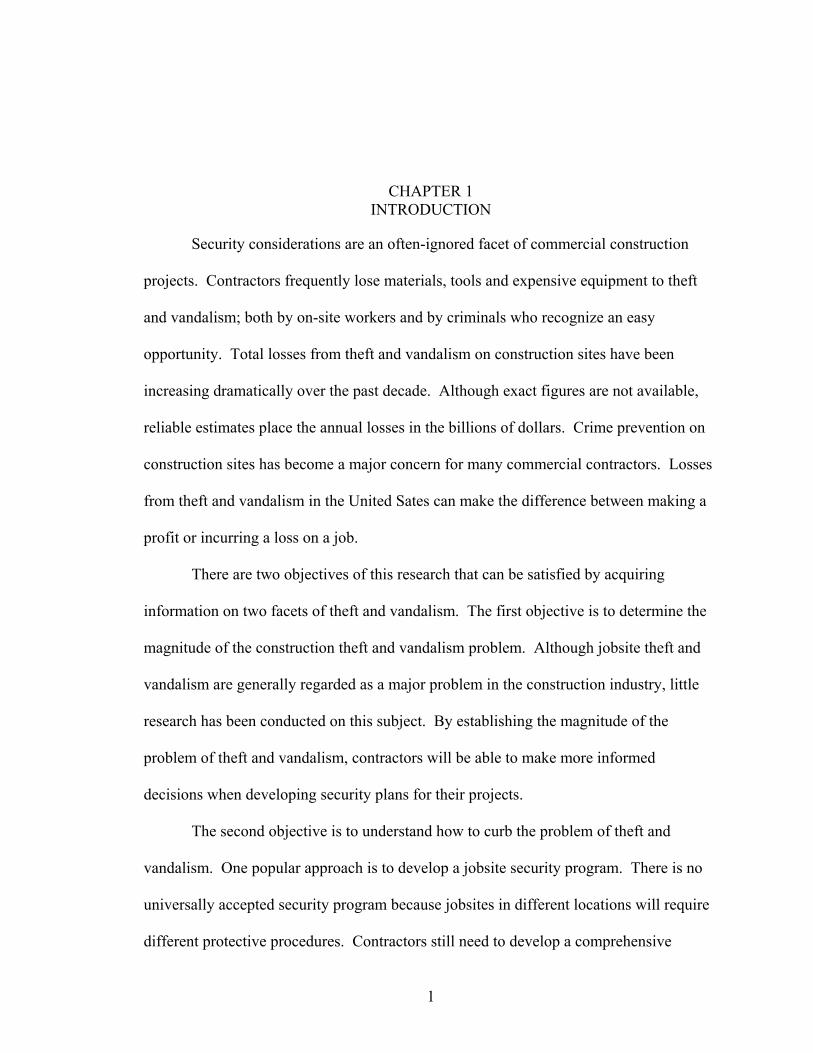
CHAPTER 1 INTRODUCTION
Security considerations are an often-ignored facet of commercial construction
projects. Contractors frequently lose materials, tools and expensive equipment to theft
and vandalism; both by on-site workers and by criminals who recognize an easy
opportunity. Total losses from theft and vandalism on construction sites have been
increasing dramatically over the past decade. Although exact figures are not available,
reliable estimates place the annual losses in the billions of dollars. Crime prevention on
construction sites has become a major concern for many commercial contractors. Losses
from theft and vandalism in the United Sates can make the difference between making a
profit or incurring a loss on a job.
There are two objectives of this research that can be satisfied by acquiring
information on two facets of theft and vandalism. The first objective is to determine the
magnitude of the construction theft and vandalism problem. Although jobsite theft and
vandalism are generally regarded as a major problem in the construction industry, little
research has been conducted on this subject. By establishing the magnitude of the
problem of theft and vandalism, contractors will be able to make more informed
decisions when developing security plans for their projects.
The second objective is to understand how to curb the problem of theft and
vandalism. One popular approach is to develop a jobsite security program. There is no
universally accepted security program because jobsites in different locations will require
different protective procedures. Contractors still need to develop a comprehensive
1
2
written plan as well as an individual jobsite plan to curb theft and vandalism. By
understanding the various mechanisms used to address theft and vandalism, contractors
will be better able to devise effective security plans. By learning from the experiences of
others, contractors can reduce losses and perhaps make security plans more cost effective.
The methods used by successful companies to address jobsite security may offer insights
to others for dealing with theft and vandalism on their projects.
CHAPTER 2 LITERATURE REVIEW
Jobsite security is an often-ignored facet of commercial construction projects.
The construction industry in the United States lost nearly $1 billion in 2001 because of
theft of equipment and tools, according to the National Insurance Crime Bureau
(McDowall, 2002). No known studies have determined the distribution of the theft losses
among the different sectors of the construction industry. Many insurance companies state
that equipment losses due to vandalism account for up to 22% of large contractor
equipment losses (Bonesteel 1997). Theft and vandalism is not limited to the United
States. According to the Japan Construction Equipment Manufacturers Association,
more than 1,000 construction machines were stolen last year alone in Japan (Rental
Equipment Registrar Magazine, 2002). According to insurer Zurich Canada, in Canada,
the losses totaled at least $32 million, with annual insurance claims representing more
than $46 million (The Mechanical Contractors Association of Toronto Fall 1999). While
all sectors have problems with theft and vandalism, this literature review focuses on the
problem facing commercial contractors in the United States.
A 1990 survey conducted by the Associated General Contractors (AGC) indicated
that the average contractor loses more than $13,000 a year from theft and vandalism
(Banks 1990). It has been estimated that 90% of stolen construction equipment is stolen
from job sites where there may be little security and where equipment remains
unattended over the weekends (McDowall, 2002). The magnitude of the problem of theft
and vandalism is difficult to estimate with accuracy. Many contractors do not report the
3
4
theft of equipment to the police if the object stolen is valued less than the company’s
insurance deductible amount. In terms of vandalism, numerous contractors consider an
act of vandalism to be “part of the job” if it is not of an extraordinary cost. There has
been no systematic method of estimating the magnitude of the problem of theft and
vandalism among the many contractors and jobsites that are susceptible to such losses.
Besides the monetary losses resulting from theft and vandalism, associated
indirect costs should also be considered. Costly job delays, downtime for operators,
higher insurance premiums, and the possible cancellation of an insurance policy, with the
accompanying risk of jeopardizing bonding and borrowing power, make jobsite security
practices crucial for the commercial construction firm (Middleton, 1999). Because of
this, theft and vandalism can be major cost components of a construction project. The
cost is potentially sufficient to make the difference of making a profit or incurring a loss
on a project.
Because of the magnitude of the problem, it is worthwhile to understand what
techniques firms have found to be successful in preventing theft and vandalism on their
jobsites. The possible forms of deterrence can be very different depending on the
multiple variables that can be associated with any jobsite. These variables include the
locale where the work is being done (running the gamut from rural to urban). The
locality where the work is being done, along with the type of construction being
performed, must also be taken into account when assessing the performance of a
particular jobsite security plan.
Regarding jobsite security, the role played by location can be seen in recent
research dealing with theft. According to FBI statistics, location is an important risk
5
factor: the three hottest areas for construction equipment theft are New Jersey, Miami,
and Southern California. These three locations also accounted for more than half of the
recoveries of equipment in 2002 (McDowall, 2002). Construction theft is also a local
issue. In 70% of cases, the equipment never left the local area, (i.e., it was in storage on
or near a local job site). Florida, California, Georgia, Texas and Arizona (all with rapid
growth rates and large numbers of construction projects) accounted for 83% of the
recoveries. It has been theorized that these states have more ongoing winter construction
work, and the data were gathered between January and June; hence, it may be weighted
or biased. It was also reported that the most theft item recoveries occurred in Florida, at
35%; California at 17%; Georgia at 12%; Texas and Arizona each at 10%; Massachusetts
at 7%; New York at 5%; Michigan and Connecticut each at 2% (McDowall, 2002).
Many contractors feel that the best way to help control jobsite theft and vandalism
is to develop a thorough jobsite antitheft plan before the start of construction work. The
first step is to decide on a sensible, written security plan during the preconstruction
period. Money should be set aside when preparing the estimate for proper lighting, alarm
systems, fencing, watchdogs, and security guard services if applicable (Banks, 1990).
Security responsibilities should be assigned to the project manager, project engineer,
superintendent, or any other employee who is in a position of responsibility. One of
these individuals then should be made responsible for recording all incoming material
deliveries. This will insure that everything is properly recorded when it is stored on site.
Police and fire departments should also be contacted and a good line of communication
should be established. Local law enforcement must be encouraged to patrol the area at
night (when most theft and vandalism incidents occur). A construction company ought to
6
be aware of the fact that local law enforcement cannot be everywhere at once; and they
should encourage vendors and the public to take a vested interest in the security of the
jobsite (Bonesteel, 1997). Locals actively watching a construction site can act as another
form of security. If everyone involved with a project is made aware of the problems that
can result from jobsite theft and vandalism, jobsite security can be made to run more
smoothly.
Before implementing a jobsite security plan one should consider the following:
the company’s businesses history of recurring theft problems (how much does the
company have to lose?). The greater the liability, the greater the company’s investment
in security should be. The political aspects of the job must also be weighed. Is the job
controversial? Is there a history of crime problems in the area? The answers to these
questions will help the company determine the type and amount of security required to
reduce the opportunity for theft on the job site (Lumberman’s of Washington, Inc. 2000).
One area to look for information on a comprehensive job site security plan is the
Associated General Contractors (AGC), which provides information to their members on
various topics in construction. Each state differs slightly due to specific needs of the
particular region, but on the whole each state echoes the same warnings and advice. The
following is taken from the AGC of Washington regarding security recommendations
provided to its members:
• Visit the site after dark to evaluate lighting. Additional lighting can be a wise investment against theft.
• Place the tool storage area where it can be seen by law enforcement, neighbors, and others who can report unusual activity.
7
• Alert neighbors and nearby businesses about the work being performed in the area. Ask them to keep watch for unusual activities. Provide a contact person and phone number to call when suspicious activity is observed.
• Notify the local law enforcement agency when construction work is begun in the area. Provide them with the name of a company contact and telephone number.
• Install adequate perimeter fencing. Check and maintain the security fence weekly.
• Close fences.
• Close locks during the day.
• Develop a key control system and use it, consistently!
• Take tires off small equipment.
• Conduct an inventory of tools and equipment to ensure that all items are marked with the company name and the drivers’ license number of the company principal.
• Maintain an inventory of all tools and equipment used on the project including a list of the items and their model and serial numbers.
• Develop a tool loan policy.
• Remember: engage employees in these prevention techniques. Be sure all tools and equipment are locked up at the end of each work day.
Prepare for long holiday weekends:
• Remove high cost equipment from the site.
• Remove vehicle and equipment batteries.
• Install theft prevention devices to disable fuel, hydraulic, and electrical systems.
• Remove wheels from job trailers, compressors, and generators.
• Take the tongue off equipment (if removable), if bolted, remove from site.
• Remove and secure large amounts of metals, especially copper wire. If it must be left on site, spray paint it black, stack it where it is difficult to load, use case hardened chain to secure it, and surround it with heavy objects.
• If copper or aluminum has been recently installed, consider hiring a guard service.
8
• Park heavy equipment camp wagon style heel to toe, with generators and compressors inside the circle.
• Post “No Trespassing” signs.
• Remove valuable items from the job trailer. Lock down computers and back-up information on disks. Store disks away from the site.
• Consider having someone stay on site over long weekends.
• Remember: begin planning on the Tuesday prior to a long weekend. Give specific tasks to employees and expect the site to be secured by mid-day Friday.
Sophisticated Scams
Several contractors have fallen victim to costly scams. Unauthorized people, claiming to
be employed by the company order several thousand dollars of construction materials.
Acting as though nothing is unusual, they arrange a pick-up and when asked to sign for it,
they use a fictitious name. Take the following steps to protect the company:
• Check invoices to make sure all charges are authorized.
• Establish clear policies about making purchases. Specific employees should be authorized to make purchases and the vendors should know who is authorized to make purchases for the company. Ask vendors to require identification for all company purchases.
• When a vendor has a question about the authorization of a purchase, there should be a specific person for them to call for approval.
• Purchase order books or forms should not be carried in vehicles. They are too easy for would-be thieves to steal or see, using the correct numbering sequence.
• Remember: a loose purchase tracking system can potentially cost a firm thousands of dollars annually. Maintain an intact control system (Associated General Contractors of Washington. 2002).
An added factor that should be investigated is to identify the culprits involved in
incidents of theft and vandalism. It is important for contractors to recognize that
construction sites are a natural point of curiosity. Passers-by always want to see what is
9
being built and if it will be something of interest to them. A typical construction site
turns into a “ghost town” after 4 or 5 p.m. and this leaves it very vulnerable to theft and
vandalism (Gardner 2003). Research has shown that the majority of theft and vandalism
incidents are not done by strangers, but rather by individuals familiar with the jobsite.
Many police statistics indicate that all too often equipment theft is an inside job.
The AGC of California states that 85% of jobsite theft is employee related (Moorhouse).
This may be due to the fact that many construction workers employed on construction
sites are employed for a short-term, but long enough to gain knowledge of company
procedures. Since mobile equipment keys and locks are of a common design, equipment
becomes an easy or "soft target" that is ripe for theft (Vista Training, Inc., 2003). To help
combat potential problems it is recommended that contractors perform background
checks on all workers allowed on the site, including employees of subcontractors. These
checks include the following suggestions recommended by the Eugene, Oregon Police
Department:
• Post and enforce a zero tolerance policy for drugs and alcohol.
• Develop a positive relationship with all company employees. This will help reduce any sense of “entitlement”.
• Develop a positive relationship with neighboring businesses and residents. They can be the eyes and ears of the company during non-work hours.
• Inform the neighbors about who is authorized on the site and at what times they should expect people to be there.
• Communicate with other contractors in the area regarding theft problems.
• Encourage employees to communicate with each other about threats against the firm and other suspicious activities.
• Security guards can be effective on weekends and at night (Lumberman’s of Washington, Inc. 2000).
10
Rationalization is one of the leading factors of theft on a job site. Some
employees may think “The contractor leaves all these tools and equipment unprotected,
because they are so rich. Obviously they don’t care. Besides, I need a new drill at
home.” The result is a theft (Moorhouse).
Theft and vandalism can also be linked to how an employee is treated.
Terminations alone account for many of the causes of vandalism that have been
prosecuted. After a difficult termination, a job site should be made extra secure through
the use of additional security and possibly the changing of locks (Moorhouse).
Organized crime associated with the theft of construction equipment is another
major problem. Construction equipment thieves are generally a sophisticated group that
not only has a ready-made market, but that also knows which pieces of equipment are
most in demand and lucrative on the black market (Middleton 1999). Four types of
equipment account for 70 percent of equipment thefts, according to LoJack Corp.,
Westwood, Mass. Backhoes are the top targets for professional thieves, followed by air
compressors, skid-steer loaders and generators, based on LoJack’s recovery experiences
between January and June 2001. The company tracked the top recoveries by type:
backhoes 22 percent; air compressors and skid-steers each 17 percent; generators 14
percent; forklifts, light towers and trucks each 5 percent; trailers, graders, loaders and
excavators, each 3 percent (McDowall, 2002). Research indicates that a large percentage
of stolen equipment remains within about 100 miles of the theft location. A lucrative
market also exists in underdeveloped countries around the world, and once stolen
equipment is aboard a ship or across a border, recovery of the equipment is nearly
impossible (VISTA Training, Inc., 2003). Another finding showed that recent models
11
are stolen more often than older equipment with almost 75 percent of the recoveries being
no more than three years old (McDowall, 2002).
Typically, thieves will not attempt a theft from a jobsite if they cannot enter, load
the products and be away within 5 or 10 minutes (Bonesteel 1997). Most thefts are
performed by groups of persons that “canvass” jobs by day to see what equipment is
available and what hours the contractor works. During the contractor’s off hours, thieves
will sometimes pose as the contractor and call a rental firm to arrange for equipment to be
immediately moved to another location after hours, where the equipment can be stolen
with little difficulty (Krizan, 1987). Since construction theft is often carried out by
organized crime rings, tracking one piece of stolen equipment often leads to the discovery
of a larger theft operation (McDowall, 2002).
Another problem is that some contractors want manufacturers to provide them
with universal ignition keys covering a particular product line so as not to waste time
while operators try to locate the correct keys during the day. This exposes many large
pieces of construction equipment to theft due to the relative ease that one can obtain the
keys to start the equipment and drive it off of the jobsite (Bonesteel, 1997).
To combat equipment theft Liberty Mutual Insurance’s Loss Prevention
Department recommends scratching an identifying mark into equipment (spray paint and
initials on a piece of equipment does not qualify as being “positively” identified). It also
suggests asking for identification from drivers before equipment is loaded onto trailers,
and removing keys and securing the jobsite at the end of the day (Middleton 1987). One
should also immobilize equipment when it is not in use; this can be done by removing
rotors, lowering blades and buckets, and disabling batteries and electric starting systems
12
(Bonesteel 1997). If immobilization is not possible then equipment should be parked in a
“wagon train” formation, using larger equipment to protect small equipment (Bonesteel
1997). Using backhoes and front-end loaders to block trailer entrances can also help
protect equipment on site.
A recent form of theft that has been on the rise is the occurrence of office
equipment theft from jobsite offices. Popular equipment that has attracted thieves
includes fax machines, computers, copiers, and telephones. It is recommended that a
company should try to position the site or trailer office in an area with limited access to
the opportunist thief, yet highly visible to the public. Expensive pieces of office
equipment should be well-marked with indelible markings (Insurance Journal, 2001).
Valuable business information such as payroll figures, work schedules and future
ventures, or anything that could undermine a company’s strategy if it was lost or put in
the hands of rivals should also be recognized as a potential target and protected
accordingly (Neighborhoodwatch.Net, 1992).
One of the most important factors that is rarely taken into account when dealing
with theft on a construction project is the reporting of any incident that involves the theft
of heavy equipment or materials. It is beneficial to everyone involved, as well as
potential future victims, when local law enforcement is made aware of the occurrence of
theft or vandalism. This will enable law enforcement to be able to work at assisting the
contractor in locating the stolen equipment.
When reporting an incident, one should include as much detail as possible;
including year, make, model, serial numbers, company identification (e.g. logos, decals,
internal numbers, unique paint), and any attachments or customized features to assist the
13
authorities in trying to locate a piece of stolen equipment (Bonestel 1997). If a firm feels
that someone is offering to sell property that could be stolen, then one is encouraged to
call authorities. In the event that a suspect is apprehended, police encourage those
victimized to prosecute to the fullest extent of the law to discourage any future thefts.
The reporting of theft and vandalism is of utmost importance. The steps that are taken
can make the difference between solving a crime and no solution at all (Bonesteel, 1997).
A construction site will never be able to claim that it is theft or vandal proof, but
commercial contractors can make it difficult for professional thieves and vandals to cause
large amounts of damage. The review of literature has provided evidence that becoming
proactive in securing a jobsite will result in crime becoming a minor nuisance instead of a
major problem that has the potential of draining profits from an otherwise successful
project.
CHAPTER 3 RESEARCH METHODOLOGY
Based on the various references in the literature, it is clear that losses from theft
and vandalism can be substantial. The objective of this research was to more accurately
define the magnitude of these losses and to gather information on effective techniques
being employed to curtail or reduce these losses. This type of information is not readily
available from any known source, so it was decided that this information could better be
acquired directly from the construction community. In order to obtain this information
from a large number of contractors, it was determined that a mailed survey questionnaire
was the most effective means of obtaining the quantity and type of information needed to
fulfill the goals of this research.
The literature on jobsite security was used as a primary resource for developing
an appropriate questionnaire (see appendix A) that was used to conduct this research.
The literature that was reviewed dealt specifically with theft and vandalism incidents and
prevention techniques on commercial construction job-sites. The literature review was
the initial source of information used to develop the questionnaire. Refinements were
then made to the questionnaire and these modifications were based on the results of an
unpublished research report (pilot study) prepared by Dr. Jimmie Hinze of the M.E.
Rinker, Sr. School of Building Construction at the University of Florida. In addition, this
questionnaire evolved at the same time that another study was being developed on theft
and vandalism in the area of residential construction. The final version of the
14
15
questionnaire resulted after several iterations of revisions, with each iteration improving
the survey clarity and ease of understanding.
The final version of the questionnaire was submitted to the University of Florida
Institutional Review Board for approval on May 26, 2003. The form was approved on
June 2, 2003 with minor changes required to be made to the cover letter. After these
changes were made, the cover letter and questionnaire were mailed to approximately
1200 commercial contractors. The list of contractors was obtained from the M.E. Rinker,
Sr. School of Building Construction at the University of Florida. The list included 800 to
900 contractors who were located in the southeast with the majority of these being in the
state of Florida. These contractors had had some type of communication with the Rinker
School in recent years, primarily for the purpose of recruitment for the firm.
In administering the survey, employees of the targeted companies were asked to
fill out the survey to the best of there ability and to return it through an enclosed postage
paid envelope. No names or identification were asked to be provided on the
questionnaire unless the respondent wanted to receive a summary report. Sixty surveys
were returned due to bad addresses or which were undeliverable for some reason. From a
statistical perspective, 30 samples would have been adequate to generate conclusions of
the population. A total of 100 surveys were completed and returned. The data gathered
from these 100 surveys were entered into the SPSS statistical analysis software during the
week of June 23, 2003 to June 27, 2003 with the primary focus being to identify specific
factors that are associated with theft and vandalism on commercial construction sites.
Findings were considered to be statistically significant if the level of significance (p) was

16
less than or equal to 0.10. All findings of interest are reported, but specific notations will
be made when a particular finding is not statistically significant.
CHAPTER 4 RESULTS
One hundred questionnaires were completed and returned. The data, excluding
all open-ended questions, were analyzed by calculating the frequencies of responses for
all of the questions which required specific responses. The next pages provide
information on these frequencies. The results include a discussion of specific
experiences that respondents had with theft and vandalism on their construction sites.
Since all respondents did not answer every question, some frequencies are presented on
the responses given.
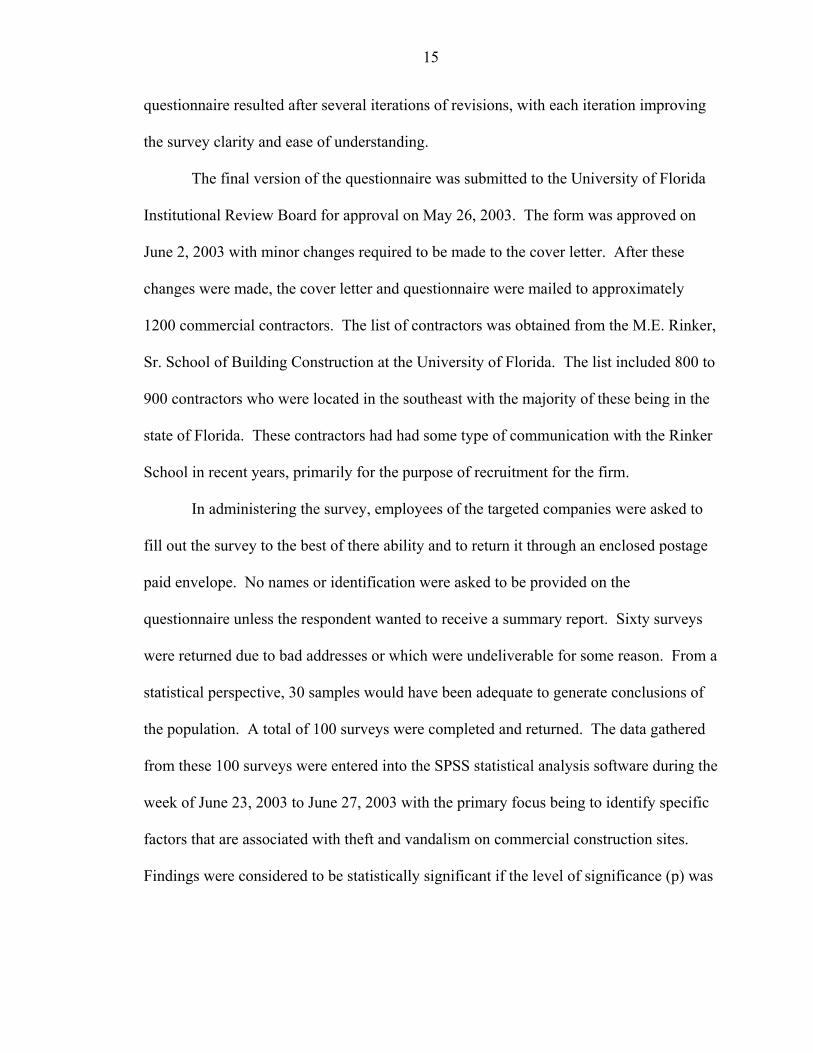
The 100 companies that responded were classified into two categories for further
statistical analysis, namely ‘small to medium’ sized companies with less than $100
million annual volume of work performed and ‘large’ companies with over $100 million
annual volume of work performed (Figure 4-1).
65
35
0
10
20
30
40
50
60
70
Number of Replies
$0.4 - $100 > $100
Annual Volume of Work (In Millions)
Figure 4-1 Annual dollar volume of work performed (n=100)
17
18
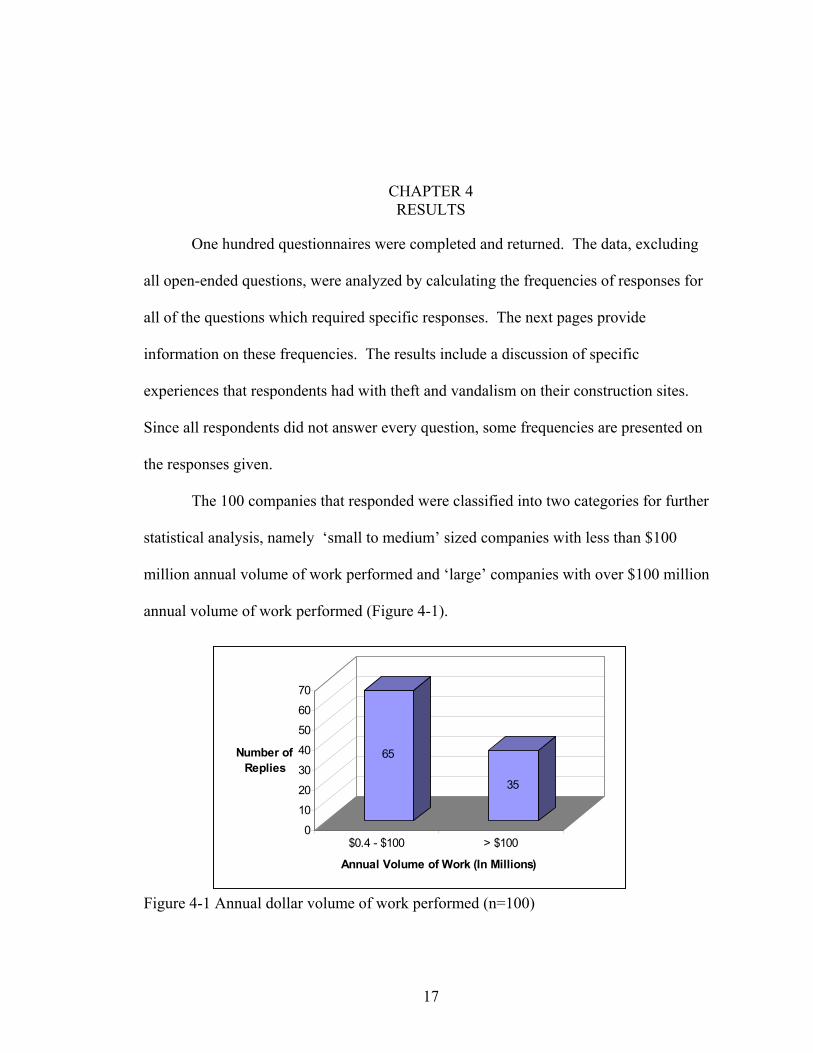
Respondents were grouped according to the type of firm, namely general
contractor, subcontractor, or vendor/supplier. Of the respondents who gave this
information, most were general contractors; twelve worked as subcontractors, and one
was a vendor/supplier (see Figure 4-2). In general, the responses reflect the experiences
of general contractors, the target population of this study.
87
1210
102030405060708090
Number of Replies
GeneralContractor
Subcontractor Vendor/Supplier
How is the Firm Best Desbribed
Figure 4-2 Type of respondent firm (n=100)
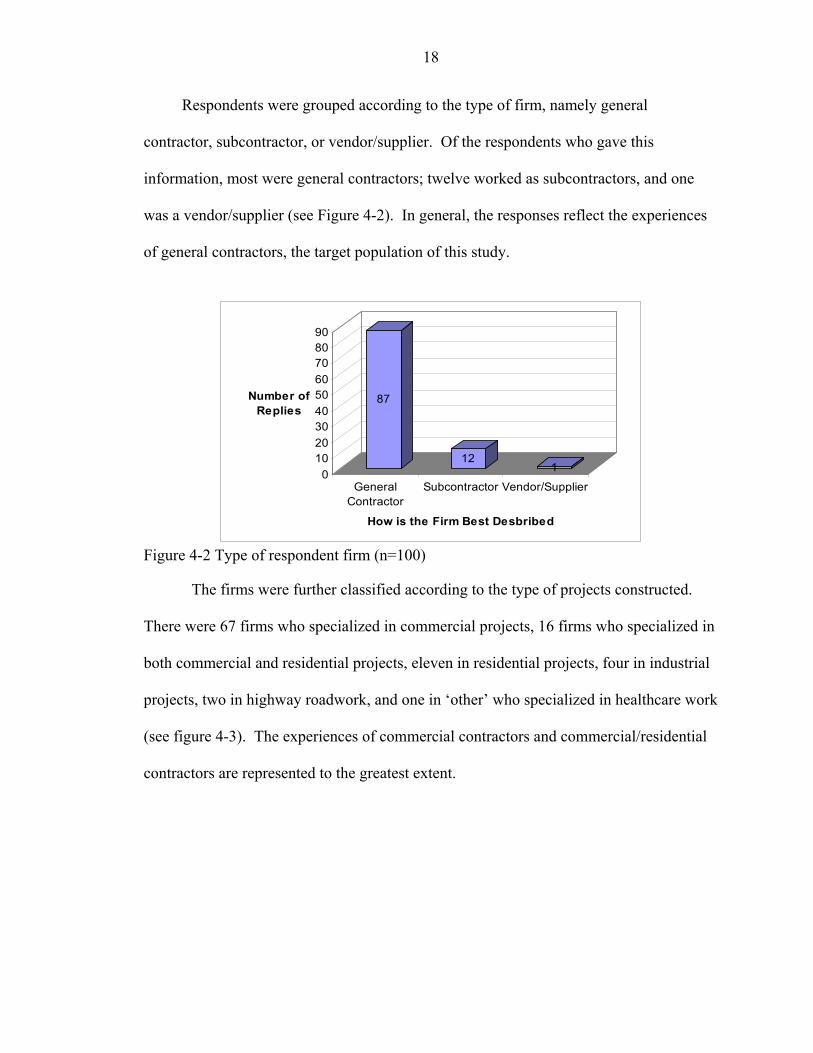
The firms were further classified according to the type of projects constructed.
There were 67 firms who specialized in commercial projects, 16 firms who specialized in
both commercial and residential projects, eleven in residential projects, four in industrial
projects, two in highway roadwork, and one in ‘other’ who specialized in healthcare work
(see figure 4-3). The experiences of commercial contractors and commercial/residential
contractors are represented to the greatest extent.
19
Commercial 67%
Commercial/ Residential 16%
Residential 11%
Industrial 4%
Highway/ Roadwork 2%
Other 1%
Figure 4-3 Type of projects undertaken (n=100)
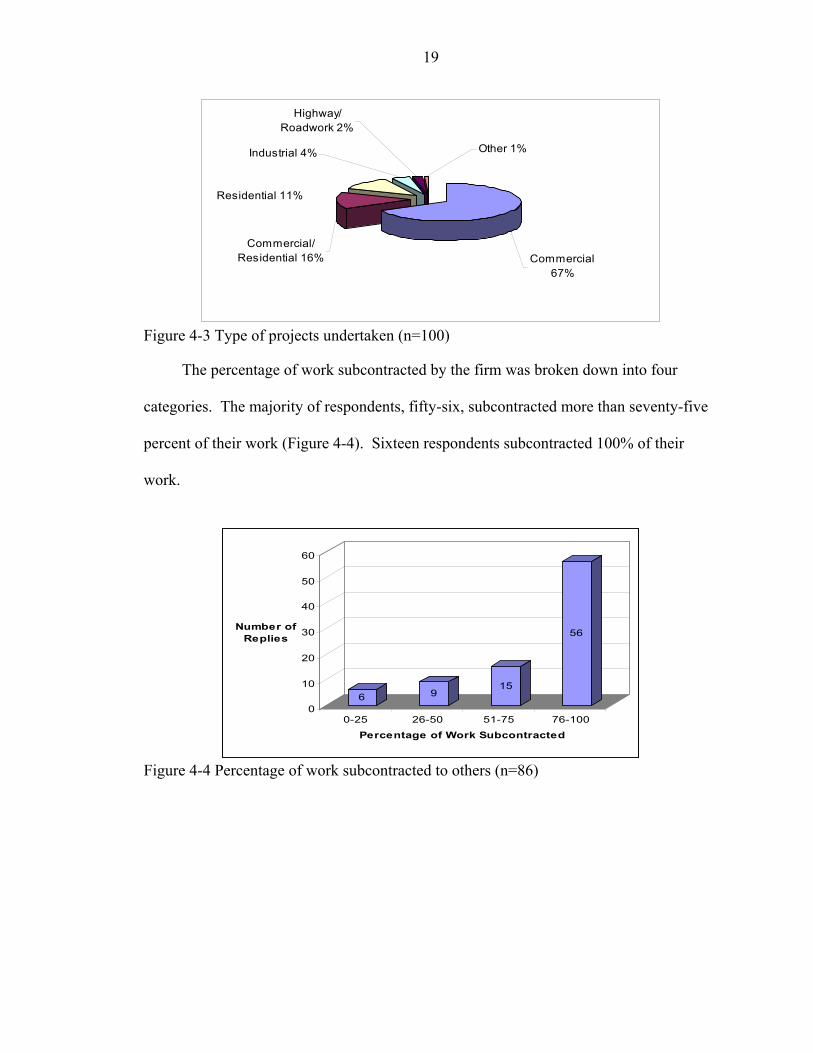
The percentage of work subcontracted by the firm was broken down into four
categories. The majority of respondents, fifty-six, subcontracted more than seventy-five
percent of their work (Figure 4-4). Sixteen respondents subcontracted 100% of their
work.
6 915
56
0
10
20
30
40
50
60
Number of Replies
0-25 26-50 51-75 76-100
Percentage of Work Subcontracted
Figure 4-4 Percentage of work subcontracted to others (n=86)
20
THEFT
The following paragraphs present information obtained that pertains specifically
to jobsite theft. A variety of types of theft information are presented along with a number
of approaches used to curtail these types of theft incidents.
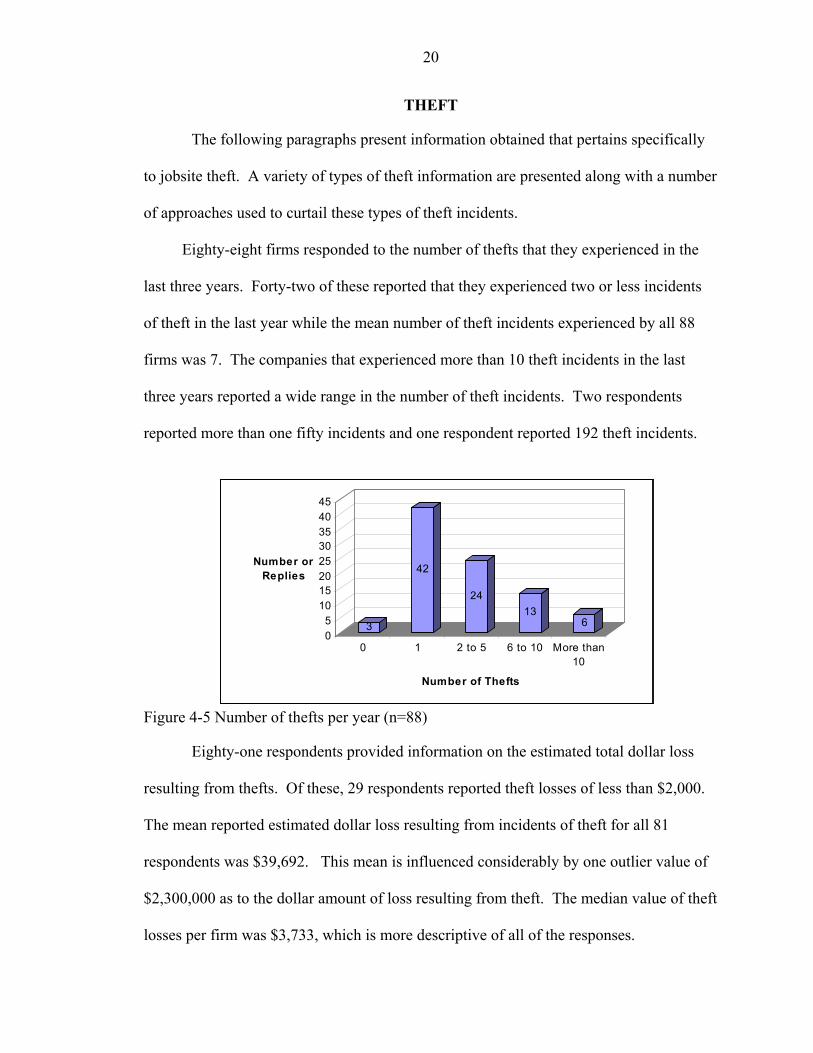
Eighty-eight firms responded to the number of thefts that they experienced in the
last three years. Forty-two of these reported that they experienced two or less incidents
of theft in the last year while the mean number of theft incidents experienced by all 88
firms was 7. The companies that experienced more than 10 theft incidents in the last
three years reported a wide range in the number of theft incidents. Two respondents
reported more than one fifty incidents and one respondent reported 192 theft incidents.
3
42
2413
605
1015202530354045
Number or Replies
0 1 2 to 5 6 to 10 More than10
Number of Thefts
Figure 4-5 Number of thefts per year (n=88)
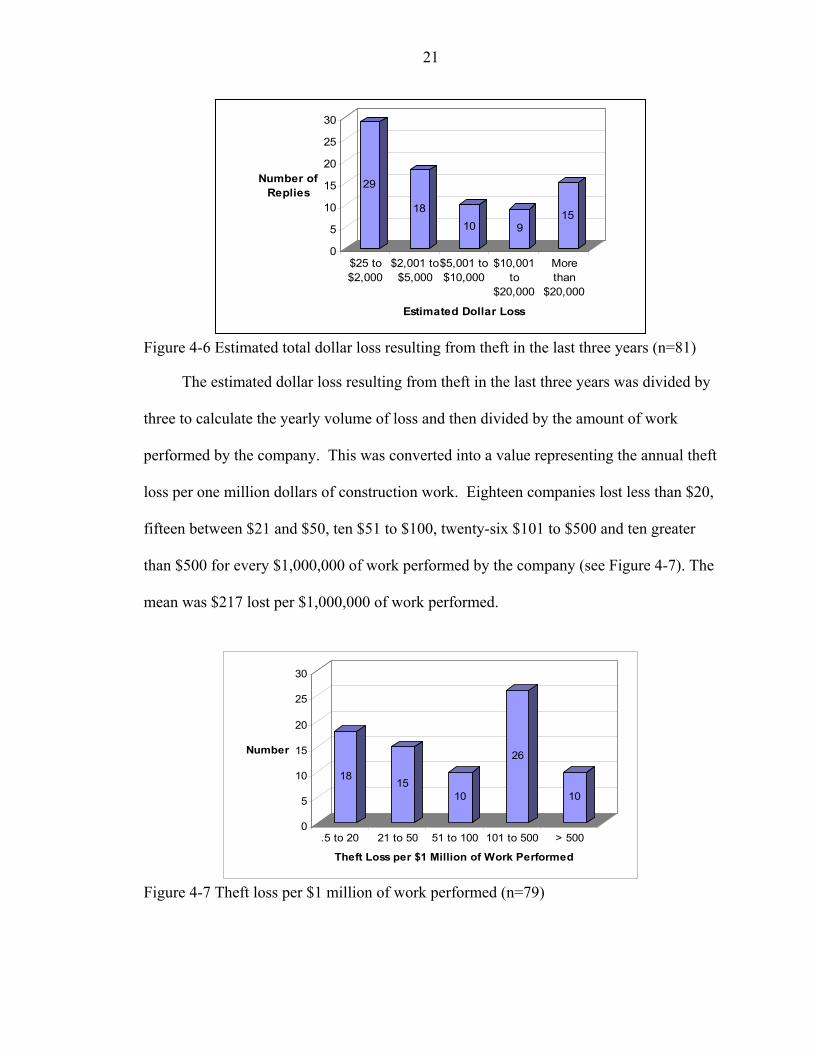
Eighty-one respondents provided information on the estimated total dollar loss
resulting from thefts. Of these, 29 respondents reported theft losses of less than $2,000.
The mean reported estimated dollar loss resulting from incidents of theft for all 81
respondents was $39,692. This mean is influenced considerably by one outlier value of
$2,300,000 as to the dollar amount of loss resulting from theft. The median value of theft
losses per firm was $3,733, which is more descriptive of all of the responses.
21
29
1810 9
15
0
5
10
15
20
25
30
Number of Replies
$25 to$2,000
$2,001 to$5,000
$5,001 to$10,000
$10,001to
$20,000
Morethan
$20,000
Estimated Dollar Loss
Figure 4-6 Estimated total dollar loss resulting from theft in the last three years (n=81)
The estimated dollar loss resulting from theft in the last three years was divided by
three to calculate the yearly volume of loss and then divided by the amount of work
performed by the company. This was converted into a value representing the annual theft
loss per one million dollars of construction work. Eighteen companies lost less than $20,
fifteen between $21 and $50, ten $51 to $100, twenty-six $101 to $500 and ten greater
than $500 for every $1,000,000 of work performed by the company (see Figure 4-7). The
mean was $217 lost per $1,000,000 of work performed.
1815
10
26
10
0
5
10
15
20
25
30
Number
.5 to 20 21 to 50 51 to 100 101 to 500 > 500
Theft Loss per $1 Million of Work Performed
Figure 4-7 Theft loss per $1 million of work performed (n=79)
22
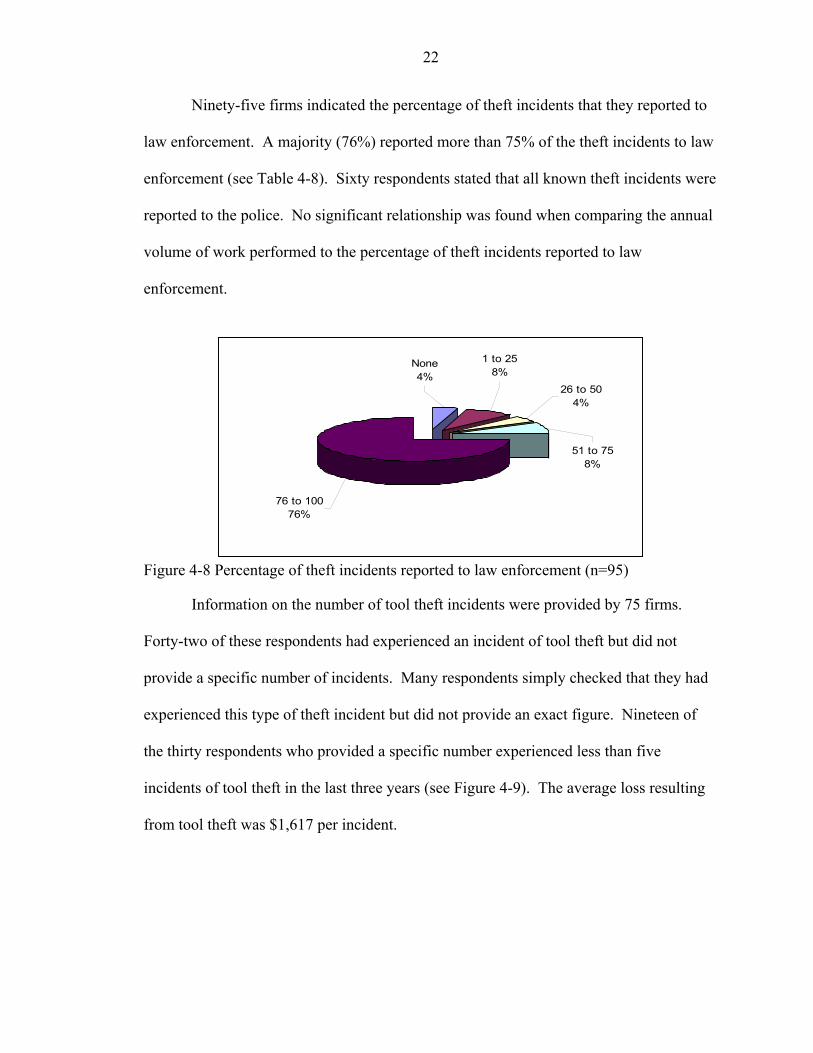
Ninety-five firms indicated the percentage of theft incidents that they reported to
law enforcement. A majority (76%) reported more than 75% of the theft incidents to law
enforcement (see Table 4-8). Sixty respondents stated that all known theft incidents were
reported to the police. No significant relationship was found when comparing the annual
volume of work performed to the percentage of theft incidents reported to law
enforcement.
51 to 758%
26 to 504%
1 to 258%
None4%
76 to 10076%
Figure 4-8 Percentage of theft incidents reported to law enforcement (n=95)
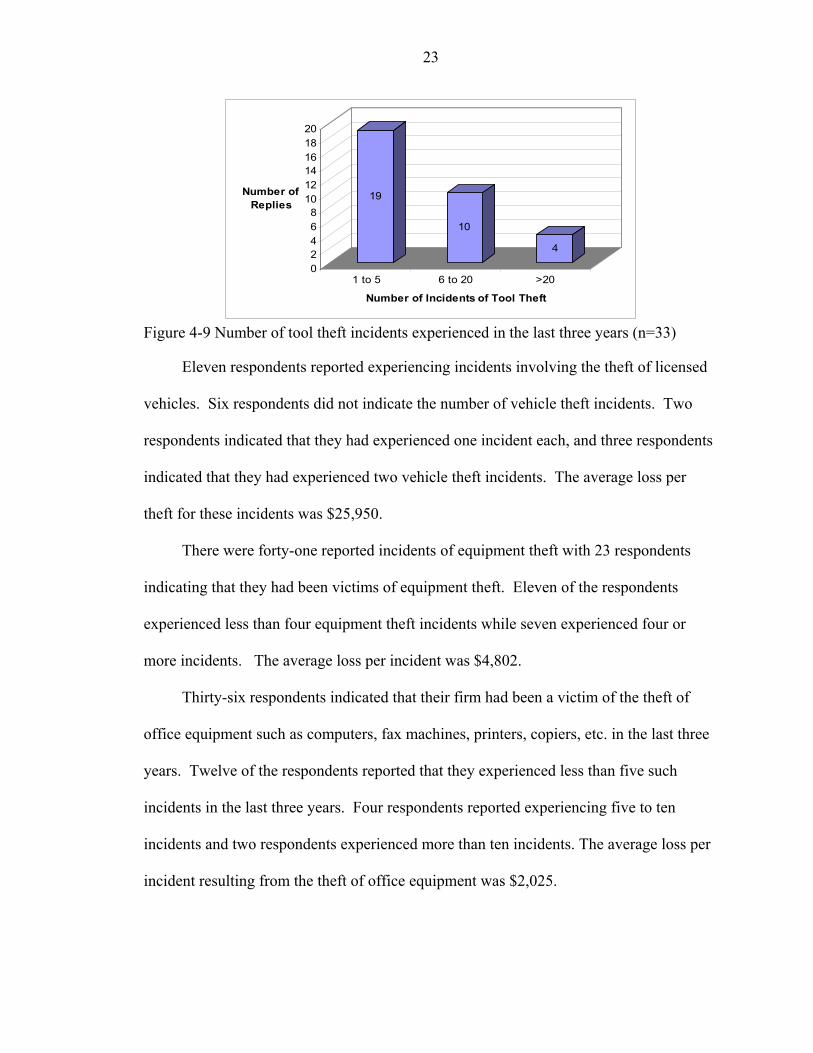
Information on the number of tool theft incidents were provided by 75 firms.
Forty-two of these respondents had experienced an incident of tool theft but did not
provide a specific number of incidents. Many respondents simply checked that they had
experienced this type of theft incident but did not provide an exact figure. Nineteen of
the thirty respondents who provided a specific number experienced less than five
incidents of tool theft in the last three years (see Figure 4-9). The average loss resulting
from tool theft was $1,617 per incident.
23
19
10
4
02468
101214161820
Number of Replies
1 to 5 6 to 20 >20
Number of Incidents of Tool Theft
Figure 4-9 Number of tool theft incidents experienced in the last three years (n=33)
Eleven respondents reported experiencing incidents involving the theft of licensed
vehicles. Six respondents did not indicate the number of vehicle theft incidents. Two
respondents indicated that they had experienced one incident each, and three respondents
indicated that they had experienced two vehicle theft incidents. The average loss per
theft for these incidents was $25,950.
There were forty-one reported incidents of equipment theft with 23 respondents
indicating that they had been victims of equipment theft. Eleven of the respondents
experienced less than four equipment theft incidents while seven experienced four or
more incidents. The average loss per incident was $4,802.
Thirty-six respondents indicated that their firm had been a victim of the theft of
office equipment such as computers, fax machines, printers, copiers, etc. in the last three
years. Twelve of the respondents reported that they experienced less than five such
incidents in the last three years. Four respondents reported experiencing five to ten
incidents and two respondents experienced more than ten incidents. The average loss per
incident resulting from the theft of office equipment was $2,025.
24
Forty-seven respondents indicated that they had experienced an incident of the theft
of construction materials in the last three years. Twenty-one of these provided a specific
figure as to the number of construction material theft incidents experienced in the last
three years. Eleven of these respondents experienced less than five incidents with six
experiencing five to twenty-five and four experiencing more than twenty-five. The
average loss for each incident of the theft of office equipment was $3,586.
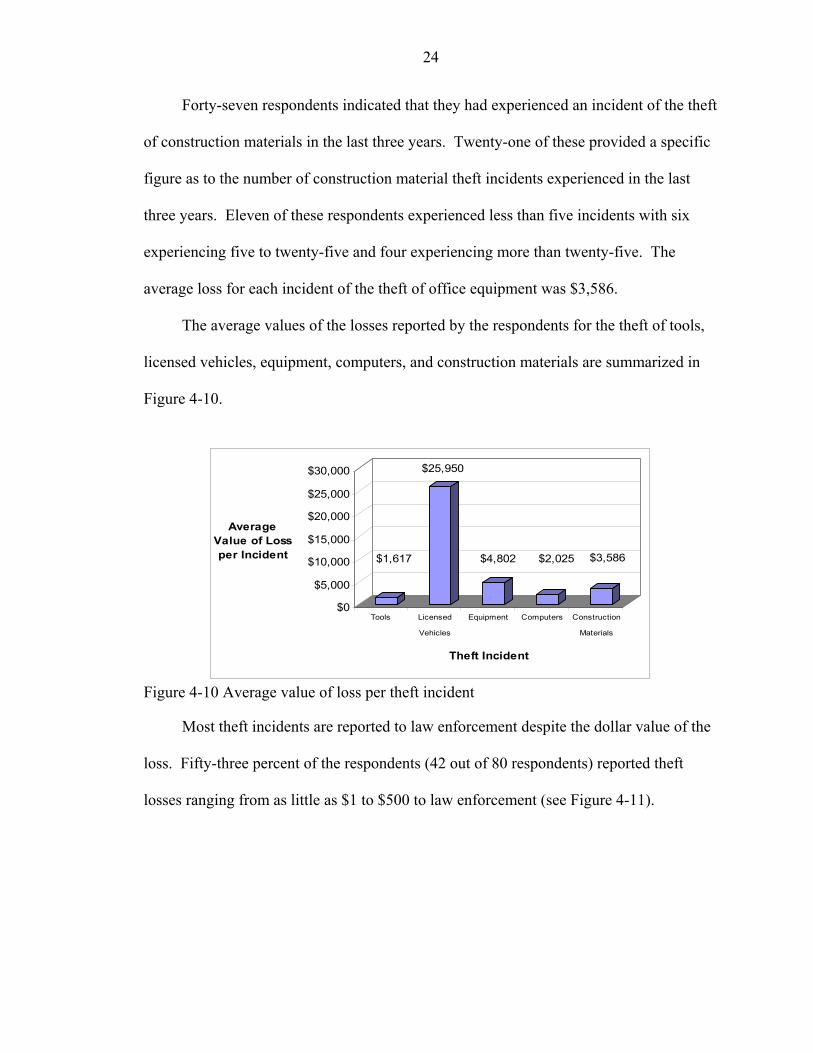
The average values of the losses reported by the respondents for the theft of tools,
licensed vehicles, equipment, computers, and construction materials are summarized in
Figure 4-10.
$1,617
$25,950
$4,802 $2,025 $3,586
$0
$5,000
$10,000
$15,000
$20,000
$25,000
$30,000
Average Value of Loss per Incident
Tools Licensed
Vehicles
Equipment Computers Construction
Materials
Theft Incident
Figure 4-10 Average value of loss per theft incident
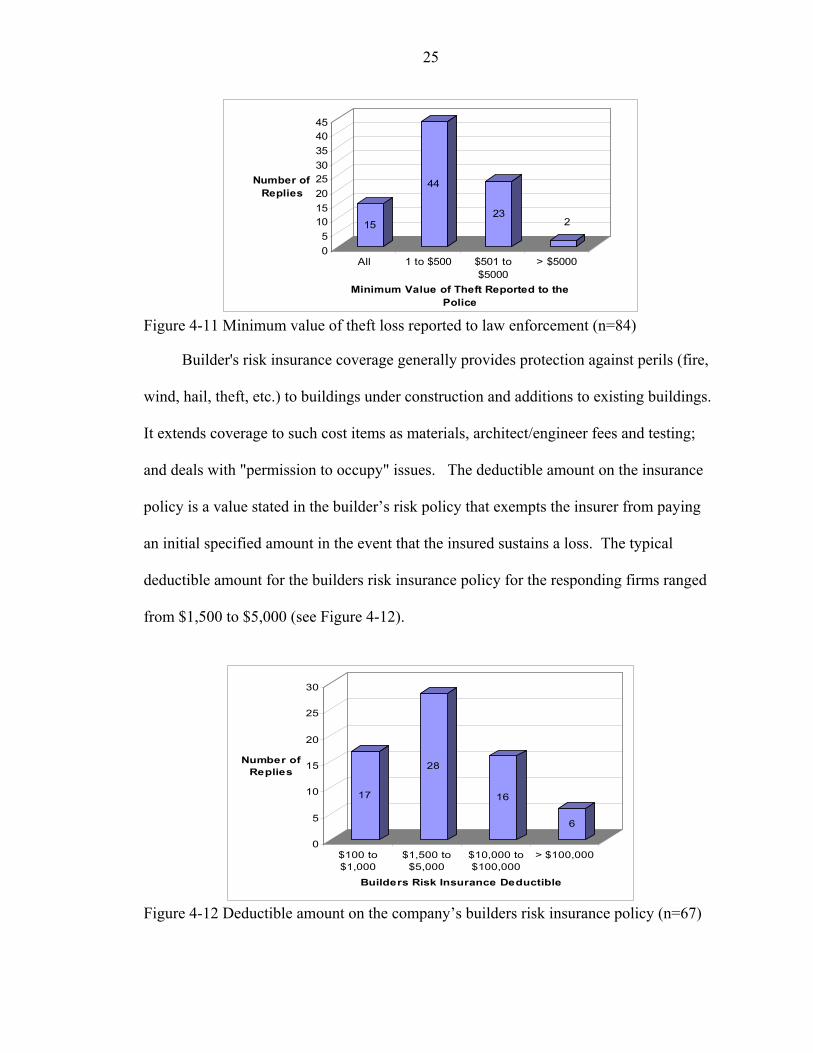
Most theft incidents are reported to law enforcement despite the dollar value of the
loss. Fifty-three percent of the respondents (42 out of 80 respondents) reported theft
losses ranging from as little as $1 to $500 to law enforcement (see Figure 4-11).
25
15
44
232
05
1015202530354045
Number of Replies
All 1 to $500 $501 to$5000
> $5000
Minimum Value of Theft Reported to the Police
Figure 4-11 Minimum value of theft loss reported to law enforcement (n=84)
Builder's risk insurance coverage generally provides protection against perils (fire,
wind, hail, theft, etc.) to buildings under construction and additions to existing buildings.
It extends coverage to such cost items as materials, architect/engineer fees and testing;
and deals with "permission to occupy" issues. The deductible amount on the insurance
policy is a value stated in the builder’s risk policy that exempts the insurer from paying
an initial specified amount in the event that the insured sustains a loss. The typical
deductible amount for the builders risk insurance policy for the responding firms ranged
from $1,500 to $5,000 (see Figure 4-12).
17
28
16
6
0
5
10
15
20
25
30
Number of Replies
$100 to$1,000
$1,500 to$5,000
$10,000 to$100,000
> $100,000
Builders Risk Insurance Deductible
Figure 4-12 Deductible amount on the company’s builders risk insurance policy (n=67)
26
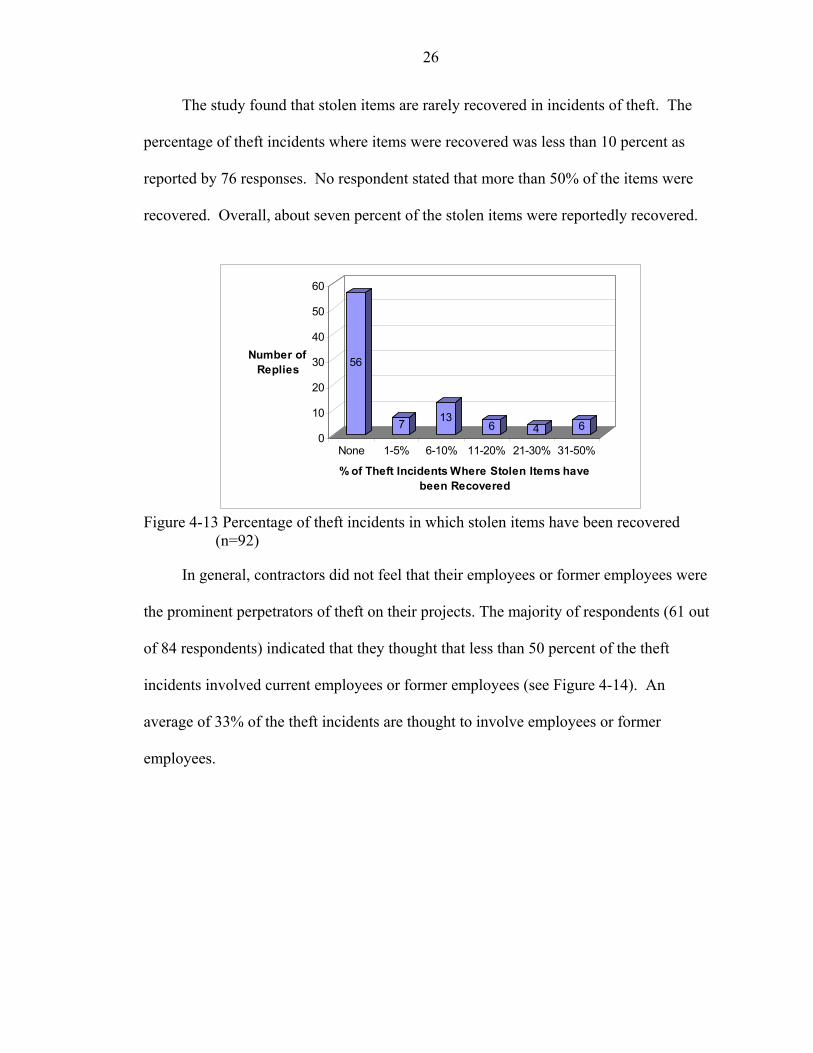
The study found that stolen items are rarely recovered in incidents of theft. The
percentage of theft incidents where items were recovered was less than 10 percent as
reported by 76 responses. No respondent stated that more than 50% of the items were
recovered. Overall, about seven percent of the stolen items were reportedly recovered.
56
7 136 4 6
0
10
20
30
40
50
60
Number of Replies
None 1-5% 6-10% 11-20% 21-30% 31-50%
% of Theft Incidents Where Stolen Items have been Recovered
Figure 4-13 Percentage of theft incidents in which stolen items have been recovered
(n=92)
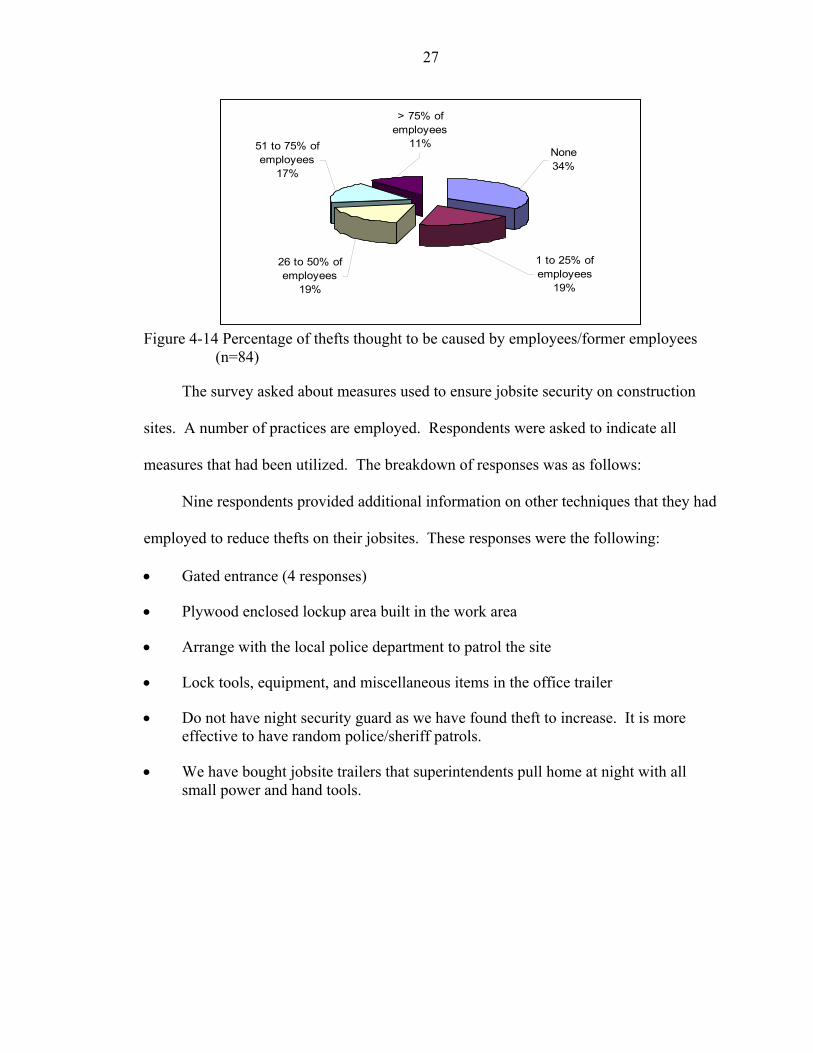
In general, contractors did not feel that their employees or former employees were
the prominent perpetrators of theft on their projects. The majority of respondents (61 out
of 84 respondents) indicated that they thought that less than 50 percent of the theft
incidents involved current employees or former employees (see Figure 4-14). An
average of 33% of the theft incidents are thought to involve employees or former
employees.
27
51 to 75% of employees
17%
> 75% of employees
11%
26 to 50% of employees
19%
1 to 25% of employees
19%
None34%
Figure 4-14 Percentage of thefts thought to be caused by employees/former employees
(n=84)
The survey asked about measures used to ensure jobsite security on construction
sites. A number of practices are employed. Respondents were asked to indicate all
measures that had been utilized. The breakdown of responses was as follows:
Nine respondents provided additional information on other techniques that they had
employed to reduce thefts on their jobsites. These responses were the following:
• Gated entrance (4 responses)
• Plywood enclosed lockup area built in the work area
• Arrange with the local police department to patrol the site
• Lock tools, equipment, and miscellaneous items in the office trailer
• Do not have night security guard as we have found theft to increase. It is more effective to have random police/sheriff patrols.
• We have bought jobsite trailers that superintendents pull home at night with all small power and hand tools.
28
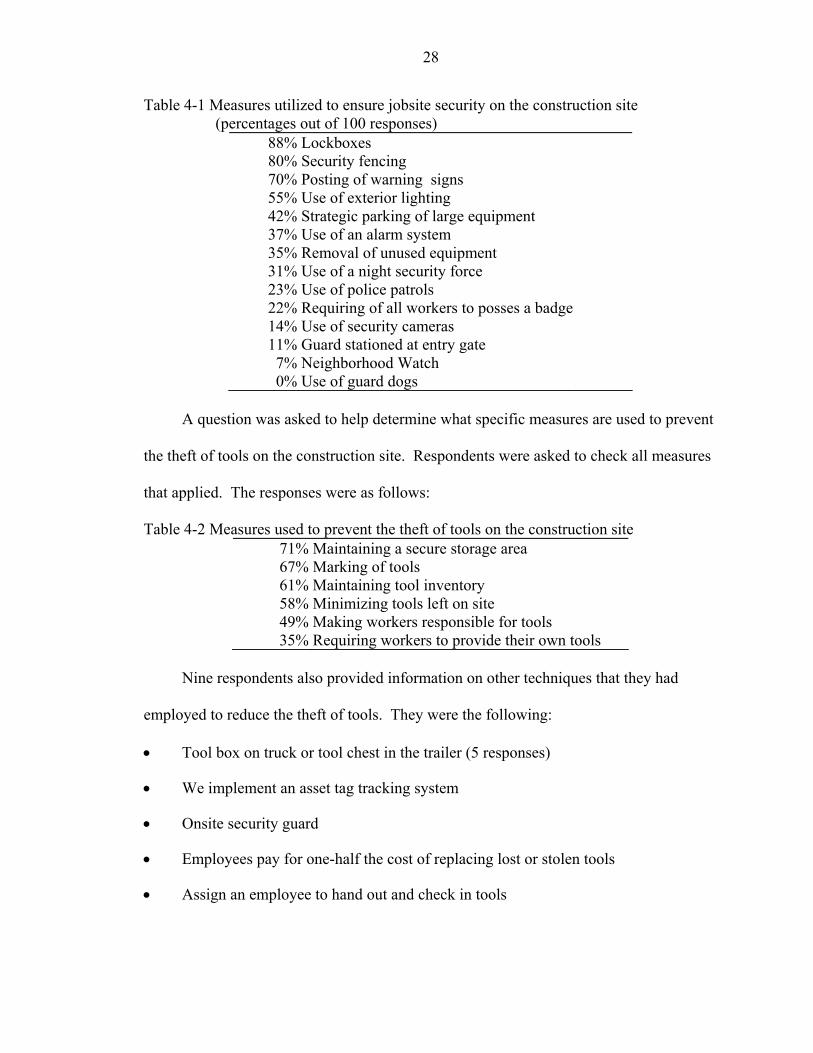
Table 4-1 Measures utilized to ensure jobsite security on the construction site (percentages out of 100 responses)
88% Lockboxes 80% Security fencing 70% Posting of warning signs 55% Use of exterior lighting 42% Strategic parking of large equipment 37% Use of an alarm system 35% Removal of unused equipment 31% Use of a night security force 23% Use of police patrols 22% Requiring of all workers to posses a badge 14% Use of security cameras 11% Guard stationed at entry gate 7% Neighborhood Watch 0% Use of guard dogs
A question was asked to help determine what specific measures are used to prevent
the theft of tools on the construction site. Respondents were asked to check all measures
that applied. The responses were as follows:
Table 4-2 Measures used to prevent the theft of tools on the construction site 71% Maintaining a secure storage area 67% Marking of tools 61% Maintaining tool inventory 58% Minimizing tools left on site 49% Making workers responsible for tools 35% Requiring workers to provide their own tools
Nine respondents also provided information on other techniques that they had
employed to reduce the theft of tools. They were the following:
• Tool box on truck or tool chest in the trailer (5 responses)
• We implement an asset tag tracking system
• Onsite security guard
• Employees pay for one-half the cost of replacing lost or stolen tools
• Assign an employee to hand out and check in tools
29
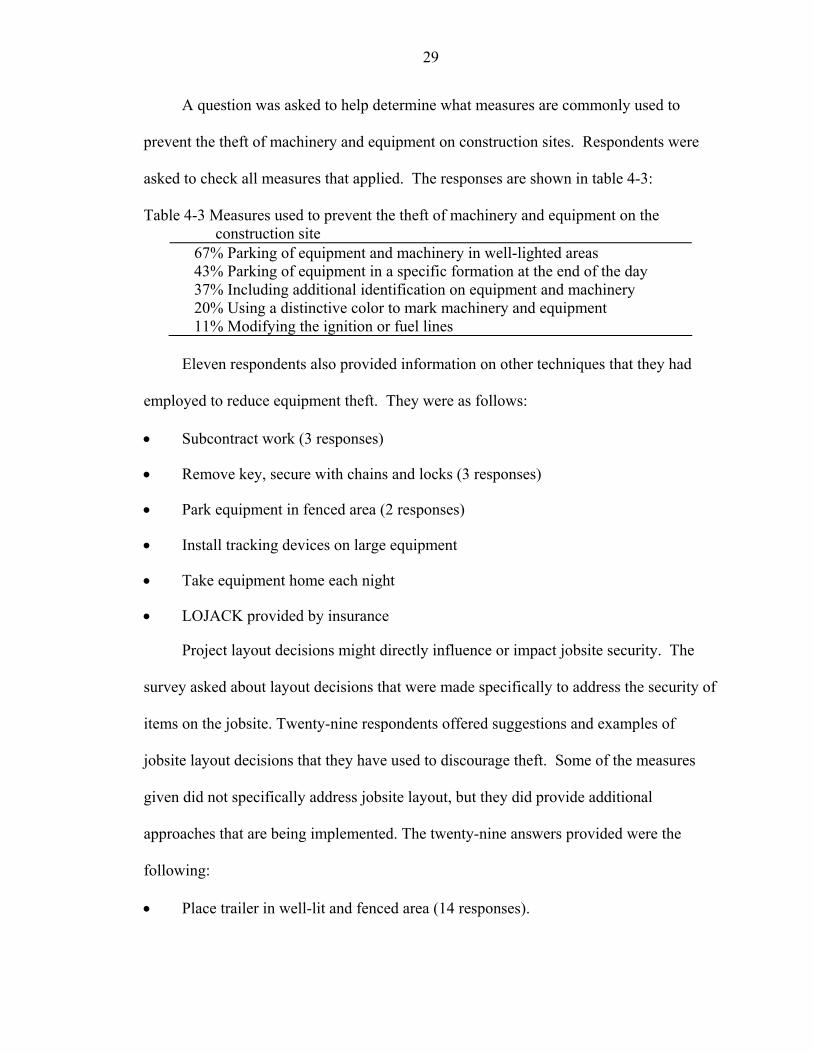
A question was asked to help determine what measures are commonly used to
prevent the theft of machinery and equipment on construction sites. Respondents were
asked to check all measures that applied. The responses are shown in table 4-3:
Table 4-3 Measures used to prevent the theft of machinery and equipment on the construction site
67% Parking of equipment and machinery in well-lighted areas 43% Parking of equipment in a specific formation at the end of the day 37% Including additional identification on equipment and machinery 20% Using a distinctive color to mark machinery and equipment 11% Modifying the ignition or fuel lines
Eleven respondents also provided information on other techniques that they had
employed to reduce equipment theft. They were as follows:
• Subcontract work (3 responses)
• Remove key, secure with chains and locks (3 responses)
• Park equipment in fenced area (2 responses)
• Install tracking devices on large equipment
• Take equipment home each night
• LOJACK provided by insurance
Project layout decisions might directly influence or impact jobsite security. The
survey asked about layout decisions that were made specifically to address the security of
items on the jobsite. Twenty-nine respondents offered suggestions and examples of
jobsite layout decisions that they have used to discourage theft. Some of the measures
given did not specifically address jobsite layout, but they did provide additional
approaches that are being implemented. The twenty-nine answers provided were the
following:
• Place trailer in well-lit and fenced area (14 responses).
30
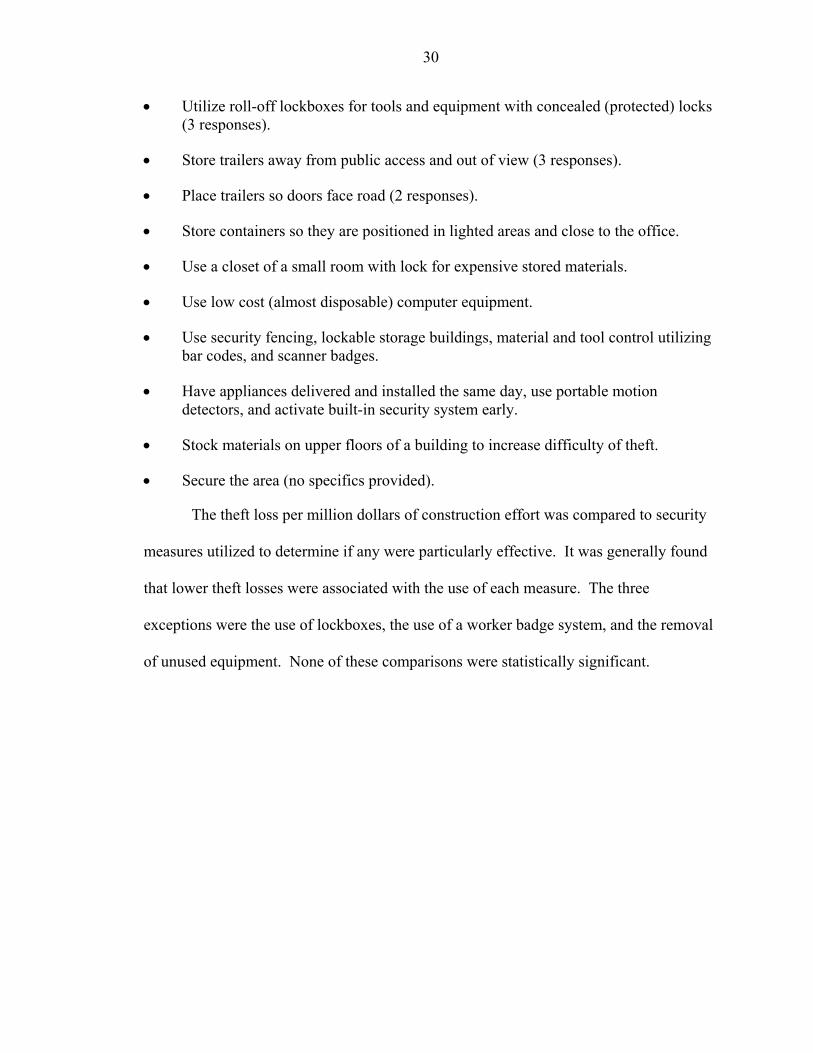
• Utilize roll-off lockboxes for tools and equipment with concealed (protected) locks (3 responses).
• Store trailers away from public access and out of view (3 responses).
• Place trailers so doors face road (2 responses).
• Store containers so they are positioned in lighted areas and close to the office.
• Use a closet of a small room with lock for expensive stored materials.
• Use low cost (almost disposable) computer equipment.
• Use security fencing, lockable storage buildings, material and tool control utilizing bar codes, and scanner badges.
• Have appliances delivered and installed the same day, use portable motion detectors, and activate built-in security system early.
• Stock materials on upper floors of a building to increase difficulty of theft.
• Secure the area (no specifics provided).
The theft loss per million dollars of construction effort was compared to security
measures utilized to determine if any were particularly effective. It was generally found
that lower theft losses were associated with the use of each measure. The three
exceptions were the use of lockboxes, the use of a worker badge system, and the removal
of unused equipment. None of these comparisons were statistically significant.
31
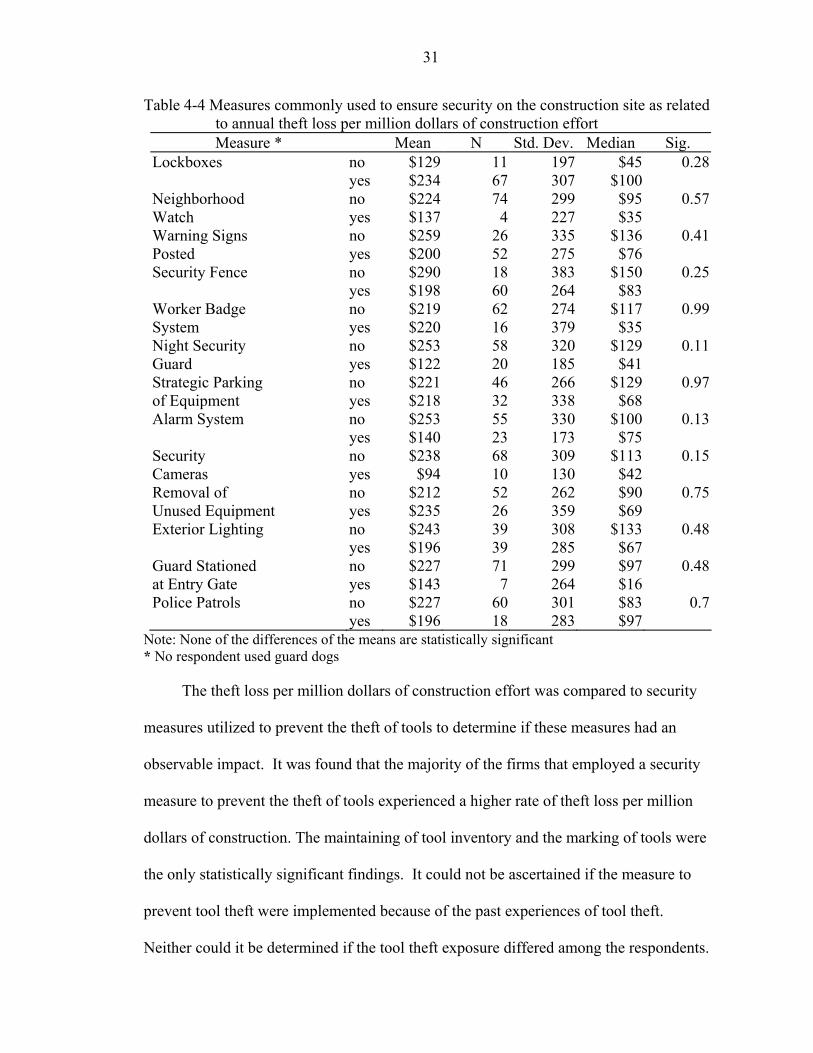
Table 4-4 Measures commonly used to ensure security on the construction site as related to annual theft loss per million dollars of construction effort Measure * Mean N Std. Dev. Median Sig.
Lockboxes no $129 11 197 $45 0.28 yes $234 67 307 $100 Neighborhood no $224 74 299 $95 0.57Watch yes $137 4 227 $35 Warning Signs no $259 26 335 $136 0.41Posted yes $200 52 275 $76 Security Fence no $290 18 383 $150 0.25 yes $198 60 264 $83 Worker Badge no $219 62 274 $117 0.99System yes $220 16 379 $35 Night Security no $253 58 320 $129 0.11Guard yes $122 20 185 $41 Strategic Parking no $221 46 266 $129 0.97of Equipment yes $218 32 338 $68 Alarm System no $253 55 330 $100 0.13 yes $140 23 173 $75 Security no $238 68 309 $113 0.15Cameras yes $94 10 130 $42 Removal of no $212 52 262 $90 0.75Unused Equipment yes $235 26 359 $69 Exterior Lighting no $243 39 308 $133 0.48 yes $196 39 285 $67 Guard Stationed no $227 71 299 $97 0.48at Entry Gate yes $143 7 264 $16 Police Patrols no $227 60 301 $83 0.7 yes $196 18 283 $97
Note: None of the differences of the means are statistically significant * No respondent used guard dogs
The theft loss per million dollars of construction effort was compared to security
measures utilized to prevent the theft of tools to determine if these measures had an
observable impact. It was found that the majority of the firms that employed a security
measure to prevent the theft of tools experienced a higher rate of theft loss per million
dollars of construction. The maintaining of tool inventory and the marking of tools were
the only statistically significant findings. It could not be ascertained if the measure to
prevent tool theft were implemented because of the past experiences of tool theft.
Neither could it be determined if the tool theft exposure differed among the respondents.
32
Table 4-5 Measures commonly used to prevent the theft of tools as related to annual theft loss per million dollars of construction effort
Measure Mean N Std. Dev. Median Sig. Maintain yes $290 48 341 $153 0.01Tool Inventory no $107 30 151 $44 Maintain yes $236 55 318 $97 0.44Secure Storage no $179 23 237 $56 Minimize yes $234 45 326 $97 0.62Tools Left on Site no $200 33 252 $48 Mark Tools yes $266 53 331 $133 0.04 no $120 25 166 $45 Make Workers yes $250 38 322 $88 0.37Responsible no $190 40 270 $90 Workers Provide yes $199 24 305 $61 0.69Own Tools no $228 54 294 $113
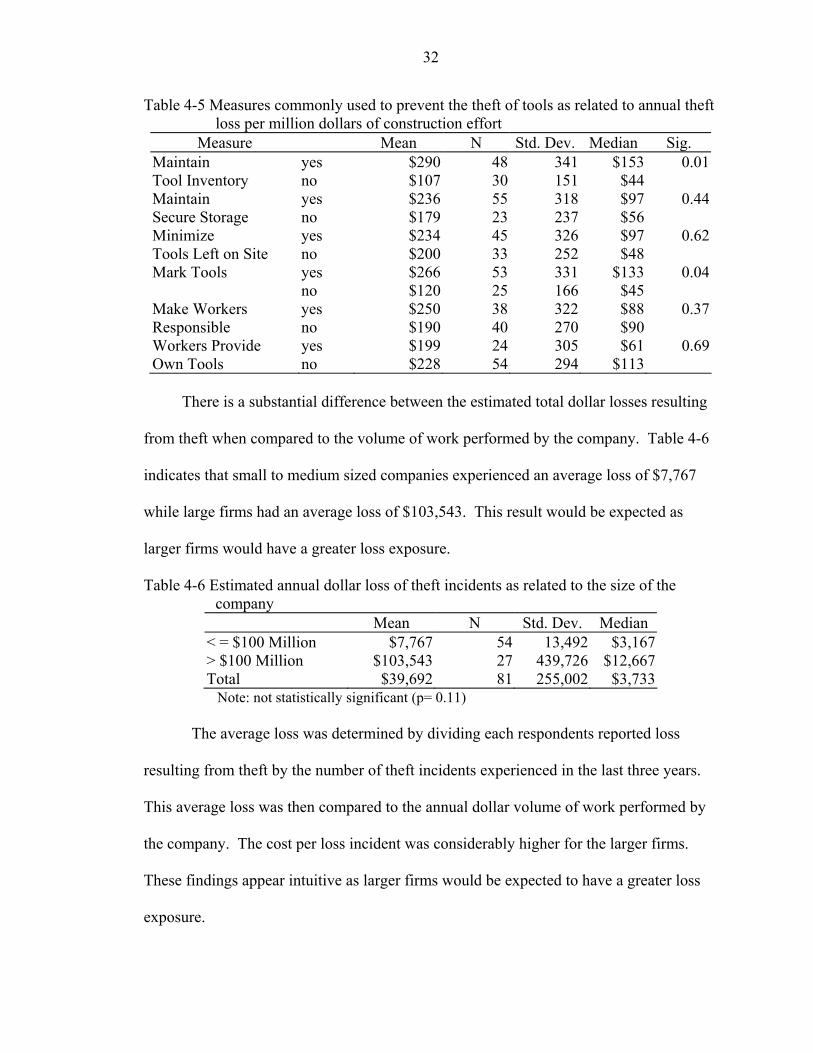
There is a substantial difference between the estimated total dollar losses resulting
from theft when compared to the volume of work performed by the company. Table 4-6
indicates that small to medium sized companies experienced an average loss of $7,767
while large firms had an average loss of $103,543. This result would be expected as
larger firms would have a greater loss exposure.
Table 4-6 Estimated annual dollar loss of theft incidents as related to the size of the company
Mean N Std. Dev. Median < = $100 Million $7,767 54 13,492 $3,167 > $100 Million $103,543 27 439,726 $12,667 Total $39,692 81 255,002 $3,733
Note: not statistically significant (p= 0.11)
The average loss was determined by dividing each respondents reported loss
resulting from theft by the number of theft incidents experienced in the last three years.
This average loss was then compared to the annual dollar volume of work performed by
the company. The cost per loss incident was considerably higher for the larger firms.
These findings appear intuitive as larger firms would be expected to have a greater loss
exposure.
33
Table 4-7 Average loss experienced by each company as related to the size of the company
Mean N Std. Dev. Median < = $100 Million $2,986 52 4,002 $1,393 > $100 Million $5,020 25 4,441 $3,800 Total $3,646 77 4,230 $2,000
Note: this is statistically significant (p= 0.05)
The dollar value of loss experienced due to theft was divided by the annual dollar
volume of work performed by each company and then divided by three to get a yearly
value of loss. This figure was then compared to the size of the company. It was found
that small to medium sized companies experienced a higher dollar amount of loss from
incidents of theft when compared to large companies (see Table 4-8).
Table 4-8 Annual dollar value of theft loss per million dollars of work performed as related to company size.
Mean N Std. Dev. Median < = $100 Million $286 48 324 $139 > $100 Million $90 27 179 $27 Total $215 75 295 $83
Note: this is statistically significant (p=.005)
The number of measures that were being utilized by the respondents was compared
to the annual dollar volume of work performed by the company. Examples of measures
can be found in Table 4-1. Of the fourteen measures identified, larger firms used an
average of 6.2 measures while smaller firms used 4.6 measures.
Table 4-9 Number of measures checked by participants as being used to ensure jobsite security as related to the size of the company
Mean N Std. Dev. Median < = $100 Million 4.6 65 2.1 5> $100 Million 6.2 35 2.5 6Total 5.2 100 2.3742 5
Note: this is statistically significant (p= 0.001)
Small to medium sized firms tended to report smaller losses ($760) to law
enforcement compared to larger firms ($1,492).
34
Table 4-10 Minimum value of loss reported to law enforcement in incidents of theft as related to the size of the company
Mean N Std. Dev. Median < = $100 Million $719 53 1108 $500 > $100 Million $1,461 31 2606 $500 Total $993 84 1866 $500
Note: this is statistically significant (p= 0.07)
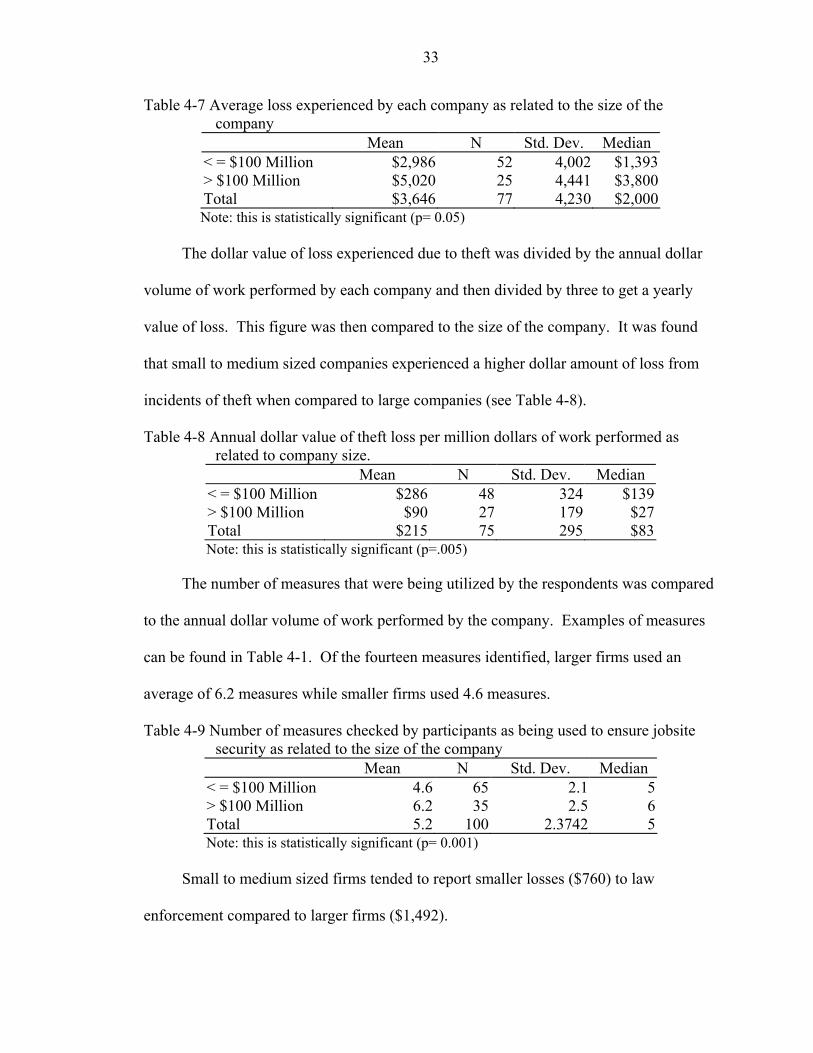
The amount of the company’s builders risk insurance policy was found to be
related to the size of the company. Small to medium sized firms had a smaller average
deductible of $5,329 as compared to larger firms who had an average deductible of
$7,264 (see Table 4-11). These figures excluded 14 outliers from companies that had a
deductible greater than $10,000.
Table 4-11 The deductible of the company’s builders risk insurance policy as related to the size of the company
Mean N Std. Dev. Median < = $100 Million $5,329 42 15,300 $1,750 > $100 Million $7,264 25 19,598 $5,000 Total $6,050 67 16,911 $2,500
Note: not statistically significant (p= 0.65)
35
VANDALISM
Vandalism is generally a nuisance crime for contractors and does not present
serious losses for most contractors. Nonetheless, any losses detract from company profits
and the threat of vandalism cannot be ignored. The study examined the experiences that
firms had with losses due to vandalism.
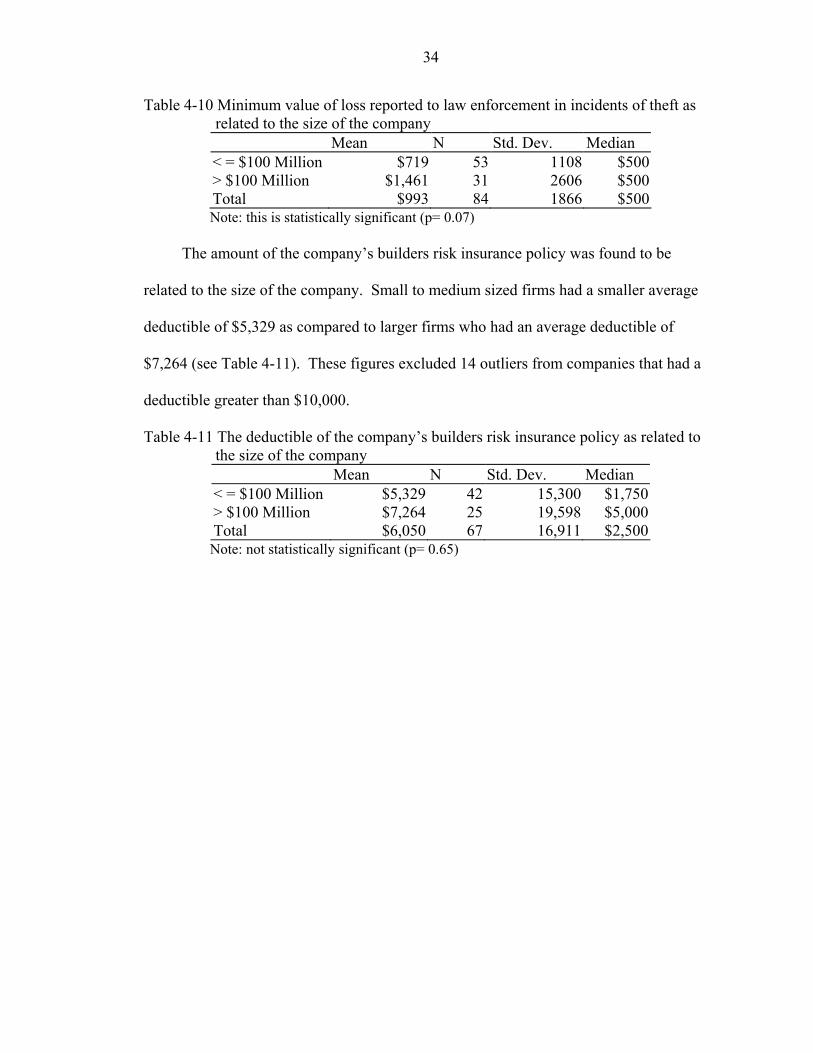
Seventy-six firms gave information on the number of vandalism incidents that
they experienced. Twenty-six of these respondents reported that they had not
experienced an incident of vandalism while thirty-two respondents reported that they had
experienced less than 2 incidents of vandalism. The mean was 3.6 vandalism incidents
experienced as one respondent had experienced 42 incidents and one had experienced
109 incidents.
2632
14
40
5
10
15
20
25
30
35
Number of Replies
None 1 2 to 5 > 5
Number of Vandalism Incidents
Figure 4-15 Number of vandalism incidents (n=76)
A total of 63 respondents gave an estimate of the total dollar losses resulting from
vandalism. Of these, 34 experienced vandalism losses of less than $1,000, while the
mean was $9,689. This relatively high mean can be attributed to a response of $433,333
in losses by one respondent.
36
16 1821
8
0
5
10
15
20
25
Number of Replies
0 $1 to $1,000 $1,001 to$5,000
> $5,000
Estimated Loss due to Vandalsim
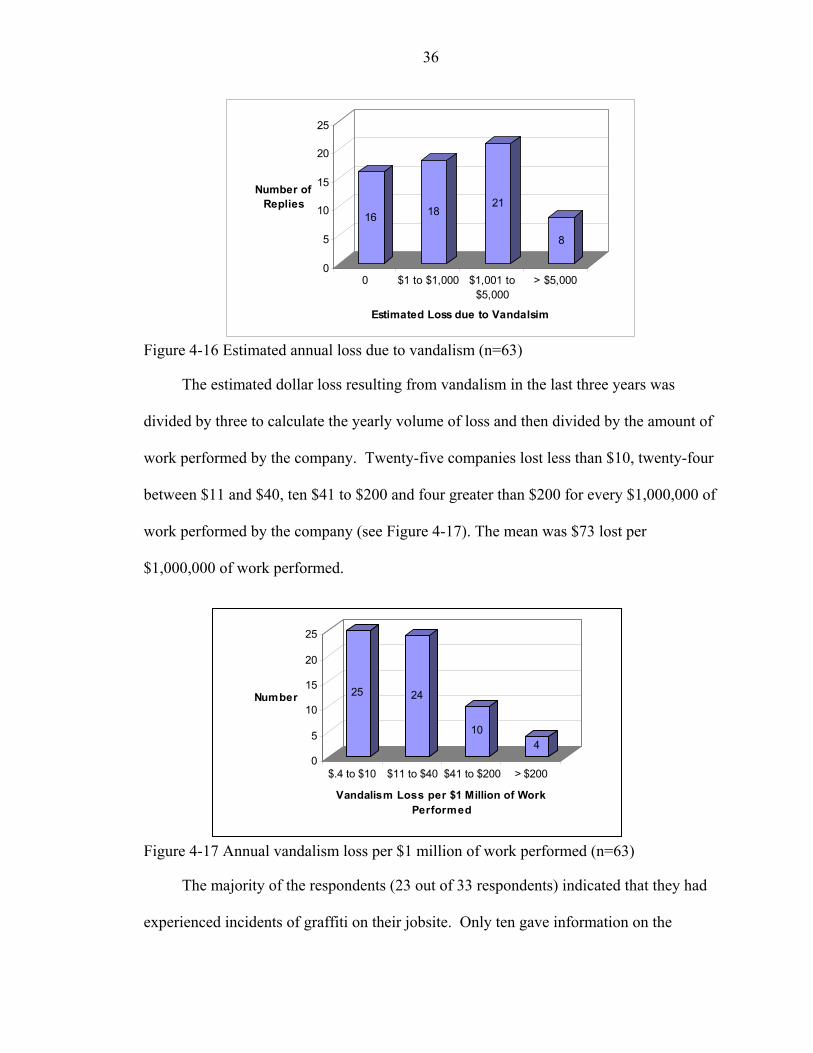
Figure 4-16 Estimated annual loss due to vandalism (n=63)
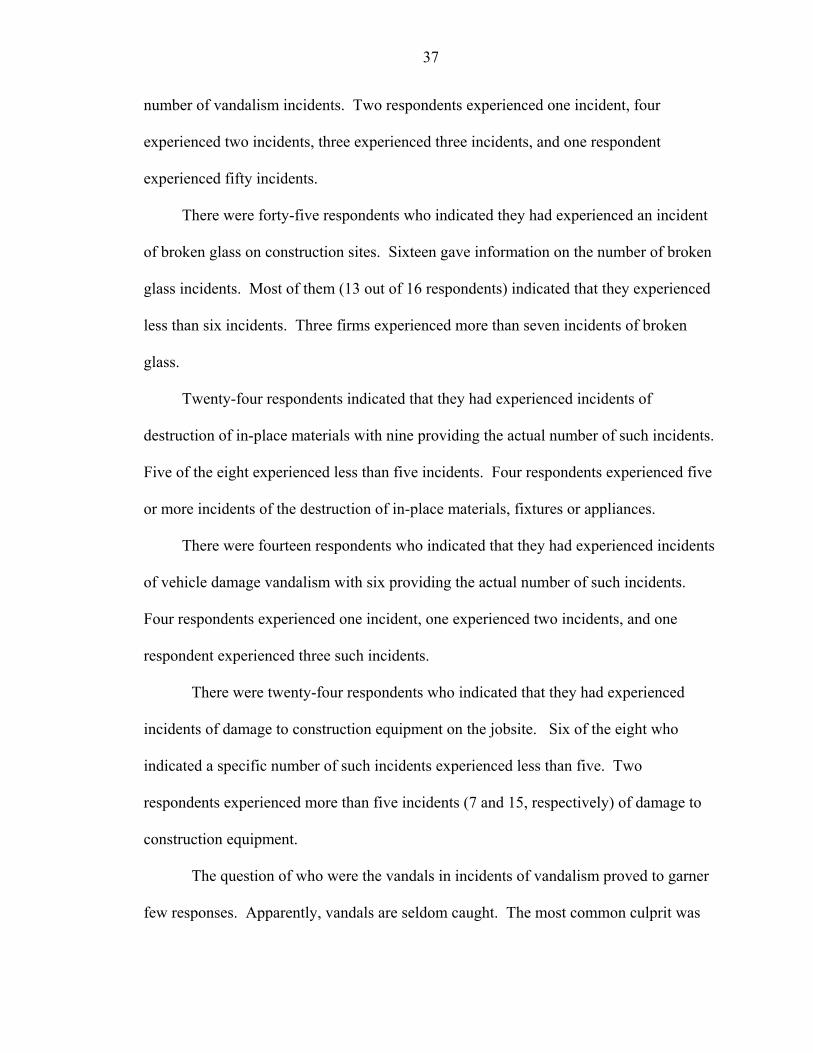
The estimated dollar loss resulting from vandalism in the last three years was
divided by three to calculate the yearly volume of loss and then divided by the amount of
work performed by the company. Twenty-five companies lost less than $10, twenty-four
between $11 and $40, ten $41 to $200 and four greater than $200 for every $1,000,000 of
work performed by the company (see Figure 4-17). The mean was $73 lost per
$1,000,000 of work performed.
25 24
104
0
5
10
15
20
25
Number
$.4 to $10 $11 to $40 $41 to $200 > $200
Vandalism Loss per $1 Million of Work Performed
Figure 4-17 Annual vandalism loss per $1 million of work performed (n=63)
The majority of the respondents (23 out of 33 respondents) indicated that they had
experienced incidents of graffiti on their jobsite. Only ten gave information on the
37
number of vandalism incidents. Two respondents experienced one incident, four
experienced two incidents, three experienced three incidents, and one respondent
experienced fifty incidents.
There were forty-five respondents who indicated they had experienced an incident
of broken glass on construction sites. Sixteen gave information on the number of broken
glass incidents. Most of them (13 out of 16 respondents) indicated that they experienced
less than six incidents. Three firms experienced more than seven incidents of broken
glass.
Twenty-four respondents indicated that they had experienced incidents of
destruction of in-place materials with nine providing the actual number of such incidents.
Five of the eight experienced less than five incidents. Four respondents experienced five
or more incidents of the destruction of in-place materials, fixtures or appliances.
There were fourteen respondents who indicated that they had experienced incidents
of vehicle damage vandalism with six providing the actual number of such incidents.
Four respondents experienced one incident, one experienced two incidents, and one
respondent experienced three such incidents.
There were twenty-four respondents who indicated that they had experienced
incidents of damage to construction equipment on the jobsite. Six of the eight who
indicated a specific number of such incidents experienced less than five. Two
respondents experienced more than five incidents (7 and 15, respectively) of damage to
construction equipment.
The question of who were the vandals in incidents of vandalism proved to garner
few responses. Apparently, vandals are seldom caught. The most common culprit was
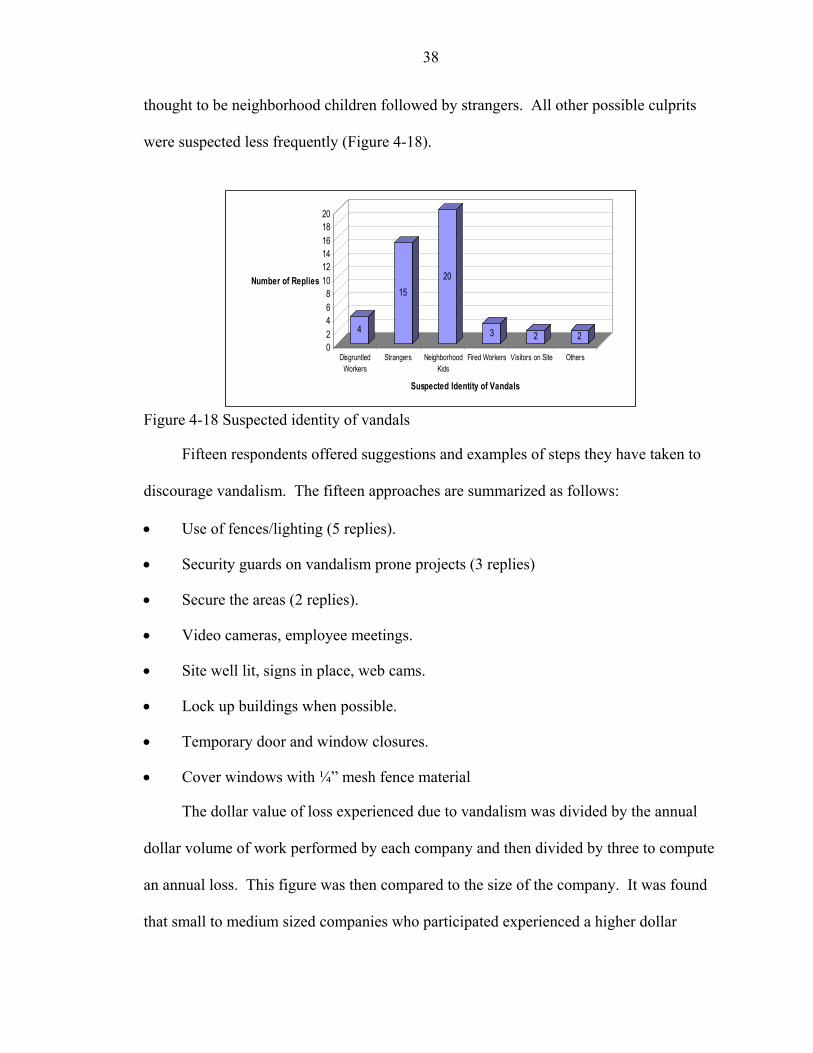
38
thought to be neighborhood children followed by strangers. All other possible culprits
were suspected less frequently (Figure 4-18).
4
1520
3 2 202468
101214161820
Number of Replies
DisgruntledWorkers
Strangers NeighborhoodKids
Fired Workers Visitors on Site Others
Suspected Identity of Vandals
Figure 4-18 Suspected identity of vandals
Fifteen respondents offered suggestions and examples of steps they have taken to
discourage vandalism. The fifteen approaches are summarized as follows:
• Use of fences/lighting (5 replies).
• Security guards on vandalism prone projects (3 replies)
• Secure the areas (2 replies).
• Video cameras, employee meetings.
• Site well lit, signs in place, web cams.
• Lock up buildings when possible.
• Temporary door and window closures.
• Cover windows with ¼” mesh fence material
The dollar value of loss experienced due to vandalism was divided by the annual
dollar volume of work performed by each company and then divided by three to compute
an annual loss. This figure was then compared to the size of the company. It was found
that small to medium sized companies who participated experienced a higher dollar
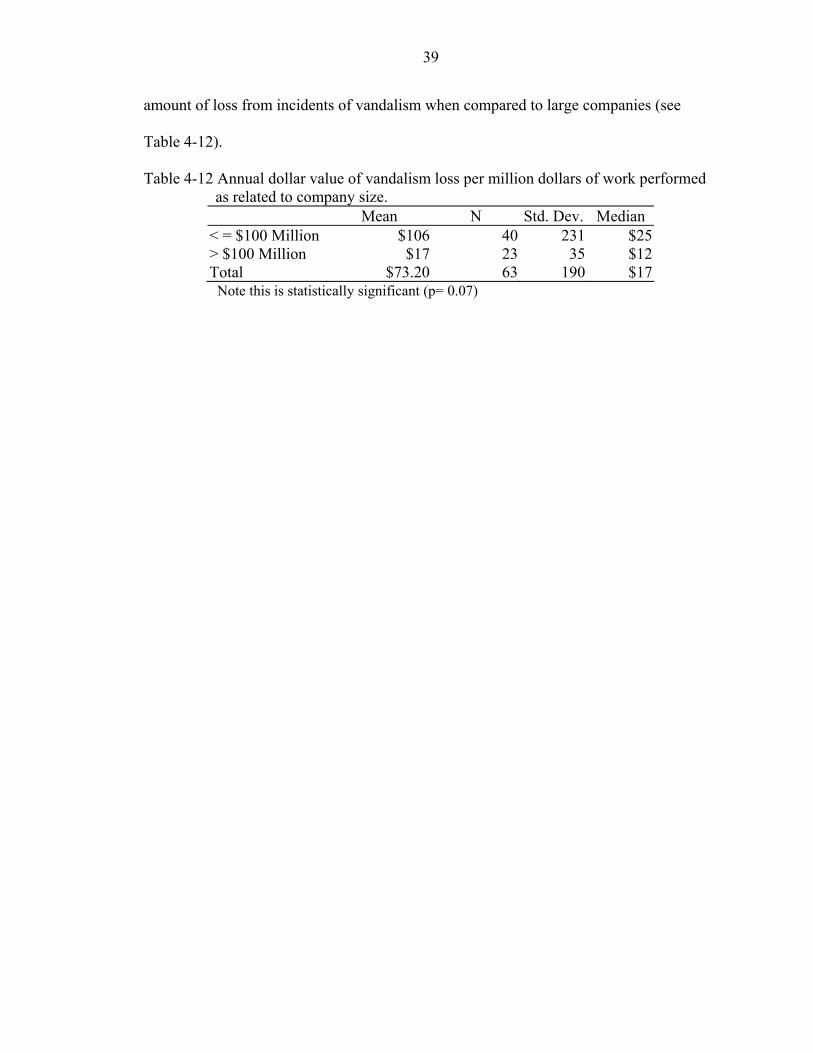
39
amount of loss from incidents of vandalism when compared to large companies (see
Table 4-12).
Table 4-12 Annual dollar value of vandalism loss per million dollars of work performed as related to company size.
Mean N Std. Dev. Median < = $100 Million $106 40 231 $25 > $100 Million $17 23 35 $12 Total $73.20 63 190 $17
Note this is statistically significant (p= 0.07)
CHAPTER 5 CONCLUSIONS AND RECOMMENDATIONS
CONCLUSIONS
The purpose of our study was to gather data that could be used to help to
understand the scope of the problem of theft and vandalism in the commercial
construction industry. The conclusions are based on the information provided by 100
responding firms.
Theft on construction jobsites is a considerable problem in the construction
industry and will continue to be a threat. The direct losses from theft and vandalism are
estimated to be $1,861 per million dollars of construction work, with theft constituting
about 85% of this amount. Based on an annual construction volume of approximately
$700 billion in the United States, it is estimated that the direct costs of theft and
vandalism on construction sites exceed $1.3 billion. Note that this estimate does not take
into account the indirect costs that are associated with these losses. These values are
consistent with the costs reported in several literature sources. The loss values estimated
by the study results represent the losses of general contractors. Since most of the
exposure to loss be theft and vandalism is borne by subcontractors, it is reasonable to
expect that the true direct costs of thefts on construction projects is probably 10 to 20
times greater. The major losses from theft in terms of direct costs are associated with the
theft of vehicles and construction equipment. Other thefts cannot be ignored as their
costs can be considerable. Incidents the theft (whether it be tools, equipment and
40
41
machinery, office equipment, and construction materials) can prove detrimental in the
running of a successful project because of the associated indirect costs. These indirect
costs are not always evident but the loss of productivity because a tool or piece of
equipment was stolen the night before can cause work to be halted for hours or even days
until a replacement can be found. This can be a burden on any project that falls victim to
theft.
Employees of small to medium sized firms do not put as much emphasis on jobsite
security measures as do large firms. As firms get larger they tend to utilize a more
sophisticated approach to protecting their jobsites. This is evident in the finding that
small to medium sized companies experienced a greater theft loss per million dollars of
work in place when compared to the losses experienced by large companies. Because of
the larger volume of work being undertaken by large firms they are in a position where
there is a greater chance for theft and vandalism on their jobsites. These larger firms
utilize more techniques for the protection of their jobsites then do small to medium sized
companies. Large firms tend to realize that theft and vandalism are very real problems
that need to be addressed through appropriate prevention measures. The utilization of
more sophisticated jobsite security techniques by larger construction firms could be
paralleled to research findings that show that large firms are more proactive in
developing extensive safety programs than are small to medium sized firms. In addition
to the added security measures used by large firms, it is likely that their projects tend to
be larger and pose a more imposing obstacle to a potential thief.
The percentage of work subcontracted and the type of work being done was not
found to have a relationship with such variables as the number of theft or vandalism
42
incidents in the last three years or the dollar value of losses resulting from theft or
vandalism. This would seem to suggest that these are factors that are not central in
effecting jobsite security. Firms engaging in all types of projects are susceptible to theft
and vandalism.
Vandalism was not a big concern of many contractors. This may be due to the fact
that measures used to prevent vandalism may be regarded as being more costly than the
cost of damage resulting from the vandalism. The findings for the vandalism losses per
million dollars of construction work indicated that the cost of vandalism effects small to
medium sized firms more than large firms. These larger firms are more proactive and
utilize better techniques in the prevention of vandalism on their construction sites. It is
more likely larger firms construct larger projects and that these projects tend to be located
further from neighborhood areas where vandals may live.
RECOMMENDATIONS
In conducting the literature review for this research we found a shortage of prior
research and data on the subject of jobsite security. This was puzzling because of the
large dollar figure (roughly $1 billion lost annually from incidents of theft and
vandalism) associated with theft and vandalism on the construction site. This large
potential of loss can obviously have severe negative impacts on the success of a. It is
important that a better understanding of the problem be determined, and this can only be
achieved through further research.
The ninety-three responses received were beneficial in performing a good initial
study of jobsite security and getting an indication of the depth of the problem as well as
what techniques have proven to be successful for companies. Future studies should seek a
larger and more nationally focused survey. This would prove to be a greater help in the
43
understanding of the breadth of the problem of theft and vandalism in the construction
industry. Future studies could focus strictly on either theft or vandalism. Another
possibility is looking only at equipment theft or tool theft and the resultant impact on
productivity. Understanding more about vandalism may require research to identify the
types of individuals who are most often involved in vandalism.
Contractors need to be proactive in order to curtail theft and vandalism on the
jobsite, rather than waiting for problems to arise. The initial investment in developing a
complete jobsite security plan prior to beginning construction work can be miniscule
when compared to the losses that can result from the theft of an expensive piece of
equipment. Contractors should also take into account the specific area that they are
working in and realize that there are different potential problems associated with different
sites such as remote, metropolitan, or neighborhood sites. Recognizing that potential
problems of theft or vandalism exist on every construction site, contractors can
implement measures to reduce the probability of being a target for thieves and vandals.
Utilizing many different measures and techniques in the prevention of theft and
vandalism has proven to be successful. Contractors are encouraged to expand the number
of measures to prevent theft and vandalism. Incidents of theft should be reported to law
enforcement, no matter how seemingly insignificant the loss.
Finally, this study relied only on the opinions and perceptions of the employees of
the firms surveyed. A more accurate technique that could be utilized in the future is the
use of controlled experiments. Construction sites with differing variables such as region,
type of project, and size of project could be observed throughout the life of the job to find
out what the potential problems are and what solutions proved to be most beneficial. A

44
large amount of data could be generated and further prove to be beneficial in the
prevention of theft and vandalism in the construction industry.
APPENDIX A MAILED QUESTIONAIRE COVER LETTER
June 2, 2003 Subject: Survey on Jobsite Security Dear Contractor, The M. E. Rinker, Sr. School of Building Construction at the University of Florida is conducting a study on jobsite security. The focus of the study is to identify specific practices that are being employed by contractors pertaining to security on their construction projects. In this study we are attempting to identify typical practices and techniques that are related to reducing theft and vandalism. The short survey questionnaire contains a variety of questions related to jobsite security in construction projects. If you feel that you are not the appropriate individual to complete the survey, please forward it to someone who you feel is knowledgeable on the subject covered. Many of the questions can be answered by simply checking the applicable answers. There are no risks associated with participating in this study and participation is entirely voluntary. The survey can be completed in a few minutes. Naturally, you are asked to answer only those questions that you feel comfortable in answering. Results of this study will be compiled and summarized in a report. We will provide a complimentary summary report to you if you want one. The information presented in the report may prove to be beneficial to you and your firm. Should you have any questions please feel free to contact me. Responses provided by specific firms will be kept strictly confidential to the extent provided by law. Research data will be summarized so that the identity of individual participants will be concealed. You have my sincere thanks for participating in this study. Yours truly, Jimmie Hinze Director, Fluor Program for Construction Safety (352) 273-1167 FAX: (352) 392-9606 Email: [email protected] P.S. For information about participant rights, please contact the University of Florida Institutional Review Board at (352) 392-0433 or Email: [email protected]
45
APPENDIX B JOBSITE SECURITY QUESTIONAIRE
Information about the size and type of company: How is the firm best described?
General contractor Subcontractor Vendor/supplier What type of projects does your firm undertake (More than one answer may be selected)?
Commercial Highway/roadwork Utility Residential Industrial Public buildings Other (please describe):
___________________________________________________ What is the approximate annual dollar volume of work performed by the company? $_________. If a general contractor, what percent of the work is typically subcontracted? ______ % subbed What measures are commonly used to ensure the security on the construction sites? (Check all that apply)
Lockbox for tools/small equipment Strategic parking of large equipment Neighborhood watch Alarm system
Guard dogs Security cameras Warning signs posted Remove unused equipment from site Security fence Exterior lighting on the site Use worker badge system Station a guard at entry gate Night security guard on site Police patrols Other, describe: _________________________________________________________ Theft In the past 3 years, what has the company experienced in terms of incidents of theft? Approximate number of theft incidents in the past 3 years: ______ Estimated total loss of these thefts: $ ______________ How many of the following types of theft incidents has the firm experienced in the past 3 years? ____ Tools (hand tools and power tools), Value of Loss = $__________ ____ Licensed vehicles, Value of Loss = $__________ ____ Equipment, Value of Loss = $___________
46
47
____ Computers, printers, copiers, etc., Value of Loss = $__________ ____ Construction materials, Value of Loss = $__________ If applicable, give an example of a jobsite layout decision that has been used to discourage theft. ________________________________________________________________________ ________________________________________________________________________ What percent of the theft incidents are reported to the police? ______ % What is the minimum value of a theft loss that is reported to the police? $_________ What is the deductible amount on the firm’s builder’s risk insurance policy? $ _________ What percent of the theft incidents have the stolen items actually been recovered? _____ % What percent of jobsite thefts on your projects are assumed to involve employees or former employees? _______% What measures are commonly used to prevent theft of tools? (√ all that apply) Maintain tool inventory Mark tools Maintain secure storage area Make workers responsible for tools Minimize tools left on site Workers provide their own tools Other, describe: _______________________________________________ What measures does the firm take to prevent theft of machinery and equipment? (√ all that apply) Park equipment in well-lighted areas at night Modify ignition or fuel lines to make it difficult for others to start the engine Include additional identification on the equipment Use a distinctive color for the equipment Park the equipment at a central location/specific formation at end of each day Other, describe: ________________________________________________ Vandalism In the past 3 years, what has the company experienced in terms of incidents of vandalism? Number of vandalism incidents in the past 3 years: ______ Total estimated loss due to vandalism: $ ___________ Number of vandalism incidents that were reported to the police? _____ How many of the following vandalism incidents did the firm experience in the past 3 years? ____ Graffiti ____ Broken glass ____ Destruction of in-place materials, fixtures, or appliances ____ Damage to licensed vehicles ____ Damage to construction equipment ____ Other: _____________________________________________ For how many instances of vandalism in the past 3 years were the vandals on your firm’s projects actually caught? ______ If known, who were the vandals? (Check all that apply) Disgruntled workers Workers who had been fired Strangers Persons who had been on the site for some reason
48
Neighborhood kids Other: _____________________________ What other steps, if any, does your firm take to curtail vandalism? ________________________________________________________________________ Optional: A summary of this research study will be prepared. If you would like a complimentary copy of the report as soon as it is available, you may include your name and address below and one will be provided to you. Note that your firm’s identity will not be used in any way other than to get a report to you. Thank you for your participation. Name: ____________________________________________ Firm: ____________________________________________ Street Address: ______________________________________________ City: ______________________________ State: ______ Zip: ________
LIST OF REFERENCES
Banks, Terry. “Equipment Theft.” Constructor November 1990: 42-43.
Bonesteel, Matt. NUCA August 1997: 15-17.
“Combating Construction Theft.” The Mechanical Contractors Association of Toronto. Fall 1999. http://www.mcat.on.ca/pipeline/fall99/consttheft.html
“Construction Site Theft.” Lumberman’s of Washington, Inc. January 2000. http://www.lumbermens-building.com/builders/builderxpress/BuildersXpressArticle.asp?Volume=25&Article=1.
“Contractors' Equipment Losses: Knowledge of Hazards Can Reduce Risk.” Insurance Journal. 19 February 2001. http://www.insurancejournal.com/magazines/southcentral/2001/02/19/features/22326.htm
Gardner, Tony. “Security in Construction and Beyond; Protecting Your Site, Even During Build-up.” Virgo Publishing, Inc. 2003. http://www.insideselfstorage.com/articles/291feat4.html.
“Japanese Theft Gang Tied to U.S.” Rental Equipment Registrar Magazine. 11 March 2002. http://rerreports.com/31102/.
Krizan, William G. “Jobsite Crime Soaring Along with Workloads.” Engineering News Record. 20 August 1987: 10.
McDowall, Jon. “Backhoes, Air Compressors, Skid-steers, Generators Head the Hit List.” Rental Management November 2002. http://www.rentalmanagementmag.com/newsart.asp?ARTID=677
Middleton, Sherri. “Equipment Theft; Finding the Solutions to a Billion Dollar Problem.” Heavy Equipment News. June 1999: 48-49.
Moorhouse, Nancy. “Cost Retention and Safety Enhancement, Protecting Your Assets.” AGC of California. http://www2.agc-ca.org/services/SH&E/Safety/Sb01-2.pdf.
“Protect Your Company From Jobsite Crime.” Associated General Contractors of Washington. March 2002. http://www.agcwa.com/public/newsletter/2002/march/crime.asp
“Site theft - A spanner in the works; Advice on construction site security.” Neighborhoodwatch. Net. August 1992. http://www.neighbourhoodwatch.net/neighbourhoodwatch/organisational/prevention/site.html.
49

50
“Theft and Vandalism Prevention Kit for Construction.” Vista Training Inc. 2003. http://www.vista-start smart.com/What_s_New/Theft___Vandalism_Press_Releas/theft___vandalism_press_releas.html
BIOGRAPHICAL SKETCH
I possess a Bachelor of Science in Finance from the University of Florida and will
have completed a Master of Science in Building Construction from the University of
Florida in August of 2003. In the past I have worked in the financial industry as a
registered securities trader and in the construction industry with a general contractor in
the state of Florida.
51