jindal steel and power ltd - power your trade:...
TRANSCRIPT
Jindal Steel and Power Ltd
BUY
- 1 of 34 -
Tuesday 1st August, 2017
This document is for private circulation, and must be read in conjunction with the disclaimer on the last page.
ST
OC
K P
OIN
TE
R
Target Price ₹ 472 CMP ₹ 155 FY20E EV/EBITDA 4.0X
Index Details We believe that the steel industry is headed for a cyclical upturn
given that China has undertaken intiatives to cut excess capacities
citing environmental issues. Following this we have seen a rebound
in global steel prices. In India too the government measures to check
dumping have resulted in prices firming up. With prices set to rally
there is always the threat of imports increasing, especially flat
products. However given the fact that JSPL is primarily into long
products it should remain unaffected.
Post capex completion at Angul, we expect JSPL to near double its
revenues by FY20. This coupled with the fact that coal linkages with
Coal India have been firmed up for five years and the domestic iron
ore prices are quoting at lows, the steel business is expected to do
well. The power business is also expected to perform well given that
FSA & PPAs are in place. Further with the sale of its power asset
Tamnar I (1,000 MW) already inked the company should be able to
leverage its gearing to a certain extent.
We expect revenues to grow at a CAGR of 22.7% to Rs. 39,184 crores
while EBITDA is expected to grow at a faster clip of 27% CAGR to Rs.
9,615 crores by FY20. Net earnings are expected to turn the corner in
FY18 and should scale to Rs.1,954 crores by FY20. We initiate with a
BUY for a price target of Rs. 472 (target 7.0X FY20 EV/EBITDA)
representing an upside of 204.5% from the CMP of Rs.155 over the
next 21 months.
We are optimistic given that :
Completion of capex at Angul should enhance crude steelmaking
capacity to 8.9 million tonnes from 6 million tonnes in FY17. Steel
volumes are expected to grow at a CAGR of 21% to 8.4 million
tonnes in FY20. On the back of improving realisations, revenues
from the steel business are expected to grow at a CAGR of 25%
from Rs. 16,280 crores in FY17 to Rs. 31,574 crores by FY20.
Sensex 32,575
Nifty 10,114
Industry Steel & Power
Scrip Details Mkt Cap(₹ cr) 14,160
BVPS (₹) 328.4
O/s Shares (Cr) 91.5
Av Vol (Lacs) 13.9
52 Week H/L 62.6/158.3
Div Yield (%) 0
FVPS (₹) 2
Shareholding Pattern
Shareholders %
Promoters 61.9
Public 38.1
Total 100
Jindal Steel & Power vs. Sensex
00000000000
0000000000000000000;/’;;.
0
50
100
150
200
0 5000
10000 15000 20000 25000 30000 35000
SENSEX JSPL
Key Financials (₹ in Cr)
Y/E Mar Net
Sales EBITDA PAT EPS
EPS Growth
(%)
RONW (%)
ROCE (%)
P/E EV/EBITDA
(x) (x)
2017 21051 4658 -2281 -24.93 NA -7.6 -3.8 NA 11.5
2018E 31415 7745 115 1.64 NA 0.4 0.3 119.9 6.3
2019E 37329 8991 1865 20.38 1508 6.4 2.6 7.5 4.6
2020E 39184 9615 1955 21.36 5 6.5 4.3 7.1 4.0
- 2 of 34- Tuesday 1st August, 2017
This document is for private circulation, and must be read in conjunction with the disclaimer on the last page.
JSPL skipped its debt repayment schedule in FY16 as it was cash
strapped. To overcome this the company has inked an agreement to
sell its 1,000 MW power generating asset (Tamnar I) to JSW energy
for a consideration of Rs. 4,000 crores in FY19. This should help the
company deleverage. Further improving business fundamentals
should help lower debt gearing to 1.0X by FY20 from 1.3X reported
in FY17. This compares very favourably with that of peers JSW and
Tata Steel.
With signing of PPAs & FSAS (barring Tamnar I) visibility of
power business should improve. We expect overall PLF
utilizations to improve to 70% by FY20 from the current 35%. In
line with this revenues are expected to grow at a CAGR of 17% to
Rs. 5,063 crores by FY20 from the current Rs. 3120 crores.
- 3 of 34- Tuesday 1st August, 2017
This document is for private circulation, and must be read in conjunction with the disclaimer on the last page.
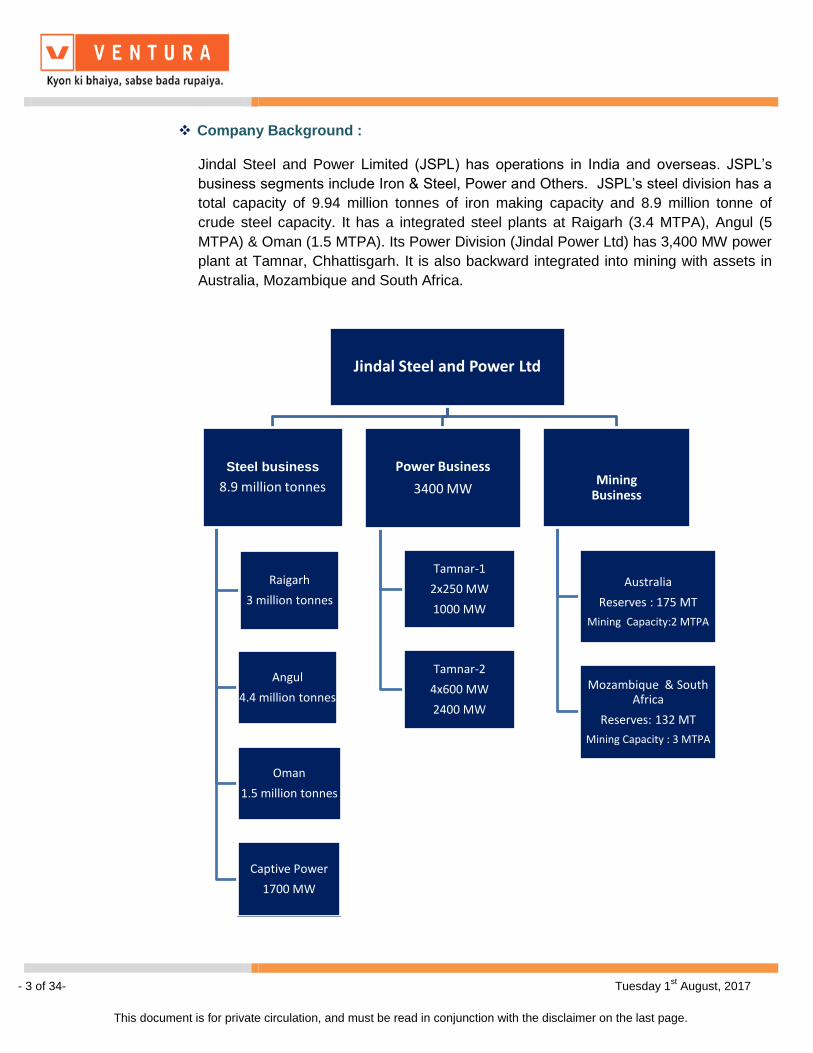
Company Background : Jindal Steel and Power Limited (JSPL) has operations in India and overseas. JSPL’s
business segments include Iron & Steel, Power and Others. JSPL’s steel division has a
total capacity of 9.94 million tonnes of iron making capacity and 8.9 million tonne of
crude steel capacity. It has a integrated steel plants at Raigarh (3.4 MTPA), Angul (5
MTPA) & Oman (1.5 MTPA). Its Power Division (Jindal Power Ltd) has 3,400 MW power
plant at Tamnar, Chhattisgarh. It is also backward integrated into mining with assets in
Australia, Mozambique and South Africa.
Jindal Steel and Power Ltd
Steel business
8.9 million tonnes
Raigarh
3 million tonnes
Angul
4.4 million tonnes
Oman
1.5 million tonnes
Captive Power
1700 MW
Power Business
3400 MW
Tamnar-1
2x250 MW
1000 MW
Tamnar-2
4x600 MW
2400 MW
Mining Business
Australia
Reserves : 175 MT
Mining Capacity:2 MTPA
Mozambique & South
Africa
Reserves: 132 MT
Mining Capacity : 3 MTPA
- 4 of 34- Tuesday 1st August, 2017
This document is for private circulation, and must be read in conjunction with the disclaimer on the last page.
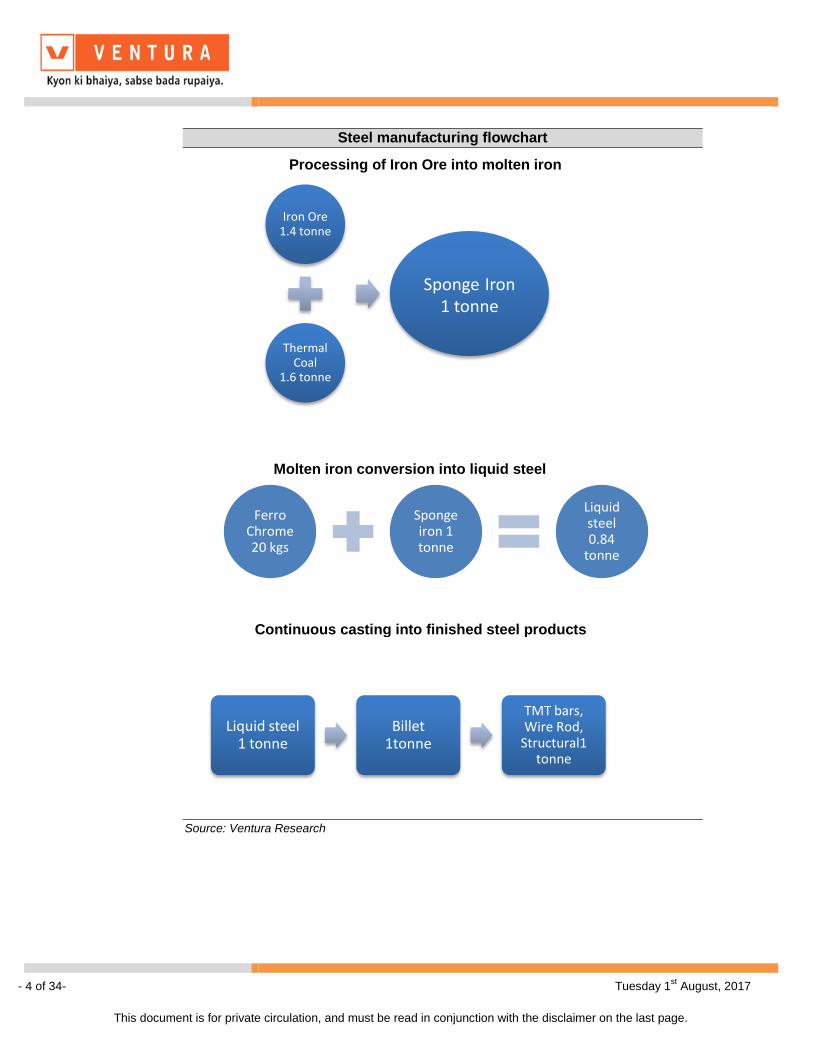
Steel manufacturing flowchart
Source: Ventura Research
Iron Ore 1.4 tonne
Thermal Coal
1.6 tonne
Sponge Iron 1 tonne
Ferro Chrome 20 kgs
Sponge iron 1 tonne
Liquid steel 0.84
tonne
Liquid steel 1 tonne
Billet 1tonne
TMT bars, Wire Rod,
Structural1 tonne
Processing of Iron Ore into molten iron
Molten iron conversion into liquid steel
Continuous casting into finished steel products
- 5 of 34- Tuesday 1st August, 2017
This document is for private circulation, and must be read in conjunction with the disclaimer on the last page.
Key Investment Highlights
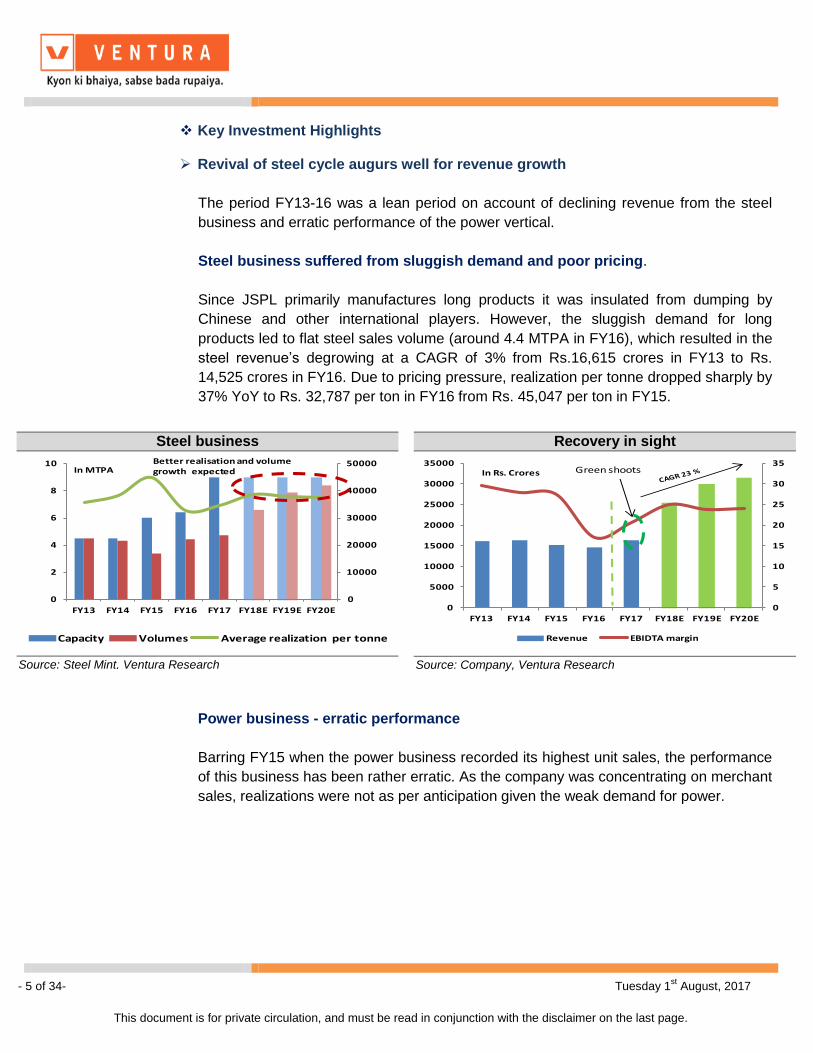
Revival of steel cycle augurs well for revenue growth
The period FY13-16 was a lean period on account of declining revenue from the steel
business and erratic performance of the power vertical.
Steel business suffered from sluggish demand and poor pricing.
Since JSPL primarily manufactures long products it was insulated from dumping by
Chinese and other international players. However, the sluggish demand for long
products led to flat steel sales volume (around 4.4 MTPA in FY16), which resulted in the
steel revenue’s degrowing at a CAGR of 3% from Rs.16,615 crores in FY13 to Rs.
14,525 crores in FY16. Due to pricing pressure, realization per tonne dropped sharply by
37% YoY to Rs. 32,787 per ton in FY16 from Rs. 45,047 per ton in FY15.
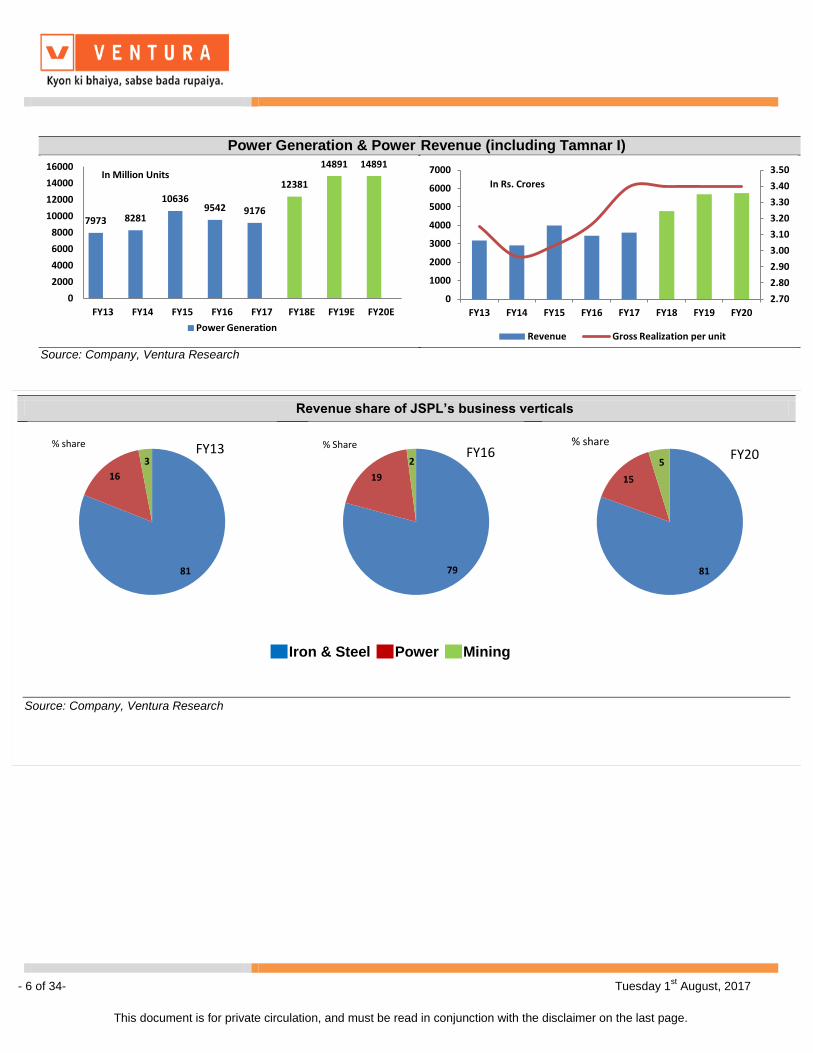
Power business - erratic performance
Barring FY15 when the power business recorded its highest unit sales, the performance
of this business has been rather erratic. As the company was concentrating on merchant
sales, realizations were not as per anticipation given the weak demand for power.
Recovery in sight
0
5
10
15
20
25
30
35
0
5000
10000
15000
20000
25000
30000
35000
FY13 FY14 FY15 FY16 FY17 FY18E FY19E FY20E
Revenue EBIDTA margin
In Rs. Crores Green shoots
Source: Company, Ventura Research
Steel business
0
10000
20000
30000
40000
50000
0
2
4
6
8
10
FY13 FY14 FY15 FY16 FY17 FY18E FY19E FY20E
Capacity Volumes Average realization per tonne
In MTPABetter realisation and volume growth expected
Source: Steel Mint, Ventura Research
- 6 of 34- Tuesday 1st August, 2017
This document is for private circulation, and must be read in conjunction with the disclaimer on the last page.
Revenue share of JSPL’s business verticals
Source: Company, Ventura Research
81
16
3
% share FY13
79
19
2
% Share FY16
81
15
5
% share FY20
Power Generation & Power
Source: Company, Ventura Research
7973 8281
10636 9542 9176
12381
14891 14891
0
2000
4000
6000
8000
10000
12000
14000
16000
FY13 FY14 FY15 FY16 FY17 FY18E FY19E FY20E
Power Generation
In Million Units
Revenue (including Tamnar I)
2.70
2.80
2.90
3.00
3.10
3.20
3.30
3.40
3.50
0
1000
2000
3000
4000
5000
6000
7000
FY13 FY14 FY15 FY16 FY17 FY18 FY19 FY20
Revenue Gross Realization per unit
In Rs. Crores
Iron & Steel Power Mining
- 7 of 34- Tuesday 1st August, 2017
This document is for private circulation, and must be read in conjunction with the disclaimer on the last page.
Steel Business - green shoots seen in FY17.
FY17 was the year of revival not only for the overall global steel cycle but also for the
Indian steel industry and JSPL. This was on account of -
1. Sharp cut backs by China in its installed capacity citing environmental concerns.
2. Anti-dumping measures undertaken by major steel importers viz. India, US & Europe on
Chinese dumping.
3. Decrease in domestic iron ore prices which have improved profitability.
4. Revival of Indian infrastructure given the measures taken by the Modi government.
5. Shrinking demand supply gap in the domestic market which has improved long term
visibility.
6. Completion of capex at the Angul plant which augurs well for JSPL’s steel revenue
growth. Long products in particular plates, rails & TMT bars which are the revenue
spinners of JSPL have strong drivers in place.
7. Existing operations at Raigarh to function at full throttle from FY19.
8. Oman facility to produce value added products (TMT bars) from FY18.
- 8 of 34- Tuesday 1st August, 2017
This document is for private circulation, and must be read in conjunction with the disclaimer on the last page.
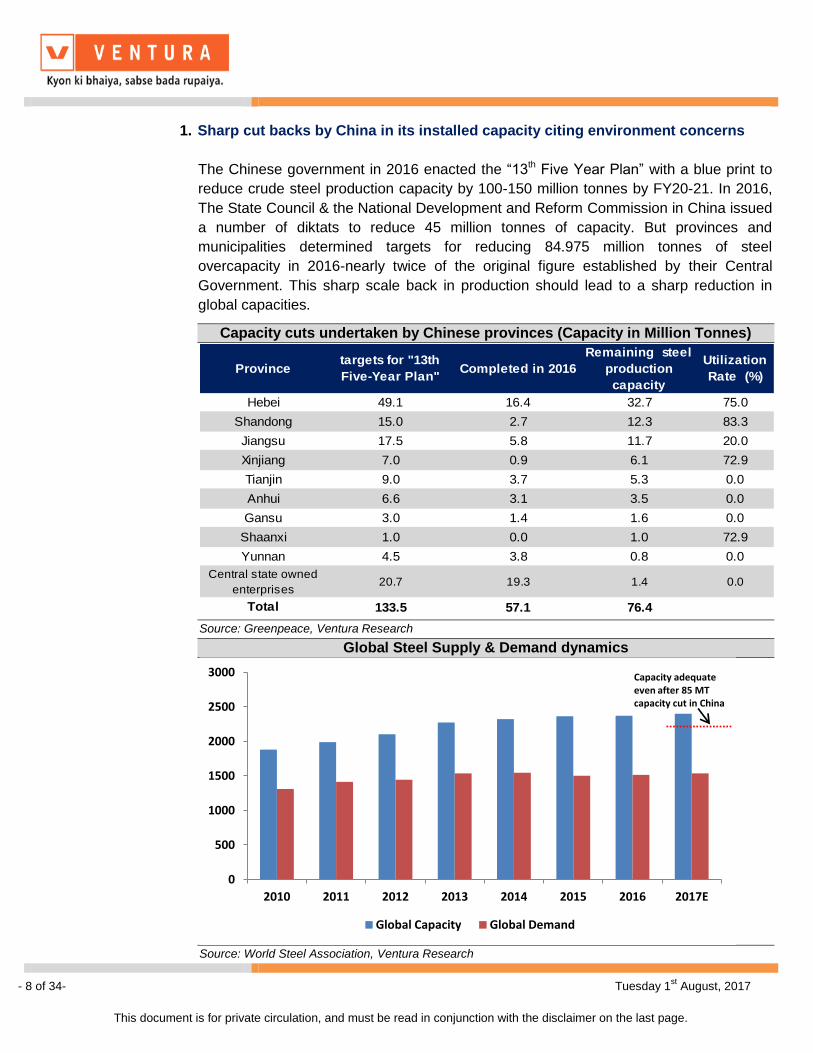
1. Sharp cut backs by China in its installed capacity citing environment concerns
The Chinese government in 2016 enacted the “13th Five Year Plan” with a blue print to
reduce crude steel production capacity by 100-150 million tonnes by FY20-21. In 2016,
The State Council & the National Development and Reform Commission in China issued
a number of diktats to reduce 45 million tonnes of capacity. But provinces and
municipalities determined targets for reducing 84.975 million tonnes of steel
overcapacity in 2016-nearly twice of the original figure established by their Central
Government. This sharp scale back in production should lead to a sharp reduction in
global capacities.
Capacity adequate even after capacity cut back in China
Capacity cuts undertaken by Chinese provinces (Capacity in Million Tonnes)
Provincetargets for "13th
Five-Year Plan"Completed in 2016
Remaining steel
production
capacity
Utilization
Rate (%)
Hebei 49.1 16.4 32.7 75.0
Shandong 15.0 2.7 12.3 83.3
Jiangsu 17.5 5.8 11.7 20.0
Xinjiang 7.0 0.9 6.1 72.9
Tianjin 9.0 3.7 5.3 0.0
Anhui 6.6 3.1 3.5 0.0
Gansu 3.0 1.4 1.6 0.0
Shaanxi 1.0 0.0 1.0 72.9
Yunnan 4.5 3.8 0.8 0.0
Central state owned
enterprises20.7 19.3 1.4 0.0
Total 133.5 57.1 76.4
Source: Greenpeace, Ventura Research
Global Steel Supply & Demand dynamics
Source: World Steel Association, Ventura Research
0
500
1000
1500
2000
2500
3000
2010 2011 2012 2013 2014 2015 2016 2017E
Global Capacity Global Demand
Capacity adequate even after 85 MT capacity cut in China
- 9 of 34- Tuesday 1st August, 2017
This document is for private circulation, and must be read in conjunction with the disclaimer on the last page.
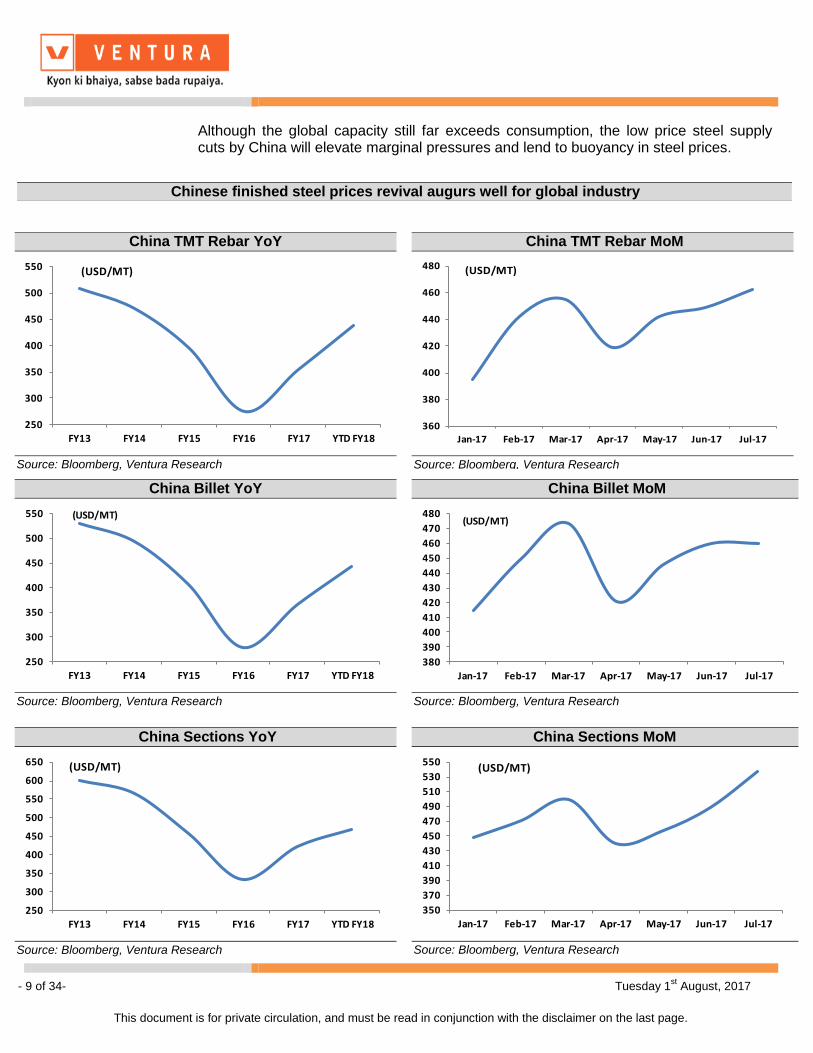
Although the global capacity still far exceeds consumption, the low price steel supply cuts by China will elevate marginal pressures and lend to buoyancy in steel prices.
China TMT Rebar YoY
250
300
350
400
450
500
550
FY13 FY14 FY15 FY16 FY17 YTD FY18
(USD/MT)
Source: Bloomberg, Ventura Research
China TMT Rebar MoM
360
380
400
420
440
460
480
Jan-17 Feb-17 Mar-17 Apr-17 May-17 Jun-17 Jul-17
(USD/MT)
Source: Bloomberg, Ventura Research
China Billet YoY
250
300
350
400
450
500
550
FY13 FY14 FY15 FY16 FY17 YTD FY18
(USD/MT)
Source: Bloomberg, Ventura Research
China Billet MoM
380
390
400
410
420
430
440
450
460
470
480
Jan-17 Feb-17 Mar-17 Apr-17 May-17 Jun-17 Jul-17
(USD/MT)
Source: Bloomberg, Ventura Research
China Sections YoY
250
300
350
400
450
500
550
600
650
FY13 FY14 FY15 FY16 FY17 YTD FY18
(USD/MT)
Source: Bloomberg, Ventura Research
China Sections MoM
350
370
390
410
430
450
470
490
510
530
550
Jan-17 Feb-17 Mar-17 Apr-17 May-17 Jun-17 Jul-17
(USD/MT)
Source: Bloomberg, Ventura Research
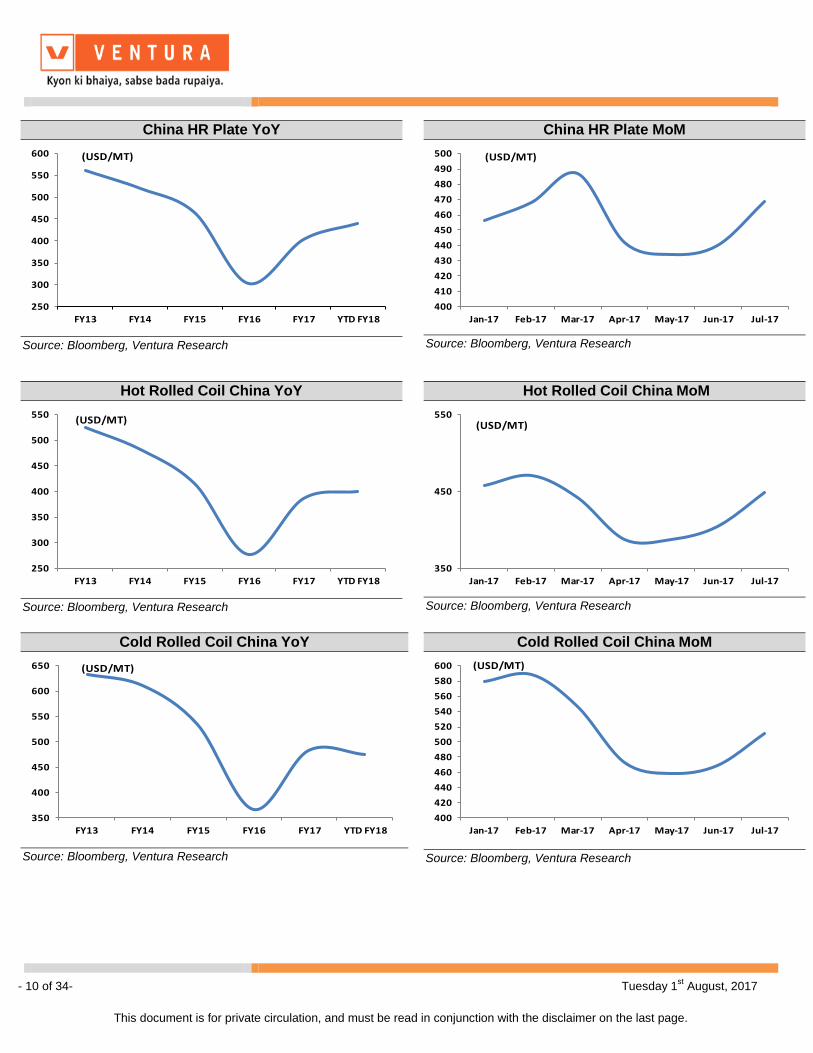
Chinese finished steel prices revival augurs well for global industry
- 10 of 34- Tuesday 1st August, 2017
This document is for private circulation, and must be read in conjunction with the disclaimer on the last page.
China HR Plate YoY
250
300
350
400
450
500
550
600
FY13 FY14 FY15 FY16 FY17 YTD FY18
(USD/MT)
Source: Bloomberg, Ventura Research
China HR Plate MoM
400
410
420
430
440
450
460
470
480
490
500
Jan-17 Feb-17 Mar-17 Apr-17 May-17 Jun-17 Jul-17
(USD/MT)
Source: Bloomberg, Ventura Research
Hot Rolled Coil China YoY
250
300
350
400
450
500
550
FY13 FY14 FY15 FY16 FY17 YTD FY18
(USD/MT)
Source: Bloomberg, Ventura Research
Hot Rolled Coil China MoM
350
450
550
Jan-17 Feb-17 Mar-17 Apr-17 May-17 Jun-17 Jul-17
(USD/MT)
Source: Bloomberg, Ventura Research
Cold Rolled Coil China YoY
350
400
450
500
550
600
650
FY13 FY14 FY15 FY16 FY17 YTD FY18
(USD/MT)
Source: Bloomberg, Ventura Research
Cold Rolled Coil China MoM
400
420
440
460
480
500
520
540
560
580
600
Jan-17 Feb-17 Mar-17 Apr-17 May-17 Jun-17 Jul-17
(USD/MT)
Source: Bloomberg, Ventura Research
- 11 of 34- Tuesday 1st August, 2017
This document is for private circulation, and must be read in conjunction with the disclaimer on the last page.
Coking coal Australia YoY
60
80
100
120
140
160
180
FY13 FY14 FY15 FY16 FY17 YTD FY18
(USD/MT)
Source: Steel Mint, Ventura Research
Coking coal Australia MoM
100
120
140
160
180
200
220
240
Jan-17 Feb-17 Mar-17 Apr-17 May-17 Jun-17 Jul-17
(USD/MT)
Source: Steel Mint, Ventura Research
Coking coal USA YoY
80
100
120
140
160
180
200
FY13 FY14 FY15 FY16 FY17 YTD FY18
(USD/MT)
Source: Steel Mint, Ventura Research
Coking coal USA MoM
125
145
165
185
205
225
245
Jan-17 Feb-17 Mar-17 Apr-17 May-17 Jun-17 Jul-17
(USD/MT)
Source: Steel Mint, Ventura Research
- 12 of 34- Tuesday 1st August, 2017
This document is for private circulation, and must be read in conjunction with the disclaimer on the last page.
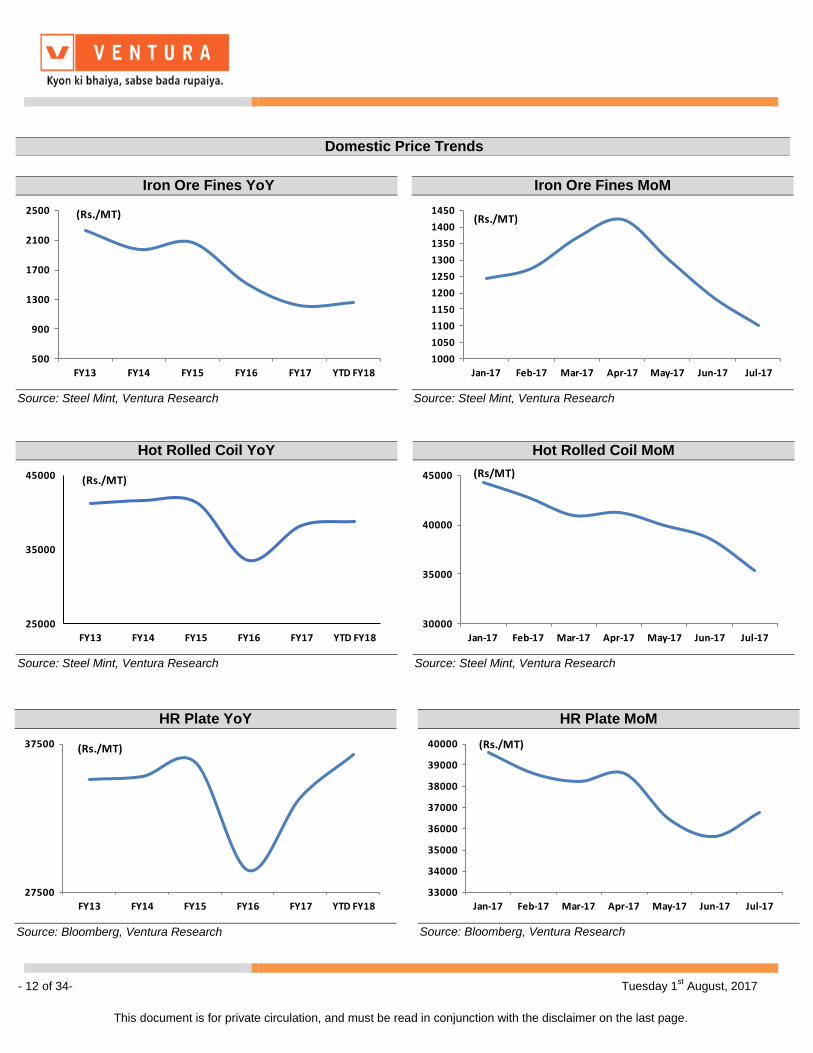
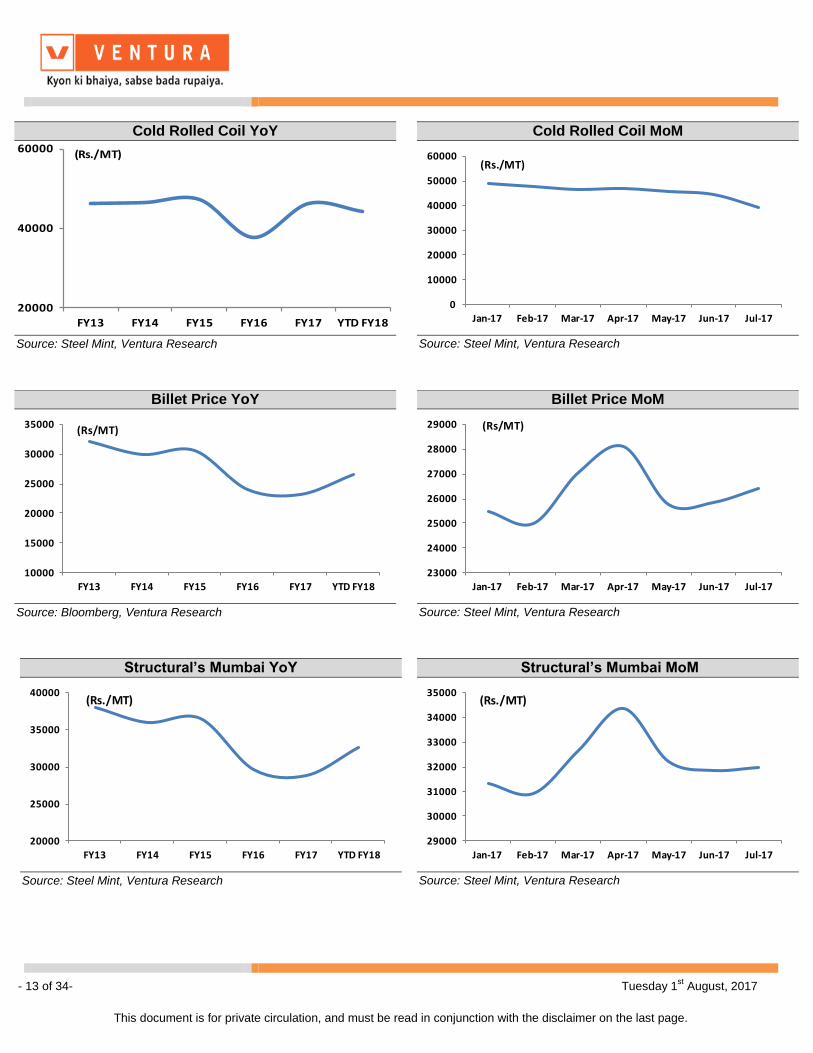
Domestic Price Trends
Iron Ore Fines YoY
500
900
1300
1700
2100
2500
FY13 FY14 FY15 FY16 FY17 YTD FY18
(Rs./MT)
Source: Steel Mint, Ventura Research
Iron Ore Fines MoM
1000
1050
1100
1150
1200
1250
1300
1350
1400
1450
Jan-17 Feb-17 Mar-17 Apr-17 May-17 Jun-17 Jul-17
(Rs./MT)
Source: Steel Mint, Ventura Research
Hot Rolled Coil YoY
25000
35000
45000
FY13 FY14 FY15 FY16 FY17 YTD FY18
(Rs./MT)
Source: Steel Mint, Ventura Research
Hot Rolled Coil MoM
30000
35000
40000
45000
Jan-17 Feb-17 Mar-17 Apr-17 May-17 Jun-17 Jul-17
(Rs/MT)
Source: Steel Mint, Ventura Research
HR Plate YoY
27500
37500
FY13 FY14 FY15 FY16 FY17 YTD FY18
(Rs./MT)
Source: Bloomberg, Ventura Research
HR Plate MoM
33000
34000
35000
36000
37000
38000
39000
40000
Jan-17 Feb-17 Mar-17 Apr-17 May-17 Jun-17 Jul-17
(Rs./MT)
Source: Bloomberg, Ventura Research
- 13 of 34- Tuesday 1st August, 2017
This document is for private circulation, and must be read in conjunction with the disclaimer on the last page.
Cold Rolled Coil YoY
20000
40000
60000
FY13 FY14 FY15 FY16 FY17 YTD FY18
(Rs./MT)
Source: Steel Mint, Ventura Research
Billet Price YoY
10000
15000
20000
25000
30000
35000
FY13 FY14 FY15 FY16 FY17 YTD FY18
(Rs/MT)
Source: Bloomberg, Ventura Research
Structural’s Mumbai YoY
20000
25000
30000
35000
40000
FY13 FY14 FY15 FY16 FY17 YTD FY18
(Rs./MT)
Source: Steel Mint, Ventura Research
Cold Rolled Coil MoM
0
10000
20000
30000
40000
50000
60000
Jan-17 Feb-17 Mar-17 Apr-17 May-17 Jun-17 Jul-17
(Rs./MT)
Source: Steel Mint, Ventura Research
Billet Price MoM
23000
24000
25000
26000
27000
28000
29000
Jan-17 Feb-17 Mar-17 Apr-17 May-17 Jun-17 Jul-17
(Rs/MT)
Source: Steel Mint, Ventura Research
Structural’s Mumbai MoM
29000
30000
31000
32000
33000
34000
35000
Jan-17 Feb-17 Mar-17 Apr-17 May-17 Jun-17 Jul-17
(Rs./MT)
Source: Steel Mint, Ventura Research
- 14 of 34- Tuesday 1st August, 2017
This document is for private circulation, and must be read in conjunction with the disclaimer on the last page.
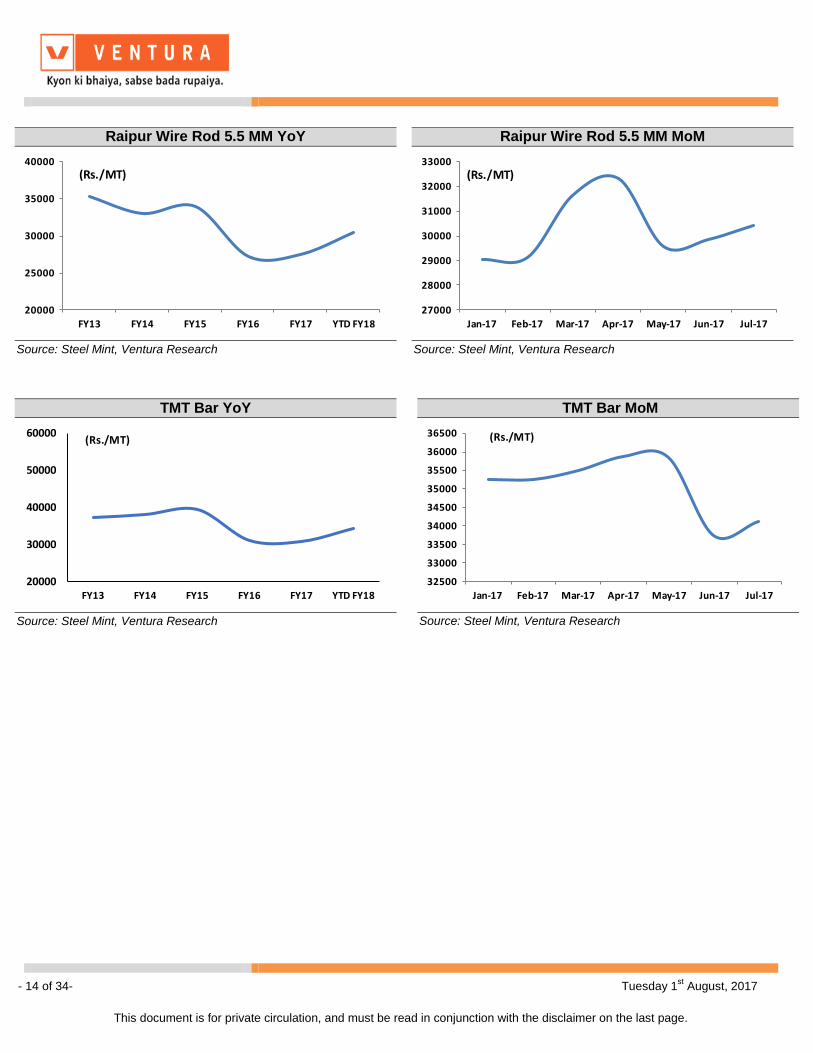
Raipur Wire Rod 5.5 MM YoY
20000
25000
30000
35000
40000
FY13 FY14 FY15 FY16 FY17 YTD FY18
(Rs./MT)
Source: Steel Mint, Ventura Research
TMT Bar YoY
20000
30000
40000
50000
60000
FY13 FY14 FY15 FY16 FY17 YTD FY18
(Rs./MT)
Source: Steel Mint, Ventura Research
Raipur Wire Rod 5.5 MM MoM
27000
28000
29000
30000
31000
32000
33000
Jan-17 Feb-17 Mar-17 Apr-17 May-17 Jun-17 Jul-17
(Rs./MT)
Source: Steel Mint, Ventura Research
TMT Bar MoM
32500
33000
33500
34000
34500
35000
35500
36000
36500
Jan-17 Feb-17 Mar-17 Apr-17 May-17 Jun-17 Jul-17
(Rs./MT)
Source: Steel Mint, Ventura Research
- 15 of 34- Tuesday 1st August, 2017
This document is for private circulation, and must be read in conjunction with the disclaimer on the last page.
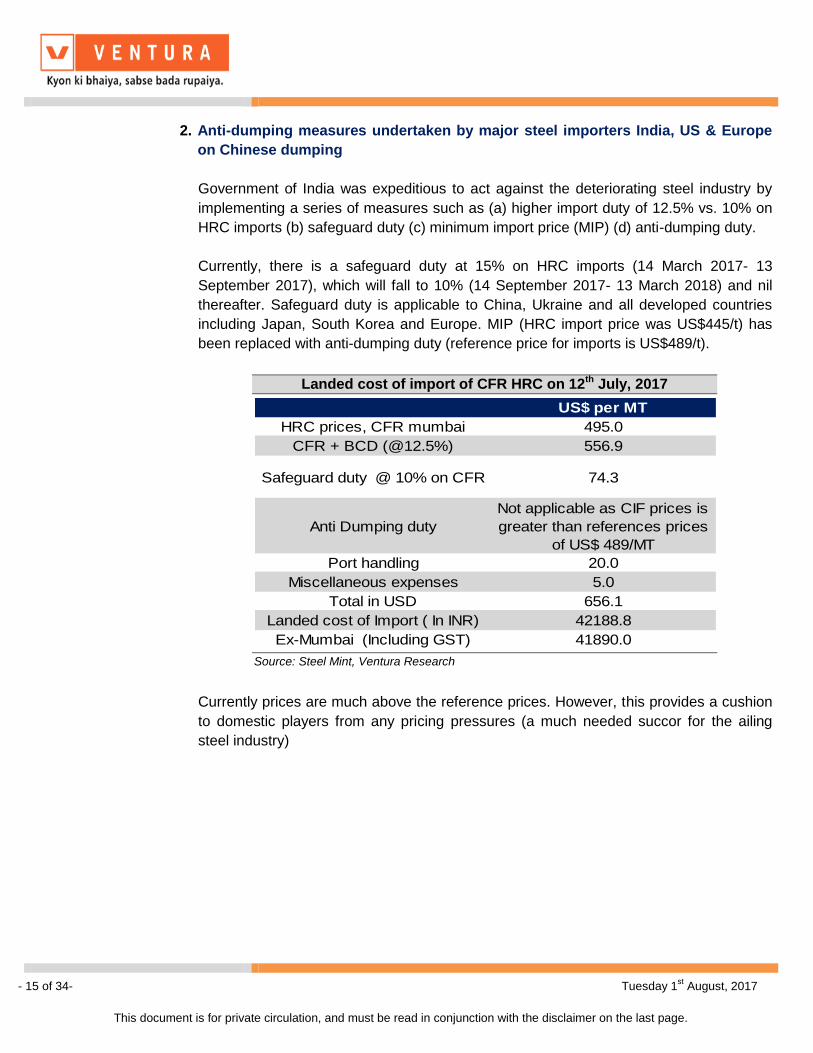
2. Anti-dumping measures undertaken by major steel importers India, US & Europe
on Chinese dumping
Government of India was expeditious to act against the deteriorating steel industry by
implementing a series of measures such as (a) higher import duty of 12.5% vs. 10% on
HRC imports (b) safeguard duty (c) minimum import price (MIP) (d) anti-dumping duty.
Currently, there is a safeguard duty at 15% on HRC imports (14 March 2017- 13
September 2017), which will fall to 10% (14 September 2017- 13 March 2018) and nil
thereafter. Safeguard duty is applicable to China, Ukraine and all developed countries
including Japan, South Korea and Europe. MIP (HRC import price was US$445/t) has
been replaced with anti-dumping duty (reference price for imports is US$489/t).
Currently prices are much above the reference prices. However, this provides a cushion
to domestic players from any pricing pressures (a much needed succor for the ailing
steel industry)
Landed cost of import of CFR HRC on 12th July, 2017
US$ per MT
HRC prices, CFR mumbai 495.0
CFR + BCD (@12.5%) 556.9
Safeguard duty @ 10% on CFR 74.3
Anti Dumping duty
Not applicable as CIF prices is
greater than references prices
of US$ 489/MT
Port handling 20.0
Miscellaneous expenses 5.0
Total in USD 656.1
Landed cost of Import ( In INR) 42188.8
Ex-Mumbai (Including GST) 41890.0
Source: Steel Mint, Ventura Research
- 16 of 34- Tuesday 1st August, 2017
This document is for private circulation, and must be read in conjunction with the disclaimer on the last page.
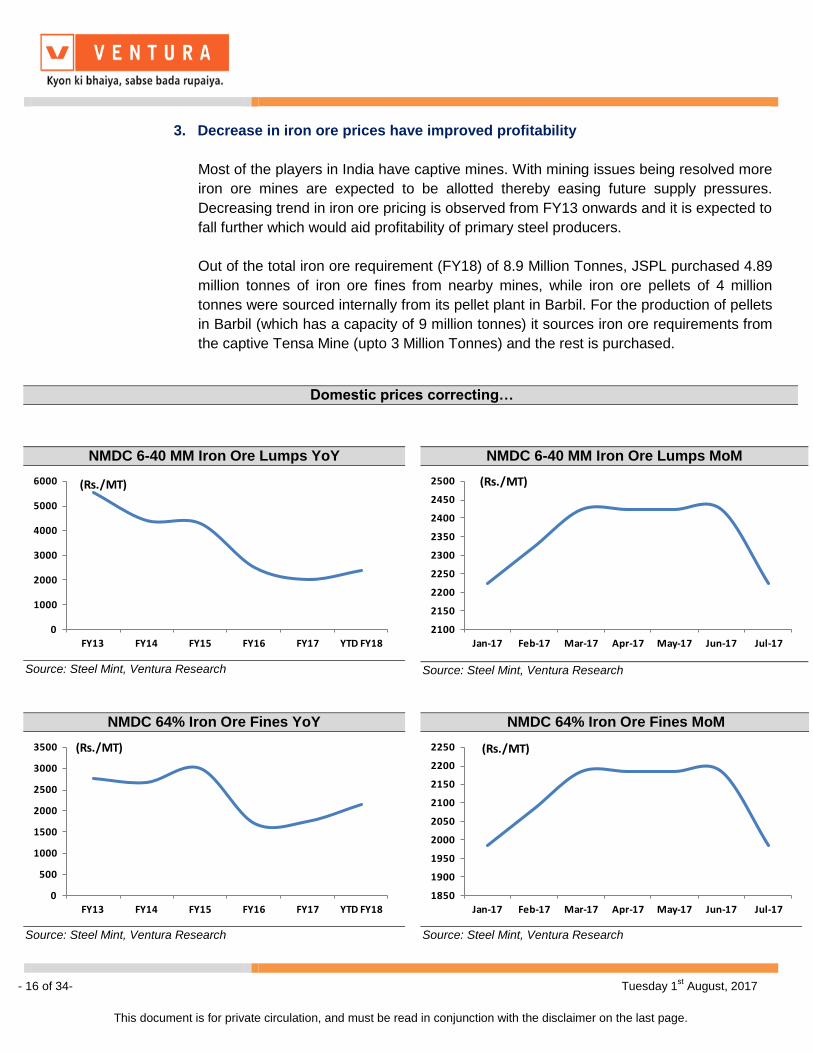
3. Decrease in iron ore prices have improved profitability
Most of the players in India have captive mines. With mining issues being resolved more
iron ore mines are expected to be allotted thereby easing future supply pressures.
Decreasing trend in iron ore pricing is observed from FY13 onwards and it is expected to
fall further which would aid profitability of primary steel producers.
Out of the total iron ore requirement (FY18) of 8.9 Million Tonnes, JSPL purchased 4.89
million tonnes of iron ore fines from nearby mines, while iron ore pellets of 4 million
tonnes were sourced internally from its pellet plant in Barbil. For the production of pellets
in Barbil (which has a capacity of 9 million tonnes) it sources iron ore requirements from
the captive Tensa Mine (upto 3 Million Tonnes) and the rest is purchased.
NMDC 6-40 MM Iron Ore Lumps YoY
0
1000
2000
3000
4000
5000
6000
FY13 FY14 FY15 FY16 FY17 YTD FY18
(Rs./MT)
Source: Steel Mint, Ventura Research
NMDC 6-40 MM Iron Ore Lumps MoM
2100
2150
2200
2250
2300
2350
2400
2450
2500
Jan-17 Feb-17 Mar-17 Apr-17 May-17 Jun-17 Jul-17
(Rs./MT)
Source: Steel Mint, Ventura Research
NMDC 64% Iron Ore Fines YoY
0
500
1000
1500
2000
2500
3000
3500
FY13 FY14 FY15 FY16 FY17 YTD FY18
(Rs./MT)
Source: Steel Mint, Ventura Research
NMDC 64% Iron Ore Fines MoM
1850
1900
1950
2000
2050
2100
2150
2200
2250
Jan-17 Feb-17 Mar-17 Apr-17 May-17 Jun-17 Jul-17
(Rs./MT)
Source: Steel Mint, Ventura Research
Domestic prices correcting…
- 17 of 34- Tuesday 1st August, 2017
This document is for private circulation, and must be read in conjunction with the disclaimer on the last page.
China Iron Ore 62% Fines YoY
0
20
40
60
80
100
120
140
FY13 FY14 FY15 FY16 FY17 YTD FY18
(USD/MT)
Source: Bloomberg, Ventura Research
China Iron Ore 62% Fines MoM
0
20
40
60
80
100
Jan-17 Feb-17 Mar-17 Apr-17 May-17 Jun-17 Jul-17
(USD/MT)
Source: Bloomberg, Ventura Research
Brazil Iron Ore 65% Fines YoY
0
20
40
60
80
100
120
140
160
FY13 FY14 FY15 FY16 FY17 YTD FY18
(USD/MT)
Source: Steel Mint, Ventura Research
Brazil Iron Ore 65% Fines MoM
0
20
40
60
80
100
Jan-17 Feb-17 Mar-17 Apr-17 May-17 Jun-17 Jul-17
(USD/MT)
Source: Steel Mint, Ventura Research
Australia Iron 61.5% Fines YoY
0
20
40
60
80
100
120
140
FY13 FY14 FY15 FY16 FY17 YTD FY18
(USD/MT)
Source: Steel Mint, Ventura Research
Australia Iron Ore 61.5% Fines MoM
0
10
20
30
40
50
60
70
80
90
Jan-17 Feb-17 Mar-17 Apr-17 May-17 Jun-17 Jul-17
(USD/MT)
Source: Steel Mint, Ventura Research
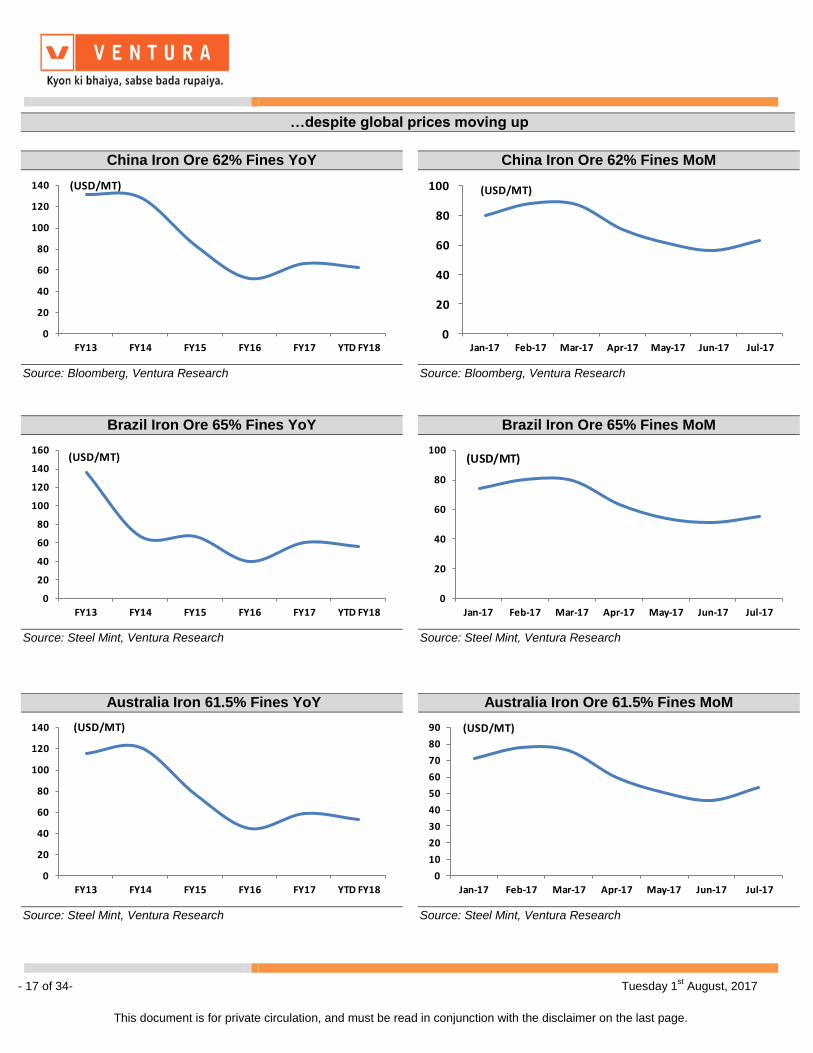
…despite global prices moving up
- 18 of 34- Tuesday 1st August, 2017
This document is for private circulation, and must be read in conjunction with the disclaimer on the last page.
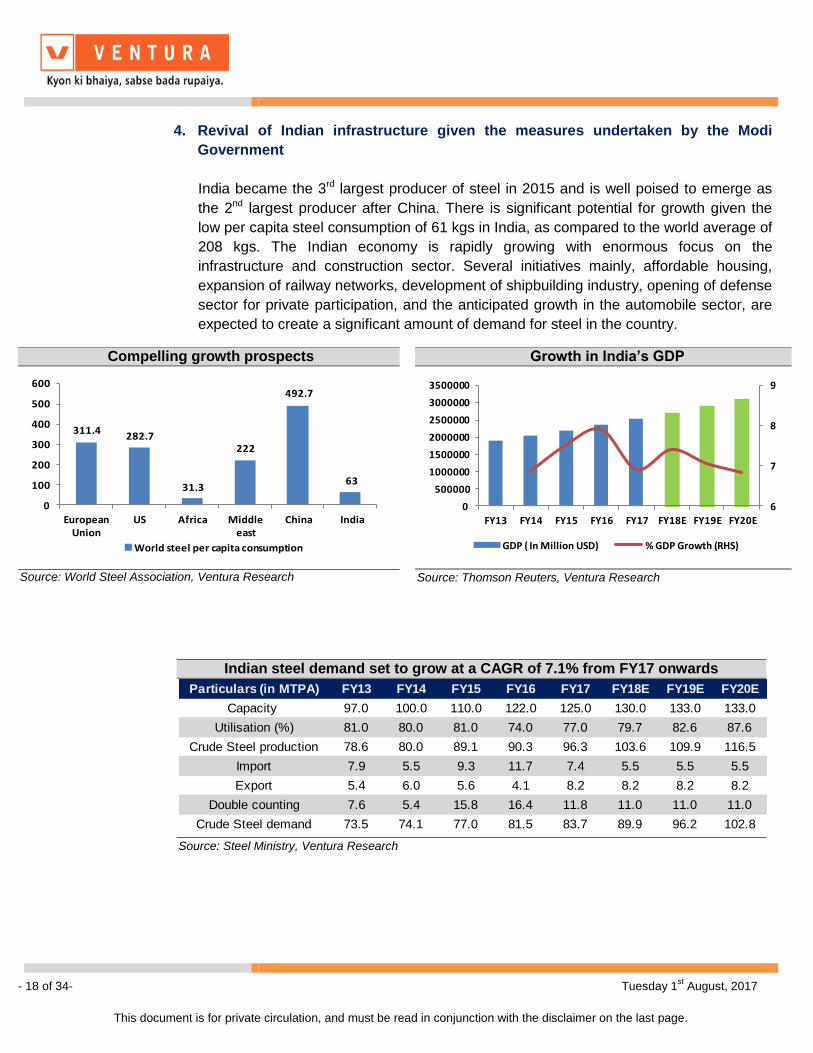
4. Revival of Indian infrastructure given the measures undertaken by the Modi
Government
India became the 3rd largest producer of steel in 2015 and is well poised to emerge as
the 2nd largest producer after China. There is significant potential for growth given the
low per capita steel consumption of 61 kgs in India, as compared to the world average of
208 kgs. The Indian economy is rapidly growing with enormous focus on the
infrastructure and construction sector. Several initiatives mainly, affordable housing,
expansion of railway networks, development of shipbuilding industry, opening of defense
sector for private participation, and the anticipated growth in the automobile sector, are
expected to create a significant amount of demand for steel in the country.
Indian steel demand set to grow at a CAGR of 7.1% from FY17 onwards
Particulars (in MTPA) FY13 FY14 FY15 FY16 FY17 FY18E FY19E FY20E
Capacity 97.0 100.0 110.0 122.0 125.0 130.0 133.0 133.0
Utilisation (%) 81.0 80.0 81.0 74.0 77.0 79.7 82.6 87.6
Crude Steel production 78.6 80.0 89.1 90.3 96.3 103.6 109.9 116.5
Import 7.9 5.5 9.3 11.7 7.4 5.5 5.5 5.5
Export 5.4 6.0 5.6 4.1 8.2 8.2 8.2 8.2
Double counting 7.6 5.4 15.8 16.4 11.8 11.0 11.0 11.0
Crude Steel demand 73.5 74.1 77.0 81.5 83.7 89.9 96.2 102.8
Source: Steel Ministry, Ventura Research
Compelling growth prospects
311.4282.7
31.3
222
492.7
63
0
100
200
300
400
500
600
European Union
US Africa Middle east
China India
World steel per capita consumption
Source: World Steel Association, Ventura Research
Growth in India’s GDP
6
7
8
9
0
500000
1000000
1500000
2000000
2500000
3000000
3500000
FY13 FY14 FY15 FY16 FY17 FY18E FY19E FY20E
GDP ( In Million USD) % GDP Growth (RHS)
Source: Thomson Reuters, Ventura Research
- 19 of 34- Tuesday 1st August, 2017
This document is for private circulation, and must be read in conjunction with the disclaimer on the last page.
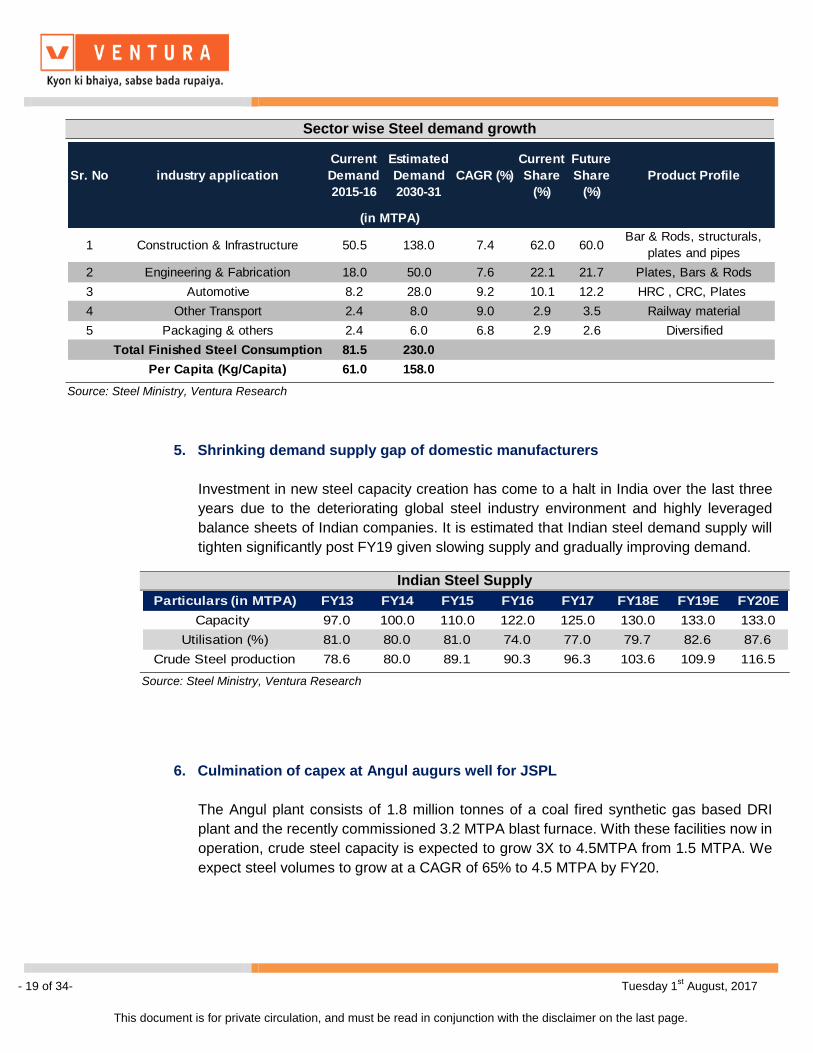
5. Shrinking demand supply gap of domestic manufacturers
Investment in new steel capacity creation has come to a halt in India over the last three
years due to the deteriorating global steel industry environment and highly leveraged
balance sheets of Indian companies. It is estimated that Indian steel demand supply will
tighten significantly post FY19 given slowing supply and gradually improving demand.
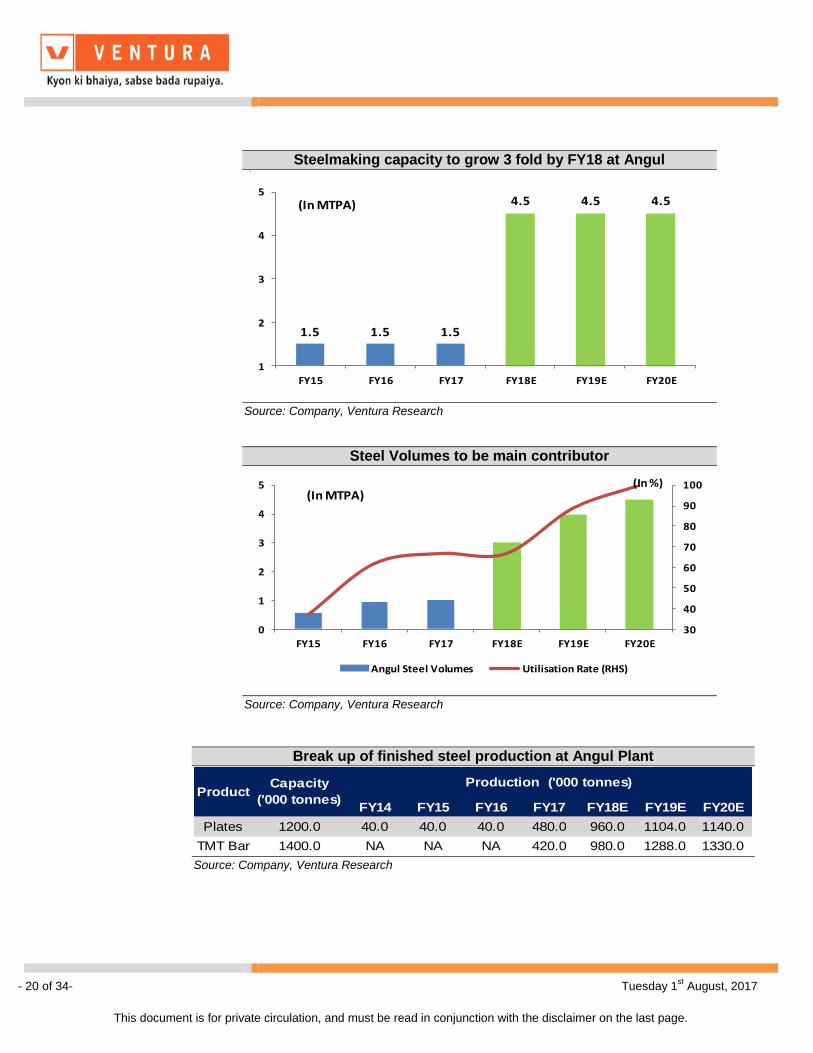
6. Culmination of capex at Angul augurs well for JSPL
The Angul plant consists of 1.8 million tonnes of a coal fired synthetic gas based DRI
plant and the recently commissioned 3.2 MTPA blast furnace. With these facilities now in
operation, crude steel capacity is expected to grow 3X to 4.5MTPA from 1.5 MTPA. We
expect steel volumes to grow at a CAGR of 65% to 4.5 MTPA by FY20.
Sector wise Steel demand growth
Sr. No. industry application
Current
Demand
2015-16
Estimated
Demand
2030-31
CAGR (%)
Current
Share
(%)
Future
Share
(%)
1 Construction & Infrastructure 50.5 138.0 7.4 62.0 60.0
2 Engineering & Fabrication 18.0 50.0 7.6 22.1 21.7
3 Automotive 8.2 28.0 9.2 10.1 12.2
4 Other Transport 2.4 8.0 9.0 2.9 3.5
5 Packaging & others 2.4 6.0 6.8 2.9 2.6
Total Finished Steel Consumption 81.5 230.0
Per Capita (Kg/Capita) 61.0 158.0
(in MTPA)
Railway material
Diversified
Product Profile
Bar & Rods, structurals,
plates and pipes
Plates, Bars & Rods
HRC , CRC, Plates
Source: Steel Ministry, Ventura Research
Indian Steel Supply
Particulars (in MTPA) FY13 FY14 FY15 FY16 FY17 FY18E FY19E FY20E
Capacity 97.0 100.0 110.0 122.0 125.0 130.0 133.0 133.0
Utilisation (%) 81.0 80.0 81.0 74.0 77.0 79.7 82.6 87.6
Crude Steel production 78.6 80.0 89.1 90.3 96.3 103.6 109.9 116.5
Source: Steel Ministry, Ventura Research
- 20 of 34- Tuesday 1st August, 2017
This document is for private circulation, and must be read in conjunction with the disclaimer on the last page.
Break up of finished steel production at Angul Plant
FY14 FY15 FY16 FY17 FY18E FY19E FY20E
Plates 1200.0 40.0 40.0 40.0 480.0 960.0 1104.0 1140.0
TMT Bar 1400.0 NA NA NA 420.0 980.0 1288.0 1330.0
Production ('000 tonnes)Capacity
('000 tonnes)Product
Source: Company, Ventura Research
Steel Volumes to be main contributor
30
40
50
60
70
80
90
100
0
1
2
3
4
5
FY15 FY16 FY17 FY18E FY19E FY20E
Angul Steel Volumes Utilisation Rate (RHS)
(In MTPA)(In %)
Source: Company, Ventura Research
Steelmaking capacity to grow 3 fold by FY18 at Angul v
1.5 1.5 1.5
4.5 4.5 4.5
1
2
3
4
5
FY15 FY16 FY17 FY18E FY19E FY20E
(In MTPA)
Source: Company, Ventura Research
- 21 of 34- Tuesday 1st August, 2017
This document is for private circulation, and must be read in conjunction with the disclaimer on the last page.
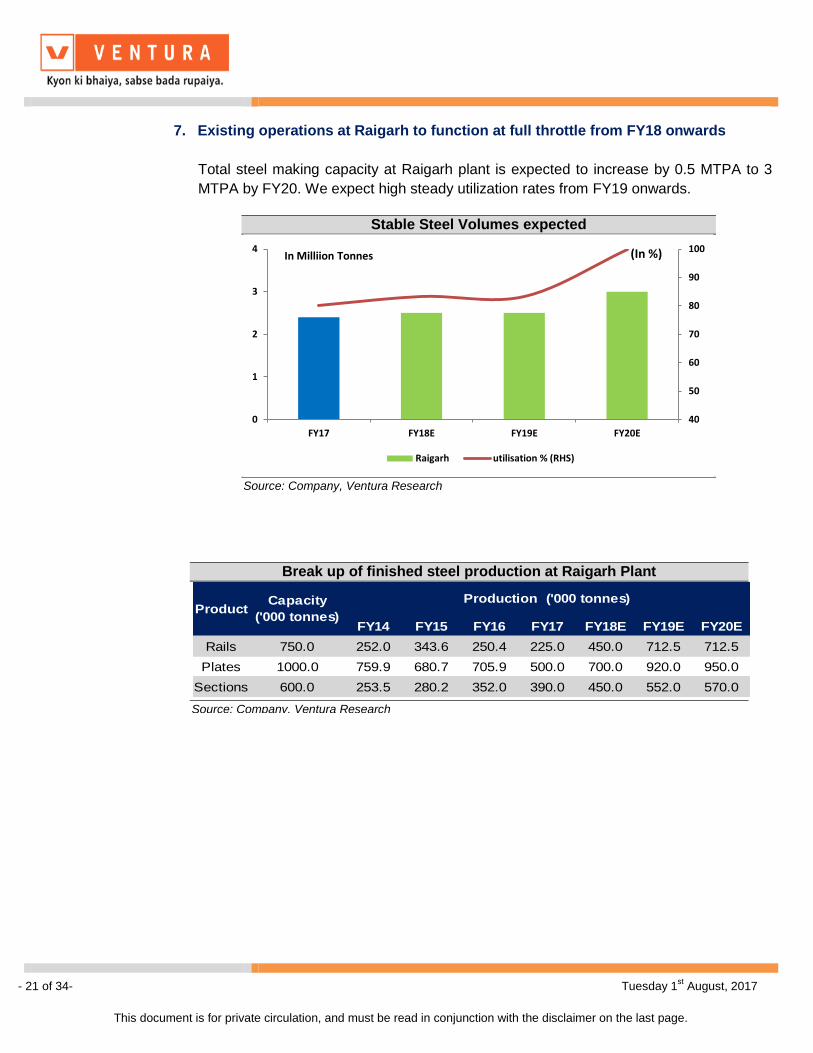
7. Existing operations at Raigarh to function at full throttle from FY18 onwards
Total steel making capacity at Raigarh plant is expected to increase by 0.5 MTPA to 3
MTPA by FY20. We expect high steady utilization rates from FY19 onwards.
Break up of finished steel production at Raigarh Plant
FY14 FY15 FY16 FY17 FY18E FY19E FY20E
Rails 750.0 252.0 343.6 250.4 225.0 450.0 712.5 712.5
Plates 1000.0 759.9 680.7 705.9 500.0 700.0 920.0 950.0
Sections 600.0 253.5 280.2 352.0 390.0 450.0 552.0 570.0
Production ('000 tonnes)Product
Capacity
('000 tonnes)
Source: Company, Ventura Research
Stable Steel Volumes expected
Source: Company, Ventura Research
40
50
60
70
80
90
100
0
1
2
3
4
FY17 FY18E FY19E FY20E
Raigarh utilisation % (RHS)
In Milliion Tonnes (In %)
- 22 of 34- Tuesday 1st August, 2017
This document is for private circulation, and must be read in conjunction with the disclaimer on the last page.
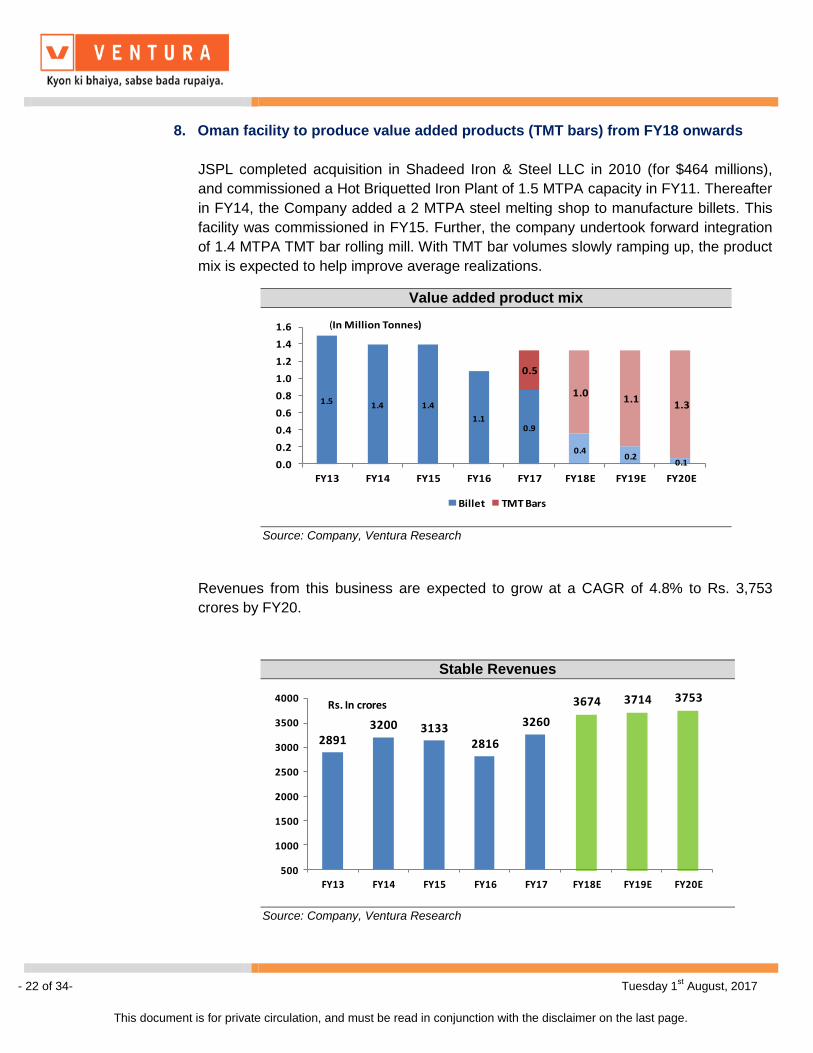
8. Oman facility to produce value added products (TMT bars) from FY18 onwards
JSPL completed acquisition in Shadeed Iron & Steel LLC in 2010 (for $464 millions),
and commissioned a Hot Briquetted Iron Plant of 1.5 MTPA capacity in FY11. Thereafter
in FY14, the Company added a 2 MTPA steel melting shop to manufacture billets. This
facility was commissioned in FY15. Further, the company undertook forward integration
of 1.4 MTPA TMT bar rolling mill. With TMT bar volumes slowly ramping up, the product
mix is expected to help improve average realizations.
Revenues from this business are expected to grow at a CAGR of 4.8% to Rs. 3,753
crores by FY20.
Value added product mix
1.5 1.4 1.4
1.10.9
0.40.2
0.1
0.5
1.01.1
1.3
0.0
0.2
0.4
0.6
0.8
1.0
1.2
1.4
1.6
FY13 FY14 FY15 FY16 FY17 FY18E FY19E FY20E
Billet TMT Bars
(In Million Tonnes)
Source: Company, Ventura Research
Stable Revenues
28913200 3133
2816
3260
3674 3714 3753
500
1000
1500
2000
2500
3000
3500
4000
FY13 FY14 FY15 FY16 FY17 FY18E FY19E FY20E
Rs. In crores
Source: Company, Ventura Research
- 23 of 34- Tuesday 1st August, 2017
This document is for private circulation, and must be read in conjunction with the disclaimer on the last page.
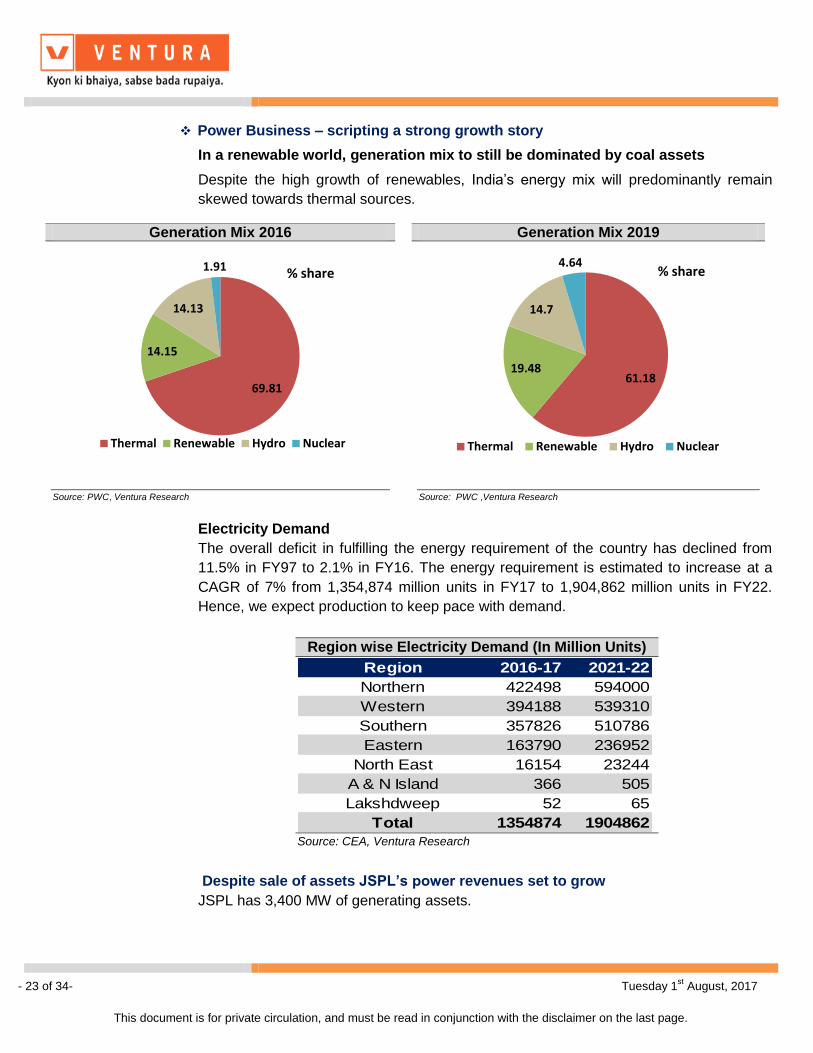
Power Business – scripting a strong growth story
In a renewable world, generation mix to still be dominated by coal assets
Despite the high growth of renewables, India’s energy mix will predominantly remain
skewed towards thermal sources.
Electricity Demand
The overall deficit in fulfilling the energy requirement of the country has declined from
11.5% in FY97 to 2.1% in FY16. The energy requirement is estimated to increase at a
CAGR of 7% from 1,354,874 million units in FY17 to 1,904,862 million units in FY22.
Hence, we expect production to keep pace with demand.
Despite sale of assets JSPL’s power revenues set to grow
JSPL has 3,400 MW of generating assets.
Generation Mix 2016 Generation Mix 2019
Source: PWC, Ventura Research
Source: PWC ,Ventura Research
69.81
14.15
14.13
1.91
Thermal Renewable Hydro Nuclear
% share
61.18 19.48
14.7
4.64
Thermal Renewable Hydro Nuclear
% share
Region wise Electricity Demand (In Million Units)
Region 2016-17 2021-22
Northern 422498 594000
Western 394188 539310
Southern 357826 510786
Eastern 163790 236952
North East 16154 23244
A & N Island 366 505
Lakshdweep 52 65
Total 1354874 1904862
Source: CEA, Ventura Research

- 24 of 34- Tuesday 1st August, 2017
This document is for private circulation, and must be read in conjunction with the disclaimer on the last page.
However, to deleverage its balance sheet and improve liquidity, it concluded a binding
agreement for the sale of a thermal power plant worth Rs. 4,000 crores (1,000 MW plant
located at Tamnar, Chhattisgarh). This deal has two options:
Option 1: Sale of asset without Fuel Source Agreement (FSA) for Rs. 4,000 crores
Option 2: Sale of asset with FSA for Rs. 6,500 crores
This deal is expected to conclude in H1FY19. In our model we have assumed option 1
for cash flow consideration. This would mean in case of option 2, there would be an
upside risk to our EPS estimates by ~ Rs. 9.8 per share in FY19.
After the asset sale JSPL will be left with a portfolio of 2,400 MW of thermal power. We
expect the revenues to grow at a CAGR of 17.5% to Rs. 5,063 crores by FY20. We
expect the overall portfolio PLF to improve to 70% from the current 35%. We expect
EBIDTA to grow at a CAGR of 20% to Rs. 1,814 crores by FY20.
Sold to JSW energy
Details of Power purchase agreements
Project Buyer Period Quantity (MW) FSA
Tamnar I Tamil Nadu Sep 2014 to Aug 17 400 r
Tamnar IITamil Nadu Feb 2014 to Sep 2028 400 a
Tamnar IIKarnataka Jun 2016 to May 4041 200 a
Tamnar IIKarnataka Oct 2017 to Sep 2042 150 a
Tamnar IIChattisgarh From start of commercial operation 60 a
Tamnar IIChattisgarh From start of commercial operation 60 r
Total 870
Source: Company, Ventura Research
Capacity reduction with stable utilizations
Source: Company, Ventura Research
0
20
40
60
80
100
120
0
500
1000
1500
2000
2500
3000
3500
4000
FY13 FY14 FY15 FY16 FY17 FY18E FY19E FY20E
Capacity Overall PLF % (RHS)
In MW Decline in capacity post sale of Tanmar I
Stable revenue from long term PPA’s
Source: Company, Ventura Research
2.7
2.8
2.9
3.0
3.1
3.2
3.3
3.4
3.5
0
1000
2000
3000
4000
5000
6000
FY13 FY14 FY15 FY16 FY17 FY18E FY19E FY20E
Revenue Gross realisation Per unit
In Rs. Crores
Power generation portfolio
Tamnar I (2 unitsx250 MW) 1000 MW
Tamnar II (4 units x600 MW)2400 MW
Total 3400 MW
Source: Company, Ventura Research
Sold to JSW energy
- 25 of 34- Tuesday 1st August, 2017
This document is for private circulation, and must be read in conjunction with the disclaimer on the last page.
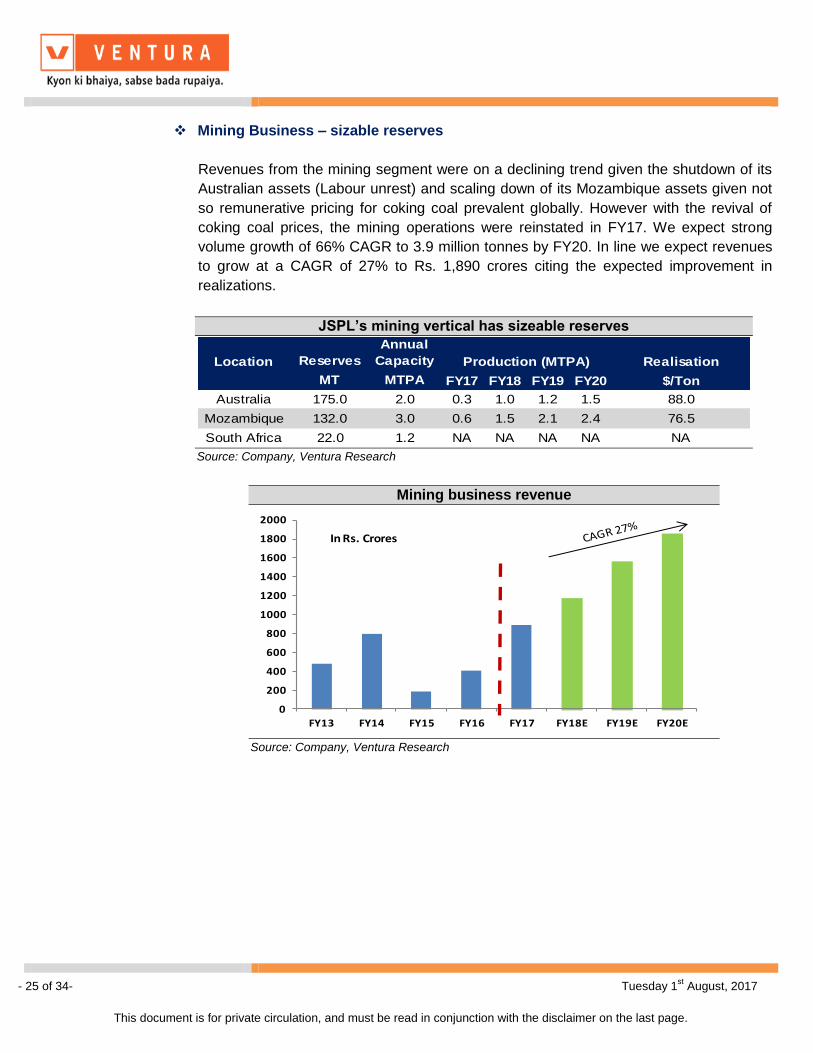
Mining Business – sizable reserves
Revenues from the mining segment were on a declining trend given the shutdown of its
Australian assets (Labour unrest) and scaling down of its Mozambique assets given not
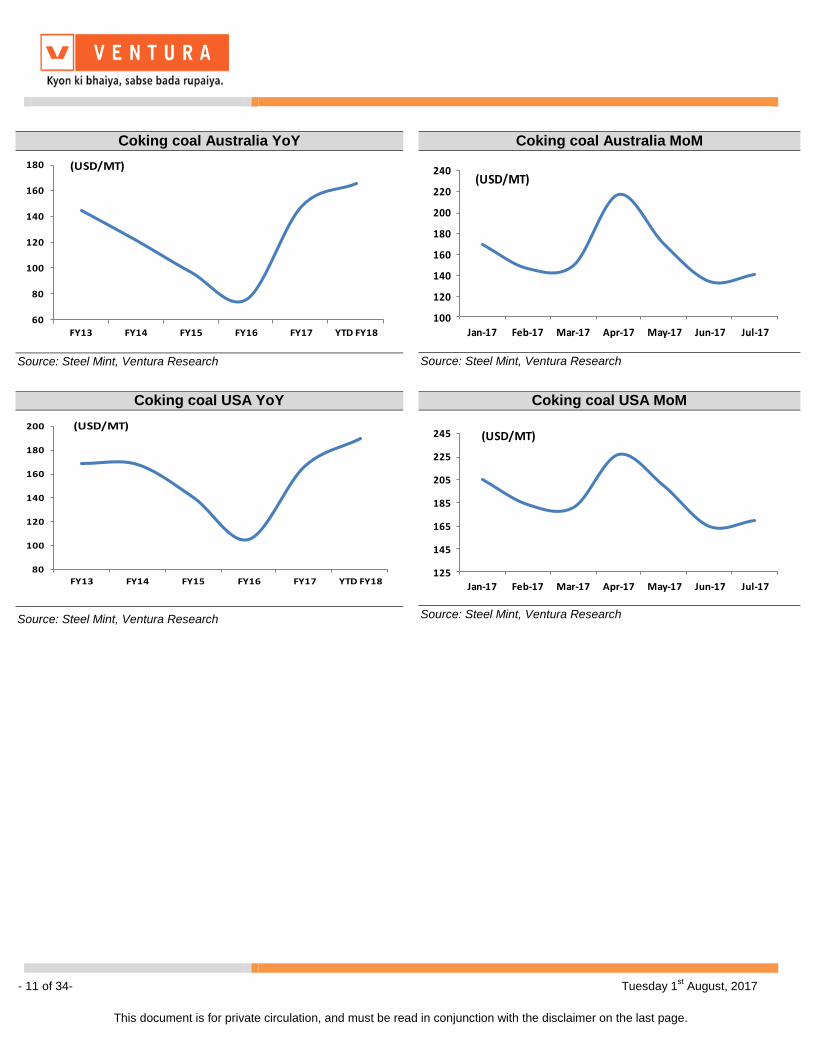
so remunerative pricing for coking coal prevalent globally. However with the revival of
coking coal prices, the mining operations were reinstated in FY17. We expect strong
volume growth of 66% CAGR to 3.9 million tonnes by FY20. In line we expect revenues
to grow at a CAGR of 27% to Rs. 1,890 crores citing the expected improvement in
realizations.
JSPL’s mining vertical has sizeable reserves
Location Reserves
Annual
Capacity Realisation
MT MTPA FY17 FY18 FY19 FY20 $/Ton
Australia 175.0 2.0 0.3 1.0 1.2 1.5 88.0
Mozambique 132.0 3.0 0.6 1.5 2.1 2.4 76.5
South Africa 22.0 1.2 NA NA NA NA NA
Production (MTPA)
Source: Company, Ventura Research
Mining business revenue
0
200
400
600
800
1000
1200
1400
1600
1800
2000
FY13 FY14 FY15 FY16 FY17 FY18E FY19E FY20E
In Rs. Crores
Source: Company, Ventura Research
- 26 of 34- Tuesday 1st August, 2017
This document is for private circulation, and must be read in conjunction with the disclaimer on the last page.
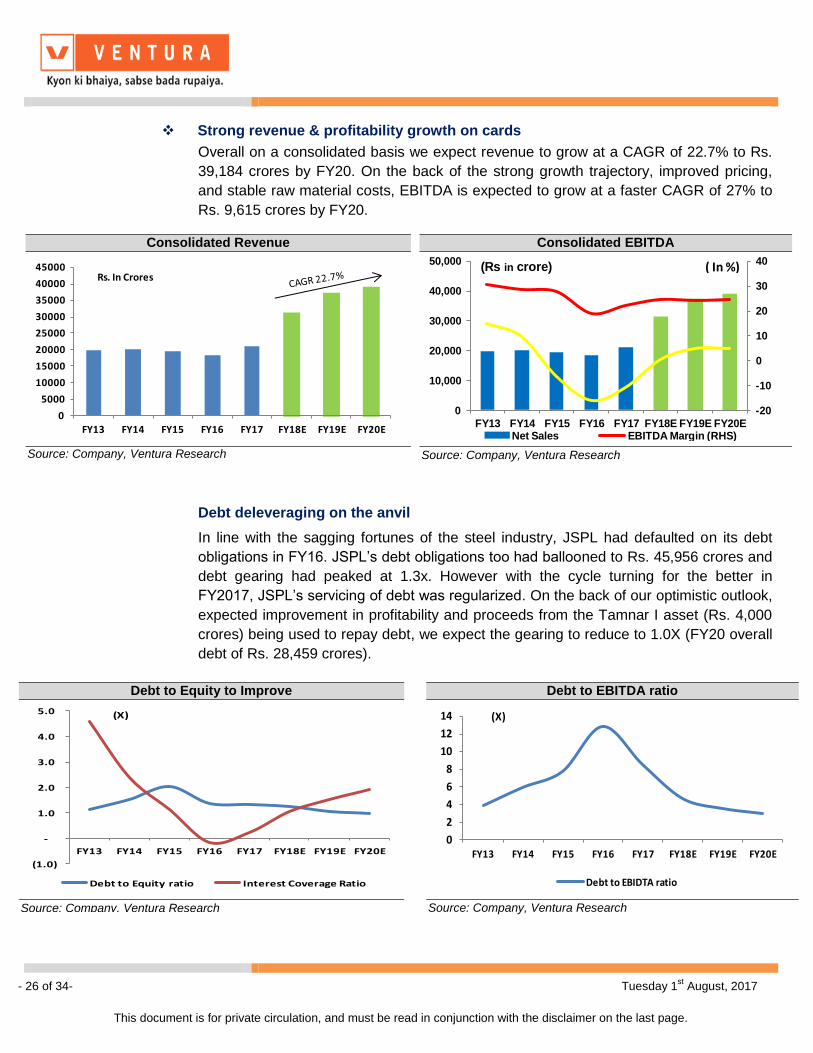
Strong revenue & profitability growth on cards
Overall on a consolidated basis we expect revenue to grow at a CAGR of 22.7% to Rs.
39,184 crores by FY20. On the back of the strong growth trajectory, improved pricing,
and stable raw material costs, EBITDA is expected to grow at a faster CAGR of 27% to
Rs. 9,615 crores by FY20.
Debt deleveraging on the anvil
In line with the sagging fortunes of the steel industry, JSPL had defaulted on its debt
obligations in FY16. JSPL’s debt obligations too had ballooned to Rs. 45,956 crores and
debt gearing had peaked at 1.3x. However with the cycle turning for the better in
FY2017, JSPL’s servicing of debt was regularized. On the back of our optimistic outlook,
expected improvement in profitability and proceeds from the Tamnar I asset (Rs. 4,000
crores) being used to repay debt, we expect the gearing to reduce to 1.0X (FY20 overall
debt of Rs. 28,459 crores).
Consolidated Revenue
0
5000
10000
15000
20000
25000
30000
35000
40000
45000
FY13 FY14 FY15 FY16 FY17 FY18E FY19E FY20E
Rs. In Crores
Source: Company, Ventura Research
Consolidated EBITDA
-20
-10
0
10
20
30
40
0
10,000
20,000
30,000
40,000
50,000
FY13 FY14 FY15 FY16 FY17 FY18E FY19E FY20ENet Sales EBITDA Margin (RHS)
(Rs in crore) ( In %)
Source: Company, Ventura Research
Debt to Equity to Improve
(1.0)
-
1.0
2.0
3.0
4.0
5.0
FY13 FY14 FY15 FY16 FY17 FY18E FY19E FY20E
Debt to Equity ratio Interest Coverage Ratio
(X)
v
Source: Company, Ventura Research
Debt to EBITDA ratio
0
2
4
6
8
10
12
14
FY13 FY14 FY15 FY16 FY17 FY18E FY19E FY20E
Debt to EBIDTA ratio
(X)
Source: Company, Ventura Research
- 27 of 34- Tuesday 1st August, 2017
This document is for private circulation, and must be read in conjunction with the disclaimer on the last page.
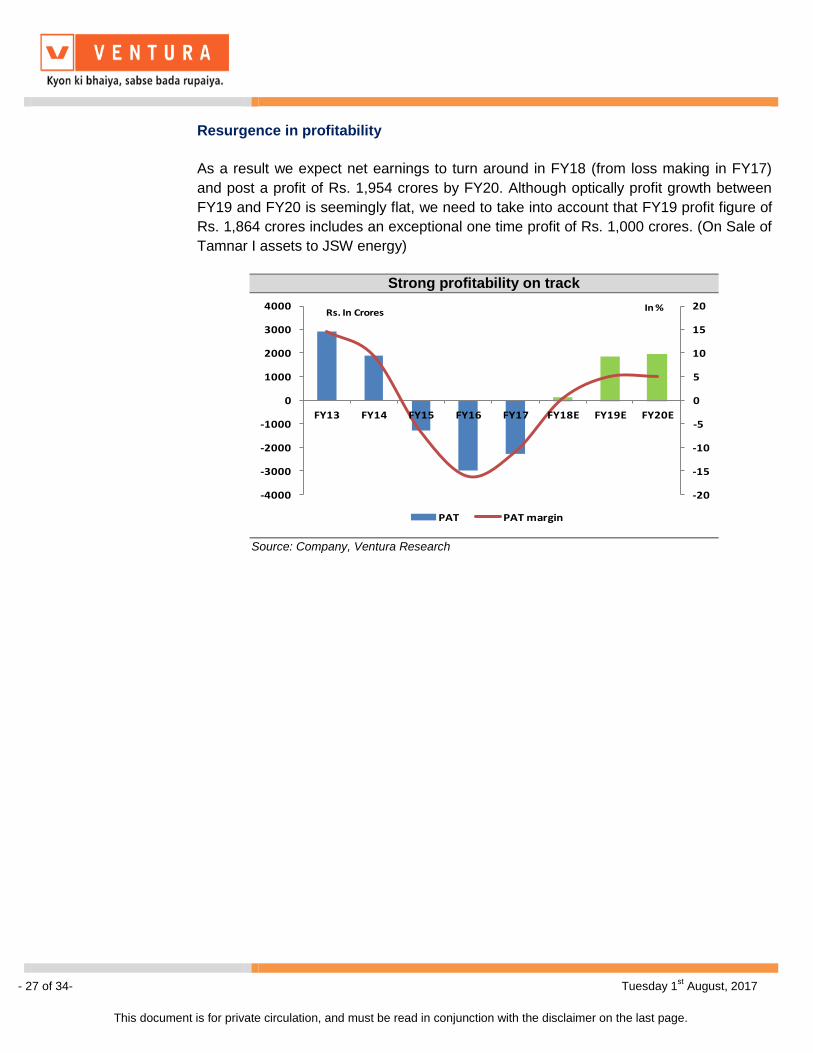
Resurgence in profitability
As a result we expect net earnings to turn around in FY18 (from loss making in FY17)
and post a profit of Rs. 1,954 crores by FY20. Although optically profit growth between
FY19 and FY20 is seemingly flat, we need to take into account that FY19 profit figure of
Rs. 1,864 crores includes an exceptional one time profit of Rs. 1,000 crores. (On Sale of
Tamnar I assets to JSW energy)
Strong profitability on track
-20
-15
-10
-5
0
5
10
15
20
-4000
-3000
-2000
-1000
0
1000
2000
3000
4000
FY13 FY14 FY15 FY16 FY17 FY18E FY19E FY20E
PAT PAT margin
Rs. In Crores In %
Source: Company, Ventura Research
- 28 of 34- Tuesday 1st August, 2017
This document is for private circulation, and must be read in conjunction with the disclaimer on the last page.
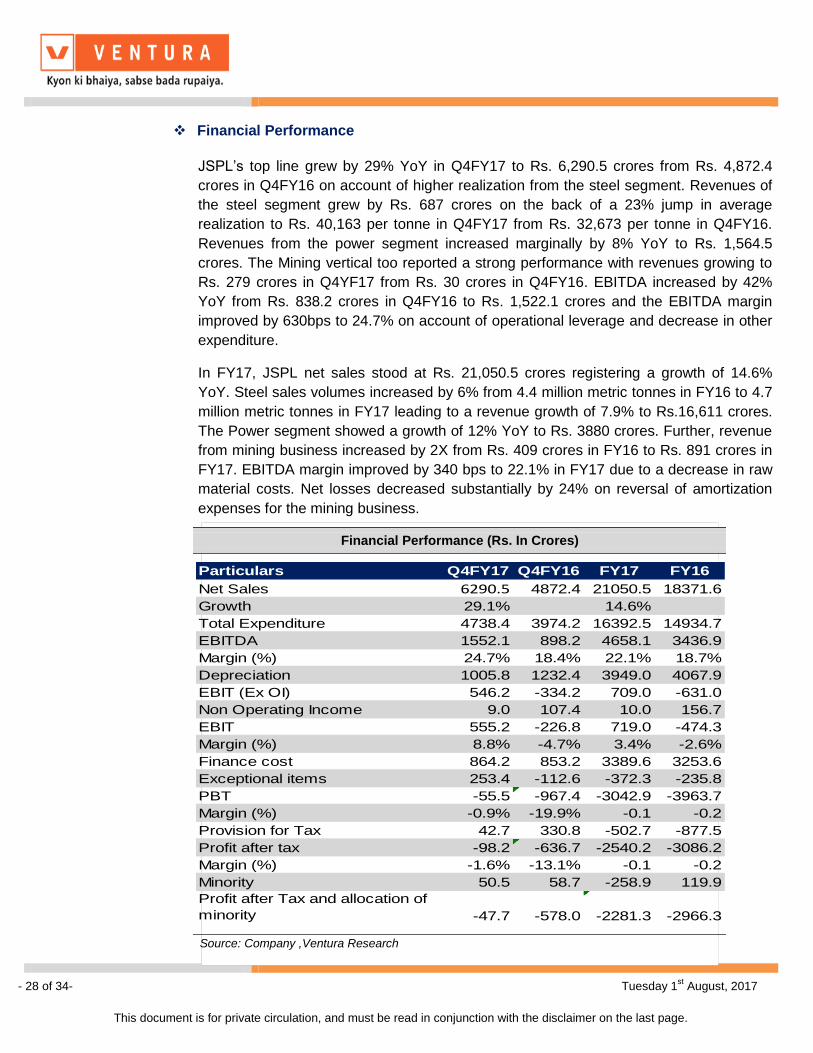
Financial Performance
JSPL’s top line grew by 29% YoY in Q4FY17 to Rs. 6,290.5 crores from Rs. 4,872.4
crores in Q4FY16 on account of higher realization from the steel segment. Revenues of
the steel segment grew by Rs. 687 crores on the back of a 23% jump in average
realization to Rs. 40,163 per tonne in Q4FY17 from Rs. 32,673 per tonne in Q4FY16.
Revenues from the power segment increased marginally by 8% YoY to Rs. 1,564.5
crores. The Mining vertical too reported a strong performance with revenues growing to
Rs. 279 crores in Q4YF17 from Rs. 30 crores in Q4FY16. EBITDA increased by 42%
YoY from Rs. 838.2 crores in Q4FY16 to Rs. 1,522.1 crores and the EBITDA margin
improved by 630bps to 24.7% on account of operational leverage and decrease in other
expenditure.
In FY17, JSPL net sales stood at Rs. 21,050.5 crores registering a growth of 14.6%
YoY. Steel sales volumes increased by 6% from 4.4 million metric tonnes in FY16 to 4.7
million metric tonnes in FY17 leading to a revenue growth of 7.9% to Rs.16,611 crores.
The Power segment showed a growth of 12% YoY to Rs. 3880 crores. Further, revenue
from mining business increased by 2X from Rs. 409 crores in FY16 to Rs. 891 crores in
FY17. EBITDA margin improved by 340 bps to 22.1% in FY17 due to a decrease in raw
material costs. Net losses decreased substantially by 24% on reversal of amortization
expenses for the mining business.
Financial Performance (Rs. In Crores)
Particulars Q4FY17 Q4FY16 FY17 FY16
Net Sales 6290.5 4872.4 21050.5 18371.6
Growth 29.1% 14.6%
Total Expenditure 4738.4 3974.2 16392.5 14934.7
EBITDA 1552.1 898.2 4658.1 3436.9
Margin (%) 24.7% 18.4% 22.1% 18.7%
Depreciation 1005.8 1232.4 3949.0 4067.9
EBIT (Ex OI) 546.2 -334.2 709.0 -631.0
Non Operating Income 9.0 107.4 10.0 156.7
EBIT 555.2 -226.8 719.0 -474.3
Margin (%) 8.8% -4.7% 3.4% -2.6%
Finance cost 864.2 853.2 3389.6 3253.6
Exceptional items 253.4 -112.6 -372.3 -235.8
PBT -55.5 -967.4 -3042.9 -3963.7
Margin (%) -0.9% -19.9% -0.1 -0.2
Provision for Tax 42.7 330.8 -502.7 -877.5
Profit after tax -98.2 -636.7 -2540.2 -3086.2
Margin (%) -1.6% -13.1% -0.1 -0.2
Minority 50.5 58.7 -258.9 119.9
Profit after Tax and allocation of
minority -47.7 -578.0 -2281.3 -2966.3
e
Source: Company ,Ventura Research
- 29 of 34- Tuesday 1st August, 2017
This document is for private circulation, and must be read in conjunction with the disclaimer on the last page.
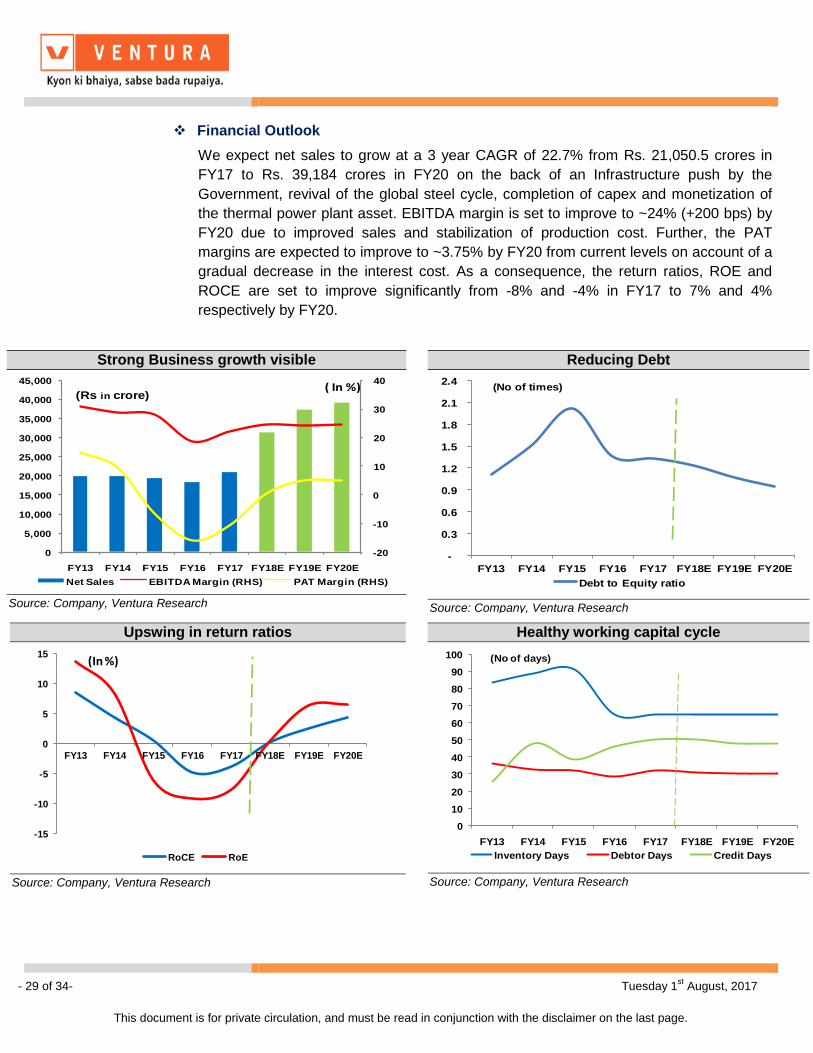
Financial Outlook
We expect net sales to grow at a 3 year CAGR of 22.7% from Rs. 21,050.5 crores in
FY17 to Rs. 39,184 crores in FY20 on the back of an Infrastructure push by the
Government, revival of the global steel cycle, completion of capex and monetization of
the thermal power plant asset. EBITDA margin is set to improve to ~24% (+200 bps) by
FY20 due to improved sales and stabilization of production cost. Further, the PAT
margins are expected to improve to ~3.75% by FY20 from current levels on account of a
gradual decrease in the interest cost. As a consequence, the return ratios, ROE and
ROCE are set to improve significantly from -8% and -4% in FY17 to 7% and 4%
respectively by FY20.
Strong Business growth visible
-20
-10
0
10
20
30
40
0
5,000
10,000
15,000
20,000
25,000
30,000
35,000
40,000
45,000
FY13 FY14 FY15 FY16 FY17 FY18E FY19E FY20E
Net Sales EBITDA Margin (RHS) PAT Margin (RHS)
(Rs in crore)( In %)
Source: Company, Ventura Research
Reducing Debt
-
0.3
0.6
0.9
1.2
1.5
1.8
2.1
2.4
FY13 FY14 FY15 FY16 FY17 FY18E FY19E FY20E
Debt to Equity ratio
(No of times)
Source: Company, Ventura Research
Upswing in return ratios
-15
-10
-5
0
5
10
15
FY13 FY14 FY15 FY16 FY17 FY18E FY19E FY20E
RoCE RoE
(In %)
Source: Company, Ventura Research
Healthy working capital cycle
0
10
20
30
40
50
60
70
80
90
100
FY13 FY14 FY15 FY16 FY17 FY18E FY19E FY20E
Inventory Days Debtor Days Credit Days
(No of days)
Source: Company, Ventura Research
- 30 of 34- Tuesday 1st August, 2017
This document is for private circulation, and must be read in conjunction with the disclaimer on the last page.
Key Risk
Coal block allocation scam
CBI had registered a case against Mr. Naveen Jindal in the allocation of the Amarkonda
Murgadangal coal block in Jharkhand. On 24th April, 2017 Mr. Jindal was formally
charged with criminal misconduct & false representation of facts in the allocation of
above coal block. Further, on 10th July, 2017 CBI filed another supplementary charge
sheet against Mr. Jindal in the Urtan North coal block case. In our view, the above
mentioned cases will not have any financial impact on the company. Markets have
already priced in the impact of above cases & any adverse order will not impact the
fortunes of the company.
Slow down in Infrastructure boom
Steel demand is expected to grow at a CAGR of 7.1% on the back of a boost given to
infrastructure by the launch of “Housing for all by 2020”, infrastructure status given to
housing projects, opening up of the defence sector to private players and growth in the
automobile industry. Any delays in achieving the stipulated targets would mean a
setback to anticipated steel demand and hence impact the profitability assumption for
JSPL negatively.
- 31 of 34- Tuesday 1st August, 2017
This document is for private circulation, and must be read in conjunction with the disclaimer on the last page.
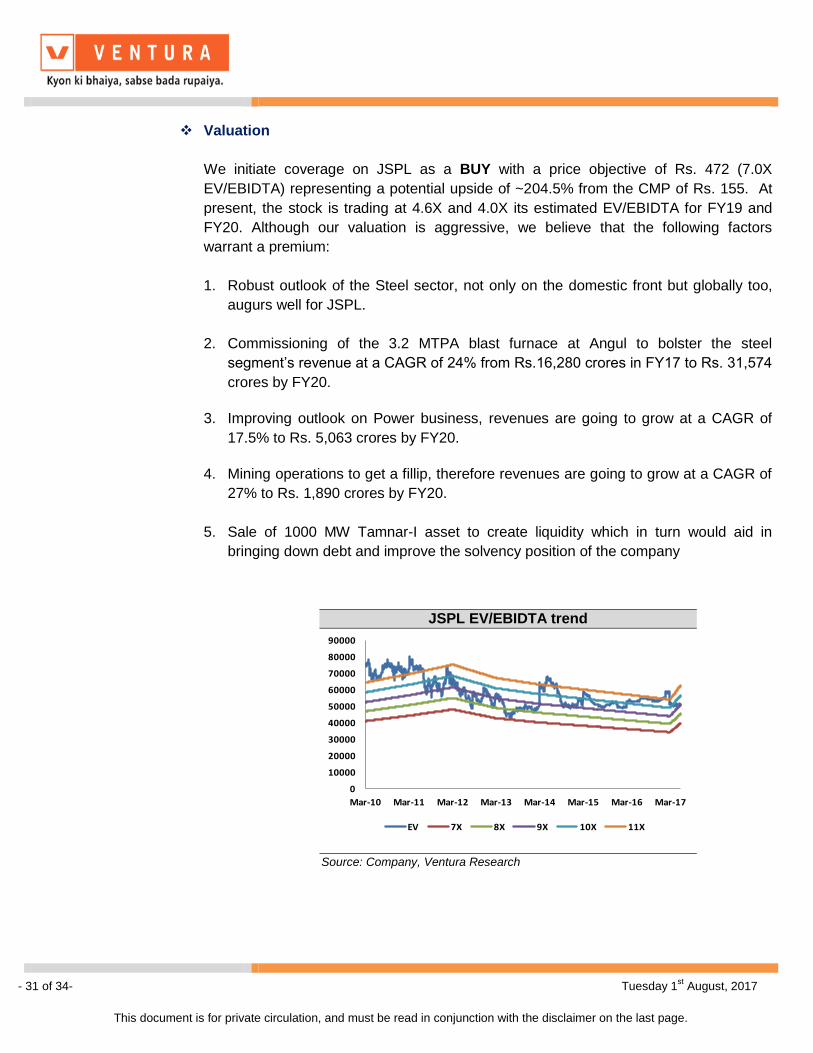
Valuation
We initiate coverage on JSPL as a BUY with a price objective of Rs. 472 (7.0X
EV/EBIDTA) representing a potential upside of ~204.5% from the CMP of Rs. 155. At
present, the stock is trading at 4.6X and 4.0X its estimated EV/EBIDTA for FY19 and
FY20. Although our valuation is aggressive, we believe that the following factors
warrant a premium:
1. Robust outlook of the Steel sector, not only on the domestic front but globally too,
augurs well for JSPL.
2. Commissioning of the 3.2 MTPA blast furnace at Angul to bolster the steel
segment’s revenue at a CAGR of 24% from Rs.16,280 crores in FY17 to Rs. 31,574
crores by FY20.
3. Improving outlook on Power business, revenues are going to grow at a CAGR of
17.5% to Rs. 5,063 crores by FY20.
4. Mining operations to get a fillip, therefore revenues are going to grow at a CAGR of
27% to Rs. 1,890 crores by FY20.
5. Sale of 1000 MW Tamnar-I asset to create liquidity which in turn would aid in
bringing down debt and improve the solvency position of the company
JSPL EV/EBIDTA trend
0
10000
20000
30000
40000
50000
60000
70000
80000
90000
Mar-10 Mar-11 Mar-12 Mar-13 Mar-14 Mar-15 Mar-16 Mar-17
EV 7X 8X 9X 10X 11X
Source: Company, Ventura Research
- 32 of 34- Tuesday 1st August, 2017
This document is for private circulation, and must be read in conjunction with the disclaimer on the last page.
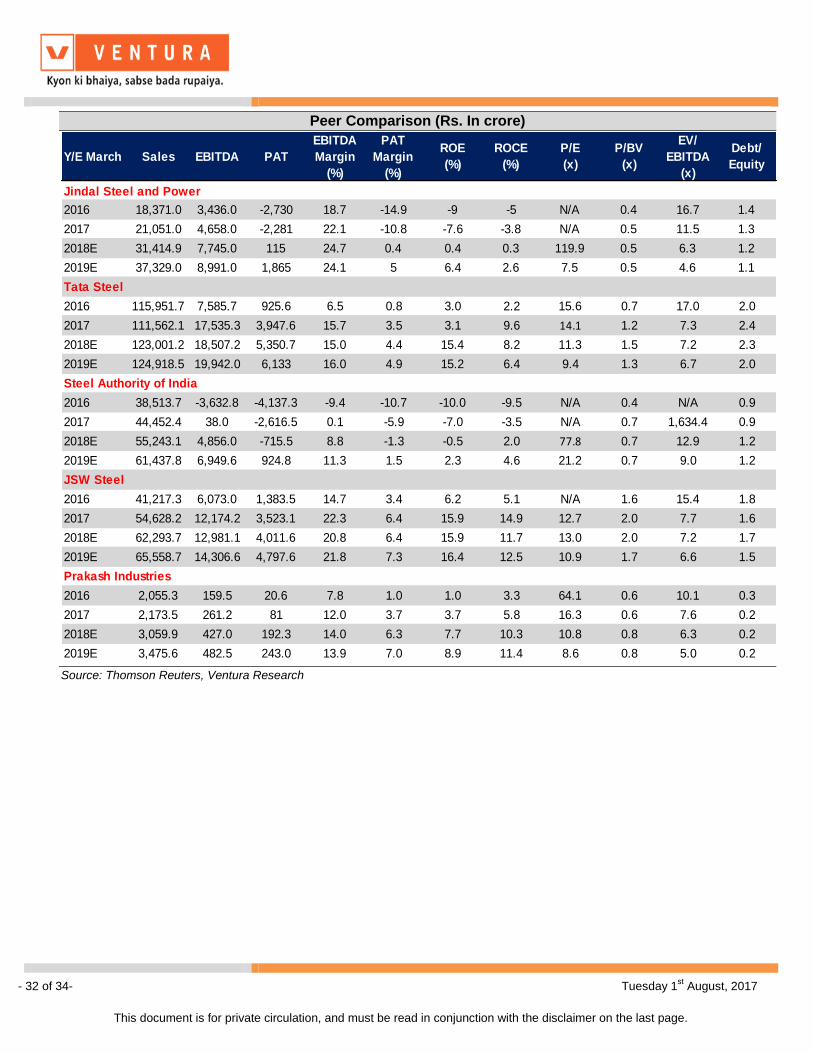
Peer Comparison (Rs. In crore)
Y/E March Sales EBITDA PAT
EBITDA
Margin
(%)
PAT
Margin
(%)
ROE
(%)
ROCE
(%)
P/E
(x)
P/BV
(x)
EV/
EBITDA
(x)
Debt/
Equity
Jindal Steel and Power 100.00%
2016 18,371.0 3,436.0 -2,730 18.7 -14.9 -9 -5 N/A 0.4 16.7 1.4
2017 21,051.0 4,658.0 -2,281 22.1 -10.8 -7.6 -3.8 N/A 0.5 11.5 1.3
2018E 31,414.9 7,745.0 115 24.7 0.4 0.4 0.3 119.9 0.5 6.3 1.2
2019E 37,329.0 8,991.0 1,865 24.1 5 6.4 2.6 7.5 0.5 4.6 1.1
Tata Steel
2016 115,951.7 7,585.7 925.6 6.5 0.8 3.0 2.2 15.6 0.7 17.0 2.0
2017 111,562.1 17,535.3 3,947.6 15.7 3.5 3.1 9.6 14.1 1.2 7.3 2.4
2018E 123,001.2 18,507.2 5,350.7 15.0 4.4 15.4 8.2 11.3 1.5 7.2 2.3
2019E 124,918.5 19,942.0 6,133 16.0 4.9 15.2 6.4 9.4 1.3 6.7 2.0
Steel Authority of India
2016 38,513.7 -3,632.8 -4,137.3 -9.4 -10.7 -10.0 -9.5 N/A 0.4 N/A 0.9
2017 44,452.4 38.0 -2,616.5 0.1 -5.9 -7.0 -3.5 N/A 0.7 1,634.4 0.9
2018E 55,243.1 4,856.0 -715.5 8.8 -1.3 -0.5 2.0 77.8 0.7 12.9 1.2
2019E 61,437.8 6,949.6 924.8 11.3 1.5 2.3 4.6 21.2 0.7 9.0 1.2
JSW Steel
2016 41,217.3 6,073.0 1,383.5 14.7 3.4 6.2 5.1 N/A 1.6 15.4 1.8
2017 54,628.2 12,174.2 3,523.1 22.3 6.4 15.9 14.9 12.7 2.0 7.7 1.6
2018E 62,293.7 12,981.1 4,011.6 20.8 6.4 15.9 11.7 13.0 2.0 7.2 1.7
2019E 65,558.7 14,306.6 4,797.6 21.8 7.3 16.4 12.5 10.9 1.7 6.6 1.5
Prakash Industries
2016 2,055.3 159.5 20.6 7.8 1.0 1.0 3.3 64.1 0.6 10.1 0.3
2017 2,173.5 261.2 81 12.0 3.7 3.7 5.8 16.3 0.6 7.6 0.2
2018E 3,059.9 427.0 192.3 14.0 6.3 7.7 10.3 10.8 0.8 6.3 0.2
2019E 3,475.6 482.5 243.0 13.9 7.0 8.9 11.4 8.6 0.8 5.0 0.2
Source: Thomson Reuters, Ventura Research
- 33 of 34- Tuesday 1st August, 2017
This document is for private circulation, and must be read in conjunction with the disclaimer on the last page.
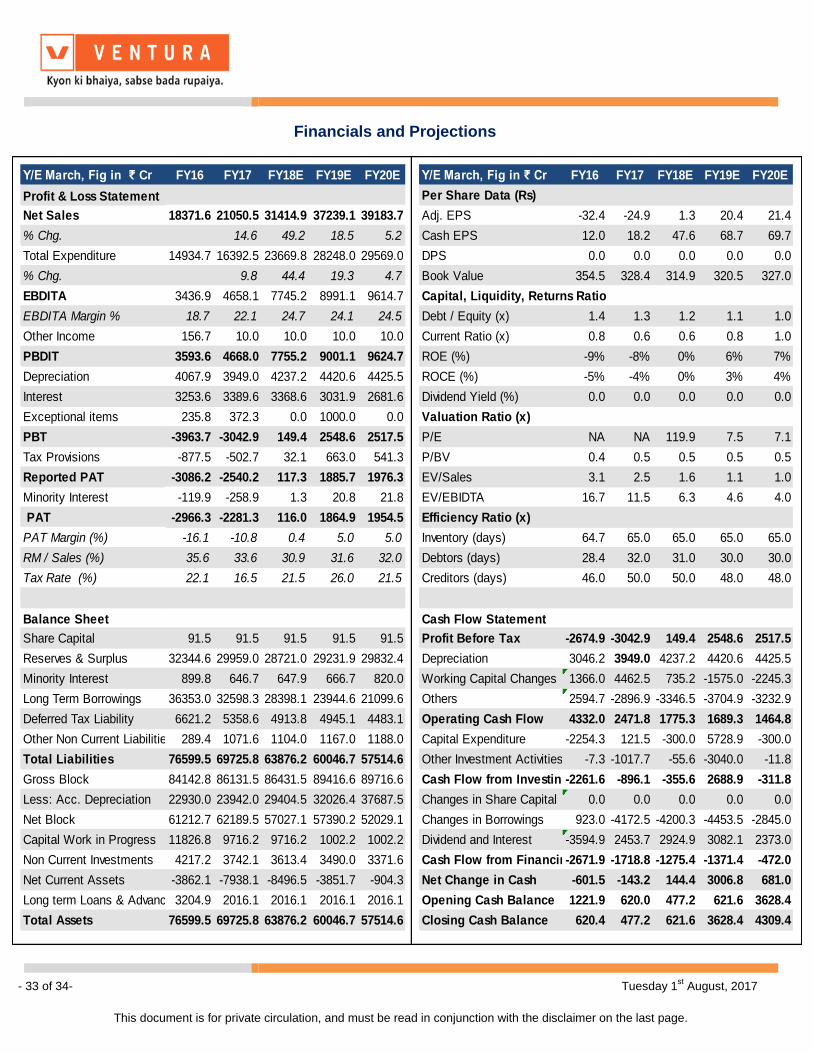
Financials and Projections
Y/E March, Fig in ₹ Cr FY16 FY17 FY18E FY19E FY20E Y/E March, Fig in ₹ Cr FY16 FY17 FY18E FY19E FY20E
Profit & Loss Statement Per Share Data (Rs)
Net Sales 18371.6 21050.5 31414.9 37239.1 39183.7 Adj. EPS -32.4 -24.9 1.3 20.4 21.4
% Chg. 14.6 49.2 18.5 5.2 Cash EPS 12.0 18.2 47.6 68.7 69.7
Total Expenditure 14934.7 16392.5 23669.8 28248.0 29569.0 DPS 0.0 0.0 0.0 0.0 0.0
% Chg. 9.8 44.4 19.3 4.7 Book Value 354.5 328.4 314.9 320.5 327.0
EBDITA 3436.9 4658.1 7745.2 8991.1 9614.7 Capital, Liquidity, Returns Ratio
EBDITA Margin % 18.7 22.1 24.7 24.1 24.5 Debt / Equity (x) 1.4 1.3 1.2 1.1 1.0
Other Income 156.7 10.0 10.0 10.0 10.0 Current Ratio (x) 0.8 0.6 0.6 0.8 1.0
PBDIT 3593.6 4668.0 7755.2 9001.1 9624.7 ROE (%) -9% -8% 0% 6% 7%
Depreciation 4067.9 3949.0 4237.2 4420.6 4425.5 ROCE (%) -5% -4% 0% 3% 4%
Interest 3253.6 3389.6 3368.6 3031.9 2681.6 Dividend Yield (%) 0.0 0.0 0.0 0.0 0.0
Exceptional items 235.8 372.3 0.0 1000.0 0.0 Valuation Ratio (x)
PBT -3963.7 -3042.9 149.4 2548.6 2517.5 P/E NA NA 119.9 7.5 7.1
Tax Provisions -877.5 -502.7 32.1 663.0 541.3 P/BV 0.4 0.5 0.5 0.5 0.5
Reported PAT -3086.2 -2540.2 117.3 1885.7 1976.3 EV/Sales 3.1 2.5 1.6 1.1 1.0
Minority Interest -119.9 -258.9 1.3 20.8 21.8 EV/EBIDTA 16.7 11.5 6.3 4.6 4.0
PAT -2966.3 -2281.3 116.0 1864.9 1954.5 Efficiency Ratio (x)
PAT Margin (%) -16.1 -10.8 0.4 5.0 5.0 Inventory (days) 64.7 65.0 65.0 65.0 65.0
RM / Sales (%) 35.6 33.6 30.9 31.6 32.0 Debtors (days) 28.4 32.0 31.0 30.0 30.0
Tax Rate (%) 22.1 16.5 21.5 26.0 21.5 Creditors (days) 46.0 50.0 50.0 48.0 48.0
Balance Sheet Cash Flow Statement
Share Capital 91.5 91.5 91.5 91.5 91.5 Profit Before Tax -2674.9 -3042.9 149.4 2548.6 2517.5
Reserves & Surplus 32344.6 29959.0 28721.0 29231.9 29832.4 Depreciation 3046.2 3949.0 4237.2 4420.6 4425.5
Minority Interest 899.8 646.7 647.9 666.7 820.0 Working Capital Changes 1366.0 4462.5 735.2 -1575.0 -2245.3
Long Term Borrowings 36353.0 32598.3 28398.1 23944.6 21099.6 Others 2594.7 -2896.9 -3346.5 -3704.9 -3232.9
Deferred Tax Liability 6621.2 5358.6 4913.8 4945.1 4483.1 Operating Cash Flow 4332.0 2471.8 1775.3 1689.3 1464.8
Other Non Current Liabilities 289.4 1071.6 1104.0 1167.0 1188.0 Capital Expenditure -2254.3 121.5 -300.0 5728.9 -300.0
Total Liabilities 76599.5 69725.8 63876.2 60046.7 57514.6 Other Investment Activities -7.3 -1017.7 -55.6 -3040.0 -11.8
Gross Block 84142.8 86131.5 86431.5 89416.6 89716.6 Cash Flow from Investing-2261.6 -896.1 -355.6 2688.9 -311.8
Less: Acc. Depreciation 22930.0 23942.0 29404.5 32026.4 37687.5 Changes in Share Capital 0.0 0.0 0.0 0.0 0.0
Net Block 61212.7 62189.5 57027.1 57390.2 52029.1 Changes in Borrowings 923.0 -4172.5 -4200.3 -4453.5 -2845.0
Capital Work in Progress 11826.8 9716.2 9716.2 1002.2 1002.2 Dividend and Interest -3594.9 2453.7 2924.9 3082.1 2373.0
Non Current Investments 4217.2 3742.1 3613.4 3490.0 3371.6 Cash Flow from Financing-2671.9 -1718.8 -1275.4 -1371.4 -472.0
Net Current Assets -3862.1 -7938.1 -8496.5 -3851.7 -904.3 Net Change in Cash -601.5 -143.2 144.4 3006.8 681.0
Long term Loans & Advances3204.9 2016.1 2016.1 2016.1 2016.1 Opening Cash Balance 1221.9 620.0 477.2 621.6 3628.4
Total Assets 76599.5 69725.8 63876.2 60046.7 57514.6 Closing Cash Balance 620.4 477.2 621.6 3628.4 4309.4
- 34 of 34- Tuesday 1st August, 2017
This document is for private circulation, and must be read in conjunction with the disclaimer on the last page.
Disclosures and Disclaimer
Ventura Securities Limited (VSL) is a SEBI registered intermediary offering broking, depository and portfolio management services to clients. VSL is member of BSE, NSE and MCX-SX. VSL is a depository participant of NSDL. VSL states that no disciplinary action whatsoever has been taken by SEBI against it in last five years except administrative warning issued in connection with technical and venial lapses observed while inspection of books of accounts and records. Ventura Commodities Limited, Ventura Guaranty Limited, Ventura Insurance Brokers Limited and Ventura Allied Services Private Limited are associates of VSL. Research Analyst (RA) involved in the preparation of this research report and VSL disclose that neither RA nor VSL nor its associates (i) have any financial interest in the company which is the subject matter of this research report (ii) holds ownership of one percent or more in the securities of subject company (iii) have any material conflict of interest at the time of publication of this research report (iv) have received any compensation from the subject company in the past twelve months (v) have managed or co-managed public offering of securities for the subject company in past twelve months (vi) have received any compensation for investment banking merchant banking or brokerage services from the subject company in the past twelve months (vii) have received any compensation for product or services from the subject company in the past twelve months (viii) have received any compensation or other benefits from the subject company or third party in connection with the research report. RA involved in the preparation of this research report discloses that he / she has not served as an officer, director or employee of the subject company. RA involved in the preparation of this research report and VSL discloses that they have not been engaged in the market making activity for the subject company. Our sales people, dealers, traders and other professionals may provide oral or written market commentary or trading strategies to our clients that reflect opinions that are contrary to the opinions expressed herein. We may have earlier issued or may issue in future reports on the companies covered herein with recommendations/ information inconsistent or different those made in this report. In reviewing this document, you should be aware that any or all of the foregoing, among other things, may give rise to or potential conflicts of interest. We may rely on information barriers, such as "Chinese Walls" to control the flow of information contained in one or more areas within us, or other areas, units, groups or affiliates of VSL. This report is for information purposes only and this document/material should not be construed as an offer to sell or the solicitation of an offer to buy, purchase or subscribe to any securities, and neither this document nor anything contained herein shall form the basis of or be relied upon in connection with any contract or commitment whatsoever. This document does not solicit any action based on the material contained herein. It is for the general information of the clients / prospective clients of VSL. VSL will not treat recipients as clients by virtue of their receiving this report. It does not constitute a personal recommendation or take into account the particular investment objectives, financial situations, or needs of clients / prospective clients. Similarly, this document does not have regard to the specific investment objectives, financial situation/circumstances and the particular needs of any specific person who may receive this document. The securities discussed in this report may not be suitable for all investors. The appropriateness of a particular investment or strategy will depend on an investor's individual circumstances and objectives. Persons who may receive this document should consider and independently evaluate whether it is suitable for his/ her/their particular circumstances and, if necessary, seek professional/financial advice. And such person shall be responsible for conducting his/her/their own investigation and analysis of the information contained or referred to in this document and of evaluating the merits and risks involved in the securities forming the subject matter of this document. The projections and forecasts described in this report were based upon a number of estimates and assumptions and are inherently subject to significant uncertainties and contingencies. Projections and forecasts are necessarily speculative in nature, and it can be expected that one or more of the estimates on which the projections and forecasts were based will not materialize or will vary significantly from actual results, and such variances will likely increase over time. All projections and forecasts described in this report have been prepared solely by the authors of this report independently of the Company. These projections and forecasts were not prepared with a view toward compliance with published guidelines or generally accepted accounting principles. No independent accountants have expressed an opinion or any other form of assurance on these projections or forecasts. You should not regard the inclusion of the projections and forecasts described herein as a representation or warranty by VSL, its associates, the authors of this report or any other person that these projections or forecasts or their underlying assumptions will be achieved. For these reasons, you should only consider the projections and forecasts described in this report after carefully evaluating all of the information in this report, including the assumptions underlying such projections and forecasts. The price and value of the investments referred to in this document/material and the income from them may go down as well as up, and investors may realize losses on any investments. Past performance is not a guide for future performance. Future returns are not guaranteed and a loss of original capital may occur. Actual results may differ materially from those set forth in projections. Forward-looking statements are not predictions and may be subject to change without notice. We do not provide tax advice to our clients, and all investors are strongly advised to consult regarding any potential investment. VSL, the RA involved in the preparation of this research report and its associates accept no liabilities for any loss or damage of any kind arising out of the use of this report. This report/document has been prepared by VSL, based upon information available to the public and sources, believed to be reliable. No representation or warranty, express or implied is made that it is accurate or complete. VSL has reviewed the report and, in so far as it includes current or historical information, it is believed to be reliable, although its accuracy and completeness cannot be guaranteed. The opinions expressed in this document/material are subject to change without notice and have no obligation to tell you when opinions or information in this report change. This report or recommendations or information contained herein do/does not constitute or purport to constitute investment advice in publicly accessible media and should not be reproduced, transmitted or published by the recipient. The report is for the use and consumption of the recipient only. This publication may not be distributed to the public used by the public media without the express written consent of VSL. This report or any portion hereof may not be printed, sold or distributed without the written consent of VSL. This document does not constitute an offer or invitation to subscribe for or purchase or deal in any securities and neither this document nor anything contained herein shall form the basis of any contract or commitment whatsoever. This document is strictly confidential and is being furnished to you solely for your information, may not be distributed to the press or other media and may not be reproduced or redistributed to any other person. The opinions and projections expressed herein are entirely those of the author and are given as part of the normal research activity of VSL and are given as of this date and are subject to change without notice. Any opinion estimate or projection herein constitutes a view as of the date of this report and there can be no assurance that future results or events will be consistent with any such opinions, estimate or projection. This document has not been prepared by or in conjunction with or on behalf of or at the instigation of, or by arrangement with the company or any of its directors or any other person. Information in this document must not be relied upon as having been authorized or approved by the company or its directors or any other person. Any opinions and projections contained herein are entirely those of the authors. None of the company or its directors or any other person accepts any liability whatsoever for any loss arising from any use of this document or its contents or otherwise arising in connection therewith. The information contained herein is not intended for publication or distribution or circulation in any manner whatsoever and any unauthorized reading, dissemination, distribution or copying of this communication is prohibited unless otherwise expressly authorized. Please ensure that you have read “Risk Disclosure Document for Capital Market and Derivatives Segments” as prescribed by Securities and Exchange Board of India before investing in Securities Market. Ventura Securities Limited
Corporate Office: C-112/116, Bldg No. 1, Kailash Industrial Complex, Park Site, Vikhroli (W), Mumbai – 400079