jets and wide-angle outflows in cepheus e ... - astro.up.pt · 2 centro de astrofisica da...
TRANSCRIPT

The Astrophysical Journal, 741:60 (15pp), 2011 November 1 doi:10.1088/0004-637X/741/1/60C© 2011. The American Astronomical Society. All rights reserved. Printed in the U.S.A.
JETS AND WIDE-ANGLE OUTFLOWS IN CEPHEUS E: NEW EVIDENCE FROM SPITZER
T. Velusamy1, W. D. Langer1, M. S. N. Kumar2, and J. M. C. Grave21 Jet Propulsion Laboratory, California Institute of Technology, 4800 Oak Grove Drive, Pasadena, CA 91109, USA;
[email protected], [email protected] Centro de Astrofisica da Universidade do Porto, Rua das Estrelas, 4150-762 Porto, Portugal; [email protected], [email protected]
Received 2011 April 28; accepted 2011 August 3; published 2011 October 14
ABSTRACT
Outflows and jets are believed to play a crucial role in determining the mass of the central protostar and its planet-forming disk by virtue of their ability to transport energy, mass, and momentum of the surrounding material, andthus terminate the infall stage in star and disk formation. In some protostellar objects both wide-angle outflowsand collimated jets are seen, while in others only one is observed. Spitzer provides unprecedented sensitivity in theinfrared to study both the jet and outflow features. Here, we use HiRes deconvolution to improve the visualizationof spatial morphology by enhancing resolution (to subarcsecond levels in the Infrared Array Camera (IRAC) bands)and removing the contaminating sidelobes from bright sources. We apply this approach to study the jet and outflowfeatures in Cep E, a young, energetic Class 0 protostar. In the reprocessed images we detect (1) wide-angle outflowseen in scattered light, (2) morphological details on at least 29 jet-driven bow shocks and jet heads or knots, (3) threecompact features in 24 μm continuum image as atomic/ionic line emission coincident with the jet heads, and (4) aflattened ∼35′′ size protostellar envelope seen against the interstellar background polycyclic aromatic hydrocarbonemission as an absorption band across the protostar at 8 μm. By separating the protostellar photospheric scatteredemission in the wide-angle cavity from the jet emission we show that we can study directly the scattered lightspectrum. We present the H2 emission line spectra, as observed in all IRAC bands, for 29 knots in the jets andbow shocks and use them in the IRAC color–color space as a diagnostic of the thermal gas in the shocks drivenby the jets. The data presented here will enable detailed modeling of the individual shocks retracing the history ofthe episodic jet activity and the associated accretion on to the protostar. The Spitzer data analysis presented hereshows the richness of its archive as a resource to study the jet/outflow features in H2 and scattered light in a largehomogeneous sample.
Key words: Herbig–Haro objects – infrared: ISM – ISM: individual objects (Cepheus E) – ISM: jets and outflows– stars: formation – stars: protostars
1. INTRODUCTION
Star formation begins with the collapse of a dense interstel-lar cloud core to a protostar surrounded by a disk of gas anddust. The envelope of the cloud core falls inward to feed furthergrowth of the protostar and its accreting disk. At some pointduring the accretion phase, protostellar jets and winds origi-nate close to the surface of the forming star and interact withthe dense envelope surrounding the protostar-disk system (e.g.,Konigl & Pudritz 2000; Shu et al. 2000). These outflows andjets are believed to play a crucial role in determining the massof the central protostar and its planet-forming disk by virtue oftheir ability to transport energy, mass, and momentum of thesurrounding material, and thus terminate the infall stage in starand disk formation. It is now well recognized that jets and out-flows are essential and inherent to the star formation process.These flows are broadly classified into two types: molecularoutflows traced mainly with CO emission, and jets observed byoptical emission (cf. recent reviews by Arce et al. 2007; Pudritzet al. 2007; Bally 2007). Observations indicate that around someprotostars, high-velocity jets with a narrow opening angle areenclosed by a low-velocity outflow with a wide opening angle(e.g., Mundt & Fried 1983; Velusamy et al. 2007), howeverin others only one component is observed. Poorly collimatedflows can be due to extreme precession of the jet (Shepherdet al. 2000) and indistinguishable from wide-angle outflows.The wide-angle outflows, which are also observed in the scat-tered light, are often missed in the optical or near-IR due to in-
strument insensitivity to faint emission and confusion from thebright protostellar emissions. Spitzer provides unprecedentedsensitivity in the infrared to detect the jet/outflow features. TheInfrared Array Camera (IRAC), Infrared Spectrograph (IRS),and Multiband Imaging Photometer for Spitzer (MIPS) obser-vations can provide new insight into the structure, morphology,and physical and chemical characteristics of the outflow sourcesas demonstrated in the observations of HH46/47 by Noriega-Crespo et al. (2004b) and Velusamy et al. (2007), Cep E byNoriega-Crespo et al. (2004a), L1512F by Bourke et al. (2006),L1448 by Tobin et al. (2007) and Dionatos et al. (2009), L1251by Lee et al. (2010), and HH211 by Dionatos et al. (2010). Usingthe IRAC colors alone, Ybarra & Lada (2009) demonstrated thefeasibility to study the pure rotational H2 line emissions in theshocks without the need for spectroscopic data. Velusamy et al.(2007) demonstrated that resolution-enhanced reprocessing ofSpitzer images in the case of HH46/47 brought out more clearlythe morphologies of (1) wide-angle outflow cavities in the IRAC3.6 and 4.5 μm images by scattered starlight, (2) jets and bowshocks in H2 molecular emission within the IRAC bands, and(3) the hottest atomic/ionic gas in the jet head characterized by[Fe ii] and [S i] line emissions within the MIPS 24 μm band.
In this paper, we present new results on Cep E obtained byreprocessing the Spitzer IRAC and MIPS images with the HiResdeconvolution (Backus et al. 2005). Cep E is a remarkablybright outflow object, at a distance of 730 pc, with strongradiative power (∼80 L�), and appears to be an intermediate-mass object, which is expected to reach a final stellar mass
1

The Astrophysical Journal, 741:60 (15pp), 2011 November 1 Velusamy et al.
of 3 M� (Froebrich et al. 2003). Cep E has been recentlyclassified as a Class 0 protostar by Noriega-Crespo et al. (2004a)based on the Spitzer Early Release Observations. It is amongthe youngest protostars, with an age in the range of 20–400thousand years, estimated for different evolutionary models(Froebrich 2005, and the references therein). In the near- andmid-IR its morphology is similar to that expected for a jet-drivenoutflow, where the leading bow shocks entrain and accelerate thesurrounding molecular gas. The properties of this outflow havebeen well studied by Moro-Martın et al. (2001) and Smith et al.(2003). The southern bright bow shock, identified as HH377(Devine et al. 1997), is well studied in the optical wavelengthsusing the [O i] λ6300, [N i ] λ5200, and [S ii] λλ6717,6731 linestracing the dissociative shock characteristics of Herbig–Haro(HH) flows (e.g., Ayala et al. 2000), and later in the near-IRin the [Fe ii] 1.26 and 1.64 μm emission lines, utilizing the factthat [S ii] and [Fe ii] have very similar excitation energies (Nisiniet al. 2002). Furthermore, Hartigan et al. (1987) interpreted therelative strength of [O i] and [N i] with respect to Hα and thelack of [O ii] and [O iii] in terms of relatively low velocity(20–25 km s−1) dissociative shocks and concluded that thesouth bow shock of Cep E is a low-excitation HH object. Inaddition to dissociative shocks, the HH outflows are known tohave also magnetic precursors (C-shocks) needed to explainexcitation of the molecular H2 emission. Cep E lobes havebeen well imaged in H2 emission in IR: in v = 1–0 S(1)2.122 μm; v = 2–1 S(1) 2.248 μm; v = 3–2 S(3) 2.202 μm(Eisloffel et al. 1996; Ladd & Hodapp 1997); v = 0–0 S(5)6.91 μm and S(3) 9.66 μm (Noriega-Crespo et al. 1998); andv = 1–0 S(1) 1.21 μm. In the mid-IR, a series of six purerotational emission lines H2 0–0 S(2)–S(7) in the wavelengthrange of 12.28–5.51 μm in the Cep E lobes were first imaged byISOCAM circular variable filter (CVF; Moro-Martın et al. 2001)and their excitation diagrams led to the use of H2 line ratios asC-shock diagnostics. The emissions in the Spitzer images in allthe IRAC bands are dominated by a wide range of H2 rotationaltransitions from 0–0 S(4) to 0–0 S(13) and a few vibrational 1–0transitions in the 3.6 μm band. Thus, Spitzer observations of CepE enhance the rich data set already available in optical, near-IR,and millimeter wavelengths. Furthermore, all the interpretationsso far have focused on treating this object as having jets andbow shocks, but no wide-angle outflow. Because of the limitedspatial resolution, even the CO outflow morphology has beeninterpreted as entrained low-velocity molecular gas associatedwith the bow shock driven by the jets (Moro-Martın et al. 2001).Our enhanced image analysis shows the simultaneous presenceof wide-angle outflow along with the bow shocks powered bythe jets. In this paper we highlight the morphological features inthe low-velocity wide-angle outflow and the high-velocity jetsand discuss a wide range of structures from compact knots toextended envelopes as seen in the reprocessed Spitzer IRAC andMIPS images.
2. ANALYSIS
Noriega-Crespo et al. (2004a) presented the mosaic images ofCep E in the Spitzer IRAC bands at 3.5 μm, 4.5 μm, and 8 μmin a three-color representation and the mosaic image of MIPSband at 24 μm. However, some of the structures were missedin these mosaic maps due to either lower spatial resolution ordiffraction lobes. Spitzer provides unprecedented sensitivity inthe infrared, but the spatial resolution is limited by the rela-tively small aperture (0.85 m) of the primary mirror. To max-imize the scientific return of Spitzer images we use the HiRes
deconvolution processing technique, which makes the optimaluse of the spatial information in the observations. The algo-rithm “HiRes” and its implementation has been discussed byBackus et al. (2005), and its performance on a variety of astro-physical sources observed by Spitzer is presented by Velusamyet al. (2008). The HiRes deconvolution algorithm is based onthe Richardson–Lucy algorithm (Richardson 1972; Lucy 1974),and the Maximum Correlation Method employed by Aumannet al. (1990) for IRAS data. As demonstrated by Velusamy et al.(2007, 2008) the HiRes deconvolution on Spitzer images retainsa high fidelity preserving all the main features. HiRes decon-volution improves the visualization of spatial morphology byenhancing resolution and removing the contaminating sidelobesfrom bright sources. The benefits of HiRes include (1) enhancedresolution ∼0.′′6–0.′′8 for IRAC bands and ∼1.′′8 and ∼7′′ forMIPS 24 μm and 70 μm, respectively; (2) the ability to detectsources below the diffraction-limited confusion level; (3) theability to separate blended sources, and thereby provide guid-ance to point-source extraction procedures; and (4) an improvedability to show the spatial morphology of resolved sources. Wereprocessed the images at all the IRAC bands and the MIPS 24and 70 μm bands using all available map data in these bandsin the Spitzer archives containing the protostellar object CepE centered at (α = 23h03m12.s5, δ = +61◦42′30′′[J2000]). Weused the pipeline processed basic calibrated data (BCD) down-loaded from the Spitzer Science Center (SSC) archives. We con-structed mosaic images at each band using the MOPEX software(provided by SSC). In addition, we also produced reprocessedimages at each band by applying the HiRes deconvolution onBCDs following the steps outlined by Velusamy et al. (2008).The mosaic and the HiRes images cover an angular size of 5′centered on the Cep E protostar. All the HiRes images shownin this paper were obtained after 50 iterations unless mentionedotherwise.
The mosaic and the HiRes deconvolved images in the IRACand MIPS bands, shown in Figures 1 and 2, respectively, bringout the merits of HiRes processing. In these figures the top panelsshow the reprocessed HiRes images and the correspondingobserved (mosaic) images are shown in the lower panels. Themosaic and HiRes images have identical angular extent andscale. The images are presented using a square-root intensityscale and color stretches. The color stretches used are similarin all images and an example of the colors representing therelative intensities is shown by the wedge at the upper left. Inthe MIPS 24 μm mosaic image only the protostar is obvious.However, in the HiRes image at least three additional featuresalong the atomic jet become identifiable as sources distinct fromthe “sidelobes” present in the mosaic image. These were notidentified in previously published mosaic images.
The MIPS images shown in Figure 2 have small pointingdifferences (∼1′′) with respect to the IRAC images in Figure 1.A comparison of the point sources in the MIPS 24 μm imagewith their counterparts in the IRAC bands indicated that thepointing at 24 μm was off with respect to the IRAC bands by−0.s07 in R.A. and +1.′′1 in decl. We shifted the MIPS 70 μmmap position by matching the protostar position with the MIPS24 μm image. In all subsequent displays and analysis we usethe MIPS images corrected for their position shifts with respectto the IRAC images.
3. RESULTS AND DISCUSSION
The Spitzer IRAC and MIPS bands offer a unique resource tostudy a wide range of components simultaneously: protostars,
2

The Astrophysical Journal, 741:60 (15pp), 2011 November 1 Velusamy et al.
Figure 1. Mosaic (lower) and HiRes deconvolved (upper) images in the IRAC bands. In all images the color stretch and the square-root scaling used are designedto bring out the low surface emissions, and thus the brightest emission is saturated. It is readily evident that the image enhancement in the HiRes images improvesthe visualization of the morphologies of jets and outflows by virtue of the increase in the resolution to subarcsecond scale, and by removal of the confusion from the“sidelobes.”
Figure 2. Mosaic (lower) and HiRes deconvolved (upper) images in the MIPSbands. The arrows in the 24 μm HiRes image indicate the features that aredistinctly visible only after the HiRes processing and were formerly completelymasked by the “sidelobes” in the mosaic image.
protostellar disks, outflows, protostellar envelopes, and cores.At the short-wavelength IRAC bands the outflow cones areobservable in scattered light from the protostar through thecavity created by the jets and outflows (cf. Tobin et al. 2007;Velusamy et al. 2007). A significant fraction of the emission inthe IRAC bands is also considered to contain emission from theH2 rotational lines (e.g., Noriega-Crespo et al. 2004a, 2004b;Neufeld & Yuan 2008; Smith & Rosen 2005) and therefore
is an excellent tracer of H2 emission in the protostellar jets.Recently, Velusamy et al. (2007) have shown that molecular jetsand molecular gas in the bow shocks are readily identifiablein the IRAC bands, while the hottest atomic/ionic gases in thebow shocks are also identifiable in the MIPS 24 μm band whichcovers a few atomic/ionic emission lines. The dust emissionfrom the protostar in the MIPS bands is a good diagnostic ofthe circumstellar disks. Finally, an extended flattened infallenvelope perpendicular to the outflow has been seen in theIRAC 8 μm in absorption against the background interstellarpolycyclic aromatic hydrocarbon (PAH) emission (Looney et al.2007; Tobin et al. 2010b). Spitzer’s coverage of a broad range ofIR emissions in the IRAC and MIPS bands with high sensitivityand photometric stability along with the IRS data in somecases provide sufficient data for a comprehensive modeling ofthe spectral energy distribution (SED) to derive the physicalcharacteristics and the evolutionary stages of protostars (cf.Robitaille et al. 2007; Forbrich et al. 2010). However, byapplying the HiRes reprocessing we can extract even moreinformation from the Spitzer data. The sensitivity, the resolutionenhancement, and removal of the diffraction lobe confusion haveled to visualizing and characterizing more clearly the followingfeatures in the Cep E protostar:
1. very high dynamic range maps in which the protostar is wellresolved on a subarcsecond scale from the surrounding jetsand outflows
2. wide-angle outflow cavities in the IRAC 3.6 and 4.5 μmimages identified by the scattered photospheric starlight;though they are visible in the Mosaic (standard post-BCDproducts), they are brought out more clearly in the HiResimages
3. jets and bow shocks in H2 molecular emission within theIRAC bands
4. hottest atomic/ionic gas in the jet head traced by the [Fe ii]/[S i] line emissions within MIPS 24 μm continuum band
5. flattened infall envelope around the protostar seen in ex-tinction at 8 μm.
3

The Astrophysical Journal, 741:60 (15pp), 2011 November 1 Velusamy et al.
Figure 3. HiRes maps of the inner 10′′ region around the Cep E protostar. The contour levels are at 0.01%, 0.1%, 1%, 10%, and 50% of the peak intensity (listed inTable 1) at each band. At 70 μm, only the contour at 50% peak intensity is plotted. Note the extremely low surface brightness of the outflow–jet features in all IRACbands, delineated by the low-level contours at intensities below a few percent of the peak at the protostar. The crosses in the 3.6 μm map represent the positions of themillimeter double source (from Moro-Martın et al. 2001).
Table 1Observed Protostar Parameters from the HiRes Maps
Band Peak Size Flux Density(μm) (MJy sr−1) (′′ × ′′) (Jy)
3.6 355 0.83 × 0.72 0.00554.5 1877 0.73 × 1.00 0.03585.8 6465 0.71 × 0.91 0.1118.0 10964 0.78 × 0.85 0.19624 47597 1.97 × 2.06 5.1570 32714 5.23 × 6.03 26.4
3.1. Protostar
The protostar in Cep E is detected in all IRAC and MIPSbands. The IRAC HiRes images shown in Figure 1 have highdynamic range, but the brightest features are shown saturatedas they are optimized to highlight the low surface brightnessemission. In all bands the highest brightness is at the protostarlocation, while the jets and the outflow features are at very lowbrightness levels of ∼1% or less of the peak brightness. Thecolor stretch used in Figure 1 is designed to bring out these lowsurface brightness features and, therefore, underrepresents thepeak brightness at the protostar. In Figure 3 we show the HiResintensity contour maps of the protostar in all bands. To bring outthe huge intensity contrast between the brightest emission at theprotostar and the weaker emission of the outflow–jet featuresplotted in Figure 3, we show selected contours: the lowest levelat 0.01% and the highest at 50% of the peak. The observed fluxdensities and sizes for the protostar are summarized in Table 1. Inthe IRAC wavelengths the emission from the protostar appearsto be unresolved with sizes comparable to the HiRes beam. Theprotostar flux densities measured in the HiRes maps listed inTable 1 are consistent with the photometric estimates discussedbelow in Section 3.4.
Cep E is believed to be a double source separated by 1.′′4(∼1000 AU), as shown by the 222 GHz millimeter interfer-
ometric observations of Moro-Martın et al. (2001). However,as seen in Figure 3, the overlay of millimeter source positionson the IRAC 3.6 μm map does not show any evidence for adouble source in the IR bands. The subarcsecond resolution(∼0.′′6–0.′′8) in the HiRes images would have clearly resolvedany double source if present. Though the protostar emissionis barely resolved in the maps, there is a hint of slight elonga-tion roughly along the separation between the millimeter doublesources. Our results do not show any evidence for the presenceof a second protostellar component. Instead, we suggest thatthe resolved millimeter double source structure may representcircumstellar cold dust within a few ×103 AU.
3.2. Wide-angle Outflows and Jets: IRAC Images
It can be difficult to observe the extended low surfacebrightness features associated with the outflow or jets asthey may be severely confused by the high brightness of theprotostar and the disk. Deconvolution at best removes, or atleast minimizes, the diffraction effects of the brightest features,thus enabling improved visualization of the low surface featuresaround them. Furthermore, the resolution enhancement providesa sharper view of the outflow cavity walls, molecular jets, andbow shocks.
3.2.1. Wide-angle Outflow Component
The radiation from deeply embedded young protostars iscompletely opaque at short wavelengths and we can observeonly the scattered light escaping along the bipolar cavitiesproduced by their jets and outflows. The scattering models (cf.Whitney et al. 2003a, 2003b; Tobin et al. 2007) show that suchoutflow cavities can be traced in Spitzer images in IRAC 3.6 and4.5 μm bands, as is seen more clearly in the HiRes deconvolvedimages (Velusamy et al. 2007, 2008). In Figure 1 a wide-anglebiconical outflow is clearly detected in the HiRes images at 3.6and 4.5 μm. Though its presence is marginally evident in themosaic images, its morphological details are delineated more
4

The Astrophysical Journal, 741:60 (15pp), 2011 November 1 Velusamy et al.
Figure 4. (a) The 8 μm emission (intensity contours) tracing the jet overlaidon the 4.5 μm image which traces both the jet and the wide-angle outflow inscattered light. The contour intensities are at 1, 2, 4, 8, 16, 32, 64, 128, and256 MJy sr−1 (peak intensity is 10,964 MJy sr−1). We show a schematic of thebiconical wide-angle outflow (solid lines) and the narrow jets and associatedbow shocks (broken lines) in the northern lobe. The plausibility of a secondH2 molecular jet/outflow (see the text) is indicated. (b) Spectral plot of relativeintensities of the scattered light integrated over the area between the boundariesof the wide-angle outflow and the narrow jet, as shown in the upper panel.
clearly only in the HiRes images. The wide-angle outflow isclearly detected in the light from the protostar scattered bythe outflow cavity. Scattered light is brightest at the 3.6 and4.5 μm bands. As expected for the photospheric light emittedby a protostar at T ∼ 4000 K (see Section 3.4), the scattered lighttracing the wide-angle outflow component is relatively weak at5.8 μm and nearly absent in the 8 μm image. In contrast tothis wide-angle outflow traced by the scattered light from theprotostar, the narrower and collimated jets and the associatedbow shocks are detected by their H2 emission in all the IRACbands. All the four IRAC bands contain a few H2 spectral lines(see below for details). While bands 1 and 2 show both the wide-angle outflow (in scattered light) and narrow jet features (in H2emission), the bands 3 and 4 are dominated by the latter. Inthe HiRes images the jet emission features show well-resolvedknots and bow shocks. In the north lobe alone there are at least16 such features (see Figure 5(a)).
The HiRes processing brings out the morphology of the jetand outflow more clearly. In Figure 4 we show a comparisonbetween the 4.5 μm and 8 μm images by overlaying a schematic
of the geometry of the wide-angle outflow with its innerboundary matching the outer extent of the jet and bow shocks.The 8 μm emission delineates the narrow jet traced by theentrained H2 emission, while at 4.5 μm, in addition to the jet,the wide-angle outflow cavity is clearly visible. The scatteredlight seen in the 3.6 μm (Figure 1) and 4.5 μm (Figures 1 and4) delineates a sharp conical boundary for the outflow cavity.The projected opening angle of the cavity is ∼85◦ in the 3.6 μmimage, which is significantly large and places it among thosewith very wide outflows (Velusamy & Langer 1998; Arce &Sargent 2006) and those with simultaneous presence of high-velocity jets (Velusamy et al. 2007; Torrelles et al. 2011, andreferences therein). The wide-angle outflow seen here in thescattered light closely resembles the 13CO(1–0) low-velocitylobes (Moro-Martın et al. 2001) with the blueshifted SW lobeapproaching the observer. However, the spatial resolution in theCO maps (8′′ × 7′′) cannot resolve the sharp edges of the wide-angle outflow cavity walls as seen more clearly in the scatteredlight images with subarcsecond resolution presented here.
Poorly collimated flows can be due to extreme precessionof the jet (e.g., Shepherd et al. 2000) and are indistinguishablefrom the apparent wide-angle outflows. In the Spitzer image,shown in Figure 4(a), there is a “second jet/outflow” nearlyperpendicular to the main north–south outflow as indicated bythe east–west ellipse. The presence of this secondary jet wasfirst observed earlier in the H2 2.12 μm image (Eisloffel et al.1996). The two brightest knots in the 4.5 μm image were clearlydetected in their H2 2.12 μm image while the easternmost knot isoutside the 2.12 μm image. In a later H2 2.12 μm image (Ladd &Hodapp 1997) all three 4.5 μm knots are detected. The presenceof two outflows nearly perpendicular to each other suggests thedriving source in Cep E is a binary with a separation 4–20 AU(0.′′005–0.′′025), and disk radius 110 AU (Terquem et al. 1999).A binary systems enhances the effects of precession of boththe primary and secondary jets. Eisloffel et al. interpret thewiggles in the loci of the H2 2.12 μm knots as being a resultof precession with a period of 400 yr and a pitch angle 4◦.Binaries with multiple outflows may be common; for example:HH111/HH121 (cf. Gredel & Reipurth 1993) and L1551 (cf.Rodrıguez et al. 1998). Therefore, we cannot rule out that theobserved wide-angle cavity in Cep E is the result of precessingjets. Indeed the combined effect of the precessing jet along withthe geometry of the “infall envelope” (discussed in Section 3.5)is an alternate scenario as the cause for the observed wide-angle cavity. In the absence of direct observational evidence onthe outflow motions using high spatial resolution data of COor other molecular tracers, we cannot identify with certaintythe wide-angle cavity detected in scattered light as wide-angleoutflow.
In the jet-driven outflow models the outflow emission nearthe protostar may be interpreted as the wings of the bow shocksextending toward the protostar (e.g., Raga et al. 2004). However,in these models the opening angle of the cavities near theprotostar tends to be extremely narrow, in contrast to the wideangle observed in Cep E. Furthermore, the emission in the bowshock is distinctly different, predominantly H2 emission, as seenin the IRAC images along the jet axis; but in the wide-angleoutflow region the H2 emission is totally absent, as seen by thehigh contrast between the emissions in the 4.5 μm and 8 μmbands in Figure 4. The lack of H2 emission and the prevalenceof scattered photospheric light rule out the possibility that thewide-angle outflow is part of the jet-driven bow shock. Thus,we can constrain the extent of any jet precession to be strictly
5

The Astrophysical Journal, 741:60 (15pp), 2011 November 1 Velusamy et al.
Figure 5. 8 μm image (left panel) and difference images between IRAC bands (right three panels) showing the spatial variation of excitation across the bow shocksinferred from the colors: (a) NE lobe; (b) SW lobe. In H2 a total of 29 jet features, “knots,” are identified as marked on the images in all panels. The numbered labels1–22 represent the knots identified by the peak emissions in the 8 μm image. The knots identified by K1–K7 represent those less prominent at 8 μm but are bright at4.5 μm.
confined to the emission region in the 8 μm image as shown bythe schematic in Figure 4.
Whatever is the cause for the wide-angle cavity in Cep E(by precessing jets or by wide-angle low-velocity outflow), inSpitzer images it is observable only in the scattered light. We canclearly distinguish between the jet and the wide-angle cavity byusing the IRAC colors for scattered light in the wide-angle cavityand H2 emission in the narrow high-velocity jets. In Figure 4(a)the 8 μm emission (dominated by H2 emission in the jets andbow shocks) correlates well with the inner narrow jet featuresin the 4.5 μm image, but not with the biconical emission awayfrom the jet. Thus, it is clear that biconical low surface emissionis distinctly different from the jet emission and it is comingfrom the scattered light in a wide-angle cavity. In Figure 4(a)the geometry of the wide-angle outflow and the narrow high-velocity jets in the northern lobe are shown schematically byconical boundaries. The emission in the region outside theinner cone clearly represents the scattered light in the wide-
angle outflow and that from inside the inner cone boundaryrepresents the jets and their associated bow shocks. To study thespectral characteristics of the scattered photospheric emissionfrom the protostar in the wide-angle outflow cavity, we wereable to separate the scattered emission from the jet emission bycomputing the flux densities at each IRAC band integrated overthe area between the inner and outer boundaries of the outflowcone as shown in Figure 4(a). The scattered light flux densityspectral plot is shown in Figure 4(b). This spectrum is distinctlydifferent from those in Figure 6(a) for the “knots” in the jetsand bow shocks. On the other hand, between 4.5 μm and 8 μmit is suggestive of the photospheric (at T = 4300 K) emissionspectrum (which is discussed in Section 3.4) obtained from theSED analysis (see Section 3.4), if we take into consideration theeffects of higher extinction at 3.6 μm. The K-band extinctionsare in the range of 2.1–2.4 mag across the northern lobe and1.4 mag for the southern lobe (Smith et al. 2003). The lower fluxdensity at 3.6 μm, even after the extinction correction (using the
6
The Astrophysical Journal, 741:60 (15pp), 2011 November 1 Velusamy et al.
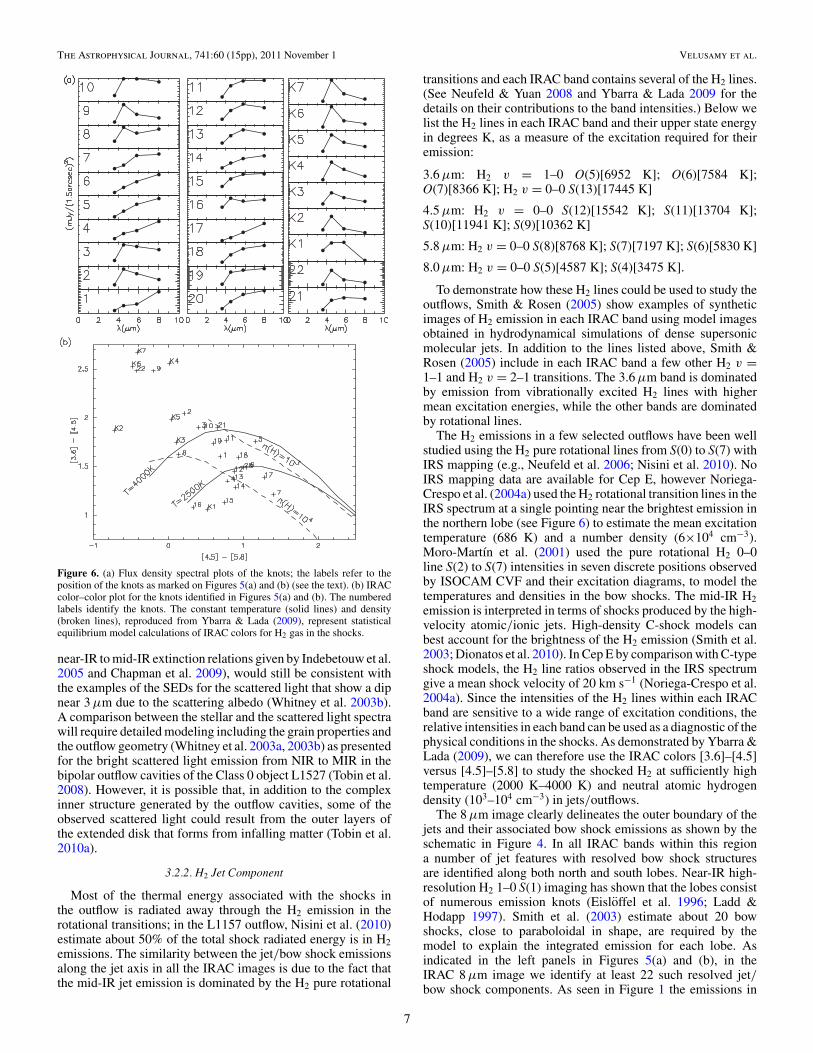
Figure 6. (a) Flux density spectral plots of the knots; the labels refer to theposition of the knots as marked on Figures 5(a) and (b) (see the text). (b) IRACcolor–color plot for the knots identified in Figures 5(a) and (b). The numberedlabels identify the knots. The constant temperature (solid lines) and density(broken lines), reproduced from Ybarra & Lada (2009), represent statisticalequilibrium model calculations of IRAC colors for H2 gas in the shocks.
near-IR to mid-IR extinction relations given by Indebetouw et al.2005 and Chapman et al. 2009), would still be consistent withthe examples of the SEDs for the scattered light that show a dipnear 3 μm due to the scattering albedo (Whitney et al. 2003b).A comparison between the stellar and the scattered light spectrawill require detailed modeling including the grain properties andthe outflow geometry (Whitney et al. 2003a, 2003b) as presentedfor the bright scattered light emission from NIR to MIR in thebipolar outflow cavities of the Class 0 object L1527 (Tobin et al.2008). However, it is possible that, in addition to the complexinner structure generated by the outflow cavities, some of theobserved scattered light could result from the outer layers ofthe extended disk that forms from infalling matter (Tobin et al.2010a).
3.2.2. H2 Jet Component
Most of the thermal energy associated with the shocks inthe outflow is radiated away through the H2 emission in therotational transitions; in the L1157 outflow, Nisini et al. (2010)estimate about 50% of the total shock radiated energy is in H2emissions. The similarity between the jet/bow shock emissionsalong the jet axis in all the IRAC images is due to the fact thatthe mid-IR jet emission is dominated by the H2 pure rotational
transitions and each IRAC band contains several of the H2 lines.(See Neufeld & Yuan 2008 and Ybarra & Lada 2009 for thedetails on their contributions to the band intensities.) Below welist the H2 lines in each IRAC band and their upper state energyin degrees K, as a measure of the excitation required for theiremission:
3.6 μm: H2 v = 1–0 O(5)[6952 K]; O(6)[7584 K];O(7)[8366 K]; H2 v = 0–0 S(13)[17445 K]
4.5 μm: H2 v = 0–0 S(12)[15542 K]; S(11)[13704 K];S(10)[11941 K]; S(9)[10362 K]
5.8 μm: H2 v = 0–0 S(8)[8768 K]; S(7)[7197 K]; S(6)[5830 K]
8.0 μm: H2 v = 0–0 S(5)[4587 K]; S(4)[3475 K].
To demonstrate how these H2 lines could be used to study theoutflows, Smith & Rosen (2005) show examples of syntheticimages of H2 emission in each IRAC band using model imagesobtained in hydrodynamical simulations of dense supersonicmolecular jets. In addition to the lines listed above, Smith &Rosen (2005) include in each IRAC band a few other H2 v =1–1 and H2 v = 2–1 transitions. The 3.6 μm band is dominatedby emission from vibrationally excited H2 lines with highermean excitation energies, while the other bands are dominatedby rotational lines.
The H2 emissions in a few selected outflows have been wellstudied using the H2 pure rotational lines from S(0) to S(7) withIRS mapping (e.g., Neufeld et al. 2006; Nisini et al. 2010). NoIRS mapping data are available for Cep E, however Noriega-Crespo et al. (2004a) used the H2 rotational transition lines in theIRS spectrum at a single pointing near the brightest emission inthe northern lobe (see Figure 6) to estimate the mean excitationtemperature (686 K) and a number density (6×104 cm−3).Moro-Martın et al. (2001) used the pure rotational H2 0–0line S(2) to S(7) intensities in seven discrete positions observedby ISOCAM CVF and their excitation diagrams, to model thetemperatures and densities in the bow shocks. The mid-IR H2emission is interpreted in terms of shocks produced by the high-velocity atomic/ionic jets. High-density C-shock models canbest account for the brightness of the H2 emission (Smith et al.2003; Dionatos et al. 2010). In Cep E by comparison with C-typeshock models, the H2 line ratios observed in the IRS spectrumgive a mean shock velocity of 20 km s−1 (Noriega-Crespo et al.2004a). Since the intensities of the H2 lines within each IRACband are sensitive to a wide range of excitation conditions, therelative intensities in each band can be used as a diagnostic of thephysical conditions in the shocks. As demonstrated by Ybarra &Lada (2009), we can therefore use the IRAC colors [3.6]–[4.5]versus [4.5]–[5.8] to study the shocked H2 at sufficiently hightemperature (2000 K–4000 K) and neutral atomic hydrogendensity (103–104 cm−3) in jets/outflows.
The 8 μm image clearly delineates the outer boundary of thejets and their associated bow shock emissions as shown by theschematic in Figure 4. In all IRAC bands within this regiona number of jet features with resolved bow shock structuresare identified along both north and south lobes. Near-IR high-resolution H2 1–0 S(1) imaging has shown that the lobes consistof numerous emission knots (Eisloffel et al. 1996; Ladd &Hodapp 1997). Smith et al. (2003) estimate about 20 bowshocks, close to paraboloidal in shape, are required by themodel to explain the integrated emission for each lobe. Asindicated in the left panels in Figures 5(a) and (b), in theIRAC 8 μm image we identify at least 22 such resolved jet/bow shock components. As seen in Figure 1 the emissions in
7

The Astrophysical Journal, 741:60 (15pp), 2011 November 1 Velusamy et al.
both lobes along the jet axis in all four IRAC bands appearto be morphologically very similar. Although all the knotsidentified at 8 μm (Figure 5) have counterparts in all otherbands, their relative intensities vary widely. Furthermore, inthe 4.5 μm image we could easily identify at least an additionalseven knots (indicated as K1–K7 in Figure 5) that appear lessprominently at 8 μm. To fully characterize the shock conditionsin these H2 knots and bow shock features and to bring out theirdifferences, we constructed the IRAC channel difference images(Figure 5): 4.5 μm–3.6 μm, 5.8 μm–4.5 μm, and 8 μm–4.5 μm.The difference image 4.5 μm–3.6 μm is more like a continuumsubtracted H2 line emission (assuming the 3.6 μm band behaveslike a continuum filter with little H2 line emission) and resemblesthe 2.12 μm image (Eisloffel et al. 1996; Ladd & Hodapp1997), tracing the brightest emission closer to the leadingbow shock edges on small scales, while the difference images5.8 μm–4.5 μm and 8 μm–4.5 μm show strong color differencesdetermined by the shock excitation along the wings, spatiallyaway from their leading edges.
To obtain a more quantitative description of the knots iden-tified in Figure 5, we measured their flux densities in eachIRAC band by integrating over a 1.′′5 × 1.′′5 area and these arealso shown as spectral plots in Figure 6(a). Though the imageshave subarcsecond resolution, to obtain a more robust estima-tion of the flux densities we used a larger area of integration.These spectra indicate that the excitation conditions vary widelyamong the knots: 14 (including all seven selected by the 4.5 μmpeak emission) have apparent spectral peaks at 4.5 μm; 10 havespectral peaks between 5.8 and 8 μm, while five have no appar-ent peak with fluxes increasing beyond 8 μm. These differencesare also clearly brought out in the difference images shownin Figure 5. The extinction corrections will increase the fluxesat 3.6 and 4.5 μm relative to the others; however, the spectralshapes do not change significantly. Our results of such strong4.5 μm emission is consistent with the hydrodynamic simula-tions of Smith & Rosen (2005). The knots with the highestexcitation as inferred from the narrow spectral peaks at 4.5 μm(nos. K7, K6, and K2) are all located near the brightest tips of thesouthern and northern lobes, respectively. While the knots K7and K6 are among the brightest, the knot K2 is only marginallybright. Except for these three, there is no other striking corre-lation between the excitation conditions (spectral peak/shape)in the knots and their radial distance from the protostar or anyparticular age sequence.
The IRAC H2 emission spectral data presented here will beuseful to constrain the C-shock models for each jet feature alongwith those available in the near-IR. We use the colors [3.6]–[4.5]and [4.5]–[5.8] derived from the spectral data for each knotas diagnostics to constrain the temperature and densities asdiscussed by Ybarra & Lada (2009). The IRAC color–colorplot for the H2 knots in Cep E is shown in Figure 6(b). Thelabels in Figure 6(b) represent the color–color regime for eachH2 knot, identified in Figure 5. The IRAC color–color plotfor Cep E knots is remarkably similar to those obtained forHH54 (Ybarra & Lada 2009). The majority of the knots, 17out of 29, appear to have excitation conditions corresponding totemperatures 2500–4000 K and densities 103–104 cm−3.
The observed bow shock structures (leading edges and wings)projected on the sky and the subsequent interpretation of theirshock layers emitting in different IRAC bands are criticallydependent on the observer’s viewing geometry with respect tothe shock. Taking advantage of the subarcsecond resolutionin the deconvolved IRAC images, we can study in some
greater detail the spatial characteristics in each image to resolveshock geometry. In Figure 7 we show a blowup of the IRACimages near the tip of the NE and SW lobes. We use thegeometrical shape of the 4.5 μm and 8 μm emissions of theshock features combined with their relative displacements to“infer” the direction the shocks which is likely to be consistentwith the schematic bow shock structure, for example, as shownin Figure 13 in Moro-Martın et al. (2001). In such cases weexpect the atomic/ionic emission lines to originate at the tip ofthe bow shock (in the “Mach disk” and stagnation tip) wherethe J-shocks are dominant, but, the H2 line emissions originatefarther down along the bow shock wings where the shocks areoblique and more likely to be C-type. For a better understandingof the relationship between the structural complexity in theIRAC emissions and their colors with the atomic/ionic jet head,we plot in Figures 7(a) and (b) the atomic jet traced by the MIPS24 μm emission from the [Fe ii] and [S i] lines (discussed belowin Section 3.3). The 24 μm emission contour defines the locationof the jet head (Mach disk/stagnation tip), which is driving thebow shock. The high-excitation H2 lines in the 4.5 μm band arelikely to be relatively closer to the “tip” than the low excitationtraced by 8 μm band. Schematically, in Figures 7(a) and (b)the 4.5 μm intensity contours overlaid on the 8 μm gray scaledelineate the bow shock closer to its leading edge (the tip),while the 8 μm emission traces the projected spatial structurethe bow shock wings away from the tip. The bright and darkbands seen across several knots in the 5.8 μm–4.5 μm and8 μm–4.5 μm difference images (e.g., nos. 9, 10, 12, K4, K7,and 21 in the right two panels in Figures 5(a) and (b)) trace theprojected separation between the bow shock tips and wings. Thegeometry in two systems of knots consisting of numbers 3/5/6(Figures 5(a) and 7(a)) and K5/18/19 (Figure 5(b)), respectively,seems consistent, with each one describing a bow shock tipwith wings on either side, moving nearly in the plane of thesky. The two outermost arc-like emission features in the 4.5 μmemission (Figure 7(a)) are also detected at 2.12 μm (Ladd &Hodapp 1997). However, the outermost arc-like emission at8 μm (Figure 7(a)) is located between the two 4.5 μm arcs,behind the leading outer 4.5 μm arc and slightly ahead of thesecond 4.5 μm arc, with ∼1.′′5 (1000 AU) separation betweenthem. The 8 μm arc does not seem consistent with bow shockwings but rather with a shocked layer between two successiveleading shocks described by the 4.5 μm and 2.12 μm arcsand originating in two successive ejections. It is interesting tonote that the 4.5 μm outermost arc has a flux density spectrum(K1 in Figure 6(a)) resembling that of the scattered light inthe wide-angle outflow cavity (Figure 4(b)). It is, therefore,possible that this outermost arc indeed represents scattered lightin the cavity produced by the NE jet. However, the continuumsubtracted 2.12 μm H2 line emission (Ladd & Hodapp 1997)strongly favors its identifications as a bow shock H2 emissionfeature.
The IRAC data for emissions near the SW tip as shown inFigures 5(b) and 7(b) suggest a very complex system of oblique(C-type) shocks with possible twists in the jet kinematics andgeometry. The image in Figure 7(b) shows a plausible scenariofor the C-type shocks, seen in projection, as traced by IRACbands. The location of the jet head (Mach disk/stagnation tip)that is driving the bow shock is indicated by the 24 μm emissioncontours. The multiple C-type shocks suggested by the 4.5 μmand 8 μm emissions, surrounding the 24 μm jet feature, seemto be tracing different pieces of the bow shock and its wings,expanding into or out of the plane (but seen in projection on
8

The Astrophysical Journal, 741:60 (15pp), 2011 November 1 Velusamy et al.
Figure 7. 4.5 μm intensity contours (white) overlaid on 8 μm emission (gray scale) showing the relative displacement between them. The MIPS 24 μm emission(tracing the atomic gas in the jet head/J-shocks) is shown by selected solid black contours (near peak and half-power intensities). (a) Tip of NE lobe. Red arcs show aschematic of three bow shocks as inferred from 4.5 μm emissions. (b) Tip of SW lobe showing a complex system of oblique C-type shocks. The arcs (dashed lines)represent leading edges of C-type shocks as inferred from the 4.5 μm emissions. The short arrows mark the “putative” projected oblique shock directions as “inferred”from the viewing geometry and the relative displacement between 8 μm and 4.5 μm intensities (see the text). The long arrow marks the direction of the atomic jet.
the sky), all driven by a single jet head. In Figure 7(b) thelong arrow marks the general direction of the atomic jet whilethe short arrows indicate oblique shocks moving in and out ofthe plane. We can interpret the relative outward and inwarddisplacements of the 4.5 μm emissions with respect to the 8 μmfor knots K7 and 21, respectively, as due to the viewing geometryof the observer and the C-type shock orientations. As anotherexample of the geometry of the bow shock with respect to theMach disk, in Figure 7(a) we show the association betweenthe 24 μm atomic/ionic jet feature (no. 2 in Figure 8(a)) and thebow shock traced by knots 4, 5, and 6 (identified as arc no. 3 inFigure 7(a)).
3.3. Atomic Jets: MIPS 24 μm Compact Sources
In Figure 8 we show an overlay of the MIPS 24 μm HiResimage (as contours) on the 4.5 μm image. At 24 μm, in additionto the protostar, we detect at least three compact featurescoincident with the brightest emission in the bow shocks astraced by the H2 emission in the 4.5 μm and other IRAC bands.These compact emissions at MIPS 24 μm coincide with the jetheads. Although some enhanced emission from the collisionallyheated dust in the shocks is possible, it is more likely that the24 μm emission is tracing the hottest atomic/ionic gas in thebow shocks, possibly similar to that seen in the HH46/47 system(Velusamy et al. 2007). In contrast to the morphology of the H2emission, which are bow shocks with extended long arcs, the24 μm emission is more compact and is confined to the tip ofthe bow shock coinciding with the jet head. We can expect to seesuch differences if the 24 μm emission is produced by higherexcitation (velocity) shocks arising closer to the apex of the jet asin the case of J-shocks, while the H2 emission is produced furtherback in the low-velocity C-shocks. We can, therefore, interpret
the 24 μm emission to represent that produced in the J-shocks(ionic/atomic shocks) from the bright [Fe ii] line emissions at24.51 and 25.98 μm within the MIPS passband, as observed inthe case of HH46/47. For one of the sources, no. 1 in Figure 8(a),we can use the IRS spectral data to substantiate the fact that the24 μm emission is indeed atomic. In the previously publishedIRS spectrum (Figure 6 in Noriega-Crespo et al. 2004a) of thisfeature we identify only the [S i] 3P1 − 3P2 line at 24.249 μm,but no [Fe ii] line emissions. In order to characterize the atomicemissions within the MIPS 24 μm passband, we replotted thespectrum using the IRS data obtained from the Spitzer archives.This spectrum, shown in Figure 8(b), is consistent with thepublished spectrum except for the baseline subtraction. The[S i] line first detected by Noriega-Crespo et al. (2004a) in thisposition in Cep E is clearly seen in this spectrum. The [Fe ii]line at 25.98 μm and the H2 S(0) at 28.22 μm are also detectedwith relatively low intensities. We use the intensities in thisspectrum ([S i] at 0.82 Jy and [Fe ii] at 0.06 Jy) to estimatequalitatively the contribution to the 24 μm passband from theatomic spectral lines within the MIPS passband as indicatedin Figure 6(b). The total integrated line emission correspondsto 0.64 Jy in a single IRS channel (0.17 μm wide, which isabout 3% of the total passband) appearing at ∼60% level ofthe passband response. We would then expect this line emissionto appear as a 13 mJy continuum source in the MIPS 24 μmimage. Thus, in the HiRes image (with 2′′ spatial resolution) weexpect it to have a brightness of ∼136 MJy sr−1. This valueis in reasonable agreement with the observed brightness of103 MJy sr−1, considering the uncertainties in estimating theequivalent intensity in the MIPS continuum band for a givenchannel intensity in the IRS spectrum. We therefore concludethat the 24 μm emission in this jet feature in Cep E is truly atomic
9

The Astrophysical Journal, 741:60 (15pp), 2011 November 1 Velusamy et al.
Figure 8. (a) 24 μm emission (contours) overlaid on the 4.5 μm image. The intensity contours are at 4, 8, 16, 32, 64, 128, 256, 512, and 1024 MJy sr−1. The contoursnear the center represent the protostar with a peak intensity of 47,597 MJy sr−1. The long arrow marks the emission feature for which the IRS spectrum is shown.The labels 1–3 mark the 24 μm emission peaks along the jet. (b) IRS LL spectrum of the 24 μm NE emission peak (labeled 1). The atomic/ionic spectral features aremarked. The MIPS 24 μm band response is also shown.
in origin, primarily from [S i]. Thus, after HiRes reprocessing,the Spitzer MIPS 24 μm image is found to be an extremelyuseful diagnostic of the atomic component of the protostellarjets.
For the other two 24 μm sources (nos. 2 and 3 as markedby the short arrows in Figure 8(a)) seen along the jet emission,there are no matching IRS spectra to interpret the origin of theiremission as atomic/ionic gas in the jet heads. However, in thecase of no. 3, strong [S ii]λλ6717/31 emission is observed byAyala et al. (2000) in this position, which coincides with HH377.Furthermore, [S ii] and [Fe ii] have very similar excitationenergies (Nisini et al. 2002) and, therefore, we can expect asignificant contribution from [S i] and/or [Fe ii] to the MIPS24 μm emission. Their location along the jet axis coincides wellwith the bright emission knots/jet heads (inferred as arisingfrom H2) seen in the IRAC bands. Also their positions coincidewith the tip of the bow shocks. We expect to see [S i] and [Fe ii]fine structure line emission in the spectra of HH objects, whichshow the classical signatures of collisional excitation similar tothose observed in the IRS spectra of supernova remnants likeIC 443 (Noriega-Crespo et al. 2009). Therefore, by analogyto that identified in the jets of HH46/47 system (Velusamyet al. 2007), we can regard these 24 μm emission features tohave the same characteristics as the source 1 discussed above.Among the three, the source 3 in the south lobe is the brightest(peak at 345 MJy sr−1) and is also the source of brightestemission in the IRAC bands. The second brightest source 2(with peak 145 MJy sr−1) is located in the NE lobe, fartheraway than source 1, but the IRAC emission here is weakerthan for source 1. In the close vicinity of the sources 1 and2 there are multiple bow shocks and jet heads in the IRACbands. However, the 24 μm peaks are exclusively coincidentwith only one of the jet heads implying that not all bow shocksand jet heads have associated 24 μm sources. In other words,not all jet heads have detectable atomic/ionic emission. The two
outermost bow shocks in the northern lobe, which are clearlyseen in the IRAC bands (see Figure 7(a)), do not show anycompact 24 μm sources. Furthermore, these bow shocks do notshow the bright jet heads as seen in the other cases.
As pointed out earlier, not all jet heads or knots with strongH2 emission in the IRAC bands have associated atomic/ioniccounterparts. The atomic/ionic emission appears to requirehigher excitation shocks than those producing the mid-IR H2lines. Dionatos et al. (2010) discuss in detail the physicalconditions required for the mid-IR atomic/ionic and H2 lineemissions in these jet features. They show that the low-velocity10–15 km s−1 shock models that best fit the warm H2 emissionare unable to reproduce the observed [Fe ii] in HH211. It wouldbe difficult for us to quantify the differences in H2 and atomic/ionic emission from the jet heads or knots in Cep E withoutappropriate shock models. However, the association betweenthe 24 μm atomic/ionic jet feature and the bow shock knotsobserved in IRAC bands can be interpreted in terms of theschematic bow shock model as discussed above in Section 3.2.2.The 24 μm feature 3 is associated with several knots K6, K7,21, and 22 (in Figures 5(b) and 7(b)), and it can be identifiedas the Mach disk driving a system of oblique C-type shocksrepresented by these knots. Similarly, the 24 μm compact source1 is associated with the 4.5 and 8 μm knots no. 10, K3, andK4, respectively (Figure 5(a)), and can be interpreted as theatomic/ionic jet driving the bow shock represented by theseknots around it. The 24 μm atomic/ionic jet feature 2 bringsout even more clearly its association with the bow shock and itswings observed in IRAC bands. This feature is associated withthe knots 4, 5, and 6, and the diffuse emission along the bowshock wings (arc no. 3 as shown in Figure 7(a)).
So far, we have IRS spectral data for only two 24 μm compactsources associated with the atomic jet head (knots), but theyseem to have very different atomic spectral characteristics. Thejet head in the HH46/47 system shows a strong [Fe ii] line while
10

The Astrophysical Journal, 741:60 (15pp), 2011 November 1 Velusamy et al.
that in Cep E shows a strong [S i] line and very weak [Fe ii].Such differences suggest that the physical conditions in the jetheads or knots can vary widely. The IRS spectral line intensitiesin the jet heads or knots, similar to those in Cep E and HH46/47, in HH211 (Dionatos et al. 2010), HH54, HH 7–11 (Neufeldet al. 2006), BHR71, L1157, L1448, NGC 2071, and VLA 1623(Neufeld et al. 2009), show a wide variation in the intensity ratio[Fe ii] 26 μm to [S i] 25 μm. Such variations can be interpretedas electron density and temperature effects on the ionization ofFe, as well as differences in the collisional excitation. Neufeldet al. (2009) find evidence for some spatial segregation betweenthe [S i] and [Fe ii] emitting regions, suggesting that [Fe ii] istracing the faster, dissociative shocks. Thus, the differencesbetween the 24 μm features in Cep E and HH46/47 are dueto their shock conditions, namely, shocks in Cep E being lessdissociative than in HH46/47.
The Infrared Space Observatory (ISO) Long WavelengthSpectrometer (LWS) spectra of both the north and south lobes inCep E detected strong [O i] 63 μm and [C ii] 158 μm emissions(Moro-Martın et al. 2001), which are important coolants in low-velocity dissociative shocks. The low-intensity features in thedeconvolved MIPS 70 μm image (Figure 2) are very intriguing,especially since they lie along the jet/outflow lobes in Cep E.Of special interest to us is the fact that the MIPS 70 μm bandincludes the [O i] 63 μm line near the end of its passband at∼75% response. In the ISO LWS spectra the [O i] 63 μm linewas detected as the brightest line emission with intensities of 9.3and 12 × 10−19 W cm−2 at the NE and SW lobes, respectively.Such emission would be observed in the MIPS 70 μm imageas continuum sources with total flux densities of 0.58 Jy and0.75 Jy, respectively, for the NE and SW lobes, which arehigher by a factor two to three than the features in Figure 2.These feature are at intensities at a level of 0.1% of the peak(protostar) emission. The SW feature is the brighter of the twoand in the 70 μm point response function it coincides with anenhanced sidelobe in the Airy ring, at ∼6.3% level. We believethe MIPS 70 μm data do not warrant such high dynamic range(>1000) in the HiRes processed image. These features appearto be residuals of the Airy ring. Furthermore, their locations donot seem to correlate with any of the features observed in 24 μmor the IRAC bands.
3.4. Photometric SED Analysis of Cep E Protostellar Emission
We obtained the Spitzer IRAC and MIPS photometry usingthe mosaic images. For the IRAC data we used the artifactcorrected BCD’s (cbcd images) and Imasks (bimsk), with thestandard overlap and mosaic modules, to create the mosaicimages for each of the IRAC bands. The mosaics were doneusing a pixratio = 2, which results in a pixel scale of 0.′′6per mosaic pixel. IRAC photometry was obtained by using thephot task in IRAF. An aperture radius of 4 pixels (2.′′4), skyannulus between 4 and 8 pixels, was used to obtain the aperturephotometry. For the 3.6 μm, 4.5 μm, 5.8 μm, and 8 μm bands,we used zero-point magnitudes of 18.59, 18.09, 17.48, and 16.7,respectively, and corresponding aperture corrections of 1.213,1.234, 1.379, and 1.584.
The Spitzer MIPS BCD data in the 24 μm and 70 μmbands were used to create the basic mosaics using the relevanttemplates in the MOPEX software. Subsequently, photometrywas obtained by using the appropriate default MOPEX/APEXsingle-frame templates for each band. The recommendations of
Figure 9. SED fitting for the Cep E protostar. The solid black line shows the best-fitting model. Gray lines show the models that satisfy the criteria χ2−χ2
best < 3.Black dots are data points and triangles are upper limits. The dashed line showsthe stellar photosphere of the best-fit model.
the Spitzer data analysis cookbook recipe 24 were followed.3
We note that our MIPS photometry agrees with the photometryderived by Noriega-Crespo et al. (2004a) to better than 5%.
We constructed the SED of the Cep E protostar by combiningour Spitzer photometry with other photometry from the litera-ture. Chini et al. (2001) have studied this protostar at millimeterwavelengths, using the fluxes at 450 and 850 μm obtained withSCUBA on the James Clerk Maxwell Telescope and at 1300 μmwith the IRAM telescope. The aperture sizes used to derive thefluxes are all larger than 10′′, which is larger than the apertureused to obtain the MIPS 70 μm photometry. In order to model theprotostar using the SED fitting tool by Robitaille et al. (2007),it is essential to classify the available data as “data points” and“upper limits.” The data points are used to obtain the best modelfitting and computing the χ2 factor, whereas the upper limitsserve in constraining the fits. We note that the protostar ap-pears as a point source in the Spitzer IRAC and MIPS bands(Figure 3). Therefore, we use the IRAC and MIPS photometryas data points in subsequent modeling. The millimeter fluxesfrom Chini et al. (2001) are obtained from apertures larger than10′′ and could be contaminated by the outflow and surroundingcloud. Therefore, we use the millimeter data points as upperlimits. We also use the IRAS 12 μm flux (obtained from anaperture of 30′′) as an upper limit. The protostar is not detectedin the Two Micron All Sky Survey K band, therefore an upperlimit of 16 mag in the K band was used to constrain the SED.
The SED, characterized by these data points and upper limits,is modeled using the SED fitting tool (Robitaille et al. 2007).We note that the actual photometry has an accuracy closer to1%–2%. However, we assumed photometric uncertainties of10% as a conservative limit to minimize the risk of includingbiases in the modeling. The SED fitting tool requires a range ofvalues for the distance and interstellar extinction to the sourceto scale the models in the grid to the observed data. The lowerand upper limits to the distance were set at 0.65 and 0.8 kpc,respectively. The interstellar extinction was set to vary between2 and 8 visual magnitudes.
The observed SED is well represented by a young stellarobject (YSO) model in the Class 0/I evolutionary stage. Figure 9
3 http://ssc.Spitzer.caltech.edu/dataanalysistools/cookbook/29/
11
The Astrophysical Journal, 741:60 (15pp), 2011 November 1 Velusamy et al.
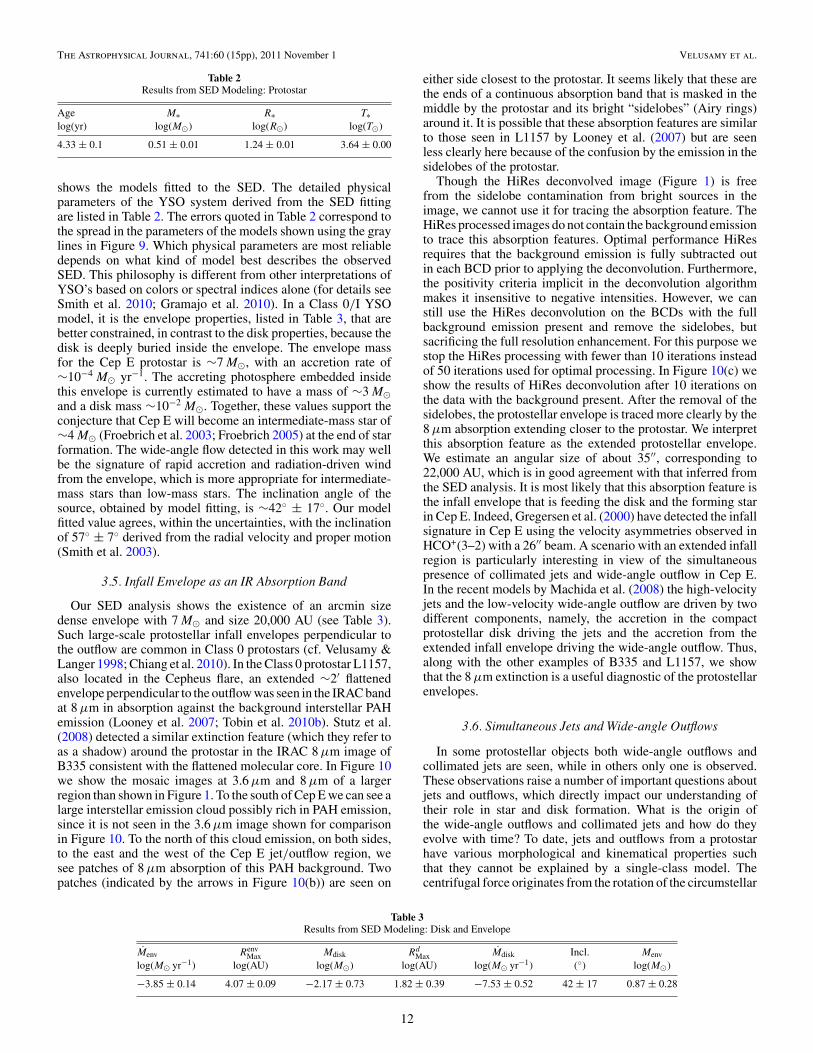
Table 2Results from SED Modeling: Protostar
Age M∗ R∗ T∗log(yr) log(M�) log(R�) log(T�)
4.33 ± 0.1 0.51 ± 0.01 1.24 ± 0.01 3.64 ± 0.00
shows the models fitted to the SED. The detailed physicalparameters of the YSO system derived from the SED fittingare listed in Table 2. The errors quoted in Table 2 correspond tothe spread in the parameters of the models shown using the graylines in Figure 9. Which physical parameters are most reliabledepends on what kind of model best describes the observedSED. This philosophy is different from other interpretations ofYSO’s based on colors or spectral indices alone (for details seeSmith et al. 2010; Gramajo et al. 2010). In a Class 0/I YSOmodel, it is the envelope properties, listed in Table 3, that arebetter constrained, in contrast to the disk properties, because thedisk is deeply buried inside the envelope. The envelope massfor the Cep E protostar is ∼7 M�, with an accretion rate of∼10−4 M� yr−1. The accreting photosphere embedded insidethis envelope is currently estimated to have a mass of ∼3 M�and a disk mass ∼10−2 M�. Together, these values support theconjecture that Cep E will become an intermediate-mass star of∼4 M� (Froebrich et al. 2003; Froebrich 2005) at the end of starformation. The wide-angle flow detected in this work may wellbe the signature of rapid accretion and radiation-driven windfrom the envelope, which is more appropriate for intermediate-mass stars than low-mass stars. The inclination angle of thesource, obtained by model fitting, is ∼42◦ ± 17◦. Our modelfitted value agrees, within the uncertainties, with the inclinationof 57◦ ± 7◦ derived from the radial velocity and proper motion(Smith et al. 2003).
3.5. Infall Envelope as an IR Absorption Band
Our SED analysis shows the existence of an arcmin sizedense envelope with 7 M� and size 20,000 AU (see Table 3).Such large-scale protostellar infall envelopes perpendicular tothe outflow are common in Class 0 protostars (cf. Velusamy &Langer 1998; Chiang et al. 2010). In the Class 0 protostar L1157,also located in the Cepheus flare, an extended ∼2′ flattenedenvelope perpendicular to the outflow was seen in the IRAC bandat 8 μm in absorption against the background interstellar PAHemission (Looney et al. 2007; Tobin et al. 2010b). Stutz et al.(2008) detected a similar extinction feature (which they refer toas a shadow) around the protostar in the IRAC 8 μm image ofB335 consistent with the flattened molecular core. In Figure 10we show the mosaic images at 3.6 μm and 8 μm of a largerregion than shown in Figure 1. To the south of Cep E we can see alarge interstellar emission cloud possibly rich in PAH emission,since it is not seen in the 3.6 μm image shown for comparisonin Figure 10. To the north of this cloud emission, on both sides,to the east and the west of the Cep E jet/outflow region, wesee patches of 8 μm absorption of this PAH background. Twopatches (indicated by the arrows in Figure 10(b)) are seen on
either side closest to the protostar. It seems likely that these arethe ends of a continuous absorption band that is masked in themiddle by the protostar and its bright “sidelobes” (Airy rings)around it. It is possible that these absorption features are similarto those seen in L1157 by Looney et al. (2007) but are seenless clearly here because of the confusion by the emission in thesidelobes of the protostar.
Though the HiRes deconvolved image (Figure 1) is freefrom the sidelobe contamination from bright sources in theimage, we cannot use it for tracing the absorption feature. TheHiRes processed images do not contain the background emissionto trace this absorption features. Optimal performance HiResrequires that the background emission is fully subtracted outin each BCD prior to applying the deconvolution. Furthermore,the positivity criteria implicit in the deconvolution algorithmmakes it insensitive to negative intensities. However, we canstill use the HiRes deconvolution on the BCDs with the fullbackground emission present and remove the sidelobes, butsacrificing the full resolution enhancement. For this purpose westop the HiRes processing with fewer than 10 iterations insteadof 50 iterations used for optimal processing. In Figure 10(c) weshow the results of HiRes deconvolution after 10 iterations onthe data with the background present. After the removal of thesidelobes, the protostellar envelope is traced more clearly by the8 μm absorption extending closer to the protostar. We interpretthis absorption feature as the extended protostellar envelope.We estimate an angular size of about 35′′, corresponding to22,000 AU, which is in good agreement with that inferred fromthe SED analysis. It is most likely that this absorption feature isthe infall envelope that is feeding the disk and the forming starin Cep E. Indeed, Gregersen et al. (2000) have detected the infallsignature in Cep E using the velocity asymmetries observed inHCO+(3–2) with a 26′′ beam. A scenario with an extended infallregion is particularly interesting in view of the simultaneouspresence of collimated jets and wide-angle outflow in Cep E.In the recent models by Machida et al. (2008) the high-velocityjets and the low-velocity wide-angle outflow are driven by twodifferent components, namely, the accretion in the compactprotostellar disk driving the jets and the accretion from theextended infall envelope driving the wide-angle outflow. Thus,along with the other examples of B335 and L1157, we showthat the 8 μm extinction is a useful diagnostic of the protostellarenvelopes.
3.6. Simultaneous Jets and Wide-angle Outflows
In some protostellar objects both wide-angle outflows andcollimated jets are seen, while in others only one is observed.These observations raise a number of important questions aboutjets and outflows, which directly impact our understanding oftheir role in star and disk formation. What is the origin ofthe wide-angle outflows and collimated jets and how do theyevolve with time? To date, jets and outflows from a protostarhave various morphological and kinematical properties suchthat they cannot be explained by a single-class model. Thecentrifugal force originates from the rotation of the circumstellar
Table 3Results from SED Modeling: Disk and Envelope
Menv RenvMax Mdisk Rd
Max Mdisk Incl. Menv
log(M� yr−1) log(AU) log(M�) log(AU) log(M� yr−1) (◦) log(M�)
−3.85 ± 0.14 4.07 ± 0.09 −2.17 ± 0.73 1.82 ± 0.39 −7.53 ± 0.52 42 ± 17 0.87 ± 0.28
12

The Astrophysical Journal, 741:60 (15pp), 2011 November 1 Velusamy et al.
Figure 10. Extinction at 8 μm through a dense envelope surrounding the protostar. Mosaic images of a large region around the protostar showing the interstellarbackground at 3.6 μm (panel (a)) and at 8 μm (panel (b)); the arrows (in panel (b)) mark extinction near the protostar. (c) The 8 μm HiRes deconvolved image after10 iterations, processed without background subtraction (see the text). The ellipse indicates the flattened envelope region with high extinction at 8 μm.
accretion disk and the jets are ultimately powered by the infallof material, with the rotation and magnetic fields playing acrucial role. The magnetocentrifugal origin of jets and theirlaunch from the magnetized accretion disk of the protostar (cf.Ouyed & Pudritz 1997) are generally accepted, although thedetailed mechanism is under debate. The wide-angle outflowmay also be jet driven (cf. Raga & Cabrit 1993; Ostriker et al.2001) or wind driven (cf. Shu et al. 2000). In the jet-drivenbow shock model, an episodic variation in jet velocity producesan internal bow shock driving an internal shell, in addition tothe terminal shock. Poorly collimated flows seen as wide-angleoutflows can be due to extreme precession of the jet (Shepherdet al. 2000) and indistinguishable from wind-driven wide-angleoutflows. Other explanations include a turbulent jet model (cf.Canto & Raga 1991; Watson et al. 2004), and a circulationmodel, involving radiation and magnetocentrifugal accelerationand collimation producing heated pressure-driven outflows (cf.Lery 2003; Combet et al. 2006).
In a unified model for bipolar jets and outflows, Shang et al.(2006) incorporate the essential features of the primary X-wind,which is driven magnetocentrifugally from close to the protostarin the interface between its magnetosphere and the associatedcircumstellar disk. This primary wind has an angle-dependentdensity distribution, with a dense axial jet surrounded by a moretenuous wide-angle wind. The resulting structure shows twoprominent dense features: a shell of mostly swept-up ambientmaterial and a jet along the axis that is the densest part ofthe primary wind. The shell can be either well collimated, asobserved for the class of jet-like molecular outflows, or wideopen, as in the classical molecular outflows. The morphologyof jets and outflow is shaped to a large extent by the ambientmass distribution in the collapsing envelope, and thus jet-likeand wide-angle outflows are unified only in an evolutionarysequence. In the disk-wind model simulations of collapsing,rotating, magnetized Bonnor–Ebert spheres of molecular cores,the highly collimated wind is driven magnetocentrifugally froma wide range of circumstellar disk radii, surrounded by a wide-angle wind driven by toroidal magnetic pressure (e.g., Banerjee& Pudritz 2006). In another unified model, Machida et al.(2008) explain the simultaneous occurrences of both the jets
and wide-angle outflows using the results from their calculationof cloud evolution from a molecular cloud core to a stellarcore, starting with a Bonner–Ebert isothermal core rotating ina uniform magnetic field. They find two distinct flows, wide-angle low-velocity and narrow high-velocity flows driven bytwo different components: the collapsing core and the protostar,respectively. These two distinct flows have different degrees ofcollimation and velocities: the low-velocity flow (i.e., molecularoutflow) has a wide opening angle, while the high-velocityflow (i.e., optical jet) has a well-collimated structure. Thiscollimation is caused by both the configuration of the magneticfield lines around the drivers and their driving mechanisms:the low-velocity wide-angle outflow, mainly driven by themagnetocentrifugal wind mechanism (disk wind), and guided byhourglass-like field lines; and the fast highly collimated outflowdriven by magnetic pressure and guided by straight field linesnear the protostar.
The results of the unified model by Machida et al. (2008), asseen in their schematic (Figure 15 in their paper), are remarkablysimilar to the simultaneously present narrow jet and wide-angleoutflow in Cep E we derive from Spitzer observations. Thismodel also appears to be viable for the jet/outflow seen inseveral other objects such as in B5-IRS1 in which the wide-angle CO outflow (Velusamy & Langer 1998) and the pc scaleHH flows (Yu et al. 1999) are likely be driven by the extendedinfall and the compact disk, respectively. HH46/47 (Velusamyet al. 2007), CepA (Torrelles et al. 2011), and HH211 (Hiranoet al. 2006) are a few other examples of simultaneous jets andwide-angle outflows in protostars. In outflows of L1448-mm andIRAS 04166+2706, Tafalla et al. (2010) observe evidence forthe simultaneous presence of multiple components consistingof a wide-angle slow wind (identified by the line wings) andcollimated flows (identified by the extremely high velocity(EHV) component). A high angular resolution CO(J = 2–1) mapof the EHV component in I04166 is well explained as resultingfrom a series of internal working surfaces traveling along acollimated jet (Santiago-Garcıa et al. 2009). The large-scalemorphologies observed in these objects are broadly consistentwith any of the above models for the multiple jet/outflowcomponents. Observations with much higher spatial resolution
13

The Astrophysical Journal, 741:60 (15pp), 2011 November 1 Velusamy et al.
with sufficient sensitivities will be needed to probe the launchingregion of the primary winds on a scale of a few AU ofthe protostar to discriminate between various models of jetsand outflows. Furthermore, a large sample of fully mappedjets and outflows will lead to a better understanding of thesimultaneously present jets and wide-angle outflow sources inthe context of the evolutionary sequences of protostars.
4. CONCLUSIONS
By combining the high sensitivity in the Spitzer images andthe reprocessing with HiRes, we find new jet and outflowfeatures in Cep E in addition to those previously known; thenew results are (1) wide-angle outflow seen in the scatteredlight, (2) morphological details of at least 29 jet-driven bowshocks and jet heads or knots, (3) three compact featuresin 24 μm continuum image identified as atomic/ionic lineemission coincident with the jet heads, and (4) a flattenedarcmin size protostellar envelope seen against the interstellarbackground PAH emission as an absorption band seen acrossthe protostar at 8 μm. We demonstrate that by separating theprotostellar photospheric scattered emission in the wide-anglecavity from the jet emission, we can study directly the scatteredlight spectrum. The simultaneous presence of collimated jetsand wide-angle outflow in Cep E, as shown here, is consistentwith unified jet–outflow models such as by Machida et al. (2008)in which the accretion in the compact protostellar disk drivesthe high-velocity jets and the accretion from the extended infallenvelope drives the wide-angle outflows. We have obtained theH2 emission line spectra as observed in all IRAC bands for all29 knots and use their IRAC colors as probes of the temperatureand density in the jets and bow shocks. These spectra are usefulin diagnostics of the C-type shock excitation of pure rotationaltransitions of H2 and a few H2 vibrational emissions. A shockexcitation model template of IRAC intensity spectra taking intoaccount all H2 transitions and the spectral response of eachIRAC band will be a useful resource for interpreting the vastSpitzer database available to study protostellar jets and outflows.Detailed modeling of the individual shocks will help retrace thehistory of episodic jet activity and the associated accretion onto the protostar.
Our results for Cep E, which utilize the HiRes algorithm, showthe potential of Spitzer data to study the entrained molecularH2 in the high-velocity jets as well as the wide-angle outflowcavities associated with the slower winds often traced by CO.Our approach for Cep E builds on the earlier work of Velusamyet al. (2007), who identified simultaneous jets and wide-angleoutflows in the young protostar HH46/47. In addition to theSpitzer data, the recent millimeter and submillimeter spectralline observations of outflows and jets from ground (e.g., Tafallaet al. 2010; Santiago-Garcıa et al. 2009) and from Herschel(e.g., Codella et al. 2010; Lefloch et al. 2010) will offer newclues to the nature of the EHV gas and its relation to the low-velocity outflow shells. Though a few selected outflows havebeen well studied in H2 emission using all H2 pure rotationallines from S(0) to S(7) with IRS (e.g., Neufeld et al. 2006;Nisini et al. 2010), the IRAC images available in the Spitzerarchives have the potential to study the H2 emission in a largesample of outflow sources. Quantitative analysis of IRAC colorsusing statistical equilibrium estimates such as those of Ybarra &Lada (2009) demonstrates the value of Spitzer images to probethe thermal structure of the shocked gas without the need ofusing spectroscopic data. Thus, the Spitzer’s capability to studythese features in H2 and scattered light, as described here, will
be complementary to the millimeter/submillimeter moleculardata, thus leading to a better understanding of the origin ofthe atomic jets and the fast and slow molecular outflows, andtheir subsequent manifestation in the physical and chemicalcharacteristics as observed in the resulting shocks. The SpitzerH2 molecular outflow data are even more relevant now, in thelight of recent observations (cf. Tafalla et al. 2010) of the EHVcomponent (in addition to the wing components) in a suite ofcomplex molecules such as CO, SiO, SO, CS, HC3N, HCO+,H2CO, HCN, H2O, and CH3OH that can be used to model theshock chemistry and excitation conditions.
We thank Dirk Froebrich for useful discussions. We thankthe referee, Alberto Noriega-Crespo, whose critical commentshelped us to present a more complete and comprehensive pic-ture of Cep E; in particular, for pointing out the presence of asecond jet and suggesting using the IRAC colors. The researchdescribed in this paper was carried out at the Jet PropulsionLaboratory, California Institute of Technology, under a con-tract with the National Aeronautics and Space Administration.M.S.N.K. is supported by a Ciencia 2007 contract, funded byFCT/MCTES (Portugal) and POPH/FSE (EC).
REFERENCES
Arce, H. G., & Sargent, A. I. 2006, ApJ, 646, 1070Arce, H. G., Shepherd, D., Gueth, F., et al. 2007, in Protostars and Planets V,
ed. B. Reipurth, D. Jewitt, & K. Keil (Tucson, AZ: Univ. Arizona Press), 245Aumann, H. H., Fowler, J. W., & Melnyk, M. 1990, AJ, 99, 1674Ayala, S., Noriega-Crespo, A., Garnavich, P., et al. 2000, AJ, 120, 909Backus, C. R., Velusamy, T., Thompson, T. J., & Arballo, J. K. 2005, in ASP
Conf. Ser. 347, ADASS XIV, ed. P. L. Shopbell, M. C. Britton, & R. Ebert(San Francisco, CA: ASP), 61
Bally, J. 2007, Ap&SS, 311, 15Banerjee, R., & Pudritz, R. E. 2006, ApJ, 641, 949Bourke, T. L., Myers, P. C., Evans, N. J., II, et al. 2006, ApJ, 649, L37Canto, J., & Raga, A. C. 1991, ApJ, 372, 646Chapman, N. L., Mundy, L. G., Lai, S.-P., & Evans, N. J., II. 2009, ApJ, 690,
496Chiang, H.-F., Looney, L. W., Tobin, J. J., & Hartmann, L. 2010, ApJ, 709, 470Chini, R., Ward-Thompson, D., Kirk, J. M., et al. 2001, A&A, 369, 155Codella, C., Lefloch, B., Ceccarelli, C., et al. 2010, A&A, 518, L112Combet, C., Lery, T., & Murphy, G. C. 2006, ApJ, 637, 798Devine, D., Reiputh, B., & Bally, J. 1997, in IAU Symp. 182, Low Mass Star
Formation—From Infall to Outflow, ed. F. Malbet & A. Castets (Cambridge:Cambridge Univ. Press), 91
Dionatos, O., Nisini, B., Cabrit, S., Kristensen, L., & Pineau des Forets, G.2010, A&A, 521, A7
Dionatos, O., Nisini, B., Garcia Lopez, R., et al. 2009, ApJ, 692, 1Eisloffel, J., Smith, M. D., Davis, C. J., & Ray, T. P. 1996, AJ, 112, 2086Forbrich, J., Tappe, A., Robitaille, T., et al. 2010, ApJ, 716, 1453Froebrich, D. 2005, ApJS, 156, 169Froebrich, D., Smith, M. D., Hodapp, K. W., & Eisloffel, J. 2003, MNRAS,
346, 163Gramajo, L. V., Whitney, B. A., Gomez, M., & Robitaille, T. P. 2010, AJ, 139,
2504Gredel, R., & Reipurth, B. 1993, ApJ, 407, L29Gregersen, E. M., Evans, N. J., II, Mardones, D., & Myers, P. C. 2000, ApJ,
533, 440Hartigan, P., Raymond, J., & Hartmann, L. 1987, ApJ, 316, 323Hirano, N., Liu, S.-Y., Shang, H., et al. 2006, ApJ, 636, L141Indebetouw, R., Mathis, J. S., Babler, B. L., et al. 2005, ApJ, 619, 931Konigl, A., & Pudritz, R. E. 2000, in In Protostars and Planets IV, ed. V.
Mannings, A. P. Boss, & S. S. Russell (Tucson, AZ: Univ. Arizona Press),759
Ladd, E. F., & Hodapp, K.-W. 1997, ApJ, 474, 749Lee, C.-F., Hasegawa, T. I., Hirano, N., et al. 2010, ApJ, 713, 731Lefloch, B., Cabrit, S., Codella, C., et al. 2010, A&A, 518, L113Lery, T. 2003, Ap&SS, 287, 35Looney, L. W., Tobin, J. J., & Kwon, W. 2007, ApJ, 670, L131Lucy, L. B. 1974, AJ, 79, 745Machida, M. N., Inutsuka, S.-I., & Mastumoto, T. 2008, ApJ, 676, 1088
14

The Astrophysical Journal, 741:60 (15pp), 2011 November 1 Velusamy et al.
Moro-Martın, A., Noriega-Crespo, A., Molinari, S., et al. 2001, ApJ, 555, 146Mundt, R., & Fried, J. W. 1983, ApJ, 274, L83Neufeld, D. A., Melnick, G. J., Sonnentrucker, P., et al. 2006, ApJ, 649, 816Neufeld, D. A., Nisini, B., Giannini, T., et al. 2009, ApJ, 706, 170Neufeld, D. A., & Yuan, Y. 2008, ApJ, 678, 974Nisini, B., Caratti o Garatti, A., Giannini, T., & Lorenzetti, D. 2002, A&A, 393,
1035Nisini, B., Giannini, T., Neufeld, D. A., et al. 2010, ApJ, 724, 69Noriega-Crespo, A., Garnavich, P M., & Molinari, S. 1998, AJ, 116, 1388Noriega-Crespo, A., Hines, D. C., Gordon, K., et al. 2009, The Evolving
ISM in the Milky Way & Nearby Galaxies, http://ssc.spitzer.caltech.edu/mtgs/ismevol/
Noriega-Crespo, A., Moro-Martin, A., Carey, S., et al. 2004a, ApJS, 154, 402Noriega-Crespo, A., Morris, P., Marleau, F. R., et al. 2004b, ApJS, 154, 352Ostriker, E. C., Lee, C., Stone, J. M., & Mundy, L. G. 2001, ApJ, 557, 443Ouyed, R., & Pudritz, R. E. 1997, ApJ, 482, 712Pudritz, R. E., Ouyed, R., Fendt, Ch., & Brandenburg, A. 2007, in Protostars
and Planets V, ed. B. Reipurth, D. Jewitt, & K. Keil (Tucson, AZ: Univ.Arizona Press), 277
Raga, A., & Cabrit, S. 1993, A&A, 278, 267Raga, A. C., Noriega-Crespo, A., Gonzalez, R. F., & Velazquez, P. F. 2004, ApJS,
154, 346Richardson, W. H. 1972, J. Opt. Soc. Am., 62, 55Robitaille, T. P., Whitney, B. A., Indebetouw, R., & Wood, K. 2007, ApJS, 169,
328Rodrıguez, L. F., D’Alessio, P., Wilner, D. J., et al. 1998, Nature, 395, 355Santiago-Garcıa, J., Tafalla, M., Johnstone, D., & Bachiller, R. 2009, A&A,
495, 169Shang, H., Allen, A., Li, Z.-Y., et al. 2006, ApJ, 649, 845Shepherd, D. S., Yu, K. C., Bally, J., & Testi, L. 2000, ApJ, 535, 833
Shu, F. H., Najita, J. R., Shang, H., & Li, Z.-Y. 2000, in Protostars and PlanetsIV, ed. V. Mannings, A. P. Boss, & S. S. Russell (Tucson, AZ: Univ. ArizonaPress), 789
Smith, M. D., Froebrich, D., & Eisloffel, J. 2003, ApJ, 592, 245Smith, M. D., & Rosen, A. 2005, MNRAS, 357, 1370Smith, N., Povich, M. S., Whitney, B. A., et al. 2010, MNRAS, 406, 952Stutz, A. M., Rubin, M., Werner, M. W., et al. 2008, ApJ, 687, 389Tafalla, M., Santiago-Garcıa, J., Hacar, A., & Bachiller, R. 2010, A&A, 522, 91Terquem, C., Eisloffel, J., Papaloizou, J. C. B., & Nelson, R. P. 1999, ApJ, 512,
L131Tobin, J. J., Hartmann, L., Calvet, N., & D’Alessio, P. 2008, ApJ, 679,
1364Tobin, J. J., Hartmann, L., & Loinard, L. 2010a, ApJ, 722, L12Tobin, J. J., Hartmann, L., Looney, L. W., & Chiang, H.-F. 2010b, ApJ, 712,
1010Tobin, J. J., Looney, L. W., Mundy, L. G., Kwon, W., & Hamidouche, M.
2007, ApJ, 659, 1404Torrelles, J. M. T., Patel, N. A., Curiel, S., et al. 2011, MNRAS, 410, 627Velusamy, T., & Langer, W. D. 1998, Nature, 392, 686Velusamy, T., Langer, W. D., & Marsh, K. A. 2007, ApJ, 668, L159Velusamy, T., Marsh, K. A., Beichman, C. A., Backus, C. R., & Thompson, T. J.
2008, AJ, 139, 197Watson, C., Zweibel, E. G., Heitsch, F., & Churchwell, E. 2004, ApJ, 608,
274Whitney, B. A., Wood, K., Bjorkman, J. E., & Cohen, M. 2003a, ApJ, 598,
1079Whitney, B. A., Wood, K., Bjorkman, J. E., & Wolff, M. J. 2003b, ApJ, 591,
1049Ybarra, J. E., & Lada, E. A. 2009, ApJ, 695, L123Yu, K. C., Billawala, Y., & Bally, J. 1999, AJ, 118, 2940
15