jeremy webb thesis (pdf 2mb)
TRANSCRIPT
Theory and practice of automotive modal lock-in
– an Indonesian case study
This dissertation is submitted to the School of Economics and Finance, Queensland University of Technology for the Degree of
Doctor of Philosophy
2014
Jeremy Webb
B.EC Hons., Australian National University MA, University of Hawaii.
School of Economics and Finance QUT Business School
Queensland University of Technology Gardens Point Campus
Brisbane Australia

i
Statement of original authorship
The work contained in this thesis has not been previously submitted to meet
requirements for an award at this or any other higher education institution. To the
best of my knowledge and belief, the thesis contains no material previously
published or written by another person except where due reference is made.
QUT Verified Signature
Jeremy Webb 2014

ii
Acknowledgements
My thanks go, firstly, to Dr Max Briggs who first encouraged me to embark on this thesis and provided a constant stream of advice and encouragement throughout. My thanks also to Professors Tim Robinson and Mike Kidd and the School of Economics and Finance at QUT, for seeing fit to provide generous support and the bulk of the resources for this study. My appreciation also to Professor Peter Grace and the Institute for Sustainable Resources (ISR) at QUT for additional financial support. This thesis could not have been completed without the ongoing advice and support of my principal thesis supervisor Professor Clevo Wilson. He provided invaluable guidance on structuring this thesis, as well as taking on the onerous task of guiding me through the pitfalls of thesis research and opening up to me the world of environmental economics. My colleagues Dr Wasantha Athukorala and Dr Muditha Karunarathna both shared invaluable information on thesis research techniques and particularly on mastering the complexities of choice modelling. My field study in Jakarta Indonesia was greatly assisted by Teti Sihombing who supplied many valuable introductions, and her son Matthew who, with his student colleagues, took on the task of data entry. Tim Scott’s unsolicited flow of press cuttings on Jakarta’s traffic problems provided a constant source of current information for the thesis. Patrick Alexandra generously opened up many doors to the business community in Jakarta and which proved to be a major source of survey participants. My thanks as well go to Dr Neta Nainggolan, Meinanda Kurnianan and Harry Bhaskara for assistance in translating the surveys into the Indonesian language and to Geoff Miller, Peter Nunan and Bill Bowen for their editorial advice on Sections of the thesis. Finally, but not least my thanks go to my wife Aline who has put up with the distractions and frustrations which inevitably arise from living with someone who is completing a PhD.
iii
Table of contents
Page
Statement of original authorship……………………. i
Acknowledgements ……………………… …………. ii
Table of contents …………………………………….. iii
Chapter contents …………………………………….. iv
Bibliography…………………………………………… vii
List of Appendices……………………………………. viii
List of Figures………………………………………… ix
List of Tables…………………………………………. x
Key Words……………………………………………. xi
List of abbreviations………………………………….. xii
Abstract……………………………………………...... xiii
iv
Chapter Contents
CHAPTER ONE: THESIS OVERVIEW
1.1 Introduction 1
1.2 Background to research 1
1.3 Research problem/thesis contribution 6
1.4 Methodology 10
1.5 Thesis chapter summary 13
CHAPTER TWO: LITERATURE REVIEW OF RESEARCH ISSUES
2.1 Introduction 15
2.2 Market failure 16
2.3 Market failure, path dependence and lock-in 19
2.4 Critical analysis of path dependence and lock-in 25
2.5 Transport modal lock-in 28
2.6 Cost benefit and lock-in 30
2.7 Automotive modal lock-in in developing countries 36
2.8 Gaps in literature: thesis aims 38
2.9 Conclusion 42
CHAPTER THREE: MODELLING AUTOMOTIVE MODAL LOCK-IN: THE U.S.A.
3.1 Introduction 44
3.2 Automotive modal lock-in stage 1: c1900-1920 45
3.3 Automotive modal lock-in stage 2: C1921- 1970 52
3.4 Automotive modal lock-in stage 3: C1971 – to present 61
3.5 Conclusion 71
v
CHAPTER FOUR: MODELLING AUTOMOTIVE MODAL LOCK-IN: DEVELOPING COUNTRIES
4.1 Introduction 73
4.2 Automotive modal lock-in: incidence in developing countries 74
4.3 Developing country automotive modal lock-in: the roles of automotive socio-economic regimes, governments and consumers 75
4.4 Developing country automotive modal lock-in: stage 1 78
4.4.1 Seoul: automotive modal lock-in: stage 1 84
4.4.2 Beijing: automotive modal lock-in: stage 1 85
4.4.3 Delhi: automotive modal lock-in: stage 1 85
4.3.4 Kuala Lumpur: automotive modal lock-in: stage 1 87
4.4.5 Jakarta: automotive modal lock-in: stage 1 87
4.5 Developing country automotive modal lock-in: stage 2 89
4.5.1 Seoul: automotive modal lock-in: stage 2 92
4.5.2 Beijing: automotive modal lock-in: stage 2 93
4.5.3 Kuala Lumpur: automotive modal lock-in: stage 2 95
4.5.4 Jakarta: automotive modal lock-in: stage 2 96
4.6 Developing country automotive modal lock-in: stage 3 97
4.6.1 Seoul: automotive modal lock-in: stage 3 reversal 101
4.6.2 Malaysia, Kuala Lumpur: automotive model lock-in: stage 3 101
4.6.3 Beijing: automotive modal lock-in: stage 3 reversal 102
4.6.4 Jakarta: automotive lock-in: stage 3 103
4.7 Conclusion 104
CHAPTER FIVE: SURVEY METHODOLOGY
5.1 Introduction 107
5.2 Surveys of Jakarta commuters 108
5.3 Choice of Jakarta for surveys’ location 110
5.4 Use of choice modelling 113
5.4.1 Preliminary survey: choice model attributes 115
vi
5.4.2 Preliminary survey: level of congestion 117
5.4.3 Preliminary survey: environmental issues 119
5.4.4 Preliminary survey: automotive travel costs 121
5.4.5 Preliminary survey: choice set neither option 121
5.4.6 Preliminary survey: socio-economic profiling attributes 123
5.4.7 Preliminary survey: data collection 126
5.5 Final survey: design methodology 127
5.5.1 Final survey: formatting of questions using Likert scale 134
5.5.2 Final survey: survey sampling methodology and data collection 134
5.6 Ethical clearances 136
5.7 Conclusions 136
CHAPTER SIX: ECONOMETRIC METHODOLOGY
6.1 Introduction 138
6.2 Automotive demand models 138
6.3 Research data gathering techniques: background to revealed preference and stated preference methods 144
6.4 Research procedures: discrete choice experiment 146
6.5 Modelling discrete choice experiments: use of conditional logit model 147
6.6 Conclusion 151
CHAPTER SEVEN: JAKARTA COMMUTER SURVEYS: RESULTS
7.1 Introduction 153
7.2 Travel Preferences: Jakarta commuters 154
7.3 Automotive ownership: aspirational demand 157
7.4 Demand models: cars motorcycles 158
7.5 Demand model: socio-economic variables 160
7.6 Car and motorcycle demand models: outcomes 162
7.7 Market failure: public transport 166
7.8 Externalities and lock-in 168
vii
7.9 Congestion reduction: discrete choice experiment preliminary survey 170
7.10 Final survey discrete choice experiment: outcomes 174
7.11 Final survey: WTP 183
7.11.1 Final survey WTP: congestion 184
7.11.2 Final survey WTP: time 185
7.12 Conclusion 188
CHAPTER EIGHT: CONCLUSIONS AND POLICY IMPLICATIONS
8.1 Introduction 192
8.2 Theoretical contribution 193
8.3 Empirical validation of automotive modal lock-in 198
8.4 Automotive modal lock in: development of reversal strategies 202
8.5 Research limitations and further study 209
Bibliography.........................................................................................214
viii
List of Appendices
Appendix 5.1 Preliminary survey: English language version………………...238
Appendix 5.2 Preliminary survey: Indonesian language version...................256
Appendix 5.3 Final survey: choice matrix......................................................274
Appendix 5.4 Final survey: English language version………………………….292
Appendix 5.5 Final survey: Indonesian language version.............................303
Appendix 5.6 Participating companies and institutions: preliminary survey. ....................................................................................315
Appendix 5.7 Participating companies and institutions: final survey………...316
ix
List of Figures
Figure 3.1 Automotive modal lock-in stage 1: Increasing returns ........................ 47
Figure 3.2 Increasing returns ............................................................................... 48
Figure 3.3 Automotive modal lock-in the U.S.A.: 1970 to present ....................... 49
Figure 3.4 Automotive modal lock-in: stage 1: symmetrical market expansion ........................................................................................... 51
Figure 3.5 Automotive modal lock-in stage 2: asymmetric market reshaping ...... 55
Figure 3.6 U.S. average annual vehicle mileage………………………..................63
Figure 3.7 Comparative costs: cars and public transport per kilometer ............... 65
Figure 3.8 Automotive modal lock-in: stage 3: 1970 to present ........................... 67
Figure 3.9 Public transport share of total passenger kilometres .......................... 71
Figure 4.1 Automotive modal lock-in stage 1: developing countries: semi-symmetric market expansion ..................................................... 80
Figure 5.1 The ‘golden triangle’ central business district of Jakarta .................. 109
Figure 5.2 Passenger vehicles per 1000 population selected cities in Southeast Asia ............................................................................... 110
Figure 5.3 Daerah Khusus Ibukota Jakarta (DKI) .............................................. 111
Figure 5.4 Greater Jakarta: Bogor, Tangerang, Bekasi (Jabodetabek) ............ 112
Figure 5.5 Location of participants – preliminary survey ................................... 126
Figure 5.6 Preliminary survey: choice chosen: all commuters (%) .................... 130
Figure 5.7 Preliminary survey: choice chosen: automotive and motorcycle mode (%) ........................................................................ 131
Figure 5.8 Final survey: location of participants ................................................. 135
Figure 7.1 Preliminary survey: choice chosen all commuters (% of total) ......... 173
Figure 7.2 Preliminary survey: choice according to mode: cars and motorcycles ....................................................................................... 174
Figure 7.3 Final survey choices according to tax level ...................................... 182
x
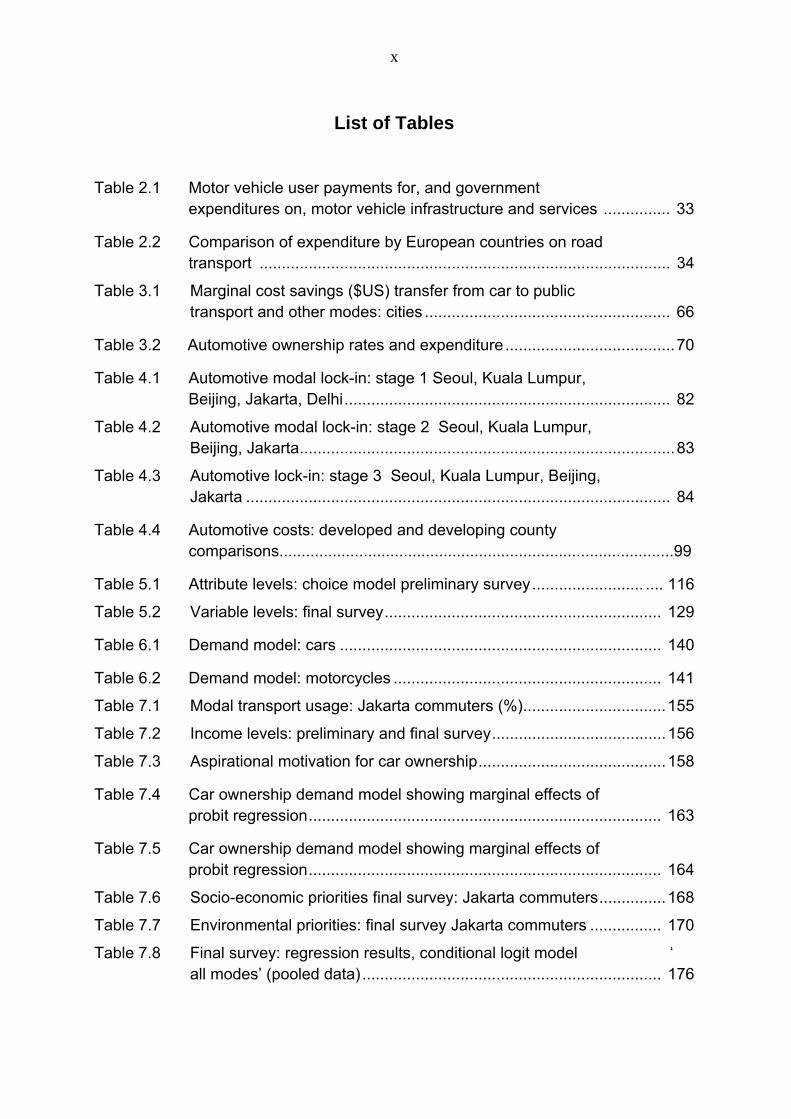
List of Tables
Table 2.1 Motor vehicle user payments for, and government expenditures on, motor vehicle infrastructure and services ............... 33
Table 2.2 Comparison of expenditure by European countries on road transport ............................................................................................ 34
Table 3.1 Marginal cost savings ($US) transfer from car to public transport and other modes: cities ....................................................... 66
Table 3.2 Automotive ownership rates and expenditure ...................................... 70
Table 4.1 Automotive modal lock-in: stage 1 Seoul, Kuala Lumpur, Beijing, Jakarta, Delhi ......................................................................... 82
Table 4.2 Automotive modal lock-in: stage 2 Seoul, Kuala Lumpur, Beijing, Jakarta .................................................................................... 83
Table 4.3 Automotive lock-in: stage 3 Seoul, Kuala Lumpur, Beijing, Jakarta ............................................................................................... 84
Table 4.4 Automotive costs: developed and developing county comparisons.........................................................................................99
Table 5.1 Attribute levels: choice model preliminary survey ......................... .... 116
Table 5.2 Variable levels: final survey .............................................................. 129
Table 6.1 Demand model: cars ........................................................................ 140
Table 6.2 Demand model: motorcycles ............................................................ 141
Table 7.1 Modal transport usage: Jakarta commuters (%) ................................ 155
Table 7.2 Income levels: preliminary and final survey ....................................... 156
Table 7.3 Aspirational motivation for car ownership .......................................... 158
Table 7.4 Car ownership demand model showing marginal effects of probit regression ............................................................................... 163
Table 7.5 Car ownership demand model showing marginal effects of probit regression ............................................................................... 164
Table 7.6 Socio-economic priorities final survey: Jakarta commuters ............... 168
Table 7.7 Environmental priorities: final survey Jakarta commuters ................ 170
Table 7.8 Final survey: regression results, conditional logit model ‘ all modes’ (pooled data) ................................................................... 176
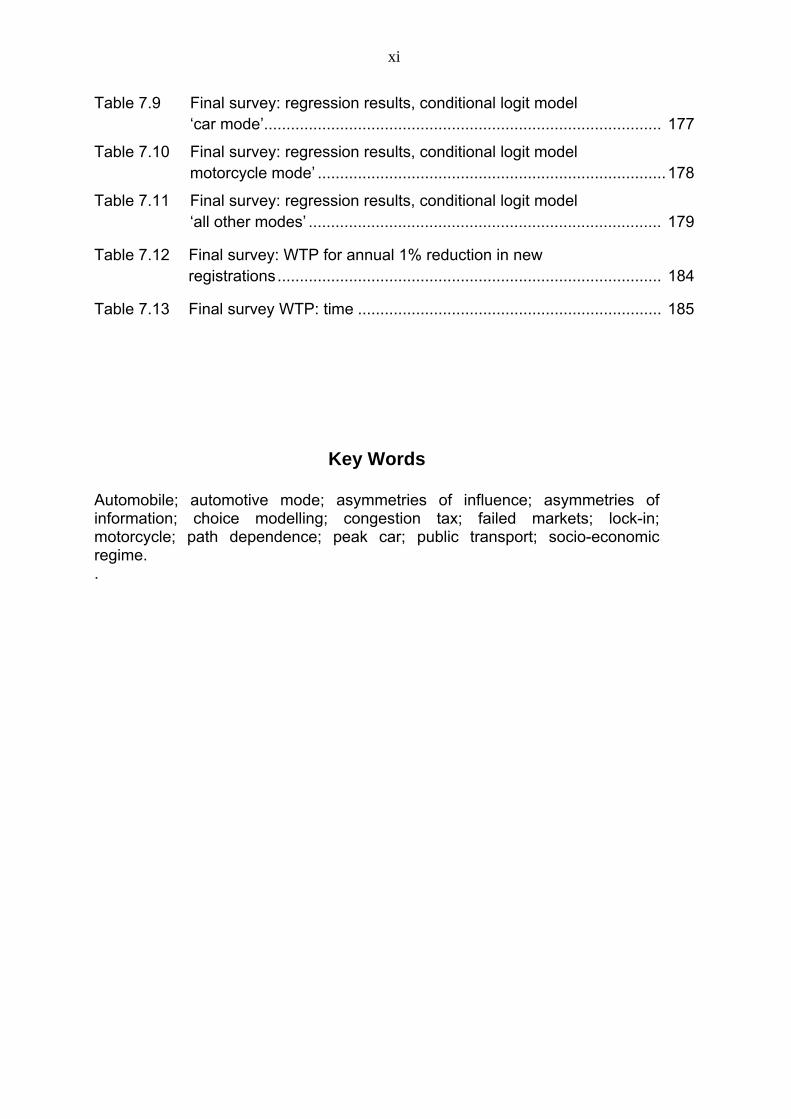
xi
Table 7.9 Final survey: regression results, conditional logit model ‘car mode’......................................................................................... 177
Table 7.10 Final survey: regression results, conditional logit model motorcycle mode’ .............................................................................. 178
Table 7.11 Final survey: regression results, conditional logit model ‘all other modes’ ............................................................................... 179
Table 7.12 Final survey: WTP for annual 1% reduction in new registrations ...................................................................................... 184
Table 7.13 Final survey WTP: time .................................................................... 185
Key Words Automobile; automotive mode; asymmetries of influence; asymmetries of information; choice modelling; congestion tax; failed markets; lock-in; motorcycle; path dependence; peak car; public transport; socio-economic regime. .

xii
List of abbreviations
ASC Alternative specific constant
BAPPENAS Badan Perencanaan dan Pembangunan Nasional BPK (National Planning and Development Agency)
BRT Bus Rapid Transit
CLM Conditional logit model
COE Certificate of entitlement
CS Compensating surplus
CV Contingent valuation
GHG Greenhouse gas emissions
IC Internal combustion
IIA Independence of irrelevant alternatives
ISSP International Social Survey Program
JICA Japan International Cooperation Agency
MLM Multinomial logit model
RP Revealed preference
SP Stated preference
TIC Techno-institutional complex
UNCTAD UN Committee on Trade and Development
WHO World Health Organisation
WRI World Resources Institute
WTP Willingness to pay
ZEV Zero emissions vehicle
xiii
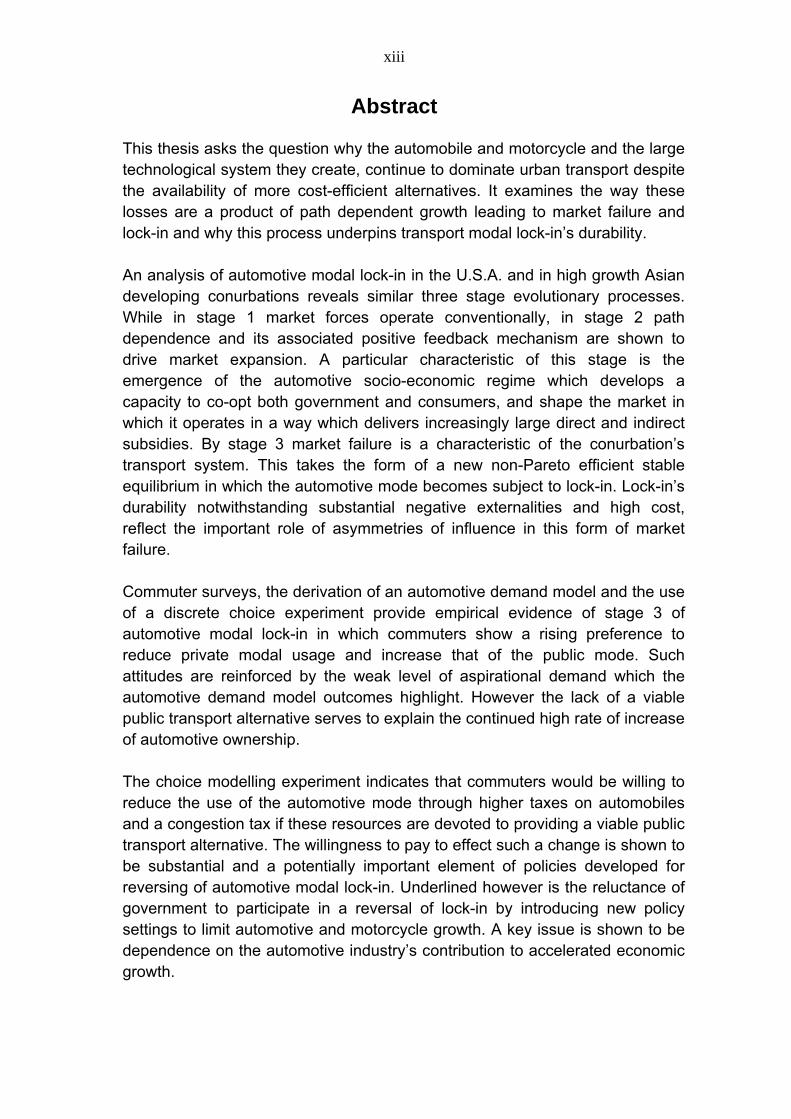
Abstract This thesis asks the question why the automobile and motorcycle and the large technological system they create, continue to dominate urban transport despite the availability of more cost-efficient alternatives. It examines the way these losses are a product of path dependent growth leading to market failure and lock-in and why this process underpins transport modal lock-in’s durability. An analysis of automotive modal lock-in in the U.S.A. and in high growth Asian developing conurbations reveals similar three stage evolutionary processes. While in stage 1 market forces operate conventionally, in stage 2 path dependence and its associated positive feedback mechanism are shown to drive market expansion. A particular characteristic of this stage is the emergence of the automotive socio-economic regime which develops a capacity to co-opt both government and consumers, and shape the market in which it operates in a way which delivers increasingly large direct and indirect subsidies. By stage 3 market failure is a characteristic of the conurbation’s transport system. This takes the form of a new non-Pareto efficient stable equilibrium in which the automotive mode becomes subject to lock-in. Lock-in’s durability notwithstanding substantial negative externalities and high cost, reflect the important role of asymmetries of influence in this form of market failure. Commuter surveys, the derivation of an automotive demand model and the use of a discrete choice experiment provide empirical evidence of stage 3 of automotive modal lock-in in which commuters show a rising preference to reduce private modal usage and increase that of the public mode. Such attitudes are reinforced by the weak level of aspirational demand which the automotive demand model outcomes highlight. However the lack of a viable public transport alternative serves to explain the continued high rate of increase of automotive ownership. The choice modelling experiment indicates that commuters would be willing to reduce the use of the automotive mode through higher taxes on automobiles and a congestion tax if these resources are devoted to providing a viable public transport alternative. The willingness to pay to effect such a change is shown to be substantial and a potentially important element of policies developed for reversing of automotive modal lock-in. Underlined however is the reluctance of government to participate in a reversal of lock-in by introducing new policy settings to limit automotive and motorcycle growth. A key issue is shown to be dependence on the automotive industry’s contribution to accelerated economic growth.
1
CHAPTER ONE: THESIS OVERVIEW
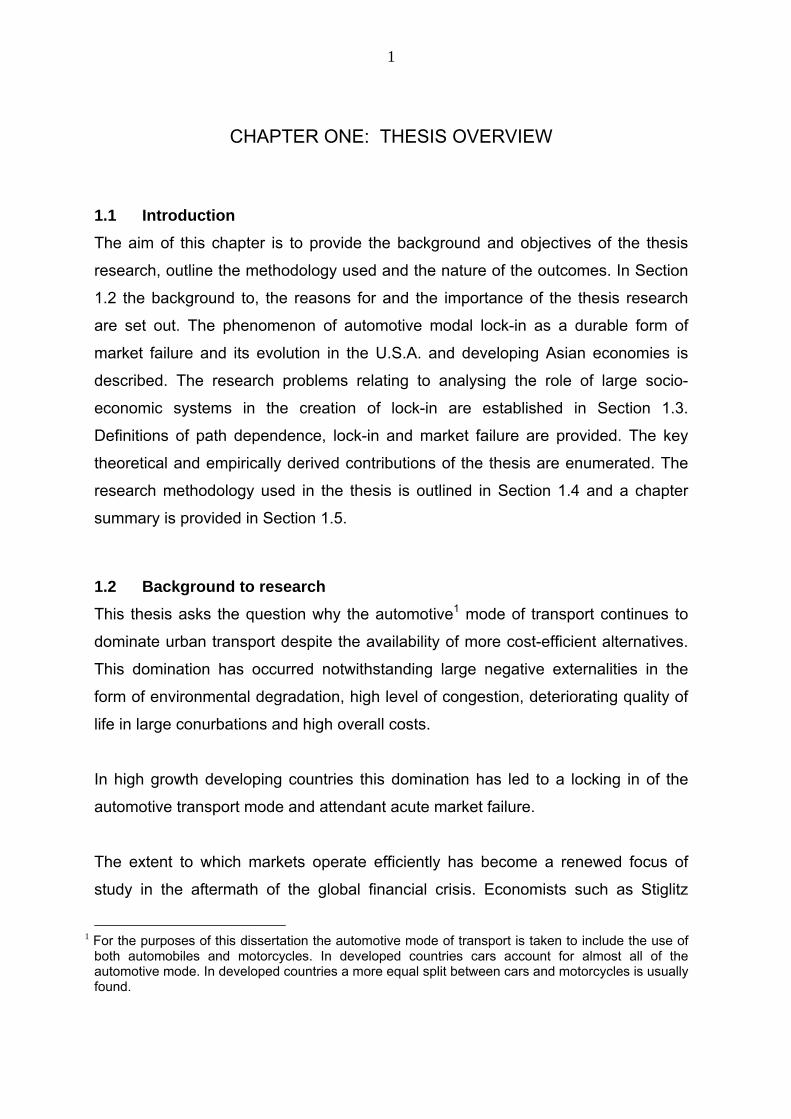
1.1 Introduction
The aim of this chapter is to provide the background and objectives of the thesis
research, outline the methodology used and the nature of the outcomes. In Section
1.2 the background to, the reasons for and the importance of the thesis research
are set out. The phenomenon of automotive modal lock-in as a durable form of
market failure and its evolution in the U.S.A. and developing Asian economies is
described. The research problems relating to analysing the role of large socio-
economic systems in the creation of lock-in are established in Section 1.3.
Definitions of path dependence, lock-in and market failure are provided. The key
theoretical and empirically derived contributions of the thesis are enumerated. The
research methodology used in the thesis is outlined in Section 1.4 and a chapter
summary is provided in Section 1.5.
1.2 Background to research
This thesis asks the question why the automotive1 mode of transport continues to
dominate urban transport despite the availability of more cost-efficient alternatives.
This domination has occurred notwithstanding large negative externalities in the
form of environmental degradation, high level of congestion, deteriorating quality of
life in large conurbations and high overall costs.
In high growth developing countries this domination has led to a locking in of the
automotive transport mode and attendant acute market failure.
The extent to which markets operate efficiently has become a renewed focus of
study in the aftermath of the global financial crisis. Economists such as Stiglitz
1 For the purposes of this dissertation the automotive mode of transport is taken to include the use of
both automobiles and motorcycles. In developed countries cars account for almost all of the automotive mode. In developed countries a more equal split between cars and motorcycles is usually found.
2
(1989, 2002) have long argued that market failure is the norm rather than the
exception pointing to the inevitability of imperfect and asymmetric information in
markets as a key cause.
Studies of such asymmetries and forms of market failure (see, for example, Unruh,
2000; Geels and Kemp, 2007; Urry, 2008) show them to be characteristic of
markets dominated by firms which are large enough to create whole socio-
economic systems (and which have the capacity to shape their markets to suit their
own commercial ends). Under these conditions, markets – and as Soros (2008)
argues, particularly financial markets – may not necessarily reach allocative efficient
equilibriums. This is of particular interest to economists given the global context
where large multinational firms have multiplied in recent years and increased their
global market share of trade and investment (UNCTAD, 2012). Perhaps the most
prominent example of such market failure is that based on the carbon economy
which as Unruh (2000) and others argue (Bailey and Wilson, 2009; Newell and
Paterson, 2010) has produced exceptionally high levels of inefficiency2.
At the heart of the carbon economy is the internal combustion (IC) engined private
automotive transport mode which dominates transport systems of developed
economies. Associated with this domination are large direct and indirect subsidies
and negative externalities particularly apparent in the form of environmental and
social costs (Jakob et al., 2006; Mizutani et al., 2011). In so far as the bulk of
negative externalities are generally paid for by the community as a whole, and not
exclusively by motorists, they, too, take the form of indirect subsidisation of the
automotive mode. A number of detailed transnational studies have quantified the
direct and indirect costs of the automotive mode of transport (International Social
Survey Program: Environment, 1993; International Social Survey Program:
Environment II, 2000; Tjernstrom and Tietenberg, 2008). They demonstrate the
development of a substantial form of market failure in which more cost effective
public transport modes have largely been locked out of the market. This
phenomenon of automotive modal lock-in is found to be a feature of large
2 The International Energy Agency puts global subsidies for carbon based fuels at $523 billion in 2011, almost 30% higher than in 2010 and projects that the subsidy could account for 0.7% of global domestic product in 2020 (International Energy Agency, 2012).
3
conurbations in high growth developing economies of Asia – and in particular China,
India, Malaysia, Thailand, The Philippines and Indonesia. In these cases high levels
of growth have been underpinned by heavy domestic investment in automotive
industries.
An examination of major developed economies indicates the U.S.A. has globally, by
far the highest level of automotive domination of its transport system: 96% of all
trips are accounted for by automobiles (Rodrigue et al., 2009). The U.S.A. also has
one of the most acute forms of market failure in terms of the benefit-cost imbalance
between public and private transport (Kenworthy and Laube, 1999). Most major
European and developed Asian economies display lesser but varying levels of
automotive domination of their transport systems and of public transport lock-out.
The key indirect costs of the automotive transport mode are found to be congestion,
carbon emissions, accidents, and automotive pollution’s effect on health. In high
growth developing economies extreme levels of automotive congestion and
pollution in large conurbations have produced growing (albeit delayed) levels of
public discomfort and concern. Further substantial and potentially greater long term
costs are attached to carbon emissions as a cause of climate change which Stern
(2006) describes as the world’s “...greatest and most wide-ranging market failure.”
of all. Transport is one of the largest single causes of greenhouse gas (GHG)
emissions (only power generation and the industrial sector are larger) and the
fastest growing. Transport emissions represent the fastest and second fastest
increases for all economic sectors in OECD and non-OECD countries respectively.
Globally, they account for over half of oil consumption (International Energy Agency,
2012), and 14% of GHG emissions of which almost 80% are from road transport. If
GHG emissions are measured on an end user basis, transport accounts for 25% of
global CO2 (World Resources Institute, 2006). Global CO2 emissions have been
increasing at an annual rate of 1.9% since 1990 (Netherlands Environmental
Assessment Agency, 2011) compared to a 1.1% annual increase during the 1980s.
Between 1990 and 2007, global transport emissions grew by 45%. The Asia-Pacific
region recorded a 34% increase in road transport emissions, the EU 25%, and the
U.S.A. 36% (International Transport Forum, 2010). Between 2007 and 2030 it is
expected global transport emissions will grow around 40% with the major increases
4
occurring in the high growth Asia-Pacific region and particularly China and India.
This is based on projections that passenger travel will increase by a factor of 1.4 in
OECD countries and a factor of 3.3 in non OECD countries by 2050 (International
Energy Agency, 2009). Automotive energy use is estimated to growth by a factor of
1.9 to 2.5 over the same period.
Global vehicular growth rates are therefore unsustainable if targets for GHG
emissions are to be met2. Moreover, given near saturation of automotive ownership
in most OECD countries, pressure for the needed far reaching structural adjustment
to transport systems will be focussed on developing countries where the growth in
demand for transport is most rapid. At the level of reductions in global emissions
needed to avoid dangerous increases in temperature it has been estimated
(DeCicco, 2013) that reductions in GHG emissions of the automotive sector of 80%
in the U.S.A. and 50% in China would be needed.
The way in which carbon dependent high cost transport systems are being
implanted in developing countries is described by Unruh (2006) as being
transmitted through the conveyor belts of international trade and investment3. Such
investment in the automotive industry is shown to be a critical element of developing
country strategies to drive economic take-off. Others (Dargay et al., 2007) have
pointed out the growth of automotive industries is greatly accelerated by the high
income elasticity of demand for automobiles in developing countries at certain levels
of income. Affluence is shown to produce a shift away from traditional non
3 That 2 degrees Celsius is the maximum level by which temperatures should be allowed to rise is now generally accepted by the international community (Stern, 2006). This is based on the Inter-government Panel on Climate Change’s (Intergovernmental Panel on Climate Change, 2007) scientific studies which show that at temperatures in excess of this point serious damage to the earth’s economy and ecology are likely and that tipping points are likely leading to uncontrolled non-linear increases in GHG. However there is growing concern that the 2 degree limit the international community is setting itself will not be achieved. Kyoto Protocol OECD members have also collectively increased their emissions since 2000 (Garnaut, 2008) albeit marginally. This is notwithstanding the commitment to reduce emissions by an average of 5.5% over 1990 levels. 3 Unruh (2006) points out that such investment carries with it what he calls ‘carbon lock-in’. This form
of lock-in describes the way in which the IC engine became locked-in, firstly, as the preferred mode of powering the automobile. It secondly describes how, in evolving into a large technological system, the IC powered automotive mode of transport locked in the transport sector into the fossil fuel economy.
5
mechanised and mass transport systems to private modes inducing a substantial
increase in per capita distance travelled.
The way in which income drives automotive demand is described by a World Bank
comparison of passenger car numbers in Asian countries between 1990 and 2005
(Timilsina and Sherestha, 2009). This shows GDP per capita elasticities of demand
for cars well in excess of 14. For Indonesia the elasticity was almost 3 with the
annual per capita income rising by 2.9% per annum and passenger car numbers by
8.5% per annum. A central hypothesis of this thesis is that, as important as the
relationship of income to automotive demand is, it masks more fundamental and
underlying drivers of automotive demand and modal lock-in. As discussed in
Chapter Two, once catalysed, growth in automotive ownership tends to be subject
to path dependent growth. In this way, automotive demand can increasingly reflect
the positive feedback mechanisms embedded in the lack of cost effective public
transport – a fact not well acknowledged in the literature. This therefore becomes a
more important driver of automotive modal lock-in in its latter stage of evolution
when income becomes a weaker driver of automotive ownership and use.
Such is the strength of these path dependent drivers of demand for the automotive
mode in rapidly developing emergent economies that its future sustainability has
become highly problematic. The world vehicle population (defined here as four
wheeled vehicles) is estimated to exceed 2 billion by 2030 (Dargay et al., 2007).
These projections show a major part of this increase occurring in two countries –
China and India. Per capita ownership in China is projected to rise from 16 per
100,000 in 2002 to 269 in 2030. This equates to 390 million vehicles which exceeds
the U.S.A.’s projected 314 million. Estimates for India put the rise in per capita
ownership from 17 to 110 per 100,000 over the same time frame. Dargay et al.’s
projections for Indonesia put per capita vehicle ownership at 166 per 100,000 by
4 Dargay et al.’s (2007) study shows elasticities of around 2 when per capita incomes reach between $US3-10,000.
6
2030 – an eight fold increase from the 29 vehicles per capita in 2002 and an
increase in the total car population from 6 to 46 million5.
However, as discussed in Chapter Two, in the developing countries cited, the
motorists’ and general public’s capacity to assess the long term costs of such
projected increases in private vehicle ownership has, and remains, critically
deficient. Indeed even in developed OECD economies, there remains a low level of
public appreciation of the full direct and indirect costs of automotive transportation.
In Chapter Three, this information deficiency among U.S. consumers (and
consumers in many other affluent economies) is shown to be a crucial factor in
explaining why the automobile’s high cost physical infrastructure has been allowed
to grow in preference to lower cost public transport.
1.3 Research problem/thesis contribution
The central question posed by this thesis is why the private automotive mode of
transport continues to dominate urban transport systems despite the availability of
more cost effective public transport alternatives. The need to understand the
reasons relate to the large intra and intra-generational welfare losses generated by
automotive modal lock-in and associated market failure of transport markets. These
trends are already a characteristic of developed country economies and in
developing countries where transport systems are in a formative stage.
However the literature provides only an incomplete analysis of the precise
mechanisms by which large socio-economic systems such as the automotive mode
of transport become subject to market failure and lock-in. An analytical tool is
needed to answer the key question raised in this thesis research – why has
automotive transport modal lock-in become so durable and are there mechanisms
available to engineer its reversal?
Theorists have grouped the causes of market failure under a number of headings:
5 This would appear to be a considerable underestimation given Indonesia’s per capita ownership rate had already reached 80 in 2012 and is being projected by some analysts to reach 300 by 2025 (Asiaone Motoring, 2012).
7
1. Lack of competition
2. Reduction in provision of viable alternatives (e.g. in the case of
automotive modal lock-in, public transport)
3. Negative externalities (such as congestion and the automobile’s
carbon emissions)
4. Incomplete markets and information failures; and
5. The phenomenon of public goods.
Lacking in the literature however is a comprehensive description of the important
interrelationships between all key market actors (producers, consumers and
government) which can illuminate the causal mechanisms and how they might be
reversed. In particular there is a need to describe how these interrelationships
operate under the conditions of path dependent growth which characterises the
emergence of the transport system in Jakarta, Indonesia and in a number of other
third world conurbations.
The concept of path dependence as a cause of market failure and lock-in was first
introduced into mainstream economic literature by Arthur (1983, 1989) and David
(1975, 1985). They argued that economic outcomes are not always the product of
current conditions and market forces as characterised by classical equilibrium
economic theory. Rather, history does matter in that previous outcomes can be a
critical factor in determining economic outcomes. In this way market forces do not
always act in a rational manner and can produce an equilibrium in which there is an
inefficient allocation of resources (non-Pareto efficient) – and therefore market
failure.
Initially, the way in which path dependence could lead to lock-in was applied to
technological change and used to explain the curiosity as to why more cost effective
products or systems were not always adopted (David’s (1985) key example was
8
that of the QWERTY keyboard). However its use was subsequently expanded to
explain the evolution of larger economic and socio-economic phenomenon for which
conventional equilibrium theory was seen be an inadequate analytical tool. Despite
this broadening of the theory of path dependence it has yet to be well integrated into
the mainstream of economic analysis. In part this reflects the influential
preoccupation of Chicago school economists to definitionally minimise the
importance of market failure (and its extreme form of lock-in) in economic theory.
More recently however, market failure has gained an elevated theoretical status in
the wake of the global financial crisis. Economists such as Soros (2008) and Stiglitz
(2009) have argued that the global financial crisis in 2008 provides strong credence
to their view that markets have no necessary ergodic tendency to efficiency.
This thesis contributes to this literature on the linked phenomenon of path
dependence, market failure and lock-in by, firstly, proposing an explanatory
framework based on automotive transport systems in which three evolutionary
stages are defined. This is achieved by identifying the changing roles of key market
actors – consumers, government and producer created socio-economic systems.
Indicated is the way in which path dependence and the consequent changes in
market actor interrelationships generate substantive changes to the market
environment of the automotive mode. Secondly, a further contribution to the
literature is made through the use of demand and choice modelling of commuter
surveys which provides a measure of the strength of lock-in in its third stage of
evolution. This provides data which supports the notion of a third stage of lock-in as
defined by the changing role of consumers and the important role of influence as a
key cause of market failure and lock-in.
By identifying systemic market failures of transport systems in both developed and
developing countries the thesis adds evidence to studies by Stiglitz (2009a, 2010)
and others (Soros, 2008) who have argued market failure is more widespread in
market economies than has been generally accepted by the theoretical mainstream
of the economic discipline.
In showing that asymmetries of influence are an important driver of market failure,
lock-in and its durability, an important definitional distinction is made from
9
asymmetries of information. From the literature it is noted that the means for the
public (as consumers) to articulate, aggregate, and create a level of influence over
transport policy is comparatively weak (see, for example, Stigler, 1971; Peltzman,
1976; and Becker, 1986). This is shown to be particularly so in developing countries
where information asymmetries may be greater and access to governments and
their instrumentalities restricted through weakly developed democratic and
bureaucratic institutions. On the other hand the extent to which commercial interests
can co-opt governments and consumers to achieve their aims is shown to be
considerably superior given their greater capacity to aggregate and apply influence.
In summary, the aim of this dissertation is to:
Contribute to a dynamic and systematic model of the way in which
path dependent market failure can produce transport modal lock-in.
Through an historical analysis of the evolution of automotive transport
systems in the U.S.A. and Asian conurbations
o develop an explanatory framework which describes the emergence of
automotive modal lock-in through the changing role of key market actors
Through an empirical study of Jakarta commuters provide validation of
the explanatory framework developed to explain automotive modal
lock-in, and in particular
o provide a measure of the strength of automotive modal lock-in
o assess the level of commuter support for reversal of automotive modal
lock-in in a developing country context.
In light of the above aims, the thesis research is based on three linked hypotheses:
10
1. Developing country conurbations subject to automotive modal lock-in
and rising externalities become subject to falling levels of aspirational
demand for the automotive mode of transport.
2. Where automotive modal lock-in is present the lack of public transport
becomes an important positive feedback driving demand for the private
automotive mode
3. Automotive modal lock-in can be shown to emerge in three identifiable
stages. In the third acute stage there will be strong commuter
willingness to pay to reverse automotive modal lock-in.
1.4 Methodology
The thesis research is structured in three parts. The first – Chapter Two – makes a
critical examination of the theoretical literature on path dependence, market failure
and lock-in and in particular as it applies to large socio-economic systems. The
second part – Chapters Three and Four – develops a theoretical framework of lock-
in which is an outcome of path dependent growth and which evolves from a large
socio-economic system. This is firstly based on an historical study of the
development of the automotive mode of transport in the U.S.A. and secondly on
similar studies in developing countries of the Asia-Pacific region.
The third part – Chapters Five to Eight – describes two empirical surveys of
commuters in Jakarta which are used to profile the nature of automotive modal lock-
in6 in a developing country and validate the theoretical framework developed in part
two of this thesis. Jakarta was chosen given the sunk investments in public
transport infrastructure is still relatively modest, and given the high and rapidly
growing level of per capita automotive ownership.
Choice experiments are used to measure the strength of lock-in by eliciting
commuters’ willingness to forego automotive transport for improved public transport,
6 In defining automotive modal lock-in, ‘automotive’ is taken to include motorcycles as well as automobiles given the former’s importance as a private transport mode in developing countries.
11
lower pollution, congestion and better health outcomes. In this way, policy pathways
available to facilitate the reversal of transport modal lock-in are explored. The
emphasis here is not on the early incubatory stages of automotive modal lock-in
but, rather, on the dynamics and roles of key market actors – consumers,
governments and industry – in the subsequent stages of lock-in.
Adopting some of the key concepts of Unruh (2000), a dynamic model is developed
which identifies three discrete evolutionary stages of lock-in differentiated by the
changing roles of the principal economic actors.
In the U.S. case study, the first stage of growth is driven by the internal economies
of scale produced by mass production and positive feedback created by the IC
engine’s rapid market domination. In the second stage, path dependent growth is
catalysed as wider socio-economic positive reinforcement mechanisms become key
agents of market expansion. In the process, the transport market itself is reshaped
and substantive negative externalities generated through this reshaping. A
particular characteristic of this process is the important role of market information
and influence asymmetries. In the third stage full lock-in is shown to occur in the
Kuala Lumpur and Jakarta conurbations as rising direct and indirect costs (negative
externalities) produce a negative benefit cost ratio for the automotive transport
mode. In this environment the automotive socio-economic system increasingly
focuses on securing legislative and regulatory support for sustaining lock-in. By
contrast a third/reversal evolutionary stage is identified for the conurbation of Seoul,
in which automotive modal lock-in is averted while an initiation of this reversal is
indicated for the conurbation of Beijing.
Chapter Four adds to the literature on lock-in by describing how automotive modal
lock-in has been introduced and implanted in rapidly developing economies. In
doing so a truncated version of the staged automotive modal lock-in’s evolution is
described. Thus the implanting of an already developed vehicular means of
transport in a high growth developing country conurbation such as Jakarta produces
rapid evolution and modal domination.
12
The third Section of the thesis – Chapters Five to Seven – provides a measure of
the presence and strength of automotive modal lock-in through surveys and a
discrete choice experiment involving commuters in Jakarta. Jakarta was chosen as
the location for the survey given its transport system exhibited the key characteristic
of automotive modal lock-in. That is, a high cost urban transport system based on
rapidly rising per capita automotive ownership, high levels of automotive generated
congestion, a minimal level of public transport and high levels of transport
generated environmental negative externalities. Given the country’s still low level of
sunk investment in its transport infrastructure, the benefits of automotive modal
lock-in reversal were seen to be substantial.
As mentioned above a discrete choice experiment is used to measure the strength
of lock-in by eliciting commuters’ willingness to forego private automotive (including
motorcycle) transport in return for, variously, improved public transport, lower
congestion, pollution, and accident rates, shorter commuting times and better
health outcomes. The questionnaires which accompany the choice experiment elicit
socio-economic profiles of participating commuters, including travel habits and
attitudes, and awareness of environmental externalities created by transport.
The survey outcomes were designed to provide a framework for assessing the
feasibility of avoiding automotive modal lock-in in developing countries. The
outcomes are therefore designed to be used as a means of establishing priorities
which deliver a lower cost more efficient transport system in urban areas, and the
reduction of social and environmental externalities created by private automotive
based transport systems.
By including willingness to pay estimates, an important addition to the literature is
achieved by creating a measure of the presence of lock-in. Thus the size of
commuters’ willingness to pay to reduce the economic, social and environmental
negative externalities of the automotive transport mode provides an indication of the
extent of lock-in. The outcomes therefore generate a useful input into developing
policy pathways focussed on reversing transport modal lock-in.
13
1.5 Thesis chapter summary
Following this introductory overview the second chapter reviews the literature on
market failure, path dependence and lock-in, and identifies specific gaps in the
literature. How the thesis addresses these gaps is then discussed. Chapter Three
takes the form of an historical analysis of path dependence and lock-in of the
automotive mode of transport in the U.S.A. From this analysis a theoretical
framework is developed to explain the staged emergence of market failure and lock-
in in markets created by large socio-economic systems. The three stages identified
describe the changing roles key market actors – consumers, government and the
large socio-economic system – play in the evolution of automotive modal lock-in.
Chapter Four uses the theoretical framework developed in Chapter Three as a
basis for analysing the extent to which automotive modal lock-in has been exported
through the arteries of global trade and investment to developing countries in Asia.
These insights contribute to the development of a truncated model of automotive
modal lock-in evolution in developing countries. The differentiated extent of
automotive modal lock-in between developing and developed countries provides an
illustration of the importance of path dependence in explaining these differences.
The development of the car/motorcycle industry in Indonesia and its role in
generating automotive modal lock-in is examined.
Chapter Five describes the methodology used to create the surveys of Jakarta
commuters. The reasons for the choice of Jakarta are explained in terms of its
stage of economic development, level of automotive ownership, and extent of road
and public transport infrastructure. The structure of the socio-economic profiling is
outlined and the methodology used to create the choice questionnaires is
established.
In Chapter Six the econometric methodology for the analysis of the two surveys is
described. Specification of the automotive demand, the stated preference
experiment and willingness to pay models are provided. Chapter Seven contains
the results of the preliminary and final surveys. Described are the socio-economic
profiles and the outcome of regression analysis of the choice experiment.
14
Chapter Eight firstly outlines the theoretical contributions of the thesis as they relate
to the theory of lock-in of large socio-economic systems and their particular
relevance to developing country economies. The results of the thesis surveys and
the extent to which they validate these findings are discussed. In conclusion, the
policy implications of these findings in the context of strategies to avert and or
reverse automotive modal lock-in developing countries are set out.
15
CHAPTER TWO: LITERATURE REVIEW OF RESEARCH ISSUES
2.1 Introduction
This chapter provides the theoretical background and grounding for the
dissertation’s research. Identified are gaps in the literature and the contribution this
thesis makes to meeting these omissions. The central hypothesises and research
findings are then explained.
The focus of this thesis is the large intra and inter-generational welfare losses
created by path dependent evolution of transport systems leading to market failure
and lock-in. The reasons why domination of urban transport systems by the
privately owned automotive mode continues to endure, despite the availability of
more cost-efficient public transit alternatives, is therefore the subject of the
dissertation’s research. The central research question posed is under what
conditions can automotive modal lock-in be reversed and, more particularly, is such
a reversal any more likely in a developing country such as Indonesia where the
sunk investment in infrastructure is relatively smaller than in developed country
economies?
As a prominent and acute form of market failure, automotive modal lock-in’s
theoretical underpinnings are an important area of study. Stiglitz (1989) lists a
number of major causes of market failure which include (1) lack of competition; (2)
reduction in provision of public alternatives (3) negative externalities (4) incomplete
markets – including asymmetric information – and 5) information failures.
Of particular interest to this study is the dynamic process by which market failure
evolves and the changing role of market agents in this process. To provide such a
dynamic analysis a review of the literature on the linked concepts of path
dependence and lock-in is provided in Section 2.2 of this chapter. This describes
how path dependence has become an important theoretical tool for explaining not
16
only the evolution of technologies and technological systems, but also the
development of large macro-level institutions and economic phenomena. Noted are
the findings that large institutions tend to be particularly prone to path dependent
growth. Also highlighted in the literature is the way in which externalities are a
frequent by-product of path dependence and a characteristic of failed markets
studied by environmental economists. The role of asymmetries of information and
influence in catalysing path dependence is discussed. In doing so the role of
asymmetric influence is examined as an additional and key element of path
dependence and a central contributor to the durability of lock-in.
In Section 2.3 the evolution of the concept of market failure is discussed, the way in
which it arose out of the great depression, and the theoretical credence given it by
post war economists such as Samuelson (1947) and later by Stiglitz (1989). The
theoretical interweaving of the concepts of path dependence and lock-in with market
failure is then examined. Criticisms of the theoretical and empirical underpinnings of
path dependence, lock-in and market failure are discussed in Section 2.4. In
Section 2.5 the concept of automotive modal lock-in is explained with particular
reference to Unruh’s (2000) description of carbon economy lock-in. The way in
which high cost automotive based transport systems have become a feature of
large developing country conurbations and the subject of lock-in is discussed in
Section 2.6. Also reviewed is Unruh’s (2002) description of the process by which
ACL has been ‘exported’ from developed to developing countries. Studies of
transport mode choice in Jakarta, Indonesia are enumerated.
The chapter concludes with a discussion in Section 2.7 of the gaps in the literature
and how the thesis contributes to filling in these gaps.
2.2 Market failure
The high direct and indirect costs associated with automotive modes of transport
have been the subject of considerable research (Kenworthy and Laube 1999;
Chamon et al., 2008; Litman, 2009; Rodrigue et al., 2009; International Energy
Agency, 2011). Such studies indicate that urban transport markets are often subject
17
to substantive market failure where more efficient lower cost public transport
systems have been effectively locked out of the market.
The notion that markets are imperfect is firmly rooted in classical economics.
Keynes (1936) was a strong proponent of government intervention in situations
where markets had failed. Others such as Pigou (1920) introduced the notion of
externalities – which described the way in which the actions of an economic agent
influences the utility or production of another and no means of compensation exists.
The 1960s proved to be the heyday of market failure theory as concerns over
negative environmental externalities became a major public preoccupation justifying
widespread government intervention.
Samuelson (1964) and Coase (1974) provided further justification for the
acceptance of market failure as a norm rather than an exception by introducing the
concept of public goods. In this case market failure was identified as arising where
access to public goods could not be restricted to paying consumers.
In the 1980s Milton Friedman led the Chicago School’s laissez faire approach to
economics which argued that free markets were inherently efficient. The more so if
deregulated and not subject to government intervention. Economists such as Hayek
(1971) would link these views to the Darwinian theory of evolution and survival of
the fittest by asserting that the dynamics of the free market process would ensure
the survival of the most efficient firms. Assumed therefore was that the powerful
rationalising forces of free markets would largely obviate market failure.
Such notions were, however, contested. The notion that market failure in varying
degrees was a norm rather than the exception was championed by Stiglitz (1986,
2002). In doing so he took issue with Stigler’s (1961) path finding work on market
information asymmetries and his view that they could be accounted for in economic
modelling once the market quantified them as transaction costs. Greenwald and
Stiglitz (1986) argued that information was far more troublesome that a mere
transaction cost representing a major new economic paradigm and a key cause of
market failure. Information asymmetries and deficiencies could, and did, create the
persistence of non-Pareto efficient markets. Moreover this phenomenon (given
18
markets did not provide appropriate incentives for information disclosure) was the
rule rather than the exception. As Stiglitz (1986) asserts:
“…externality-like effects are pervasive whenever information is imperfect or
markets incomplete – that is always – and as a result, markets are essentially never
constrained Pareto efficient. In short, market failures are pervasive” (page 478).
Stiglitz also noted that information deficiencies led to consumer lack of foresight
about the consequences of their own actions (moral hazard) which could lead to
market imperfections. Simon (1947) in his development of the theory of bounded
rationality, also emphasised that imperfect decision making should be regarded as
the norm rather than the exception. Simon argued that decision making in
economics could never be wholly rational or optimal given limits on the cognitive
resources of such actors. In this way, economic actors sought satisfactory solutions
rather than optimal ones.
In the aftermath of the Global Financial crisis George Soros (2008) and Stiglitz
(2010) have argued the crisis was a perfect of example of how irrational markets
could and do evolve. As Stiglitz (2009a) wryly remarked “Today we realise that the
reason that the invisible hand often seems invisible is that it is not there.” (page 12).
In a subsequent book on the global financial crisis, Stiglitz (2012) observed “…we
allowed markets to blindly shape our economy and in doing so they helped shape
ourselves and our society.” (page 276). Such blindness Stiglitz points out could be
sourced to information asymmetries which led to firms populating the financial
sector becoming increasingly more, not less, short-sighted:
“Standard economics assumes that we are born with fully formed preferences. But
we are shaped by what happens around us including, and perhaps most
importantly, by the economy.” (page 277).
Soros (2008) similarly argued it was unrealistic to suppose that in any given market,
all economic agents involved could be fully informed or that they would always act
in a fully rational way even if transaction costs were known. He pointed out that
19
between the cognitive and reflexive activities involved in decision making there is
indeterminacy which runs counter to the sort of rational scientific causality in the
natural world.
Adding a further element to the theory of market failure are Stigler (1971), Peltzman
(1976), and Becker (1986) who sought to explain how the use of influence could
affect regulatory outcomes and produce economic inefficiencies in markets. Stigler
noted that the basic resource of Government is the power to coerce and that
interest groups seek to influence governments to improve their wellbeing.
Importantly, he observed that small well organised groups, whose individual
members stand to individually gain substantially, are inherently more successful in
lobbying governments than large groups where individual rewards are small or
spread unevenly (the free rider problem). Becker’s contribution lies in his depiction
of multiple interest groups sharing a finite amount of influence. The greater
resources applied by smaller more effective groups would, he argues, tend to be at
the expense of larger interest groups.
Stigler applied his new paradigm on the role of information in economics to point out
that governments could use information asymmetries to distort markets:
“As in the theory of the firm where the current management has an incentive to
increase asymmetries of information in order to enhance market power, so too in
public life” (page 487).
2.3 Market failure, path dependence and lock-in
A number of economic theorists such as Unruh (2000) and Geels (2005) have
argued that the locking in of the automotive mode’s domination (and the locking out
of potentially more cost effective transport modes) is best understood by the theory
of path dependent growth. Using this analytical lens a far more complex
constellation of influences are revealed as drivers of high levels of automotive
ownership and use.
20
The development of path dependence as an important tool of analysis in economics
is generally attributed to Arthur (1983) and David (1975, 1985) who sought to
explain how the adoption of technologies and technological systems could dominate
a market despite the presence of superior alternatives.
At the core of Arthur and David’s work is the notion that, in economics, history can
matter. That is, outcomes are not always the product of current conditions and
market forces as characterised by neo-classical equilibrium economic theory, but of
previous outcomes. As David (2007) points out, path dependence represents the
property of systems whose dynamics are non-ergodic – that is those which do not
respond to known market forces and return to a predicable equilibrium. Under these
conditions David and Arthur showed that the effect of a random historical event on
the evolution of a technology can be magnified over time by path dependent forces.
From this process a number of outcomes are possible some of which represent a
new market equilibrium in which there is an inefficient allocation of resources – in
other words which are non-Pareto efficient. As Puffert (2000) notes:
“The economics of path dependence tells us not only how history matters in
allocation: it also tells us how, even more fundamentally, time matters (author’s
italics)… (Thus) because new technologies and their uses – as well as interests and
strategies of interacting agents – are revealed progressively over time, allocation
processes also evolve progressively rather than being decided in one timeless
moment of expectations formation” (page 25-26).
The classic case of path dependent lock-in cited by David (1985) is that of the
QWERTY keyboard which became the dominant standard and universally adopted
notwithstanding the availability of ergonomically superior keyboard formats. A
random decision to adopt the QWERTY keyboard, David notes, triggered positive
feedback mechanisms which led to its almost universal adoption.
From the QWERTY and other examples Arthur (1983, 1989) and David (1985,
2007) identify the key drivers of path dependence and lock-in. Arthur (1994) lists
four major classes of increasing returns: scale economies, learning effects, adaptive
expectations and network economies. Scale economies relate to a technology or
21
product’s set-up or fixed costs, which decline as mass production reduces unit
production costs. Arthur points out that under these circumstances there is the
phenomenon of quasi irreversibility of investment. Given the large sunk costs of this
original investment, firms will be reluctant to invest in more cost effective
alternatives.
Learning effects describe the process by which a product is improved and its cost
reduced as specialised skills and knowledge accumulate through production and
market experience7. On the demand side adaptive expectations arise as uncertainty
is reduced for consumers as they become increasingly attracted to the quality,
performance and longevity of the current technology or product. As Foxon (2002)
notes, this produces a lack of ‘market pull’ for more sustainable alternatives.
Network or co-ordination effects are shown to accrue to consumers where they
adopt the same technology or product as other consumers. Similarly, where
infrastructures is developed in support of the existing technology or product, a
barrier is generated to the adoption of any more cost effective product not yet
similarly benefitted8.
Arthur in his 1989 paper models the development of two competing technologies to
show that the four differing forms of increasing returns can amplify small, essentially
random, initial variations in market share and result in one technology gaining
complete market dominance at the expense of the other.
Given the non-reversibility of path dependence it could, Arthur and David argued –
as it did in the case of the QWERTY keyboard – lead to an inherently inefficient
technology achieving market domination and becoming locked in within a new
stable market equilibrium. Arthur and David used the term lock-in to describe the
7 Arrow (1962) described the concept of ‘learning-by-doing’. In subsequent empirical studies the effect of declining unit costs from learning curves has been demonstrated (International Energy Agency, 2000). 8 Foxon (2002) points to the example of telecommunications technologies where the more others have a mobile phone or fax machine, the greater utility the consumer derives by having a compatible one.
22
way in which the new market equilibrium could only be disturbed by an exogenous
shock since, by definition, endogenous market forces were in equilibrium.
Many of the models of technological change evolution and lock-in which have
subsequently drawn on David and Arthur’s works (see Rip and Kemp, 1998;
Berkhout, 2002; Bergek et al., 2007; Markard and Truffer, 2008 and Smith et al.,
2010) have as their primary focus the evolution of individual technologies. In these
studies the primary interest is the nature of often fragile and complex incubatory
forces and niche development paths.
A number of economists (see, for example, Koschatzky, 2000; Walker, 2000;
Berkhout, 2002; Cowan and Jonard, 2003; Geels, 2005; Choi, 2008; Storz, 2008)
have focussed on the way in which socio-technological systems have become part
of a multi-tiered interactive process of technological evolution and diffusion. Such a
model of the innovation cycle is taken as a starting point to focus on how specific
technologies can spread rapidly through path dependent forces, emerge as large
technological systems and thereby play a key role in locking out competing and
sometimes superior technology.
In describing the process of technological evolution Geels (2005) defines the term
socio-technological system as one which incorporates “…a cluster of elements
including technology, regulation, user practices and markets, cultural meaning,
infrastructure, maintenance and supply networks…” (page 446).
He noted that elements and linkages of socio-technological systems do not exist
autonomously but are created and developed by social groups and their agents.
Collectively, they form a wider socio-technological regime which, as defined by Rip
and Kemp (1998) can include policy makers and which, while acting with relative
autonomy, also interact and form networks with mutual dependencies.
Geels (2005) uses the multi-tiered model in his account of the evolution of the
socio-technological system which encases the IC engined automobile. This system
is described as being composed of the automotive industry plus the associated
network of interdependent entities drawn from industry, consumers, and
23
government. As such, the definition provides a useful approximate definition of the
elements which comprise the automotive transport regime referred to in this thesis9.
The question of how wider socio-economic institutions become key actors in the
path dependent evolution of particular markets is taken up by Pierson (2000) who
points out that descriptions of path dependence, as it relates to a particular
technology, may not in fact be about the technology itself but the characteristics of a
technology in interaction with certain qualities of related social activity. Puffert
(2000) similarly argues that as for path dependent technological change:
“…the evolution of institutions, organisations and cultures surely depends on the
patterns of interactions (i.e. the formal structure of social networks), the
characteristics of innovative practices, foresight switching costs, possibilities and
internalising gains from switching, and other matters analogous to those discussed
here”. (page 27).
Urry (2008) in referring to the rapid expansion of the automotive transport mode in
the U.S.A. during the 20th century notes that:
“…this naturalisation of the car and its increasingly extensive lock-in with multiple
institutions/organisations necessary for its expansion was facilitated through a new
discourse of governance...” (page 344).
The evolution of large technological systems is at the centre of Unruh’s (2000)
landmark study of carbon lock-in. Unruh’s major contribution is to emphasise the
important role of government in the interaction of large technological systems. Such
interactions can lead (as in the case of the carbon economy) to what he describes
as techno-institutional complexes:
9 For the purposes of this thesis the use of the term ‘socio-economic regime’ is taken to be analogous to Unruh’s concept of the techno-institutional complex and Geels’ socio-technological regime. The term ‘socio-economic system’ is used to refer to the product/service/system generated by the socio-economic regime – in this case the automotive modal system – and which becomes subject path dependent growth and lock-in.
24
“Governments can be involved in the evolution of technological systems in many
ways. In market democracies, for example, constituencies can draw law makers in
by lobbying socials for support and preferential treatment of an existing
technological system” (page 825).
Others have sought to further broaden the scope of path dependence’s reach by
applying it to a yet broader range of macroeconomic phenomena. Studies by
Krugman (1998), Grabher (1993), Eichengreen (1996) and David (2007) and
Moodysson et al. (2008) examine how path dependence can be a key element in
the development paths of large institutions and even whole economies. In this way,
the location of industrial clusters, the evolution of international trade patterns and
international monetary systems and even differing economic growth rates of
countries, were shown to be the product of path dependent evolution. Pierson
(2000) applied path dependent processes to the political domain arguing that
“…political development is punctuated by critical moments or junctures that shape
the basic contours of social life” (page 251).
The notion that the development of large scale technological systems could be
particularly prone to path dependence and a period of lasting lock-in, has been
argued by a number of authors. North (1990, 1996) observed that path dependence
could be more marked at the institutional level, a view similarly held by Pierson
(2000):
“Path dependent processes will often tend to be most powerful not at the level of
individual organisations or institutions but at a more macro level of organisations
and institutions …” (page 255).
Martin (2010) referred to ‘radical’ technologies as:
“…the occasional innovations that define critical junctures in the history of
economic development, that transform the whole economy, that entire markets
become locked into, and that last unchanged (in a sort of stable equilibrium state)
for considerable periods, until they are replaced by another radical new innovation”
(page 22).
25
The theory of lock-in and path dependence have also been increasingly applied to
environmental issues to explain the slow or blocked technological diffusion of
environmentally friendly technology (see, for example, Cowan and Gunby, 1996;
Unruh 2000; Walker 2000; Berkhout 2002). In doing so they underline the key role
of negative environmental externalities which can be accumulated in a path
dependent growth of a technological system and, ultimately, become a key factor in
the development of market failure10.
2.4 Critical analysis of path dependence and lock-in
The linked theories of path dependence and lock-in have generated considerable
debate between economists – who view markets as the dominating and
rationalising force in economic growth – and economic historians. Thus Martin
(2010) in emphasising the importance of history in economics notes that the
initiation of path dependence by a random event:
“...immediately distances the notion from standard equilibrium economics, where
the past has no influence on outcomes, and the economy is assumed to converge
(typically instantaneously) to a unique equilibrium state, regardless of where it
started from” (page 3).
Martin (2010) sees as unrealistic the notion of the emergence of a new technology
or product and any competition with other emergent rivals taking place without
being uninfluenced by inherited market conditions. However Martin (2010) and other
critics (see, for example, Stark and Bruszt 2001; Schwartz, 2004; Boas, 2007) also
claim that the equilibrium outcomes of path dependence described by Arthur and
David are rarely equilibriums but more often dynamic and not necessarily moving
towards such a state. Martin argues that empirical studies of locational theory
indicate a process of gradual evolution rather than a number of equilibriums being
10 Imperfect information is shown to be the critical element in Cowan and Gunby’s (1996) environmental case study of path dependence and lock-in in agriculture. They show that farmers were, at the outset, unaware that the use of integrated pest management over the longer term would be a more cost effective option than pesticides. However, the initial higher returns from using pesticides created a path dependent process which eventually locked them into its usage.
26
dislodged by exogenous shocks. The prevailing model of path dependence has
therefore been seen by some economists to overstate the degree of inertia in
political and social institutions.
A more frontal attack on the nature of lock-in and its handmaiden path dependence
was launched by Chicago School economists. Stigler (1985) did much to popularise
the notion of ‘Government failure’ – as a reason for reducing market regulation and
lending greater weight to the rationalising forces of the market. Liebowitz and
Margolis (1995) sought to show that the market’s inherently rationalising nature
would make true lock-in exceptionally rare if not non-existent. They conceptualised
lock-in as occurring in three progressively more robust forms. The first early stage
implies no inherent future inefficiency but simply the initiation of a path dependent
course through a particular event. The second occurs where path dependence
leads to an inefficient outcome but due to imperfect knowledge, cannot be rectified.
The third stage or ’true’ lock-in is reached only where there is the possibility of
remediation of the inefficient outcome. In other words, for Liebowitz and Margolis
lock-in occurs only when the known switching costs of transferring to a superior
technology are less that the costs of remaining with the locked in technology.
However this situation is claimed to be unlikely, if not non-existent, given the
inherently ‘purposeful behaviour’ of economic actors who would have averted lock-
in by effecting a switch it if were profitable to do so.
Their assertions about the self rationalising powers of the market did not go
unchallenged. Puffert (2000) argued that Liebowitz and Margolis confuse the
concept of path dependence with the mechanistic deterministic model of chaos
theory in which a purposeful deliberate action can override this form of path
dependence. Ignored, he points out, is that “…positive feedbacks…interact with
purposeful behaviour and the limitation on which history imposes on what future-
oriented behaviour can accomplish” (page 7).
David (1997) challenges Liebowitz and Margolis’s claims that full blooded third
degree lock-in is unlikely given that the locked in inefficiencies will simply be
manifested in high transaction costs. He notes that while in a static context such a
27
definition might hold in a dynamic sense, there is no justification for accepting that
this status quo should be accepted as desirable:
“When one says it is ‘best’ to leave the situation as it is, because making it better
would cost as much as the improvement is worth, that is a judgement which accepts
the history that created the status quo…Should we not consider, instead, the
possibility that even if a remedy is now available the present state of affairs may
well have been avoidable, and in that sense ‘regrettable’” (page 28).
David then makes the further point that “It is quite possible that the costs of
remedial actions were lower at various points along the path than they subsequently
became….” (page 28).
Moreover while Liebowitz and Margolis’s concept of third level lock-in may, perhaps,
apply to a small industry or firm which has a limited number of costs and competing
interests to account for, it is harder to apply to much larger institutions or industries
where a number of countervailing influences are in play. Such influences may
manifest themselves in the form of market failure which is the product of institutional
failure. In this case while consumers may be well be informed about alternative
lower cost systems to that of the incumbent technology or system, governments
may – if persuaded by industry which finds the status quo more profitable – stand in
the way of transition (e.g. through regulatory barriers). Governments (and as noted
in Chapter Eight, particularly the Indonesian Government) have shown themselves
to be particularly vulnerable to such persuasion where the automotive industry has
become a key component of economic growth and a major employer of labour.
Other economists such as Soros (2008) and Stiglitz (2010) argue that the global
financial crisis represented a perfect of example of how irrational markets could and
do evolve. Soros points out that it is unrealistic to suppose in any given market that
all economic actors involved could be fully informed. Equally he argues it cannot be
assumed they would always act in a fully rational way even if transaction costs were
known. Between what he terms as the ‘cognitive’ and ‘reflexive’ activities involved in
decision making, there is ‘indeterminacy’ which runs counter to the sort of rational
scientific causality in the natural world. Proponents of lock-in therefore accept that,
28
consistent with the assertion that markets can and do evolve in a non-rational way,
lock-in can and does persist – even when knowledge of its inefficiency was known.
2.5 Transport modal lock-in
A number of economists have turned to the theory of path dependence to provide
the underlying explanation for the locking in of dominant technologies and of wider
macro-economic phenomena. Puffert, 2000; Unruh, 2000; Geels and Kemp, 2007;
and Urry, 2008 all use the theoretical lens of path dependence to analyse the
evolution of the IC engined automobile into a large socio-technological system and
its eventual lock-in.
Urry (2008) notes that the complex system which makes up the automotive mode of
transport arose from a path-dependent pattern initiated in the 1890s and which
generated massive increasing return from those producing and selling cars. Such
increasing returns were, he noted, a product of a system which became so large
and powerful it shaped its own market:
“…the power of automobility is the consequence of its system characteristics. Unlike
the bus or train system it is a way of life, an entire culture (Miller, 2000). It has
redefined movement, pleasure and emotion in the contemporary world. Sheller
emphasises ‘the full power of automotive emotions that shape our bodies, homes
and nations’ (Sheller, 2004, page 237; Gilroy, 2000). The car system possesses
distinct characteristics. It changes and adapts as it spreads along the paths and
roads of each society, moving from luxury, to household, to individual item. It draws
in many aspects of its environment which are then reconstituted as components of
its system; the car system became central to and locked in with the leading
economic sectors and social patterns of 20th century capitalism. It changes the
environment for all the other systems. It promotes convenience rather than speed;
the car system is a key component in the shift from clock to instantaneous time. It
seems to provide the solution to the problems of congestion that it itself generates.
It is able to externalise dangers onto those outside the system as it provides
enhanced security for those within it. And it is central to the individualist,
consumerist culture of contemporary capitalism” (page 347).
29
Unruh (2000) seeks to show that the automotive example of path dependence and
lock-in is one of a number of locked in technologies which inhabit the western world
carbon economy. In doing so Unruh makes an important contribution to the
literature by tracing in a detailed way the development of an original technology – in
this case the IC engine – into a technological system and the manner in which it
achieves lock-in of the automotive mode. At the industry level the manufacture and
sale of IC engine technology produces linkages “…arising from systemic relations
among technologies, infrastructures, interdependent industries and users.” (page
822).
Co-evolving with this firm level network is an institutional form of lock-in as linkages
are forged with private and public institutions such as professional engineering
associations, auto trade unions, and the automotive press. Unruh argues that these
private institutions can be behavioural in form and can socialise public life by
contributing to the reshaping of residential location, work habits and leisure time. In
this way public institutions play an important part in creating a “…self referential
system that tends to increase in value with the growth of the technological
system….” (page 824). Unruh also points out the important role Governments can
play in the evolution of a technological system such as the automotive by interfacing
with social and professional networks – e.g. lobbyists. Insofar as the outcome is
favourable to the growth and/or stability of the technological system, this type of
interface further re-enforces lock-in.
Finally, Unruh (2000) suggests that, at the marco level, the intimate inter-linkage of
large technological systems and institutions can feed off each other in a self
referential system which he calls a techno-institutional complex (TIC) which is
analogous to that of the socio-technological regime used by Geels and others). The
TIC emerges:
“…through synergistic co-evolution initiated by technological increasing returns and
perpetuated by the emergence of dominant technological, organizational and
institutional designs” (page 826).
30
As such, TICs are composed of large technological systems and the public and
private institutions that govern their diffusion and use. They are able to
autonomously and collectively create:
“…persistent incentive structures which strongly influence system evolution and
stability…” through a process of “technological and institutional co-evolution driven
by path dependent increasing returns to scale” (page 817).
Accordingly, in advanced stages of technological evolution the TIC becomes the
locus of techno-institutional lock-in.
Unruh argues that the TICs generated by the carbon based segments of the
economy – notably the automotive and power generating industries – have been
particularly powerful and successful in securing the lock-in of the carbon economy.
Cited as evidence is Flavin and Dunn’s study (1997) which put the global subsidy
for the fossil fuel industry at $US200 billion annually. Further evidence of the extent
of automotive TICs’ influence is described by Sturgeon et al. (2008) in a study of the
global auto industry:
“Powerful lead firms and industry associations, large-scale employment and
relatively high rates of unionization, and the iconic status of motor vehicles in the
minds of consumers (and policy-makers) in many countries, increase the political
clout of the automotive industry” (page 28).
2.6 Cost benefit and lock-in
From the above the underlying reasons for the automobile’s domination of transport
systems are to be found in its role as a powerful agent of social as well as economic
change. This literature well describes the transformative effect of the automobile in
the U.S.A. (see, for example, Baudrillard, 1996; Kay, 1997; Featherstone, 2004;
Seiler, 2008; Lutz and Lutz Fernandez, 2010)11. In doing so, highlighted are the
wider social forms of utility which the automobile has progressively generated. They 11 Others have studied how the automobile has created differentiated social norms in various countries (Sedgwick, 1970; Koshar, 2004).
31
are shown to go well beyond the economic benefits of mobility to embrace leisure
needs as well as that of the more abstract aspirational/ psychological needs such
freedom, individuality, prestige and, ultimately, as a symbol and facilitator of key
American values (Seiler, 2008). And as Bauman (1998) claims:
“Mobility climbs to the rank of the uppermost among the converted values – the
freedom to move perpetually – a scarce and unequally distributed commodity fast
becomes the main stratifying factor in our late modern or post-modern society”
(page 2).
Baudrillard (1996) notes the automobile was to acquire an ambiguous nature being
at once both a dwelling place and a means of transport:
“The car rivals the house as an alternative zone of everyday life; the car, too, is an
abode, but an exceptional one; it is a closed realm of intimacy, but one released
from the constrains that usually apply to the intimacy of the home once endowed
with a formal freedom of great intensity” (page 67).
Described in these ways are the strength and depth of both economic and social
utility delivered by the automobile as its spread produces radical changes in spatial
living configurations and modes of social interaction. It is therefore a particularly
complex problem to source with precision the causes of the spread and ultimate
domination of the transport system let alone measure its effect with precision.
As noted in Chapter Two of this thesis, the linked theories of path dependence and
lock-in provide a convenient framework within which to describe the way in which
positive feedback mechanisms work to accelerate the automotive mode of
transport’s spread and, ultimately, its lock-in into a failed market. Thus, while
consumer utility is clearly a key driver in the initial stages of automobilisation, its
subsequent spread is increasingly influenced by the attraction of indirect subsidies
and the generation of negative externalities. This changing balance between what
motorists pay and the extent to which this covers the costs of motoring, drive
eventual market failure.
32
The size of these direct and indirect subsidies is the subject of considerable
research (see for example, Blum, 1982; Quintet, 1994; Delucchi, 1997; Greene et
al., 1997; Urry, 2004). A number of U.S. studies (Morris and DeCicco, 1996) found
that U.S. revenues from automotive users fell short of government expenditures by
22%. Similarly, a highway-cost allocation study by the Federal Highway
Administration (FHWA, 1997), indicated that highway user fees were 20% below
highway-related expenditures for all levels of government and all vehicle classes in
the U.S.A. More recently one of the most detailed studies of automotive costs and
expenditures in the U.S.A. by Delucchi (2007), again produces results which align
with previous studies as shown in table 2.1. Importantly, excluded from this
calculation are non-monetary environmental or oil-use externalities such as global
warming or the costs of oil supply disruptions.
The U.S.’s evident subsidisation of automobile infrastructure goes some way to
explain the higher level of automotive domination of the U.S.’s transport system
compared to EU countries12. Equally, the surplus of income over expenditure in EU
countries reveals their greater capacity to invest larger proportions of national
budgets on public transport systems.
12 It also may help explain the fact that usage of public transport in the EU which, as Schwartz (2004) points out, shrank further in the 30 years to 2000, still remained 2.5 times that of the U.S., and that per capita annual km travelled by U.S. motorists in 2000 was twice that of EU countries.
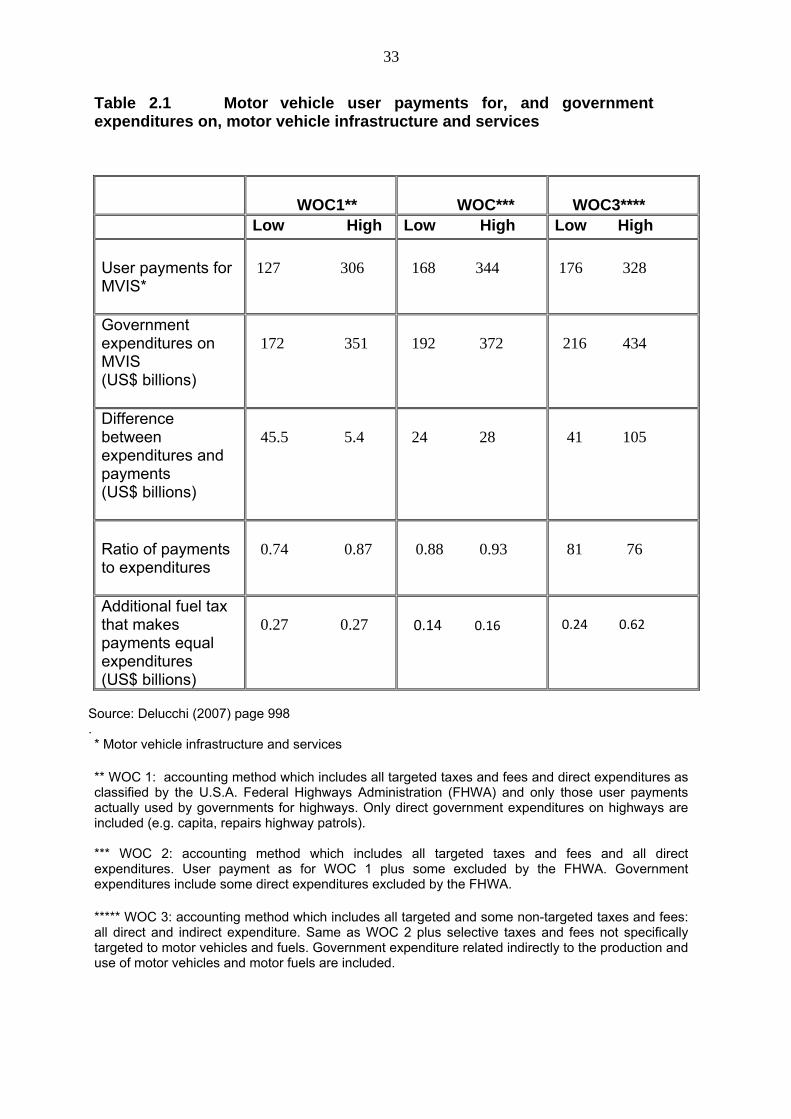
33
Table 2.1 Motor vehicle user payments for, and government expenditures on, motor vehicle infrastructure and services
WOC1**
WOC***
WOC3****
Low High Low High Low High
User payments for MVIS*
127 306
168 344
176 328
Government expenditures on MVIS (US$ billions)
172 351
192 372
216 434
Difference between expenditures and payments (US$ billions)
45.5 5.4
24 28
41 105
Ratio of payments to expenditures
0.74 0.87
0.88 0.93
81 76
Additional fuel tax that makes payments equal expenditures (US$ billions)
0.27 0.27
0.14 0.16
0.24 0.62
Source: Delucchi (2007) page 998 . * Motor vehicle infrastructure and services
** WOC 1: accounting method which includes all targeted taxes and fees and direct expenditures as classified by the U.S.A. Federal Highways Administration (FHWA) and only those user payments actually used by governments for highways. Only direct government expenditures on highways are included (e.g. capita, repairs highway patrols). *** WOC 2: accounting method which includes all targeted taxes and fees and all direct expenditures. User payment as for WOC 1 plus some excluded by the FHWA. Government expenditures include some direct expenditures excluded by the FHWA. ***** WOC 3: accounting method which includes all targeted and some non-targeted taxes and fees: all direct and indirect expenditure. Same as WOC 2 plus selective taxes and fees not specifically targeted to motor vehicles and fuels. Government expenditure related indirectly to the production and use of motor vehicles and motor fuels are included.
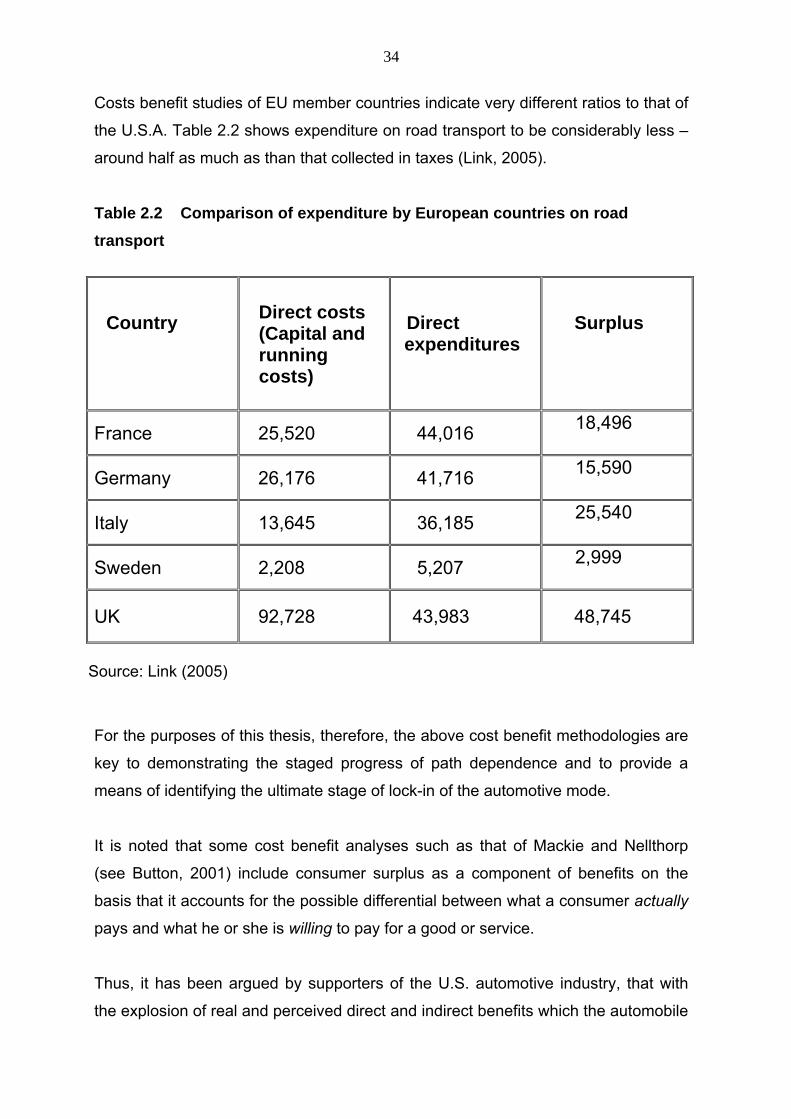
34
Costs benefit studies of EU member countries indicate very different ratios to that of
the U.S.A. Table 2.2 shows expenditure on road transport to be considerably less –
around half as much as than that collected in taxes (Link, 2005).
Table 2.2 Comparison of expenditure by European countries on road
transport
Source: Link (2005)
For the purposes of this thesis, therefore, the above cost benefit methodologies are
key to demonstrating the staged progress of path dependence and to provide a
means of identifying the ultimate stage of lock-in of the automotive mode.
It is noted that some cost benefit analyses such as that of Mackie and Nellthorp
(see Button, 2001) include consumer surplus as a component of benefits on the
basis that it accounts for the possible differential between what a consumer actually
pays and what he or she is willing to pay for a good or service.
Thus, it has been argued by supporters of the U.S. automotive industry, that with
the explosion of real and perceived direct and indirect benefits which the automobile
Country
Direct costs (Capital and running costs)
Direct expenditures
Surplus
France 25,520 44,016 18,496
Germany 26,176 41,716 15,590
Italy 13,645 36,185 25,540
Sweden 2,208 5,207 2,999
UK 92,728 43,983 48,745
35
bestowed on its owners in the first half of the 20th century in the U.S.A., a sizeable
consumer surplus was created by automobilisation. More recently an American
Petroleum Institute Study (Hogarty, 1988) is cited as showing U.S. automobile users
enjoying a large consumer surplus notwithstanding acknowledged subsequent and
cumulative generation of negative externalities.
The problem of estimating the originally Marshallian concept (Marshall, 1961) of
consumer surplus has however been a major one for economists. By the early
1960s environmental economists such as Knetsch (1963) took up the challenge and
successfully opened the way for viable forms of estimation. This was to be further
expanded by the use of stated preference models of non-use values (see, for
example, Champ et al., 1997; and Mäler and Vincent, 2005). Here, a number of
theoretical scenarios were created (distinguished by varying parameter values)
between which participants in the experiments were asked to choose. From these
choices a willingness to pay (WTP) could be derived for abstract parameters.
Such methodologies have been used to claim both a positive and a negative
cost/benefit for the automotive mode of transport in the U.S.A. Thus a study
supported by the automobile and oil industries (Cox et al., 2006)3 focused attention
on the universal and rapid rise in automobile ownership in first world economies. In
a cost benefit analysis the study seeks to show this rise as being a function of a
large and enduring consumer surplus. The derived utility which the automobile
offers, goes far beyond, it is asserted, mere transportation by capturing more
abstract needs of individual freedom, wider social interaction and prestige
generating a substantial consumer surplus. The study goes on to claim a favourable
benefit/cost for the automobile over public transport in the U.S.A. of at least 40%.
Domination of the automotive mode of transport in the U.S.A. is, then, characterised
by Cox et al. (2006) as:
“…primarily the result of consumer choice, rather than subsidies or coercion, and
overall, the automobile and its associated road and street infrastructure delivers
3 The book was published by the American Enterprise Institute – a think tank which receives substantial funding from a number of auto and oil companies including ExxonMobil.
36
huge net benefits to Americans that could not be obtained by any other measures
currently available or likely to be available for the foreseeable future” (Chapter Two).
However, the assumptions used carry with them some critical logical and
methodological flaws13. As David (2007) notes, where path dependence generates
a particular new development direction and leads to a new possibly negative cost
benefit equilibrium, it leaves behind a counter-factual (might have been) world
where a different and possible more cost effective product could have survived and
prospered. In the U.S.A. a viable public transport system can, therefore, be seen as
an all but non-existent counter-factual world of which taxi users would have no
means to access to provide a valid comparison. Moreover, an efficient form of
public transport could well itself attract a counter-balancing consumer surplus if the
actual cost was lower than the WTP. Finally, the analysis makes no distinction
between trips which involve commuters and other types of trips where private
transport is more highly valued.
Button (2001) notes that more commonly used methodologies to measure
consumer surplus involve revealed preference and stated preference techniques.
However, deriving a meaningful WTP can depend on to what extent consumers are
well informed about the real costs of motoring – most tend not to include
depreciation as a per km cost let alone hard to quantify indirect costs (e.g. free
parking, environmental damage and social disruption). Thus, the extent of a
consumer surplus, as measured by WTP, depends critically on the information
which consumers have about direct and indirect costs of transport modes (both
current and, more problematically, in the future) and to what extent they affect their
modal choice.
2.7 Automotive modal lock-in in developing countries
In his 2006 paper Unruh describes a process by which carbon lock-in is passed on
to developing countries via the conveyor belts of international trade and investment
13 The study uses a proxy – travel by taxi or hire car – to represent the upper bounds of the price automotive users are prepared to pay for choosing the automobile over public transport. In this way, Cox et al. (2006) claim drivers were attracting a consumer surplus of around $5.8 to 9.5 billion in 2000. This is added to the utility as measured by automotive direct costs involved in automotive use. Subtracting an estimated cost of automotive travel, the 40% favourable cost benefit ratio is arrived at.
37
flows. Thus, investment in automotive manufacturing by developing countries is
shown to have initiated a path dependent process similar to that experienced earlier
in developed economies in which the automobile (including the motorcycle) has
become locked in as the dominant mode of transport. Gallagher (2004) notes that
developing country governments have become highly dependent on such
investment. This occurs given the key role the automotive manufacturing sector
plays in economic take-off and the pressure of consumer expectations which see
automobiles as a rite of passage to higher standards of living.
An indirect measure of the extent to which consumers in developing countries are
aware of the nature of automotive modal lock-in and the direct and indirect costs
involved, is provided by research which seeks to capture levels of awareness of
environmental issues in developing countries (see, for example, Brechin and
Kempton, 1994; Payne, 2007; Tjernstrom and Tietenbergy, 2008). These studies
suggest that awareness levels are indeed high particularly when compared to
similar surveys in developed countries (Gallup International Institute Survey, 1992;
International Social Survey Program, 1993 and 2002).
Using regression analysis of the International Social Survey (2002) data, Payne
(2007) finds positive correlations between the level of environmental concern with
religion, urban residence, age and education for respondents in developing
countries. However, he finds a negative correlation for per capita income. Both
Payne (2007) and Tjernstrom and Tietenbergy (2008) point out that these and other
survey results run counter to Maslow’s (1954) hierarchy of human goals theory and
Inglehart’s (2008) post materialistic theories in which public willingness to tackle
environmental issues is asserted to be higher in developed countries where
individuals have the discretionary income to make the tradeoffs. It may therefore be
assumed that the severity of environmental problems facing urban residents in the
rapidly growing cities of developing countries are creating unusually high levels of
environmental awareness.
38
2.8 Gaps in literature: thesis aims
The analysis of the literate indicates that the linked theories of path dependence
and lock-in are still in the process of elucidation and development and yet to
become a mainstream element of economic analysis. As Puffert (2013) notes:
“ (it is)…not possible at this time to assess the overall importance of path
dependence either in determining individual features of the economy or in
determining larger patters of economic activity.” (non paginated article).
In terms of the thesis focus on the path dependent evolution of a large socio-
economic system some particular gaps and inadequacies in the relevant theoretical
development of the literature are evident. The evolution of larger socio-technological
and socio-economic systems has been generally pictured as an ongoing process
without defined stages. As North (1990) describes the process:
“The resultant path of institutional change is shaped by 1. The lock-in that comes
from the symbiotic relationship between institutions and the organisations that have
evolved as a consequence of the incentive structure provided by those institutions
and, 2. The feedback process by which human beings perceive and react to
changes in the opportunity set. The increasing returns characteristics of an
institutional matrix that produces lock-in come from the dependence of the resultant
organisations on that institutional framework and the consequent network
externalities that arise” (pages 6 and 7).
Geels (2005) equally sees the path dependent evolution of technology and
subsequent socio-economic market structures as a somewhat ill-defined ongoing
process occurring between differing organisational levels – the technological niche,
the ‘meso’ technological system and the ‘landscape’ (macro) level. Such transitions
come about:
“…through the alignment and interaction of dynamics at all three levels…which are
not mechanical and linear, but come about through the interactions of social groups
with different interests, strategies and values” (page 469).
39
Unruh (2000) similarly chooses to emphasise that the path dependent process
leading to lock-in involving large technological systems comes about through
complex ‘synergistic co-evolution’ (page 817). Thus he describes a process
whereby formal and informal societal institutions can emerge alongside
technological systems.
However this unstructured representation of a system’s path dependent evolution
provides no useful theoretical framework to analyse the changing role of market
actors in this evolution. In particular, no great attention is given to the evolving role
of consumers who clearly are of critical importance in evaluating the conditions
under which lock-in might be reversed. Moreover, as an evolutionary process the
character and importance of market actors is likely to change over time. These
changes will in turn be determined by the evolving economic, social and political
environments.
Such dynamic changes and their contribution to an explanatory framework which
seeks to provide sequential structure to the historical evolutions are therefore the
focus of studies of the development of automotive modal lock-in in U.S.A.
conurbations – contained in Chapter Four – and in a number of Asian developing
country conurbations (see Chapter Five).
The use of the linked theories of path dependence and lock-in provide a means of
addressing a further inadequacy in much of the current literature. The emphasis by
a number of authors (see, for example, Kenworthy and Laub, 1999, 1999a; Dargay
et al., 2007) has been to explain the extraordinarily strong growth in the automotive
transport mode in developed and now developing countries in terms of the robust
correlation with rising per capita income levels. But this provides an overly one
dimensional picture of automotive demand and provides no satisfactory answer as
to why such a high cost system endures notwithstanding the availability of lower
cost alternatives.
Two other gaps in the methodology used to describe the evolution path dependent
growth of large socio-economic systems are identified. Clearly indicated in the
evolution of large socio- and technological systems is their acquired capacity to
40
exert influence to beneficially shape their own markets. The noted use of influence
to achieve regulatory change is at the core of regulation theory developed, inter alia,
by Stigler, 1971; Peltzman, 1976; and Becker, 1986).
However, the literature does not satisfactorily provide a broad integration of the
concept of influence in the path dependent evolution of large socio-economic
systems and in particular in regard to the role of influence not only on government
regulation but also on other actors and in particular consumers. For regulation
theorists influence is generically subsumed in information asymmetries and
information failures – a device generally followed by analysts of path dependence
and large socio-economic systems. In Chapters Three and Four a more precise
definition of influence which distinguishes it from information asymmetries is
therefore developed to provide a clearer distinction of the forces driving automotive
modal lock-in.
The other identified gap in the literature refers to a lack of an empirical means to
measure the strength of lock-in in developing country conurbations – and in
particular the strength of automotive modal lock-in as reflected in the level of
consumer demand for reversing its effects. As noted, a number of international
studies indicate high levels of environmental concern in developing countries
flowing from the environmental costs of acute automotive congestion and pollution.
However there are no studies found which seek to measure the extent to which
there is a willingness to reverse automotive modal lock-in by choosing to forego this
mode in exchange for better public transport, less congestion and lower pollution.
Embedded in such modelling is the likelihood of revealing a more complex profile of
demand for private automotive modes where path dependent growth is evident. In
particular to be revealed is to what extent income alone remains a useful
explanatory factor and to what extent there are other underlying drivers.
The effect on automotive ownership of key variables such as income, road
infrastructure, and fuel prices in developed country markets is well documented by
Cragg and Uhler, 1970; Hensher, 1986; Kenworthy and Laube, 1999; and Cameron
et al., 2003. Such studies have been replicated in further developing country studies
(see, for example, Ingram and Liu, 1999; Dargay et al., 2007; Chamon et al., 2008).
41
Key studies by Dargay et al. (2007) and Chamon et al. (2008) indicate a high
correlation between income and per capita ownership. According to Chamon et al.’s
study at particular income levels (around $US4,500) the explanatory power of
income is around 80%14 and similar explanatory power occurs in predicting trans
country differentiation in per capita automotive ownership15. However as a
commentator on Chamon’s paper points out such high correlations can be
deceptive:
“In the panel data models, the impact on car ownership of the above-threshold
population share increases quite strongly over time. In other words, the results
imply that, over time, a higher and higher proportion of the ‘potential’ car owners are
choosing to buy cars. The reasons for this increase remain something of a black
box, which is a little problematic, not least when developing long-run projections of
car ownership” (page 287).
Thus, to what extent automotive demand reflects positive feedback mechanisms is
addressed by Chamon et al. (2008) only in passing (nor is it addressed in Dargay et
al.’s, 2007 study). In particular they do not model the possible role of public
transport on transport demand (which may either be attributed as a direct driver or
as a positive feedback mechanism)16.
14 Chamon et al. (2008) note “The income threshold is chosen (through a grid search) so as to maximize the regression’s adjusted R2 coefficient. For example, when only this threshold variable is used as a regressor (column 6, Table 3), the optimal threshold is found to be $4500, and this univariate regression yields an R2 of 0.83” (page 255). 15 On this basis they project car numbers will increase 350% to 2.3 billion worldwide by the year 2050. The bulk of the increase is to come from China and India whose per capita increases are closely tracking the income ratios of the western world at similar level of income. 16 Where the lack of public transport acts as a direct cause of private automotive demand it is likely to also act as a positive feedback mechanism and further increase demand. Thus where public transport services are inadequate greater demand for private transport means increased demand for resources to facilitate this expansion. This in turn reduces resources available for public transport and therefore induces yet greater demand for private modes.
42
2.9 Conclusion
In summary the aims of this thesis are to:
1. Use insights from the studies of the nature of demand for automobiles
in the U.S.A. and rapidly developing conurbations to develop an
explanatory framework of automotive modal lock-in drawing on the
differentiated roles of key market actors.
2. Contribute to the theory of path dependence and lock-in by examining
the role of influence as a driver of market failure and lock-in.
3. Through the use of demand and choice modelling:
o develop a means of measuring the presence of transport modal lock-in
in a developing country conurbation and thereby the potential for its
reversal – and in particular
o examine the role of public transport availability as a driver of
automotive demand
o provide an original input into the development of transport policies
which can assist in the reversal of market failure and lock-in
Underpinning these thesis aims are three central hypotheses about the nature of
automotive demand which the demand and choice models are designed to test.
They are:
1. Developing country conurbations subject to automotive modal lock-in
and rising externalities become subject to falling levels of aspirational
demand for the automotive mode of transport.
2. Where automotive modal lock-in is present the lack of public transport
becomes an important positive feedback driver of demand for the
private automotive mode.
43
3. In the third acute stage of automotive modal lock-in there will be
strong commuter willingness to pay to reverse automotive modal lock-
in.
Chapters Three and Four provide an historical analysis of the evolution of
automotive mode of transport in the U.S.A. and developing country conurbations
and the derivation of an explanatory framework of the evolution of automotive modal
lock-in.
44
CHAPTER THREE: MODELLING AUTOMOTIVE MODAL LOCK-IN: THE U.S.A.
3.1 Introduction
Transnational comparisons of transport modal splits (Kenworthy and Laube, 1999a)
indicate the U.S.A. has the highest level of automobile usage of any major Western
economy. Around 96% of all trips are by the automotive mode (Rodrigue et al.,
2009) a figure which has not changed substantially since the 1970s. This path
dependent progression to locking in of the automotive transport mode in the U.S.A.
is the subject of a number of studies (Unruh, 2000; Geels, 2005). That this has
occurred despite the potential to furnish lower cost public transport modes, and
notwithstanding large economic, social and environmental externalities, is well
documented (Litman, 2002; Victoria Institute of Transport Studies, 2009).
As noted in Chapter Two, Section 2.3, a number of theorists have contributed to
providing an explanatory structure by the development of technological life-cycle
models (Koschatzky, 2000; Unruh, 2000; Walker, 2000; Berkhout, 2002; Cowan
and Jonard, 2003; Geels, 2005; Choi, 2008; and Storz, 2008). A number of these
studies have tended to focus on the early evolutionary stage of new technologies –
in which of primary interests is the nature of often fragile and complex incubatory
forces and niche development paths (Berkhout, 2002; Geels, 2005; Choi, 2008; and
Storz, 2008). Others who have examined the nature of the path dependent
evolution of whole technological and socio-economic systems (Rip and Kemp,
1998; Puffert, 2000; Urry, 2008) have generally portrayed the evolutionary process
as one of an ongoing somewhat disorderly process of interaction between market
actors and their market environment. In the following chapter an explanatory
framework is developed which is designed to identify sequential features which
distinguish particular stages in the progression of automotive modal lock-in in the
U.S.A. In doing so the role and interaction of market actors is used as a key tool to
define stages and thereby provide a more informative description of automotive
45
modal lock-in. It equally allows subsequent modelling of the nature and strength of
automotive modal lock-in which is set out in Chapters Five to Seven.
Section 3.2 of this chapter provides a description of stage 1 of automotive lock-in
the U.S.A. In this formative stage, a period of increasing returns evolving from the
dynamics of mass production is identified. The subsequent transformation of the
automobile into a transport mode, and the early stages of the formation of a socio-
economic regime are analysed. In Section 3.3 the characteristics of stage 2 of U.S.
automotive modal lock-in are described. The key identifying features are shown to
include the development of a path dependent growth process in which a number of
key positive feedback mechanisms are catalysed. Highlighted is the now important
role of the automotive socio-economic regime in expanding transport infrastructure
and in enhancing the role of positive feedback mechanisms in expanding market
demand for the automobile. Section 3.4 provides a summary of the findings and its
relevance to modelling of automotive lock-in in subsequent chapters.
3.2 Automotive modal lock-in stage 1: c1900-1920
Stage 1 is revealed as a period in which the IC automotive technology in the U.S.A.
transitions into a major transport mode and becomes a dominant feature of the
transport system. The IC engine automobile’s rapid domination is accompanied by
the effective elimination of competing steam and electric driven systems of private
transport. In this process mass production based positive feedback mechanism are
seen to be driving and accelerating the process of market domination. However in
describing the features of stage 1 of this explanatory framework no assumption
made about path dependence given the debatability of Unruh and others’ claims
that the IC engine was, at its commercial inception, competitively inferior and
therefore its growth to market domination was path dependent from its inception.
While in stage 1 the increasing returns observed may be characteristic of a path
dependent process, there is no assumption made in this regard. As David (2007)
has noted “….no necessary connection exists between conventionally defined
increasing returns and path dependence” (page 12). The IC engine’s technological
evolution in stage 1 can, rather, be seen as one of an arguably superior technology
gaining market dominance (see Figure 3.1) and for which the theory of dominant
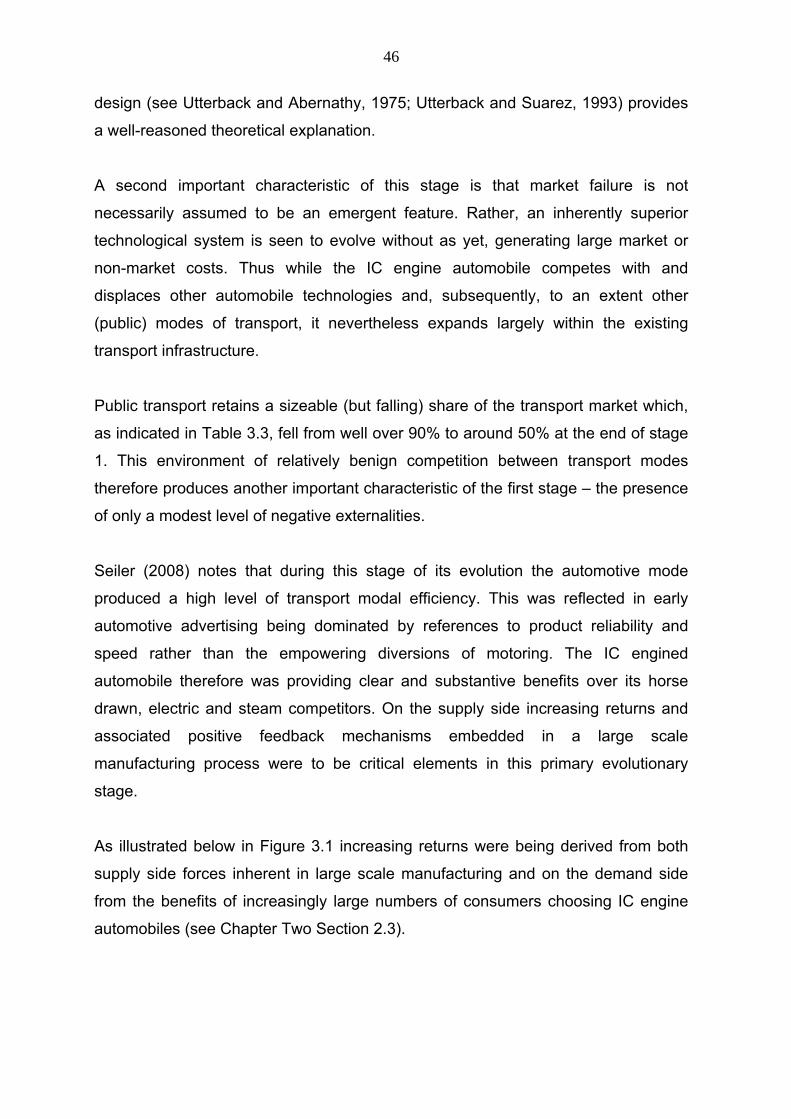
46
design (see Utterback and Abernathy, 1975; Utterback and Suarez, 1993) provides
a well-reasoned theoretical explanation.
A second important characteristic of this stage is that market failure is not
necessarily assumed to be an emergent feature. Rather, an inherently superior
technological system is seen to evolve without as yet, generating large market or
non-market costs. Thus while the IC engine automobile competes with and
displaces other automobile technologies and, subsequently, to an extent other
(public) modes of transport, it nevertheless expands largely within the existing
transport infrastructure.
Public transport retains a sizeable (but falling) share of the transport market which,
as indicated in Table 3.3, fell from well over 90% to around 50% at the end of stage
1. This environment of relatively benign competition between transport modes
therefore produces another important characteristic of the first stage – the presence
of only a modest level of negative externalities.
Seiler (2008) notes that during this stage of its evolution the automotive mode
produced a high level of transport modal efficiency. This was reflected in early
automotive advertising being dominated by references to product reliability and
speed rather than the empowering diversions of motoring. The IC engined
automobile therefore was providing clear and substantive benefits over its horse
drawn, electric and steam competitors. On the supply side increasing returns and
associated positive feedback mechanisms embedded in a large scale
manufacturing process were to be critical elements in this primary evolutionary
stage.
As illustrated below in Figure 3.1 increasing returns were being derived from both
supply side forces inherent in large scale manufacturing and on the demand side
from the benefits of increasingly large numbers of consumers choosing IC engine
automobiles (see Chapter Two Section 2.3).
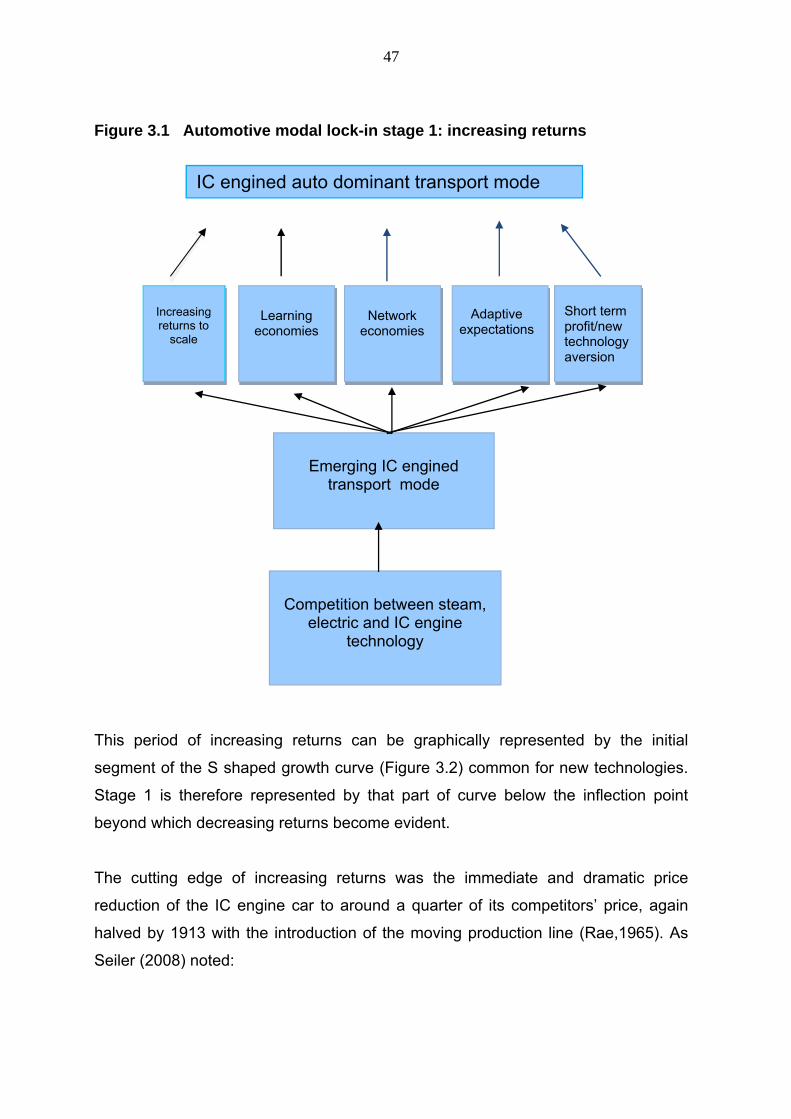
47
Figure 3.1 Automotive modal lock-in stage 1: increasing returns
This period of increasing returns can be graphically represented by the initial
segment of the S shaped growth curve (Figure 3.2) common for new technologies.
Stage 1 is therefore represented by that part of curve below the inflection point
beyond which decreasing returns become evident.
The cutting edge of increasing returns was the immediate and dramatic price
reduction of the IC engine car to around a quarter of its competitors’ price, again
halved by 1913 with the introduction of the moving production line (Rae,1965). As
Seiler (2008) noted:
Increasing returns to
scale
Competition between steam,
electric and IC engine technology
Emerging IC engined
transport mode
IC engined auto dominant transport mode
Learning
economies
Network
economies
Adaptive
expectations
Short term profit/new technology aversion
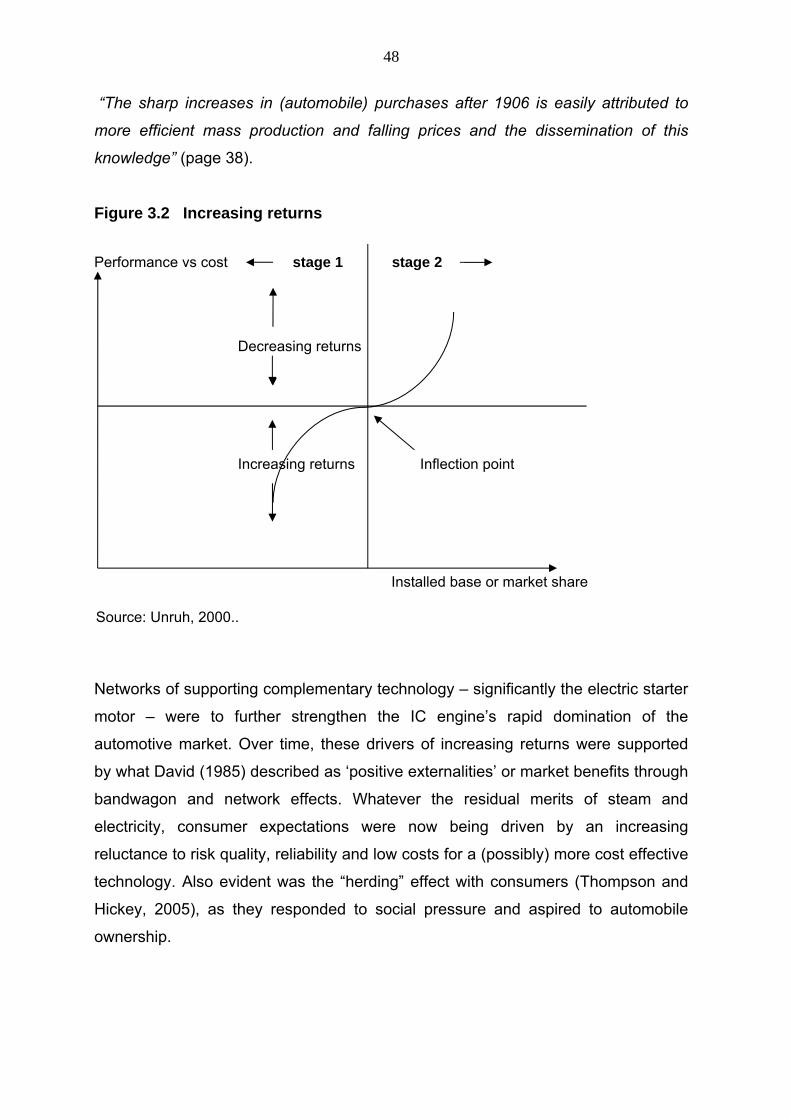
48
“The sharp increases in (automobile) purchases after 1906 is easily attributed to
more efficient mass production and falling prices and the dissemination of this
knowledge” (page 38).
Figure 3.2 Increasing returns
Performance vs cost stage 1 stage 2
Decreasing returns
Increasing returns Inflection point Installed base or market share
Source: Unruh, 2000..
Networks of supporting complementary technology – significantly the electric starter
motor – were to further strengthen the IC engine’s rapid domination of the
automotive market. Over time, these drivers of increasing returns were supported
by what David (1985) described as ‘positive externalities’ or market benefits through
bandwagon and network effects. Whatever the residual merits of steam and
electricity, consumer expectations were now being driven by an increasing
reluctance to risk quality, reliability and low costs for a (possibly) more cost effective
technology. Also evident was the “herding” effect with consumers (Thompson and
Hickey, 2005), as they responded to social pressure and aspired to automobile
ownership.
49
By 1920 the IC engined automobile had achieved overwhelming market superiority
as the dominant automotive propulsion system and had already increased public
transport’s market share to around 50% (see Figure 3.3).
Figure 3.3 Automotive modal lock-in the U.S.A.: 1970 to present
Source: Adopted from Rodrigue et al. (2009).
Sales in the USA had reached 9 million and steam and electric cars had all but
disappeared from the market. In this transitioning to a transport system the
expansion of the automotive mode was achieved without deliberate major reshaping
of consumer attitudes or substantial co-option of government support as illustrated
in Figure 3.4.
Described, therefore, is a market which is termed as being reasonably ‘symmetric’.
That is, it is defined as one in which market actors make generally rational decisions
having sufficient knowledge to do so. Negative externalities are limited and
therefore the market can be described as ergodic by acting as a rational resource
allocator which sustains a (Pareto) efficient equilibrium. There is, consequently, no
presumption in stage 1 that market failure will emerge. The automobile delivers
Stage 3 Stage 2 Stage 1
50
substantive positive utility to automotive consumers in terms of improved
transportation and therefore enjoys a high benefit cost ratio.
A further distinguishing characteristic of this initial stage of the automotive mode’s
evolution are consumers who are reasonably well informed in so far as the
automobile and the automotive mode’s indirect costs and negative externalities are
not yet large and their future increase not yet an inevitable outcome of private
automotive ownership. Foresight is, therefore, not yet a market defining issue.
In summary then there are a number of characteristics which are of key importance
in defining stage 1. The expansion of the automotive industry is shown to be
primarily driven by private sector market mechanisms. Henry Ford’s ground
breaking creation of mass production and dramatically lowering of the price of the
IC engine automobile was achieved largely without government assistance or
legislative support. Also evident in the history of the early expansion of the
automotive industry is the increasingly intense competition between manufacturers.
Thus the automotive socio-economic regime was in a formative stage in which
competitive tensions had not yet encouraged rapid evolution. Equally of importance
was the absence of critical issues which would produce a unifying influence.
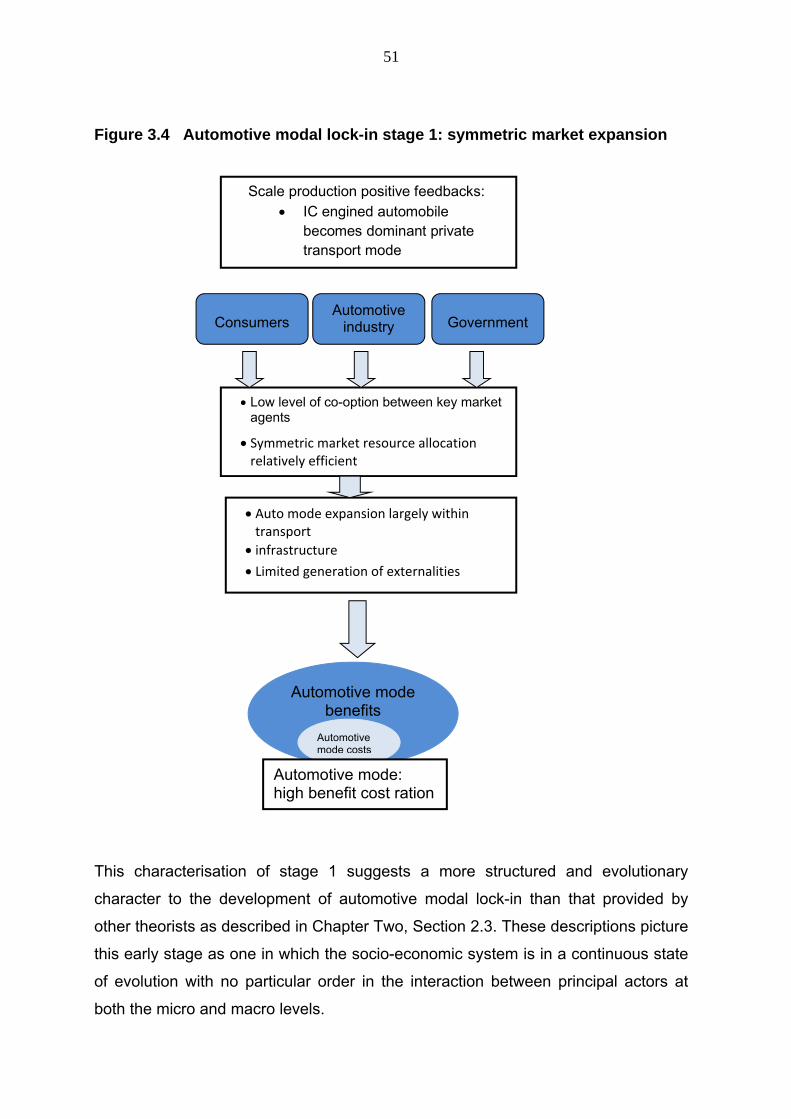
51
Figure 3.4 Automotive modal lock-in stage 1: symmetric market expansion
Consumers
This characterisation of stage 1 suggests a more structured and evolutionary
character to the development of automotive modal lock-in than that provided by
other theorists as described in Chapter Two, Section 2.3. These descriptions picture
this early stage as one in which the socio-economic system is in a continuous state
of evolution with no particular order in the interaction between principal actors at
both the micro and macro levels.
Scale production positive feedbacks: IC engined automobile
becomes dominant private transport mode
Low level of co-option between key market agents
Symmetric market resource allocation relatively efficient
Auto mode expansion largely within transport
infrastructure Limited generation of externalities
Automotive mode benefits
Automotive mode costs
Consumers Automotive
industry
Government
Automotive mode: high benefit cost ration
52
3.3 Automotive modal lock-in stage 2: C1921- 1970
The second stage of automotive modal lock-in’s evolution in the U.S.A. is
distinguished by a further rapid and sustained rise in per capita ownership of
automobiles and utilisation of the automotive mode – as illustrated in Figure 3.317–
but under a very different market environment. The transition from stage 1 to two is
marked by the lessening effect of positive feedback mechanisms derived from the
initiation of mass production. As illustrated in Figure 3.2, stage 2 occurs at the
inflection point where increasing returns are transitioning to decreasing returns as
new automotive manufacturers entering the market produce more intense
competition for market share (Rae, 1965). Equally, by the early 1920s past high
rates of market expansion were being constrained by vigorous competition for
space and resources between the automotive mode and the established rail based
transit systems in urban centres (Kay, 1997).
Negative externalities begin to emerge as existing transport infrastructure proves
inadequate to accommodate further expansion of the automotive mode. An
emerging automotive socio-economic regime now becomes sufficiently influential to
generate and heighten market positive feedback mechanisms. These serve to
expand the automobile’s share of the transport market and drive path dependent
growth leading to market failure.
As noted in Section 2.2, the triggering of path dependence is through a discrete
random or series of random event(s). However as David (2007) points out, once
initiated, path dependence produces a situation where “…at the putative ‘critical’
fork in the road, there was an open path which would have led to events quite
different from those that eventually transpired”.
The apparent emergence in stage 2 of such counterfactual differentiated outcomes
between the U.S.A. and a number of European countries has been noted in Chapter
Two, Section 2.6. Thus having initiated the introduction of the automotive mode of
transport at approximately the same time as the U.S.A., these countries produced
17 The steady increase in the automotive mode’s share is broken only by the sharp reversal during the Second World War which is clearly indicated in Figure 3.3 in the years 1940-1946.
53
substantially different levels of automotive utilisation. Gordon and Radford (1976)
and Kenworthy and Laub (1999a) have sought to explain these differentials by
pointing to the correlation between urban density and transport modal usage.
However such an explanation fails to account for the way in which urban densities
can themselves be a product of path dependency’s positive feedback mechanisms.
Both Kay (1997) and Seiler (2008) point out that in a number of conurbations in the
U.S.A. falling urban densities were being driven by the rising automotive modal
shares rather than the converse.
Similarly the emphasis placed by Kenworthy and Laub (1999a) and Dargay et al.
(2007) on rising income levels to explain the historically rapid rise in automotive
ownership in both developed and developing countries, can be shown to be only a
partial explanation of the level of automotive domination of transport systems in
urban conurbations.
The original contribution of the explanatory framework as developed in this chapter
– and specifically the second and third stages – is, therefore, its capacity to
describe the underlying causes of automotive lock-in. In particular it provides a way
of describing how key market actors – the automotive socio-economic regime,
government and consumers – are intimately involved in the path dependent process
engendered by positive feedback mechanisms. This interrelation ship is graphically
illustrated in Figure 3.5.
The key insight provided by this model is therefore its capacity to explain the
rapidity and extent of market failure which emerges in the U.S.A. Figure 3.5
illustrates how in stage 2 of U.S. automotive modal lock-in the automotive socio-
economic regime emerges as a substantive entity. With the expansion of the
density and strength of component couplings with consumers, government and auto
dependent industries, the regime acquires the capacity to increase the automotive
mode’s share of the transport market18. This maturing of the automotive industry
into a socio-economic regime is, therefore, a distinguishing transition from stage 1.
18 Unruh (2000) describes the capacity of what he calls the U.S. automotive techno-institutional complex (analogous to the automotive socio-economic complex described in this thesis) to protract the lock-in of the internal combustion engine through its ability to attract networks of suppliers
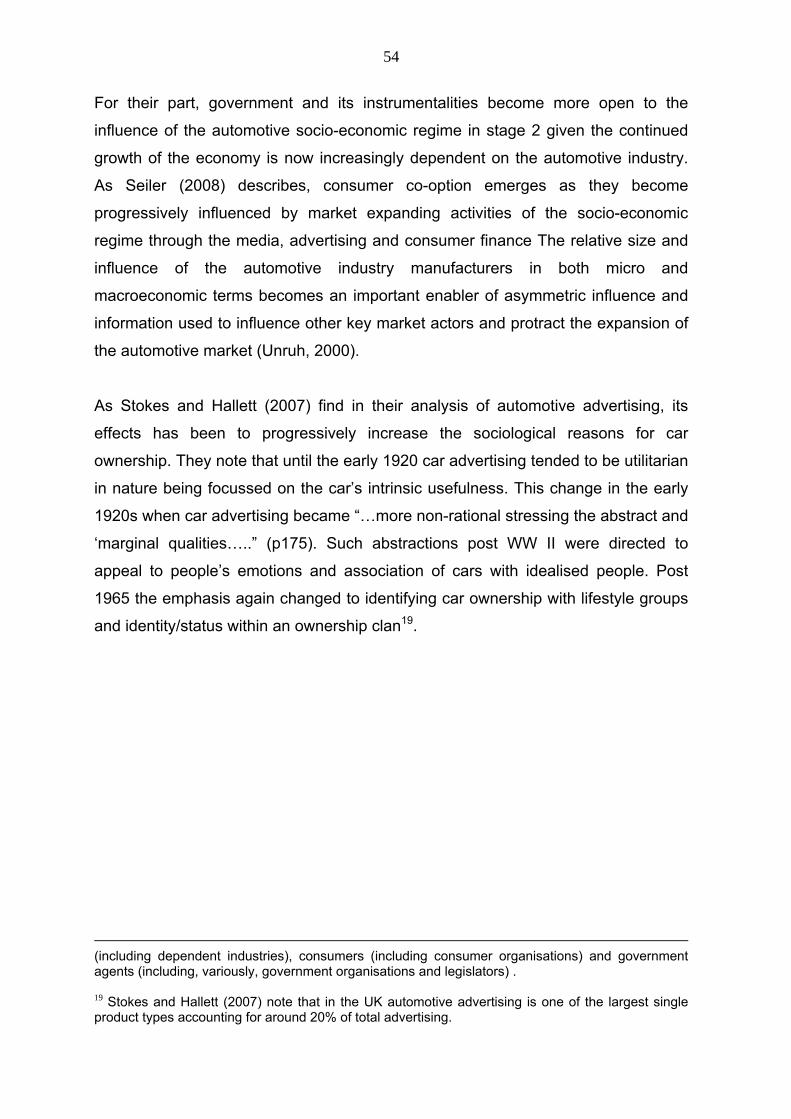
54
For their part, government and its instrumentalities become more open to the
influence of the automotive socio-economic regime in stage 2 given the continued
growth of the economy is now increasingly dependent on the automotive industry.
As Seiler (2008) describes, consumer co-option emerges as they become
progressively influenced by market expanding activities of the socio-economic
regime through the media, advertising and consumer finance The relative size and
influence of the automotive industry manufacturers in both micro and
macroeconomic terms becomes an important enabler of asymmetric influence and
information used to influence other key market actors and protract the expansion of
the automotive market (Unruh, 2000).
As Stokes and Hallett (2007) find in their analysis of automotive advertising, its
effects has been to progressively increase the sociological reasons for car
ownership. They note that until the early 1920 car advertising tended to be utilitarian
in nature being focussed on the car’s intrinsic usefulness. This change in the early
1920s when car advertising became “…more non-rational stressing the abstract and
‘marginal qualities…..” (p175). Such abstractions post WW II were directed to
appeal to people’s emotions and association of cars with idealised people. Post
1965 the emphasis again changed to identifying car ownership with lifestyle groups
and identity/status within an ownership clan19.
(including dependent industries), consumers (including consumer organisations) and government agents (including, variously, government organisations and legislators) . 19 Stokes and Hallett (2007) note that in the UK automotive advertising is one of the largest single product types accounting for around 20% of total advertising.
55
Figure 3.5 Automotive modal lock-in stage 2: asymmetric market reshaping
Automotive mode benefits
Automotive mode costs
Automotive socio-economic regime co-opts government and
consumer support for:
Subsidies support for auto infrastructure Non user pay for externalities
Rising direct costs: Rising indirect costs Roads, running costs, Pollution, accidents, Traffic management Congestion
Automotive mode: high benefit cost ratio
Consumers Automotive industry
Government
Asymmetric market: Path dependence/positive feedback heighten auto
demand while costs rise
56
The foregoing describes the evolution of what is termed an ‘asymmetric’ automotive
market in which non-market forces of influence play a particularly important role.
Thus the stage 2 explanatory framework illustrates the symbiotic interrelationships
of information failure, market asymmetries of influence and information which act as
the catalysts and reinforcers of path dependence and positive feedback
mechanisms. In this process an increasingly purposeful automotive socio-economic
regime accumulates sufficient influence to alter market parameters through
reshaping consumer and government attitudes.
A key insight of this explanatory framework of U.S. automotive lock-in in its second
stage is the importance of the use of influence in stimulating positive feedback feed
mechanisms which drive growth of the automotive mode and, ultimately, market
failure. Influence in the context of this study is defined so as to be in contrast to
information failure/incomplete information which is commonly referred to in the
literature on market failure (Stiglitz, 1986, 2002; Greenwald and Stiglitz, 1986).
Rather influence is defined as being intentional in its formulation and deliberate in
its effect while information failure is take to be unintentional in formulation and
effect20.
As applied to the model of automotive lock-in as a form of market failure, influence
refers to deliberate actions by the key market actors – consumers, the socio-
economic regimes and governments – in relation to each and which produces a
measure of the desired results.
The way in which socio-economic regimes, once formed, gain a capacity to
profitably interact with and influence government was well recognised by Unruh
(2000):
“Governments can be involved in the evolution of technological systems in many
ways. In market democracies, for example, constituencies can draw law makers in
by lobbying social networks for support and preferential treatment of an existing
20 This accords with the Concise Oxford English Dictionary’s definition of influence: “Actions of person or things on /upon another, perceptible only in its effects; ascendancy, moral power, over/with persons or things or person exercising power”.
57
technological system. Here governmental institutions interface with the professional
and social networks…In the early history of automobiles, for instance, U.S.A.
government officials were lobbied for road building projects by a large network of
institutions…(which) were successful in inducing government to undertake massive
road building projects that extended the technological system. The highway lobby is
still recognized today as one of the most powerful interest groups in U.S.A. fiscal
policy” (page 825).
The success of marketing and advertising by the automotive socio-economic regime
equally constitutes influence. This becomes asymmetric when consumer
organisations are shown to be incapable of providing counter-balancing information.
Thus the way in which the automotive socio-economic regime used asymmetries of
influence to drive key positive feedback mechanisms can be categorised as follows:
Government persuaded not to implement user-pay for negative
externalities
Government persuaded to expand and subsidise automotive road
infrastructure: intensification of suburban positive feedback
mechanism
Targeted and well-funded marketing and advertising to persuade
consumers to further expand adoption of automotive mode of
transport
In stage 2 achievement of the above outcomes equally reflected the weakness of
countervailing centres of influence. As described by Becker in his theory of
regulation (1983, 1986), while consumers are numerous they typically lack the
organisational capacity to accumulate, process and apply countervailing influence.
This weakness, Becker argues, can be sourced to the relatively modest rewards to
be gained by individual consumers. In contrast, industry socio-economic regimes
while comparatively small, tend to be highly focussed and well-funded – a product
of the large gains to be realised by its relatively few members.
58
The application of asymmetries of influence to drive of positive feedback
mechanisms helps explain the extent of market power these mechanisms exhibited
in driving path dependent growth of automotive modal look-in in stage 2. Arguably,
the most powerful positive feedback mechanism and enabler of automotive
transport mode expansion between the 1920s and 1970s was road infrastructure
(St Clair, 1986; Wachs and Crawford, 1992). Aspiring automotive owners were to
assume an increase in road construction would lead to alleviation from congestion
and the use of a far more rapid and independent form of travel. As noted, in reality
once more roads were built, positive feedback effects engendered higher car sales,
further congestion and yet greater demand for road construction. It was therefore no
coincidence that the U.S. highway lobby emerged to ensure an increasing
proportion of transport resources were funnelled to this end. This organisation was
to be one of the most enduring, powerful and successful of all industry lobbying
groups in the U.S.A. Its success in securing substantial and highly subsidized
funding provided the means for a doubling of surfaced roads in the USA to 1.4
million miles between 1930 and 1940 (Seely, 1987). Bus and to a greater extent rail
mass transit systems on the other hand were to receive only minimal funding.
Coincidentally, asymmetries of influence applied by the automotive socio-economic
regime were to accelerate positive feedback mechanisms which produced an on-
going reduction in the role of public transport. As Seiler (2008) notes:
“…at the beginning of the 1920s, transportation policy makers increasingly rejected
as outmoded or futile the expansion of long-distance passenger rail systems and
the revitalization of mass urban transit…the prevailing view was held that the people
had chosen the car, and the car was annexing urban space, which in turn needed to
be reconfigured – there was no alternative…Automotive industries and their political
familiars began in the 1930s to dismantle the rail infrastructure as they more fully
autombilized the American landscape and continued to develop the legal and
behaviour codes and supporting institutions of automobility.”
In this way pressure for higher road expenditure led to lower funding for public
transport, reducing public usage leading to further funding cuts.
59
Also evident in stage 2 is the way in which the effectiveness of asymmetric
influence found a natural partner in the pervasive presence of information failure. In
the U.S.A. this manifested itself in three key forms:
Bounded rationality: consumers had limited capacity to make complex
computations required to calculate the longer term costs of automotive
ownership.
Imperfect information: consumers and to a lesser extent government
were subject to acute information deficiencies regarding direct and
indirect costs – in particular long term and negative externality costs
generated by the automotive mode.
Consumer ‘irrationality’: consumer assumptions about the advantages
of the automotive mode of transport (e.g. freedom, prestige) were later
found to be misguided/illusory.
Litman (2009) in his cost benefit study of U.S. transport points out that the public’s
inability to assemble and take into account the wide range of market and non-
market costs and even direct fixed costs, led to the habitual overuse of the
automotive mode. As many of these costs were only realised in a later time frame,
the lack of consumer foresight was heightened and became a key element in
helping to catalyse positive feedback mechanisms. Litman observes that lack of
foresight is particularly evident in automotive users’ lack of appreciation of the
downstream need to fund road infrastructure. Motorists habitually used limited and
static benefit cost analysis and excluded most future market and non-market costs
of motor transport21. That reflected, in large part, the fact that actual costs – and in
particular indirect costs – were not well researched nor widely known.
21 As Litman (2009) notes: “If you ask people what it costs to drive they typically mention vehicle operating expenses, which average approximately 16¢ per mile for a typical automobile. Some may include vehicle ownership costs, which average about 27¢ per mile. A few may also mention travel time and crash risk. These, however, are only a portion of total costs. The full cost of driving includes these direct, internal costs, plus various indirect and external costs. Total estimated costs range from about $0.94 per vehicle mile for rural driving to $1.64 for urban-peak driving...External costs tend to be smaller, and so are
60
Thus, as Delucchi (2007) shows in his study, while up front highway construction
costs were generally substantially less than light or heavy rail, indirect costs –
including car parking, auto generated congestion – increased traffic generation over
time and the added cost of vehicle use. Cumulatively this turned a net saving in
transport costs into a sizeable deficit. Moreover, in funding the (near term) lower
cost option, reduced investment in public transport (despite a growing need and
demand) became part of the indirect costs of the automotive mode. This trend was
particularly evident as the automobile drove fundamental life style changes and, in
particular, the capacity for people to live and commute to and from suburbs outside
city centres22. Crucially, no such positive feedback mechanism existed to promote
mass rail transit. Government authorities typically responded to falling demand for
public transport in city centres by reducing investment thus ignoring the wider cost
benefits of public transport. As Kay (1997) described the process:
“The developer of a motorcar dependent real estate subdivision could secure a road
and city services free, paid for from public funds, whereas street railway owners had
to self-finance the tracks plus paving, snow shovelling and other city fees. In the
four years after the beginning of World War I, 137 electric railways and 900 miles of
track went bankrupt” (page 166).
In this way the symbiotic combination of information failure and asymmetries of
influence served as a powerful means of catalysing and reinforcing positive
feedback mechanisms and producing remarkably complete market domination by
the automotive transport mode in the U.S.A. As Figure 3.3 illustrates, from the
inception of mass production of the automobile in 1910 through to 1920, public
easy to overlook, but numerous, so their aggregate value tends to be significant. About half of transport costs are either external or internal-fixed, and therefore do not directly affect individual travel decisions. This represents underpricing, which results in economically excessive automobile travel (more vehicle travel than would occur in a more efficient market)” (page 15). 22 This trend was further stimulated by Roosevelt’s New Deal projects which encouraged rehousing of the poor from inner urban to automobile dependent outer suburban areas (Kay, 1997). Once begun, a strong feedback loop was created as people moved out of the now decaying city centres leading to yet further decay and flight. Similar feedbacks were operating in the financing of suburban road infrastructure which was, in part, being financed by gasoline taxes. As more roads were built, more taxes were gathered and yet more roads constructed.
61
transport’s share of the passenger market halved from 95% to 45%3 and halved
again to around 20% by the late 1930s. In the several decades following World War
II, when the power of the U.S. automotive socio-economic regime was at its peak,
public transport’s share of the market fell to around 5%4.
3.4 Automotive modal lock-in stage 3: C1971 – to present
Automotive modal lock-in as an example of path dependent growth and market
failure has been characterised by major theorists as a somewhat chaotic interaction
of market forces and market actors. This historical analysis of U.S. automotive
modal lock-in nevertheless produces a number of differentiating features which
indicates a definable third stage in its evolution.
A levelling off in automotive demand as the market approaches
saturation and public transport reaches an irreducible minimum.
A distinguishable reduction in the level of co-option of consumers by
the socio-economic regime as consumers become more aware of the
full direct and indirect short and long term costs of the private
automotive mode of transport.
The long term longevity of automotive modal lock-in becomes
increasingly dependent on co-option of government by the socio-
economic regime.
3 U.S. automotive registrations tripled to over 26 million between 1920 and the end of the 1930s, by which time more than half of all U.S. families owned a car and a fifth owned two (Seely,1987). 4 The Interstate Highways Bill enacted in 1956 provided for 90% Federal Government finance of the interstate road system 60% of which came from petrol taxes with the other 40% in the form of an automotive subsidy. President Eisenhower’s enactment of the Interstate Highway Bill directed US$50 billion annually into building freeways – but without corresponding funding of mass transit (Lewis, 1997). While President Eisenhower publicly used cold war national security to justify such a major expenditure, the bill had its origins in the lobbying efforts of the Detroit highway lobby group (Fink, 1988).
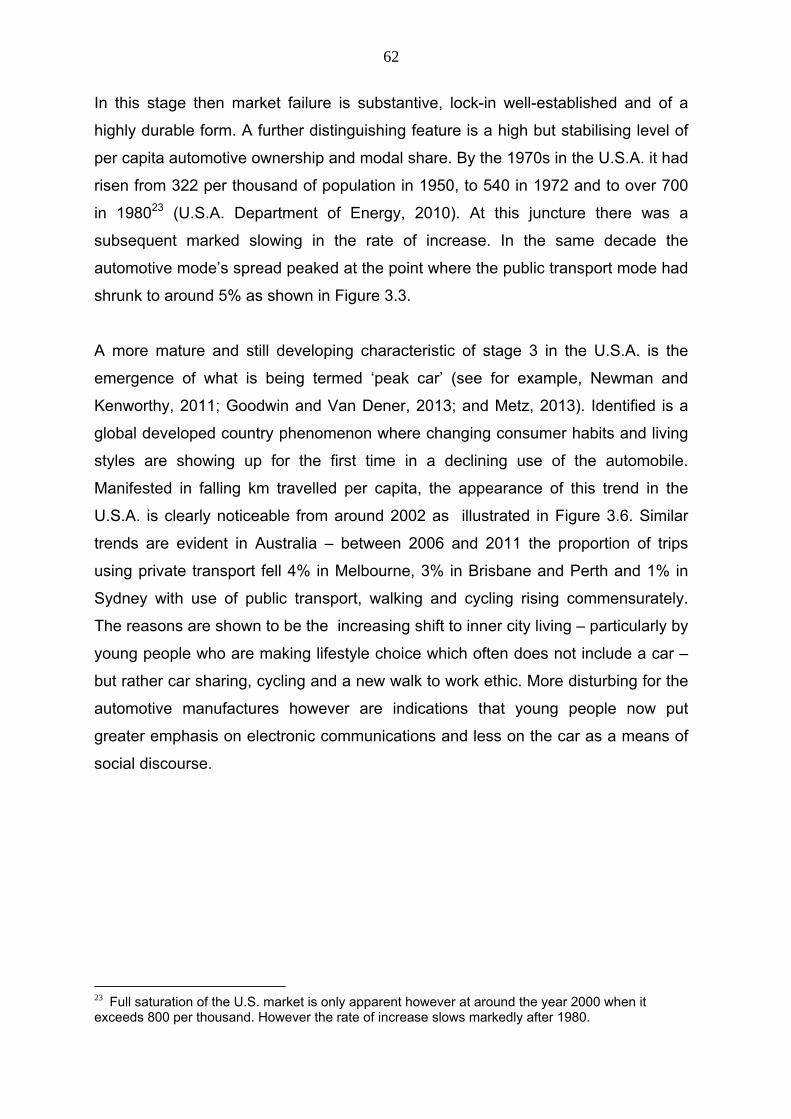
62
In this stage then market failure is substantive, lock-in well-established and of a
highly durable form. A further distinguishing feature is a high but stabilising level of
per capita automotive ownership and modal share. By the 1970s in the U.S.A. it had
risen from 322 per thousand of population in 1950, to 540 in 1972 and to over 700
in 198023 (U.S.A. Department of Energy, 2010). At this juncture there was a
subsequent marked slowing in the rate of increase. In the same decade the
automotive mode’s spread peaked at the point where the public transport mode had
shrunk to around 5% as shown in Figure 3.3.
A more mature and still developing characteristic of stage 3 in the U.S.A. is the
emergence of what is being termed ‘peak car’ (see for example, Newman and
Kenworthy, 2011; Goodwin and Van Dener, 2013; and Metz, 2013). Identified is a
global developed country phenomenon where changing consumer habits and living
styles are showing up for the first time in a declining use of the automobile.
Manifested in falling km travelled per capita, the appearance of this trend in the
U.S.A. is clearly noticeable from around 2002 as illustrated in Figure 3.6. Similar
trends are evident in Australia – between 2006 and 2011 the proportion of trips
using private transport fell 4% in Melbourne, 3% in Brisbane and Perth and 1% in
Sydney with use of public transport, walking and cycling rising commensurately.
The reasons are shown to be the increasing shift to inner city living – particularly by
young people who are making lifestyle choice which often does not include a car –
but rather car sharing, cycling and a new walk to work ethic. More disturbing for the
automotive manufactures however are indications that young people now put
greater emphasis on electronic communications and less on the car as a means of
social discourse.
23 Full saturation of the U.S. market is only apparent however at around the year 2000 when it exceeds 800 per thousand. However the rate of increase slows markedly after 1980.
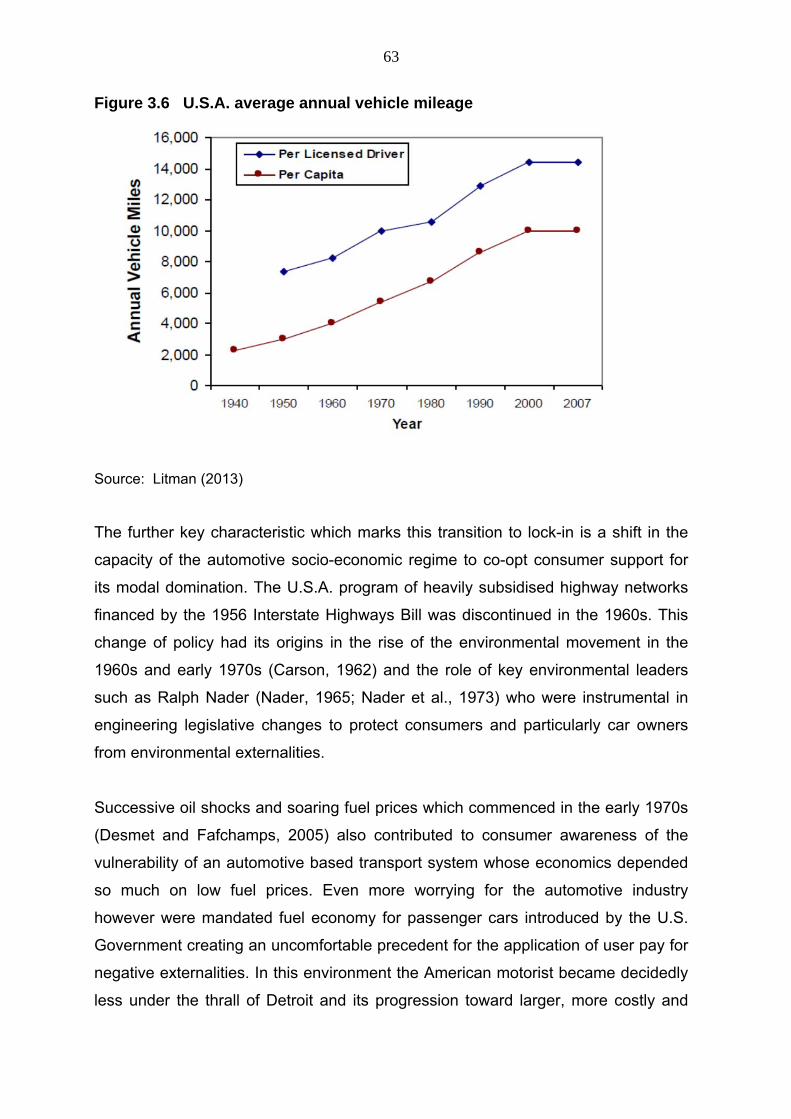
63
Figure 3.6 U.S.A. average annual vehicle mileage
Source: Litman (2013)
The further key characteristic which marks this transition to lock-in is a shift in the
capacity of the automotive socio-economic regime to co-opt consumer support for
its modal domination. The U.S.A. program of heavily subsidised highway networks
financed by the 1956 Interstate Highways Bill was discontinued in the 1960s. This
change of policy had its origins in the rise of the environmental movement in the
1960s and early 1970s (Carson, 1962) and the role of key environmental leaders
such as Ralph Nader (Nader, 1965; Nader et al., 1973) who were instrumental in
engineering legislative changes to protect consumers and particularly car owners
from environmental externalities.
Successive oil shocks and soaring fuel prices which commenced in the early 1970s
(Desmet and Fafchamps, 2005) also contributed to consumer awareness of the
vulnerability of an automotive based transport system whose economics depended
so much on low fuel prices. Even more worrying for the automotive industry
however were mandated fuel economy for passenger cars introduced by the U.S.
Government creating an uncomfortable precedent for the application of user pay for
negative externalities. In this environment the American motorist became decidedly
less under the thrall of Detroit and its progression toward larger, more costly and
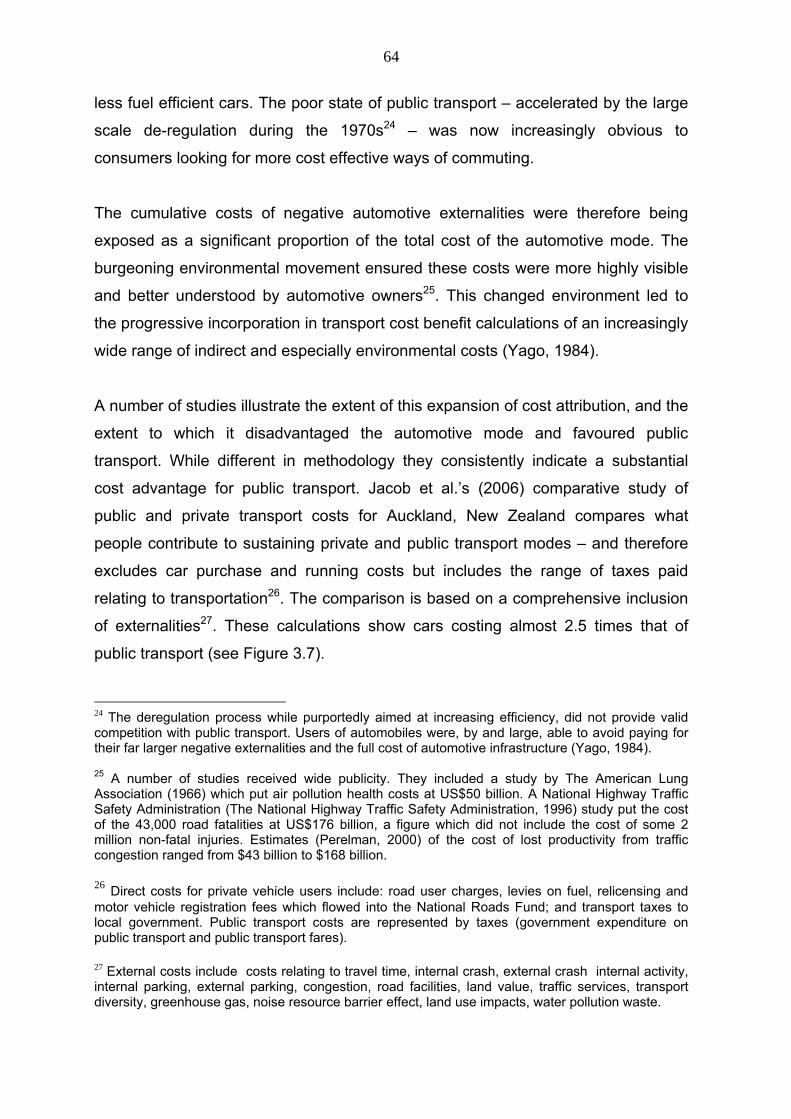
64
less fuel efficient cars. The poor state of public transport – accelerated by the large
scale de-regulation during the 1970s24 – was now increasingly obvious to
consumers looking for more cost effective ways of commuting.
The cumulative costs of negative automotive externalities were therefore being
exposed as a significant proportion of the total cost of the automotive mode. The
burgeoning environmental movement ensured these costs were more highly visible
and better understood by automotive owners25. This changed environment led to
the progressive incorporation in transport cost benefit calculations of an increasingly
wide range of indirect and especially environmental costs (Yago, 1984).
A number of studies illustrate the extent of this expansion of cost attribution, and the
extent to which it disadvantaged the automotive mode and favoured public
transport. While different in methodology they consistently indicate a substantial
cost advantage for public transport. Jacob et al.’s (2006) comparative study of
public and private transport costs for Auckland, New Zealand compares what
people contribute to sustaining private and public transport modes – and therefore
excludes car purchase and running costs but includes the range of taxes paid
relating to transportation26. The comparison is based on a comprehensive inclusion
of externalities27. These calculations show cars costing almost 2.5 times that of
public transport (see Figure 3.7).
24 The deregulation process while purportedly aimed at increasing efficiency, did not provide valid competition with public transport. Users of automobiles were, by and large, able to avoid paying for their far larger negative externalities and the full cost of automotive infrastructure (Yago, 1984). 25 A number of studies received wide publicity. They included a study by The American Lung Association (1966) which put air pollution health costs at US$50 billion. A National Highway Traffic Safety Administration (The National Highway Traffic Safety Administration, 1996) study put the cost of the 43,000 road fatalities at US$176 billion, a figure which did not include the cost of some 2 million non-fatal injuries. Estimates (Perelman, 2000) of the cost of lost productivity from traffic congestion ranged from $43 billion to $168 billion. 26 Direct costs for private vehicle users include: road user charges, levies on fuel, relicensing and motor vehicle registration fees which flowed into the National Roads Fund; and transport taxes to local government. Public transport costs are represented by taxes (government expenditure on public transport and public transport fares). 27 External costs include costs relating to travel time, internal crash, external crash internal activity, internal parking, external parking, congestion, road facilities, land value, traffic services, transport diversity, greenhouse gas, noise resource barrier effect, land use impacts, water pollution waste.
65
Figure 3.7 Comparative costs: cars and public transport per kilometre
Source: Jacob (2006).
A further range of studies carried out by Litman’s Victoria Transport Institute
(Litman, 2007) use a different set of cost parameters which include direct purchase
and running costs for cars and public transport. Litman estimated that for peak
urban transit, the level of indirect costs including subsidies for automobiles was
around 0.46 cents per passenger mile compared to around 30 cents for diesel
buses. Once total direct and indirect costs were included, the cost ratios were 1.5
and 1.1 respectively8. While Litman’s U.S. based estimates show a less marked
reduction in costs for public transport than Jacob’s, a key difference is the former’s
low average occupancy rate for buses (around 30%) in estimating the cost per
passenger per mile. Jacob’s calculations for Auckland put the average bus
occupancy rate twice that of U.S. estimates used by Litman. Thus given the excess
capacity of public transport revealed in Litman’s calculations he is able to show that
the marginal cost savings of shifting to public transport is considerable as indicated
by Table 3.1.
8 Litman (2007) also estimates in a 2007 study that total annual direct and indirect U.S. road transport costs would total as much as $3.4 trillion or 25% of U.S. GDP.
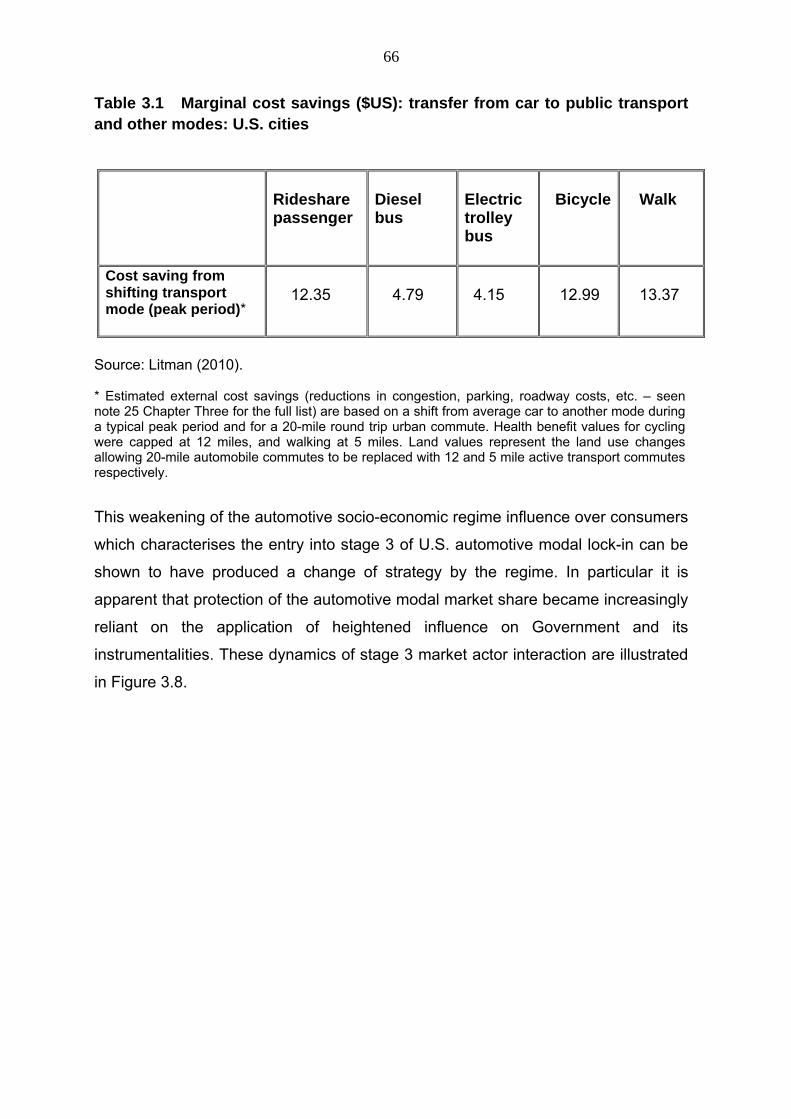
66
Table 3.1 Marginal cost savings ($US): transfer from car to public transport and other modes: U.S. cities
Source: Litman (2010). * Estimated external cost savings (reductions in congestion, parking, roadway costs, etc. – seen note 25 Chapter Three for the full list) are based on a shift from average car to another mode during a typical peak period and for a 20-mile round trip urban commute. Health benefit values for cycling were capped at 12 miles, and walking at 5 miles. Land values represent the land use changes allowing 20-mile automobile commutes to be replaced with 12 and 5 mile active transport commutes respectively.
This weakening of the automotive socio-economic regime influence over consumers
which characterises the entry into stage 3 of U.S. automotive modal lock-in can be
shown to have produced a change of strategy by the regime. In particular it is
apparent that protection of the automotive modal market share became increasingly
reliant on the application of heightened influence on Government and its
instrumentalities. These dynamics of stage 3 market actor interaction are illustrated
in Figure 3.8.
Rideshare passenger
Diesel bus
Electric trolley bus
Bicycle
Walk
Cost saving from shifting transport mode (peak period)*
12.35
4.79
4.15
12.99
13.37
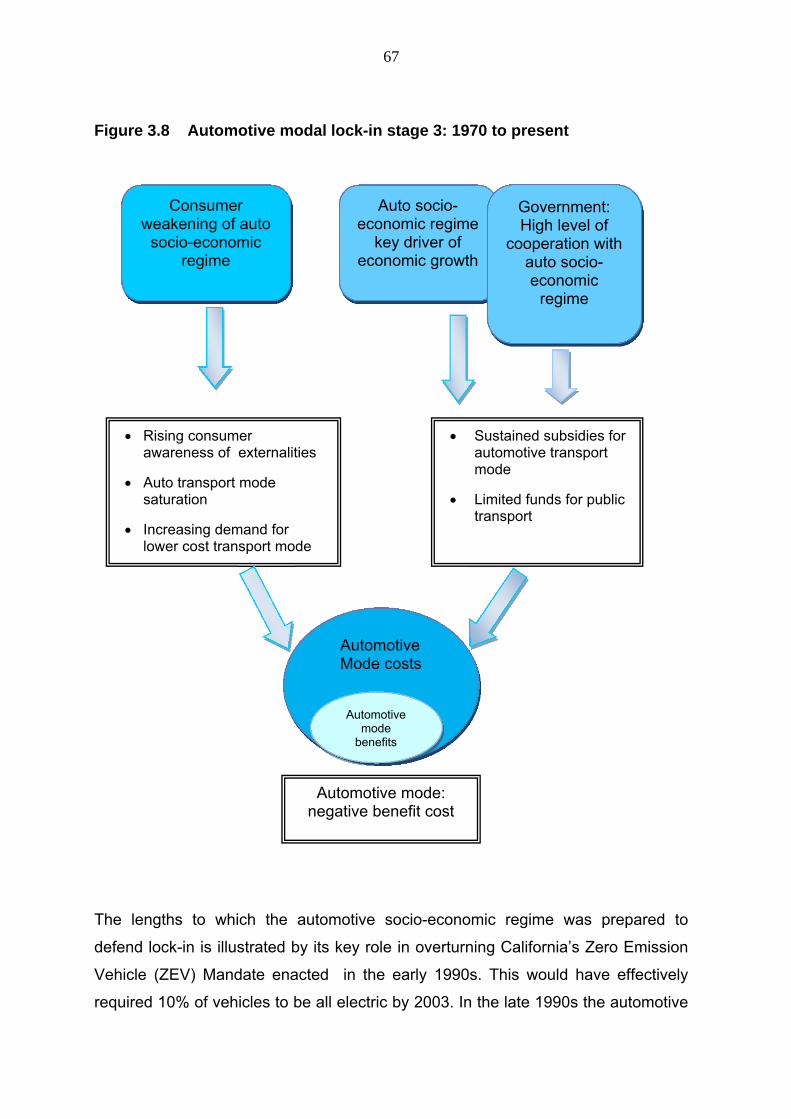
67
Figure 3.8 Automotive modal lock-in stage 3: 1970 to present
The lengths to which the automotive socio-economic regime was prepared to
defend lock-in is illustrated by its key role in overturning California’s Zero Emission
Vehicle (ZEV) Mandate enacted in the early 1990s. This would have effectively
required 10% of vehicles to be all electric by 2003. In the late 1990s the automotive
Consumer weakening of auto
socio-economic regime
Auto socio- economic regime
key driver of economic growth
Government: High level of
cooperation with auto socio-economic
regime
Rising consumer awareness of externalities
Auto transport mode saturation
Increasing demand for lower cost transport mode
Sustained subsidies for automotive transport mode
Limited funds for public transport
Automotive Mode costs
Automotive mode
benefits
Automotive mode: negative benefit cost
68
socio-economic regime was to be equally adroit as a key actor in the nullifying of a
Californian law which would have mandated a 30% reduction of automotive CO2 by
2016.28
The increasing reliance of the automotive socio-economic regime on government
co-option to sustain its modal dominance is borne out by a number of studies
tracing the sharp rise in lobbying of Government by commercial interests in the
U.S.A. since the mid 1980s (McCright et al., 2003; Reich, 2008). In doing so they
show a fundamental shift in the templates of influence between key market actors.
Expenditure by lobbyists rose from around $US100 million in the mid-1980s to
around $US2.2 billion in 2005 (Reich 2008). Over the same period the number of
registered (overwhelmingly corporate) Washington lobbyists increased from around
6000 to almost 33,000. Reich points out that the accretion of business sector
influence was matched by a corresponding marked deterioration in the influence
aggregation capacity of consumers and labour within the U.S. economy.
A particularly noticeable increase in government lobbying by oil and automotive
industries is detailed in studies by McCright et al., 2003; Black, 2006; and Oreskes
and Conway, 2010. This became evident in the run up to the Kyoto climate change
negotiations, when oil and automotive companies launched a concerted campaign
to influence the U.S. Congress, members of the Administration and the public.
McCright et al. (2003) describe how a network of 43 advocacy think tanks was
assembled to undermine the credentials of global warming science by launching a
campaign claiming that climate change science was flawed and unreliable. A 1996
U.S. survey (Union of Concerned Scientists, 2007) noted that between 1998 and
2005, ExxonMobil funnelled nearly US$16 million into the think tanks. Between
2003 and 2006 OPEC and its members reportedly spent over US$13 million on
lobbying and the oil companies some $US59 million (Black, 2006).
28 In 2005 nine global manufacturers sued the Californian government in an attempt to block implementation of the law. While the lawsuit was dismissed, concerted lobbying of the presidential executive arm of the U.S. Government preceded the administration's Environmental Pollution Authority announcement in December 2007 that California would not be granted an exemption from the act to allow it to regulate emissions. The quashing of the ZEV mandate and CO2 reduction legislation effectively ensured that some of the substantial negative externalities attached to the IC engine automotive mode of transport would not be internalised.
69
The intensity of direct corporate lobbying of government on climate change by oil
dependent corporations was further underlined by estimates by The Center for
Public Integrity (Lavelle and Pell, 2009) which put the number of businesses and
groups lobbying on climate legislation in the lead up to the Kyoto protocol
negotiations at around 1,160 employing 2,780 people, five for every member of
Congress. It further estimated that this represented a 400% increase compared to
six years earlier when lawmakers first considered a nationwide GHG reduction
program.
The product of this shaping of political attitudes was to be clearly evidenced in the
U.S. Senate’s unanimous vote 93-0 to not sign the Kyoto protocol in 1997. Public
opinion polls also provided an indication of the success of the corporate public
campaign on climate change. Between 2005 and 2007 polls put those who were
“very concerned” by climate change at between 25% and 35% (Scruggs and
Benegal 2012), a level half that of European surveys.
The exceptional stability of the new equilibrium generated by the two previous
stages of path dependent evolution of automotive modal lock-in can therefore be
seen as a by-product of this concentration of influence by the automotive socio-
economic regime. This stability is also reflected in the fact that the percentage of
total trips made by the automobile has changed little in the U.S.A. over the past 40
years as shown in Figures 3.3. Moreover, international comparisons (Kenworthy
and Laube, 1999; Dargay et al., 2007) indicate a sustained gap in the cost of
transport in the U.S. automotive based transport system. The durability of these
differentials – in the form of a non-Pareto efficient equilibrium – underline both the
path dependent nature of U.S. automotive modal lock-in, its underpinnings of
positive feedback mechanisms (highly resistant to reversal) and the associated use
of substantial and concentrated influence on the political process.
The particularly close ties in the U.S.A. between the automotive socio-economic
regime and government helps to explain why, having started the IC automotive era
from roughly the same point at the beginning of the 19th century, the U.S.A.’s
Western economic counterparts in Europe developed markedly different
public/private modal mixes and transport system costs.
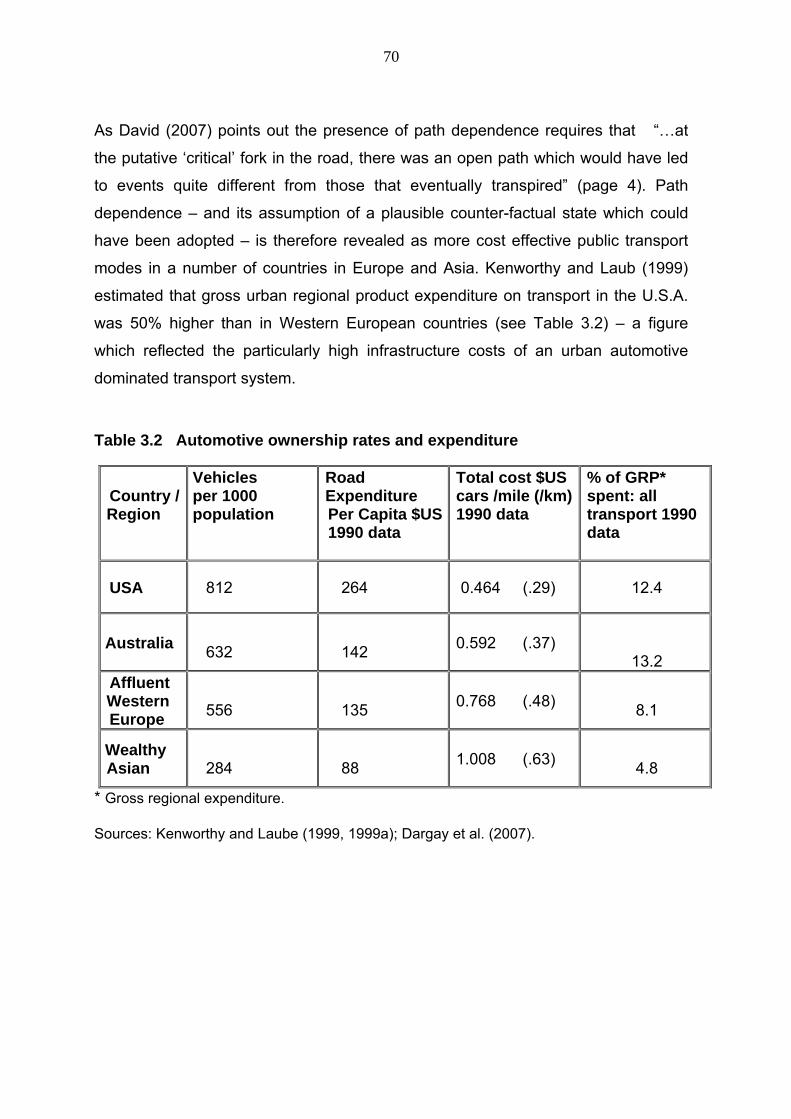
70
As David (2007) points out the presence of path dependence requires that “…at
the putative ‘critical’ fork in the road, there was an open path which would have led
to events quite different from those that eventually transpired” (page 4). Path
dependence – and its assumption of a plausible counter-factual state which could
have been adopted – is therefore revealed as more cost effective public transport
modes in a number of countries in Europe and Asia. Kenworthy and Laub (1999)
estimated that gross urban regional product expenditure on transport in the U.S.A.
was 50% higher than in Western European countries (see Table 3.2) – a figure
which reflected the particularly high infrastructure costs of an urban automotive
dominated transport system.
Table 3.2 Automotive ownership rates and expenditure
Country / Region
Vehicles per 1000 population
Road Expenditure
Per Capita $US 1990 data
Total cost $US cars /mile (/km) 1990 data
% of GRP* spent: all transport 1990 data
USA 812 264 0.464 (.29) 12.4
Australia 632
142
0.592 (.37)
13.2
Affluent Western
Europe
556
135
0.768 (.48) 8.1
Wealthy Asian
284
88
1.008 (.63)
4.8
* Gross regional expenditure. Sources: Kenworthy and Laube (1999, 1999a); Dargay et al. (2007).
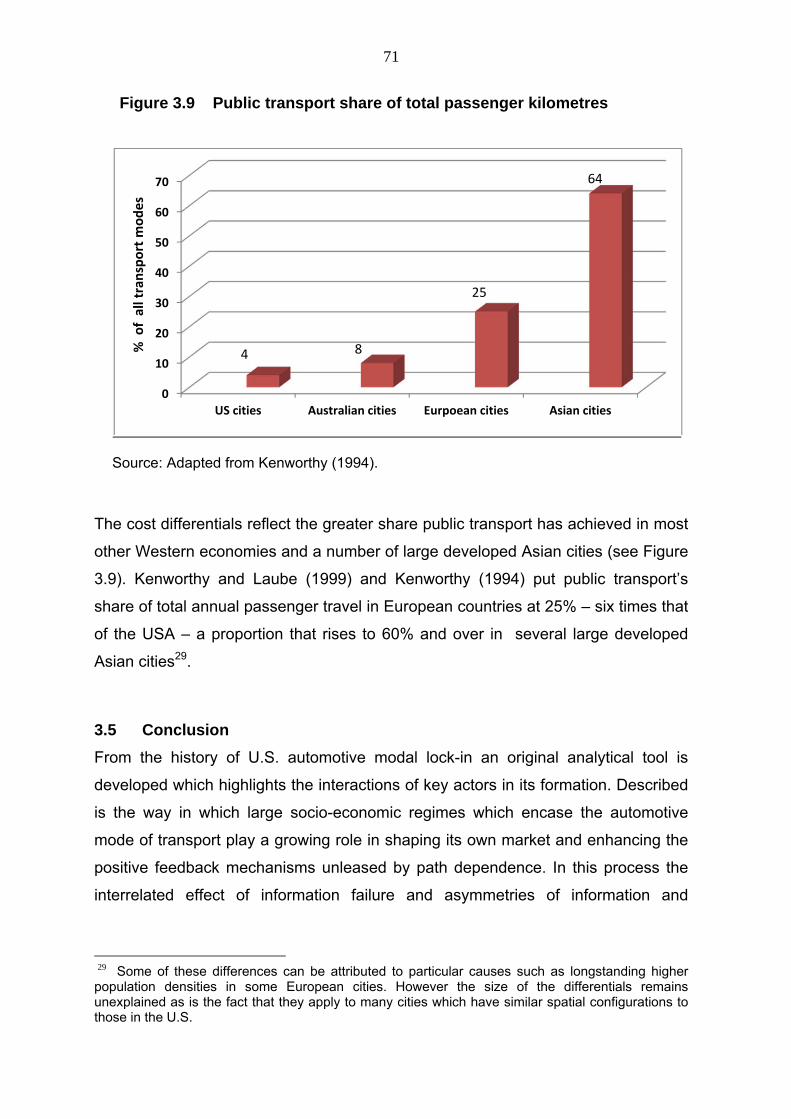
71
Figure 3.9 Public transport share of total passenger kilometres
Source: Adapted from Kenworthy (1994).
The cost differentials reflect the greater share public transport has achieved in most
other Western economies and a number of large developed Asian cities (see Figure
3.9). Kenworthy and Laube (1999) and Kenworthy (1994) put public transport’s
share of total annual passenger travel in European countries at 25% – six times that
of the USA – a proportion that rises to 60% and over in several large developed
Asian cities29.
3.5 Conclusion
From the history of U.S. automotive modal lock-in an original analytical tool is
developed which highlights the interactions of key actors in its formation. Described
is the way in which large socio-economic regimes which encase the automotive
mode of transport play a growing role in shaping its own market and enhancing the
positive feedback mechanisms unleased by path dependence. In this process the
interrelated effect of information failure and asymmetries of information and
29 Some of these differences can be attributed to particular causes such as longstanding higher population densities in some European cities. However the size of the differentials remains unexplained as is the fact that they apply to many cities which have similar spatial configurations to those in the U.S.
0
10
20
30
40
50
60
70
US cities Australian cities Eurpoean cities Asian cities
%of all tran
sport m
odes
4 8
25
64
72
influence is shown to reinforce the path dependent process and accelerate the
onset of market failure and lock-in in the third stage.
In this examination of the role of influence through the lobbying of the automotive
socio-economic complex some theoretical conclusions can be drawn. Becker (1983,
1986) Stigler (1971) and Peltzman (1976) theorise that the outcome of the
application of interest group influence on government regulation is likely to be
welfare improving given maximum gains are derived from the larger ‘dead weight’
losses within failed markets. Thus success among competing interest groups (which
share a finite quantum of influence) will lie with those who have most to gain and
who will therefore exert greater pressure.
However this claimed resource rationalising bias of influence exerted through lobby
groups is shown not to apply to the U.S. transport market notwithstanding the
considerable welfare gains on offer. That the relative efficiency of interest groups
also can play an important role is clearly important – a factor which the Becker and
the Stigler/Peltzman models give some recognition to and in particular through their
observation that large diffuse interest groups, typically consumers, suffer from
inherent organisational and resources weaknesses. Thus even where consumers
could appreciate the benefits of reversing automotive modal lock-in, the capacity to
aggregate these needs has remained limited in the absence of viable alternatives
being offered by government. That absence in turn reflects the enduring effect of
market asymmetries of information and influence on Government and in particular
that which informs it of the continuing critical importance of the automotive industry
to government in terms of economic growth and employment generation.
In Chapter Four the three stage theoretical framework derived from the
development of automotive modal lock-in in the U.S.A. is used to examine the
extent to which there is differentiation in the evolution of transport modal lock-in as it
has evolved in a developing country conurbation. Validation of the explanatory
framework’s characterisation of stage 3 in a developing country conurbation and of
the nature of automotive modal lock-in described, is then tested in empirical
modelling set out in Chapters Five to Seven.
73
CHAPTER FOUR: MODELLING AUTOMOTIVE MODAL LOCK-IN: DEVELOPING COUNTRIES
4.1 Introduction
This chapter develops an explanatory framework of automotive modal lock-in’s30
evolution in developing and formerly developing country conurbations. A similar
methodology is used to that employed in the study of U.S. automotive modal lock-in
in Chapter Three. This historical analysis is used to contribute to a more dynamic
model of evolution and thereby provide better insights into the nature, strength and
reversibility of automotive lock-in in developing country conurbations which still have
emerging transport infrastructures.
Studies are made of the automotive mode’s emergence in Jakarta Indonesia, Seoul
ROK, Beijing China, Delhi India, and Kuala Lumpur Malaysia. A more detailed
analysis is made of the evolution of Jakarta’s transport system. This provides
collaborative data for the empirical surveys of Jakarta commuters the methodology
and results for which are set out in Chapters Six and Seven.
Section 4.2 provides an overview of the development of transport modal lock-in in
developing countries. The role of key market actors in this process is described in
Section 4.3 drawing on the staged analysis set out in Chapter Three. Section 4.4
describes the first stage of transport modal lock-in evolution in developing countries.
Sections 4.4.1, 4.4.2, 4.4.3, and 4.4.4 outline the evolution of stage 1 of transport
modal lock-in in a number of developing and formerly developing country
conurbations – Seoul, Beijing, Delhi, and Kuala Lumpur. The first phase of transport
modal lock-in in Jakarta Indonesia is analysed in Section 4.4.5 indicating its
commencement in the early 1980s with the creation of a substantive domestic
automotive industry based on Japanese investment and technology. Section 4.5
identifies the emergence of the second stage of developing country transport modal
30 The term ‘automotive modal lock-in’ is used here to describe the widespread private use of both automobiles and motorcycles in transport systems of developing countries.
74
lock-in. Sections 4.5.1, 4.5.2, and 4.5.3 provide the historical sequencing of stage 2
transport modal lock-in in Seoul, Beijing, and Kuala Lumpur. Delhi is shown not to
have reached stage 2. The entry of the Jakarta conurbation into stage 2 in the early
2000s is described in Section 4.5.4, a point at which there is a sustained rise in
automotive sales and a pronounced drop in the public/private transport usage ratio.
Highlighted is the pressure for substantive expansion of the road network and very
low expenditure on public transport. Section 4.6 describes evolutionary markers of
developing country transport modal lock-in in stage 3. Section 4.6.3 analyses the
transition to this stage in the Kuala Lumpur conurbation. The process of reversal of
lock-in in the Seoul conurbation is discussed in Section 4.6.1 while the initiation of
reversal in Beijing is described in Section 4.6.2. The transition to the third stage of
full transport lock-in in the Jakarta conurbation is set out in Section 4.6.4. A still
minimal public transport infrastructure is revealed (accounting for only around 1/3 of
passenger trips) as are high externality costs in the form of congestion, pollution
and social costs, and rising public awareness of their effects. Section 4.7 concludes
Chapter Four.
4.2 Automotive modal lock-in: incidence in developing countries
In his 2006 paper Unruh argues that carbon lock-in as it has developed in Western
developed economies is in the process of being ‘exported’ to developing countries
via the conveyor belts of international trade and investment flows. He notes that
investors are change averse given they typically deliver – as in the case of
automotive manufacturing and power stations (Nakicenovic, 1996) – complete
packages of capital, expertise, skilled labour and finance based on their profitable
existing carbon based technology. In this way Unruh (2006) observes that:
“…carbon lock-in may become globalised and large developing countries, if they
are successful at rapid industrialisation, will become “carbon copies” of their
industrialised neighbours” (page 1189).
Although Unruh’s focus is on the lock-in of the IC engine technology and
subsequently the development of the carbon economy it spawned, the process well
describes how the growth of the private automotive and motorcycle modes is being
75
catalysed in developing country conurbations by externally sourced investment in
automotive manufacturing. The need for multi-national automotive companies to
seek out low cost profitable offshore manufacturing (Nag et al., 2007) is matched by
developing country governments which see automotive manufacturing as a
necessary ingredient of accelerated economic growth (Gallagher, 2004).
Developing country governments have therefore shown themselves prone to
concentrate scarce resources on expanding automotive production and usage (and
therefore economic growth) providing only minimal and inadequate funding for
public transport systems (Foxon, 2002).
Unruh (2000) also observes that investing automotive companies have been prone
to reaping high returns from already amortised and dated automotive technology
taking advantage of the typically lax regulatory regimes31 in developing countries.
The rapid generation of environmental negative externalities has therefore
commonly been a by-product. Thus where regulations governing fuel economy and
environmental pollution have been lax, particularly in the early stages of accelerated
growth, high levels of pollution have been a by-product.32
4.3 Developing country automotive modal lock-in: the roles of automotive
socio-economic regimes, governments and consumers
As noted, automotive industries33 have been a crucial ingredient of in the early
stages of economic takeoff. In countries such as Japan and Korea there was a high
concentration of economic power within a small number of very large companies
(variously called Zaibatsus in Japan and Chaebols in the ROK) key members of
which were automotive manufacturers. Even where such concentrations have not
been as marked – e.g. Indonesia, China, Thailand and Malaysia – automotive
31 A number of studies show that without strong incentives or regulatory constraints, multinational investors have been unwilling to introduce low carbon technology (Ahman, 2004; Angel and Rock, 2007) and resist technological leapfrogging (Perkins, 2003; Chen, 2004). 32 New automobiles sold in the Indonesian market at the time of writing required only EU stage 2 pollution control equipment compared to the stage 5 now operating in the EU and which reduces pollutants by a factor of between 2 and 10 compared to stage 2. 33 The use of the term ‘automotive industry’ in this chapter refers to the manufacture of both automobiles and motorcycles.
76
manufactures have tended to dominate the manufacturing sector particularly at the
early stages of economic take-off.
Given the heavy reliance on foreign investment in establishing automotive
industries, a symbiotic relationship emerged between the international automotive
industry and developing country governments in Asia (Yang, 1995). In the less
transparent environment of emerging systems of governance in developing
countries automotive socio-economic regimes have therefore rapidly developed
close ties with and exerted considerable influence over governments.
A measure of the extent of these interlocking interests and its effect on policy
formation (which by their nature are informal and therefore difficult to quantify), is
provided by the preponderance of high tariff levels, investment incentives and fuel
subsidies which have been typically provided by governments to catalyse the
growth of the automotive and motorcycle mode of transport in developing countries.
Equally, the expansion of high cost urban road infrastructure has represented a
further form of subsidisation and, via positive feedback mechanisms, has strongly
stimulated higher automotive and motorcycle usage (Hook and Replogle, 1995;
Ingram and Liu, 1999; Anas et al., 2009). Through these means, private modes of
transport in developing countries have attracted a disproportionate share of
resources when compared to investment in public transport modes. As noted in
Chapter Two, the cumulative effect of these subsidies have been a key catalyst of
positive feedback mechanisms and path dependent growth leading to market failure
and, ultimately, lock-in.
Governments have been willing to provide direct and indirect automotive subsidies
as part of a wider strategy to generate growth through a more sophisticated
manufacturing base (Yang, 1995). This has occurred notwithstanding the clearly
evident track record of other (then) developing economies such as Japan and, later,
Korea and Malaysia which were subject to very high social and economic costs as a
result of submitting to unfettered rapid growth of the automotive transport mode.
Consumers play a similarly important role in the development of automotive modal
lock-in in developing countries. As noted in Chapter Three, the studies by Dargay et
77
al. (2007) and Delucchi (2007) show how sharply demand increases at critical
income thresholds. Represented here in the early stages of growth of the private
automotive mode is the aspirational nature of consumer expectations which see
automobiles as a rite of passage to higher standards of living. Consumers are
shown to be either unaware or uninterested in the downstream large negative
externalities which their collective choice of the automotive mode entails. Dargay et
al. (2007) note that demand for automobiles generally increases twice as fast as per
capita income when it lies between $US3000 and $US10,000. Also evident is the
way in which aspirational demand for automobiles and motorcycles is enhanced by
governments which reduce their cost of purchase through direct and indirect
subsidies. Kenworthy and Laube (1999a) and Dargay et al. (2007) have highlighted
the correlation between high automotive ownership levels, low automotive driving
costs and the high direct and indirect costs of the automotive mode of transport (see
Table 3.7). Other studies have highlighted the correlation between population
densities and the level of automobile ownership (Gordon and Radford, 1976;
Kenworthy and Laub, 2000).
These factors help to explain why, at a relatively early stage of a country’s
industrialisation, there has been such an exceptionally strong growth in per capita
ownership of automobiles. However as noted in Chapter Two Section 7, the
literature is less adequate in explaining differences in demand elasticities for the
automobile over time. As well, the correlation between urban density and per capita
automotive ownership says little about causality. While in the case of cities such as
Hong Kong high density may directly produce low per capita private automotive
ownership this may not be the case for other conurbations. Indeed, as noted, where
path dependence and positive feedback mechanisms are driving the growth of the
automotive mode it becomes the cause not the effect of low urban densities.
Equally the literature does not well explain why, for most Asian conurbations, the
automotive mode has repeatedly expanded well beyond a cost effective level. As
Figure 4.2 illustrates such costs are considerably higher than for developed country
conurbations as a percentage of regional GDP. The inclusion of path dependent
growth – and its key feature of positive feedback mechanisms – as a central feature
of the evolution of automotive modal lock-in therefore provides a means of
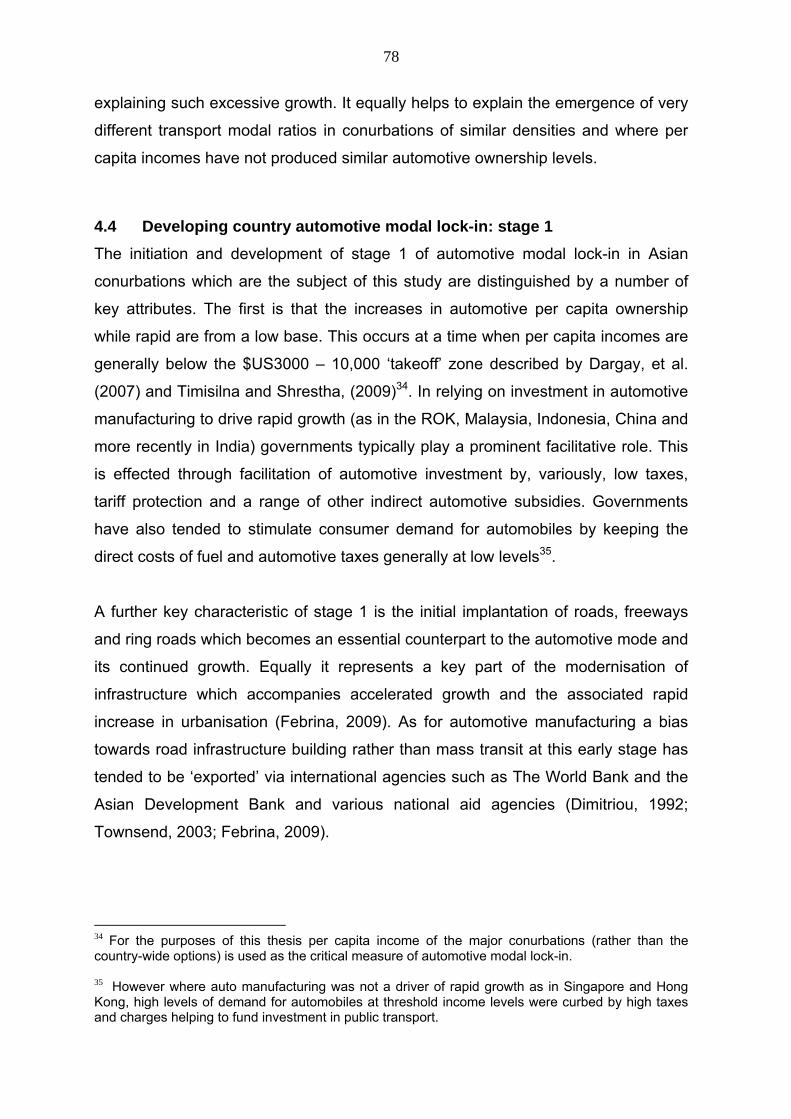
78
explaining such excessive growth. It equally helps to explain the emergence of very
different transport modal ratios in conurbations of similar densities and where per
capita incomes have not produced similar automotive ownership levels.
4.4 Developing country automotive modal lock-in: stage 1
The initiation and development of stage 1 of automotive modal lock-in in Asian
conurbations which are the subject of this study are distinguished by a number of
key attributes. The first is that the increases in automotive per capita ownership
while rapid are from a low base. This occurs at a time when per capita incomes are
generally below the $US3000 – 10,000 ‘takeoff’ zone described by Dargay, et al.
(2007) and Timisilna and Shrestha, (2009)34. In relying on investment in automotive
manufacturing to drive rapid growth (as in the ROK, Malaysia, Indonesia, China and
more recently in India) governments typically play a prominent facilitative role. This
is effected through facilitation of automotive investment by, variously, low taxes,
tariff protection and a range of other indirect automotive subsidies. Governments
have also tended to stimulate consumer demand for automobiles by keeping the
direct costs of fuel and automotive taxes generally at low levels35.
A further key characteristic of stage 1 is the initial implantation of roads, freeways
and ring roads which becomes an essential counterpart to the automotive mode and
its continued growth. Equally it represents a key part of the modernisation of
infrastructure which accompanies accelerated growth and the associated rapid
increase in urbanisation (Febrina, 2009). As for automotive manufacturing a bias
towards road infrastructure building rather than mass transit at this early stage has
tended to be ‘exported’ via international agencies such as The World Bank and the
Asian Development Bank and various national aid agencies (Dimitriou, 1992;
Townsend, 2003; Febrina, 2009).
34 For the purposes of this thesis per capita income of the major conurbations (rather than the country-wide options) is used as the critical measure of automotive modal lock-in. 35 However where auto manufacturing was not a driver of rapid growth as in Singapore and Hong Kong, high levels of demand for automobiles at threshold income levels were curbed by high taxes and charges helping to fund investment in public transport.

79
As in the U.S.A., rising per capita usage of automobiles and motorcycles is largely
accommodated within the conurbation’s transport infrastructure. Thus,
notwithstanding subsidies flowing to the automotive industry, the market operates
as a reasonably efficient allocator of resources within these boundaries.
Construction of a substantive road and freeway infrastructure for inner city areas is
typically deferred given growth oriented governments are willing to trade-off
automotive domination of an undeveloped transport system for higher growth.
The rapid urbanisation going hand in hand with accelerated economic growth, is
however, being fuelled by the expectation that the automobile will provide a low cost
means to make low density suburbanisation possible. Stage 1 therefore typically
plays host to the initial catalisation of a positive feedback mechanism and path
dependent growth. Thus the net effect of these inner city and outer city
developments is a rising ratio of private automotive to public transport usage with
the latter falling to around 50% at the end of phase one.
Finally the formation of an automotive socio-economic regime tends to occur more
readily in stage 1 during which large scale automotive manufacturing investment is
typically implanted. Thus, in contrast to the U.S. study, a semi-symmetric transport
market is already apparent in stage 1 in which asymmetries of influences are
apparent between the automotive socio-economic regime and government. The
trade-offs – in the form of higher (or expected higher) levels of economic growth in
return for investment and consumer subsidies – begin the process of re-shaping the
transport market. This is illustrated in Figure 4.1.
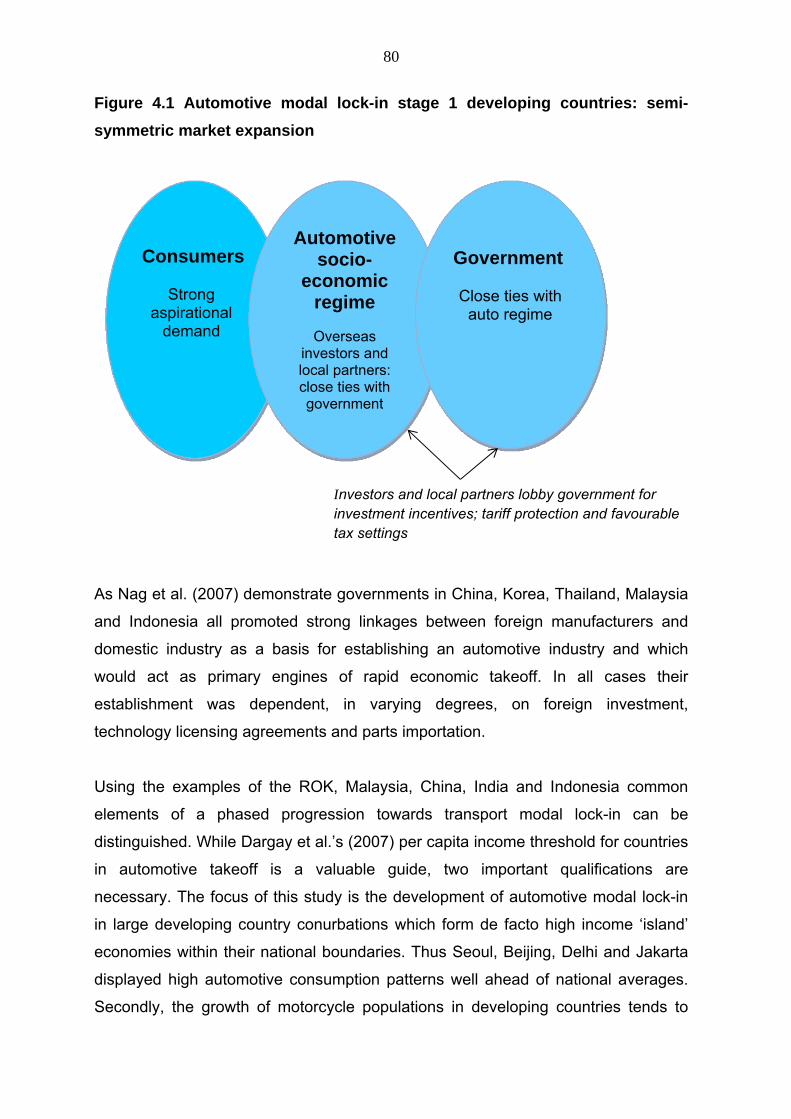
80
Figure 4.1 Automotive modal lock-in stage 1 developing countries: semi-
symmetric market expansion
Investors and local partners lobby government for investment incentives; tariff protection and favourable tax settings
As Nag et al. (2007) demonstrate governments in China, Korea, Thailand, Malaysia
and Indonesia all promoted strong linkages between foreign manufacturers and
domestic industry as a basis for establishing an automotive industry and which
would act as primary engines of rapid economic takeoff. In all cases their
establishment was dependent, in varying degrees, on foreign investment,
technology licensing agreements and parts importation.
Using the examples of the ROK, Malaysia, China, India and Indonesia common
elements of a phased progression towards transport modal lock-in can be
distinguished. While Dargay et al.’s (2007) per capita income threshold for countries
in automotive takeoff is a valuable guide, two important qualifications are
necessary. The focus of this study is the development of automotive modal lock-in
in large developing country conurbations which form de facto high income ‘island’
economies within their national boundaries. Thus Seoul, Beijing, Delhi and Jakarta
displayed high automotive consumption patterns well ahead of national averages.
Secondly, the growth of motorcycle populations in developing countries tends to
Consumers
Strong aspirational
demand
Automotive socio-
economic regime
Overseas
investors and local partners: close ties with government
Government
Close ties with
auto regime

81
occur well ahead of the thresholds described by Dargay and contributes
substantively to levels of congestion and modal lock-in. With these qualifications in
mind the Tables 4.1- 4.3 provide the approximate timelines and statistical identifiers
of a phased evolution of automotive modal lock-in in a developing country context.
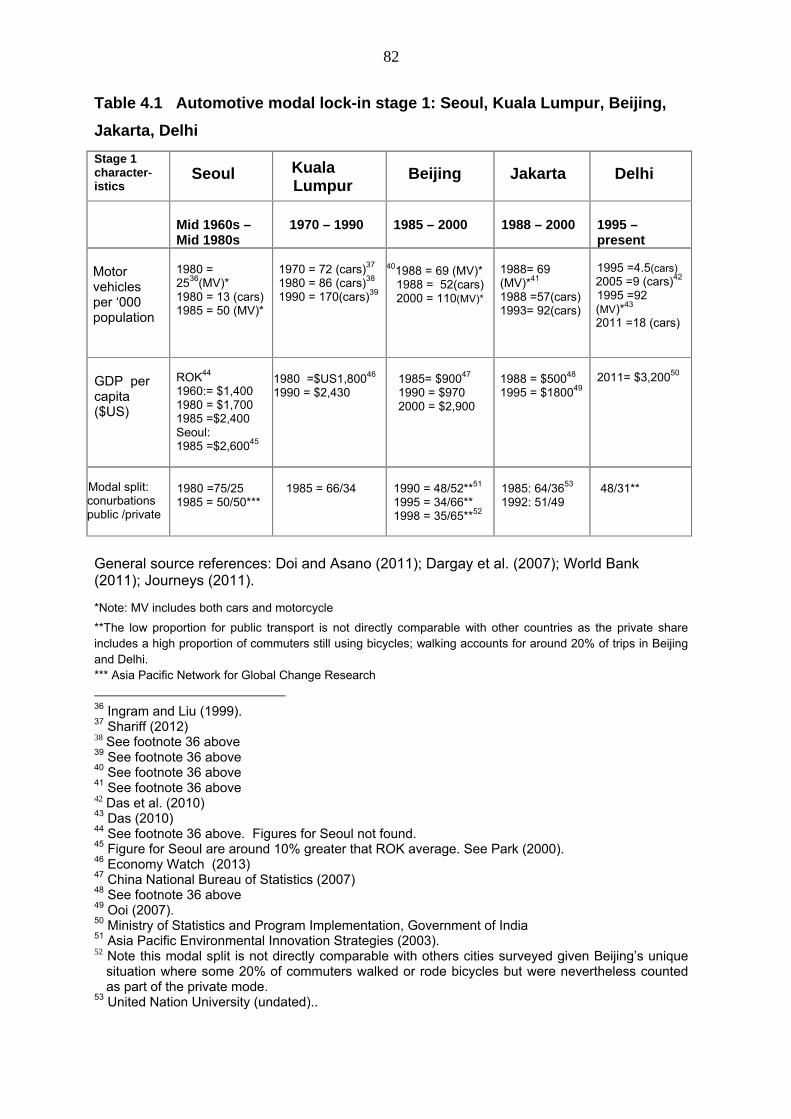
82
Table 4.1 Automotive modal lock-in stage 1: Seoul, Kuala Lumpur, Beijing,
Jakarta, Delhi
General source references: Doi and Asano (2011); Dargay et al. (2007); World Bank (2011); Journeys (2011). *Note: MV includes both cars and motorcycle
**The low proportion for public transport is not directly comparable with other countries as the private share includes a high proportion of commuters still using bicycles; walking accounts for around 20% of trips in Beijing and Delhi. *** Asia Pacific Network for Global Change Research
36 Ingram and Liu (1999). 37 Shariff (2012) 38 See footnote 36 above 39 See footnote 36 above 40 See footnote 36 above 41 See footnote 36 above 42 Das et al. (2010) 43 Das (2010) 44 See footnote 36 above. Figures for Seoul not found. 45 Figure for Seoul are around 10% greater that ROK average. See Park (2000). 46 Economy Watch (2013) 47 China National Bureau of Statistics (2007) 48 See footnote 36 above 49 Ooi (2007). 50 Ministry of Statistics and Program Implementation, Government of India 51 Asia Pacific Environmental Innovation Strategies (2003). 52 Note this modal split is not directly comparable with others cities surveyed given Beijing’s unique
situation where some 20% of commuters walked or rode bicycles but were nevertheless counted as part of the private mode.
53 United Nation University (undated)..
Stage 1 character- istics
Seoul
Kuala Lumpur
Beijing
Jakarta
Delhi
Mid 1960s – Mid 1980s
1970 – 1990
1985 – 2000
1988 – 2000
1995 – present
Motor vehicles per ‘000 population
1980 = 2536(MV)* 1980 = 13 (cars) 1985 = 50 (MV)*
1970 = 72 (cars)37 1980 = 86 (cars)38 1990 = 170(cars)39
401988 = 69 (MV)* 1988 = 52(cars) 2000 = 110(MV)*
1988= 69 (MV)*41 1988 =57(cars) 1993= 92(cars)
1995 =4.5(cars) 2005 =9 (cars)42 1995 =92 (MV)*43 2011 =18 (cars)
GDP per capita ($US)
ROK44 1960:= $1,400 1980 = $1,700 1985 =$2,400 Seoul: 1985 =$2,60045
1980 =$US1,80046 1990 = $2,430
1985= $90047 1990 = $970 2000 = $2,900
1988 = $50048 1995 = $180049
2011= $3,20050
Modal split: conurbations public /private
1980 =75/25 1985 = 50/50***
1985 = 66/34
1990 = 48/52**51 1995 = 34/66** 1998 = 35/65**52
1985: 64/3653 1992: 51/49
48/31**
83
Table 4.2 Automotive modal lock-in stage 2: Seoul, Kuala Lumpur, Beijing,
Jakarta
Stage 2 characteristics
Seoul
Kuala Lumpur
Beijing
Jakarta
1985 -1999
1995 -2004
2001 – 2009
2001- 2009
Motor vehicles per ‘000 population
1993 =23654 (MV)* 1990 =88 (cars)* 1995 =152 (cars)
1996 = 546 (MV)*55 1997 = 300 (cars)56 2002 = 994 (MV)*
2006 = 150 (cars)
2000= 2009 = 225
GDP per capita ($US)
1988 = 2,300*** 1991 = 5,600
1995 = $650057
2000 = $8,00058
2005 = 5,60059 2010 =11,200
2002 = US2,900
Modal Split: conurbations public/private
1996 = 60/40***
2005 = 30/70
2000 = 34/66 **60 2006 = 32/68
2000 = 38/6261
General source references: Doi and Asano (2011); Dargay et al. (2007), World Bank (2011); Journeys (2011). * Note: MV includes both cars and motorcycles
** The low proportion for public transport is not directly comparable with other countries given the private share includes a high proportion of commuters still using bicycles; walking accounts for around 20% of trips in both Beijing and Delhi.
*** APN/South Pacific Network for Global Change Research
54 See footnote 36 above. 55 See footnote 36 above. 56 Zegras and Gakenheimer (2006) 57 Mohamad (2007) 58 See footnote 36 above. 59 See footnote 47 above 60 See footnotes 51 and 52 above. 61 Prakoso (2012)
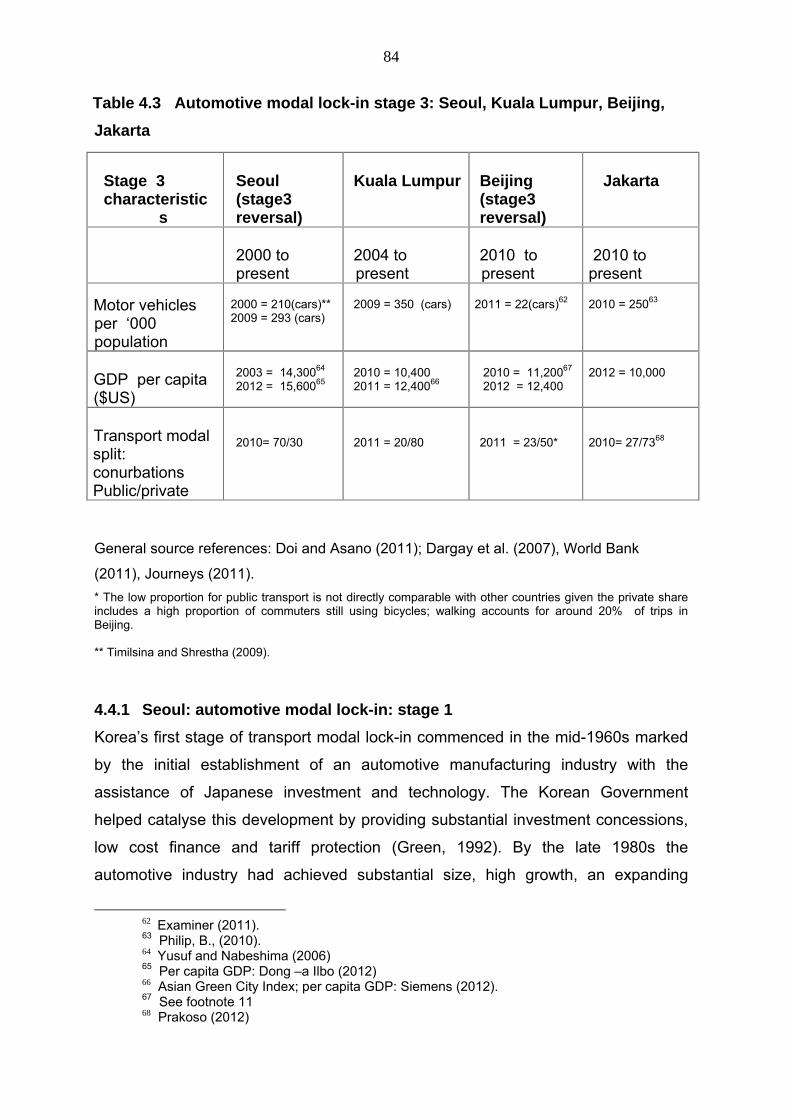
84
Table 4.3 Automotive modal lock-in stage 3: Seoul, Kuala Lumpur, Beijing,
Jakarta
General source references: Doi and Asano (2011); Dargay et al. (2007), World Bank
(2011), Journeys (2011).
* The low proportion for public transport is not directly comparable with other countries given the private share includes a high proportion of commuters still using bicycles; walking accounts for around 20% of trips in Beijing. ** Timilsina and Shrestha (2009).
4.4.1 Seoul: automotive modal lock-in: stage 1
Korea’s first stage of transport modal lock-in commenced in the mid-1960s marked
by the initial establishment of an automotive manufacturing industry with the
assistance of Japanese investment and technology. The Korean Government
helped catalyse this development by providing substantial investment concessions,
low cost finance and tariff protection (Green, 1992). By the late 1980s the
automotive industry had achieved substantial size, high growth, an expanding
62 Examiner (2011). 63 Philip, B., (2010). 64 Yusuf and Nabeshima (2006) 65 Per capita GDP: Dong –a Ilbo (2012) 66 Asian Green City Index; per capita GDP: Siemens (2012). 67 See footnote 11 68 Prakoso (2012)
Stage 3 characteristic
s
Seoul (stage3 reversal)
Kuala Lumpur
Beijing (stage3 reversal)
Jakarta
2000 to present
2004 to present
2010 to present
2010 to present
Motor vehicles per ‘000 population
2000 = 210(cars)** 2009 = 293 (cars)
2009 = 350 (cars)
2011 = 22(cars)62
2010 = 25063
GDP per capita ($US)
2003 = 14,30064 2012 = 15,60065
2010 = 10,400 2011 = 12,40066
2010 = 11,20067 2012 = 12,400
2012 = 10,000
Transport modal split: conurbations Public/private
2010= 70/30
2011 = 20/80
2011 = 23/50*
2010= 27/7368
85
export capacity and a rapidly expanding domestic market. In Seoul the number of
motor vehicles per capita increased from less than 20 per 1000 population in the
early years of this stage to around 50 at its conclusion. Apart from the national
security induced freeway between Seoul and Pusan, new road and freeway
construction was minimal. Public transport’s share fell in concert with the rise
vehicle numbers falling from 75% in 1980 to 50% in 1988 (see figure 4.1).
4.4.2 Beijing: automotive modal lock-in: stage 1
In China the mid 1980’s marks the beginning of stage 1 with foreign investment in
the automotive industry driving a substantial rise in passenger car production over
the succeeding decade and a half (Holweg et al., 2005). In this period vehicle
assemblers increased from around 60 to over 120 by 1995 (Xie and Oliver, 1996).
Major manufacturers – Chrysler, then Volkswagen AG, Peugeot, Suzuki, Toyota
and Subaru – all followed during the late 1980s and early 1990s. GM established a
major joint venture in 1997. In 1980 vehicles per capita – while only around 2 per
1000 in China as a whole – had reached around 28 in Beijing (Doi and Asano,
2011). By 1988 this had risen to 57 in Beijing reaching around 100 in 2000 at the
end of the first stage.
With car registrations increasing at 20% a year by the late 1990s and Beijing’s
suburban population beginning to rise rapidly, new road construction was
accelerated with the fourth urban ring road being largely completed by 2000.
Between 1990 and 2003 the urban roadway network doubled in length (Pucher et
al., 2007) and largely outside the CBD. Public transport share fell from almost 50%
to a little over one third between 1990 and 1998 (see Figure 4.1) although private
non-motorised transport (bicycle and walking) still accounted for a very high modal
share of around 60% in 200069.
4.4.3 Delhi: automotive modal lock-in: stage 1
Indian automotive output began to rise from a low base in the mid 1990s as tariffs
were lowered and joint ventures blossomed (D’costa, 1995). Nationally motor
69 This unusually high proportion indicates that the use of the automotive mode was in fact still modest by the end of stage 1 with cars accounting for only about 10%.
86
vehicles per 1,000 rose from 4.5 in 1995 to 7 in 2002 (Gupta, 2008) although much
higher concentrations were to be found in major cities such as Delhi. Car ownership
per capita doubled in the 10 years between 1995 and 2005 from 4.5 to a still
modest 9 per 1000 population. The predominance of small two and three wheeled
motorised transport in Delhi was reflected in the number of all types of motor
vehicles – already around 92 per 1000 population in 1995 (see Figure 4.1) and
which had reached 75 per 1000 by 2003 (Kokaz and Rogers, undated).
Sales of automobiles numbers continued to rise sharply during the first decade of
the 2000s (Humphrey, 2003) although they were still largely being accommodated
within the existing road infrastructure. Current urban transport modal splits in India
reflect the still relatively modest role automobiles have in the modal mix. In cities
over 5 million automobiles account for only 6% of the share, motorcycles 15%, and
public transport almost two thirds (Gupta, 2008). In Delhi where per capita incomes
are higher, the private modes shares are greater but still comparatively modest:
19% of trips are by automobile, 12% by motorcycle and bicycle and 48% by public
transport (21% walk).
The role of Government policy in encouraging the expansion of the automobile
industry in India is openly acknowledged as a key element in achieving accelerated
overall economic growth. For their part the automotive industry is stimulating
expansion by bringing onto the market exceptionally low cost automobiles (the
Nano costs around $US3000) which have helped push up national per capita car
ownership to the current level of 18 per 1000 and to over 50 per 1000 in the more
affluent region of New Delhi. This has put already overcrowded urban transport
systems under acute pressure. The emerging conflict between the demands of
urban commuters for an efficient cost effective transport system and the growth
objectives of the automotive socio-economic regime is described by Pucher et al.
(2005) in their study of Indian urban transport systems:
“Another formidable obstacle to improved transport policies is the political influence
of the automobile and highway lobbies in India, as well as affluent Indians, who
benefit the most from increased adaptations of transport policies to their car-
oriented lifestyles. Indeed, several Central Government policy documents indicate
87
an overriding priority for further developing the growing Indian automobile industry
as the most important measure for promoting overall economic growth and
employment in India (Ministry of Heavy Industries and Public Enterprises, 2002). An
explicit part of that strategy is the stimulation of maximum possible growth in car
ownership and use, both through new roadway construction and provision of ample
car parking. The increased car use that would generate would hardly help solve the
many problems India’s cities already face with travel demands far exceeding the
capacity of the transport system” (page 196).
4.4.4 Kuala Lumpur: automotive modal lock-in: stage 1
The first stage of major expansion of Malaysia’s automotive mode of transport took
place from the mid 1980s through to the mid 1990s (Mahidin and Kanageswary,
2004). As in the ROK, this was based on the government’s decision to develop an
indigenous automotive industry made possible by the transfer of technology and
parts from, initially, Japanese manufacturers (Mitsubishi) and the formation of joint
ventures. By the 1990s auto sales had increased dramatically with auto production
rising from 42,000 in 1986 to over 220,000 in 1995 (Mahidin and Kanageswary,
2004). As for other Asian cities in this study, the associated explosion of ownership
levels was largely accommodated within the existing road infrastructure and without
a corresponding increase in investment in public transport. Consequently the ratio
of vehicles to road kilometres rose from 46 in 1994 to 71 in 1999 (ESCAP, 2001).
The surge in per capita ownership rates in Kuala Lumpur in the 1990s – assisted by
generous government subsidies – was considerably in excess of that which could
be expected due to per capita income levels alone. With some two thirds of trips in
Kuala Lumpur being made by private vehicles by 1990, the result was severe traffic
congestion (Mohamad and Kiggundu (2007).
4.4.5 Jakarta: automotive modal lock-in: stage 1
The development of transport modal lock-in in the Jakarta conurbation closely
reflects its evolution in other Asian developing countries. Stage 1 is identified to
have commenced in the early 1980s with stage 2 beginning around 2000. The
drivers of stage 1 were clearly present with the installation of a domestic automotive
industry designed to accelerate Indonesia into rapid economic takeoff. Automobile
88
production rose strongly from around 100,000 units per annum in the mid 1980s to
400,000 by 1998 (Aswicahyono, 2000).
During this period the bulk of car sales occurred in Jakarta which was undergoing
rapid urban expansion. In the two decades to 1998 the proportion of Indonesians
living in urban areas almost doubled to 42% (Susilo et al., 2007). Much of this
growth occurred through progressive absorption and expansion of the satellite
urban areas of Bogor, Depok, Tangerang, and Bekasi to form the conurbation
Jabotabek70 whose collective population had reached 20 million by 2000. This
growth was reflected in the rising average trip distances to work, school and shops
for Jakarta commuters: between 1985 to 2000 the increases were 43%, 104% and
85% respectively with the average work commuting distance increased from 6.7 to
9.6 km (Susilo et al., 2007).
Under high levels of tariff protection the automotive industry’s share of Indonesia’s
manufacturing sector rose from 1.6% to 4.6% between1975-96. As for Malaysia,
Korea, India and China, the rapid growth in stage 1 brought about an increasingly
close network of ties with the government. This development of an expanding and
increasingly well organised automotive socio-economic regime is well described by
Aswicahyono’s (2000) landmark study of the automotive industry in Indonesia:
“The particularly high levels of Japanese involvement reflect the very close
commercial relationship between the two countries when major decisions about the
industry’s future were being taken. The second characteristic derives in part from
the highly political environment, in which the Government virtually selected the
major domestic business groups who were to participate in the industry” (page 217).
Up to the early 1980s the Government gave strong support to the industry by being
its major buyer – on-selling automobiles to public servants at heavily discounted
prices (Aswichayono 2000). The industry also received high levels of tariff
protection leading to calculations that it was probably producing negative value
70 The size of the Jakarta conurbation has grown from 180 sq km in the early 1980’s to its current expanse of 6,580 sq km (Suliso et al., 2007).
89
added at international prices (Gray, 1982). With relatively low taxes, subsidised
gasoline71 and the rising affluence and suburbanisation of Jakarta, car registrations
in Jakarta increased three fold between 1985 and 2000 (Susilo et al., 2007). This
represented an annual rate of increase of over 8% per annum. Rather than easing
congestion, the modest road infrastructure expenditure inevitably acted as an
incentive for car ownership. During the 1980s 325 km of toll roads were built, and a
further 144 km during the 1990s in part funded by international financial institutions.
A plan to develop a mass rail transit system was floated by the Jakarta Provincial
Government in the early 1990’s but was later dropped being considered too costly
to underwrite.
Thus while expenditure on roads increased fivefold between 1985 and 1995 –
accounting for a rise from 9% to 20% of the government’s total budget (Hook and
Replogle, 1995) – traffic congestion increased by almost 100% between 1988 and
2000 (Susilo et al., 2007). And with only token investment in rapid transit the modal
split between public and private transport fell from 61%/ 39% in 1972, to 57%/43%
in 1985 and 49%/51% in 1992.
4.5 Developing country automotive modal lock-in: stage 2
The drivers of the second stage of transport modal lock-in in developing countries
are shown to be similar to those of the U.S. automotive modal lock-in model. Thus
the particular insight provided by stage 2 of the automotive modal lock-in model is
the way in which it demonstrated the interlinked role of path dependent growth and
the associated phenomenon of positive feedback mechanisms, asymmetries of
influence, and high levels of aspirations demand unleashed by rising per capita
incomes. This interlinking occurs at a point where per capita incomes in stage 2
have reached the critical ‘takeoff zone’ for automotive demand takeoff of $US3000-
$US10,000 (as described by Dargay et al., 2007).
The unusually high income elasticities of demand for the automobile in stage 2 are
shown to be greatly enhanced by key positive feedback mechanisms such as road
71 Hook and Replogle (1995) note that between 1989 and 1991 motorised road user charges were negative due to highly subsidised price of gasoline.
90
infrastructure investment to meet rising congestion. Equally, rapid urbanisation and
suburbanisation were shaped to the automotive and motorcycle modes of transport
generating yet higher dependence on private transport modes.
Also replicating phase two of U.S. automotive modal lock-in, Governments of
developing country conurbations were choosing not to substantially recoup the by
now sharply rising indirect environmental and social costs of automobilisation.
These costs were in the form of congestion, pollution, and a general deterioration of
the quality of urban life through the spread of automobiles into urban living space.
Continued high levels of investment by automobile companies are another key
characteristic of the second stage. Governments, encouraged by the auto
industries’ contribution to overall economic growth, continued to eschew investment
in public transport preferring to provide direct and indirect subsidies to the
automotive mode thus further stimulating demand. As in the U.S.A., positive
feedback again became evident as the deteriorating standard of public transport
induced yet higher reliance on private means. This phenomenon is described by
Kenworthy (1994) in his account of the growth of the Thai automotive industry in the
early 1990s:
“Bangkok clearly has a burgeoning vehicle population which is higher than
expected if wealth were the only factor involved. It can be argued that the absence
of a real public transport alternative and the serious problems associated with
walking and cycling are helping to fuel exponential growth in vehicles, especially
since 1980 (Poboon et al., 1994). There is also nothing in government policy which
would help to curtail the trend. On the contrary, close ties with Japanese car and
motor cycle manufacturers, financial aid from Japan and other financial institutions
for road projects, plus low tariffs and other government charges associated with
vehicle ownership, suggest that high vehicle growth will continue.”72
72 The flows of aid and loans from international financial institutions (Asian Development Bank, 2011) earmarked for automotive infrastructure provides an illustration of the way in which Asian developing countries were to acquire Western developed country transport development templates.
91
A marked difference with the U.S. and Western European automotive modal lock-in
model however has been in the truncation of stage 2 in developing countries. With
exceptionally rapid growth in per capita ownership of cars and motorcycles,
congestion was correspondingly increased as were the levels of negative
externalities but over a markedly shorter timeframe. Scarce resources spent on
road infrastructure investment created yet higher automotive demand while
heightening the shortfall in public transport investment. The entry into stage 2 of
automotive modal lock-in is thus characterised by a falling public/private modal ratio
which typically reaches around a 50/50 split as found in the U.S.A.’s transition. In
this environment demand for the automotive transport mode becomes increasingly
driven by the lack of public transport and less by its perceived inherent superiority
and aspirational characteristics.
The exception to the downward trend in the public/private transport modal ratio in
stage 2 is Seoul with the public proportion rising to around 60%. Thus Seoul is
shown not to have moved towards but away from automotive modal lock-in by
means of a deliberate policy of public transport investment and the imposition of
high taxes on automotive ownership.
At this still early stage of evolution of the automotive mode developing country
consumers in concert with their developed country predecessors had inadequate
means to compute full direct and indirect costs of the automotive mode of transport.
In particular they were ill equipped to foresee the high downstream infrastructure
costs and large negative social and environmental externalities. The contribution to
automotive demand afforded by this lack of foresight was to be accompanied by
further stimulation of demand through the application of asymmetries of influence.
Co-option of consumers by automotive socio-economic regimes – primarily by way
of media, marketing and advertising – was typically aimed at promoting the values
of mobility, convenience and social prestige of automotive ownership (Vasconcellos,
1997). The success of such campaigns depended on the lack of countervailing
information available to consumers on the real short and long term direct and
indirect costs of automobilisation.
92
Co-option of Government by the automotive socio-economic regime was to become
an equally important feature of stage 2 in which further expansion of demand was
increasingly dependent on expansion of now highly congested road infrastructure.
Moreover with rising direct and indirect negative externality costs attached to the
automotive mode, co-option was all the more important to ensure fuel and
automotive taxes were kept low. In this way user-pay was limited enhancing the
indirect subsidy afforded the automotive mode. As noted, co-option was to be
facilitated by the increasingly privileged position of the automotive socio-economic
regimes had with governments which they earned by means of their key role in
raising economic growth.
4.5.1 Seoul: automotive modal lock-in: stage 2
The second stage of transport lock-in in Seoul can be dated around the mid 1980s.
National domestic sales of automobiles increased sharply between 1990 and 1995
when the per capita ownership tripled from 48 to 152 (Timilsina and Shrestha,
2009). The automotive population in Seoul doubled from 1 million to 2 million cars
between 1980 and 2000, while CBD travel speed more than halved from 31 to 14
km per hour (World Health Organisation, 2008).
The second phase of rapid domestic growth ended with the Asia financial crisis in
the late 1990s by which time annual automotive production had peaked at an
annual rate of 3 million. Automobile numbers in Korea between 1980 and 2005
increased fivefold (Timilsina and Shrestha (2009) with production rising by over
18% annually. This occurred notwithstanding very high levels of tax levied on cars –
around 45% of purchase price73.
Automotive demand was driven not only by rising incomes but also by the positive
feedback mechanism which accompanied rapid suburbanisation in Seoul and the
accompanying substantial rise in road transport infrastructure investment. Between
1988 and 1996 a doubling of freeway length occurred (Lee, 1997). By the end of
stage 2 Seoul had almost 8,000 km of freeways coping with more than 30 million
73 However with wages rising at an average of 12% a year during the 1990s tax disincentives were ineffective.
93
commutes per day (The Institute for Transport Development and Policy, 2009).
Nevertheless Seoul was being subjected to acute traffic congestion by the
conclusion of stage 2. This occurred notwithstanding the proportion of passengers
being carried by public transport rising to around 60%.
The increasingly close network of ties between the rapidly growing Korean
Chaebols which housed automotive manufacturing and the Korean Government is
well documented in the literature (Lee and Yoo, 1987; Weiss, 1995). Substantial
Government direct and indirect subsidies were an accepted and universal means of
supporting the automotive sector and the substantial contribution it was now making
to economic growth. However these subsidies were oriented to driving exports
rather than domestic consumption. Thus Korean economic growth was sustained at
a high level of automotive exports rather than domestic sales. In this way the
Government was able to impose high taxes on domestic automotive sales without
compromising growth. Equally tax revenues from export sales provided funding for
improvements to the public transport system.
4.5.2 Beijing: automotive modal lock-in: stage 2
Stage 2 in Beijing China commenced at the turn of the century with an exceptionally
rapid increase in automotive sales commencing in 2001. Per capita ownership for
passenger cars in urban households rose from around 20 per 1000 to 50 in 2006.
However the figure for Beijing was considerably higher – 150 in 2006 – reaching
300 by 2009 (AdvisorAnalyst, 2012). As shown in table 4.2, per capita incomes
were by now rising rapidly and exceeding the $US3000 mark peaking at the end of
phase two at $US10,000.
High levels of investment in China’s auto industries were also a feature of stage 2.
By 2007 $US233 billion in foreign direct investment had been recorded with 120
vehicle manufacturers employing 2 million workers producing 4.8 million vehicles
(Nag et al., 2007).
94
As in Malaysia, Indonesia and India, the automotive socio-economic regime’s close
association with Government produced policy settings which, as Pucher et al.
(2007) note, provided substantial subsidies for private modes of transport74:
“Central and provincial governments offer a range of tax breaks, subsidies and
regulatory concessions that enhance the car industries profitability. In addition the
governments at all levels have concentrated on expanding the roadway capacity to
accommodate the increased of private motorised travel especially by car and truck.
Finally, taxes and fees for car purchases, registration, parking and leaving gas
prices are generally quite low thus facilitating the general affordability of cars” (page
397).
The exceptionally rapid increase in per capita automotive ownership can equally be
attributed to the increasing strength of positive feedback mechanisms first initiated
in stage 1. Thus in stage 2 a further acceleration of freeway construction and rapid
suburbanisation were evident. Beijing’s population increased from 13.6 million in
2000 to 17 million in 2003. By 2009 it had reached around 19 million a growth
facilitated by the progressive additions of new ring roads which totalled six by 2009.
This way new infrastructures contributed substantially to automotive demand –
between 1997 and 2010 vehicle ownership more than quadrupled, from 1 million in
1997 to 4.76 million in 2010 (Sun et al., 2011). Not surprisingly the average motor
vehicle speed in central Beijing on arterials dropped from 45 kmph in the 1990s to
around 17 kmph in 2009 and between 2000 and 2006 the average road space per
car in Beijing fell by around 50% (Tang, 2009).
The aversion to demand management is reflected by the fact that, despite having
roughly the same population as Shanghai, Beijing’s automobile population was six
times greater. This differential is largely explained by Shanghai’s introduction of a
74 In 2006 14,000 new cars were being registered each day in China (Economy, 2007). In 2009 a multi-billion RMB subsidy was introduced as a stimulus to domestic automakers with the Government setting a target of 10 million vehicles to be manufactured and sold domestically in 2009. The 13.6 million sold in that year made China the world’s largest market for automobiles (Reuters, 2010). Subsidies to auto owners in the form minimal user pay for transport infrastructure and negative externalities continued until late 2008. Prior to this date China’s transport fuel tax was set at $US3 cents a litre (subsequently raised to $US15 cents a litre).
95
Singapore style licence registration auction which capped registrations to around
100,000 annually (Fang et al., 2012)75.
Despite increased investment in bus and subway networks, public transport still only
accounted for around 33% of Beijing’s transport market. As for other cities in this
study, the imbalance of funding between roads and public transport led to rising
demand for automotive mode due to the lack of alternative public means.
4.5.3 Kuala Lumpur: automotive modal lock-in: stage 2
Stage 2 in Malaysia – 1995 to 2005 – is marked by an accelerated increase in per
capita passenger car ownership well above that which could be attributed to
increases in per capita income. Demand was heavily underwritten by substantial
Government support for the domestic car industry, subsidised purchase for public
servants, low taxes on cars and highly subsidised gasoline prices. Kasipillai and
Chan (2008) in their study of transport demand in Malaysia point out that while
incentivising high levels of automobile ownership the Government had no direct
policies to deal with the resulting severe congestion – other than to rapidly increase
the construction of toll highways. Such a strategy did nothing to internalise the cost
of congestion as Abidin et al. (2004) point out:
“…toll charges in Malaysia were not explicitly implemented to internalize external
costs such as congestion but reportedly to recover infrastructural costs. The
Malaysian government set up a lease-like mechanism (known as Build – Operate –
Transfer) wherein private concessionaires finance, design, build, and maintain
roads in exchange for exclusive rights to impose tolls upon entry and exit within a
time limit. Upon expiration of this time limit, ownership of the roads reverts to the
government, and the roads, presumably, become toll-free. Despite spiralling toll
charges, which are increasing on average by 10 percent every three years, the
number of vehicle continues to grow by a conservative estimate of eight percent
annually” (page 44).
75 Beijing had no such scheme relying only on an automotive sales tax set at around 30% of the purchase price (Hayes, 2010). However Beijing has recently announced the introduction of a registration auction scheme.
96
The exceptionally high level of automotive ownership and lack of investment in
public transport in Kuala Lumpur raised the percentage of trips using private
vehicles from 47% in 1985 to 71% in 2005. Over the same period the share of
public transport dropped from 35% to 16% – the lowest of all major Asian
conurbations (Kari and Rasiah, 2010).
A major contribution to the automotive mode’s domination of the transport system
was to be the positive feedback inherent in the rapid low density suburbanisation of
the Klang Valley region around Kuala Lumpur. Fed by the growth in tollways, the
number of motorcycles and private passenger cars increased at an average rate of
4.5% and 10% respectively from 2000 to 2005, (Kassipillai and Chan, 2008). Such
high rates of growth were to be further stimulated by Malaysian Government
policies which continued to provide large subsidies to automotive users. By 2005
vehicle sales tax had remained at 2% and petrol prices were fixed at around
$US0.50 a litre – both some of the lowest in Asia.
4.5.4 Jakarta: automotive modal lock-in: stage 2
Commencing around 2000, stage 2 marked the beginning of a further decade of
rapid increases in Jakarta’s automobile and motorcycle population. By 2002 when
per capital incomes in Indonesia had reached $US2,900, income for Jakarta were
around double this figure (Rizkiya, 2011) – a level at which per capita automotive
ownership generally shows a marked acceleration. By 2009 there were an
estimated 5.5 million motorised vehicles with growth rates running at almost 10%.
A major contributor continued to be the symbiotic relationship between automotive
demand and the ongoing spread of the Jabotabek conurbation whose population –
at over 27 million in 2010 – made it one of the world’s three largest. Reinforcing this
interdependence was the paucity of rapid transit to Jabotabek regional suburbs and
government policies which kept the cost of automotive ownership and use low. Until
2010 (when it was raised to 10%) the vehicle sales tax was kept at 2% – one of the
lowest in Asia. At the same time generous petrol subsidies were continued: the
2004 price of US20 cents a litre being below cost. While there were a series of
97
subsequent price rises, the 2013 price was less than US66 cents a litre – still one of
the cheapest in Asia76.
With rising congestion in Jakarta road capacity expansion became a priority. Given
over 80% of automotive sales in Indonesia were Japanese vehicles, it is perhaps
not surprising that the Japan International Cooperation Agency (JICA) became
heavily involved with the Indonesian National Planning and Development Agency
(BAPPENAS) in financing and carrying out the planning road expansion project for
Jakarta (JICA and BAPPENAS, 2001, 2004). That produced a period of
accelerated freeway (mostly tollway) construction concentrated in the greater
Jakarta area to facilitate suburban expansion.
Greater road capacity was to produce a typically path dependent cycle of higher
demand for automobiles. Vehicle numbers continued to rise at almost twice the rate
of the increase in road metreage (Sutomo et al., 2007) while travel speed fell from
20-30 km/h to 5-15 km/h between 1995-2005 (Mochtar and Hino, 2006). The
product of the boom in automotive sales was a further fall in the modal split between
public and private transport for Jakarta: by 2000 it had fallen to 45% and 55%
(Sutomo et al., 2007).
4.6 Developing country automotive modal lock-in: stage 3
A third stage of a dual nature is identified for, firstly, Kuala Lumpur and Jakarta
where full lock-in is seen to have occurred and, secondly, for Seoul and Beijing
where a reversal of the progression towards lock-in is shown to have been
achieved. For both groups the third stage is distinguished by per capita income
generally rising above the high elasticity zone identified by Dargay et al. (2007) of
$US3000-10,000 and moving into the range of $US10,000-15,000 which Dargay
76 Government efforts to reverse the onset of transport lock-in proved manifestly inadequate. In 2003 regulations were introduced mandating that vehicles using a number of strategic roads during peak morning and afternoon hours must have at least three passengers. However use of paid passenger ‘jockeys’ and diversion of traffic to narrow suburban ‘rat runs’ meant the law produced only temporary relief, and an admission from the head of road traffic engineering at the Jakarta Administration’s Transportation Agency, Bambang Susantono, that “…the 3-in-1 policy is not effective in reducing Jakarta’s traffic” (Korona, 2010).
98
finds attracts a somewhat lesser but still high elasticity77. Acute traffic congestion
and associated negative externalities are now highly visible products of automotive
modal lock-in of the transport system. In Jakarta and Kuala Lumpur public modal
share of urban transport has fallen to around 30% and stabilised at this critically low
level. In stage 3 of full lock-in consumers are shown to be more aware of the
monetary and social costs of automobility, and therefore less prone to co-option by
the automotive socio-economic regime. The regime therefore becomes increasingly
focussed on sustaining and tightening its co-option of Government in order to
maintain the various direct and indirect subsidies which support existing and further
expansion of demand for the automotive mode.
A significant divergence from stage 3 automotive modal lock-in in the U.S.A. is that
in the developing country conurbations per capita automotive ownership levels are
well short of U.S. saturation level – in excess of 800 per 1000. Comparable figures
for developing country conurbation in stage 3 are shown to be between 150 and
200 per 1000. At these levels however congestion and inadequate road
infrastructure pose severe constraints on further rapid increase in per capita
automotive ownership78. Expansion of infrastructure sufficient to ameliorate
congestion of this infrastructure is problematic given. As indicated in Table 4.9,
infrastructure construction accounts for a significantly higher proportion of gross
regional product that that of developed country conurbations where per capita
`revenues are significantly higher.
77 Dargay et al. (2007) finds elasticities of demand for automobiles of around 2 where incomes are in
the range $US3-10,000 and 1 for incomes of $US10,000-15,000.
78 Seoul’s per capita ownership rate has stabilised at around 250 per 1000 of population at a time when the public private modal split has risen to 60/40.
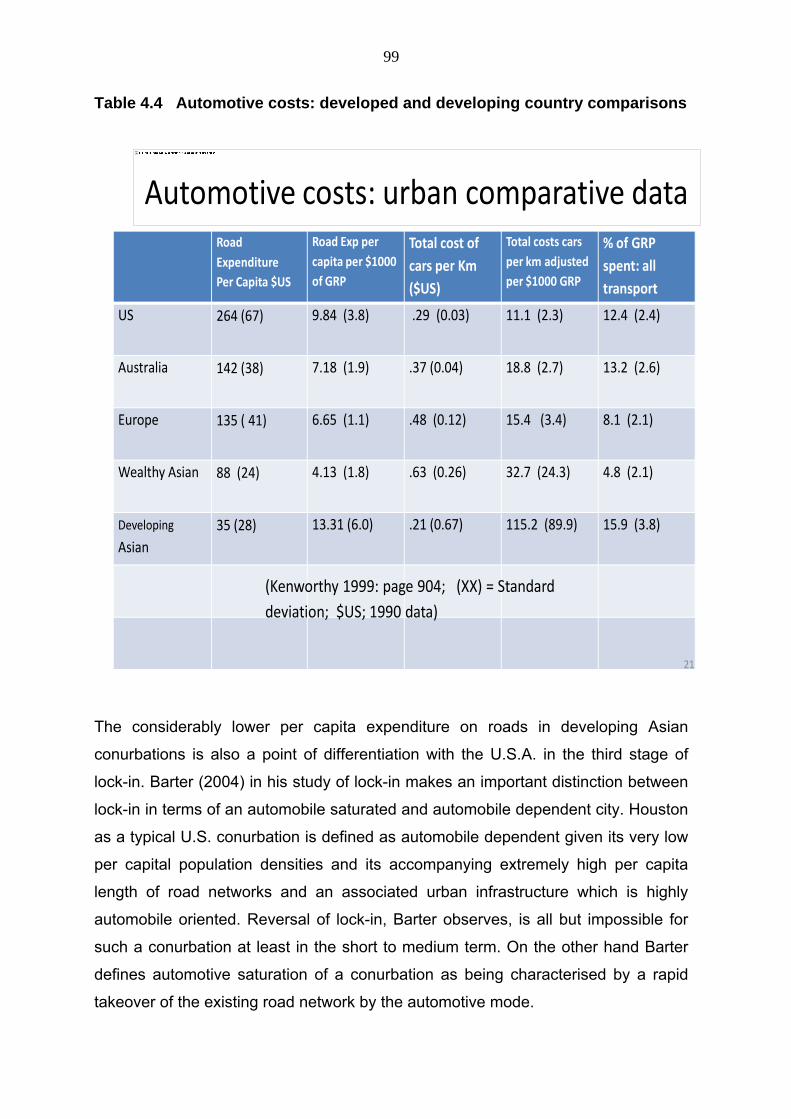
99
Table 4.4 Automotive costs: developed and developing country comparisons
Automotive costs: urban comparative dataRoad
Expenditure
Per Capita $US
Road Exp per
capita per $1000
of GRP
Total cost of
cars per Km
($US)
Total costs cars
per km adjusted
per $1000 GRP
% of GRP
spent: all
transport
US 264 (67) 9.84 (3.8) .29 (0.03) 11.1 (2.3) 12.4 (2.4)
Australia 142 (38) 7.18 (1.9) .37 (0.04) 18.8 (2.7) 13.2 (2.6)
Europe 135 ( 41) 6.65 (1.1) .48 (0.12) 15.4 (3.4) 8.1 (2.1)
Wealthy Asian 88 (24) 4.13 (1.8) .63 (0.26) 32.7 (24.3) 4.8 (2.1)
Developing
Asian
35 (28) 13.31 (6.0) .21 (0.67) 115.2 (89.9) 15.9 (3.8)
(Kenworthy 1999: page 904; (XX) = Standard
deviation; $US; 1990 data)
Transport modal lock‐in: international comparisons
21
The considerably lower per capita expenditure on roads in developing Asian
conurbations is also a point of differentiation with the U.S.A. in the third stage of
lock-in. Barter (2004) in his study of lock-in makes an important distinction between
lock-in in terms of an automobile saturated and automobile dependent city. Houston
as a typical U.S. conurbation is defined as automobile dependent given its very low
per capital population densities and its accompanying extremely high per capita
length of road networks and an associated urban infrastructure which is highly
automobile oriented. Reversal of lock-in, Barter observes, is all but impossible for
such a conurbation at least in the short to medium term. On the other hand Barter
defines automotive saturation of a conurbation as being characterised by a rapid
takeover of the existing road network by the automotive mode.
100
Using Barter’s definition, the third stage of automotive modal lock-in as described in
developing country conurbations is therefore a product of automotive saturation
rather than automotive dependency. This helps to explain why lock-in occurs in
such cities even when the level of automobiles per capita and road expenditure are
far less than in some developed conurbations. Thus in Kuala Lumpur and Jakarta
automobiles per capita are less than half and one third respectively that of the
U.S.A. at almost 600 per 1000 of population (see Table 4.3) and expenditure on
roads in developing Asian conurbations is over seven times less that the U.S.
average (see Table 4.4). Jakarta and to a somewhat lesser extent Kuala Lumpur
can therefore be classified as traffic saturated conurbations – although there is
some overlap with automotive dependence given the extent of suburban expansion
tied to the automobile.
Developing country conurbations in the third stage of automotive lock-in are
therefore typically subject to very rapid increases in CBD traffic congestion as car
numbers quickly overtake road infrastructure capacity. This creates an equally rapid
build-up of negative externalities and associated substantial financial costs. Despite
this hostile environment still highly active positive feedback mechanisms continue
to sustain lock-in. In particular rising congestion, poor public transport, and ongoing
urban expansion make private modes even more essential. Growth dependent
governments remain reluctant to effect the substantial increase in taxes on cars and
motorcycles needed to reduce congestion. With limited resources developing
country governments are equally averse to meeting the very high costs of mass rail
transit. `As well fitting examples of stage 3 automotive modal lock-in, Jakarta and
Kuala Lumpur can be shown to have entered a new form of stable market
equilibrium. Thus Jakarta reaches a private/public modal transport split of 70/30
with similar ratios for Kuala Lumpur the latter having entered stage 3 around 2005.
Underlined, therefore, is the shorter time frame in which transport modal lock-in has
emerged compared to the U.S.A. and other Western economies.
Seoul and Beijing are shown to have followed a different path to other Asian
conurbations. In stage 3/reversal, Seoul successfully interrupted the path
dependent evolution towards automotive modal lock-in by first stabilising the public
101
private ratio at around a 50\50 ratio and then increasing the public proportion to
70%. Beijing is shown to have begun a similar process of arresting the onset of
lock-in by both greatly increasing the supply of public transport and reducing the
growth of automotive transport.
4.6.1 Seoul: automotive modal lock-in: stage 3 reversal
Seoul is shown to have been capable of achieving and sustaining a reversal of
automotive modal lock-in with a public transport share rising from 60% to 70%
between 1996 and 2010. This achievement was a product of a complex of
measures aimed at dis-incentivising the use of cars for commuting, a parallel
expansion of public transport through the development of an extensive subway
network and a 536 km dedicated busway system which increased its carrying
capacity to around 4.5 million passengers daily (Park, 2010). Demand management
measures included a 10% tax cut for car owners who chose to leave their cars at
home once a week. Automobile access to key congested areas in the CBD and
surrounding areas was limited or abolished altogether.
The aggressive government directed program of moving people onto public
transport and out of the automotive mode reflected, as noted, the strong dirigiste
tradition in Korean politics where government intervention in the economy has been
an accepted way of political life.
4.6.2 Malaysia, Kuala Lumpur: automotive model lock-in: stage 3
By 2005 Malaysian per capita automobile ownership had reached around 230 per
100,000 of population and has since continued to rise at an exceptionally rapid rate.
By 2008 per capita ownership stood at 300. This is a level well in excess of the
ROK’s per capita ownership which currently stands at around 257 (The World Bank,
2011) and whose per capita income is around double that of Malaysia. The far from
adequate public transport spending led to further falls in public transport usage in
the Kuala Lumpur conurbation – from 35% in 1980 to around a current level of 17%
– one of the lowest in Asia. The severity of Kuala Lumpur’s transport modal lock-in
can be measured by comparisons with neighbouring Asian conurbations. Public
102
transport usage in Seoul stands at around 60%, Singapore 56%, Manila 54%,
Tokyo 49%, and Bangkok 30% (Abdul-Aziz 2006).
The continued rapid suburbanisation of Kuala Lumpur’s Klang Valley conurbation
and the Malaysian Government’s fuel subsidy have remained key drivers of the
sustained high levels of automotive sales. In 2009 the automotive fuel price was still
accounting for one third of the total price costing the Malaysian government around
$A3 billion annually (The Institute for Transport Development and Policy, 2009).
4.6.3 Beijing: automotive modal lock-in: stage 3 reversal
In the early 2000s Beijing was experiencing acute traffic congestion and an
exceptionally rapid increase in per capita car ownership. By 2010 cars per capita
reached around 150 per 1000 – ten times the overall Chinese average – signalling a
marked acceleration in the adoption of the automotive mode. In this year car
ownership in Beijing rose from 4 million to 5 million. According to the Beijing
Transport Commission the space taken by autos was now exceeding the sum of all
road spaces and parking lot places in urban Beijing. The average speed during rush
hours was less than 20 kilometres per hour with more than 50% of airborne
pollution coming from auto exhaust (Xie, 2012).
Automotive modal lock-in in the terms defined by this thesis was, however, not
established and indeed a process of reversal of the evolution towards lock- begun in
this third/reversal stage. The avoidance of third stage lock-in can be partly
explained by a unique feature of the Beijing transport system which severely
restricted the use of motorcycles thereby sustaining a high percentage of people
using bicycles or walking – currently accounting for over 20% of trips (Examiner,
2012). This feature has distinguished it from conurbations such as Jakarta where
cycling and walking remains at around 2-3%. And while motorcyclists account for
only around 16% of the Beijing modal split (Huo et al., 2011) in Jakarta it is currently
at over 50%. This therefore accounts for the fact that while public transport in
Beijing is responsible for around 44% of trips (2010 figures), private cars, taxis and
motorcycles still only account for around another 36% with 20% using either
bicycles or walking. In terms of modal split Beijing therefore has remained well
103
below the 70/30 private/public ratios of Jakarta and Kuala Lumpur conurbations
which characterised their state of automotive modal lock-in. Even so, in terms of
saturation of the transport road network by the car Beijing was by the turn of the
century clearly at the upper limit.
A second determining factor in avoiding third stage automotive modal lock-in has
been the role of government which, as noted in Chapter Eight Section 8.4, has
taken a more pro-active role in dealing with acute traffic congestion than the
governments of Jakarta and Kuala Lumpur. Its decision to invest heavily in public
transport and in particular on heavy rail subway development has been instrumental
in beginning to reduce CBD congestion levels and is likely to be of sufficient size to
increase the public transport’s share of the modal split. The Beijing subway network
has increased from 41 stations and 114 km of track in 2003 to 400 stations and 370
km of track in 2012. A further $30 billion is to be invested by 2015 which will
increase the track length to over 700 km, and 421 stations. At this point all urban
residents in Beijing are to be in walking distance of a subway station 2015 (Jschina,
2012).
4.6.4 Jakarta: automotive lock-in: stage 3
The current transition to stage 3 automotive lock-in for Jakarta can be described in
terms of the public/ private modal transport share which continued to fall sharply
from around 45%/55% in 2000 to its current level of around 30%/70%. As noted
above, by the end of stage 2, congestion was already acute with the automotive
population rising at an undiminished rate.
There are currently 11.3 million vehicles in the Jakarta conurbation which are
increasing at a rate of 300 new vehicles a day, (Korona 2010). According to a
recent Ministry of Transport report (Korona, 2010) Jakarta faces total gridlock in
2014 if the current annual rate of increase in vehicle numbers of 9.5% is sustained
and the road network continues to expand at the current rate of 0.01% per annum.
The Ministry report estimates that traffic congestion in Jakarta costs $US3.2 billion
yearly in fuel, lost productivity and effects on health.
104
The rapid fall in public transport usage reflects the lack of a viable subway system,
a rapid transit bus system (the BRT) which copes with only a very small proportion
of commuters and automotive tollways which are demonstrably inadequate. The
bulk of public transport remains by way of extremely crowded and slow buses.
Whether transport lock-in can be broken will in part depend on the $AU1.3 billion
plan launched to develop a rail based rapid transit system through extending the
existing inadequate network and creating an above-road and subway system.
Phase one is due for completion in 2016 with a second phase to be completed in
2018. However delays already experienced make these dates problematic.
Moreover without a parallel scheme of automotive demand management of the sort
used in Seoul and currently being introduced in Beijing, the boost in rail transit is
unlikely to be sufficient for a reversal to be achieved. Traffic experts such as
Lukman Hakim, deputy chairman of the Indonesian Institute of Sciences (LIPI), are
now advocating far tougher measures to limit vehicle ownership in the Jakarta
region, together with an introduction of electronic congestion charging (Korona,
2010).
4.7 Conclusion
The foregoing study of the evolution of automotive modal lock-in in Kuala Lumpur,
Delhi, Seoul and Jakarta indicates a broad similarity with the explanatory framework
derived from the U.S. study although with a number of important modifications.
Given the rapidity of overall growth of the developing country economies studied,
the evolution of automotive modal lock-in in their conurbations is shown to be highly
truncated. The progression to full lock-in typically occurred within a 20-30 year
timeframe. In stage 1 large externally sourced investment in automotive
manufacturing companies induces the early creation of socio-economic complexes
which typically co-opt government support in the form of substantial direct and
indirect subsidies. Together with high levels of aspirational demand driven by rising
incomes, the early catalisation of positive feedback mechanisms in the form of road
construction and suburbanisation becomes a prominent feature of stage 1.
105
The second stage in developing country conurbations more closely replicates the
U.S. model in so far as rapid increases in per capita levels of automotive ownership
and modal use are driven by a combination of an accelerated rise in income levels
of an expanding middle class. Path dependent growth is now firmly implanted driven
by positive feedback mechanisms. In the process the automotive mode’s share of
the transport market accelerates and becomes increasingly less cost-effective as
externalities are created.
The developing country conurbations of Jakarta and Kuala Lumpur in the third stage
of lock-in exhibit important similarities to the U.S. model in that socio-economic
complexes are focussed on re-enforcing co-option of governments in the face of
rising negative externalities and a less cooptable consumer. However, given the
generally lower level of transparency in government private sector relationships
(and the greater scope for corruption and the wielding of associated forms of
influence asymmetries), the capacity for co-option of governments by automotive
socio-economic regimes is seen to be greater in developing countries. In such
environments consumers – increasingly aware of the direct and indirect negative
externality costs – are less able to influence either the market’s evolution or
government policies which shape it. This is notwithstanding the generally greater
severity of negative externalities in developing countries than in the U.S.A. and
other developed countries. This high level of consumer market impotence reflects
importantly the typically weak development of institutions which aggregate
consumer influence in developing countries. For the above reasons, automotive
modal lock-in in developing countries – as exemplified by the conurbations of Kuala
Lumpur and Jakarta – can take on a remarkably resilient form in its third stage.
The examples of Seoul and Beijing underline, however, that where national
governments have a strong dirigiste tradition in which market forces
(notwithstanding the adoption of market driven economic models) are subject to
management by Governments, the path dependent growth of transport systems can
be arrested and automotive lock-in avoided.
In the following three chapters a methodology is developed and applied which is
aimed at defining more precisely the nature and strength of automotive modal lock-
106
in in a developing country context and in particular as it applies to the Jakarta
conurbation. Validation is sought for the hypothesis that, in the latter stages of
automotive modal lock-in in developing country conurbations, commuters have
largely shed aspirational demand for automotive transport and are more focussed
on utility as it relates to transit efficiency. Equally tested is the linked hypothesis that
consumers in stage 3 will show a high level of willingness to trade off automotive
modal dominance for improved public transport.
107
CHAPTER FIVE: SURVEY METHODOLOGY
5.1 Introduction
In this chapter the methodology used to test the thesis hypothesis outlined in
Chapter Two is established. The structure and content of the preliminary and final
surveys of Jakarta commuters are described in Sections 5.2 and 5.3. The purpose
of the preliminary survey was to, firstly, test use of the internet to distribute the
survey and, secondly the efficacy of having it filled in and returned on line.
Additionally, the capacity of participants to complete the questionnaire in a
reasonable time frame, the validity of the socio-economic questionnaire and
commuters’ ability to understand and participate in a discrete choice questionnaire
experiment were tested.
The final survey as described draws on the preliminary survey outcomes which led
to generation of a larger sample size, and a shortened socio-economic profile
questionnaire. Importantly the final survey included a modified and simplified
discrete choice experiment capable of providing statistically reliable choice
preferences and WTP estimations.
In Section 5.4, the advantages of using choice modelling to measure commuter
transport modal preferences are outlined. Discussed is the use of dose-response
type of choices as a way of measuring willingness to pay and as a means to test the
thesis hypothesis relating to commuters’ willingness to forego automotive and
motorcycle use in return for improved public transport, reduced congestion and
pollution. Data and the method of calculation used to specify the choice models’
parameters – specifically the increase in motoring costs, rising negative externalities
caused by pollution and congestion – are set out in Section 5.6. The reasons for
using an automotive registration tax and a CBD entry tax in the choice model as a
means of providing an option to reduce traffic congestion are explained.
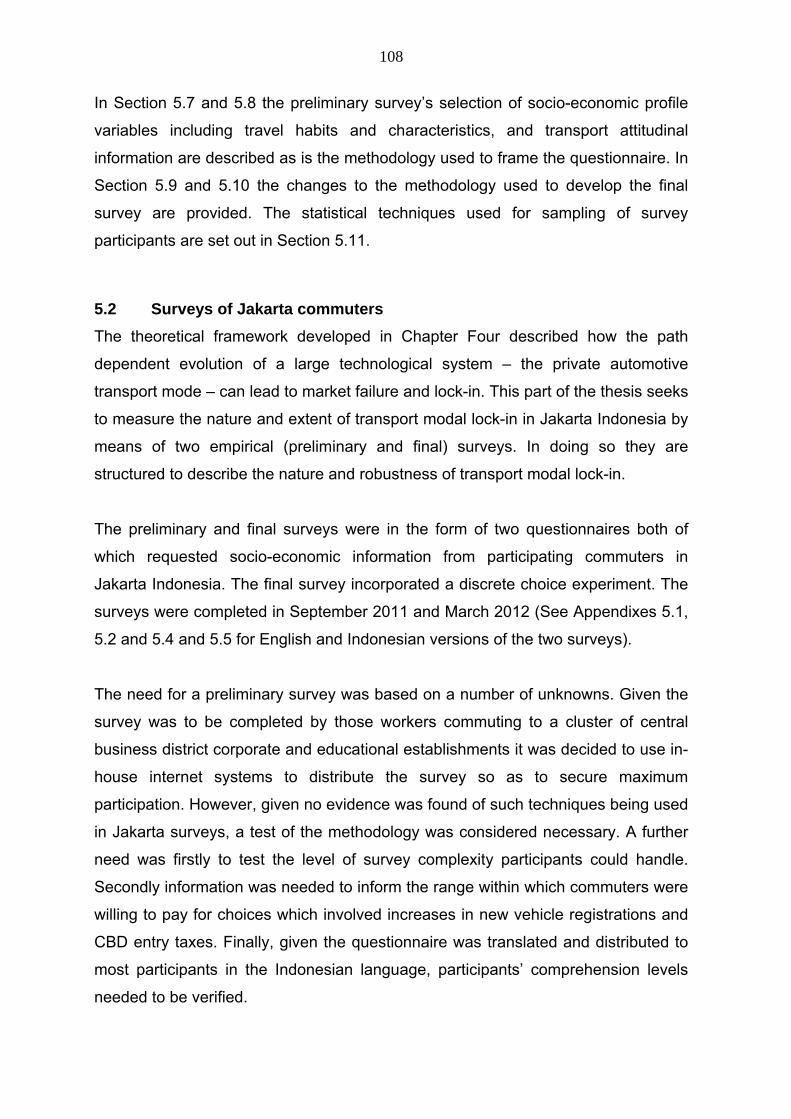
108
In Section 5.7 and 5.8 the preliminary survey’s selection of socio-economic profile
variables including travel habits and characteristics, and transport attitudinal
information are described as is the methodology used to frame the questionnaire. In
Section 5.9 and 5.10 the changes to the methodology used to develop the final
survey are provided. The statistical techniques used for sampling of survey
participants are set out in Section 5.11.
5.2 Surveys of Jakarta commuters
The theoretical framework developed in Chapter Four described how the path
dependent evolution of a large technological system – the private automotive
transport mode – can lead to market failure and lock-in. This part of the thesis seeks
to measure the nature and extent of transport modal lock-in in Jakarta Indonesia by
means of two empirical (preliminary and final) surveys. In doing so they are
structured to describe the nature and robustness of transport modal lock-in.
The preliminary and final surveys were in the form of two questionnaires both of
which requested socio-economic information from participating commuters in
Jakarta Indonesia. The final survey incorporated a discrete choice experiment. The
surveys were completed in September 2011 and March 2012 (See Appendixes 5.1,
5.2 and 5.4 and 5.5 for English and Indonesian versions of the two surveys).
The need for a preliminary survey was based on a number of unknowns. Given the
survey was to be completed by those workers commuting to a cluster of central
business district corporate and educational establishments it was decided to use in-
house internet systems to distribute the survey so as to secure maximum
participation. However, given no evidence was found of such techniques being used
in Jakarta surveys, a test of the methodology was considered necessary. A further
need was firstly to test the level of survey complexity participants could handle.
Secondly information was needed to inform the range within which commuters were
willing to pay for choices which involved increases in new vehicle registrations and
CBD entry taxes. Finally, given the questionnaire was translated and distributed to
most participants in the Indonesian language, participants’ comprehension levels
needed to be verified.
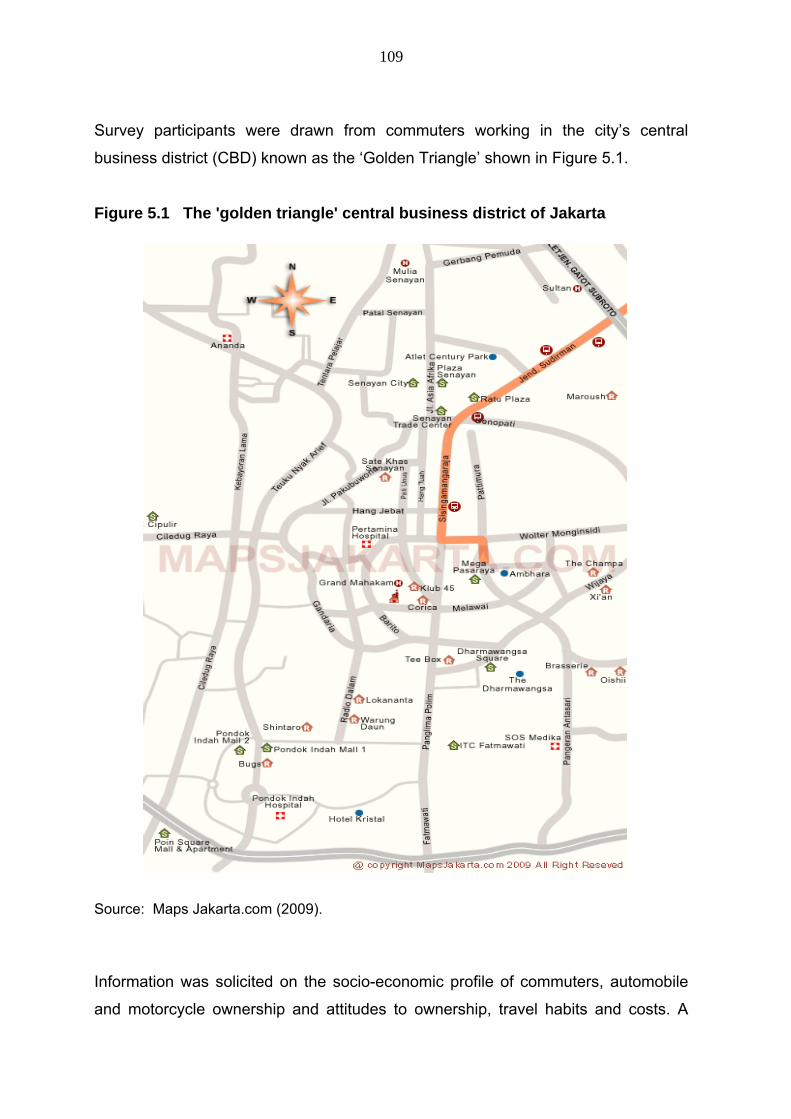
109
Survey participants were drawn from commuters working in the city’s central
business district (CBD) known as the ‘Golden Triangle’ shown in Figure 5.1.
Figure 5.1 The 'golden triangle' central business district of Jakarta
Source: Maps Jakarta.com (2009).
Information was solicited on the socio-economic profile of commuters, automobile
and motorcycle ownership and attitudes to ownership, travel habits and costs. A
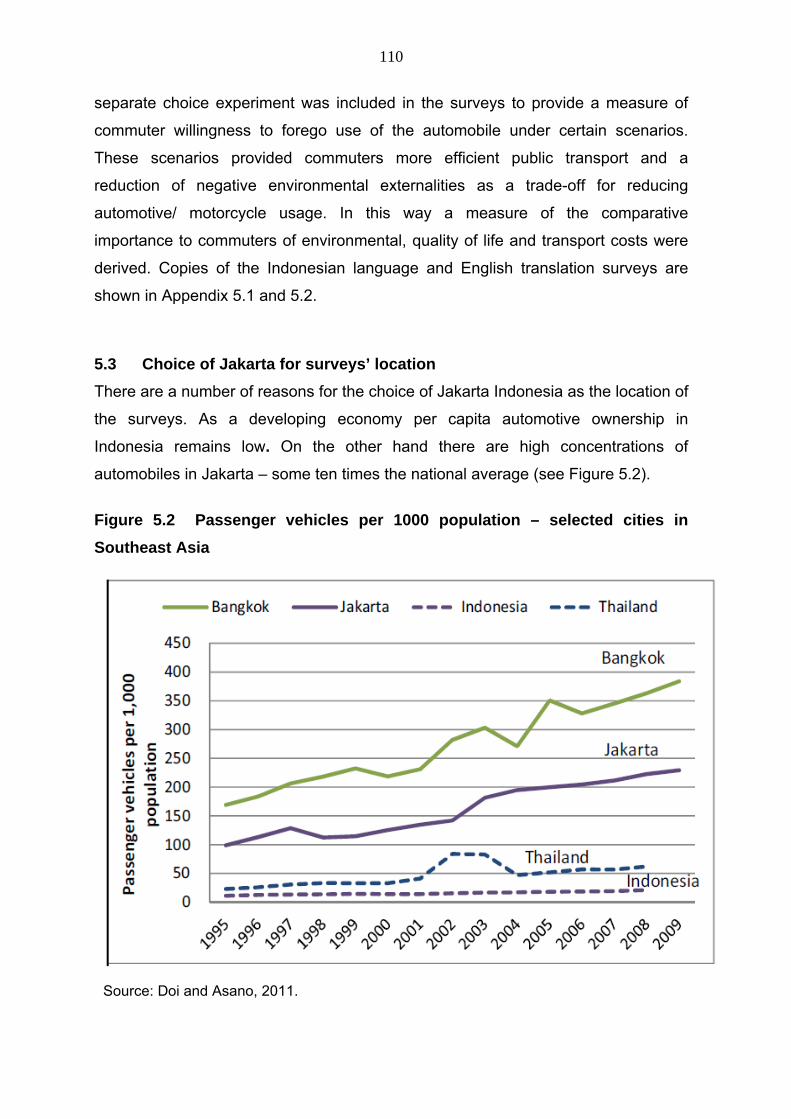
110
separate choice experiment was included in the surveys to provide a measure of
commuter willingness to forego use of the automobile under certain scenarios.
These scenarios provided commuters more efficient public transport and a
reduction of negative environmental externalities as a trade-off for reducing
automotive/ motorcycle usage. In this way a measure of the comparative
importance to commuters of environmental, quality of life and transport costs were
derived. Copies of the Indonesian language and English translation surveys are
shown in Appendix 5.1 and 5.2.
5.3 Choice of Jakarta for surveys’ location
There are a number of reasons for the choice of Jakarta Indonesia as the location of
the surveys. As a developing economy per capita automotive ownership in
Indonesia remains low. On the other hand there are high concentrations of
automobiles in Jakarta – some ten times the national average (see Figure 5.2).
Figure 5.2 Passenger vehicles per 1000 population – selected cities in
Southeast Asia
Source: Doi and Asano, 2011.
111
Per capita GDP levels for Indonesia as a whole is around $US3400 (BPS, 2012,
figures) although in Jakarta it is considerably higher at approximately $US10,000.
Thus while national per capita income is below the high growth automotive takeoff
level of $US3-5000 identified by Dargay et al. (2007), Jakarta’s considerably greater
average per capita wealth puts it well above the accepted threshold.
According to the 2010 census the population of Jakarta’s inner region – the Daerah
Khusus Ibukota Jakarta (DKI) – was 9.58 million (see Figure 5.3). Administratively it
has the status of a province headed by a Governor. Of its five municipalities the
CBD (Jakarta Pusat) houses the major commercial sector with a residential
population of around 900,000.
Figure 5.3 Daerah Khusus Ibukota Jakarta (DKI)
Source: DKI Jakarta, 2014
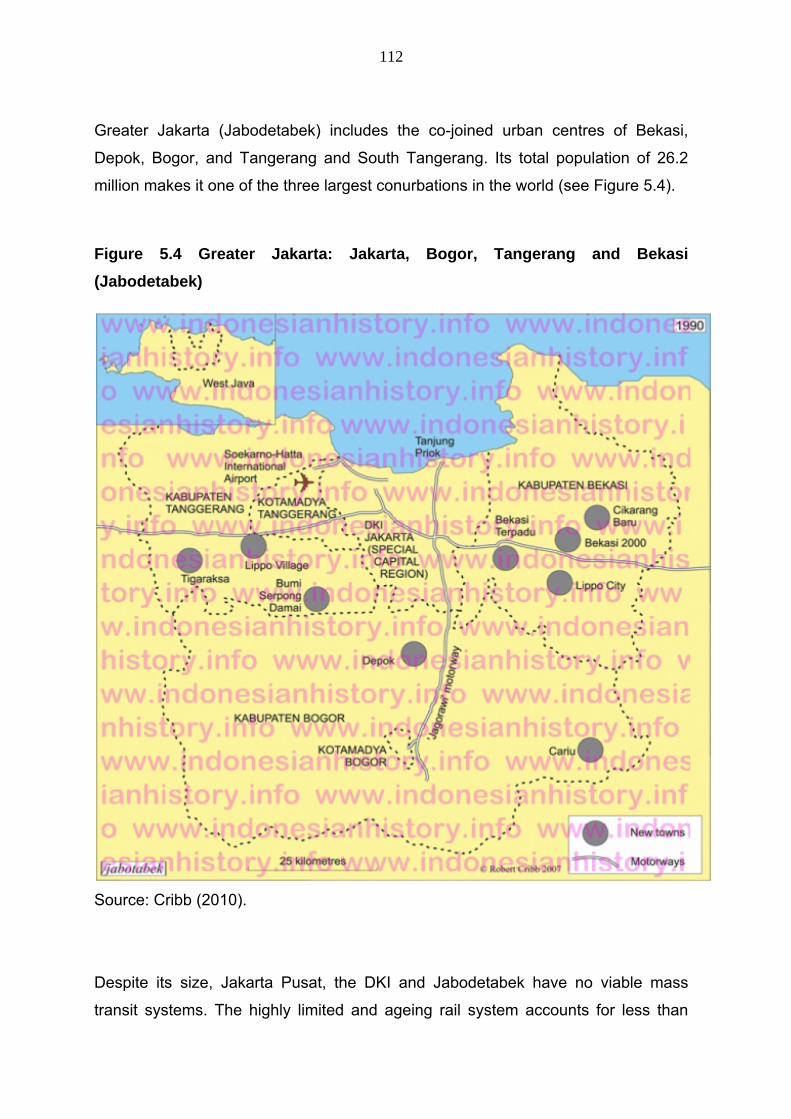
112
Greater Jakarta (Jabodetabek) includes the co-joined urban centres of Bekasi,
Depok, Bogor, and Tangerang and South Tangerang. Its total population of 26.2
million makes it one of the three largest conurbations in the world (see Figure 5.4).
Figure 5.4 Greater Jakarta: Jakarta, Bogor, Tangerang and Bekasi
(Jabodetabek)
Source: Cribb (2010).
Despite its size, Jakarta Pusat, the DKI and Jabodetabek have no viable mass
transit systems. The highly limited and ageing rail system accounts for less than
113
1.5% of trips and the new rapid transit bus carries a similarly small percentage.
Given the high dependence on cars, motorcycles and small scale regionalised
buses, transport induced air pollution accounts for 70% of the total (Resosudarmo,
and Napuitapulu, 2004). By 2004 the World Health Organisation (WHO) had ranked
Jakarta as the world’s third most polluted city (Setiawati, 2009) and it currently
remains in the top echelon globally of polluted conurbations.
While Jakarta is but one of a number of similarly polluted and congested
conurbations in Asia – e.g. Beijing, Bangkok, Kuala Lumpur – Jakarta was chosen
given the author’s past familiarity with Jakarta, his knowledge of the language and a
network of existing academic and government contacts.
5.4 Use of choice modelling
As discussed in Chapter Two, in the development of transport modal lock-in
externalities play a crucial role (see, for example, Unruh, 2000; Berkhout, 2002).
However, as non-market goods, measuring the value of externalities cannot be
effected using conventional market pricing tools. Developing a means to do so is,
therefore, needed if the extent of transport modal lock-in and the means needed to
effect its reversal is to be given precision. The economic literature provides a
number of avenues including revealed preference and stated preference
techniques. The former, introduced by Samuelson (1939) relied on using the value
of expenditure to "reveal" the preference of a consumer or group of consumers for a
bundle of goods they purchase compared to other bundles of equal or smaller
value. However, in the absence of associated market price data such techniques
proved problematic.
More recently as economists became preoccupied with valuing non market and in
particular environmental goods, the stated preference methodology was developed.
This is based on the work by Ciriacy-Wantrup (1947) and first applied by Davis
(1963) in the early 1960s who developed the contingent valuation approach. This
involved asking people directly through surveys how much they would be willing to
pay for specific environmental services rather than inferring from actual choices.
Thus those surveyed were asked to state their willingness to pay, contingent on a
114
specific hypothetical scenario and description of the environmental service rather
than inferring values from actual choices as used in revealed preference
methodology.
Contingent valuation methodology has been shown to be prone to bias (see, for
example, Diamond and Houseman, 1994; Cummings et al., 1997; List et al., 2004).
List et al. (2006) pointed out that the U.S.A. National Oceanic and Atmospheric
Administration (NOAA) recommended hypothetical bids be deflated using a ‘divide
by 2 rule’ unless they could be calibrated by real market data. Contingent valuation
methods have also been criticised for presenting all or nothing choices given the
questions can only deal with gaining or losing the good as a whole.
An alternative stated preference methodology – discrete choice – was developed
from Lancaster’s (1966) insights which described consumers’ consumption of goods
in terms of the attributes they provided. Discrete choice combined Lancaster’s
characteristics theory with McFadden’s (1974a) random utility theory which
demonstrated the way in which a choice between alternatives was a function of
relative utilities. In a typical survey, therefore, participants are asked to choose their
preferred alternative from a sequence of grouped options which collectively create a
hypothetical scenario in which market attributes (e.g. environmental attributes) form
part. A particular choice will, therefore, imply a higher utility is attached to it relative
to other alternatives listing the same attributes but with differing values (Hensher,
1981).
The advantage of the discrete choice methodology – and in particular for this thesis
research – firstly lies in its ability to allow those surveyed to choose between
alternatives that are described by attributes of the good. Secondly, in providing
choices between alternatives, the contingent valuation method’s all or nothing
offering is avoided (List et al., 2006).
Hensher (1994) noted that by the early 1990s the stated discrete choice technique
of surveying had become the most popular methodology in transportation studies.
This growing preference can be sourced to path finding transport surveys by
Louviere and Hensher (1983) and Louviere and Woodsworth (1983). More recently
115
such studies have been used to measure a range of variables such as travel time
valuations (Park and Hun-Koo-Ha, 2005), modal preferences and travel demand
estimation and management (Garrod et al., 2002; and Koundouri et al., 2012).
The thesis preliminary survey was developed to indicate the scope of commuter
socio-economic information available. Additionally a number of methodological
practices relating to the discrete choice experiment were tested in the preliminary
survey. Verification was sought of survey participants’ capacity to make choices
which involved trade-off of options. Specifically they incorporated variables which
collectively provided a measure of the future direct and indirect costs of transport
modal lock-in (over a five year time frame) on the one hand, and improved public
transport, lower congestion, and better environmental outcomes on the other. Also
to be tested were the modalities of using the internet to distribute and complete the
survey. Although now widely used in developed country settings (Fleming and
Bowden, 2009) a literature search did not reveal the used of academic internet
based surveys in studies conducted in developing countries, such as Indonesia.
Untested, therefore, was individuals’ willingness to participate in an on-line web
based surveys and whether corporate management and employees would willingly
participate if such a study was conducted via the workplace.
Finally, to be trialled and justified in the preliminary survey were the specific
attributes be used to measure choice preferences. The reasoning for the choice of
these attributes is discussed below.
5.4.1 Preliminary survey: choice model attributes
Commuters’ choices were hypothesised to be affected by primarily the level of
congestion with preferences attached to its reduction. A number of other
preferences were included in the choice set based on the socio-economic data
gathered in the preliminary survey. The use of a cross section of socio-economic
variables is common in choice experiments (see, for example, Cowan and Hulten,
1996; Alpizar and Carlsson, 2001; Unruh, 2002; Pucher et al., 2007; Suyro et al.,
2007; Barter, 2004).
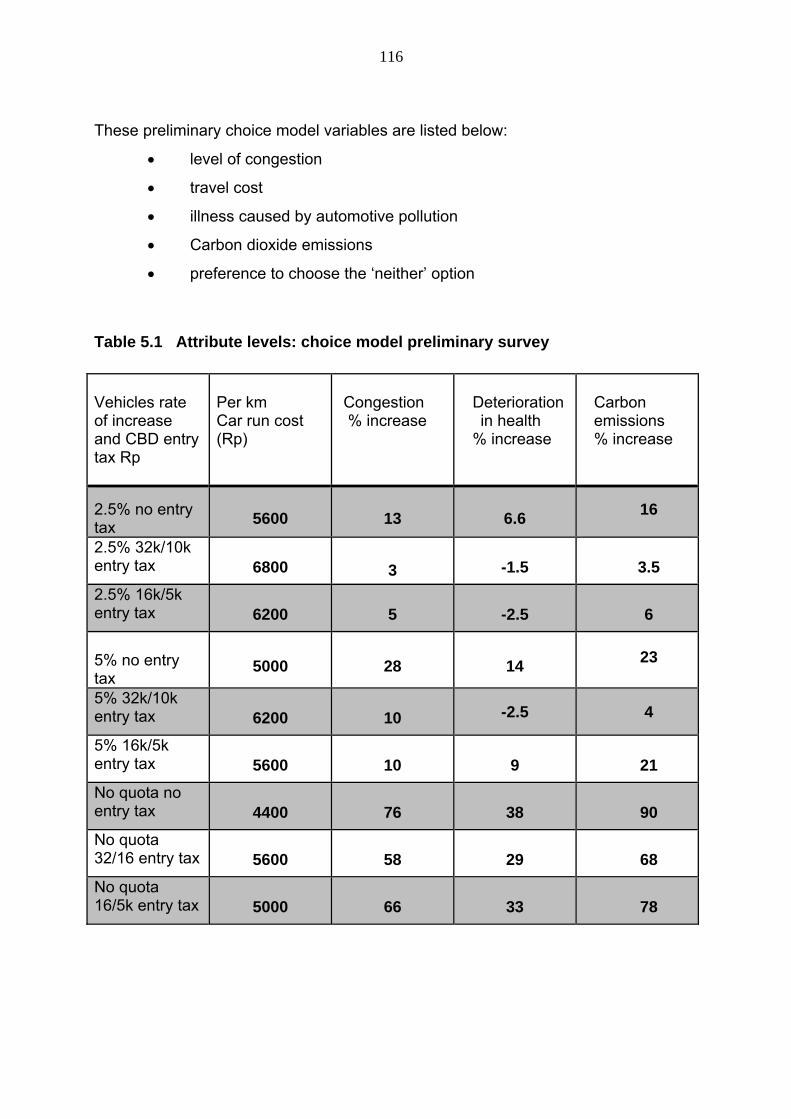
116
These preliminary choice model variables are listed below:
level of congestion
travel cost
illness caused by automotive pollution
Carbon dioxide emissions
preference to choose the ‘neither’ option
Table 5.1 Attribute levels: choice model preliminary survey
Vehicles rate of increase and CBD entry tax Rp
Per km Car run cost (Rp)
Congestion % increase
Health Deterioration i in health % increase % increase
Carbon emissions % increase
2.5% no entry tax
5600
13
6.6
16
2.5% 32k/10k entry tax
6800
3
-1.5
3.5
2.5% 16k/5k entry tax
6200
5
-2.5
6
5% no entry tax
5000
28
14
23
5% 32k/10k entry tax
6200
10 -2.5 4
5% 16k/5k entry tax
5600
10
9
21
No quota no entry tax
4400
76
38
90
No quota 32/16 entry tax
5600
58
29
68
No quota 16/5k entry tax
5000
66
33
78
117
The attribute variable levels and values are set out in Table 5.1. As indicated, for
the preliminary survey the CBD entry tax was set at two alternative levels of
Rp32,000 and Rp10,000 and Rp16,000 and Rp5000 for cars and motor cycles
respectively as well as a neither option which equated to no tax. The levels were
designed to produce similar reductions in vehicle numbers (with lower values for
motorcyclists allowing for lower wage79 and running vehicle running costs). All
combinations of the taxes were then included in the choice sets providing 28
different sets. Each participant was provided four pages with three options one of
which was the neither option.
5.4.2 Preliminary survey: level of congestion
Using sets of choices derived from the alternatives provided in Table 5.1 commuter
responses were elicited in the form of stated preference data (List et al., 2006). The
choice sets provided scenarios proposing varying permissible annual rates of
increase in congestion as measured by combinations of caps on increased motor
vehicle registrations and of CBD entry taxes. Such schemes to limit ownership and
private vehicle usage are used in a number of cities. Singapore uses an auction
scheme to limit the increase in motor vehicle registrations to around 2-4% annually
(Statistics Singapore, 2012) producing an effective tax on new cars which is one of
the highest in the world (Chin and Smith, 1997). This has been married to a CBD
entry tax the net effect of which has been to hold Singapore’s automotive ownership
at around 120 per capita – around one quarter that of countries with comparable per
capita incomes.
Shanghai introduced a registration auction scheme similar to that of Singapore’s in
1994 so that by 2008 its per capita passenger car ownership stood at around 42 per
1000 compared to Beijing’s 145 (Doi and Asano, 2011). Beijing followed Shanghai
in introducing a registration auction system in 2011. London was one of the first
major cities to introduce a CDB entry tax scheme in the early 1990s which
succeeded in reducing traffic flow into the CBD by around 22% (Evans, 2007;
Santos, 2008).
79 Suryo et al. (2007) in their choice survey of commuters found that motorcyclists’ average income to be 60% lower than that of those using cars.
118
Drawing on the examples of Shanghai and Singapore the preliminary survey’s
discrete choice experiment incorporated two hypothetical levels of annual allowable
registration increase of 2.5% and 5%. A neither option was included which equated
to no restrictions on registration increases. The levels applied were derived from the
application of similar taxes in London and Singapore. In the latter case the tax when
first applied in 1974 (at which time it was the first major city globally to do so) a
monthly pass equated to around 14% of average wages per month and produced a
44% reduction in CBD traffic volume (Holland and Watson, 1978). Studies of the UK
congestion tax on the other hand show a reduction of 17% of traffic flows into the
CBD when a 5 pound CBD entry tax was introduced in 2003 (Evans, 2007). A
further 60% increase in the entry tax to 8 pounds in 2005 produced only a 2%
further reduction in traffic flow.
The demand elasticities applicable to the CBD entry tax used in the preliminary
survey’s choice questionnaire are based on the London and Singapore models
although the values adopted are closer to the more conservative London figures.
The 5 pound entry tax – around 14% of the daily wage of salaried UK employees
(UK Transport for London, 2011) – equated to a 17% reduction in traffic volume and
a further 2% when raised to 8 pounds80. The adopted hypothetical Jakarta CBD
entry tax of Rp32,000 is roughly equivalent (as a percentage of daily salary of
Jakarta commuters if a monthly average salary of Rp8 million is assumed) to that of
the UK salary earners when the CBD tax was introduced. However, on the basis
that lower average wages in Indonesia would produce a somewhat lower capacity
to pay, a Rp32,000 entry tax was assumed to reduce traffic volume to the Jakarta
CBD by a higher level of around 20%.
The CBD entry tax was set at two alternative levels of Rp32,000 and Rp10,000 and
Rp16,000 and Rp5000 for cars and motor cycles respectively as well as a ‘neither’
option which equated to no tax. The levels were designed to produce similar
80 Suryo et al. (2007) in their choice survey of commuters found that motorcyclists’ average income to be 60% lower than that of those using cars. The reduced rate in the fall of congestion is attributed to the initial tax eliminating most drivers with highly elastic demand for commuting by car. Holland and Watson (1978) note that for Singapore part of the explanation for the dramatic fall in congestion relates to the ready availability of public transport alternatives and increased parking fees.
119
reductions in vehicle numbers (with lower values for motorcyclists allowing for lower
wage81 and vehicle running costs). All combinations of the taxes were then included
in the choice sets providing 28 different sets. Each participant was provided four
sets82 which contained three options one of which was the neither option. For each
level of congestion reduction comparable levels of explanatory variables are shown
in table 5.1.
5.4.3 Preliminary survey: environmental issues
The cost of congestion has been estimated by the Jakarta Transport Office at
around Rp9 billion made up of Rp3 billion in vehicle operating costs; Rp2.5 billion in
time lost and Rp2.8 billion in health costs (Sutomo et al., 2007). A World Bank
Study (1994) put the cost of pollution in Jakarta at $US500 million annually – 70%
of which comes from road transport. Other estimates put the costs of congestion
much higher – at Rp26 trillion ($US2.8 billion) including gasoline costs of Rp10.7
trillion, productive time lost of Rp9.7 trillion and health costs of about Rp5.8 trillion
(Jakarta Globe, 2009). Duki et al. (2003) estimate from their study the total cost of
air pollution in Jakarta to be around $US180 million, with transport accounting for
around 70% of total pollution.
A number of studies have called into question Maslow’s (1954) hierarchy of needs
theory of human motivation which suggests that individuals in developing countries
may not have the luxury of pursuing environmental agendas given the tradeoffs are
less affordable. Dunlap and Merteg (1995) examine a Health of the Planet Survey
conducted by the George H. Gallup Institute in 6 low, 7 medium and 11 high income
countries. The question seeking the respondents’ level of personal concern about
the environment produced a negative correlation to GNP per capita indicating a
higher level of concern in developing than developed countries. The survey similarly
indicates a greater level of concern by developing country respondents about
national quality of environmental management and the health effects of
environmental pollution. Even where those surveyed were asked about trading off
81 Suryo et al. (2007) in their choice survey of commuters found that motorcyclists’ average income to be 60% lower than that of those using cars. 82 Each participant was provided with four different sets – a process which was repeated sequentially for each 7 participants.
120
environmental protection for economic growth, majorities in 21 of the 24 countries
chose environmental protection. Pluralities in two others -India and Turkey – made
similar choices.
Brenchin and Kempton (1994) computed the relationship between the log per capita
GNP and two forms of willingness to pay for environmental quality – paying higher
taxes and volunteering two hours per week community work on behalf of the
environment. They found a modest but insignificant correlation between national
affluence and willingness to pay higher taxes but a highly significant negative
correlation between affluence and willingness to volunteer time. Payne’s (2007a)
analysis of data from the International Social Survey Program’s (ISSP) Environment
Survey II conducted in 2002 shows that the predicated probability of willingness to
cut standards of living to protect the environment among U.S. residents was less
than in a number of developing countries (30% were either willing or very willing in
the U.S.A., 34% in the Philippines and over 50% in Mexico).
Shen et al. (2009) in a study of modal choice in Japan used a stated preference
experiment to examine whether environmental issues affected modal choices
between monorail, cars and buses. They found an increased environmental impact
of 50% from a transport mode (monorail) would reduce its usage from between 1%
and 6% depending on passengers’ level of education and their profession (e.g.
higher levels of education rate higher sensitivity to environmental issues).
5.4.3.1 Preliminary survey: environmental issues: carbon dioxide
Calculations of the attribute values for carbon dioxide emissions were based in part
on studies which indicated automotive carbon emissions are sensitive to traffic
speed (Asri and Hidayat, 2005). An analysis of the ratio of traffic volume to speed in
Jakarta (Japan International Cooperation Agency (JICA) and the Indonesian
National Planning and Development Agency (BAPPENAS), 2001, 2004) estimated
the average traffic speed in Jakarta to be around 13 km per hour. For every km per
hour reduction in speed there was shown to be a 9% increase in CO2 output. Other
studies (Evans, 2007) show that for every percentage drop in congestion traffic
speed increased at roughly the same rate. Given that increases in CO2 output is
121
roughly proportional to overall fuel usage the overall increase in CO2 was able to be
computed for a given increase in traffic volume.
5.4.3.2 Preliminary survey: environmental issues: health
Studies by Resosudarmo and Napitulupu (2004) show the cost of health care due to
pollution is increasing at around 14% annually. Given it is estimated automotive
transport accounts for around 70% of Jakarta’s pollution, the increase over five
years (to 2015) can be put at 90%. Resosudarmo and Napitulupu show that the key
pollutants affecting health (in this case particulate matter largely from diesel fuel and
sulpur dioxide (SO2)) are increasing at a rate of 5.5% annually. On this basis an
unrestricted increase in car numbers would produce a 37% deterioration in health
and pro-rata smaller deteriorations for lower level increases as shown in Table 5.1.
5.4.4 Preliminary survey: automotive travel costs
The cost per km is computed along the lines of accepted industry depreciation
schedules (Small Business Taxes & Management, 2012). Thus the cost of
depreciation of a compact car of less than 1600 cc is spread over a 10 year period
and assumes travel of 10,000 km per annum. Running costs and fuel costs are also
included as is the average cost of registration83.
5.4.5 Preliminary survey: choice set neither option
The third ‘neither’ alternative provided participants the option not to choose either of
the first two choices. As such it represented an option to do nothing. This was
equated to an acceptance of ‘business as usual’ and therefore a continuation of the
past average increases of motor vehicles in Jakarta of 12% per annum. This was
based on the rate of increase derived from historical data over the past 20 years
(Mochtar and Hino, 2006; Sutomo et al., 2007) which showed an average 15%
increase in motor vehicles numbers in Jakarta. Current annual increases are,
however, volatile (Susilo, et al., 2007) and a more conservative figure was,
83 The cost per km is based on a Jakarta transport study by Suryo et al. (2007) who calculated per km automotive running costs on the basis that the car averages 680km per month or 22.5km per day at an adjusted for inflation cost of Rp28,000 which equates to Rp1,314. Depreciation is estimated for a typical compact Avanza model (one of the most popular in Indonesia) costing Rp140,000,000 over 10 years averaging Rp2,4000,000 pa.
122
therefore, adopted given the 5 year time frame. For each choice the cumulative
effect is shown over a 5 year period in terms of changes in the level of traffic
congestion, GHG emissions and pollution related health effects.
The levels of increase for registrations followed the Singapore model which sets
auction prices at levels which allow increases of around 2% – 5% per annum
(Statistics Singapore, 2012). Thus a 2.5% increase in registrations produces a
compound 5 year increase of 13% and 28% if a 5% increase is allowed. For the
business as usual scenario the compound 5 year 12% pa increase totals 76%. The
estimated increase in the cost of registration for the 2.5% and 5% levels is shown in
each choice option as Rp90 million and Rp45 million for cars and Rp13.5 million
and Rp6.75 million for motorcycles respectively. The assumed price elasticity is
derived from the prices paid for Certificates of Entitlements (COEs) in Singapore for
small cars of less than 1600 engine displacements and motorcycles (Ministry of
Transport Singapore, 2012). The price levels were reduced proportionately to reflect
lower salaries in Jakarta compared to Singapore (around one quarter) 84 producing
a RP90-10 million equivalent COE.
The choice questionnaire in this form equates to a dose-response discrete choice
experiment which has been commonly used in medical literature (see, for example,
King et al., 2007; McTaggart-Cowan et al., 2008). The literature on transport
economics also provides the basis for calculating the effects of lowering automotive
usage. Romilly (1999) in his analysis of the substitution of automobiles for buses in
London measures this switch in terms of improvements in environmental health and
reduced CO2 emissions.
Pairing of different allowable registration levels and CBD entry tax produced 28
different combinations, allowing for seven sets of choice questionnaires to be
created. They comprised four separate question sets which contained alternatives 1
and 2 and a third ‘neither’ option. In this way each set contained unique paring
84 This is based on pre- survey estimates of an average monthly income of Rp8 million for Jakarta commuters and monthly average salary for Singaporeans of $A2,370 (Singapore Ministry of Manpower, Singapore, 2012).
123
combinations. In the subsequent final survey however a greatly simplified choice
questionnaire was used and required a different combination of sets.
5.4.6 Preliminary survey: socio-economic profiling attributes
For Jakarta a majority of studies correlating transport modes and socio-economic
profiles use the landmark survey of 166,000 households in the Jakarta metropolitan
area funded by JICA and BAPPENAS (2001, 2004) for the purpose of developing
an Integrated Transport Master Plan. Data from this survey also includes a travel
diary survey of 4000 randomly selected participants in the household survey.
Suyro et al.’s (2007) analysis used JICA data to measure the role of age, gender,
income, comfort and safety and education in determining modal change from bus to
car. The strongest influences on modal change are shown to be lengthening travel
times and higher incomes. From the analysis a time valuation is calculated for both
car owners and motorcyclists who put the travel time valuation at 21% and 14% of
income respectively. A hypothetical congestion tax is then applied at three levels
representing 19%, 22% and 25% of travel costs for car and motorcyclists. The
outcomes show that the modal switching influence (to bus transport) of the
congestion tax produces net increases in utility of 21%, 26% and 13% (low, medium
and high income groups) and an average of 21%. Trip utility rises from an average
of Rp12,500 to Rp15,200. Suryo et al. (2007) also estimate correlations between
modal choice of bus travel and car and motorcycle alternatives which suggest
strong relationships between income and travel costs as well as wage and time
travelled. However methodological inconsistencies need to be overcome before
these results can be verified.
An analysis of JICA survey data was carried out by Yagi and Mohommadian (2008)
using the eight most common transport modes and eleven representative
destinations. The modelling indicated that income was the major determinant of
mode with use of the automobile rising with income and use of motorcycles falling.
Non-motorised transport rose in lower income groups while a commuting allowance
by employers increased car usage.
124
In the light of the above studies the following data was collected from commuters in
the preliminary survey:
a. Married or partnered (binary) lifestyle indicator and indicator of daily
travel frequency and pattern
b. Number of children /single (open scale)
c. Income (four ranges – lower and top truncated)
d. Age (four ranges – lower and top truncated)
e. Education level (3 categories – completed secondary /current tertiary
/completed tertiary)
f. Profession (categories – business managerial /business clerical
/public servant/clerical /manual and trades)
A further set of questions relating to travel habits of interviewees was included
together with questions on residential proximity to work, commuting mode choice,
and auto ownership (the full sets of survey questions in English and Indonesian
languages are at Appendix 5.1 and 5.2 respectively). This information was used to
develop behavioural profiles of commuters including attitudes to:
The motivations for purchasing or intentions to purchase automobiles
The extent and relative weighting of public concern about
environmental issues in comparison to other issues
The extent to which indirect environmental costs are recognised
by commuters
Commuters were provided an explanatory introduction to the choice experiment as
follows:
“This following are a set of choices which you are being asked to select between.
They do not represent any actual laws or taxes. The choices involve placing a limit
on the increase in the number of cars allowed in Jakarta each year for a period of
125
five years – through to 2015. The limits are 2.5% annual increase and 5% annual
increase. It is assumed if you chose not to place a limit then the number of cars will
continue to increase at the current rate of 12% per year over the next five years.
The choices also involve the option to pay a congestion tax to enter the Jakarta
CBD where you work. There are two levels of tax for both cars and motorcycles –
Rp16,000/Rp5,000; Rp32,600/Rp10,00 respectively.
Each set of choices which you are given involve choosing between a combination of
tax levels and allowable increases in car numbers. You can choose ‘neither’ which
is shown here as ‘No cap on registrations and no entry tax’.
For each choice there are different consequences. These are the cumulative
consequences over a five year period during which the taxes and restrictions on car
numbers are applied. The choices therefore show the cumulative five year increase
(or decrease) of:
The cost of driving a car per kilometre
The level of congestion
The level of ill health due to transport pollution
The level of GHG of transport vehicles
The proposed system to limit car numbers is similar to that currently in use in a
number of cities in other countries such as Singapore, Shanghai and London. Under
this system Jakarta residents would have to bid at auction each year for a
predetermined number of car registration permits which are valid for 10 years. It is
assumed for example that the cost of a compact car would rise in price by
approximately 35% if registrations were limited to an annual increase of 2.5%. The
increase in registration costs is included in the per kilometre cost of driving a car
shown in the choice provided.
It is assumed that revenues earned from the higher registration fees and CBD entry
taxes are used to fund improved public transport.”
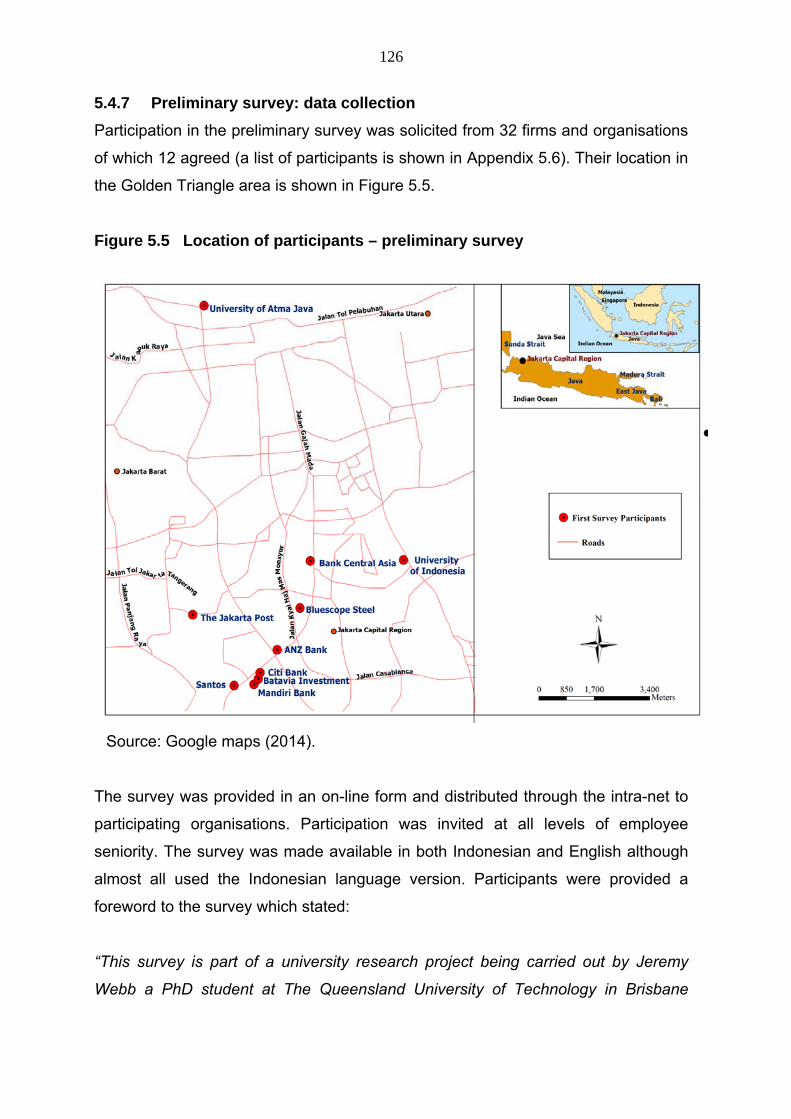
126
5.4.7 Preliminary survey: data collection
Participation in the preliminary survey was solicited from 32 firms and organisations
of which 12 agreed (a list of participants is shown in Appendix 5.6). Their location in
the Golden Triangle area is shown in Figure 5.5.
Figure 5.5 Location of participants – preliminary survey
Source: Google maps (2014).
The survey was provided in an on-line form and distributed through the intra-net to
participating organisations. Participation was invited at all levels of employee
seniority. The survey was made available in both Indonesian and English although
almost all used the Indonesian language version. Participants were provided a
foreword to the survey which stated:
“This survey is part of a university research project being carried out by Jeremy
Webb a PhD student at The Queensland University of Technology in Brisbane

127
Australia. The research is concerned with how urban transport systems develop in
large urban areas and is designed to examine way of improving the future design of
traffic systems.
The survey is not in any way connected with any government authorities in Australia
or Indonesia and is wholly funded by the Queensland University of Technology in
Australia.
The questionnaire is confidential and your response will only be recorded
numerically in the data gathered. Information about yourselves is therefore never
revealed to others and is only used in the research to create an overall profile of a
representative sample of those who commute to work on a regular basis. Anonymity
is assured.”
To collate the responses participants were either provided the email address of the
author or an in-office email address. They were informed by managements that the
survey was being carried out with its agreement, that is was voluntary, confidential
and could be completed during working hours. In all the surveys the author’s email
address was provided for any queries or clarifications. Some 90% of employees
received the survey as a message on their work email system. Ten percent
received the survey in hard copy from their supervisors (or in the case of students
from their teachers). The response rate for the emailed version was 15%. In light of
this low level and the high level of partially completed returns, a shorter paper
based version was distributed to participants in the final survey.
5.5 Final survey: design methodology
The content, design and methodology used to distribute the final survey drew
extensively from the outcomes of the preliminary survey. In particular data from the
latter provided input into the development of the choice model used in the final
survey by indicating the range of taxes participants were prepared to pay to achieve
128
specified levels of congestion reduction and externalities85. Comparable values
were, therefore, used in the choice experiment contained in the final survey.
The final survey’s method of delivery to participants was changed to printed
questionnaires given the difficulties encountered in the preliminary survey in
creating on line versions and in securing a reasonable response rate. Some 2000
people received the on line version of the preliminary questionnaire. However
numerous technical difficulties were encountered in customising the electronic
forms to office IT systems. From post survey interviews, the reason for the low
response rate and high incomplete response rate (only 174 out of 674 respondents
who returned surveys fully completed the choice questionnaire) was sourced firstly
to problems encountered with the length of the survey. The interviews also indicated
that the choice questionnaire’s tax scenario proved overly difficult to understand
resulting in either a considerable increase in the time taken to complete the survey
or incomplete questionnaires.
The final survey, therefore, incorporated an abbreviated socio-economic
questionnaire and a simplified choice model with randomised attribute values to
allow for WTP estimations (the full English and Indonesian language surveys are at
Appendices 5.4 and 5.5).
Seven variables were included in the choice set each of which consisted of three
choices. The variable level values are set out in Table 5.2.
85 Given the non-randomised value levels of the explanatory variables in the preliminary survey the choice experiment was not designed to produce willingness to pay values.
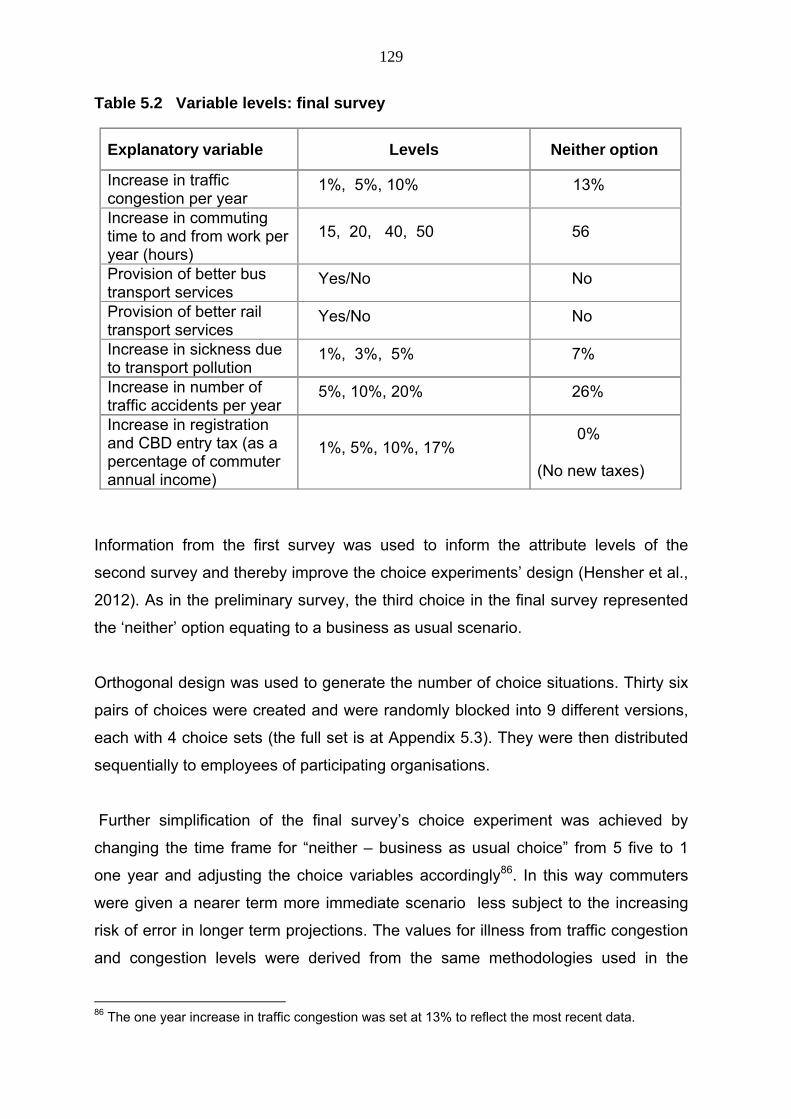
129
Table 5.2 Variable levels: final survey
Explanatory variable Levels Neither option
Increase in traffic congestion per year
1%, 5%, 10% 13%
Increase in commuting time to and from work per year (hours)
15, 20, 40, 50 56
Provision of better bus transport services
Yes/No No
Provision of better rail transport services
Yes/No No
Increase in sickness due to transport pollution
1%, 3%, 5% 7%
Increase in number of traffic accidents per year
5%, 10%, 20% 26%
Increase in registration and CBD entry tax (as a percentage of commuter annual income)
1%, 5%, 10%, 17%
0%
(No new taxes)
Information from the first survey was used to inform the attribute levels of the
second survey and thereby improve the choice experiments’ design (Hensher et al.,
2012). As in the preliminary survey, the third choice in the final survey represented
the ‘neither’ option equating to a business as usual scenario.
Orthogonal design was used to generate the number of choice situations. Thirty six
pairs of choices were created and were randomly blocked into 9 different versions,
each with 4 choice sets (the full set is at Appendix 5.3). They were then distributed
sequentially to employees of participating organisations.
Further simplification of the final survey’s choice experiment was achieved by
changing the time frame for “neither – business as usual choice” from 5 five to 1
one year and adjusting the choice variables accordingly86. In this way commuters
were given a nearer term more immediate scenario less subject to the increasing
risk of error in longer term projections. The values for illness from traffic congestion
and congestion levels were derived from the same methodologies used in the
86 The one year increase in traffic congestion was set at 13% to reflect the most recent data.
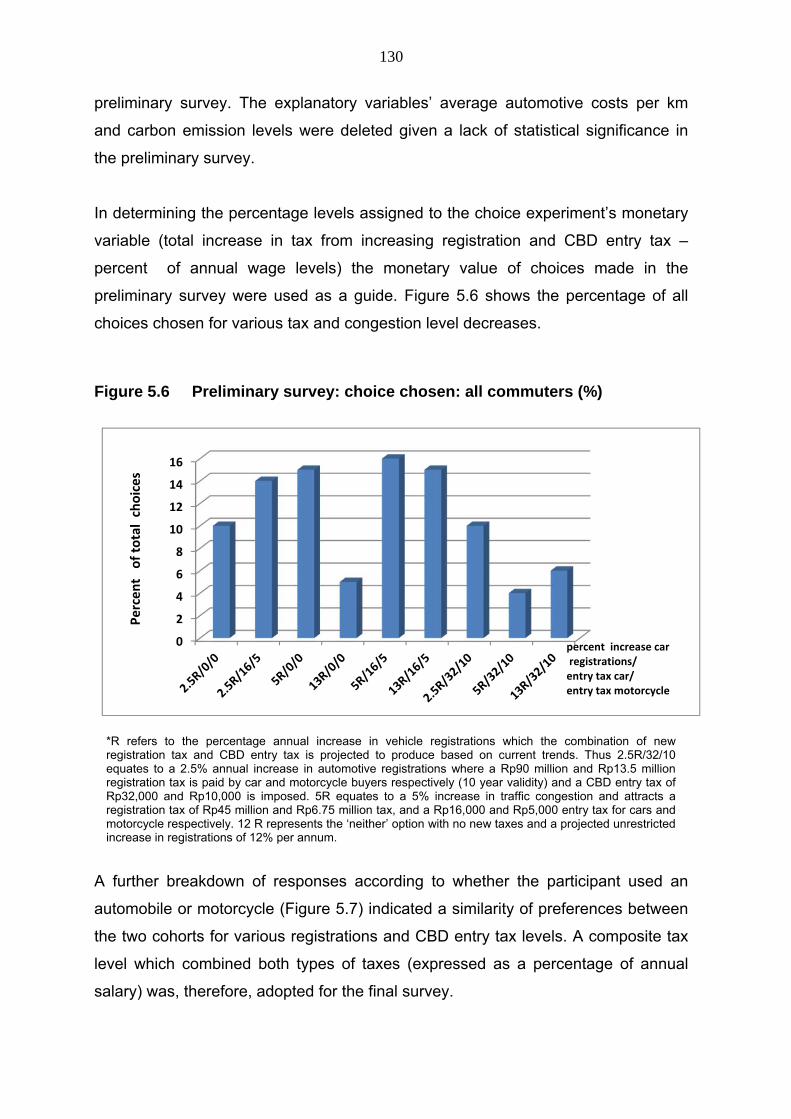
130
preliminary survey. The explanatory variables’ average automotive costs per km
and carbon emission levels were deleted given a lack of statistical significance in
the preliminary survey.
In determining the percentage levels assigned to the choice experiment’s monetary
variable (total increase in tax from increasing registration and CBD entry tax –
percent of annual wage levels) the monetary value of choices made in the
preliminary survey were used as a guide. Figure 5.6 shows the percentage of all
choices chosen for various tax and congestion level decreases.
Figure 5.6 Preliminary survey: choice chosen: all commuters (%)
*R refers to the percentage annual increase in vehicle registrations which the combination of new registration tax and CBD entry tax is projected to produce based on current trends. Thus 2.5R/32/10 equates to a 2.5% annual increase in automotive registrations where a Rp90 million and Rp13.5 million registration tax is paid by car and motorcycle buyers respectively (10 year validity) and a CBD entry tax of Rp32,000 and Rp10,000 is imposed. 5R equates to a 5% increase in traffic congestion and attracts a registration tax of Rp45 million and Rp6.75 million tax, and a Rp16,000 and Rp5,000 entry tax for cars and motorcycle respectively. 12 R represents the ‘neither’ option with no new taxes and a projected unrestricted increase in registrations of 12% per annum.
A further breakdown of responses according to whether the participant used an
automobile or motorcycle (Figure 5.7) indicated a similarity of preferences between
the two cohorts for various registrations and CBD entry tax levels. A composite tax
level which combined both types of taxes (expressed as a percentage of annual
salary) was, therefore, adopted for the final survey.
0
2
4
6
8
10
12
14
16
Percent of total choices
percent increase carregistrations/entry tax car/entry tax motorcycle
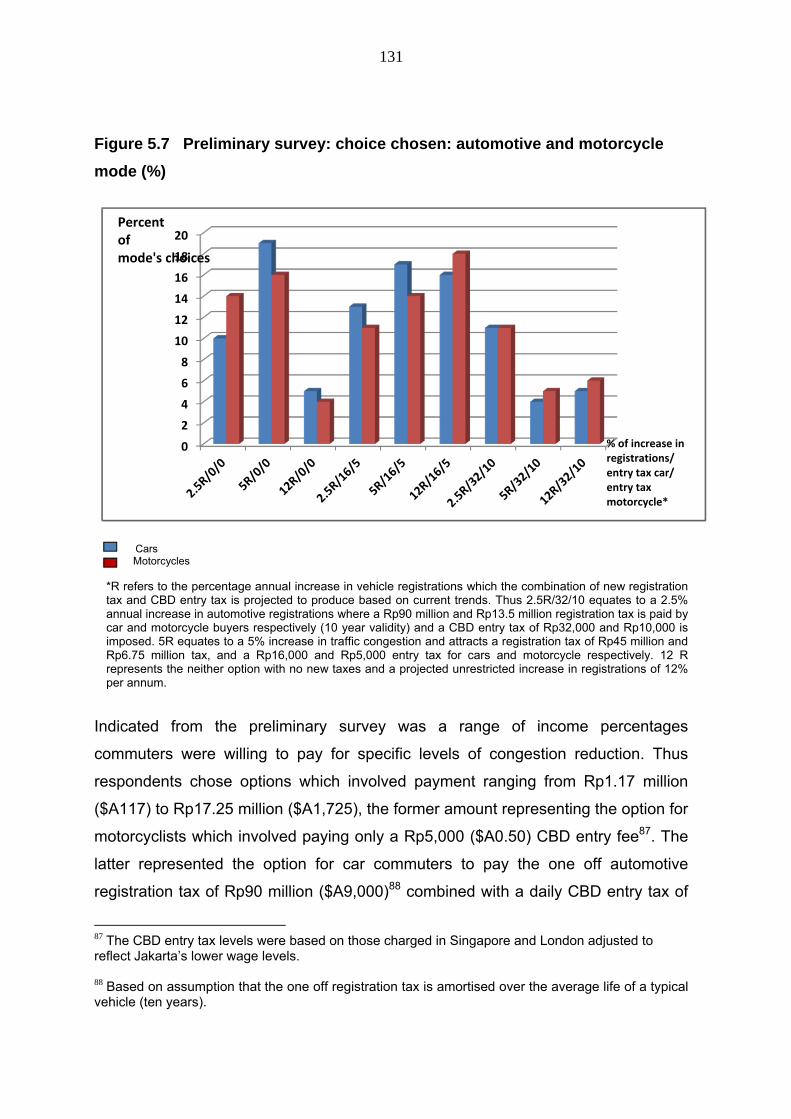
131
Figure 5.7 Preliminary survey: choice chosen: automotive and motorcycle
mode (%)
Cars Motorcycles
*R refers to the percentage annual increase in vehicle registrations which the combination of new registration tax and CBD entry tax is projected to produce based on current trends. Thus 2.5R/32/10 equates to a 2.5% annual increase in automotive registrations where a Rp90 million and Rp13.5 million registration tax is paid by car and motorcycle buyers respectively (10 year validity) and a CBD entry tax of Rp32,000 and Rp10,000 is imposed. 5R equates to a 5% increase in traffic congestion and attracts a registration tax of Rp45 million and Rp6.75 million tax, and a Rp16,000 and Rp5,000 entry tax for cars and motorcycle respectively. 12 R represents the neither option with no new taxes and a projected unrestricted increase in registrations of 12% per annum.
Indicated from the preliminary survey was a range of income percentages
commuters were willing to pay for specific levels of congestion reduction. Thus
respondents chose options which involved payment ranging from Rp1.17 million
($A117) to Rp17.25 million ($A1,725), the former amount representing the option for
motorcyclists which involved paying only a Rp5,000 ($A0.50) CBD entry fee87. The
latter represented the option for car commuters to pay the one off automotive
registration tax of Rp90 million ($A9,000)88 combined with a daily CBD entry tax of
87 The CBD entry tax levels were based on those charged in Singapore and London adjusted to reflect Jakarta’s lower wage levels. 88 Based on assumption that the one off registration tax is amortised over the average life of a typical vehicle (ten years).
0
2
4
6
8
10
12
14
16
18
20Percentof mode's choices
% of increase in registrations/entry tax car/entry taxmotorcycle*
132
Rp32,000 ($A3.20). Measured as a percentage of salary, motorists who chose a
Rp45 million automotive registration tax and Rp16,000 ($A1.60) CBD entry tax
committed 11% of their pay annually89.
These salary proportions were then used to inform calibration of the choice variable
in the final survey which requests commuters to indicate what percent of their
annual salary they would be willing to pay to reduce congestion. As a result of
feedback from the preliminary survey participants concerning the complexity of the
choice experiment, for the final survey the choice experiment’s monetary attribute
was simplified. The registration and entry tax were, therefore, combined into a
single undifferentiated figure accompanied by a simplified explanation preceding the
choice questionnaire as follows:
“In a number of cities such as Singapore, London and Shanghai it has been
demonstrated that imposing higher costs on motorists can be used to reduce traffic
congestion. They include placing a limit on the annual the increase in number of
automobiles and motorcycles by charging higher fees for their purchasing and/or
imposing an entry tax on commuters entering the central business district.
The following sets of choices represent examples of how a combination of these
higher fees on motorists could be used to help reduce traffic congestion in Jakarta
in the year ahead. Please keep in mind they are not actual government proposals
but are examples showing their effect on traffic congestion, pollution induced
sickness, and commuting times.
It is also important to understand that it is assumed revenues raised from the
additional charges are used entirely to improve public transport.
In choosing the option that you most prefer you must tick one and only one box for
each set and do so for each of the six sets provided. It is important you treat it as a
89 Based on an average monthly salary of participants recorded in the first survey of approximately Rp7 million per month.
133
real proposal and therefore carefully consider whether you can afford the tax shown
and whether the indicated benefits justify the added expenditure.
If you do not agree with either of the two options provided you should tick the
‘neither’ box (the last column on each page). This assumes you do not wish to pay
any new congestion taxes. This column therefore shows the increase in traffic
congestion, ill health, commuting times and road accidents based on the current
13% annual increase in vehicle registration”.
The decision to combine the registration fee and entry tax into a single monetary
value was adopted in the final survey given information on commuter preferences
between the two could be derived from the preliminary survey. Three new attributes
were added to the final survey. Two were binary in form and sought from
commuters preferences regarding improvements to, firstly, the bus system and
secondly the rail system. In this way a measure of commuters’ desire to switch
modes from private car and motorcycle to public transport was included in the
choice experiment. Also added was a further transport externality – traffic accidents
– given the evident high cost in developing countries where traffic management is
lax. The business as usual level was derived from DKI traffic accident data between
2008 and 201090.
The literature identifies a number of different possible methodologies for creating a
choice set (Bennett and Blamey, 2001) including a full factorial design in which all
possible combinations of the variables and their attribute levels are present. This
was not an option for the final survey given the relatively large number of attributes
and levels. A fraction factorial methodology was, therefore, preferred (Addleman,
1962) using an orthogonal design procedure (Kuhfeld et al., 1994) to ensure
minimal correlation between attributes, to minimise standard errors and maximise t-
90 Percentage increase derived from unpublished statistics for 2009 and 2011 collated by the Direktorat Lalu Lintas Polda Metropolitan Jakarta Rayahttp://www.tmcmetro.com/.
134
ratios (Hensher et al., 2005). While there are limitations attached to orthogonal
design (Scarpa and Rose, 2008) the much larger population size of the final survey
was sufficient to negate them.
5.5.1 Final survey: formatting of questions using Likert scale
Likert scales were used to assess reasons for owning or wishing to own a car or
motorcycle and views on how to solve traffic congestion. This avoided forcing
unqualified acceptance or rejection of statements and the possibility of neither
agreeing nor disagreeing (Gliem and Gliem, 2003). Equally, use of a Likert scale to
derive attitudes to environmental issues, importance of automobile and motorcycle
use, and reasons for intending to buy motor transport, allowed ranking among a
number of options and, therefore, provided a mean to assess the relative
importance between issues.
5.5.2 Final survey: survey sampling methodology and data collection
Participants were sourced from a number of businesses and organisations within
the golden triangle area of Jakarta’s central business district. In the final survey a
further 12 firms were randomly selected in the same region as the preliminary
survey (a full list of participating companies and organisations is in Appendix 5.7).
Their location in the Golden Triangle area is shown in Figure 5.8.
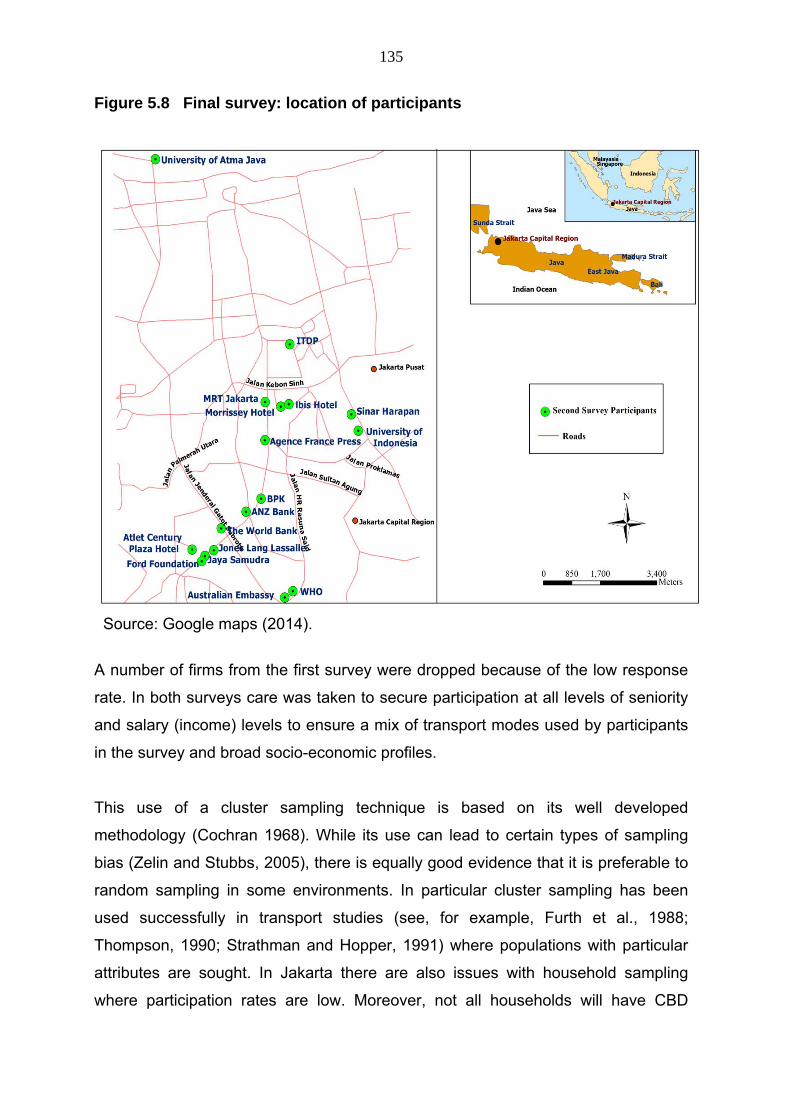
135
Figure 5.8 Final survey: location of participants
Source: Google maps (2014).
A number of firms from the first survey were dropped because of the low response
rate. In both surveys care was taken to secure participation at all levels of seniority
and salary (income) levels to ensure a mix of transport modes used by participants
in the survey and broad socio-economic profiles.
This use of a cluster sampling technique is based on its well developed
methodology (Cochran 1968). While its use can lead to certain types of sampling
bias (Zelin and Stubbs, 2005), there is equally good evidence that it is preferable to
random sampling in some environments. In particular cluster sampling has been
used successfully in transport studies (see, for example, Furth et al., 1988;
Thompson, 1990; Strathman and Hopper, 1991) where populations with particular
attributes are sought. In Jakarta there are also issues with household sampling
where participation rates are low. Moreover, not all households will have CBD

136
commuters. Use of office clusters also had the advantage that commuters had a
common destination and departure region for trips to and from work.
The process of choosing a statistically significant sample size follows the
methodology suggested by Louviere et al (2000):
(1)
n = size of sample survey
p = true proportion of the relevant population
a = percentage of deviation between p^ and p that can be accepted
α = confidence level
Use of the NGEN software was employed to compute the minimum appropriate
sample size which would provide a statistically significant result. A sample size well
in excess of this minimum was then used for the survey.
5.6 Ethical clearances
An ethical clearance was obtained from the Queensland University of Technology
for both surveys. No other ethic related clearances was required. Information
technology and health and safety issues were not relevant. The questionnaire was
translated into the Indonesian language with English copies also provided as
needed.
5.7 Conclusions
The preliminary survey provided useful information on both the methodology of
carrying out the commuter survey of Jakarta commuters and guidance on the
parameters used for choice modelling. As described in Chapter Seven, the
preliminary survey therefore provided the means for carrying out a larger final
survey in which a larger and more representative cross Section of commuters was
enrolled. The shorter format of the final survey also enabled a considerably higher
137
percentage of valid survey returns – particularly evident in the higher proportion of
completions of the simplified choice experiment.
Chapter Six provides the specification of the demand models used to analyse the
survey data derived from the preliminary and final surveys and that of the final
survey’s choice model used to measure the extent and nature of automotive modal
lock-in. Chapter Seven provides the outcomes of the modelling, WTP estimations
and an analysis of the wider socio-economic data.
138
CHAPTER SIX: ECONOMETRIC METHODOLOGY
6.1 Introduction
This chapter details the methodology and econometric models that are used to
analyse the surveys’ data. The derivation of an automotive demand model from the
preliminary and final survey data is described in Section 6.2.
Outlined in Section 6.3 is the evolution of data gathering and analysis techniques
and, specifically, the use of, and differentiation between, revealed preference and
stated preference data methodologies. Also described are the various streams of
stated preference methodology and a brief history of their evolution.
The particular characteristics of the discrete choice experiment and its theoretical
dependence on the random utility models is discussed in Section 6.4. The
advantages of using a discrete choice experiment for the purposes of this thesis are
enumerated – firstly, its ability to allow those surveyed to choose between
alternatives that are described by attributes of the good. Secondly, referenced is the
discrete choice experiment’s capacity to provide a willingness to pay for non market
goods.
The econometric modelling of a discrete choice experiment is described in Section
6.5. The history of use and relative merits of the multinomial logit and conditional
logit models when used to interpret discrete choice experiments are established and
the models specified. The derivation of willingness to pay values is also provided.
Section 6.6 concludes the chapter.
6.2 Automotive demand models
The suveys of Jakarta commuters (as described in Chapter Five) were designed to
provide a socio-economic profile of commuters including their commuting habits,
attitudes to transport issues and car/motorcycle ownership. These data were then
139
used to develop automotive demand models in order to provide insights into the
nature of automotive modal lock-in in a developing country where path dependent
growth was evident. In particular evidence was sought as to what extent demand for
cars and motorcycles could be explained in terms of income levels and to what
extent other factors – and especially those linked to positive feedback mechanisms
– were relevant.
As noted in Chapter Two, within the field of transport economics the use of
automotive demand models has been widespread reflecting the obvious need for
cost benefit analyses for new road projects and for urban planning. However, less
extensively used and researched – and particularly in the Indonesian context – are
studies which seek to measure the socio-economic and attitudinal influences on car
ownership. Common elements of the preliminary and final surveys were combined
to create car and motorcycle demand models using the variables set out in Tables
6.1 and 6.2.
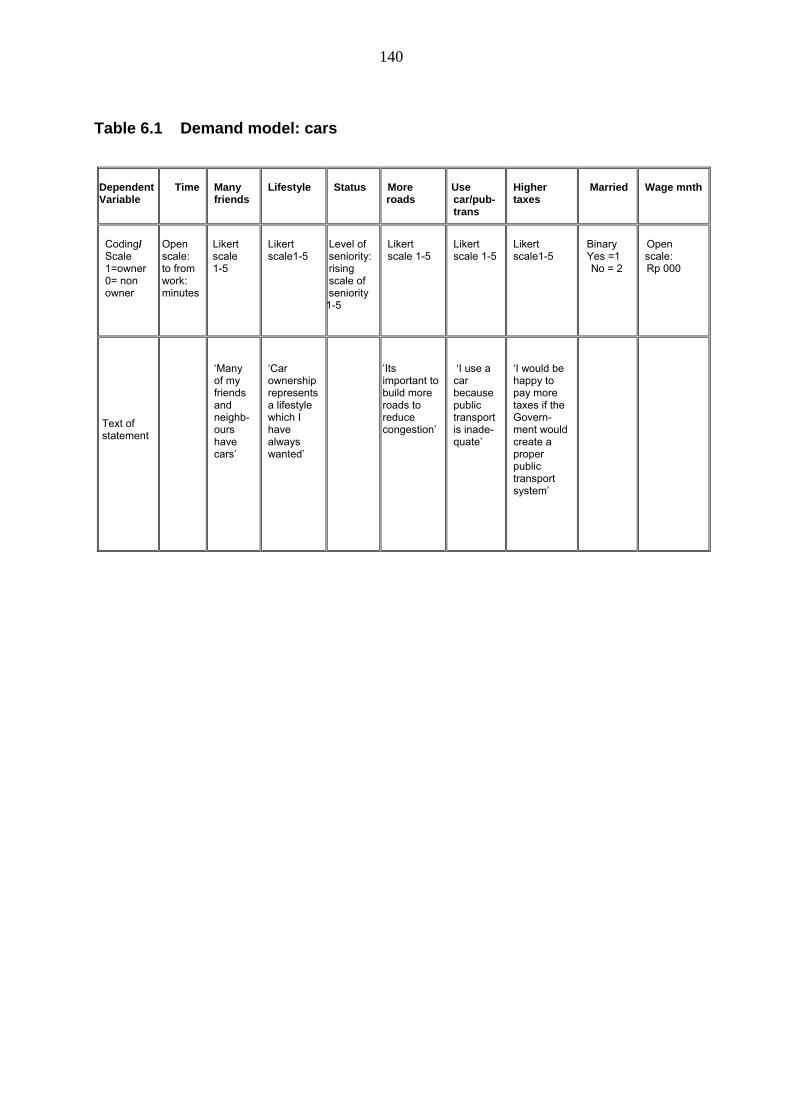
140
Table 6.1 Demand model: cars
Dependent Variable
Time
Many friends
Lifestyle
Status
More roads
Use car/pub-trans
Higher taxes
Married
Wage mnth
Coding/ Scale 1=owner 0= non owner
Open scale: to from work: minutes
Likert scale 1-5
Likert scale1-5
Level of seniority: rising scale of seniority
1-5
Likert scale 1-5
Likert scale 1-5
Likert scale1-5
Binary Yes =1 No = 2
Open scale:
Rp 000
Text of statement
‘Many of my friends and neighb-ours have cars’
‘Car ownership represents a lifestyle which I have always wanted’
’Its important to build more roads to reduce congestion’
‘I use a car because public transport is inade- quate’
‘I would be happy to pay more taxes if the Govern-ment would create a proper public transport system’
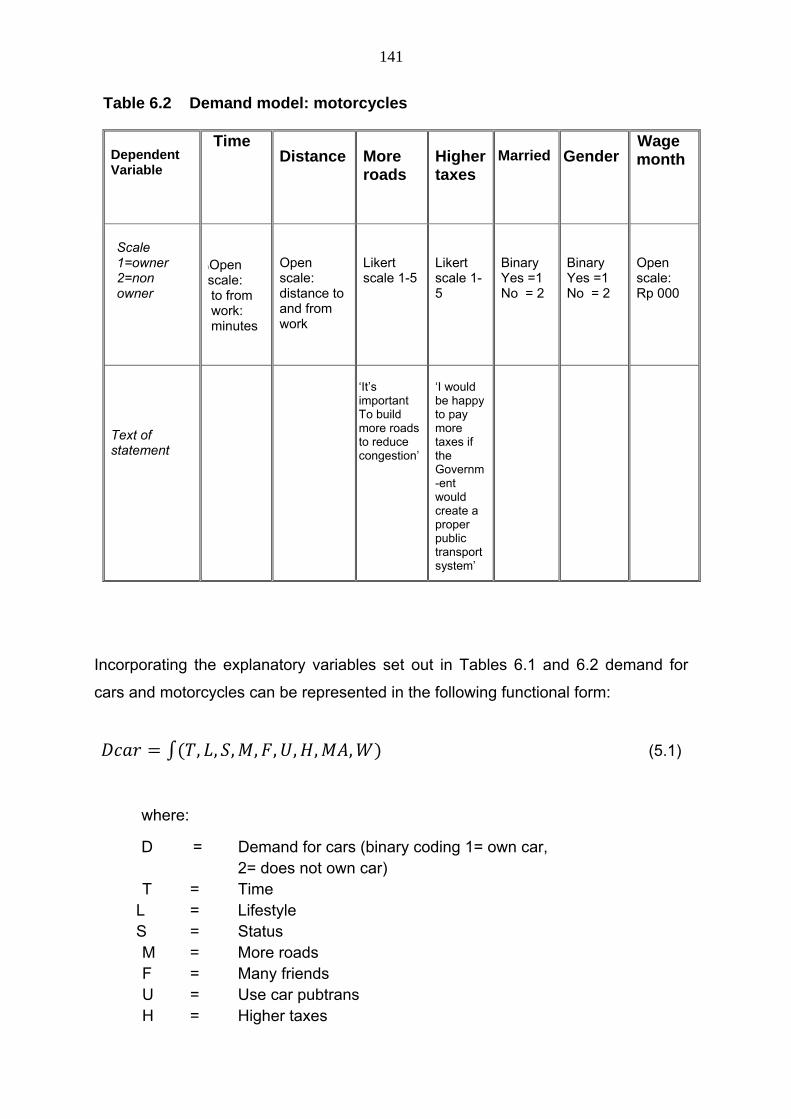
141
Table 6.2 Demand model: motorcycles
Incorporating the explanatory variables set out in Tables 6.1 and 6.2 demand for
cars and motorcycles can be represented in the following functional form:
, , , , , , , , (5.1)
where:
D = Demand for cars (binary coding 1= own car, 2= does not own car) T = Time L = Lifestyle S = Status M = More roads F = Many friends U = Use car pubtrans H = Higher taxes
Dependent Variable
Time
Distance
More roads
Highertaxes
Married
Gender
Wage month
Scale 1=owner 2=non owner
\Open scale: to from work: minutes
Open scale: distance to and from work
Likert scale 1-5
Likert scale 1-5
Binary Yes =1 No = 2
Binary Yes =1 No = 2
Open scale: Rp 000
Text of statement
‘It’s important To build more roads to reduce congestion’
‘I would be happy to pay more taxes if the Governm-ent would create a proper public transport system’
142
MA = Married W = Wage mnth
A demand model for motorcycles can also be developed using the surveys’ socio-
economic data although using a different combination of variables given a number
of the surveys’ questions on the reasons for car ownership were not relevant to
motorcycle ownership. They were the variables ‘many friends’, ‘more roads’, and
‘use car pubtrans’. ‘Gender’ and ‘education’ were however added as variables to the
motorcycle demand model given the surveys indicated an apparent gender and
educational level bias in motorcycle ownership.
, , , , , (6.2)
where:
D motorcycle = Demand for motorcycles (binary coding 1= owns motorcycle 2= does not own motorcycle)
T = Time M = More roads
H = Higher taxes
M = Married (binary coding 1= married, 2= unmarried)
G = Gender (binary coding 1= male, 2= female)
W = Wage mnth
E = Education (1-4 scale: low to high level of education)
Coding for T, M, H, W, is as for the demand model for cars above. Given that the
dependent variables are binary (Car/motorcycle ownership yes/no) they have two
values which can be denoted as 1 and 0. For the car demand model therefore the
vector of regressors X (T,L,M,F,U,H,MA,W) influence the outcome Y.
The model therefore takes the form:
Pr Y 1│X Φ β (6.3)
The conventional formulation of a binary dependent variable model – whether a
person owns a car or motorcycle or not – assumes that an unobserved dependent
variable is generated by a classical linear regression model of the form:
143
Y = â (6.4)
where:
β is a vector of regression coefficients; and
U is the random error term for observation i.
The random indicator variable Y
i represents the observed binomial process with the
following probabilities:
Pr Y 1 Pr 1 * Pr 0 (6.5)
Pr Y 0 Pr 1 * Pr 0 (6.6)
The probit model represents the binomial probabilities (6.5) and (6.6) in terms of the
standard normal cumulative distribution function Φ (z).as follows:
Pr Y 1│X ϕ X’β (6.7)
where X represents a vector of the explanatory variables and Φ is the cumulative
distribution function of the standard normal distribution. The parameters β are
typically estimated by maximum likelihood estimation.
If the data set { ,x contains n independent statistical units corresponding to the
model above then their joint log-likelihood function is:
l l Ф x β 1 y ln 1 Ф x 6.8)
The above model provides a measure of the change in predicted probability for a
unit change in the predictor. A further measure – the marginal effect of a predictor –
represents the partial effects of each explanatory variable on the probability that the
144
observed dependent variable Yi = 1. For the binary effects the probit model this can
be represented by:
ϕ x β β (6.9)
where ∅ is the probability distribution function of the standard normal cumulative
distribution function. Thus, the marginal effect of increasing results in a change in
y of magnitude ∅ .
6.3 Research data gathering techniques: background to revealed
preference and stated preference methods
In association with the socio-economic data, a discrete choice experiment formed
part of the survey. The advantages of using a discrete choice experiment are
outlined in Chapter Five, Sections 5.4 and 5.5. Given discrete choice experiments
use stated preference data, they provide a means of eliciting and measuring
preferences for goods which are not readily valued in monetary terms. The benefits
of stated preference data are linked to particular needs of economists – and in
particular environmental economists – to develop a measure of the willingness to
pay for non market goods. Stated preference data theoretically provides a means of
measuring, variously, marginal changes in values associated with changing an
attribute of a non-market good, large discrete changes associated with the
introduction of a new public good, or the substitution of one for another.
As mentioned in Chapter Five, Section 5.4, two main principal streams of non-
valuation techniques have developed namely, revealed preference and stated
preference methods. The former derives the value of a non-market good through
observing actual behaviour (choices) in a closely related market. The better known
techniques include the hedonic pricing method which involves decomposing the
target of research into its constituent characteristics and obtaining estimates of the
contributory value of each characteristic (Rosen, 1974). Often used in real estate,
an attribute vector is assigned to each characteristic or group of characteristics of
145
the object (e.g. a house). Other revealed preference techniques include the travel
cost method developed by Ben Akiva (1972) and McFadden (1974). This
methodology produced more comprehensive choice model specifications for travel
choices allowing more than two travel alternatives and using a wider scope of socio-
economic variables (Meyer et al., 1997). It was subsequently employed in
environmental economics and used in cost benefit analysis to account for the value
of a non-market good. However, as Alpizar et al. (2003) note, such revealed
preference techniques embody some particular drawbacks including the fact that
such valuations are conditioned on current and previous value levels of non-market
goods. Also identified is the problem of measuring non-use values (e.g. existence,
altruistic, and bequest values).
The alternative has centred on the stated preference techniques – contingent
valuation and discrete choice methodology. As noted in Chapter Five contingent
valuation methodology has been shown to be prone to bias and criticised for
presenting all or nothing choices given the questions can only deal with gaining or
losing the good as a whole.
An alternative stated preference methodology – discrete choice – was developed
from Lancaster’s (1966) insights which described consumers’ consumption of goods
in terms of the attributes they provided. Discrete choice combined Lancaster’s
characteristics theory with McFadden’s (1974a) random utility theory which
demonstrated the way in which a choice between alternatives was a function of
relative utilities. Ben-Akiva (1972), Louviere (1974) and McFadden (1974) and
developed this methodology in the early 1970s. In doing so they created a growing
specialisation in the development of travel demand models. In a landmark study
McFadden used stated preference methodology for measuring demand for rapid
transit through the effect of the introduction of Bay Area Rapid Transit in San
Francisco. Louviere and Hensher (1983) subsequently shifted the methodological
focus of stated preference to the marginal utility framework.
146
6.4 Research procedures: discrete choice experiment
Discussed in Chapter Five and Chapter Six, Section 6.3, is the development of
stated preference techniques namely, contingent valuation methodology and
discrete choice experiments. It should be noted that the discrete choice experiment
technique was developed in parallel to contingent valuation methodology (see, for
example, Ben-Akiva et al., 1997; Hensher, 1981, 2001; Hensher et al., 2012).
However, the discrete choice experiment technique held a particular advantage
given its capacity to allow estimation not only of non-market goods themselves, but
also of their attributes (Bateman et al., 2003). Its use in transport studies where user
socio-economic profiles become important has, therefore, been widespread.
The particular challenges of applying choice modelling to developing countries has
been explored by Bennett and Birol (2010) reflecting the spreading use of discrete
choice experiments in a wide range of environments. For example, Vedagiri and
Arasan (2009) used choice modelling to estimate the probable shift from auto‐
rickshaw usage to bus by the provision of bus lanes on Indian city roads carrying
heterogeneous traffic. However use of choice modelling to explore transport issues
and preferences in Jakarta has been relatively rare. Senbil et al. (2005) use choice
modelling to examine the effect of residential location on transport modal
preferences in Jakarta. Lubis et al. (2005) used a discrete choice experiment to help
predict travel mode preferences for the Jakarta-Bandung corridor. Vedargiri and
Arasan (2009) sought to measure the switch away from personal transport modes
through the introduction of new dedicated bus lanes in Jakarta using a discrete
choice experiment.
In light of the above analysis, the use of a discrete choice experiment was adopted
for the surveys in order to measure willingness to pay for non-market goods in the
form of travel mode preferences and the level of transport modal lock-in.
The particular advantage of using a discrete choice experiment for this thesis
research lies in its ability to allow those surveyed to choose between alternatives
that are described by attributes of the good. This contrasts with the contingent
valuation methodology which depends on hypothetical statements to gauge
preferences and the use of which has been subject to empirical challenge
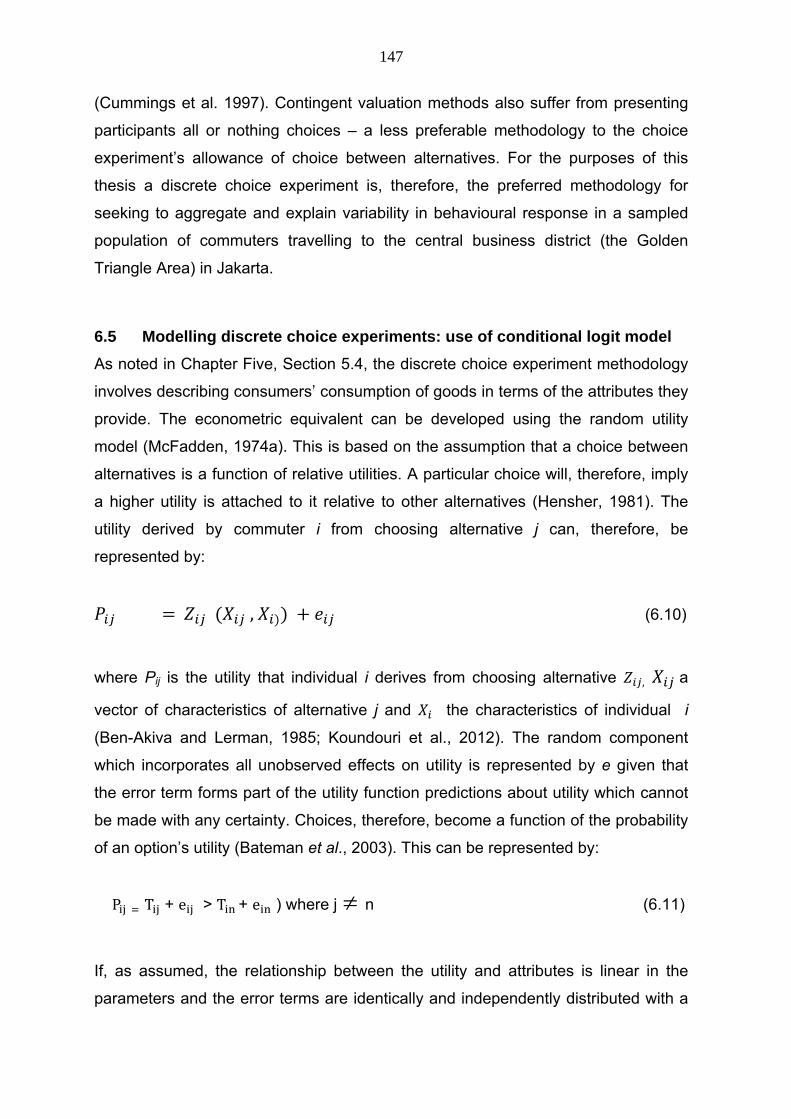
147
(Cummings et al. 1997). Contingent valuation methods also suffer from presenting
participants all or nothing choices – a less preferable methodology to the choice
experiment’s allowance of choice between alternatives. For the purposes of this
thesis a discrete choice experiment is, therefore, the preferred methodology for
seeking to aggregate and explain variability in behavioural response in a sampled
population of commuters travelling to the central business district (the Golden
Triangle Area) in Jakarta.
6.5 Modelling discrete choice experiments: use of conditional logit model
As noted in Chapter Five, Section 5.4, the discrete choice experiment methodology
involves describing consumers’ consumption of goods in terms of the attributes they
provide. The econometric equivalent can be developed using the random utility
model (McFadden, 1974a). This is based on the assumption that a choice between
alternatives is a function of relative utilities. A particular choice will, therefore, imply
a higher utility is attached to it relative to other alternatives (Hensher, 1981). The
utility derived by commuter i from choosing alternative j can, therefore, be
represented by:
, (6.10)
where Pij is the utility that individual i derives from choosing alternative , a
vector of characteristics of alternative j and the characteristics of individual i
(Ben-Akiva and Lerman, 1985; Koundouri et al., 2012). The random component
which incorporates all unobserved effects on utility is represented by e given that
the error term forms part of the utility function predictions about utility which cannot
be made with any certainty. Choices, therefore, become a function of the probability
of an option’s utility (Bateman et al., 2003). This can be represented by:
P T + e > T + e ) where j n (6.11)
If, as assumed, the relationship between the utility and attributes is linear in the
parameters and the error terms are identically and independently distributed with a
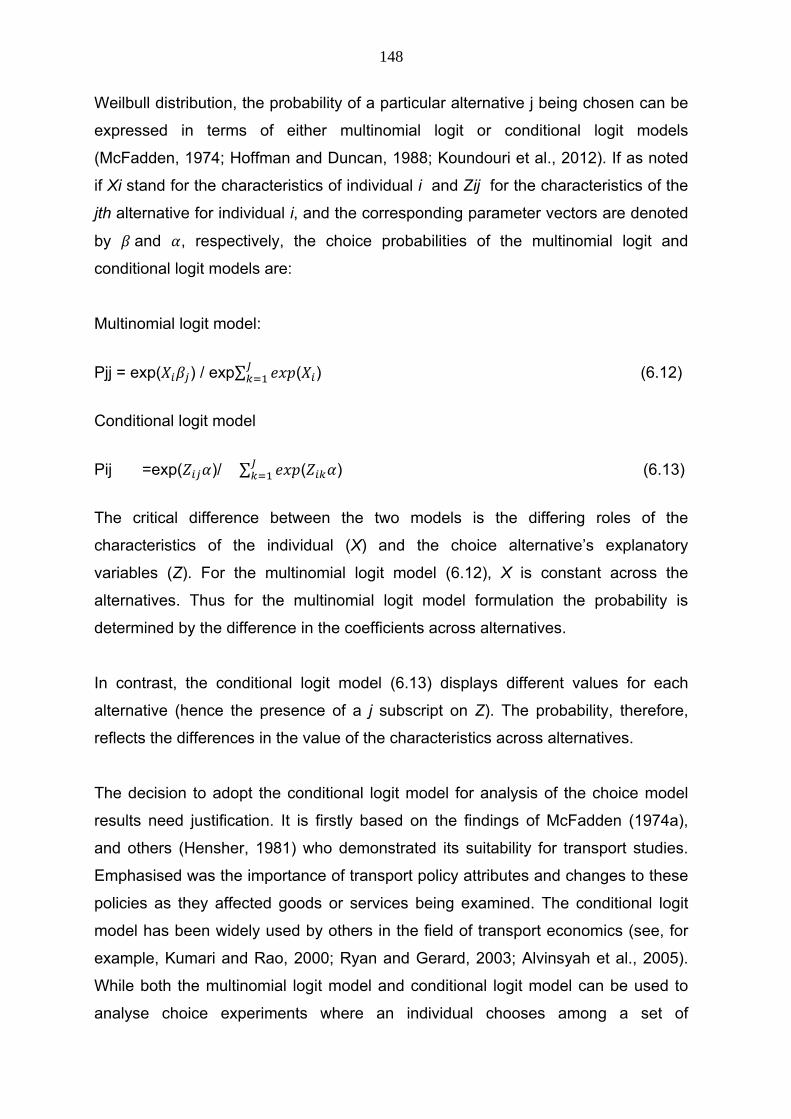
148
Weilbull distribution, the probability of a particular alternative j being chosen can be
expressed in terms of either multinomial logit or conditional logit models
(McFadden, 1974; Hoffman and Duncan, 1988; Koundouri et al., 2012). If as noted
if Xi stand for the characteristics of individual i and Zij for the characteristics of the
jth alternative for individual i, and the corresponding parameter vectors are denoted
by and , respectively, the choice probabilities of the multinomial logit and
conditional logit models are:
Multinomial logit model:
Pjj = exp( ) / exp∑ ( ) (6.12)
Conditional logit model
Pij =exp( )/ ∑ ( ) (6.13)
The critical difference between the two models is the differing roles of the
characteristics of the individual (X) and the choice alternative’s explanatory
variables (Z). For the multinomial logit model (6.12), X is constant across the
alternatives. Thus for the multinomial logit model formulation the probability is
determined by the difference in the coefficients across alternatives.
In contrast, the conditional logit model (6.13) displays different values for each
alternative (hence the presence of a j subscript on Z). The probability, therefore,
reflects the differences in the value of the characteristics across alternatives.
The decision to adopt the conditional logit model for analysis of the choice model
results need justification. It is firstly based on the findings of McFadden (1974a),
and others (Hensher, 1981) who demonstrated its suitability for transport studies.
Emphasised was the importance of transport policy attributes and changes to these
policies as they affected goods or services being examined. The conditional logit
model has been widely used by others in the field of transport economics (see, for
example, Kumari and Rao, 2000; Ryan and Gerard, 2003; Alvinsyah et al., 2005).
While both the multinomial logit model and conditional logit model can be used to
analyse choice experiments where an individual chooses among a set of
149
alternatives, preferences arise according to the nature of the choice set. Thus the
conditional logit model is appropriately used where those being surveyed are
presented with an unordered set of alternatives whose values are randomly
selected and have no natural order.
Hoffman and Greg (1988) note that while the multinomial logit model formulation
“...may provide direct and useful information about which individuals make which
choices, they are often not well suited to testing hypotheses about why those
choices are made” (page 418).
They point out that the conditional logit model is, therefore, particularly well suited
for the analysis of the way in which government policy affects the attractiveness of
an alternative by changing some relevant characteristic and to assess the effect of
such changes on individual choices. In these cases it is necessary to include as far
as possible, the policy parameters directly in the choice problem. Being a
characteristic of the alternative in question, a conditional logit model becomes the
appropriate model.
A further consideration of model choice and choice model design relates to the
issue of what is termed the independence of irrelevant alternatives (IIA). The
conditional logit model (as well as the multinomial logit model) carries with it
particular assumptions regarding IIA. That assumption is that an increase in the
probability of choosing one of the choice option sets results in an equally
proportional decrease in the probability of selecting any of the other choice sets91. If
these assumptions are violated, then the choice modelling results may be biased
(Louviere et al., 2000; Hensher et al., 2005).
The conditional and multinomial logit models assume that the error terms follow an
extreme value distribution and are independent across alternatives. Thus the
unobserved component of utility is correlated over alternatives as represented by:
91 McTaggart-Cowan et al. (2008) describe a third possibility in which choice sets (other than status quo) are closer substitutes with each other than with the status quo although status quo remains an, albeit weaker, substitute.
150
βX ε (6.14)
where Pij is the utility of the jth alternative chosen by individual i, Xij is the
preference of each attribute X, and εij is the unobserved error term.
The inclusion of a neither option in the choice experiment is designed to help
overcome the potential problem of IIA, although as Dhar and Simonson (2003)
show, its inclusion should not be expected to eradicate bias. That is, the choice of
no change/status quo/neither options in transport choice will not be totally
independent in utility terms of other options given they are all part of a continuum of
options.
Hausman and McFadden (1984) provide a way of testing whether the IIA property
holds which involves dropping an alternative from the choice set and comparing
parameter vectors for significant differences. Following this practice, the comparison
of the thesis choice model set parameters revealed only relatively insignificant
differences.
The use of the conditional logit model in preference to the multinomial logit model in
analysing the choice experiment data was validated by running both models using
the choice experiment data.92 The former proved the best fit indicating, as expected,
the greater influence on choice decisions of the explanatory variables (Z) than that
of individuals’ characteristics (X).
The distinguishing characteristic of the discrete choice experiment is its ability to
provide a measure of the marginal WTP estimation for changes in attributes of the
conditional logit model. The basic formula used can be specified as a measure of
the compensating surplus (CS):
(6.15)
92 Estimating both CLM and MLM models use the log likelihood function: Log L = ∑ ∑
i i
ii TTCS
)exp(ln)exp(ln 01
151
Here represents the marginal utility of income denoted in the discrete choice
experiment by the coefficient of the choice monetary attribute. and
representing the change in indirect utility functions of alternative i. The marginal
value of change within a single attribute can, therefore, be simply represented as a
ratio of coefficients:
WTP = ‐1
(6.16)
MWP βattribute
βmonetaryvalue (6.17)
The conditional logit model also allows for the assessment of the importance of
socio-economic variables (if needed) on choice in the discrete choice experiment.
As Rolfe et al. (2000) and Bateman et al. (2003) note socio-economic
characteristics can be considered as separate influences on behavioural intentions.
In random utility models this methodology does not allow the effects of social and
economic characteristics on choice to be examined in isolation but as interaction
terms with choice attributes. A number of key socio-economic variables – including
wage, education and Likert scaled attitudes to possible transport congestion
solutions – were run in this way with the choice model attributes. However given a
significant number of survey participants did not provide responses to all socio-
economic questions, running a number of socio-economic variables together in this
way reduced the overall populations of respondents in such a way as to produce
unacceptably high variations in the significance of the dependent variables. Instead,
a direct analysis of the socio-economic data was found to provide an adequate
additional explanatory overlay.
6.6 Conclusion
The thesis preliminary and final surveys provide a means of, firstly, creating a socio-
economic profile of Jakarta commuters. The preliminary survey’s data is then used
152
to develop an automotive demand model for both automobiles and motorcycles and
which is designed to inform the motivations of commuters for vehicle ownership and
use. Commuter profiles and demand model outcomes are set out in Chapter Seven.
The incorporation of a discrete choice experiment in the final survey is specifically
designed to measure the strength and durability of automotive modal lock-in. This is
achieved by using a conditional logit model by means of which WTP estimations are
created for a number of dependent variables which are pertinent to automotive
modal lock-in. The outcomes of these models and their contribution to validating the
thesis hypothesises concerning the nature of the staged progression of automotive
modal lock-in and its strength and durability in developing country conurbations, is
set out in Chapters Seven and Eight.
153
CHAPTER SEVEN: JAKARTA COMMUTER SURVEYS: RESULTS
7.1 Introduction
As discussed in Chapter Six, surveys of commuters working in Jakarta’s CBD were
developed to test the thesis hypothesises concerning the nature of automotive
transport lock-in. The surveys were further used to measure the extent and severity
of automotive modal lock-in in the Jakarta conurbation. The outcomes and the
extent to which the statistical analysis of the results support the thesis hypotheses
are set out in this chapter.
Socio-economic and attitudinal profiles of commuters according to modal usage and
ownership of cars and motorcycles are set out in Sections 7.2 and 7.3. This
provides empirical support for the hypothesis developed in Chapter Four that
Jakarta is currently in stage 3 of transport modal lock-in. The low level of
aspirational demand for cars is highlighted. In Section 7.4, the outcomes of the car
and motorcycle demand models, as specified in Chapter Six, Section 6.2, provide a
wider socio-economic profile of motivations for private vehicle ownership and use.
The results of survey questions relating to commuter attitudes to Jakarta’s critical
lack of public transport, its role in creating market failure and in increasing demand
for automobiles, are summarised in Section 7.5. Survey indications of commuter
intolerance to transport negative externalities are described in Section 7.6 as is their
role as a generator of resistance to transport modal lock-in.
The outcome of the survey’s discrete choice experiment is provided in Section 7.7
and 7.8. It’s important role in providing a measure of commuter willingness to
restrict private vehicle ownership in exchange for better public transport is
discussed together with the extent to which the outcomes validate key thesis
hypotheses. Further precision is provided by the WTP values for reduction of
congestion and time saved set out in Section 7.9 and which indicate the presence of
a robust and durable form of transport modal lock-in.
154
Given the importance of both cars and motorcycles in Jakarta’s modal mix and the
exceptionally low use of public transport, separate choice models and WTP
derivations are run for those using cars, motorcycles and other (largely public
modes) of transport. In this way the level of importance of choice variables and
motivations of commuters attaching to the differing modes of transport used are
used to provide a more detailed description of Jakarta’s stage 3 automotive modal
lock-in. This segmentation of the choice modelling results and derived WTP creates
a useful input into transport strategy policy prescriptions for reversal of transport
modal lock-in and which is discussed in Chapter Eight. Section 7.10 summarises
the significance of the survey’s findings in terms of validating the thesis hypothesis
and the staged model of automotive modal lock-in developing countries in Chapters
Four and Five.
7.2 Travel Preferences: Jakarta commuters
The presence and character of transport modal lock-in is well described by a
number of key findings from the two surveys. Confirming evidence is found of an
exceptionally high proportion of commuters travelling to Jakarta’s ‘Golden Triangle’
CBD region (see Chapter Five, Figure 5.1) using private transport. This underpins
the assessment in Chapter Four – that Jakarta has reached the third stage of
transport modal lock-in. The modal split as shown by the preliminary and final
surveys is shown in Table 7.1.
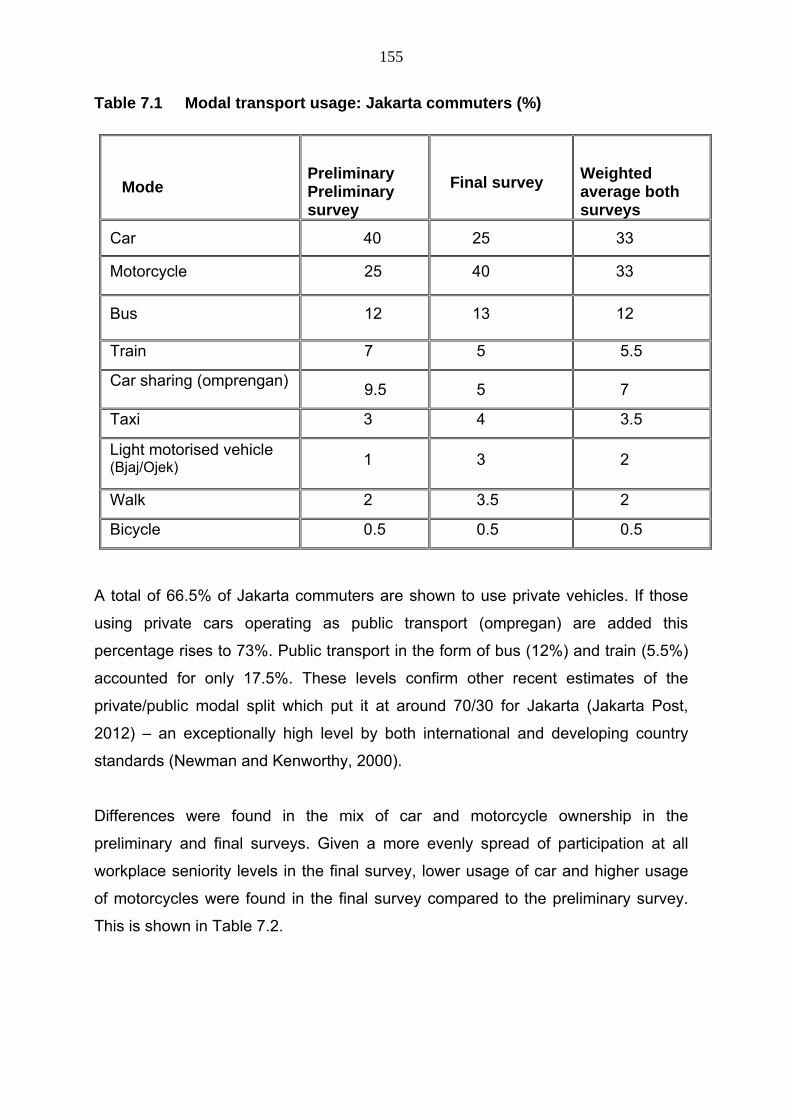
155
Table 7.1 Modal transport usage: Jakarta commuters (%)
Mode
Preliminary Preliminary survey
Final survey
Weighted average both surveys
Car 40 25 33
Motorcycle 25 40 33
Bus 12 13 12
Train 7 5 5.5
Car sharing (omprengan)
9.5 5 7
Taxi 3 4 3.5
Light motorised vehicle
(Bjaj/Ojek)
1 3 2
Walk 2 3.5 2
Bicycle 0.5 0.5 0.5
A total of 66.5% of Jakarta commuters are shown to use private vehicles. If those
using private cars operating as public transport (ompregan) are added this
percentage rises to 73%. Public transport in the form of bus (12%) and train (5.5%)
accounted for only 17.5%. These levels confirm other recent estimates of the
private/public modal split which put it at around 70/30 for Jakarta (Jakarta Post,
2012) – an exceptionally high level by both international and developing country
standards (Newman and Kenworthy, 2000).
Differences were found in the mix of car and motorcycle ownership in the
preliminary and final surveys. Given a more evenly spread of participation at all
workplace seniority levels in the final survey, lower usage of car and higher usage
of motorcycles were found in the final survey compared to the preliminary survey.
This is shown in Table 7.2.
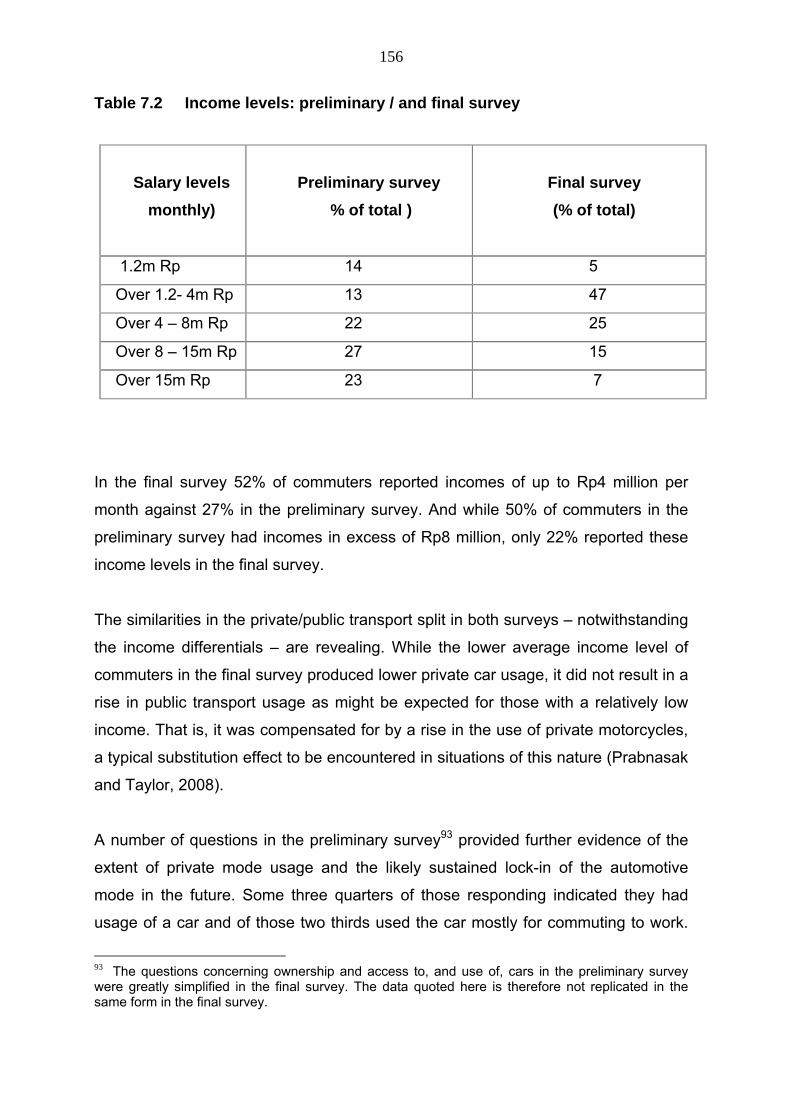
156
Table 7.2 Income levels: preliminary / and final survey
In the final survey 52% of commuters reported incomes of up to Rp4 million per
month against 27% in the preliminary survey. And while 50% of commuters in the
preliminary survey had incomes in excess of Rp8 million, only 22% reported these
income levels in the final survey.
The similarities in the private/public transport split in both surveys – notwithstanding
the income differentials – are revealing. While the lower average income level of
commuters in the final survey produced lower private car usage, it did not result in a
rise in public transport usage as might be expected for those with a relatively low
income. That is, it was compensated for by a rise in the use of private motorcycles,
a typical substitution effect to be encountered in situations of this nature (Prabnasak
and Taylor, 2008).
A number of questions in the preliminary survey93 provided further evidence of the
extent of private mode usage and the likely sustained lock-in of the automotive
mode in the future. Some three quarters of those responding indicated they had
usage of a car and of those two thirds used the car mostly for commuting to work.
93 The questions concerning ownership and access to, and use of, cars in the preliminary survey were greatly simplified in the final survey. The data quoted here is therefore not replicated in the same form in the final survey.
Salary levels
monthly)
Preliminary survey
% of total )
Final survey
(% of total)
1.2m Rp 14 5
Over 1.2- 4m Rp 13 47
Over 4 – 8m Rp 22 25
Over 8 – 15m Rp 27 15
Over 15m Rp 23 7
157
Similarly 40% had use of a motorcycle with over 80% using it primarily for work
commuting. In total, 82% of those with access to either a car or a motorcycle used
them principally for commuting. Moreover, almost half of those not owing a car
stated they intended to do so within five years94. In total 80% of respondents
revealed they either had access to a car or were intending to purchase one over the
next five years. Of those intending to purchase a car, over half indicated the
purchase would be for commuting purposes.
7.3 Automotive ownership: aspirational demand
A further important characteristic of automotive modal lock-in is revealed by the
surveys’ focus on motivation for private automotive use. In stage 3 of the
explanatory framework for transport modal lock-in – as developed in Chapters Five
and Six – the drivers of car ownership is hypothesised to be influenced by lack of
transport alternatives rather than aspirational motivations (the latter being higher in
stage 1 and 2 of transport modal lock-in). Similarly, the very high level of motorcycle
ownership and use by commuters is hypothesised to reflect the lack of suitable
public transport alternatives rather than a form of aspirational demand.
Specifically designed survey questions were, therefore, included to provide an
indication of the differing strength of these motivations for those owning or intending
to own a car. These responses provide a separate layer of analysis to attitudes
derived from the stated preference choice modelling experiment.
Seventy percent of commuters95 agreed/strongly agreed (Likert scale) with the
statement: ‘I need a car because public transport is inadequate’. This response
indicates how qualified the utility of a car has become in a conurbation where
congestion is acute and alternative modes lacking. The ambiguity over the
usefulness of cars was equally apparent in responses to questions assessing the
importance of aspirational motivations for ownership (see Table 7.3).
94 For brevity this question was not replicated in the final survey. 95 Unless stated otherwise percentages are for the weighted average of both surveys.
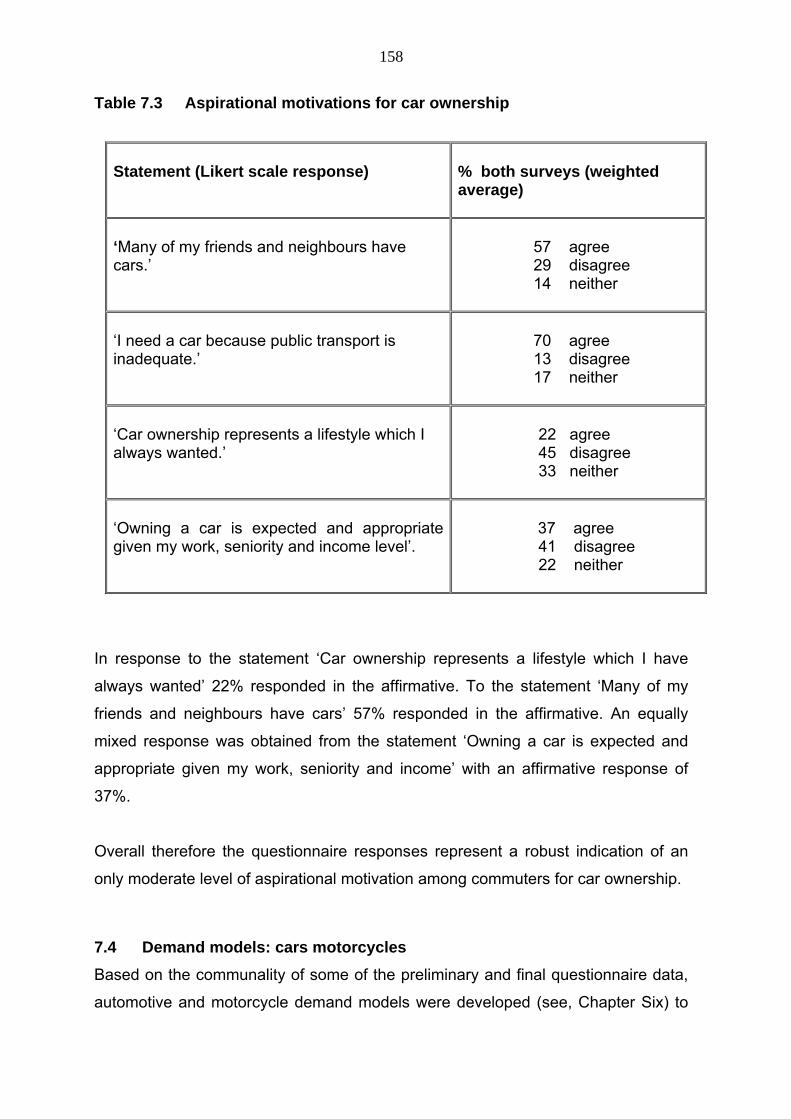
158
Table 7.3 Aspirational motivations for car ownership
In response to the statement ‘Car ownership represents a lifestyle which I have
always wanted’ 22% responded in the affirmative. To the statement ‘Many of my
friends and neighbours have cars’ 57% responded in the affirmative. An equally
mixed response was obtained from the statement ‘Owning a car is expected and
appropriate given my work, seniority and income’ with an affirmative response of
37%.
Overall therefore the questionnaire responses represent a robust indication of an
only moderate level of aspirational motivation among commuters for car ownership.
7.4 Demand models: cars motorcycles
Based on the communality of some of the preliminary and final questionnaire data,
automotive and motorcycle demand models were developed (see, Chapter Six) to
Statement (Likert scale response)
% both surveys (weighted average)
‘Many of my friends and neighbours have cars.’
57 agree 29 disagree 14 neither
‘I need a car because public transport is inadequate.’
70 agree 13 disagree 17 neither
‘Car ownership represents a lifestyle which I always wanted.’
22 agree 45 disagree 33 neither
‘Owning a car is expected and appropriate given my work, seniority and income level’.
37 agree
41 disagree 22 neither
159
provide further indications of the underlying drivers of demand for cars and
motorcycles96. The need for separate models is evident from the unusually high
proportion of commuters using motorcycles in Jakarta and the consequent need to
identify separate attitudinal profiles.
Developing country demand models for automotive ownership (see, for example,
Button et al., 1991; Senbil et al., 2005; Dargay et al., 2007; Mohamad and
Kiggundu, 2007;) and motorcycle ownership (see Prabnasak and Tayor, 2008) have
produced a focus on income’s high level of significance. The surveys’ outcomes of
this study indicate a greater complexity in the nature of the demand for cars and
motorcycles – a finding emerging in a few more recent studies such as that of Doi
and Asano (2011) who show that private vehicle dependence in Asian cities is
significantly related to the level of access to public transport.
There are a number of studies of transport mode choice in Jakarta (Senbil et al.,
2006; Susilo et al, 2007; Yagi and Mohammadian, 2008) which depend largely on
survey data gathered to develop the Transport Master Plan 2004 (Japan
International Cooperation Agency (JICA) and the Indonesian National Development
Planning Agency (BAPPENNAS), 2001 and 2004). Suryo, et al.’s (2007) study of
Jakarta commuters represents the only example found in the literature which
creates a modal demand model from a separate survey and which specifically
focuses on commuters travelling to Jakarta’s CBD district. Alvinsyah et al. (2005)
generate data to analyse modal switching due to the introduction of the bus rapid
transit system97. However, none of these studies were designed to include
dependent variables which tested the presence and strength of automotive modal
lock-in. A number of such variables are incorporated in the demand models
developed for this study and are listed below together with the relevant
hypothesises and outcomes.
96 A number of explanatory non significant variables were excluded given their inclusion would have excessively reduced the demand model population via incomplete or incorrect survey entries. 97 This study provided no strong evidence of the demand for public transport given the new BRT route used as the modal switching target was highly limited in its reach requiring most commuters to change modes to reach their home and target destinations.
160
7.5 Demand model: socio-economic variables
The dependent variables were defined using a binary form: car ownership (yes =
1/no = 2) and motorcycle ownership (yes = 1/no = 2). The following are the
explanatory variables and the hypothesised outcomes98.
Commuting time and distance99 (to and from work per day in minutes and km):
hypothesised is that the longer the commuting times and distances, car ownership
will increase given it provides the only practical means of shortening the time length
and avoiding the inconvenience and discomfort of public transport. As motorcycles
are typically used for shorter journeys, time and distance are hypothesised not to
have a high level of significance for this mode.
Wage level (monthly Rp): it is hypothesised that, as widely indicated in the
literature, wage levels will be positively associated with car ownership. The level of
significance is assumed to be particularly high given the way in which higher
incomes are expected to fuel increased car ownership as a response to poor public
transport and to a lesser extent feed what is assumed to be moderate aspirational
demand. The effect of wage levels on motorcycle ownership is expected to be
significant and negative in sign given these commuters’ lower socio-economic
status and the ubiquitously available hire purchase finance. This availability has had
the effect of greatly reducing the income entry level for motorcycle ownership. At
higher income levels commuters are assumed to graduate to the car mode100. The
lack of public transport is assumed to raise the usage of motorcycles by low income
earners who would normally use the former, usually cheaper, mode.
Marital status (dummy variable: married/single: married = 1/unmarried = 2): a
positive significance is hypothesised for car owners given this mode’s key dual role 98 The hypothesised outcomes are in line with the findings of literature listed above which contain demand models for developing country urban modal use and automotive ownership. 99 For automobiles, distance was not significant at the 10% level although positive in sign. 100 Given many car owners are also, secondarily, motorcycle owners the former were excluded from the analysis of motorcycle ownership demand in order to limit responses to commuters’ preferences shaped by their primary transport mode. Thus the motorcycle ownership demand model is based on commuters whose preferences are not primarily motivated by car ownership.
161
as a transport means for spouses and families. A negative correlation is to be
expected for motorcycle owners give their lower average age and the limited
capacity motorcycles provide for family transport.
More roads (Likert scale response: -2/-1/0/1/2): importance commuters attach to
the statement “It’s important to build more roads to reduce congestion” as a
determinant of car/motorcycle ownership. Hypothesised is that commuters will not
be aware of the positive feedback mechanisms involved in road construction and its
eventual role in increasing congestion. A significant and positive association with
car and motorcycle ownership is, therefore, anticipated.
Higher tax (Likert scale response: -2/-1/0/1/2): importance commuters attach to the
statement ‘I would be happy to pay more taxes if the Government would create a
proper public transport system’ as a determinant of car/motorcycle ownership.
Hypothesised is that as car and motorcycle owners, given the relatively high cost of
private transport, will exhibit a significant level of willingness to pay higher taxes to
improve a lower cost public transport.
Use car/ pubtrans (car own model only: Likert scale: -2/-1/0/1/2): importance
commuters attach to the statement ‘I use a car because public transport is
inadequate’ as a determinant of motorcycle ownership. In line with the thesis
hypothesis it is expected this variable will be significant and positive indicating those
most dissatisfied with public transport are more likely to be car owners.
Gender101 (motorcycle own model only: dummy variable M/F; 1= married, 2=
unmarried): some bias towards male ownership of cars is hypothesised given their
preponderance as higher income earners. A similar significant influence on
motorcycle ownership is hypothesised given the preponderance of males
commuting on motorcycles. This reflects, it can be assumed, the discomfort which
females find in motorcycle use.
101 Not significant in the automobile demand model.

162
Education102 (motorcycle own model only: ranked 1-5 from primary level to post
graduate qualifications): hypothesised is that higher education will be strongly linked
with higher income levels and, therefore, higher car ownership. A negative sign and
significance level is hypothesised to apply to motorcycle demand given the
assumed low level of education among most motorcycles owners and non
motorcycle owners.
Many friends (car own model only: Likert scale response: -2/-1/0/1/2): importance
commuters attach to the statement ‘Many of my friends and neighbours have cars’
as a determinant of car ownership. A positive sign is hypothesised with a moderate
level of significance. The assumption is that this form of aspirational motivation will
be only weakly present given the car would be recognised as a dominant cause of
the critically high level of transport congestion and pollution.
Lifestyle (car own model only: Likert scale: -2/-1/0/1/1/2): importance commuters
attach to the statement ‘Car ownership represents a lifestyle which I have always
wanted’ as a determinant of car ownership. The hypothesised significance is as for
‘Many Friends’ above.
Status (car own model only: Likert scale: -2/-1/0/1/1/2): importance commuters
attach to the statement ‘Owning a car is expected and appropriate given my work
seniority and income level’ as a determinant of car ownership. The hypothesised
response is positive and significance given still firmly embedded hierarchical cultural
norms in Indonesian society.
7.6 Car and motorcycle demand models: outcomes
As discussed in Chapter Six, Section 6.2, a probit marginal effects model was used
given the dependent variables car and motorcycle ownership are binary in form.
The results are set out in Tables 7.4 and 7.5. The significance of the dependent
variables for both car and motorcycle demand models are discussed jointly.
102 As individual explanatory variables, education and work seniority levels are shown to be significant and positive factors in the car ownership automotive demand model. However, given relatively low response rates for these questions, they were not included in the full demand model to preserve a reasonable population size.
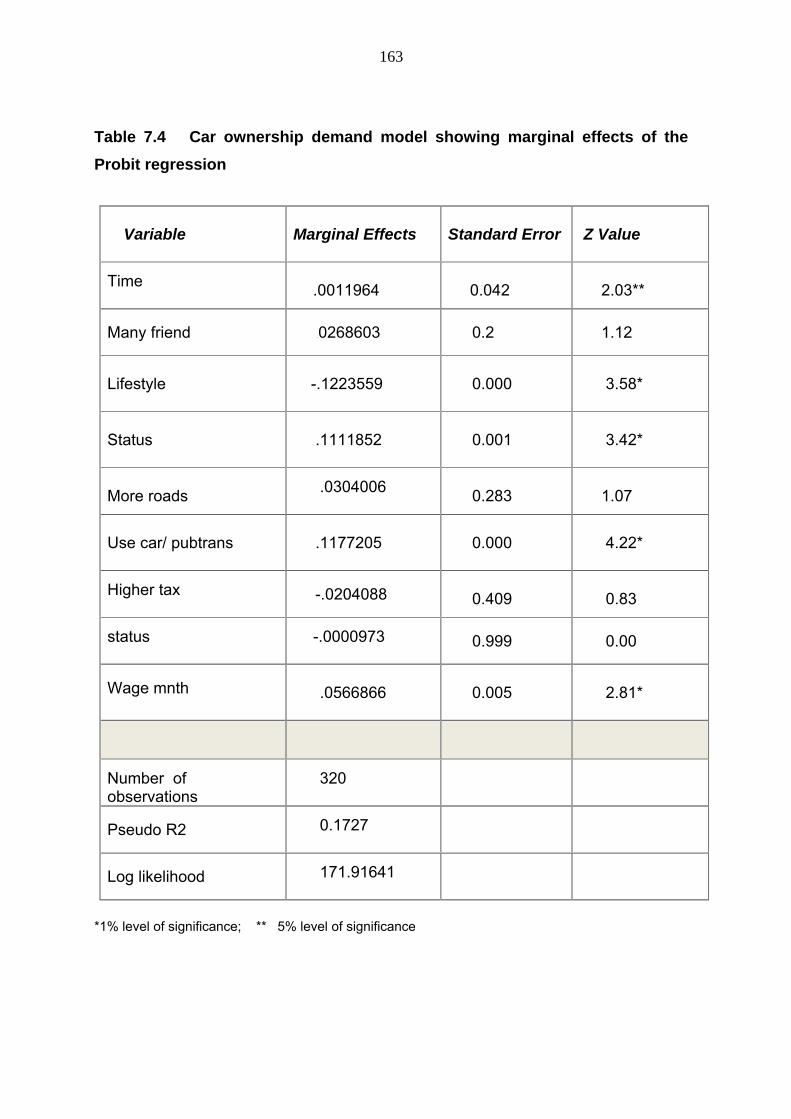
163
Table 7.4 Car ownership demand model showing marginal effects of the
Probit regression
*1% level of significance; ** 5% level of significance
Variable Marginal Effects Standard Error Z Value
Time
.0011964
0.042
2.03**
Many friend
.0268603
0.2 1.12
Lifestyle -.1223559 0.000 3.58*
Status .1111852 0.001 3.42*
More roads
.0304006
0.283
1.07
Use car/ pubtrans .1177205
0.000 4.22*
Higher tax
-.0204088 0.409
0.83
status
-.0000973
0.999 0.00
Wage mnth
.0566866
0.005 2.81*
Number of observations
320
Pseudo R2
0.1727
Log likelihood
171.91641
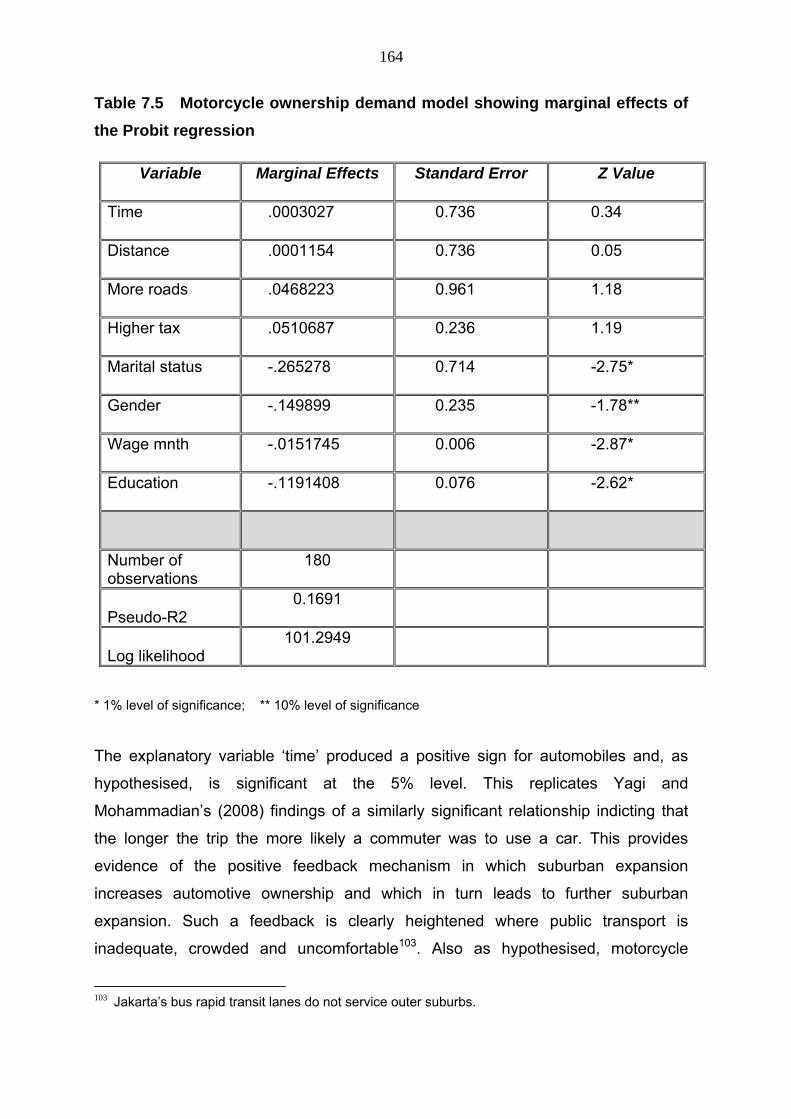
164
Table 7.5 Motorcycle ownership demand model showing marginal effects of
the Probit regression
Variable Marginal Effects Standard Error Z Value
Time .0003027 0.736 0.34
Distance .0001154 0.736 0.05
More roads .0468223 0.961 1.18
Higher tax .0510687 0.236 1.19
Marital status -.265278 0.714 -2.75*
Gender -.149899 0.235 -1.78**
Wage mnth -.0151745 0.006 -2.87*
Education -.1191408 0.076 -2.62*
Number of observations
180
Pseudo-R2 0.1691
Log likelihood 101.2949
* 1% level of significance; ** 10% level of significance
The explanatory variable ‘time’ produced a positive sign for automobiles and, as
hypothesised, is significant at the 5% level. This replicates Yagi and
Mohammadian’s (2008) findings of a similarly significant relationship indicting that
the longer the trip the more likely a commuter was to use a car. This provides
evidence of the positive feedback mechanism in which suburban expansion
increases automotive ownership and which in turn leads to further suburban
expansion. Such a feedback is clearly heightened where public transport is
inadequate, crowded and uncomfortable103. Also as hypothesised, motorcycle
103 Jakarta’s bus rapid transit lanes do not service outer suburbs.
165
ownership is shown not to be significantly linked to commuting time indicating the
unsuitability of motorcycles for long distance travel104. Senbil et al.’s (2006) model of
motorcycle demand in Jabotabek underlines this assumption by showing a
significant and negative correlation with distance and time travelled.
The sign and significance of marital status, as hypothesised, confirms the dual
nature of the car as a transport mode for family needs. The negative sign and high
level of significance (1%) of marital status in motorcycle demand is also as
hypothesised. This replicates the results of the demand model studies of Suryo et
al. (2007), Yagi and Mohammadian (2008) and Senbil et al. (2006) which test the
relationship between marriage and automotive modal choice. These studies also
find the much younger age of motorcycle commuters means they are considerably
less likely to be married.
Automobile ownership’s strong positive correlation with wage levels is as expected
as is the negative correlation between income and motorcycle ownership (1%). The
results relating to car ownership are in line with the findings of researchers of
automotive demand in developing countries – notably Dargay et al. (2007) and
Geels (2005). They show rising elasticities of demand for cars as incomes increase
particularly at the average annual income levels of Jakarta commuters of around
$US8,000 to $US10,000105. Yagi and Mohammadia’s (2008) and Suryo et al.’s
(2007) demand models of transport mode choice in Jakarta also show the strong
positive significance of income in relation to car usage and, conversely, a negative
significance in relation to those using the motorcycle mode.
The negative sign and significance (1%) for gender (motorcycle) was as
hypothesised – a result also produced by Suryro et al.’s (2007), Yagi and
Mohammadian’s (2008) and Senbil et al.’s (2006) modal demand models. The
104 Lower income motorcycle owners tend to live in poorer areas surrounding Jakarta’s CBD while other non car owing commuters are dependent for reasons of economy on public transport.These results and interpretation are supported by Suryo et al. (2007) who found that the explanatory variable ‘wage level’ to be negative and significantly linked to motorcycle demand but not significant when the ‘time’ explanatory variable was introduced as a multiple of the wage level variable. 105 Suryo et al. (2007) do not enter wage levels as a separate explanatory variable in the car mode choice model output but only in concert with time and travel costs both of which are positive and significant for choice of the car mode of transport.
166
finding provides support for the assumption that males are far more willing than
females to endure the difficulties and discomfort inherent in motorcycle transport.
Gender was dropped from the car demand model given its low level of significance.
Explanatory variables testing the strength of aspirational demand for car ownership
did not have equivalents in the literature covered. A generally weak positive
significance level was revealed as hypothesised although there was greater
differentiation in responses than expected. Thus the role of friends and neighbours
owning cars shows a greater lack of significance than hypothesised. Equally not
anticipated is the negative sign and level of significance attached to the role of the
car as a desired lifestyle object. The positive and significant importance of status
was as hypothesised. In summary, indicated was a decided lack of affection for the
car as a rite of passage marker of affluence. Indeed for many commuters it can be
assumed that acute traffic congestion caused by cars has made it a negative rather
than a positive lifestyle attribute.
Where solutions to traffic issues are the focus of explanatory variables the
outcomes were not generally as hypothesised. Thus the view that more roads would
help reduce congestion is shown not to be significant in both the car and motorcycle
demand models. However, as noted in Section 7.7, this reflects rather, the
pervasiveness of agreement among all commuters on this statement (both car and
motorcycle owners and non owners). The variable relating to the willingness to pay
higher taxes to develop an improved public transport system is also not shown to be
significant. Again, an analysis of the survey data (Section 7.7) indicates a
supportive response in which there is no great differentiation between owners and
non owners of cars and motorcycles.
7.7 Market failure: public transport
The automotive and motorcycle demand model results provide support for the third
stage of full lock-in described in Chapters Three and Four. The indicated moderate
level of aspirational demand for automobiles is paralleled by a high demand for
private modes – both automobile and motorcycle – driven by the unmet demand for
efficient public transport. Thus it appears that commuters are increasingly aware of
167
(locked out) lower cost alternatives and of market failure in the form of a public
transport good which is in demand, but not supplied.
An analysis of the collective responses of commuters to questions posed in the final
survey concerning traffic issues and the use of cars reinforces these conclusions.
Two thirds of commuters were of the view (yes/strongly yes) that they needed a car
because public transport was inadequate. Equally, 70% of commuters
agreed/strongly agree they would like to reduce the usage of automobiles but were
unable to do so because there was simply no alternative.
On the assumption being locked into a high level of dependence on the private
automotive and motorcycle modes is a function of commuter lack of understanding
of positive feedback mechanisms, further questions were posed to test this. (see
Table 7.5). Responses to these (Likert scale) questions confirmed this assumption.
Approximately three quarters of all respondents in the preliminary and final surveys
agreed/strongly agreed with the statement that building more roads was an
important means of reducing traffic congestion. Responses to a further statement in
the preliminary survey that more toll roads were a means of congestion reduction106
produced a reduced, but still considerable level of support – 47% agree/strongly
agree with a further 26% being neutral to the proposal.
Nevertheless, other data from the preliminary and final surveys indicate commuters
are unequivocal about the need for increased public transport as a solution. Two
thirds of all commuters in both surveys agreed/strongly agreeing with the statement
‘I would be happy to pay more taxes if the Government would create a proper public
transport system’. Where the quid pro quo of better public transport is not present –
as in the final survey’s proposition ‘Those using private cars and motor cycles
should pay more at peak hour’ – a very different response is elicited from
commuters. Here, only a quarter responded positively with a further 30% opting for
the neither option. And while, as noted, misconceptions about the causes of
congestions are clearly present, also evident is a desire to better understand them.
A further statement in the final survey ‘I would like to understand better the causes
106 Due to the need to shorten the final survey this part of the questionnaire was not replica.
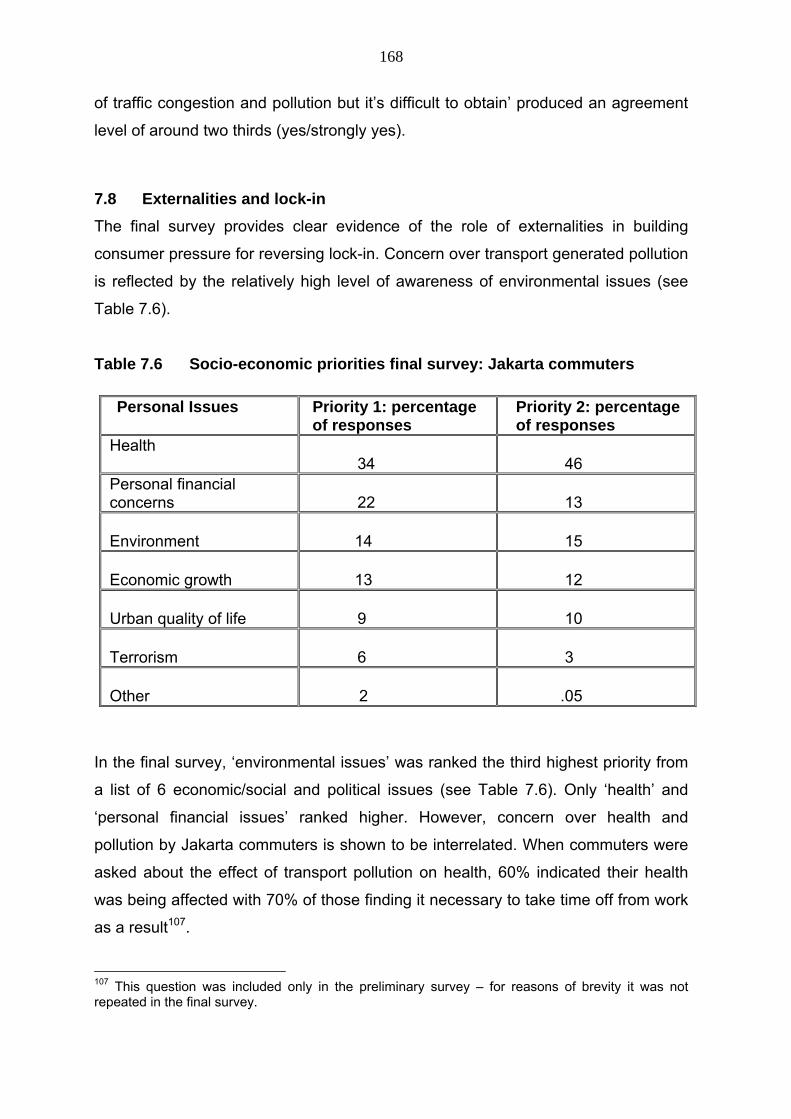
168
of traffic congestion and pollution but it’s difficult to obtain’ produced an agreement
level of around two thirds (yes/strongly yes).
7.8 Externalities and lock-in
The final survey provides clear evidence of the role of externalities in building
consumer pressure for reversing lock-in. Concern over transport generated pollution
is reflected by the relatively high level of awareness of environmental issues (see
Table 7.6).
Table 7.6 Socio-economic priorities final survey: Jakarta commuters
Personal Issues Priority 1: percentage of responses
Priority 2: percentage of responses
Health 34
46
Personal financial concerns
22
13
Environment
14
15
Economic growth
13
12
Urban quality of life
9
10
Terrorism
6
3
Other
2
.05
In the final survey, ‘environmental issues’ was ranked the third highest priority from
a list of 6 economic/social and political issues (see Table 7.6). Only ‘health’ and
‘personal financial issues’ ranked higher. However, concern over health and
pollution by Jakarta commuters is shown to be interrelated. When commuters were
asked about the effect of transport pollution on health, 60% indicated their health
was being affected with 70% of those finding it necessary to take time off from work
as a result107.
107 This question was included only in the preliminary survey – for reasons of brevity it was not repeated in the final survey.
169
Thus the high levels of sickness due to pollution indicate a greater level of concern
over pollution than is shown by its separation from health in the survey question.
The final survey further revealed that, in terms of the relative importance of various
environmental issues (Table 7.7), those relating to transport – either directly or
indirectly – ranked by far the most important. Sixty one percent of respondents rated
traffic congestion as the most important issue and a further 28% ranked air pollution
as the top priority. Some 75% and 61% of commuters ranked traffic congestion and
air pollution as either the first or second priority respectively. Not surprisingly
perhaps, as an over the horizon issue, climate change ranked only fifth in priority
order although 30% ranked it as either the first or second priority.
The pervasiveness of concern over the environmental externalities being generated
by automotive modal lock-in was further underlined by the modest influence of age,
education level and job status in the holding of these attitudes. Thus, in the ranking
of more complex issue of climate change the difference in the proportion of those
under and over 30 who put climate change as a top three priority, was not
significant. Nor was there a significant difference in views between those in
managerial and clerical positions. Education level showed a somewhat higher but
still relatively modest correlation with 36% of those with a university degree or
similar qualifications ranking climate change as a 1-3 in priority compared to 24% of
those with lower levels of education. Greater concern about climate change was
also evident among higher income cohorts.
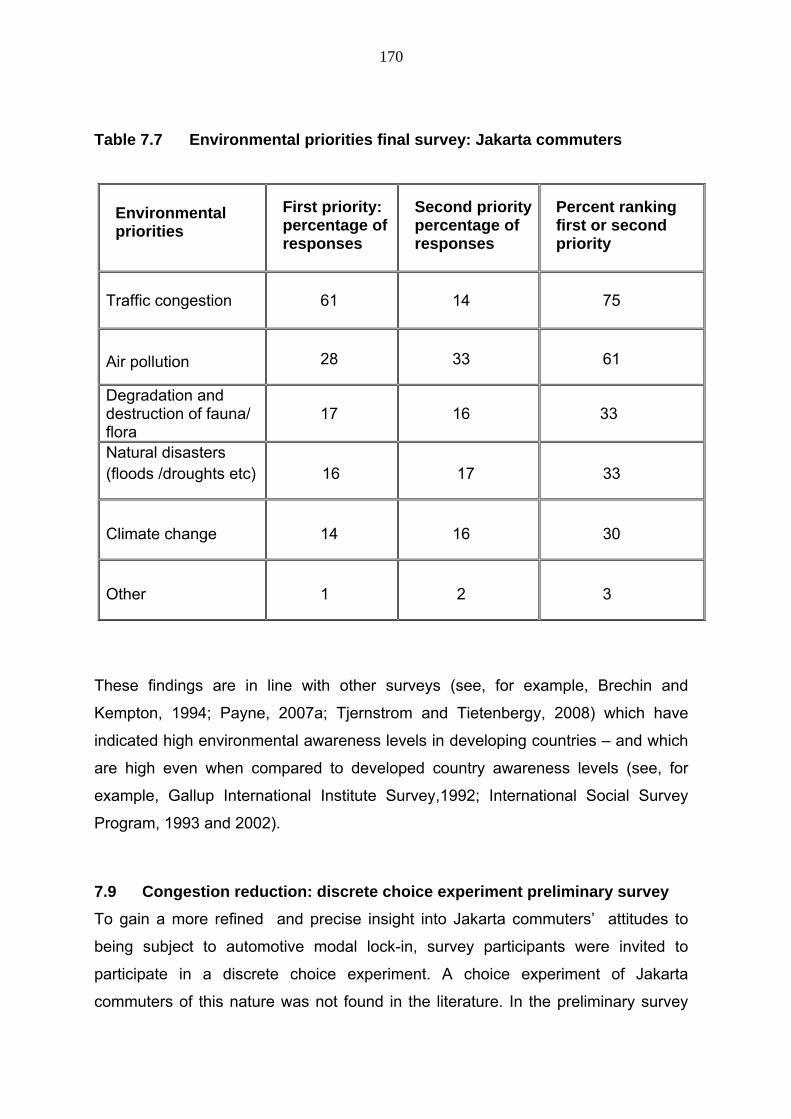
170
Table 7.7 Environmental priorities final survey: Jakarta commuters
These findings are in line with other surveys (see, for example, Brechin and
Kempton, 1994; Payne, 2007a; Tjernstrom and Tietenbergy, 2008) which have
indicated high environmental awareness levels in developing countries – and which
are high even when compared to developed country awareness levels (see, for
example, Gallup International Institute Survey,1992; International Social Survey
Program, 1993 and 2002).
7.9 Congestion reduction: discrete choice experiment preliminary survey
To gain a more refined and precise insight into Jakarta commuters’ attitudes to
being subject to automotive modal lock-in, survey participants were invited to
participate in a discrete choice experiment. A choice experiment of Jakarta
commuters of this nature was not found in the literature. In the preliminary survey
Environmental priorities
First priority: percentage of responses
Second priority percentage of responses
Percent ranking first or second priority
Traffic congestion
61
14
75
Air pollution 28 33 61
Degradation and destruction of fauna/ flora
17
16
33
Natural disasters (floods /droughts etc) 16 17 33
Climate change 14 16 30
Other 1 2 3
171
the extent to which commuters were willing to pay higher taxes for reduced traffic
congestion and externalities was tested by creating choices which involved several
combinations of registration fees and entry taxes. These were matched with other
explanatory variables which included levels of traffic congestion, changes to
commuters’ health due to vehicular pollution, levels of CO2 emissions and
automotive travel costs. Participants were provided a description of the congestion
management scheme operating in Singapore where a capped level of annual
vehicle registrations and a CBD entry tax are used in combination. They were then
invited to make choices the effects of which were projected forward five years in
advance using current trends.
Automotive (one off) additional registration taxes were set at zero, Rp45 million
($A4,500108) and Rp90 million ($A9000) with corresponding taxes of RP10 million
($A1,000) and Rp6.75 million ($A1,750) for motorcycles. CBD entry taxes for
commuters were set at zero, Rp16,000 ($A1.60) or Rp32,000 ($A3.20) for cars and
Rp5,000 ($A0.50) and Rp10,000 ($A1.00) for motorcycles. The basis on which
these values were derived was set out in Chapter Five, Section 5.4.
Where both options are rejected participants were given the opportunity to opt for a
‘neither’ option in which no new taxes were levied. For this ‘business as usual’ case
it was assumed vehicle registrations would continue to increase at the current rate
of 12% per annum. The combined effect of both automotive and CBD entry taxes at
the above levels was calculated to slow or (at their maximum levels) halt further
increases in traffic congestion, but increase the cost of using a car or motorcycle.
Drawing on the indirect utility function specified in Chapter Six, Section 6.5, the
probability of selecting a particular level of tax can be expressed as a function of the
attributes of the alternatives and the alternative specific constant as shown in 7.1:
β +
(7.1)
108 Approximate exchange rate in December 2011.
172
where represents the probability of choosing one level of tax over another, β
refers to the alternative specific constant, and the vector of coefficients
associated with vectors of attributes describing the effects of transport modal lock-
in.
While colinearity between dependent variables did not permit derivation of valid
significance values, an analysis of the responses set out in Figures 7.1 and 7.2
provided a useful indication of the level of income trade-off commuters were willing
to make to bring about improved public transport. These levels provided the means
for setting the upper and lower limits of tax levels used in the final survey’s discrete
choice questionnaire.
Over one third were prepared to pay taxes which would have increased the cost of
a compact automobile by around 75% and pay a daily entry tax of ranging from no
payment to Rp32,000 ($A3.20). This would have decreased congestion over 5
years from a 76% business as usual rise to between a fall of 2.5% to a rise of 13%.
Only 4% chose the third ‘neither’ option which included no taxes and an unrestricted
increase in congestion. Some 10% of commuters made choices which committed
them to an average of approximately Rp9 million ($A900) annually in registration
charges and a further Rp7.5 million ($A750) in entry charges annually for a total of
Rp19 million ($A1,900) – equivalent to around 10% of average salaries of
automotive owners.
When income differences between car and motorcycle mode users are taken into
account – reflected in the lower levels of registration and entry taxes for the latter
mode – the results of the preliminary discrete choice experiment show a high level
of similarity between the two modes as indicated in Figure 7.2.
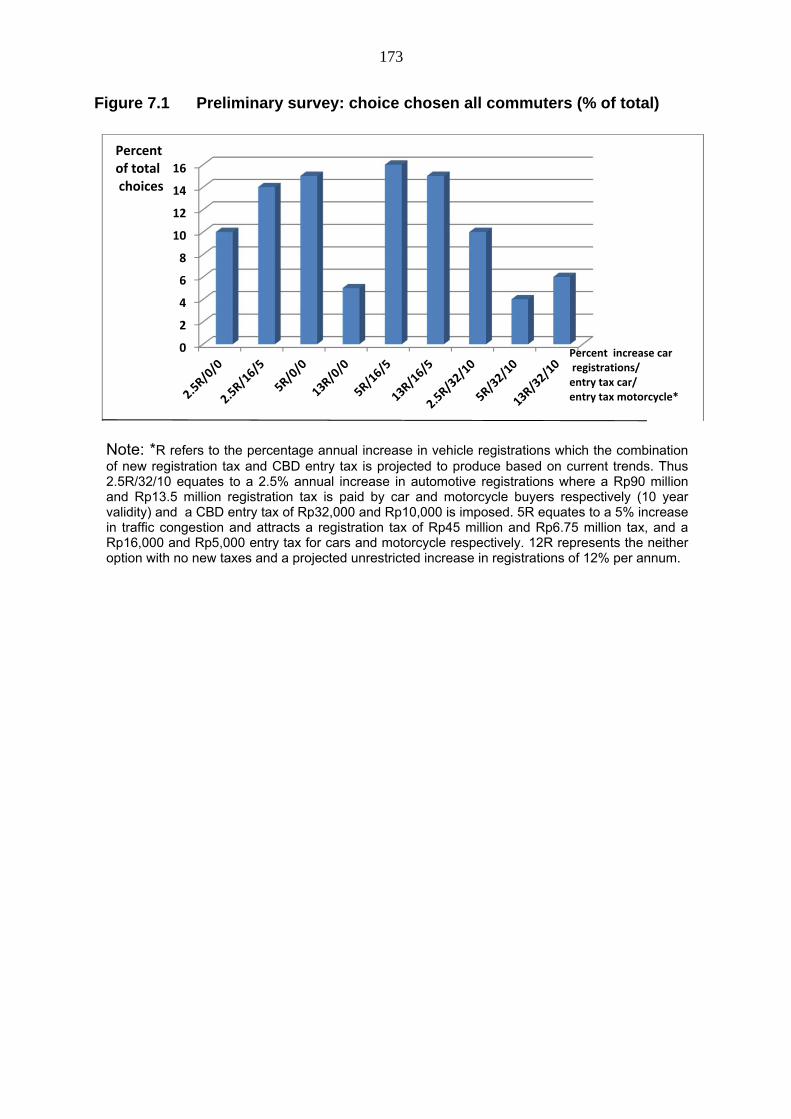
173
Figure 7.1 Preliminary survey: choice chosen all commuters (% of total)
Note: *R refers to the percentage annual increase in vehicle registrations which the combination of new registration tax and CBD entry tax is projected to produce based on current trends. Thus 2.5R/32/10 equates to a 2.5% annual increase in automotive registrations where a Rp90 million and Rp13.5 million registration tax is paid by car and motorcycle buyers respectively (10 year validity) and a CBD entry tax of Rp32,000 and Rp10,000 is imposed. 5R equates to a 5% increase in traffic congestion and attracts a registration tax of Rp45 million and Rp6.75 million tax, and a Rp16,000 and Rp5,000 entry tax for cars and motorcycle respectively. 12R represents the neither option with no new taxes and a projected unrestricted increase in registrations of 12% per annum.
0
2
4
6
8
10
12
14
16
Percent of totalchoices
Percent increase carregistrations/entry tax car/entry tax motorcycle*
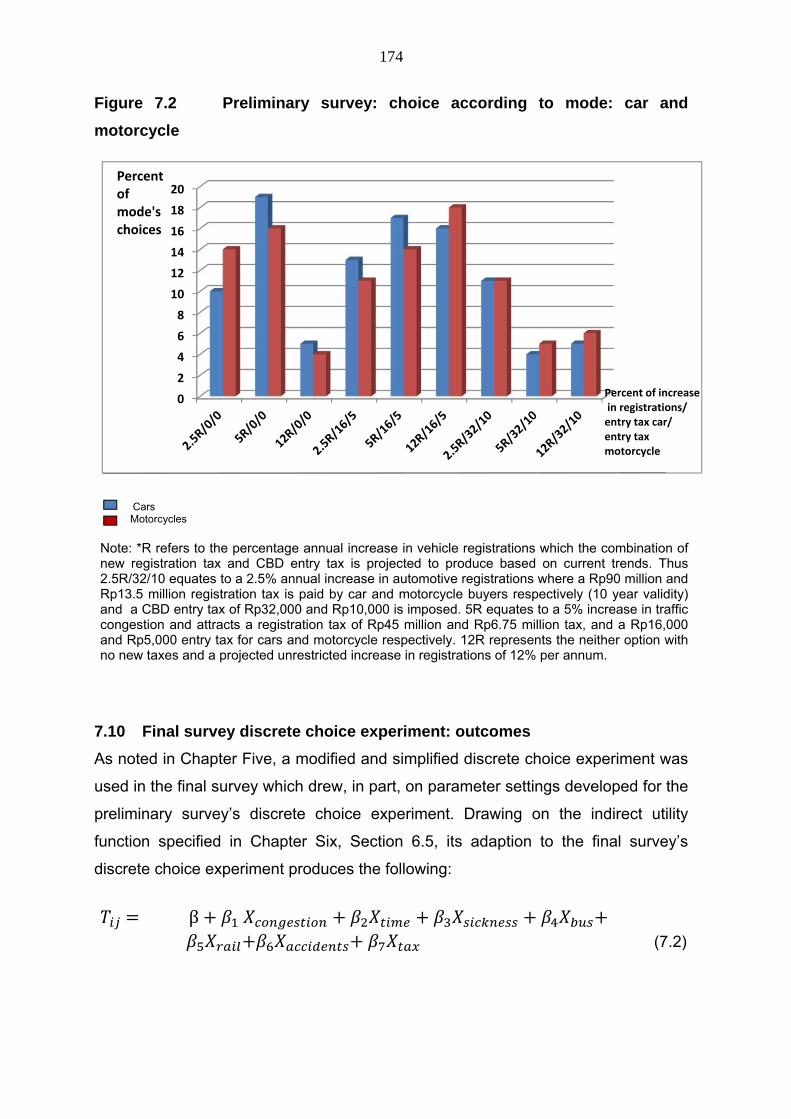
174
Figure 7.2 Preliminary survey: choice according to mode: car and
motorcycle
Cars Motorcycles
Note: *R refers to the percentage annual increase in vehicle registrations which the combination of new registration tax and CBD entry tax is projected to produce based on current trends. Thus 2.5R/32/10 equates to a 2.5% annual increase in automotive registrations where a Rp90 million and Rp13.5 million registration tax is paid by car and motorcycle buyers respectively (10 year validity) and a CBD entry tax of Rp32,000 and Rp10,000 is imposed. 5R equates to a 5% increase in traffic congestion and attracts a registration tax of Rp45 million and Rp6.75 million tax, and a Rp16,000 and Rp5,000 entry tax for cars and motorcycle respectively. 12R represents the neither option with no new taxes and a projected unrestricted increase in registrations of 12% per annum.
7.10 Final survey discrete choice experiment: outcomes
As noted in Chapter Five, a modified and simplified discrete choice experiment was
used in the final survey which drew, in part, on parameter settings developed for the
preliminary survey’s discrete choice experiment. Drawing on the indirect utility
function specified in Chapter Six, Section 6.5, its adaption to the final survey’s
discrete choice experiment produces the following:
β
(7.2)
0
2
4
6
8
10
12
14
16
18
20Percentof mode'schoices
Percent of increasein registrations/entry tax car/entry taxmotorcycle
175
where represents the probability of choosing one alternative over another, β
refers to the alternative specific constant, and the vector of coefficients
associated with vectors of attributes describing the effects of transport modal lock-
in.
The results for pooled data for all modes, car, motorcycle and ‘all other’ using a
conditional logit model as specified in Chapter Six are shown in Tables 7.8, 7.9,
7.10 and 7.11 respectively. The creation of choice profiles for each of the major
modes was considered necessary given the unusually high proportion of commuters
using motorcycles and the particularly low level of usage of public transport in the
commuter modal mix.
The structure of the discrete choice experiment, as discussed in Chapter Six was
specifically designed to provide a measure of the extent of transport modal lock-in
and an indication of what commuters collectively, and for each major mode, may be
prepared to pay to reverse lock-in. In doing so, the model differs in its structure and
outcomes from the literature covering transport stated preference experiments
which have tended to focus on policy issues such as the WTP for road congestion
charges, and modal preferences effects of alterations to fuel tax (see, for example,
FHWA 1997; Alpizar et al., 2003; Suryo et al., 2007 and Yagi and Mohommadian,
2008). Such studies have, therefore, focussed the consumer on tradeoffs which
would affect their daily commuting habits. In contrast, the thesis discrete choice
experiment has a wider focus, the aim of which is to allow commuters to make
choices based on the effects of the rise of congestion and indirect transport related
externalities (sickness due to pollution, accidents, and time lost) over time and
which characterise the acute market failure which lock-in represents. Thus, the
model spells out both the choices which involve options for fundamental changes to
the transport system (via means of a modal switch to public transport) and the
aggregated costs over time if the status quo is preserved. The focus is, therefore,
directed away from short term daily considerations and journey specific costs.
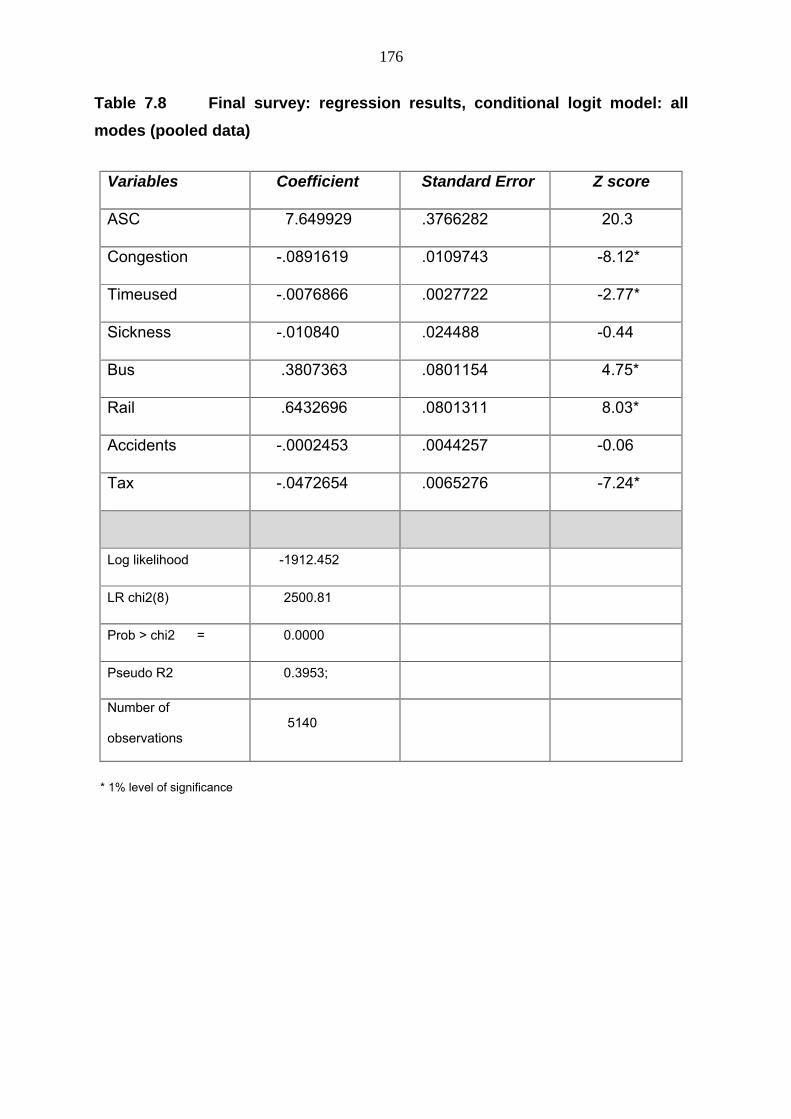
176
Table 7.8 Final survey: regression results, conditional logit model: all
modes (pooled data)
* 1% level of significance
Variables Coefficient Standard Error Z score
ASC 7.649929 .3766282 20.3
Congestion -.0891619 .0109743 -8.12*
Timeused -.0076866 .0027722 -2.77*
Sickness -.010840 .024488 -0.44
Bus .3807363 .0801154 4.75*
Rail .6432696 .0801311 8.03*
Accidents -.0002453 .0044257 -0.06
Tax -.0472654 .0065276 -7.24*
Log likelihood -1912.452
LR chi2(8) 2500.81
Prob > chi2 = 0.0000
Pseudo R2 0.3953;
Number of
observations 5140
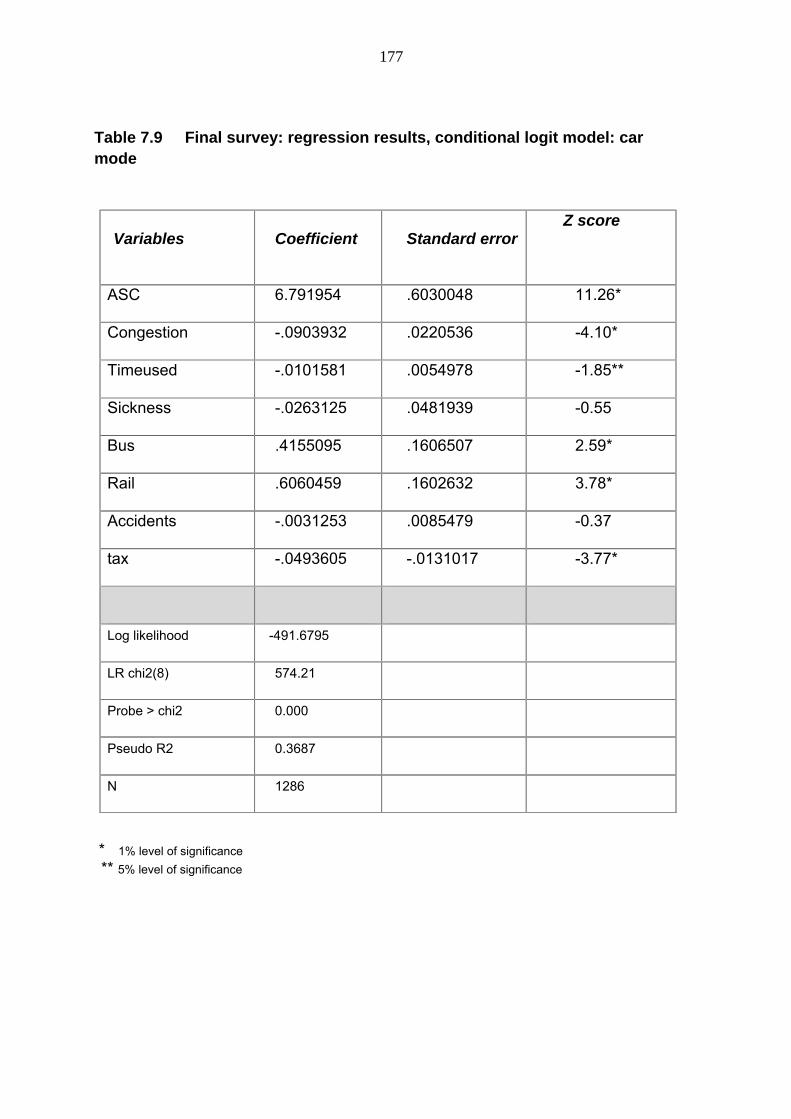
177
Table 7.9 Final survey: regression results, conditional logit model: car mode
* 1% level of significance ** 5% level of significance
Variables Coefficient Standard errorZ score
ASC 6.791954 .6030048 11.26*
Congestion -.0903932 .0220536 -4.10*
Timeused -.0101581 .0054978 -1.85**
Sickness -.0263125 .0481939 -0.55
Bus .4155095 .1606507 2.59*
Rail .6060459 .1602632 3.78*
Accidents -.0031253 .0085479 -0.37
tax -.0493605 -.0131017 -3.77*
Log likelihood -491.6795
LR chi2(8) 574.21
Probe > chi2 0.000
Pseudo R2 0.3687
N 1286
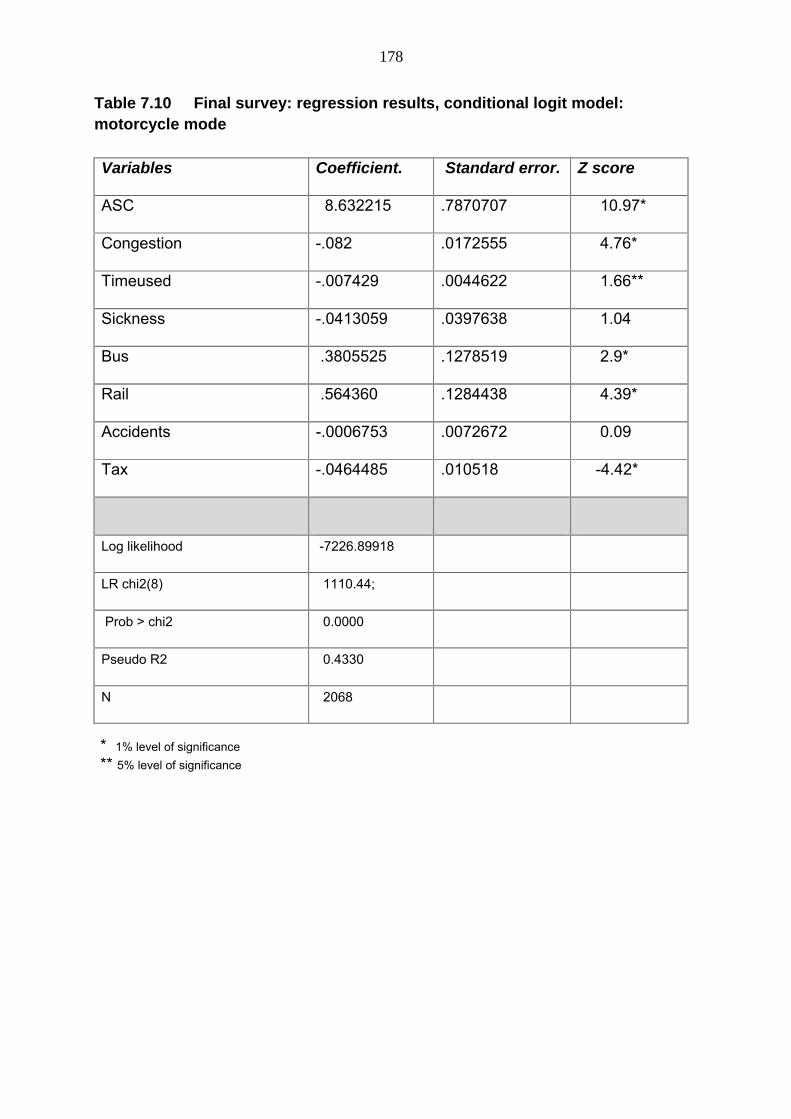
178
Table 7.10 Final survey: regression results, conditional logit model: motorcycle mode
* 1% level of significance ** 5% level of significance
Variables Coefficient. Standard error. Z score
ASC 8.632215 .7870707 10.97*
Congestion -.082 .0172555 4.76*
Timeused -.007429 .0044622 1.66**
Sickness -.0413059 .0397638 1.04
Bus .3805525 .1278519 2.9*
Rail .564360 .1284438 4.39*
Accidents -.0006753 .0072672 0.09
Tax -.0464485 .010518 -4.42*
Log likelihood -7226.89918
LR chi2(8) 1110.44;
Prob > chi2 0.0000
Pseudo R2 0.4330
N 2068
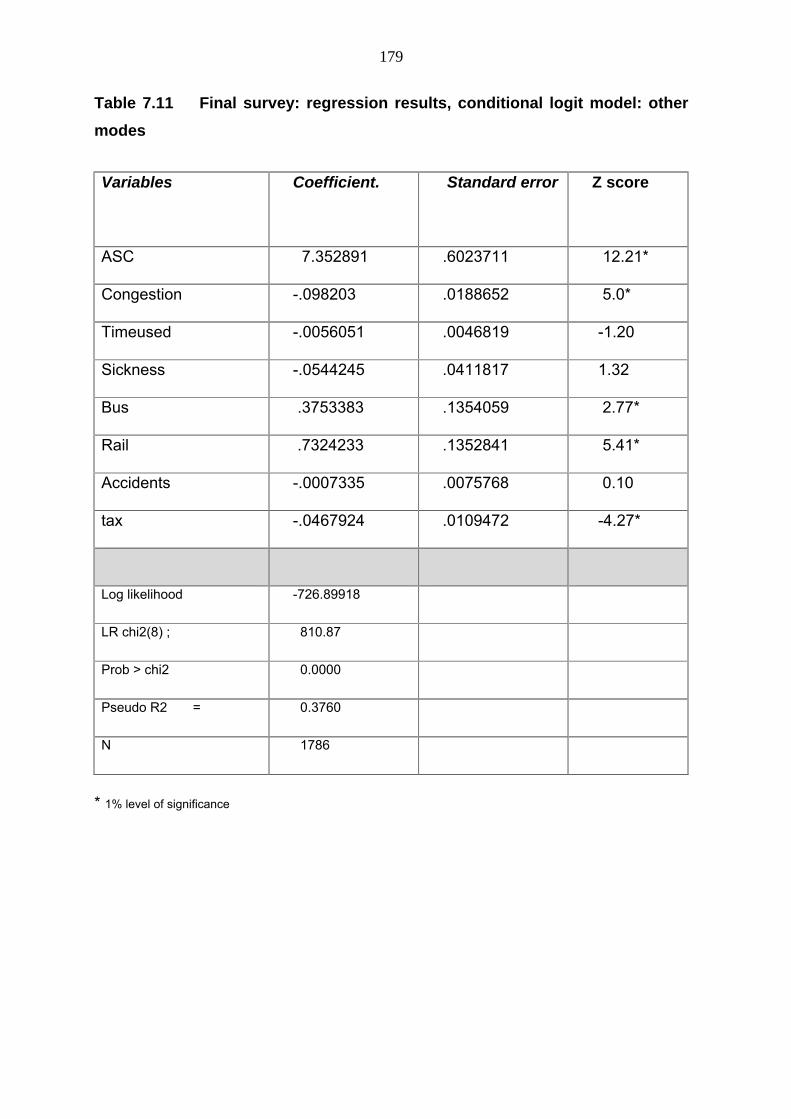
179
Table 7.11 Final survey: regression results, conditional logit model: other
modes
* 1% level of significance
Variables Coefficient. Standard error
Z score
ASC 7.352891 .6023711 12.21*
Congestion -.098203 .0188652 5.0*
Timeused -.0056051 .0046819 -1.20
Sickness -.0544245 .0411817 1.32
Bus .3753383 .1354059 2.77*
Rail .7324233 .1352841 5.41*
Accidents -.0007335 .0075768 0.10
tax -.0467924 .0109472 -4.27*
Log likelihood -726.89918
LR chi2(8) ; 810.87
Prob > chi2 0.0000
Pseudo R2 = 0.3760
N 1786
180
The variable ‘congestion’ provides a measure of the expected increase in traffic
congestion over a year using recent average increases in car and motorcycle
registrations for Jakarta (the value levels are discussed in Sections 5.5.1 and 5.6 in
Chapter Five). The 1% significance level of congestion for all modes, car,
motorcycle and other modes underlines this variable’s primary importance in
choices made by commuters. Indicated therefore is commuters’ strong preference
for choices which produce a reduction in the existing level of traffic congestion.
‘Timeused’ indicates (as discussed in Section 5.6 Chapter Five) varying levels of
travelling time increase to and from the workplace in hours per year. It is highly
significant for commuters as a whole and those commuting by car (1%) but
somewhat less so for motorcycle commuters (5%) and the ‘other’ cohort of
commuters. As can be expected both congestion reduction and travel time
reduction is shown to be most important for those commuting by car and whose
time valuation in terms of average wage is highest. Given the shorter average trips
made by motorcyclists, the lower importance of time reduction is not unexpected.
The significantly lower importance attached to time reduction by ‘other’ commuters
indicates the inclusion of the lowest wage level group (those travelling by public
transport) and therefore a low time valuation.
Noted in the explanatory introduction to the choice experiment given to respondents
(see, Appendix 5.4), is the assumption that all taxes raised by increasing
registration fees and imposition of a CBD entry tax would be allocated to
improvement of public transport in Jakarta. ‘bus’ and ‘rail’ represent binary choices
variables regarding the need for improvement to their services (y/n). Importantly,
these choices provided commuters options which could contribute to a reversal of
transport modal lock-in through the upgrading of public trains and/or bus transport
services. Both the rail and bus improvement explanatory variables are significant at
the 1% for all modes combined as well as for the automotive, motorcycle and other
modes – an acknowledgement by commuters across the board of the importance of
improving public transport. A further clear preference indicated by the choice model
is for improvement to rail transport over bus transport by all commuter groups. The
regression coefficients indicate that this preference is particularly marked for the
‘other’ commuter cohort which is primarily comprised of users of public transport.
181
This may be explained in terms of the poorly regulated, chaotic state of the overly
numerous bus services in Jakarta and their evident role in significantly contributing
to generation of traffic congestion. This is in spite of the presence of the much
publicised BRT bus rapid transit system which is one of the largest globally.
However it carries only 1.5% of commuter traffic in Jakarta notwithstanding its 172
km of dedicated busways and over 520 buses (Maimunah et al., 2012). This is be
explained by its limited reach (in a conurbation which accommodates 35 million and
covers 5,500 square kilometres), it’s badly run down state, and given, reportedly, it
is running at 25% capacity (Macbeth, 2012). And while studies show there are
major organisational improvements to the bus system (Arifin et al., 2011) potential
commuters are evidently not impressed.
The tax variable – representing the combination of higher registration fees and CBD
entry tax – carries a negative sign and is also significant at the 1% level and for all
modes. This indicates that, as could be expected, in making choices, commuters
chose, where possible, lower levels of tax. Nevertheless, an analysis of the
response data (see Figure 7.3) shows almost 80% of commuters were still willing to
pay a not insubstantial level of tax to reduce congestion with well over half willing to
pay between 5% and 17% of their annual wage. This capacity is spread relatively
evenly over the option levels of between 1% and 17% of annual income. The
regression coefficients indicate the level of reluctance to pay higher levels of tax is
spread reasonably evenly with the strongest reluctance among those commuting by
car suggesting that those who have already made a substantial investment in an
alternative mode of transport (to that of the public mode) are reluctant to bear too
much of the cost of improving bus and train services.
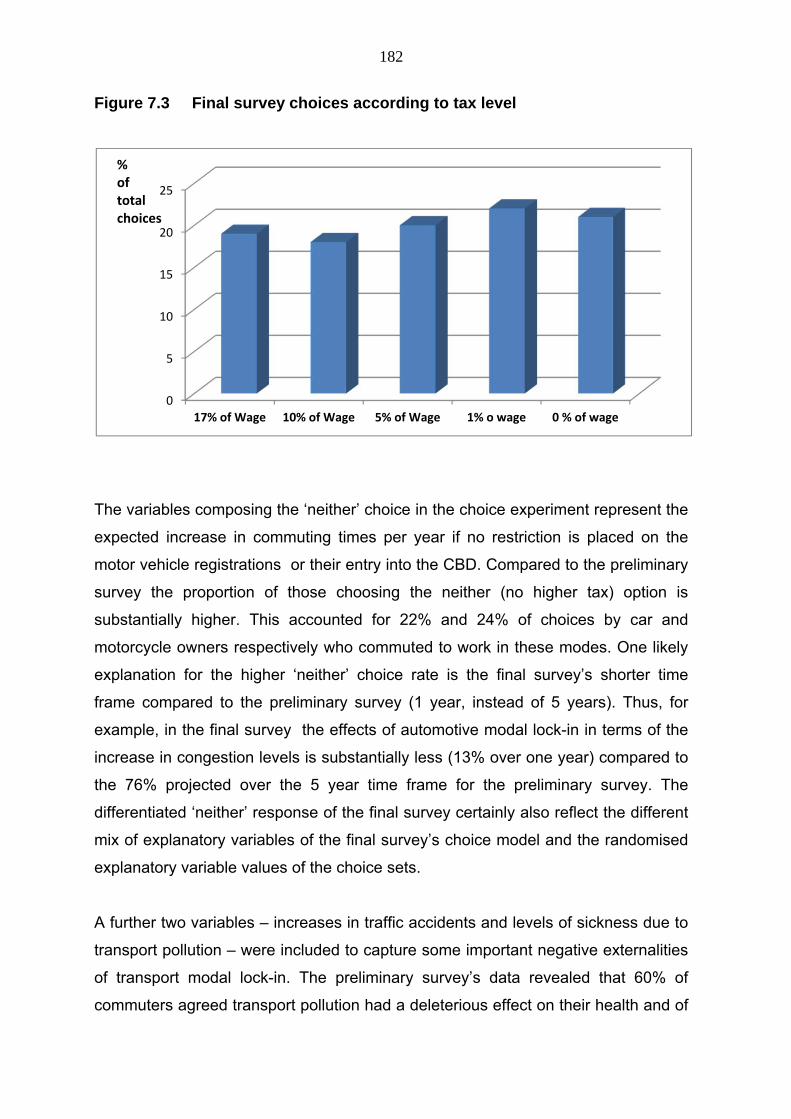
182
Figure 7.3 Final survey choices according to tax level
The variables composing the ‘neither’ choice in the choice experiment represent the
expected increase in commuting times per year if no restriction is placed on the
motor vehicle registrations or their entry into the CBD. Compared to the preliminary
survey the proportion of those choosing the neither (no higher tax) option is
substantially higher. This accounted for 22% and 24% of choices by car and
motorcycle owners respectively who commuted to work in these modes. One likely
explanation for the higher ‘neither’ choice rate is the final survey’s shorter time
frame compared to the preliminary survey (1 year, instead of 5 years). Thus, for
example, in the final survey the effects of automotive modal lock-in in terms of the
increase in congestion levels is substantially less (13% over one year) compared to
the 76% projected over the 5 year time frame for the preliminary survey. The
differentiated ‘neither’ response of the final survey certainly also reflect the different
mix of explanatory variables of the final survey’s choice model and the randomised
explanatory variable values of the choice sets.
A further two variables – increases in traffic accidents and levels of sickness due to
transport pollution – were included to capture some important negative externalities
of transport modal lock-in. The preliminary survey’s data revealed that 60% of
commuters agreed transport pollution had a deleterious effect on their health and of
0
5
10
15
20
25
17% of Wage 10% of Wage 5% of Wage 1% o wage 0 % of wage
%of total choices
183
these 70% found it necessary to take time off work as a result109. It was, therefore,
hypothesised that the views of both car and motorcycle owners would be negatively
correlated with this explanatory variable as it would be for the increase in accidents
which, as noted, in Chapter Five Section 5.6, had been increasing at an extremely
rapid rate. While the signs for both were, as expected, negative for all modes,
neither showed significance at the 10% level or less. The more vulnerable ‘other’
commuters were shown to be the most keen to make choices which involved
reducing accident rates; the least concerned being the less vulnerable car owners.
Those most concerned about reducing the health effects of congestion were also
the ‘other’ cohort followed by motorcycle commuters – both groups which are
directly exposed to automotive induced pollution. Indicated, therefore, is that the
issues of health and accidents were of secondary importance in guiding choices in
which the more immediate considerations of securing a faster and more efficient
transport system and the improvement of its public modes took far greater
precedence.
7.11 Final survey: WTP
Set out below are WTP estimations for those variables which have significantly
affected choice – ‘congestion’, ‘time saved’ and improvements to bus and rail
services. They have been derived from the coefficients using equation 7.2 above
and the final survey’s choice experiment outcomes set out in tables 7.8, 7.9, 7.10
and 7.11. Given large disparities between the incomes of automotive and
motorcycle commuters, the WTP was further broken down into three cohorts –
those using cars, motorcycles and other modes. The latter includes public transport
(18% of all commuters), taxis and Omprengan (10%),110 Ojek/Bjaj (3%),111 bicycle
and walking (3.5%).
109 Given the need to shorten the survey this question was not repeated in the final version.
110 Omprengan is the unofficial system of private cars being used commercially for commuting. 111 Small three wheel single/two person transport.
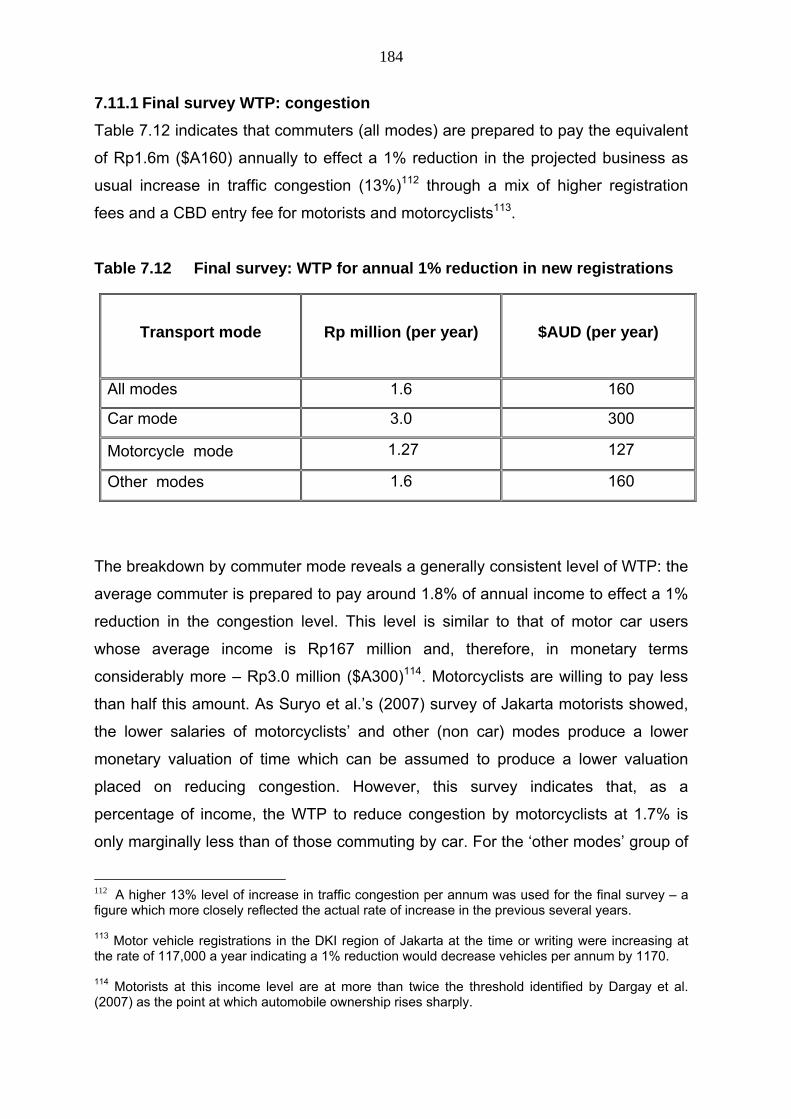
184
7.11.1 Final survey WTP: congestion
Table 7.12 indicates that commuters (all modes) are prepared to pay the equivalent
of Rp1.6m ($A160) annually to effect a 1% reduction in the projected business as
usual increase in traffic congestion (13%)112 through a mix of higher registration
fees and a CBD entry fee for motorists and motorcyclists113.
Table 7.12 Final survey: WTP for annual 1% reduction in new registrations
Transport mode
Rp million (per year)
$AUD (per year)
All modes 1.6 160
Car mode 3.0 300
Motorcycle mode 1.27 127
Other modes 1.6 160
The breakdown by commuter mode reveals a generally consistent level of WTP: the
average commuter is prepared to pay around 1.8% of annual income to effect a 1%
reduction in the congestion level. This level is similar to that of motor car users
whose average income is Rp167 million and, therefore, in monetary terms
considerably more – Rp3.0 million ($A300)114. Motorcyclists are willing to pay less
than half this amount. As Suryo et al.’s (2007) survey of Jakarta motorists showed,
the lower salaries of motorcyclists’ and other (non car) modes produce a lower
monetary valuation of time which can be assumed to produce a lower valuation
placed on reducing congestion. However, this survey indicates that, as a
percentage of income, the WTP to reduce congestion by motorcyclists at 1.7% is
only marginally less than of those commuting by car. For the ‘other modes’ group of
112 A higher 13% level of increase in traffic congestion per annum was used for the final survey – a figure which more closely reflected the actual rate of increase in the previous several years. 113 Motor vehicle registrations in the DKI region of Jakarta at the time or writing were increasing at the rate of 117,000 a year indicating a 1% reduction would decrease vehicles per annum by 1170. 114 Motorists at this income level are at more than twice the threshold identified by Dargay et al. (2007) as the point at which automobile ownership rises sharply.
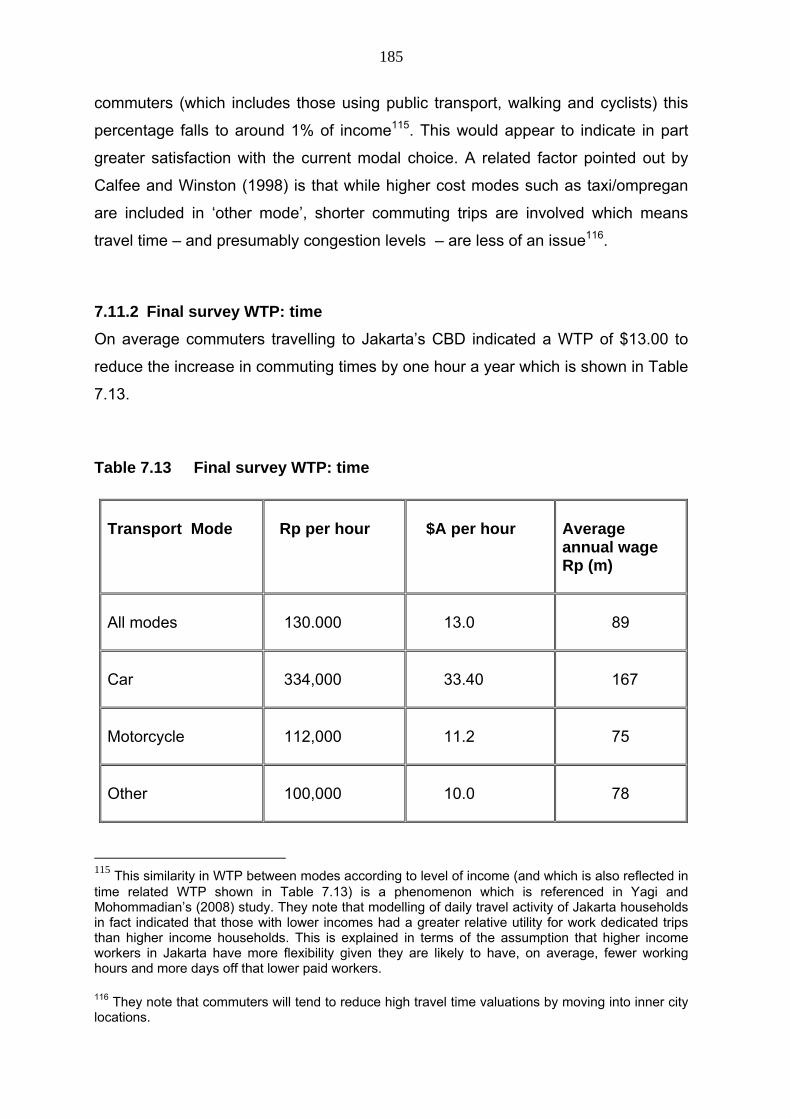
185
commuters (which includes those using public transport, walking and cyclists) this
percentage falls to around 1% of income115. This would appear to indicate in part
greater satisfaction with the current modal choice. A related factor pointed out by
Calfee and Winston (1998) is that while higher cost modes such as taxi/ompregan
are included in ‘other mode’, shorter commuting trips are involved which means
travel time – and presumably congestion levels – are less of an issue116.
7.11.2 Final survey WTP: time
On average commuters travelling to Jakarta’s CBD indicated a WTP of $13.00 to
reduce the increase in commuting times by one hour a year which is shown in Table
7.13.
Table 7.13 Final survey WTP: time
Transport Mode
Rp per hour
$A per hour
Average annual wage Rp (m)
All modes
130.000
13.0
89
Car
334,000
33.40
167
Motorcycle
112,000
11.2
75
Other
100,000
10.0
78
115 This similarity in WTP between modes according to level of income (and which is also reflected in time related WTP shown in Table 7.13) is a phenomenon which is referenced in Yagi and Mohommadian’s (2008) study. They note that modelling of daily travel activity of Jakarta households in fact indicated that those with lower incomes had a greater relative utility for work dedicated trips than higher income households. This is explained in terms of the assumption that higher income workers in Jakarta have more flexibility given they are likely to have, on average, fewer working hours and more days off that lower paid workers. 116 They note that commuters will tend to reduce high travel time valuations by moving into inner city locations.
186
This compares with the commuters’ average hourly wage of around 54,000
($A5.40). This figure is high in relation to a number of other studies in other
countries, although such estimations show notoriously wide variations. Asensio
(2002) in a Barcelona, Spain survey of transport mode choice, produces a travel
time valuation of 92% of the wage rate (with a top value of 33.5 Euros for car
travellers) and refers to studies by Train (1980) and Truong and Hensher (1985)
which produce time valuation by car commuters well in excess of 100%. McFadden
and Talvitie and Associates (1977) put the time valuation’s proportion of hourly
wage rate at 49% in a Californian study. Small (1997) found that travel time
valuations could vary from between 20% to 100% of wages according to the country
of survey. Travel time valuations are also shown to vary markedly according to age,
income of interviewees, and to the timing of trips (Small et al., 2005).
Geographical location of the discrete choice experiment (see, Chapter Five, Section
5.3) is also clearly a source of variation in the WTP for time. Greater Jakarta being
one of the largest conurbations in the world, is highly unusual in having no effective
mass transit system generating extreme and continuous levels of congestion. These
reasons are cited by Suryo et al. (2007) in explaining Jakarta’s commuters’
relatively high WTP.
While part of the higher WTP time valuation may be accounted for by the above,
there are clearly more fundamental reasons. A likely source is the design of the
choice model. Hensher (2001a) emphasises significant differences in time travel
valuation occur according to the way in which choice models are structured. Thus
the comparison of the design of travel time valuation experiments in much of the
literature and in particular the Jakarta choice experiment carried out by Suryo et al.
(2007), underlines some fundamental differences with the final survey choice
model. In particular the time frames differ significantly to that of past studies. The
survey’s discrete choice experiment focuses participants on the consequences of
remaining locked into the status quo by providing an explicit indication of the
consequences of this choice over time. The choice participant is, therefore,
encouraged to value time over a year rather than simply on individual trips. As
187
noted by Small et al., 2005) once time frames are extended, WTP valuations can be
expected to increase:
“….decisions underlying VOT (value of travel time) and VOR (value of reliability of
transport) depend critically on the length of time over which behaviour can change.
On any given day once a trip plan is made, disruptions to that plan due to
scheduling may be quite costly, whereas known time savings may have limited
value. Over a long time horizon, by contrast, one can adjust to one’s activity
patterns to accommodate some unreliability, and also to take greater advantage of
time savings. The intuitive considerations lead us to expect that over short time
spans, VOT (valuation of time) may be smaller and VOR larger over long spans.
Peer et al. (2011) indeed find such a pattern and it is quite marked” (page 11).
Small’s reasoning appears to be borne out by the decrease in the percentage of
those taking the neither (no tax) choice option in the preliminary survey which uses
a five year time frame compared to the one year time frame used in the final
survey’s choice experiment.
The discrete choice experiment’s method of creating a monetary variable (tax as a
percentage of annual income) is also likely to influence the WTP time valuation. The
intent of the annualised figure – as in other parts of the discrete choice experiment –
is to encourage participants to consider alternatives as part of a long term strategy
and in the context of his annual income rather than daily travel budgets. In this, the
choice questionnaire differs markedly from other surveys which have also sought to
measure time travel value but using a narrower frame of reference and in terms of
daily travel habits.
In terms of the choice variable relating to the reduction in congestion, motorcycle
commuters show a lower monetary willingness to pay for travel time compared to
car commuters and similarly for ‘other modes’ but a considerably smaller differential
in WTP when expressed as a percentage of income.
188
7.12 Conclusion
Interpretation of the survey’s data produces a number of important validations for
the first two of the key thesis hypotheses and of the nature of the third full lock-in
stage of the thesis model.
The first hypothesis (see, Chapter One, Section 1.3) is that: ‘In developing
countries, negative externalities will produce falling levels of aspirational demand for
the automotive mode of transport and rising levels of support for reversal of
automotive modal lock-in’. The second linked hypothesis is that this form of lock-in
is a product of the failed market’s inability to provide a viable cost effective public
transport alternative rather than the automotive mode’s inherent competitive
advantage.
The surveys of Jakarta commuters indicate demand for cars is only weakly linked to
aspirational lifestyle motivations – highlighted by the negative significance of the
statement that automotive ownership was a desired element of lifestyle. On the
other hand it is generally accepted that motorcycles are intrinsically limited in their
aspirational value. The unusually high proportion of Jakarta’s commuters (two
thirds) who nevertheless use these two forms of private transport and collectively
have precipitated automotive modal lock-in, therefore requires an explanation that
goes beyond that offered by most of the literature. The thesis modelling of
automotive and motorcycle demand and choice modelling provide some new
insights which help to explain this in terms of the interrelated nature automotive
modal lock-in, commuter income levels and demand for private modes of transport.
Support is provided for the hypothesis that poor public transport is a critically
important cause – a view recently proposed by Doe and Asano (2011). The
automotive demand models provide some strong evidence of this. The explanatory
variables ‘income’ and ‘use car/publictrans’ (the view that motor car use would be
reduced if adequate public transport were available) are both significant at the 1%
level in the car demand model. The implication here is that higher incomes are
facilitating higher levels of car ownership and use which is in turn increasingly a
product of the absence of adequate public transport – rather than aspirational
motivations. As noted, this assumption is given credence by the negative
189
significance of the ‘lifestyle’ explanatory variable. In other words motorists see the
car more of a hindrance that a contributor to a better lifestyle. Thus aspirational
demand for cars is indicated to be relatively weak notwithstanding strongly rising
incomes and high per capita ownership levels.
By contrast the explanatory variable income in the motorcycle demand model has a
negative sign and a 1% significance level. This indicates that the lower the income
of commuters, the higher the demand for motorcycles – again an indication of non
aspirational drivers.
Inadequate public transport as a key driver of demand for private transport is
equally reflected in commuter preferences for improving rail and bus services (both
significant at the 1% level). Moreover 78% of survey respondents made choices
which indicated a willingness to pay new registration and CBD entry taxes to reduce
car and motorcycle usage and provide a source of revenue to invest in better public
transport. Indicated, therefore, is that commuters would willingly use rising incomes
to improve public transport rather than increase car or motorcycle ownership.
The preliminary survey’s choice model outcome shows that, on average, car owners
and motorcyclists were willing to pay annually around Rp46 million and Rp9.3
million respectively to reduce congestion – the equivalent of 5.3% and 2.4% of the
average wage of motorists and motorcyclists117. Importantly these choice model
commitments, as indicated in Figure 7.3, were relatively evenly spread between
various tax levels proposed.
A more precise and robust measure of these preferences is provided by WTP for
congestion and time reduction estimates derived from the final survey’s choice
experiment. In doing so the thesis uses a different methodology to that followed in
most transport literature modelling WTP. The final survey choice experiment
projects outcomes a year ahead and poses choices which put the monetary
contribution in terms of percentage of annual salary. The outcomes, not surprisingly,
117 Based on an average monthly salary of participants recorded in the first survey of approximately Rp7 million per month.
190
indicate relatively high values which might not be replicated if WTP estimates were
derived by choices which involved one off payment for entry taxes or as a one off
registration surcharge on automobiles. It is argued that the values produced from
the final survey data do, nevertheless, indicate a valid price commuters put on the
effects of congestions. This view is supported by the preliminary choice experiment
which, with its longer five year time scenario, also records the relatively high income
percentages commuters were willing to pay to reduce congestion and improve
public transport.
The higher choice of the ‘neither’ option in the final survey seems to suggest the
one year time frame – and, therefore, lower levels of direct costs and indirect
negative externality levels – also plays a role in WTP valuations. A measure of the
relative importance of these transport negative externalities is provided by the
survey data and modelling. Attitudinal ranking show between two thirds and three
quarters of commuters had high levels of concern over traffic externalities such as
health, congestion and pollution. Importantly there was no substantial differentiation
in views between income levels, education or position ranking.
However, the choice modelling indicates that for both car and motorcycle
commuters the dependent variables relating to health and accident rates were not
significantly correlated to choices made. It can be assumed, therefore, that
important as these issues may have been to commuters, in terms of choice
preferences the reduction of congestion levels followed by commuting time were far
more significant drivers of preferences. This is not surprising given the length of
commuting distances (for over half the commuters the daily average being greater
than 20 km), and the severity and frequency of acute traffic congestion. The
demand model for car ownership also reveals that commuting time rated as one of
the most significant issues for car ownership – although not for motorcycle
ownership where trip times are significantly shorter. For the younger, single and
mostly male motorcycle owners the survey data indicates generally lower levels of
concern over health and accident rates and clearly represent a reason for the lack
of significance of these variables in the choice modelling. Thus commuters exhibited
in their preoccupation with congestion and commuting times the overriding
importance of near term work related economic concerns.
191
The surveys’ attitudinal questions also provide some further insights into the nature
of the Jakarta conurbation’s stage 3 automotive modal lock-in. In particular revealed
is the extent to which commuters appear largely unaware of critical issues which
play a major role in the development of transport modal lock-in and higher
congestion. Thus, 73% agreed/strongly agreed with the statement that it was very
important to build more roads to reduce traffic congestion – an acknowledged
positive feedback mechanism. Two thirds of commuters indicated they needed
more information on the causes of traffic congestion and pollution.
These findings and commuter attitudes as revealed in the demand and choice
models have important implications for the development of a better understanding
of the way in which automotive lock-in evolves in a developing country context and
how its modelling might be further developed. The findings also have implications
for the development of Jakarta’s transport strategies and the way in which they can
be fashioned to ensure the support of commuters. These issues are discussed in
the concluding Chapter Eight.
192
CHAPTER EIGHT: CONCLUSIONS AND POLICY IMPLICATIONS
8.1 Introduction
This chapter summarises the theoretical and empirical contributions of the thesis to
the literature on path dependence and lock-in, particularly as it applies to transport
systems. These contributions are three fold. The first is the development of an
explanatory framework which seeks to set out in a systematic way the evolutionary
path of lock-in of a large technological system. This is achieved through an
historical study of the emergence of automotive modal lock-in in conurbations in the
U.S.A. and in a number of developing and former developing Asian countries.
Identified through an analysis of key market actors are three stages in which
automotive modal lock-in develops. A distinguishing feature of these stages is the
importance of positive feedback mechanisms and the way in which asymmetric
market forces – and in particular asymmetries of information and influence – can
further heighten their key role the creation and durability of this form of lock-in.
A second contribution is in the form of an empirical study of commuters in the
Jakarta conurbation. This provides validating evidence for the explanatory
framework’s description of stage 3 of automotive modal lock-in which Jakarta is
assessed to have reached. The third contribution is provided by the development of
demand and discrete choice experiments using the survey’s data and which provide
indicators of the strength and reversibility of the third stage of automotive modal
lock-in in Jakarta and further validation of the nature of stage 3 automotive modal
lock-in in developing countries.
Strategies for the reversal of automotive modal lock-in in developing countries are
then examined in the light of the research and policies adopted by the municipal
governments of Seoul and Beijing. The survey choice experiment findings – which
indicate high levels of consumer demand for a modal change to public transport –
are discussed in the context of ongoing automotive modal lock-in. Identified is the
193
highly inelastic demand for the automotive mode and the consequent high tax levels
needed if market oriented policies designed to induce modal switching are adopted.
The nature of the exogenous shock needed to dislodge the market equilibrium is
discussed drawing on the examples of Seoul and Beijing.
Research limitations and in particular the difficulties in the measuring of influence
are discussed. A number of venues for further study are explored including the need
for more focussed studies on the role of influence in driving the process of
automotive lock-in. A need is identified to further develop the explanatory framework
which can contribute to a more sophisticated model of the way in which path
dependent growth of technological systems are prone to market failure and lock-in.
Equally, further research is needed to assess the prevalence of this form of lock-in,
and the particular role of information and influence asymmetries in their creation.
8.2 Theoretical contribution
The focus of this thesis has been on the way in which path dependent growth of a
large market reaches and remains in a state which is non-Pareto efficient. In such
an analysis it has been necessary to accommodate the notion that history matters.
That is historical events as distinct from market forces can and often do play a
critical role in determining whether markets fail and whether this state takes on a
durable form. This line of enquiry is stimulated by North’s (1996) questioning of the
underpinnings of classical economics in an historical context. North poses the
question if incentives are the primary driver of economic growth, why then has
economic growth and efficiency so often in history not been the outcome? North
turns to path dependence as an explicatory methodology:
“We need to understand path dependence and its implications because it plays a
major role in constraining change. As yet we know only that it is a fundamental
regularity that makes clear that history matters. But the gradual accretion of
empirical evidence should enable us to understand exactly what are the sources”
(page 21).
194
A literature review reveals this gradual accretion is still very much an ongoing
process and, in particular, that analysis of the way in which large socio-
technological systems evolve in a path dependent manner remains an incomplete
area of study. This thesis has, therefore, focussed on some of the gaps and
inadequacies in the relevant theoretical development of the literature. Of central
interest is the way in which the evolution of large technological and socio- economic
systems has generally been pictured by economic theorists such as Geels (2005),
North (1996) and Unruh (2000) as an ongoing process without clearly defined
stages. Thus Unruh (2000) chooses not to develop a description of lock-in which is
shaped by evolutionary changes in the way companies, governments and
consumers operate. Rather, he sees the process of path dependence as a process
in which all such changes are an ongoing process.
The first part of this thesis is, therefore, devoted to creating a more structured
analysis of automotive modal lock-in in which the changing role of key market actors
is used as an insightful way of describing the path dependent evolution of lock-in.
The applicability of this methodology relates to the nature of the market for transport
modes and the central importance of influence interdependencies of its three key
market actors – the automotive socio-economic regime, government and
consumers. A first stage is shown to be one in which conventional equilibrium
theory can be used to characterise the transport market’s operation. The level of
independence between consumers, industry suppliers and governments allows the
market to function as a reasonably efficient allocator of resources. It is a stage
where, after the initial emergence of the IC automotive technology, it gains market
dominance and reaps increasing returns from large scale production and
consumption. An important distinction is, therefore, made with theorists such as
Unruh who depict the successful and rapid path dependent growth of the IC engine
being catalysed in the initial stage of its emergence at which point it is described as
technologically inferior to its key competitors. However, in the first stage of the
thesis explanatory framework no such claim is made about the IC engine’s initial
technical inferiority. Rather, its rise to market dominance is characterised simply as
being a product of the positive feedback mechanisms inherent in mass production
and consumption.
195
What is seen as considerably more important in the analysis is distinguishing the
way in which the evolution of a large socio-economic system such as that created
by an increasingly dominant automotive mode of transport, drives path dependent
growth in a subsequently identified stage. Growth in this second stage is, however,
shown to be of a qualitatively different nature to that described by Arthur (1989) and
David (1985) and Unruh (2000) where positive feedback mechanisms largely derive
from the manufacturing process. In stage 2 of the explanatory framework path
dependence in the growth of the automotive mode is shown to derive largely from
the interplay of wider socio-economic forces. As North (1996) notes, powerful forces
are unleashed when large institutions and organisation become involved in path
dependent growth:
“Once a development path is set on a particular course, the network externalities,
the learning process of organisations, and the historically derived subjective
modelling of this issue reinforce the course” (page 99).
A key insight from stage 2’s explanatory framework is the way in which the socio-
economic regime actively reinforces positive feedback mechanisms driving the path
dependent growth of the automotive mode and, eventually, the onset of market
failure. A further defining insight of stage 2 is the way in which the socio-economic
regime acts to co-opt both consumers and governments in achieving its market
expanding goals. Thus while the linkages between government, consumers, and
producers are relatively loose early in stage 1, stage 2 is distinguished by more
complex, and interdependent linkages. An important contribution of this study as
distinct from lock-in theorists such as Geels and Unruh is, therefore, the way in
which a focus on the changing nature and role of key market actors over time is
used to identify discrete stages in lock-in’s evolution.
Well accepted in the literature is the key role of information imperfections and
asymmetries in driving path dependence (Stiglitz, 2002). However, given the
important role identified in this study of the socio-economic regime in its co-option of
consumers and government, a distinction is introduced between market information
imperfections and asymmetries which are autonomous – in the sense of not having
been purposefully introduced as a deliberate strategy of influence – and the
196
deliberate application of influence specifically designed alter market actors’
behaviour.
A socio-economic regime may therefore seek to expand or protect its market by
applying influence on consumers and government through imperfect and/or
asymmetrically voluminous information. In stage 2 such influence is shown to be an
important means of catalysing and reinforcing positive feedback mechanisms.
As noted in Chapter Three, Sections 3.2 and 3.3, pressure group theorists describe
the way in which direct influence on key actors such as governments can dictate
particular policy and regulation outcomes. By stage 2, governments are shown to be
dependent on the increasingly large contribution to economic growth which the
automotive industry provides. In such an environment they become more open to
asymmetries of information and influence. The automotive socio-economic regime’s
use of direct influence to secure road infrastructure subsidies, low automotive tax
regimes and manufacturing incentives is shown to have been particularly successful
in developing country conurbations such as Jakarta where a compliant government
is to be found. In face of these costly subsidies and their positive effect on
automotive demand, inadequate resources have been available for public transport
and higher demand created for road infrastructure. In this way influence becomes
an active ingredient of the robust path dependent growth generated in stage 2.
The studies of U.S. and Asian conurbation lock-in indicate that with further changes
in the role of transport market actors a third stage in the evolution of automotive
modal lock-in is pressaged. Defining this stage of full lock-in is the changing
balance in the templates of market power and influence shared by the socio-
economic regime, government and consumers. As cost disparities widen and the
effects of growing externalities become more evident, a stage is reached where
consumers become more aware and therefore better informed about transport
choices. In this environment co-option of consumers by the automotive socio-
economic regime becomes more problematic and co-option of governments
correspondingly gains greater currency and urgency. Sustaining lock-in is therefore
increasingly dependent on the capacity of a large technological system to co-opt
government support.
197
Evidence of the capacity of large technological systems to sustain lock-in is found
in recent literature particularly in studies such as that of Reich (2008) who describes
a substantive increase in the level of influence of producers and a corresponding
diminishing of consumer influence in many western developed economies
particularly the U.S.A. Further evidence for this trend is found in the marked
increases in funds spent on lobbying governments by producer interests (McCright
et al., 2003). However, measuring the precise nature and effectiveness of this
influence is more problematic (other than in terms of legislative and regulatory
outcomes) and beyond the scope of this thesis.
This focus on the nature and changes in the roles of key market actors contributes
to the literature on lock-in by highlighting similarities and divergences between
developed and developing countries. Given the rapidity and intensity with which
automotive modal lock-in occurs in developing country conurbations, consumers are
shown to be surprisingly well informed of the social and environmental
consequences. However, the generally weakly developed institutions which
aggregate consumer views mean their needs are less well articulated and catered
for in the transport market. In this way consumers in developing countries tend to
suffer from systemically weak asymmetries of influence. A general lack of
transparency in government decision making, weak legal and other institutions
which promote democratic processes serve to further undermine the willingness of
government to balance consumer and industry interests in such a way to promote
market efficiency.
In summary, the theoretical contribution of this thesis is to add evidence of the
extent, acute nature, and durability of market failure in markets which can account
for a substantial part of most economies. It is argued that to better describe the
nature of this type of market failure the role of path dependence is a critically
important and somewhat under-utilised tool of theoretical economists. In placing
such an emphasis this study suggests that a focus on the nature and changing role
of influence over time where socio-economic regimes operate within their markets,
needs better integration into the theories of path dependence, lock-in and market
failure.
198
8.3 Empirical validation of automotive modal lock-in
The theoretical framework developed to describe the evolution of automotive modal
lock-in produces a central hypothesises that, in stage 3 of full lock-in, consumers
will exhibit a strong willingness to pay to effect modal transport change. Empirical
surveys of Jakarta commuters are used to test this hypothesis.
The preliminary and final surveys provide an important contribution to the literature
on lock-in by using discrete choice experiments to directly measure its presence
and strength in a market. The discrete choice experiments and attitudinal surveys
were, therefore, designed to indicate how well informed Jakarta commuters are, to
what extent they understand the process by which automotive and motorcycle
externalities are generated, their effect, and how they value the availability of
alternative modes of public transport. From this information, insights were sought on
the nature of lock-in, its durability and potential for reversal.
The key indicator of Jakarta’s tertiary stage of lock-in is to be found in its
public/private modal share of surveyed commuters which, by international
standards, is particularly high at 30:70. As noted in Chapter Four, this proportion far
exceeds Delhi’s 48/31; Seoul’s 60/30 and Beijing’s 43/50.
The thesis surveys provide a number of indicators by which the strength of Jakarta’s
tertiary stage of lock-in can be measured. The falling public/private modal ratio is
shown to be occurring at a time when only around one third of car owners or
potential owners exhibit aspirational ownership motivations. Equally, despite this
decline, a large majority of motorists and motorcyclists indicated a strong desire to
reduce private modal usage and increase that of the public mode. Thus some three
quarters of all commuters indicated their use of automotive transport was a product
of inadequate public transport. For their part around three quarters of motorcyclists
indicated a willingness to pay to reduce congestion and improve public transport.
Overall some 80% of all commuters indicated they were willing to pay higher taxes
to provide a viable public transport alternative.
Consumer pressure for reversal of automotive modal lock-in can be explained by
the rapidity with which it has occurred and produced an equally rapid build-up of
199
externalities. Resource poor and rapidly expanding conurbations are unable to meet
the automobile’s incessant demand for infrastructure. The resulting acute traffic
congestion and its deleterious effect on the environmental and urban quality of life
are shown to be sufficiently disruptive to produce marked changes in transport
consumer attitudes. Thus the high initial mobility offered by automotive and
motorcycle transport, the high aspirational-hallmark of affluence value of
automobiles and its associated capacity to offer commuters new suburban living
styles, are all clearly being progressively discounted.
That this profound change in attitude has not led to a diminution in the demand for
automobiles and motorcycles in Jakarta118 requires an explanation. An answer to
this apparent paradox is found in the thesis survey data: some two thirds of
respondents agreed that they would have reduced their use of the automobile if
public transport had been adequate. Thus an important characteristic of market
failure – lack of expenditure on viable alternatives – shows itself to be a key driver
of automotive modal lock-in and its longevity.
Commuter attitudes in stage 3 are, therefore, shown to be shaped less by
information imperfections and asymmetries (both autonomous and purposeful)
which promoted car ownership in stage 2 of automotive modal lock-in and
increasingly by the direct negative effects of automotive modal lock-in’s
externalities.
These findings provide support for the hypothesis that, given the acute effects of
traffic congestion, a reversal of automotive modal lock-in is being sought by
consumers of transport services. However, automotive modal lock-in in the form of
high and still rising levels of car and motorcycle ownership, reflect the lack of viable
alternatives rather than a preference for one particular mode of transport based on
its characteristics alone. Thus, such is the chaotic state of Jakarta’s transport
system, that lack of a viable public alternative is the uppermost consideration while
prestige/enjoyment gratification from car ownership is forced to take a back seat.
118 The percentage increase in automotive and motorcycle sales continued to exceed double digit figures in 2011 and in the first half of 2012, notwithstanding some recent tightening of hire purchase availability for their purchase (The Economist, 2012).
200
As noted in Chapter Two, these findings run counter to Kuznets’ (1955) theory
which assumes a willingness to address environmental issues has an inverse
relationship with income. Moreover assumptions that higher levels of
education/environmental awareness are needed before redress of environmental
externalities can be achieved, need to be carefully assessed in developing country
environments. The Jakarta commuter surveys provide a clear indication that where
the physical effects of externalities are severe, it is sufficient to create high levels of
awareness of automotive modal lock-in and support for its reversal.
In light of the strong level of consumer demand for the provision of viable public
transport in Jakarta, the market’s continued state of modal lock-in indicates powerful
asymmetries of influence and information are operating. Stage 2 lock-in describes
the expanding role of the automotive socio-economic regime and its capacity to
affect consumer attitudes and the level of demand through influence asymmetries.
Notwithstanding this capacity, the thesis surveys shows a weakening of influence
on consumer attitudes in stage 3 as aspirational demand is replaced with a more
hard-headed assessment of automotive and motorcycle utility.
This of course begs the question of why such low expenditure has been occurring to
produce what is, on an internationally comparable basis, one of the most poorly
developed public transport systems for a large metropolis of its size and stage of
development. A number of linked causes can be identified. Firstly it is clear that a
primary driver of automotive modal lock-in – the close and symbiotic relationship
between the automotive socio-economic regime and the Government – has
remained robust and a key element in sustaining lock-in. The effectiveness of the
Indonesian automotive socio-economic regime in securing government support and
infrastructure resources remains much in evidence through policies which
effectively subsidise ownership and use of automobiles and motorcycles. Sales
taxes on vehicles remain at the lower end of the ASEAN comparative table.
Automotive fuel subsidies which cost the Indonesian Government 0ver $A20 billion
in 2013 have allowed pump prices at around $A0.65 cent per litre – one of the
lowest in Asia (English News, 2012). Efforts by the Indonesian President
201
Yudhoyono to effect a 33% increase in fuel prices were blocked by the Indonesian
Parliament in March 2012.
The extent of the Government’s support for unfettered future expansion of
automotive sales and its willingness to accept the high cost of allowing automotive
modal lock-in to continue is on public record. Responding to criticism of high levels
of traffic congestion in Jakarta the Indonesian Industry Minister Mohamad S Hidayat
admitted:
"It's impossible to stop car production to deal with traffic jams. What the government
can do to help is by infrastructure development. I'm confident that we can solve this
problem without compromising car production" (Baskoro, 2012).
The direct financial dependence of the Government on the automotive industry is
equally apparent. A member of the leadership board of the Association of
Indonesian Automotive Manufacturers, Mr Johnny Darmawan recently observed
that:
"The automotive industry growth is a blessing to us all because this sector now is
among the largest contributors in tax revenue.” (Baskoro, 2012).
This interdependence is likely to grow. Automotive companies have signalled $2.2
billion in Indonesian investment is in the pipeline (The Economist, 2012) making
Indonesia the largest and fastest growth automobile market in Southeast Asia.
Low investment in public transport infrastructure therefore reflects this bias in favour
of the automobile and its associated infrastructure. As such it has acted as an
important positive feedback mechanism encouraging yet higher automotive
ownership. In Jakarta this is facilitated by a lack of transparency and effectiveness
of governmental policy formulation and implementation. Thus where these
characteristics are not well developed as in Indonesia (Butt, 2011; Newman, 2011)
rational allocation of resources becomes problematic and a fertile environment for
applying asymmetric influence is created.
202
The unmet public demand for greater investment in public transport in Indonesia
therefore underpins Jakarta’s tertiary stage of automotive modal lock-in – a product
of the relative ease with which asymmetric influence can be directed to intermediate
between consumer demand and responding supply119.
The choice model and associated surveys provide solid evidence of the depth of the
failed automotive market’s imperfections and the extent of unrealised demand for
public transport alternatives. Clearly indicated is that car owners have a higher
preference for lower congestion and for improving rail facilities. Moreover, the
overwhelming majority of commuters who indicated they wanted to reduce car
usage, but had no alternative, were also those who tended to favour improved rail
usage.
8.4 Automotive modal lock in: development of reversal strategies
Given the clearly stated preference of Jakarta commuters for a modal shift to public
transport, why current transport strategies and policies have so clearly failed needs
explanation and alternative strategies developed.
What is immediately clear is that, notwithstanding commuters’ relatively high levels
of general awareness of the extent of negative externalities produced by automotive
modal lock-in, there remains a substantial level of information failure particularly at
the policy making level of government. There is no evident comprehensive
accounting of the costs of unfettered growth of the automotive and motorcycle
modes nor is there any indication of these issues becoming a focus of policy
makers let alone being subject to policy debate. Recent surveys of the social costs
of vehicular transport in large conurbations put them at around 8% of their regional
GDP with congestion taking up as much as 45% of the total (INFRAS/IWU, 2004;
Mizutani et al., 2011). In such environments the quest for high rates of GDP growth
by relying on automotive investment may be misplaced. As Stiglitz (2009) points
out, the concept of net GDP is a far more useful measure of welfare where growth
generates large externalities:
119 Such asymmetric influence is also felt through the competitive forces generated by shared responsibility for transport systems between the Jakarta Local Government (DKI) and the Indonesian Government.
203
“Just as a firm needs to measure the depreciation of its capital, so, too, our national
accounts need to reflect the depletion of natural resources and the degradation of
our environment…The report by the Commission on the Measurement of Economic
will, one hopes, provide a broader set of indicators that more accurately capture
both well-being and sustainability; and it should provide impetus to assess the
performance of the economy and society. Such reforms will help us direct our
efforts (and resources) in ways that lead to improvement in both” (page 2).
Evident, therefore, is that lessons regarding the high costs which flow from the
inappropriate sequencing of transport infrastructure over time are not well learnt by
governments initiating high levels of sustained growth. This is not withstanding clear
evidence from predecessor countries such as Japan, Korea, Malaysia and now
China.
Repeatedly over the past 50 years retrofitting adequate public transport has
occurred only after severe traffic congestion, pollution and reduction of the quality of
life of urban inhabitants. Reflected is the strength of the acquired automotive culture
in developing countries and its deeply ingrained continuing presence in developed
countries. The export of this culture through global investment and media by both
automotive multinationals (see, for example, Kay, 1997; Seiler, 2008; Unruh, 2006)
and not infrequently by international financial institutions (ADB, 2010), has injected
an ongoing bias in transport policy prescriptions.
The need for a more insightful and informed debate on transport policy is therefore
long overdue. The findings and original contributions of this study form a
contribution to this need through its analysis of the nature and causes of automotive
modal lock-in. The explanatory framework describing automotive modal lock-in as it
applies to developing countries and the subsequent modelling of commuter demand
and modal preferences in the Jakarta conurbation, provide a number of original
insights into the type of measures needed to reverse lock-in and the need to fashion
these measures in response to the revealed nature of the lock-in mechanisms.
204
In Chapter Seven the data provided by the surveys of Jakarta commuters and
modelling outcomes offer a number of new insights into the way in which
automotive modal lock-in in developing country conurbations produces marked
changes in transport consumer attitudes to different modes. In particular their
attitudes to the automobile are shown to change markedly over the three stages of
lock-in evolution. Chapters Three and Four describe the way in which demand for
the private automotive mode rises strongly in stage 2 and is then sustained in stage
3 notwithstanding the very h financial and social disincentives. The primary causes
– the level of cooption of government by the automotive socio-economic regime
which restricts the flow of resources to public transport – is shown to act as a final
and powerful lock-in mechanism and, therefore, a key issue for policy makers.
These findings and insights of the explanatory framework provide directions for
developing strategies which may be employed to reverse lock-in. The persistent
failure of authorities in Jakarta and Kuala Lumpur to adequately plan and resource
such strategies indicate new approaches are needed. A number of studies (see, for
example, Cowan and Hulten, 1996; Alpizar and Carlsson, 2001; Unruh, 2002;
Pucher et al., 2007; Barter, 2004) have examined possible measure for reducing
congestion and reversing lock-in. A modelling by Bhattacharjee et al. (1997) of
Bangkok’s traffic congestion indicated car users would strongly oppose any fiscal
disincentive on car usage or restriction on the number of riders in the congested
area of the CBD. They concluded that, while government authorities may be aware
that transportation demand can be successfully modified by imposing fiscal
measures, public agencies needed to be cautious in implementing such measures.
Alpizar and Carlsson (2001) in their use of a discrete choice model to gauge
commuter attitudes in Cost Rica indicated that given the low level of responsiveness
of commuters to fiscal measures they should be regarded as a rather blunt
instrument. That is, given lock-in is a product of some fundamental changes
wrought by the automotive socio-economic regime to the physical form, social
habits and institutional underpinnings of the transport market based incentive
mechanisms are not particularly responsive given the low demand elasticity levels.
Thus subsidised bus fares were found to be least effective in modal shifting from
cars to public transport. While increasing the cost of car transport (e.g. via
205
increasing office parking fees) was found to be more effective, the substitution effect
was still found to be weak leading them to conclude that breaking the travel pattern
of commuters using cars was particularly difficult (although not impossible).
Reducing bus travel time was found to be the most effective means of attracting
commuters to public transport. Even so, the choice modelling experiment indicated
a hypothetical 10% decrease in average travel time by bus (a 6 min reduction)
reduced the probability of car use by only 1.36%.
The findings of these studies indicate some seemingly insuperable problems for
policy-makers intent on breaking automotive modal lock-in. Market mechanisms are
shown to indeed be blunt in terms of the need to impose very heavy financial
penalties to derive modest reductions in traffic congestion. However, the thesis
survey of Jakarta commuters provides evidence of a way forward for policy makers.
Contrary to the findings of surveys reviewed above this study’s choice modelling
provided a means of testing these findings in the Jakarta context and to allow
attitudes to be influenced by long term projections of the consequences of increases
in car sales as well the prospect of offsetting improvements to public transport. This
contrasts with conventional transport mode modelling and attitudinal surveys in
which choices and preferences are tied to specific one off trip costs and choices -–
the consequences of which relate only to that point of time. Another validating
feature of the thesis choice model is that the longer term perspective of its design is
matched by an aggregation of payments of higher taxes expressed as a percentage
of income.
Thus Jakarta commuters, when faced with the projected levels of congestion,
automotive costs, effects on health and emissions over five years (as indicated in
the preliminary survey, Chapter Seven, Section 7.8), showed a far higher
willingness to pay than the reviewed studies suggest. All but 4% of commuters were
prepared to accept an increase of car registration fees and the introduction of CBD
entry taxes to reduce congestion. Some 10% of commuters were willing to pay
between 10% and 6% of annual income to effect an annual 5% reduction in
congestion while 44% were willing to pay between 7% and 3% of income to achieve
varying levels of reductions of traffic congestion. Only 4% of all commuters chose
206
the third ‘neither’ option which included no taxes and an unrestricted increase in
congestion of 12% per annum.
The willingness of Jakarta commuters to pay for reduced congestion and improved
public transport is further validated in the final survey choice modelling where those
using cars to commute indicated an annual WTP for a 1% reduction in traffic
congestion of Rp3m ($A300) and Rp1.75 million ($A175 for motorcyclists. In terms
of time reduction, commuters by car and motorcycle were prepared to pay $33 and
$11 respectively to reduce commuting times by one hour. As noted, these are high
values indicating quite different motivations to choice experiments such as those of
Alpizar and Carlsson’s (2001) which provide choices cast in terms of individual trips
and costs with no cumulative long term consequences embedded in the choices.
The implication is that while elasticities of modal substitution tend to be notoriously
low in large conurbations, the high taxes needed to induce change can become
acceptable for commuters. However, the thesis choice model indicates that such
willingness will be critically reliant on two key provisos: firstly the availability of
contextual information of the long term consequences of automotive modal lock-in
including importantly, knowledge of the consequences of taking no action at all (as
provided in the thesis choice experiment). Secondly it is dependent on assurances
that such congestions reducing taxes would be offset by the development of viable
public transport alternatives.
The thesis choice experiment, equally provides supportive evidence for Stiglitz’s
(1989) observation that information failure is a critical and omnipresent feature of
failed markets and a central element in positive feedback mechanisms which, as
(Litman, 2009) describes, drive the path dependent rise in automotive usage.
Highlighted is the extreme complexity for consumers in accumulating and assessing
the future consequences of automotive ownership both individually and collectively.
Thus where radical new policies are contemplated to break automotive modal lock-
in, governments need to put considerable resources into ensuring that consumers
understand the complexities and are fully aware of the long term consequences of
both action and inaction. Noticeable in the case of both Seoul (Pucher et al., 2007)
and Beijing (Xie, 2012) is that the initial top down proposals for radical policy
207
changes were quickly adjusted to incorporate urban transport public interest groups
which provided input into the planning process.
However, as Arthur (1983) and David (1985) and more recently Unruh (2002) have
pointed out, any strategy for reversing lock-in is incomplete without the exogenous
shock to the market needed to dislodge the erstwhile stable equilibrium. As Unruh
(2002) observed, this is particularly relevant to the automotive socio-technological
system given its predilection for creating its own stability for its owners, managers
and users of the system. In the face of such institutional atrophy characterised by
long periods of relative stability he notes “…it is difficult for policy makers to
undertake institutional change without a solid mandate...”(page 323). Thus, Unruh
concludes, beyond simple public knowledge of a problem, historical precedents
suggest that a focusing event may be needed to provide the ‘annealing’120.
Geels (2005) argues that change involving a large socio-economic system such as
that of the automotive mode needs to gather momentum over time given the “sheer
impossibility” of change being brought about by a single ‘policy’ (page 166). A
tipping point is therefore usually reached in which a number of characteristics are
evident. They include, he asserts, the evolution of numerous interrelated elements
incorporating changes in both demand and supply sides, and the implication of a
large range of actors.
Cowan and Hulten (1996) identify six discrete means by which lock-in can be
dislodged: crisis in existing technology; regulation; technological breakthrough;
change in taste; development of new niche markets and scientific results. While
suited well to technological systems collectively they apply less well to large socio-
economic systems such as the automotive mode where a lower cost alternative in
the form of public transport already exists and the adoption of which does not
depend on technological change or even, necessarily, on changes in taste.
120 Cited is the fact that despite Rachel Caron publishing her book ‘Silent Spring’ in 1962, action to ban the pesticide DDT did not occur until 10 years later with the recognition that populations of the national symbol, the Bald Eagle had been decimated.
208
The examples of Seoul and Beijing’s third stage reversal indicate that regulation in
its broader sense is one, if not the only means of escaping lock-in of a socio-
economic system. In these cases the exogenous ‘shock’ can be described as two
fold in nature. The first is the advent of exceptionally acute traffic congestion and
the attendant extensive social dislocation. The related shock is in the form of radical
changes in policies and regulations driven by particular personalities operating
within a strong tradition of government economic dirigisme. Thus in the case of
Seoul, the initial shock of approaching gridlock of the early 2000s was subsequently
accompanied by the shock created by Seoul’s Mayor Lee Myong-bak known as “Mr
Bulldozer” who acquired the sobriquet through the speed and ruthless way in which
he implemented measures to reduce car usage and increase public transport121.
In both these cases, the explanatory framework developed in this thesis provides
insights into the process involved in the creation of these administrative shocks. The
Chinese and Korean automotive socio-economic regimes, while having a history of
close supportive relations with Government, were not, ultimately, to dominate in a
relationship in which government became the guiding partner and not a dependent
supplicant. Equally, while approaching gridlock created strong support for change in
favour of the private automotive mode amongst transport consumers, it was
demonstrably insufficient by itself to deliver the exogenous shock necessary to
dislodge the locked in transport market equilibrium.
Insights into the success of the particular regulatory and policy tools used by
Korean and Chinese governments to manage traffic congestion and break
automotive modal lock-in are also derived from the thesis surveys and historical
underpinnings of the explanatory framework. Importantly both Governments acted
to modify the supply and demand side of the transport markets simultaneously. Both
invested heavily in rail transit in recognition that it was the only form which could
carry the volume of passengers created if the rise in automotive dependence was to
be arrested and then reduced. On the demand side the Beijing and Seoul municipal
governments introduced measures to further accelerate a model shift through
121 Lee (who later became the Korean President) is best known for his actions in demolishing a key 6.7 km stretch of highway in the centre of Seoul and re-introducing the former waterway (Preservation Institute, 2013).
209
restrictions on car usage to specified days. Beijing also had strict zonal restrictions
on motorcycle usage and in 2011 introduced a registration licence auction systems
similar to that operating in Singapore and Shanghai. Such linked policy strategies
acted to directly disarm automotive lock-in’s final stage positive feedback
mechanism in which automotive demand was being heightened by lack of public
transport and creating greater demand for resources to facilitate the former.
The thesis choice experiments, therefore, provide Governments with a clear
indication that management of congestion – both through congestion taxes and
auctioning of registration fees which cap sales of cars and motorcycles – are
potentially viable policy options. The further insight provided by the choice
experiment is that while there is a willingness among commuters to paying more tax
to reduce congestion and its negative externalities, without proper information that
willingness may be relatively weak. In other words, when the consequences of
allowing unfettered growth of congestion are spelt out to commuters, the willingness
to pay relatively high levels of tax in exchange for reduced congestion (and
improved public transport) can be generated.
The problem remains, however, that, notwithstanding this latent demand to reverse
automotive modal lock-in, consumers are less able to develop, aggregate and apply
the needed knowledge in a market subject to influence and information
asymmetries. Required, therefore, is a strengthening of institutions in developing
countries which can fulfil this role – both in terms of research and policy advocacy.
As noted above, this can be greatly assisted by more balanced policy advice flowing
from developed countries, international financial institutions and development
bodies.
8.5 Research limitations and further study
A review of the literature on the role of path dependence in the growth and lock-in of
large socio-economic systems indicates these concepts are yet to be well integrated
into mainstream economics. This no doubt reflects in major part the fact that
currently available theoretical and explanatory contributions provide a still
incomplete picture of the processes involved. As yet not fully explained is the
210
question that North (1996) posed: if incentives are the primary driver of economic
growth why has economic growth and efficiency so often in history not been the
outcome?
This thesis has, therefore, been designed to contribute to a more rigorous
interpretative framework with which to view the phenomenon of lock-in of large
technological and socio-economic systems. In doing so the insights provides some
signposts to further research. Studies (Strange 1996; Jones, 2005; UNCTAD, 2012)
show the increase in the role and influence of large multinationals in global markets
and the level of market distortion which is occurring. In this environment the
equilibrium theory of economics – where a decentralised system of market forces
generates an efficient system of resource allocation – is liable not to operate in
large globalised markets. Indeed, the study of automotive modal lock-in indicates
the extent to which in such markets dominated by large socio-economic regimes,
lock-in and its attendant market failure is a not an unusual and indeed a likely
outcome. At a time when globalisation and the role of large multinational
corporations in global commerce is expanding (UNCTAD, 2001) – and in particular
through the sponsorship of newly industrialising economies (Duran and Ubeda,
2005) – further research into the causes and extent of lock-in in such markets is
clearly desirable.
Such research is also merited given, firstly, it is in these newly industrialising
countries that the greater part of the global growth in automotive production will
occur. Secondly, as Barter (2004) notes (see Chapter Three, Section 4.5.4) it is
these countries where automotive saturation is more characteristic of large
conurbations – in contrast to the more permanent automotive domination of
developed countries. Thus the scope for change is economically more viable and
the timeframe somewhat shorter given that transport infrastructure is less
thoroughly integrated in urban infrastructures in developing country conurbations.
The need for further research on the nature of automotive modal lock-in equally
derives from the global imperative of reducing CO2 emissions and the associated
need for a more sustainable use of resources. A better understanding of market
failure in large markets in which socio-economic regimes are key actors could
211
therefore contribute to these goals of greater market efficiency. As noted in Chapter
Two, Section 2.3, much of the existing literature on path dependence and lock-in is
focussed on technologies and technological regimes. Less effort has been applied
to describing the nature and evolution of lock-in which is to a considerable extent a
product of socio-economic regimes shaping their own markets. Identification and
studies of the evolution of a wider range of market failure and lock-in associated
with socio-technological regimes would therefore assist in developing a more
complete theoretical underpinning of its development.
An important contribution of this research is its finding that a key means by which
the automotive socio-economic regimes sustain increasing returns and achieves
lock-in is through actively encouraging and stimulating positive feedback
mechanism which drive path dependent growth. These findings are somewhat at
variance with Arthur (1983, 1989) and David (1975, 1985) and their theoretical
successors who have tended to focus on the way in which, once catalysed, path
dependence and lock-in of an inferior technology is autonomously driven by the
generation of positive feedback mechanism and irreversibilities within the market.
Much less attention is paid to the way in which producers themselves can intervene
in this process and become a key agent in determining the outcome. Further studies
are, therefore, needed to develop a theory of path dependence which adequately
accounts for this phenomenon.
In doing so they could usefully be directed at differentiating the role of
conventionally defined ‘autonomous’ information failure and where such causes of
market failure are a product of the application of deliberate influence by market
actors and in particular by socio-economic regimes. To what extent the operation of
these types of influence can become part of a wider construct which includes
influence as described in regulation theory is an equally important research
question. Thus a limitation of this study has been the lack of a means to effectively
model and measure these forms of influence as a market force. In this context a
further line of needed research is empirical validation of stage 3 of automotive
modal lock-in in respect of the way in which Governments are subject to co-option.
A comparative analysis of the inputs into government decision making in relation to
transport infrastructure would therefore be a useful addition to the literature.
212
There is considerable anecdotal evidence that in many developed as well as
developing countries decisions on how to prioritise investment in differing modes of
transport are made on political grounds rather than on solid data and research. In
the Australian context it appear to be the exception rather than the rule that
comprehensive direct and indirect cost benefit calculations are used to determine
comparative costs of meeting urban transport needs and in turn guide investment
decisions. The measurement and use of consumer modal preferences appear
equally absent in such investment decisions. Tanko and Burke (2013) illustrate this
point in their study of the decision making process which led to the construction of a
dedicated busway system for Brisbane and in which no comprehensive analysis
was made for rail or road options.
“”Brisbane may never have adopted the BRT (bus rapid transit) without a clear
political champion in Brisbane City Council …Technical-rational analyses were used
only to help support pre-determined positions, not to provide comparisons and
assessment for a later mode selection decision. There was no real community
social movement supporting the move, and no collaborative planning involved. The
results highlights how during recent decades planners have shifted away from
traditional technical/analytical roles and are nowadays more facilitators between
stakeholders in the transport decision-making process” (page 1).
A similar lack of procedural rigour is evident at the Federal level of transport
planning in Australia. In 2013, the Australian Government has launched an $11
billion road construction program without accompanying it with a modal cost benefit
analysis. The Prime Minister has indicated his transport policy preferences by
claiming that public transport was “…generally slow, expensive, not especially
reliable and still a hideous drain on the public purse” (Abbott, 2009) – a statement
which was made without corroborative data.
An important innovation of this thesis is the use of choice modelling to measure the
strength of automotive modal lock-in in the Jakarta conurbation and the extent to
which commuters seek its reversal. Further research applied to a wider range of
cases of lock-in are therefore needed to validate the use of choice modelling as a
213
tool for measuring the severity of lock-in. In particular a focus would seem
warranted on this study’s use of long term projections of costs and effects of lock-in
in creating choices which can lead to its reversal or amelioration could usefully be
expanded. Given the higher WTP values such methodology has produced needed
are studies of a wider variety of choice experiments to provide a more precise
understanding of the way in which participants are making choices and to what
extent theoretical long term choice commitments can be effected in practice.
Finally a useful further addition to the literature in analysing how commuters choose
between modes would be to shape choice models to measure the presence or
otherwise of ‘peak car’. Such research could indicate whether this remains a
phenomenon of developed country conurbations or whether it is yet manifesting
itself in developing country cities as well.
214
Bibliography
Abbott, T. (2009). Battlelines. Melbourne: University Press. Abdul-Aziz, A.R. 2006. Privatisation of fixed-rail transit systems: a case study of Malaysia’s STAR and PUTRA. Canadian Journal of Civil Engineering, Vol. 33(7), 846-853. Abidin, A.Z., Mansor, H., Ahmad, R.D.R. Abdullah, R., &.Chung, I. (2004). The estimation of carbon dioxide emissions from the transport sector in Malaysia (2000 – 2020). 9th Asian Pacific integrated model Workshop. Kuala Lumpur: National Institute for Environmental Studies.. Retrieved from: http://www-iam.nies.go.jp/aim/AIM_workshop/9thAIM/Session6/ ADB, (2010). Retrofitting sustainable urban development practices: urban public transport. Urban innovation series. Manila: Asian Development Bank. Addleman, S. (1962). Symmetrical and asymmetrical fractional factorial design plans. Technometrics, Vol. 4(1), 47-58. AdvisorAnalyst, (2012). Car ownership in China. Toronto: AdvisorAnalyst. Retrieved from: http://advisoranalyst.com/glablog/tag/car-ownership/ Ahman, M. (2004). Government policy and the development of electric vehicles in Japan. Energy Policy, Vol. 34(4), 433-443. Alpizar, F. Carlsson, F. (2003). Policy implications and analysis of the determinants of travel mode choice: an application of choice experiments to metropolitan Costa Rica. Environment and Development Economics, Vol. 8(04), 603-619. Alpizar, F., Carlsson, F., & Martinsson, P. (2003). Using choice experiments for non-market valuation. Economic Issues-Stoke on Trent, Vol. 8(1), 83-110. Alvinsyah, Soehodoho, S., & Nainggolan,P.J. (2005). Public transport user attitude based on choice model parameter characteristics (Case Study: Jakarta Busway System). Journal of the Eastern Asia Society for Transportation Studies, Vol. 6 (2005), 480-491. Anas, A., & Timilsina G.R. (2009). Impacts of policy instruments to reduce congestion and emissions from urban transportation. The World Bank Development Report, Development Research Group, September. Washington DC: World Bank. Retrieved from: https://openknowledge.worldbank.com/handle/10986/4291 Angel, D., & Rock, M. (2008). Environmental rationalities and the development state in East Asia: prospects for a sustainability transition. Technological Forecasting and Social Change, Vol. 76(2), 229-240. Arasan, T.V., & Vedargiri, P. (2011). Study of the Impact of BRT system under highly heterogeneous traffic conditions. Asian Transport Studies, Vol. 1(3), 288-302. Arif, F.A. (2002). Transport planning in Jakarta. Urban Policy and Research, Vol. 20(4), 371-389. Arifin, Z.N., & Axhausen, K.W. (2011). Investigating commute mode and route choice variabilities in Jakarta using multi-day GPS data. Zurich, Switzerland: Institute for Transport Planning and Systems, Swiss Federal Institute of Technology. Arrow, K. (1962). Economic welfare and the allocation of resources for invention. In: Nelson. R.R., (ed.). (1962). The rate and direction of inventive activity. Princeton, NJ: Princeton University Press.
215
Arthur, W.B. (1989). Competing technologies, increasing returns and lock-in by historical events. The Economic Journal, Vol. 99(394), 116-131. Arthur, W.B. (1994). Increasing returns and path dependence in the economy. Michigan: University of Michigan Press. Asian Development Bank, (2011). Infrastructure’s role in sustaining Asia’s growth. Economics working paper 1655-5252. Manila: Asian Development Bank. Asiaone Motoring, (2012). Rising per capita incomes drive car demand in Indonesia. September 28. Asiaone Group, Singapore. Retrieved from: motoring.asiaone.com/Motoring/.../A1Story20120926-373917.html Asia Pacific Environmental Innovation Strategies, (2003). Development of the public transport system in Beijing. Tokyo: Asia Pacific Environmental Innovation Strategies. Retrieved from: Pub.iges.or.jp/contents/APIEIS?RISPO/inventory/db/pdf/00155.pdf Asia Pacific Network for Global Change Research, (2004). Urban energy use and greenhouse gas emissions in Asian mega-cities. Kitakyushu: Urban Environmental Management Project. Aschauer, D. (1991). Transport spending and economic growth. American Public Transport Association study, September 1991. Washington, DC: American Public Transport Association. Asensio, J. (2002). Transport mode choice by commuters to Barcelona's CBD. Urban Studies, Vol. 39(10), 1881–1895. Asri, D.U., & Hidayat, B. (2005). Current transportation issues in Jakarta and its impact on environment. Proceedings of the Eastern Asia Society for Transportation Studies, Vol. 5, 1792– 1798. Aswicahyono, H. (2000). How not to industrialise? Indonesia’s automotive industry. Bulletin of Indonesian Economic Studies, Vol. 36(1), 209-241. Bailey, I., & Wilson G.A. (2009). Theorising transitional pathways in response to climate change: technocentrism, ecocentrism and the carbon economy. Environment and Planning A, Vol. 41(10): 2324-2341. Barter, P., (2004). Transport, urban structure and ‘lock-in’ in the Kuala Lumpur metropolitan area. International Development Planning Review, Vol. 26(1), 1-24. Bartlett J.E. Kotrlik J.W., & Higgins C.C. (2001). Organisational research: determining appropriate sampling size in survey research. Information Technology, Learning and Performance Level, Vol. 19(1), 43-50. Baskoro, F.M. (2012). Car sales outpacing road development. Jakarta Globe, September 23. Retrieved from: www.thejakartaglobe.com/business/indonesias-infrastructure-cant-keep-pace-auto-sales/545920 Bateman, I.J., Carson, R.T., Day, B.W., Hanemann, M., Hanley, N., Hett, T., Jones-Lee, M., Loomes, G., Mourato, S., Ozdemiroglu, E., Pearce, D.W., Sugden. R., & Swanson, S. (2003). Guidelines for the use of stated preference techniques for the valuation of preferences for non-market goods. Cheltenham: Edward Elgar. Baudrillard, J. (1986). The consumer society: myths and structure. London: Sage Publications. Baudrillard, J. (1996). The system of objects. London: Verso. Bauman, Z. (1998). Globalization, the human consequences. New York: Columbia University Press.
216
Beattie, A. (2009). False economy: a surprising economic history of the world. New York: Riverhead Books. Becker, G.S. (1983). A theory of competition among pressure groups for political influence. The Quarterly Journal of Economics, Vol. 98(3), 371-400 Becker, G.S. (1986). The public interest hypothesis revisited: a new tests of the Peltzman’s theory of regulation. Public Choice, Vol. 49(3), 223-234. Ben-Akiva, M. (1972). Structure of travel demand models. Transportation Systems Division, Department of Civil Engineering. Cambridge, MA: Massachusetts Institute of Technology. Ben-Akiva, M., & Lerman, S.R. (1985). Discrete choice analysis – theory and application to travel demand. Cambridge, MA: The MIT Press. Ben-Akiva, M., McFadden D., Abe, M., Böckenholt, U., Bolduc, D., Gopinath, D., Morikawa, T., Ramaswamy, V., Rao, V., Revelt, D., & Steinberg, D. (1997). Modelling methods for discrete choice analysis. Marketing Letters, Vol. 8(3), 273-286. Bennett, J.J., & Blamey, R.K. (2001). The Choice modelling approach to environmental valuation. Cambridge, MA: Edward Elgar. Bennett, J.J., Birol, E. (2010). Choice experiments in developing countries: implementation, challenges and policy implications. Northampton, MA: Edward Elgar. Berkhout, F. (2002). Technological regimes, path dependency and the environment. Global Environmental Change, Vol. 12(1), 1-4. Bergek, A., Jacobsson, S., Carlsson, B., Lindmark, & S., Rickne, A. (2007). Analysing the functional dynamics of technological innovation systems: a scheme of analysis. Research Policy, Vol.37(3), 407-409. Bhattacharjee, D., Haider, S.W., & Tnaboriboon, K.S. (1997). Commuters’ attitudes towards travel demand management in Bangkok. Transport Policy, Vol. 4(3), 161-170. Birol, E. (2008). Farmer preferences for milpa diversity and genetically modified maize in Mexico: a latent class approach. Environment and Development Economics, Vol. 14(4), 521-540. Black, E. (2006). Internal combustion. New York: St Martins Press. Blum, U. (1982). Effect of transportation investment on regional growth. Paper of the Regional Science Association, Vol, 49(1), 169-184. Boas, T.C. (2007). Conceptualizing continuity and change: the composite-standard model of path dependence. Journal of Theoretical Politics, Vol. 1(1), 33-54. Bradley, M.J., & Associates, (2007). Comparison of energy use & CO2 emissions from different transportation modes. Manchester, NH: M.J. Bradley & Associates. Brechin, S.R., & Kempton, W. (1994). Global environmentalism: a challenge to the post materialism thesis? Social Science Quarterly, Vol. 75(2), 245-269. Butt, S., (2011). Anti-corruption reform in Indonesia: an obituary? Bulletin of Indonesian Economic Studies, Vol. 47(3: 391-394. Button, K., Ngoe, N., & Hine, J. (1991). Modelling vehicle ownership and use in low income countries. Journal of Transport Economics and Policy, Vol. 27(1), 51-67. Button, K.J., & Hensher, D.A. (Eds), (2001). Handbook of transport systems and traffic control. New York: Pergamon.
217
Calfee, J., & Winston, C. (1998). The value of automobile travel time: implications for congestion policy. Journal of Public Economics, Vol. 69(1), 69-102. Cameron, I., Lyons, T.J., & Kenworthy, J.R. (2004). Trends in vehicle kilometres of travel in world cities, 1960–1990: underlying drivers and policy responses. Transport Policy, Vol. 11(3), 287 – 298. Carson, R., (2002). Silent spring. Davis, CA: Houghton Mifflin. Chamon, M., Mauro, P., & Okawa, Y. (2008). Mass car ownership in the emerging market giants. Economic Policy, Vol. 23(54), 243–296. Champ, P.A., Bishop, R.C., Brown, T.C., & McCollum, D.W. (1997). Using donation mechanism to value non-use benefits from public goods. Environmental Economic Management, Vol. 33(2), 151–162. Chen, Y. (2004). Technological leapfrogging – a strategic pathway to modernisation of the Chinese iron and steel industry? Energy for Sustainable Development, Vol. 8(2), 30-38. Cheng, S., & Long J.S. (2007). Testing for IIA in the multinomial model. Sociological Methods and Research, Vol. 35(4), 583-600. Chin, A., & Smith, P. (1997). Automobile ownership and government policy: the economics of Singapore’s vehicle quota system. Transport Resources-A, Vol. 31(2), 129-140. China National Bureau of Statistics (2007). Revisions of China GDP 1978-2003 by province-level divisions. Beijing: China National Bureau of Statistics. Retrieved from: http://en.cyclopaedia.net/wiki/List-of-China-administrative-regions-by-GDP-per-capita Choi, Y.B. (2008). Path dependence and the Korean alphabet. Journal of Economic Behaviour and Organisation, Vol. 65(2), 185-201. Ciriacy-Wantrup, S.V. (1947). Capital returns from soil conservation practices. Journal of Farm Economics, Vol. 29(4), 1181–1196. . Clair, D. (1986). The motorisation of American cities. New York: Praeger. Coase, R.H. (1974). The lighthouse in economics. Journal of Law and Economics, Vol. 23(2), 357-376. Cochran, W.G. (1968). Sampling techniques. 2nd ed. New York: John Wiley and Sons. Collantes, G.O. (2006). The California zero-emission vehicle mandate: a study of the policy process, 1990-2004. Davis, CA: UC Davis Institute of Transportation Studies. Collier, R.B., & Collier, D. (1991). Shaping the political arena: critical junctures, the labor movement and regime dynamics in Latin America. Princeton: Princeton University Press. Cooper, R.G. (1999). From Experience: the invisible success factors in product innovation. Journal of Product Innovation Management, Vol. 16(2), 115–133. Cowan, R., & Hulten. S. (1996). Escaping lock-in: the case of the electric vehicle. Technology, forecasting and Social Change, Vol. 53(1), 61-79. Cowan, R., & Gunby, P. (1996). Sprayed to death: path dependence, lock-in and pest control strategies. The Economic Journal, Vol. 106: 521-542. Cowan, R., & Jonard, N. (2003). The dynamics of collective invention. Journal of Economic Behaviour & Organization, Vol. 52(4), 513-532.
218
Cox, W., Pisarski, A., & Utt, R.D. (2006). 21st century highways: innovative solutions to America's transportation needs. Washington, DC: The Heritage Foundation. Cragg, J.G. & Uhler, R.S. (1970). The demand for automobiles. Canadian Journal of Economics, Canadian Economics Association, Vol. 3(3), 386-406. Creutzig, F. (2009). Fixing Beijing’s transport nightmare. Beijing: Chinadialogue. Retrieved from: http://www.chinadialogue.net/article/show/single/en/2905-Fixing-Beijing-s-transport-nightmare Cribb. R. (2010). Digital atlas of Indonesian history. Copenhagen: Nordic Institute of Asian Studies. Retrieved from: www.indonesianhistory.info/ Cummings, R.T., Elliot, S., Harrison, G., & Murphy, J. (1997). Are hypothetical referenda incentives compatible? Journal of Political Economy, Vol. 105(3), 609-621. Daly, A., Hess, S., & Train, & K. (2009). Assuring finite moments for willingness to pay in random coefficient models. Transportation, Vol. 39(1), 19-31. Dargay, J D., Gately, G., & Sommer, M. (2007). Vehicle ownership and income growth, worldwide: 1960-2030. The Energy Journal, Vol. 28(4), 143-170. Das, D., (2010). Commercial vehicles in Delhi: diesel demand and sulphur emissions. Journal of Public Transportation, Vol. 13 (1), 73-95. Das, D., Dutta, S., & Sharifuddin, A. (2010). Car ownership and growth in Delhi. Decision, Vol. 2(37), 52-62. David, P.A. (1975). Technical choice, innovation, and economic growth. Cambridge: Cambridge University Press. David, P.A. (1985). Clio and the economics of QWERTY. Papers and proceedings of the ninety- seventh annual meeting of the American Economic Association (May, 1985), The American Economic Review, Vol. 75(2), 332-337. David, P.A. (1997). Path dependence and the quest for historical economics: one more chorus of the ballad of QWERTY. November, 1977. Unpublished manuscript: All Souls College. University of Oxford, Cambridge and Stanford University, Stanford. David, P.A. (2007). Path dependence: a foundational concept for historical social science. Cliometrica, Vol. 1(2), 91-114. Davis, R.K. (1963). The Value of outdoor recreation: an economic study of the Maine woods. PhD dissertation, Harvard University, Cambridge, MA. D’Acosta, A.P. (1995). The restructuring of the Indian automobile industry: Indian state and Japanese capital. World Development, Vol. 23(3), 485–502. DeCicco, J.M. (2013). Factoring the car-climate challenge: insights and implications. Energy Policy, Vol. 59(2013), 382-392. Delucci, M.,A. (1997). The annualised social cost of motor vehicle use in the U.S.A. based on 1990-1991 data: summary of theory, data, methods, and results. In Green D.L., Jones, D., & Delucchi, M.A., (Eds), (1997). Full costs and benefits of transportation. Berlin: Springer-Verlag. Delucchi, M. A. (2007). Do motor-vehicle users in the U.S.A. pay their way? Transportation Research Part 1A, Vol. 41(10), 982-1003. Desmet, K., & Fafchamps, M. (2005). Changes in the spatial concentration of employment across U.S.A. counties: a sectoral analysis 1972–2000. Journal of Economic Geography, Vol. 5(3), 261-284.
219
Del Rio, P., & Unruh G.C. (2007). Overcoming lock-out of renewable energy technologies in Spain: the case of wind and solar energy. Renewable and Sustainable Energy Reviews, Vol. 11(7), 1498-1513. Dhakal, S. (2005). Environmentally sound transport planning in Singapore. Singapore: Urban Development Authority, Land Transport Authority. Dhar, R. & Simonson, S., (2003). The effect of forced choice on choice. The Journal of Marketing Research, Vol. 40(2), 146-160. Diamond, P.A., & Hausman. J.A. (1994). Contingent valuation: is some number better than no number? The Journal of Economic Perspective, Vol.8(4), 45-64. Dimitriou, H.T. (1992). A development approach to urban transport planning: An Indonesian illustration. Aldershot, UK: Avebury. Direktorat Lalulintas Polda Metro Jaya, (2003). Statistik transportasi DKI Jakarta. Jakarta: Direktorat Lalulintas Polda Metro Jaya. Direktorat Lalulintas Polda Metro Jaya, (2009). Statistik transportasi DKI Jakarta. Jakarta: Direktorat Lalulintas Polda Metro Jaya. Direktorat Lalulintas Polda Metro Jaya, (2011). Statistik transportasi DKI Jakarta. Jakarta: Direktorat Lalulintas Polda Metro Jaya. DKI Jakarta (2014). Wikia, Indonesia. Retrieved from: http://indonesia.wikia.com/wiki/DKI_Jakarta Doi, N., & Asano, K. (2011). Understanding the factors affecting the urban transport energy in Asian cities – pathways of urban transport indicators from 1995 to 2009. Environmental Economics, Vol. 2(2),37-49. Dong–ah Ilbo, (2012). ROK per capita income on the rise. December 25. Jakarta: Dong-ah Ilbo. Retrieved from: www.english.donga.com/srv/sservice.php3?biid=201212534078 Downs, A. (1992). Stuck in traffic. Washington, DC: Brookings Institution and Lincoln Institute of Land Policy. Duki, Z., Sudarardi, S., Suzuki, S., & Kawadi, T. (2003). Effect of air pollution on respiratory health in Indonesia and its economic cost. Environmental Health: An International Journal, Vol. 58(3), 135-143. Dunlap, R.E., & Mertig, A.G. (1995). Global concern for the environment: is affluence a prerequisite? Journal of Social Issues, Vol. 51(4), 121-137. Duran, J.J., & Ubeda, F. (2005). The investment development path of newly developed countries. International Journal of the Economics of Business, Vol. 12(1), 123-137. Ealey, L. (1998). Global automotive retailing: a new perspective. Economist Intelligence Unit, London. Economy, E.C. (2007). The great leap backwards? The cost of China’s environmental crisis. Foreign Affairs, September – October 2007: 37-58. Economy Watch, (2013). Malaysian economic statistics and indicators. Singapore: Economy Watch. Retrieved from: www. Economywatch.com/economic-statistics/country/Malaysia Eichengreen, B. (1996). Globalizing capital: a history of the international monetary system. Princeton: Princeton University Press.
220
Englehart, R. (1971). The silent revolution in Europe: intergeneration change in post-industrial societies. American Political Science Review, Vol. 65(4), 991-1017. English News, (2012). Indonesia drafts budget revisions on fuel price hike. February 29. Beijing: News,Xinhuanet. ESCAP, (2001). Review and developments in transport and communications in the ESCAP region 1996-2001. September 2001. Bangkok: United Nations Economic and Social Commission for Asia and the Pacific. Evans, R. (2007). Central London congestion charging scheme:-ex-post evaluation of the quantified impacts of the original scheme. 29 June 2007. Congestion Charging Modelling and evaluation Team. London: Transport for London. Retrieved from: http://www.tfl.gov.uk/corporate/default.aspx Examiner, (2011). Beijing auto market growth world’s fastest. Examiner.com. Beijing: ASX Digital Group. Retrieved from: www.examiner.com/article/beijing-auto-market-growth-world’s-fastest Fang, C., Wei, H., Wang, Y., & Zhang J. (2012). The private car license plate auction in Shanghai: macro-effectiveness and micro-mechanisms. The Twelfth COTA International Conference of Transportation: August 3-6, 2012. Beijing, COTA. Retrieved from: http://ascelibrary.org/doi/abs/10.1061/9780784412442.014 Featherstone, M. (2004). Automobiles an introduction. Theory, Culture, Society, Vol. 2(1), 4-15. Febrina, A.S. (2009). Actors and technology in the shaping of urban transport networks in Jakarta, Indonesia. Masters thesis, Urban Management Master’s Programme. Berlin: Technische Universität. FHWA, (1997). Federal highway cost allocation study. Washington DC: Transport U.S.A. Retrieved from: www.fhwa.dot.gov/policy/hcas/summary/index.htm. Fink, J. (1988). The Automobile age. Cambridge, MA: MIT Press. Flavin, C., & Dunn, S. (1997). Rising sun, gathering winds: policies to stabilize the climate and strengthen economies. Worldwatch paper 138, November 1997. Washington DC: World Watch Institute. Fleming, C.M., & Bowden, M. (2009). Web-based surveys as an alternative to traditional mail methods. Journal of Environmental Management, Vol. 90(1), 284-292. Foxon, T.J. (2002). Technological and institutional ‘lock-in’ as a barrier to sustainable innovation. Centre for Energy Policy and Technology (ICCEPT) working paper, November 2002. London: Imperial College. Retrieved from http://www.iccept.ic.ac.uk/public.html Furth, P.G., Killough, G.F., & Ruprecht, G.F. (1988). Cluster sampling techniques for estimating transit patronage. Transportation Research Record, Issue 1165:105-114. Gallagher, K. (2004). Limits to leapfrogging in energy technology? Evidence from the Chinese automobile industry. Energy Policy, Vol. 34(4), 383-394. Gallup International Institute Survey. (1992). Survey No 59. Princeton, NJ: George H. Gallup International Institute. Garnaut, R. (2008). The Garnaut climate change review: final report. New York: Cambridge University Press. Garrod, G., Scarpa, R., & Willis, K.G, (2002). Estimating the benefits of traffic calming on through routes: a choice experiment approach. Journal of Transport Economics and Policy, Vol. 36: 211-231. Geels, F.W. (2005). Technological transitions and system innovations: a co-evolutionary and socio-technical analysis. Cheltenham, Edward Elgar.
221
Geels, F.W., & Kemp. R. (2007). Dynamics in socio-technical systems: typology of change processes and contrasting case studies. Technology in Society, Vol. 29(4), 441-455. Gliem, J.A., & Gliem, R.R. (2003). Calculating, interpreting, and reporting Cronbach's alpha reliability coefficient for Likert type scales. Midwest Research-to-Practice Conference in Adult Continuing, and. Community Education. Columbus, OH: The Ohio State University. Google maps, (2014). Maplandia.com. Retrieved from: http://www.maplandia.com/indonesia/dki-jakarta/ Gonzales, J., & Winch, G. (2006). Coming to terms with traffic congestion. Cambridge, MA: ResearchGate. Retrieved from: http://www.researchgate.net/publication.265939514-comming_to_terms_with_traffic_congestion Gonzales, P.D.R. (2008). Policy Implications of potential conflicts between short -term and long-term efficiency in CO2 emission abatement. Sociological Economics, Vol. 65: 292-303. Goodwin, P., & Van Dender, K. (2013). Peak car – themes and Issues. Transport Reviews, Vol. 33(3), 234-254. Gordon, P., & Radford, R.S. (1976). The relationship between population density, automobile ownership and automobile use: its role in transportation planning —a comment. The Annals of Regional Science, Vol. 10 (3), 127-129. Gore, A. (2007). Assault on reason. , London: Bloomsbury Publishing PLC. Grabher, G. (1993). The embedded firm: on the socioeconomic of industrial networks. London: Routledge. Gray, C. (1982). Survey of recent developments. Bulletin of Indonesian Economic Studies, Vol. 32(3), 3-31. Green, A.E. (1992). South Korea's automobile industry: development and prospects. Asian Survey, Vol. 2(5), 411-428. Greene, D.L., Jones, D.W., & Delucchi, M.A. (1997). The full costs and benefits of transportation: contributions to theory. New York: Springer Verlag. Greenwald, B.C., & Stiglitz, J.E. (1986). Externalities in economies with imperfect information and incomplete markets. The Quarterly Journal of Economics, Vol. 101(2), 229-264. Gupta, S. (2008). Urban transport in India: beyond the Nano. ISAS Brief no 51. Singapore: National University of Singapore. Gupta, J. (2010). A history of international climate change policy. Wiley Interdisciplinary Review, Vol. 1(5), 636-653. Gutfreund, O.D. (2004). Twentieth-century sprawl: highways and the reshaping of the American landscape. New York: Oxford University Press. Hacker, J.S., & Pierson, P. (2010). Winner take all politics. New York: Simon and Schuster. Harris, J.L. (1984). Henry Ford. New York: Franklin Watts. Hassan, S.S., Craft, C., & Kortron, W. (2003). Understanding the new basis for global market segmentation. Journal of Consumer Marketing, Vol. 20(5), 446-460. Hausman, J., & McFadden, D. (1984). Specification tests for the multinomial logit model. Econometrica, Econometric Society, Vol. 52(5),1219-1240.
222
Hayek, F. A. (1971). Nature vs. nurture once again. Encounter, Vol. 36: 81-83. Hayes, G. (2010). Driving and owning a car in China. Facts and details. Retrieved from: http://factsanddetails.com/china.php?itemid=409&catid=13#00) Hensher, D.A. (1981). Applied discrete choice modelling. London: Croom-Helm. Hensher, D.A. (1986). Automobile-type choice: a note on alternative specifications for discrete-choice modelling. Transportation Research Part B: Methodological, Vol. 20(5), 429–433. Hensher, D.A. (1989). Behavioural and resource value of travel time saving: a bicentennial update. Australian Road Research, Vol. 19: 223–229. Hensher, D.A. (1994). Stated preference analysis of travel choices: the state of practice. Transportation, Vol. 21(2), 107-133. Hensher, D.A. (2001). The valuation of commuter travel time savings for car drivers: evaluating alternative model specifications. Transportation, Vol. 28(2), 101-118. Hensher, D.A. (2001a). Measurement of the travel time savings. Journal of Transportation Economics and Policy, Vol. 35(1), 71-98. Hensher, D.A., Rose, J.M., Ortúzar, J.D., & Rizz, L.I. (2005). Estimating the value of risk reduction for pedestrians in the road environment: an exploratory analysis. Journal of Choice Modelling, Vol. 4(2), 70-94. Hensher, D.A., Rose, J., & Greene, H. (2012). Applied choice analysis. Cambridge: Cambridge University Press. Hoffman, S.D., & Duncan, G.J. (1988). A Comparison of choice-based multinomial and nested logit models: The family structure and welfare use: decisions of divorced or separated women. Journal of Human Resources, Vol. 23(4), 550-562. Hogarty, T. (1988). The benefits of road travel and transport. Washington DC: American Petroleum Institute. Holland, E.P., & Watson, P.l. (1978). Traffic restraint in Singapore. Traffic Engineering and Control, Vol. 19(1), 14-22. Holweg, M., Luo, J., & Oliver, N. (2005). The past present and future of China’s automotive industry: a value chain perspective. UNIDO global value chain project working paper version 11 August. Vienna: UNIDO. Hook, W., & Replogle, M. (1995). Motorization and non-motorized transport in Asia: transport system evolution in China, Japan and Indonesia. Land Use Policy, Vol. 3(1), 69-84. Humphrey, J. (2003). Globalization and supply chain networks: the auto industry in Brazil and India. Global Networks, Vol. 3(2), 121–141. Huo, H., Zhang, Q., He, K., Yqo, Z., Wang, X., Zheng, B., Streets, D., Wang, Q., & Ding, Y. (2011). Modelling vehicle emissions in different types of Chinese cities: importance of vehicle fleet and local features. Environmental Pollution, Vol. 15(10), 954-960. Illich. I. (1974). Energy and equity. New York: Harper and Rowe. INFRAS/IWU, (2004). External costs of transport update study. Paris: International Union of Railways.
223
Inglehart, R.F. (2008). Changing values among western publics from 1970 to 2006. West European Politics, Vol. 31(1-2), 130-146. Ingram, G.K., & Liu, Z. (1999). Determinants of motorization and road provision. World Bank Policy Washington, DC: Researach working paper No. 2042. Intergovernmental Panel on Climate Change, (2007). Climate change 2007 – synthesis report. Watson, R.T., & the Core Writing Team (Eds.) Geneva: Intergovernmental Panel on Climate Change. International Climate Change Workshop on Research Priorities and Policy Development, (2008). Jakarta Urban Transport Problems and Their Environmental Impacts. Jakarta: Jakarta Local Government. International Energy Agency, (2000). Experience curves for energy technology policy. ISBN 92-64-17650-0. Paris: International Energy Agency. Paris. Retrieved from: www.worldenergyoutlook.org. International Energy Agency, (2002). World energy outlook 2002. Paris: International Energy Agency. Retrieved from: http://www.worldenergyoutlook.org/media/weowebsite/2008-1994/weo2002_part1.pdf International Energy Agency, (2009). Transport energy and CO2: moving towards sustainability. Paris: International Energy Agency. . International Energy Agency, (2011). World energy report annual report, 2011. Paris: International Energy Agency. Accessible at: http://www.iea.org/publications/freepublications/publication/WEO2011_WEB.pdf International Energy Agency, (2012). International Energy Agency annual report, 2010. Paris: International Energy Agency. Retrieved from: https://www.iea.org/publications/freepublications/publication/IEA_Annual_Report_publicversion.pdf International Social Survey Program: Environment, (1993). International social survey program. G. Z. f. E. S. p. ICPSR version. Koeln, 1993. Koeln, Germany: Zentralarchiv fuer Empirische Sozialforschung/Ann Arbor, MI: Inter-university Consortium for Political and Social Research [distributors] 1996. International Social Survey Program (2002). ISSP: Environment II, (2000. G. Z. f. E. S. p. Cologne, 2002. Cologne, Germany: Zentralarchiv fur Empirische Sozialforschung/Ann Arbor, MI: Inter-university Consortium for Political and Social Research [distributors], 2004. doi:10.3886/ICPSR04104: [Computer file]. ICPSR04104-v1. International Transport Forum, (2010). Reducing greenhouse gas emissions – trends and data. OECD/IDTF, Paris. Jackson, K. (1985). The crabgrass frontier: the suburbanisation of the United States. New York: Oxford University Press. Karana, K.P. (2009). Force vehicles off roads to cut gridlock. Jakarta Globe, May 27th, Jakarta. Retrieved from: http://www.thejakartaglobe.com/archive/force-vehicles-off-roads-to-cut-gridlock-expert/ Jakarta Globe, (2009). Jakarta’s traffic costs public $2.8 billion a year says expert. September 11. Jakarta Globe. Retrieved from: http://thejakartaglobe.com/city/jakarta-traffic-costs-public-28b-per-year-says-expert/329256 Jakarta Post, (2012). Only 11% of Jakartans use public transportation. 16th February. Jakarta Post. Retrieved from: http://www.m.theJakartapost.com/2012/02/16/only-11-jakartans-use-pubic-transport
224
Jakob, A., Craig, J.L., & Fisher, G. (2006). Transport cost analysis: a case study of the total cost of private and public transport in Auckland. Environment, Science and Policy, Vol. 9(1), 55-66. Japan International Cooperation Agency (JICA) and Ministry of Communication (1985). Arterial road system development study in Jakarta metropolitan area. , Jakarta: Ministry of Communication. Japan International Cooperation Agency (JICA) and Ministry of Public Works (1993). Development of urban arterial road system in Jakarta metropolitan area. Jakarta: Ministry of Public Works. Japan International Cooperation Agency (JICA) and the Indonesian National Planning and Development Agency (BAPPENAS), (2001). The Study on integrated transport master plan for JABOTABEK (phase 1), volume 1: summary report. Jakarta: Pacific Consultants International and ALMEC Corporation. Japan International Cooperation Agency (JICA) and the Indonesian National Planning and Development Agency (BAPPENAS), (2004). The study on integrated transport master plan (SITRAMP) for the JABOTEK phase 2, final report. Jakarta: Pacific Consultants International and ALMEC Corp. Johnson, E. W. (1993). Avoiding the collision of cities and cars: urban transportation policy for the twenty-first century. Bulletin of the American Academy of Arts and Sciences, Vol. 47(2); 5-11. Jones, G. (2005). Multinationals and global capitalism. Oxford: Oxford University Press. Journeys, (2011). Passenger transport mode shares in world cities. Journeys, November, 2012. Retrieved from: www.app.ita.gov.sg/ltaacademy/doc/J11Nov-p60PassengerTransportModeSHares.pdf Jschina, (2012). 7 Subway lines of Nanjing under construction this year. Beijing: Information Office of the State Council of China. Retrieved from: http://english.jschina.com.cn/20322/201209/t1069921.shtml Kay, J. H. (1997). Asphalt nation: how the automobile took over America and how we can take it back. New York: Crown Publishers. Kari, F., & Rasiah, R. (2008). Automobile emissions and the environment: the Malaysian policy response. In Mytelka, L;K., and Boyle, G. (2008). Making choice about hydrogen; Transport Issues for Developing Countries. Tokyo: United Nations University. Kasipillia, J., & Chan, P. (2008). Travel demand management: lessons for Malaysia. Journal of Public Transport, Vol. 11(3); 41-55 .Kenworthy, J.R. (1994). Automobile dependence in Bangkok: an International comparison with implications for planning policies and air pollution. A case study. Melbourne: Murdoch University Institute for Sustainability and Technology Policy. Retrieved from: http://www.istp.murdoch.edu.au/ISTP/casestudies/Case_Studies_Asia/bangkok/bangkok.html Kenworthy, J.R., & Laube, F.B. (1999). An International sourcebook of automobile dependence In cities: 1960–1990. Colorado: University Press of Colorado. Kenworthy, J.R., & Laube, F.B. (1999a). Patterns of automobile dependence in cities: an international overview of key physical and economic dimensions with some implications for urban policy. Transportation Research Part A: Policy and Practice, Vol. 33(7), 691-723. Kessels, R. P., & Vandebroek, M. (2006). A comparison of criteria to design efficient choice experiments. Journal of Marketing Research , Vol. 43(3), 409-419. Keynes, J. M. (1936). The general theory of employment, interest and money. Cambridge: Macmillan Cambridge University Press for Royal Economic Society.
225
Kjaer, T. (2005). A review of the discrete choice experiment – with emphasis on its application to health care. Health Economics Papers, Vol. 1; Health Economics. Copenhagen: University of Southern Denmark. King, M.T., Hall, J., Lancsar, E., Fiefig, D., Hossian, I., Lourvier, J.J., Reddel, H., & Jenkins, R. (2007). Patient preferences for managing asthma: results from a discrete choice experiment. Health Economics, Vol. 16(7), 703-71. Knetsch, J. L. (1963). Outdoor recreation demands and benefits. Land Economics, Vol.39: 387-396. Kokaz, K., & Rogers, P. (undated). Systems analysis of personal transportation needs and environmental implications in India. Cambridge, MA: Harvard University. Retrieved from: http://www.seas.harvard.edu/TransportAsia/Presentations/september-india-delhi.pdf Kontoleon, A., & Mitsuyasu, Y. (2006). Market segmentation analysis of preferences for GM derived foods in the UK. Journal of Agricultural and Food Industrial Organisation, Vol. 4(1), 13-20. Kontoleon, A., Mitsuyasu, Y. (2006). Market segmentation analysis of preferences for GM derived foods in the UK. Journal of Agricultural and Food Industrial Organisation, Vol. 4(1), 13-20. Korona, J.P. (2010). Force vehicles off road to cut gridlock experts say. May 27. Jakarta Globe. Retrieved from: http://www.thejakartaglobe.com/city/force-vehicles-off-roads-to-cut-gridlock-expert/377333 Koshar, R. (2004). Cars and nations: Anglo-German perspectives on automobility between the world wars. Theory, Culture & Society, Vol. 21(4-5), 121 – 144. Koschatzky, K. (2000). The regionalisation of innovation policy in Germany: theoretical foundations and recent experience. Working paper: firms and region R1/2000. Karlsrue: Fraunhofer Institute for Systems and Innovation Research. Koundouri, P., Kountouris, Y., & Stithou, M. (2012). A choice experiments application in transport infrastructure: A case study on travel time savings, accidents and pollution reduction. Department of International and European Economic Studies. Athens: Athens University of Economics and Business. Retrieved from: http://mpra.ub.uni-muenchen.de/38274/1/MPRA_paper_38274.pdf Krugman, P. (1998). The legend of Arthur. January 31. Washington DC: Slate Magazine. Retrieved from: www.slate.com/articles/business/the.../the_legend_of_arthur.html Kuhfeld, W.F., Tobias R.D., & M Garratt, M. (1994). Efficient experimental design with marketing research applications. Journal of Marketing Research, Vol. 31(4), 545-557. Kumari, S., Rao, D.N. (2000). Valuing the benefit of air pollution abatement using a health production function: a case study of Panipat thermal power station, India. Environmental and Resource Economics, Vol. 20(2), 91–102. Kuznets, S. (1955). Economic growth and income inequality. American Economic Review, Vol. 49(1), 1-28. Lancaster, K.J. (1966). A new approach to consumer theory. Journal of Political Economy, Vol. 74(2), 132-157. Lave, C.A. (1969). A behavioural approach to modal split forecasting. Transportation Research, Vol. 3(4), 463–480. Lavelle M., & Pell, M.B. (2009). The climate lobby from soup to nuts. The International consortium of investigative journalists. Retrieved from: http://www.publicintegrity.org/2009/12/27/5479/climate-lobby-soup-nuts
226
Lee, D. (1997). Korean automotive industry in transition. , Seoul: Kia Economic Research Institute. Lee, H., Kang, H. (2008). The study of Brazilian automobile demand. Proceedings of the 39th Decision Sciences Institute annual meeting. Baltimore: Decision Sciences Institute. Retrieved from: https://www.decisionsciences.org/Proceedings/DSI2008/docs/143-8905.pdf Lee, S.M., Yoo, S. (1987). Management style and practice of Korean chaebols. Californian Management Review, Vol. 29(4), 95-110. Leonard, H.J., & Morell, D. (1981). Emergence of environmental concern in developing countries: a political perspective. Stanford Journal of International Law, Vol. 17: 281-313. Lewis, T. (1997). Divided highways. New York: Penguin Putman. Liebowitz, S.J., & Margolis, S.E. (1995). Path dependence, lock-in, and history. Journal of Law, Economics and Organization, Vol. 1(1), 205-226. Link, H. (2005). Transport accounts – methodological concepts and empirical results. Journal of Transport Geography, Vol. 13(1), 41–57. Lisco, T.E. (1967). The value of commuters’ travel time – a study in urban transportation. Ph.D. dissertation. University Microfilms. Ann Arbor, MI: University of Chicago. List, J.A., Berrens, R.P., Bohara, A.K., & Kerkvliet, J. (2004). Examining the role of social isolation on stated preferences. American Economic Review, Vol. 94(3), 742-752. List, J.A., Sinah, P., & Taylor, M. (2006). Using choice experiments to value non-market goods and services: evidence from field experiments. Advances in Economic Analysis and Policy, Vol. 6(2),1-37. Litman, T. (2002). Evaluating transportation equity. World Transport Policy & Practice, Vol. 8(2), 50-65. Litman, T. (2007). Travel time, transportation cost and benefit analysis. Victoria, BC: Victoria Transport Policy Institute. Retrieved from: (www.vtpi.org); at www.vtpi.org/tca/tca0502.pdf. Litman, T. (2009). Transportation cost and benefit analysis techniques: estimates and implications. Second Edition 2 January, Victoria, BC: Victoria Transport Policy Institute.. Litman, T. (2010). Evaluating public transit benefits and costs: best practices guidebook. Victoria, BC: Victoria Transport Policy Institute. Litman, T. (2013). The future isn’t what it used to be. Changing trends and their implications for transport planning. Victoria, BC: Victoria Transport Policy Institute. Low, N., Gleeson, B. (Eds), (2003). Making urban transport sustainable. New York: Palgrave Macmillan. Louviere, J.J. (1974). Predicting the evaluation of real stimulus objects from abstract evaluation of their attributes: the case of trout streams. Journal of Applied Psychology, Vol. 59(5), 572 – 577. Louviere, J.J., & Hensher, D.A. (1983). Using discrete choice models with experimental design data to forecast consumer demand for a unique cultural event. Journal of Consumer Research, Vol. 10(3), 348–361. Louviere, J.J, Hensher, D.A, & Swait, J. (2000). Stated choice methods: analysis and applications. Cambridge: Cambridge University Press.
227
Louviere, J.J., & Woodworth, J.J. (1983). Design and analysis of simulated consumer choice or allocation experiments: an approach based on aggregate data. Journal of Marketing Research, Vol. 20(4), 350–367. Lubis, H., Dharmowijoyo, D.B., & Armijaya, H. (2005). The competition of passenger transport modes along Jakarta-Bandung corridor. Proceedings of the Eastern Asia Society for Transportation Studies, Vol. 5: 75 – 89. Lutz, C., & Lutz Fernandez, A. (2010). Carjacked: the culture of the automobile and its effect on our lives. New York: Palgrave Macmillan. Macbeth, J. (2012). Capital gridlock looms in Indonesia. Jakarta Globe, January 10. Retrieved from: http://www.thejakartaglobe.com/opinion/capital-gridlock-looms-in-indonesia/490271 MacKenzie, J.J., Dower, R., & Donald, D.T. (1992). The going rate. Washington, DC: World Resources Institute. McCright, A., Riley, E., & Dunlap, R. (2003). Defeating Kyoto: the conservative movement’s impact on U.S.A. climate change policy. Social Problems, Vol. 3(3), 348-373. McFadden, D. (1974). Conditional logit analysis of qualitative choice behaviour. New York: Academic Press. McFadden, D. (1974a). The Measurement of urban travel demand. Journal of Public Economics, Vol. 3(.4), 303-328. McFadden, D., Bemmaor, A., Caro, F., Dominitz, J., Jun, BH, Matzkin, R, Molinari, F., Schwarz, N., Willis, R., & Winter, J. (2005). Statistical analysis of choice experiments. Marketing Letters, Vol. 16 (3-4), 183-196. McFadden, D., & Domencich, T. (1996). The measurement of urban travel demand. Mount Pleasant, MI; The Blackstone Company. McFadden, D., Talvitie, A.P., & Associates. (1977). Demand model estimation and validation. Berkeley: University of California Institute of Transportation Studies. McTaggart-Cowan, H.M., Shi, P., Fitzgerald, J.M., Aslam, A.H., Kopec, J.A., Bai, T.R., Soon, J.A., & Lynd, L.D. (2008). An evaluation of patients’ willingness to trade symptom free days for asthma related treatment risks: a discrete choice experiment. Journal of Asthma, Vol. 45(8), 630-638. Mader, J. (2006). Battery powered vehicles: don’t rule them out. Transport Energy Center Paper, November 16. Ann Arbor: University of Michigan. Mahidin, U., & Kanageswary, R. (2004). The development of the automobile industry and the road ahead. Kuala Lumpur: Department of Statistics Malaysia. Mahoney, J. (2000). Path dependence in historical sociology. Theory and Society, Vol. 29(4), 507-548. Maimunah, S., Oliva, E.C., Ahmad, Z.B., Yu, W., Sun, L., & Masuda, H. (2102). Promoting green transport systems in cities of developing countries through implementing bus rapid transit comparative study; Jakarta and Hang Zhou. Journal of International Development and Cooperation, Vol. 19(2), 57-67. Mäler, K., & Vincent, J.R. (2005). Handbook of environmental economics: valuing environmental changes. Vol. 2. San Deigo: Elsevier. Markard, J., & Truffer, B. (2008). Technological innovation systems and the multi-level perspective: Towards an integrated framework. Research Policy, Vol. 37(4), 596-615.
228
Marshall, A. (1961). Principles of economics. 9th ed. London: Macmillan. Martin, R. (2010). Rethinking regional path dependence: beyond lock-in to evolution. Roepke Lecture in Economic Geography. Economic Geography, Vol. 86(1), 1–27. Maslow, A.H. (1954). Motivation and personality. New York: Harper and Row. Metz, D. (2013). Peak car and beyond: the fourth era of travel. Transport reviews: A Transnational Transdisciplinary Journal, Vol. 33(3), 255-270. Meyer, M.D. (1997). Demand management as an element of transportation policy: using carrots and sticks to influence travel behavior. Transportation Research Part A: Policy and Practice, Vol. 33(7), 575-599. Miller, P., & Moffet, J. (1993). The Price of mobility – uncovering the hidden costs of transportation. Washington, DC: Natural Resources Defence Fund. Miller, D. (Ed), (2000). Car cultures. Oxford: Berg Publishers Michman, R., & Mazze, E. (2006). The affluent consumer: marketing and selling the luxury lifestyle. Westport: Praeger. Ministry of Statistics and Program Implementation, Government of India. New Delhi. Retrieved from: en.wikipedia.org/wiki/list_of_Inida_states_by_GPP Ministry of Transport Singapore, (2012). Certificates of entitlement. Singapore: Ministry of Transport. Retrieved from: http://app.mot.gov.sg/Land_Transport/Managing_Road_Use/Vehicle_Ownership.aspx. Mizutani, F., Suzuki, Y., & Sakai, H. (2011). Estimation of social costs of transport in Japan. Urban Studies, Vol. 48: 3537-3559. . Mochtar, Z., & Hino, Y. (2006). Principal issues to improve urban transport problems in Jakarta. Mem. Fac. Eng., Alaska City University, Vol. 47: 31-38. Mohamad, J., & Kiggundu, A.T. (2007). The rise of private car in Kuala Lumpur, Malaysia: assessing the policy options. IATSS Research, Vol. 31(1), 69–77. Moodysson, J., Coenen, L., & Asheim, B. (2008). Explaining spatial patterns of innovation: analytical and synthetic modes of knowledge creation in the Medicon Valley life-science cluster. Environment and Planning A, Vol. 40(5), 1040–1056. Moore, G. (1991). Crossing the chasm: marketing and selling high tech products to mainstream customers. New York: Harper Collins.. Moriaty, P., & Damon H. (2008). Low-mobility: the future of transport. Futures, Vol. 40(10), 865-872. Morris, H., & DeCicco, J. (1996). A critical review of API’s estimate of road user payments and expenditures. Washington, DC: American Council for an Energy-Efficient Economy. Moshe, B.A. (1997). Modelling methods for discrete choice. Marketing Letters, Vol. 8(3), 273-286. Moss, D., & Cisternino, J. (Eds.). (2009). Regulation and failure: new perspectives on regulation. Cambridge, MA: The Tobin Project. Mytelka, l., & Boyle, G. (2008). Making choices about hydrogen. Transport issues for developing countries. New York: United Nations University Press. Nader, R. (1991). Unsafe at any speed. New York: Grossman Publishers.
229
Nader, R., English, B., & Highland, J. (1973). Action for a change. A student’s manual for public interest organising. New York: Grossman Publishers. Nag, B., Banerjee, S., & Chatterjee, R. (2007). Changing features of the automobile industry in Asia: comparison of production, trade and market structure in selected countries. ESCAP Asia-Pacific Research and Training Network on Trade, working paper Series, No. 37. Nakicenovic, N. (1996). Freeing energy from carbon. Daedalus, Vol. 125(3), 95–112. Newell P., & Paterson M. (2010). Climate capitalism: global warming and the transformation of the global economy. Cambridge: Cambridge University Press. Newman, N. (2011). Indonesia telling lies. World Policy Journal, Vol. 28(4); 82-91. Newman P., & Kenworthy J. (2000). Sustainability and cities: overcoming automobile dependence. Washington, DC: Island Press.
Newman, P., & Kenworthy, J. (2011). Peak car use: understanding the demise of automobile dependence. World Transport Policy and Practice, Vol. 17(2), 31-42. North, D, C. (1990). Institutional change and economic performance. Cambridge: Cambridge University Press, North, D. C. (1996). Economic performance through time. The American Economic Review, Vol. 8(3), 359-368. OECD, (2008). OECD policy brief: climate change – meeting the challenge to 2050. Paris: OECD. Retrieved from: http://www.oecd.org/dataoecd/6/21/39762914.pdf Ooi, G.L. (2007). Urbanisation in southeast Asia: assessing policy process and progress towards sustainability. Journal of Industrial Ecology, Vol. 11(2), 31-42. Oreskes, N., & Conway, E.M. (2010). Merchants of doubt: how a handful of scientists obscured the truth on issues from tobacco smoke to global warming. New York: Bloomsbury Press. Park, S.O. (2000 ). A history of the Republic of Korea’s industrial structural transformation and spatial development. In Huang, Y., Bocchi, A. (2000). Reshaping economic geography in east Asia. Washington: The World Bank. Park, Y., & Hun-Koo Ha. (2006). Analysis of the impact of high-speed railroad service on air transport demand. Transport Research Part E: Logistics and Transportation Review, Vol. 42(2), 95-104. Park, Y.W. (2010). BRT system in Seoul and integrated E ticketing system. Symposium on public transportation in Indian cities. Hong Kong: UITP Asia Pacific. Payne, J.D. (2007). Who killed the electric car? Culver City CA: Paper cut Films. Payne, L. (2007a). Environmental public opinion in cross-national surveys: who’s willing to contribute? Presented at the South Political Science Association January 3-7, 2007. Houston: University of Houston. Peltzman, S. (1976). Towards a more general theory of regulation. National Bureau of Economic Research working paper No. 133. Cambridge, MA: National Bureau of Economic Research. Pendakur, V., S. (1999). A policy perspective for sustainable cities. Non-motorized transport in Asia. IATSS Res, Vol. 23(2), 51-61. Perelman, M. (2000). Transcending the economy: on the potential of passionate labor and the wastes of the market. New York: Macmillan.
230
Perkins, R. (2003). Environmental leapfrogging in developing countries: a critical assessment and reconstruction. Natural Resources Forum, Vol. 27(3), 177-188. Peter P.A., & Hausman, J.A. (1994). Contingent valuation: is some number better than no number? Journal of Economic Perspectives, Vol. 8(4), 45-64. Philip, B. (2010). Overstretched: Jakarta’s future as Indonesia’s capital is in doubt. The Guardian 28 December, 2010. Pierson, P. (2000). Increasing returns, path dependence, and the study of politics. American Political Science Review, Vol. 2(2), 251-267. Pigou, A.C. (1920). The economics of welfare. London: Macmillan. Polk Report, (2012). The average age of vehicles reaches record high. IHS Automotive: Southfield MI: Polk. Retrieved from: https//www.polk.company/news/average_age_of_vehicles_reaches_record_high_according_to_polk Pisarsky, A. (1996). Commuting in America II. The second national report on commuting patterns and trends. Landsdowne, VA: Eno Foundation Inc.. Poboon, C., Kenworthy, J., Newman, P., & Barter, P. (1994). Bangkok: anatomy of a traffic disaster. Paper presented to the Asian Studies Association of Australia biennial conference, Environment, State and society in Asia: the legacy of the twentieth century, 13-16 July, 1994. Perth: Asia Research Centre, Murdoch University, Pooley, E. (2010). The Climate wars. New York: Hyperion. Prabnasak, J., & Taylor, M.A. (2008). Study on mode choice and vehicle ownership in a medium-sized Asian city. Institute for Sustainable Systems and Technologies –Transport Systems. Adelaide: University of South Australia. Prakoso, H. (2012). Moving a capital city to improve transport conditions? The case of Jakarta. Jakarta: Indonesian Ministry of Transport. Retrieved from: www.Issuu.com/vilmouv/docs/article-ivm-prakoso-27-dec-2/1 Prameshwari, P. (2010). Lack of transport alternatives will lead to total gridlock in cities ministry says. Jakarta Globe, February 3. Retrieved from: http://www.thejakartaglobe.com/home/lack-of-transport-alternatives-will-lead-to-total-gridlock-in-cities-ministry-says/356607#Scene_1 Preservation Institute, (2013). Removing freeways – restoring cities: Seoul, South Korea. Seoul: Preservation Institute. Retrieved from: www.preservenet.com/freeways/FreewaysCheonggye.html Pucher, J., Korattyswaropama, N., Mittala, N., & Ittyerah, N. (2005). Urban transport crisis in India. Transport Policy, Vol. 12(3), 185–198. Pucher, J., Zhong-ren, P., Mittala, N., Zhu, Y., & Korattyswaropama, N. (2007). Urban transport trends and policy in China and India. Transport Review, 27(4), 379 -410. Puffert, D. J. (2000). Path dependence, network form, and technological change. Conference paper, June 2-3. Stanford University: Stanford, CA. Puffert, D.J. (2013). Path dependence. EH net. Originally posted October 18, 2013. U.K: Economic History Association. Retrieved from: http://eh.net/?s=Puffert Quintet, J. (1994). The social costs of transport: evaluation and links with internalisation policies. Chapter 2 of: Conference of Ministers of Transport, (19940. Internalising the social cost of transport. European Conference of Ministers of Transport. Paris: OECD. Retrieved from; http://internationaltransportforum.org/IntOrg/ecmt/taxes/pdf/94socCosts3e.pdf
231
Rae, J. (1965). The American automobile – a brief history. Chicago: University of Chicago Press. Rabl, A., & Spadaro, V. (2000). Health costs of automobile pollution. Review Francaise D’Alergologie et d’Immunologie Clinique, Vol. 40(1), 55-59. Reich, R. (2008). Supercapitalism. New York: Vintage Books. Resosudarmo, B.P., & Napitupulu, L. (2004). Health and economic impact of air pollution in Jakarta. The Economic Record, Vol. 80(Special), S65-S75. Reuters, (2010). China car sales top U.S.A. Reuters. Retrieved from: http://www.reuters.com/article/idUSTRE60A1BQ20100111 Rip, A., & Kemp, R. (1998). Constructing transition paths through the mode of niches. Chapter 10 in Rayner, S., Malone, E.L. (Eds), (1988). Technological change. Columbus Ohio: Battelle Press. Rizkiya, P. (2011). Contemporary urban setting in Jakarta and Indonesia. Master of urban agglomerations course: contemporary urban setting in Jakarta and Indonesia. Frankfurt: University of Applied Sciences. Accessible at: http://www.academia.edu/1839944/The_Contemporary_Urban_Setting_of_Jakarta Rodrigue, J.P., Comtois, C., & Slack, B. (2009). The geography of transport systems. Second edition. New York: Routledge. Rogers, E.M. (1995). Diffusion of innovations. 4th Ed. New York: The Free Press. Rolfe, J., Bennett, J., & Louviere, J.J. (2000). Choice modelling and its potential application to tropical rainforest preservation. Ecological Economics, Vol. 35(2), 289-302. Romilly, P. (1999). Substitution of bus for car travel in urban Britain: an economic evaluation of bus and car exhaust emission and other costs. Transportation Research Part D: Transport and Environment, Vol. 4(2), 109-125. Rosen, S. (1974). Hedonic prices and implicit markets: product differentiation in pure competition. Journal of Political Economy, Vol. 82(1), 34-55. Ryan, M., & Gerard, K. (2003). Using discrete choice experiments to value health care programmes: current practice and future research reflections. Applied Health Economics and Health Policy, Vol. 2(1), 55-64. St Clair, D.J. (1986). The motorization of American cities. New York: Praeger Publishers. Samuelson, P.A. (1939). The Gains from international trade. Canadian Journal of Economics and Political Science, Vol. V: 195-205. Samuelson, P.A. (1947). Foundations of economic analysis. Cambridge, MA: Harvard University Press. Samuelson, P.A. (1964). Public goods and subscription TV: correction of the record. Journal of Law and Economics, Vol. VII: 81–83. Santos, G. (2008). The London congestion charging scheme, 2003-2006. Chapter 8 in Richardson, H.W., Bae, C.H-hee. (Eds), (2008). Road congestion pricing in Europe. Northampton: Edward Elgar Publishing. Scarpa, R., & Rose, M.J. (2008). Design efficiency for non-market valuation with choice modelling: how to measure it, what to report and why. The Australian Journal of Agricultural and Resource Economics, Vol. 52(3), 252-282.
232
Schwartz, H. (2004). Down the wrong path: path dependence, increasing returns, and historical institutionalism. Unpublished Manuscript. Charlottesville VA: University of Virginia. Scruggs, L., & Benegal, S. (2012). Declining public concern about climate change: can we blame the great recession? Global Environmental Change, Vol. 22(2), 505 – 515. Sedgwick, M. (1970). Cars of the 1930s. B.T. London: Batsford. Seely, B. E. (1987). Building the American highway system: engineers as policy makers. Philadelphia: Temple University Press. Seiler, C. (2008). Republic of drivers: a cultural history of automobility in America. Chicago: University of Chicago Press. Senbil, M., Zhang, J., Fujiwara, A., & Asri, D.U. (2005). Development of a choice model for evaluating sustainable urban form. Proceedings of the Eastern Asia Society for Transportation Studies, Vol. 5: 2164 -2178. Senbil, M., Zhang, J., & Fujiwara, A. (2006). Motorcycle ownership and use in Jabotabek (Indonesia). Metropolitan area discussion paper series Vol. 2006-3. Graduate School of International Development and Cooperation. Hiroshima: Hiroshima University. Seoul Metropolitan Government, (2013). Seoul’s challenges and achievements for an environmentally sustainable healthy urban transport system. Seoul: Seoul Metropolitan Government. Retrieved from: English.Seoul.go.kr/gtk/cg/policy_view.php?idx=13&cPage=1& Setiawati, I. (2009). Jakarta’s air among Asia’s cleanest? Say it ain’t so! Jakarta Post October 17. Retrieved from: http://www.thejakartapost.com/news/2009/10/17/jakarta039s-air-among-asia039s-cleanest-say-it-ain039t-so.html Shariff, N.M. (2012). Private vehicle ownership and transport planning in Malaysia. IPCSIT Vol. 26. Singapore: IACSIT Press. Sheller, M. (2004). Automotive emotions: feeling the car. Theory culture and Society, Vol. 21(4-5), 221-22. Shen, J. (2009). Latent class model or mixed logit model? A comparison by transport mode choice data. Applied Economics, Vol. 41(22), 2915-2924. Simon, H. (1947). Administrative behavior: a study of decision-making processes in administrative organization. 4th ed. in 1997. New York: The Free Press. Siemens, (2012). Asia green city index. Siemens, Munich, and the Economist Intelligence Unit, London. Retrieved from: www.siemens.com/innnovation/apps.pof_microsite/_pofspring2011/_html_en/asia-gic.html Singapore Ministry of Manpower, (2012). Report on labour force in Singapore 2011. Singapore: Singapore Ministry of Manpower. Retrieved from: http://www.mom.gov.sg/statisticspublications/national-labourmarketinformation/publications/ pages/report-labour-force-2011.aspx Small Business Taxes & Management, (2012). Small business taxes and management. New York: smbiz.com. Retrieved from: http://www.smbiz.com/sbrl003.html Small, C.A., Winston, C., & Yan, J. (2005). Uncovering the distribution of motorists’ preferences for travel and time reliability. Econometrica, Vol. 73(4), 1367-1382. Small, K.A. (1997). Economics and urban transportation policy in the United States. Regional Science and Urban Economics, Vol. 27(6), 671–691.
233
Smith, A., Jan, P., & John, G. (2010). Innovation studies and sustainability transitions: the allure of the multi-level perspective and its challenges. Research Policy, Vol. 39(4), 435-448. Soros, G. (2008). The new paradigm for financial markets: the credit crisis of 2008 and what It means. New York: Public Affairs, Stark, D., & Bruszt, L. (2001). One way or multiple paths: for a comparative sociology of East European Capitalism. American Journal of Sociology, Vol.106: 1129–37. Statistics Singapore, (2012). Yearbook of statistics, Statistics Singapore. Singapore: Statistic Singapore. Accessible at: www.singstat.gov.sg/pubn/reference/sif2012.pd Statistik Transportasi DKI Jakarta, (2003) Direktorat Lalulintas Polda Metro Jaya. Jakarta. Stern, N. (2006). The Stern Review: the economics of climate change. London: HM Treasury. Stigler, G. J. (1961). The economics of information. Journal of Political Economy, Vol. 69(3), 213-225. Stigler, G.J. (1971 ). The theory of economic regulation. The Bell Journal of Economics and Management Science, Vol. 2(1), 3-21. Stigler, G. J. (1985). The economist as preacher. Oxford: Blackwell. Stiglitz J. E. (1986). Economics of the public sector. New York: W.W. Norton. Stiglitz, J.E. (1989). Markets, market failure and development. The American Economic Review, Vol. 79(2), 197-203. Stiglitz, J. E. (2002). Information and the change in the paradigm in economics. The American Economic Review, Vol. 92(3), 521-532. Stiglitz, J. E. (2009). GDP fetishism. The Economists’ Voice, Vol. 6(8), 1-3. Stiglitz, J, E. (2009a). Regulation and failure. Chapter 1 in Moss, D., & Cisternino, J. (Eds). (2009). Regulation and failure: new perspectives on regulation. Cambridge: The Tobin Project. Stiglitz, J.E. (2010). Risk and global economic architecture: why full financial integration may be undesirable. NBER working paper No. 15718 issued in February 2010 NBER Programs. Cambridge, MA: The National Bureau of Economic Research. Stiglitz, J.E. (2012). Freefall. America, free markets and the sinking of the world economy. London: Allen Lane. Stokes, G., & Hallett, S. (2007). The role of advertising and the car. Transport Reviews: A Transnational Transdiscipilinary Journal, Vol. 12(2), 171-183. Storz, C. (2008). Dynamics in innovation systems: evidence from Japan's game software industry. Research Policy, Vol. 37(9): 1480-1491. Strathman, J.G., & Hopper, J.R. (1991). Evaluation of automotive passenger counters: validation sampling and statistical inference. Transportation Research Record, issue number: 1308: 69-77. Strange, S. (1996). The Retreat of the state. The diffusion of power in the world economy. Cambridge: Cambridge University Press. Sturgeon, T., Van Biesebroeck, J., & Gereffi, G. (2008). Value chains, networks, and cluster reframing the global automotive industry. Global production networks: debates and challenges. Journal of Economic Geography, Vol. 8 (3), 297-321.
234
Sun, J., Lu, Q., & Peng, Z. (2011). China’s public transportation: problems, policies, and prospective of sustainability. ITE Journal, May, 2012: 36-40. Suryo, R., Fan, C., & Weiler, S. (2007). Commuting choices and congestion taxes in industrialising Indonesia. The Social Science Journal, Vol. 44(2), 253-273. Susilo, Y.O., Santosa, W., Tjoewono, T.B., & Parikesit, D. (2007). A reflection of motorization and public transport in Jakarta metropolitan area. Journal of the Eastern Asia Society for Transportation Studies, Vol. 7(1), 299-314. Sutomo, H., Saumatmaji, F., & Djarwoningrum, R. (2007). Bus rapid transit in Jakarta: evaluating the factors that impede or facilitate. Paper included in: Air pollution control in the transportation sector: third phase research report of the Urban Environmental Management Project. Institute for Global Environmental Strategies. Bandung: Gadja Mada University. Sydow, J., Lerch, F., & Staber, U. (2010). Planning for path dependence? The case of a network in the Berlin-Brandenburg optics cluster. Economic Geography, Vol. 86(2), 173-195. Tang, R. (2009). The rise of China’s auto industry and its impact on the U.S.A. motor vehicle industry. C. Washington, DC: Congressional Research Service. Retrieved from: http://digitalcommons.ilr.cornell.edu/key_workplace/688 Tanko, M., & Burke, M. (2013). How did Brisbane get it’s busways? Findings of a study into mode-choice decision-making in Brisbane. Australian Transport Research Forum, 2013, Proceedings, 2-4 October 2013. Brisbane: Australian Transport Research Forum. The American Lung Association, (1966). Health effects of outdoor air pollution. Washington, DC:The American Lung Association. The Center for Public Integrity, (2009). The climate change Lobby. Washington, DC: The Center for Public Integrity .Retrieved from: http://www.publicintegrity.org/investigations/global_climate_change_lobby/articles/entry/1884/ The Climate Change Lobby, (2009). The Climate lobby from soup to nuts. December 27. Washington, DC: Center for Public Integrity. Retrieved from: http://www.publicintegrity.org/investigations/global_climate_change_lobby/ The Economist, (2012). China and Indonesia are the two hottest markets in Asia right now. The Economist, May 26, Page 71. The Institute for Transportation and Development Policy (2009). Sustainable transport system needed in Jakarta. May 27. New York: The Institute for Transpiration and Development. Retrieved from: http://www.itdp.org/news/sustainable-transportation-system-needed-in-jakarta/ The National Highway Traffic Safety Administration, (1996). Traffic safety facts 1996: a compilation of motor vehicle crash data from the fatality analysis reporting system and the general estimate system. Washington, DC: National Center for Statistics and Analysis, National Highway Traffic Safety. The World Bank, (2002). Cities on the move: a World Bank urban transport strategy review. Washington, DC: The World Bank, Washington, DC. The World Bank, (1994). Indonesia environment and development: challenges for the future. Washington, DC: The World Bank. The World Bank, (2011). Motor vehicles (per 1000 people). Washington, DC: The World Bank. Retrieved from: http://data.worldbank.org/indicator/IS.VEH.PCAR.P3 Thompson, S.K. (1990). Adaptive cluster sampling. Journal of the American Statistical Association, Vol. 85(412), 1050-1059.
235
Thompson, W., & Hickey, J. (2005). Society in focus: an introduction to sociology. Boston, MA: Allyn and Bacon. Timilsina, G., & Shrestha, A. (2009). Why have CO2 emissions increased in the transport sector in Asia? Policy research working paper 5098. Washington, DC:The World Bank Development Research Group. Tjernstrom, E., & Tietenberg, T. (2008). Do differences in attitude explain differences in national climate change policies? Ecological Economics, Vol. 65(2), 315-324. Tollefson, P., Rypadal, K., Torvanger, A., & Rive. N. (2009). Air pollution polices in Europe: efficiency gains from integrating climate effects with damage cost to health and crops. Environmental Science and Policy, Vol. 12: 870-881. Townsend, C. (2003). In whose interest? A critical approach to Asian transport dynamics. PhD thesis. Perth: Murdoch University. Train, K. (1980). A structured logit model of auto ownership and mode choice. Review of Economics and Statistics, Vol. 47(2), 357–370. TransApex Project Executive Group, (2005). Prefeasibility report March 2005. 16 March 2005. TransApex. Brisbane: Queensland Government. Transport for London, (2011). Good practices in city energy efficiency: London, United Kingdom – Congestion charges for urban transport. Energy efficient cities initiative, Congestion Charging Division. London: Transport for London. Truong P., & Hensher D.A. (1985). Measurement of travel time values and opportunity cost from a discrete-choice model. The Economic Journal, Vol. 95(378), 438-451. UNCTAD, (2001). World investment report 2001. New York: UNCTAD. UNCTAD, (2012). World investment report 2012. New York: UNCTAD. Union of Concerned Scientists (2007). Voices of federal climate scientists: survey: federal climate scientists (2006). Cambridge, MA: Union of Concerned Scientists. Retrieved from: http://www.ucsusa.org/scientific_integrity/abuses_of_science/federal-climate scientists.html Union of Concerned Scientists, (2007). Smoke, mirrors and hot air. Cambridge, MA: The Union of Concerned Scientists. United Nation University (undated). Archives. Retrieved from: nu.edu/unpress/unpbooks/uu11ee16.htm Unruh, G.C. (2000). Understanding carbon lock-in. Energy Policy, Vol. 28(12), 817-830. Unruh, G. C. (2002). Escaping carbon lock-in. Energy Policy, Vol. 30(4), 317-325. Unruh, G. C. (2006). Globalising carbon lock-in. Energy Policy, Vol. 34(10), 1185-1197. Urry, J. (2004). Automobility. Theory, culture and society, Vol. 21(4-5), 25-39. Urry, J. (2008). Governance, flows, and the end of the car system? Global Environmental Change, Vol.18(3), 343-349. U.S.A. Department of Energy, (2010). Fact # 617. Vehicle Technologies Office. Washington, DC: U.S.A. Department of Energy. Retrieved from:www.eere.energy.gov/vehiclesandfuels/facts/m/2010.
236
U.S.A. Department of Labor (1996). The CE and the PCE: a comparison. Monthly Labor Review September 2006, pp. 20-46. Utterback, J.M., Abernathy, W.J. (1975). A Dynamic model of product and process innovation. Omega, Vol. 3(6), 639-656. Utterback, J.M., Suarez, F.F. (1993). Innovation, competition and industry structure. Research Policy, Vol. 22(1), 1-21. Vasconcellos, A. (1997). The demand for cars in developing countries. Transport Research Part A: Policy and Practice, Vol. 31(3), 245-258. Vedagiri, P., & Arasan, T. A. (2009). Modelling modal shift due to the enhanced level of bus service. Transport, Vol. 24(2), 121-128. Victoria Institute of Transport Studies (2009). Transportation cost and benefit analysis: techniques, estimates and implications. Victoria BC: Victoria Institute of Transport Studies. Retrieved from: http://www.vtpi.org/tca/ Von Hippel, E. (1998). The Sources of innovation. New York: Oxford University Press. Vyncke, P. (2002). Values, aesthetic styles, life visions and media preferences lifestyle segmentation. European Journal of Communication, Vol. 17(4), 445. Wachs, M., & Crawford, M., with Wirka, S., & Rikala, T., Eds. (1992). The car and the city: the automobile, the built environment, and daily urban life. Michigan: University of Michigan Press. Walker, W. (2000). Entrapment in large technology systems: institutional commitment and power relations. Research Policy, Vol. 29(7), 833-846. Wannacott, T.H., & Wannacott, R.J. (1990). Introductory statistics for business and economics. New York: Wiley. Weiss, L. (1995). Governed interdependence: rethinking the government-business relationship in East Asia. The Pacific Review, Vol. 8(4); 589-616. World Health Organisation, (2008). Air quality and health. Geneva: World Health Organisation. Retrieved from: http://www.wpro.who.int/environmental_health/documents/docs/SeoulReportonESHUT.pdf World Resources Institute, (2006). Climate analysis indicators tool kit. (CAIT) on-line database version 3.0. Washington, DC: CAIT. Accessible at: http://cait.wri.org Xie, B., & Oliver, N. (1966). The developing Chinese automotive industry. Judge Institute of Management Studies. Cambridge: University of Cambridge. Xie, L. (2012). Automobile usage and urban rail transit expansion. Job Market Paper. Berkeley: University of California. Yagi, S., & Mohommadian, A.K. (2008). Joint models of home-based tour mode and destination choices. Transport Research Record: Journal of the Transportation Research Board, No. 2076, pp 29-40. Yago, G. (1984). The decline of transit: urban transportation in Germany and U.S cities. New York: Cambridge University Press. Yang, X. (1995). Globalisation of the automobile industry. Westport: Praeger.
237
Yulianawati, H., Flaschsbart, P., & Saksena, S. (2010). Commuter exposure to particularte matter (PM10) and carbon monoxide (CO) in Jakarta, Indonesia. Extended abstract no 688. Honolulu: University of Hawaii. Yusuf, S., & Nabashima, K. (2006). Post industrial east Asian cities: innovation for growth. Palo Alto: Stanford University Press, and, Washington, DC: The World Bank. Zegras, P.C., & Gakenheimer, R. (2006). Driving forces in developing cites transportation systems: insights from selected cities. Developing country urban transport cases. Cambridge, MA: Massachusetts University of Technology, Accessible at: web.mit.edu/czgras/www/Zedgras&Gakheimer_WBCSD3.pdf Zelin, A., & Stubbs, R. (2005). Cluster sampling: a false economy? International Journal of Market Research, Vol. 47(5), 503-524. Zhou, Y.X., & Logan J.R. (2006). Suburbanisation of urban China: a conceptual framework. Draft Chapter from Zhou Y., and Logan, J.R.,(2007), Growth on the edge: the new Chinese metropolis. Urban China in Transition pp.140-160. London: Blackwell Publishers.
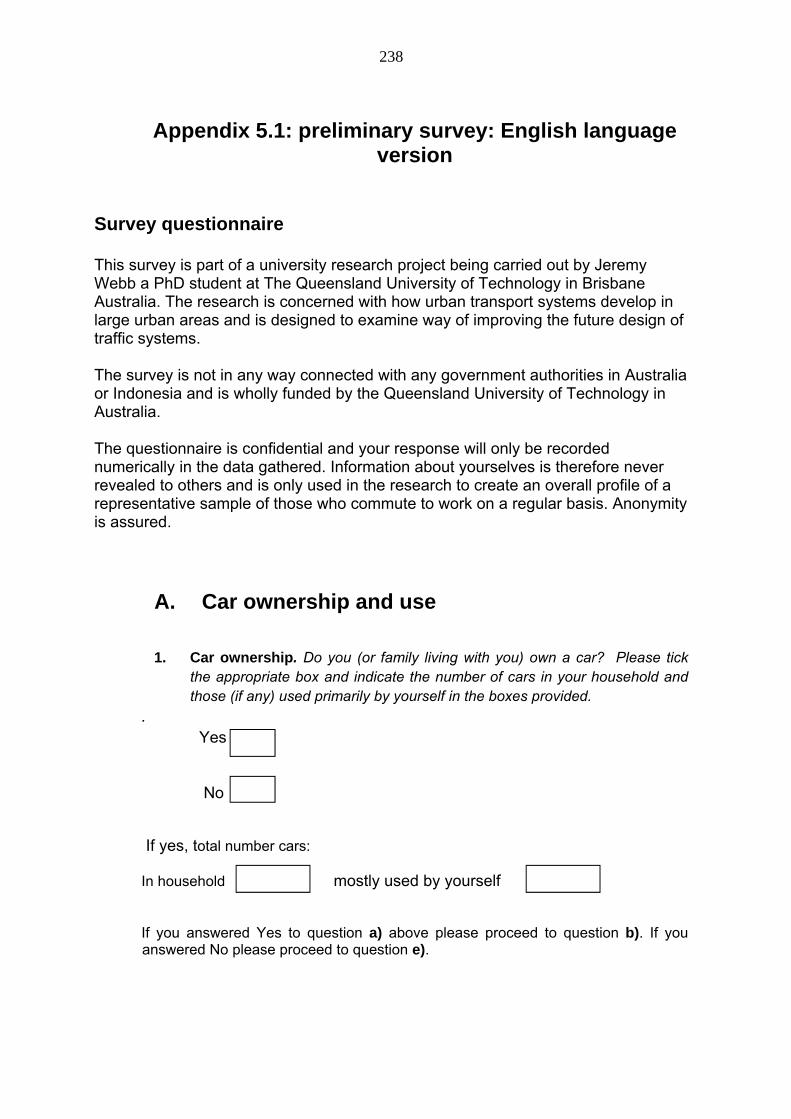
238
Appendix 5.1: preliminary survey: English language
version
Survey questionnaire
This survey is part of a university research project being carried out by Jeremy Webb a PhD student at The Queensland University of Technology in Brisbane Australia. The research is concerned with how urban transport systems develop in large urban areas and is designed to examine way of improving the future design of traffic systems. The survey is not in any way connected with any government authorities in Australia or Indonesia and is wholly funded by the Queensland University of Technology in Australia. The questionnaire is confidential and your response will only be recorded numerically in the data gathered. Information about yourselves is therefore never revealed to others and is only used in the research to create an overall profile of a representative sample of those who commute to work on a regular basis. Anonymity is assured.
A. Car ownership and use
1. Car ownership. Do you (or family living with you) own a car? Please tick
the appropriate box and indicate the number of cars in your household and those (if any) used primarily by yourself in the boxes provided.
. Yes
No
If yes, total number cars: In household mostly used by yourself
If you answered Yes to question a) above please proceed to question b). If you answered No please proceed to question e).
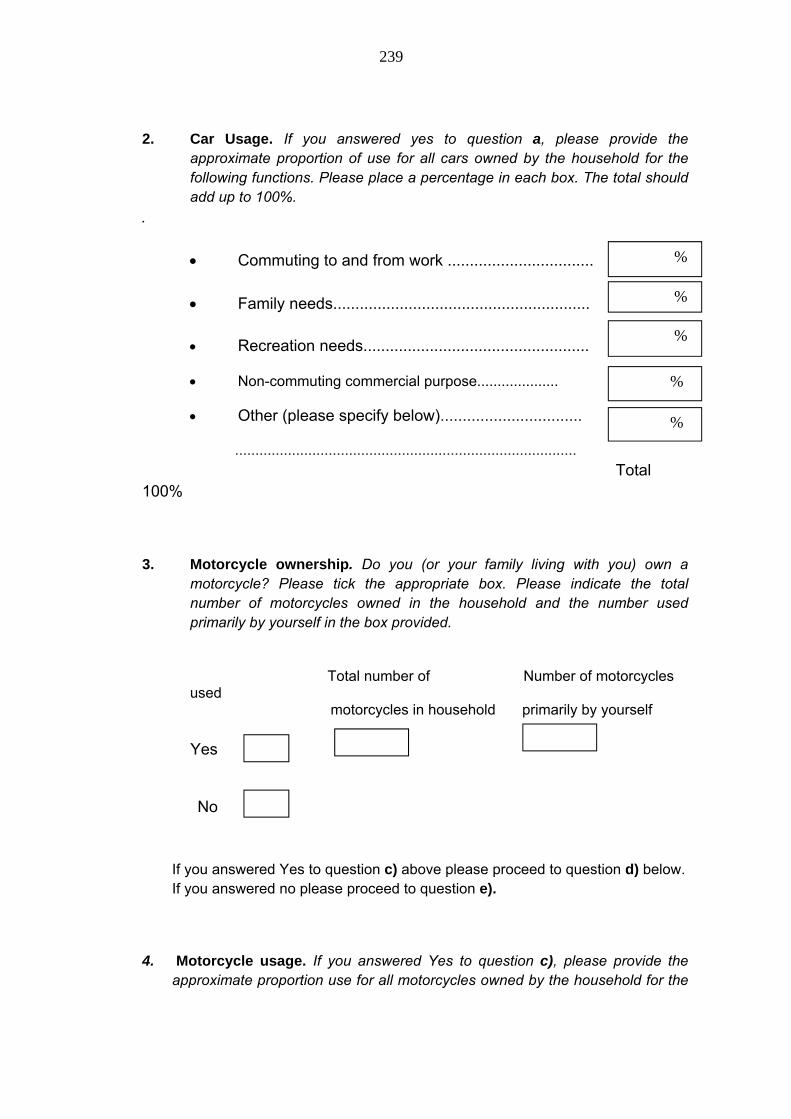
239
2. Car Usage. If you answered yes to question a, please provide the
approximate proportion of use for all cars owned by the household for the following functions. Please place a percentage in each box. The total should add up to 100%.
.
Commuting to and from work .................................
Family needs.......................................................... Recreation needs...................................................
Non-commuting commercial purpose....................
Other (please specify below)................................ .................................................................................... Total
100%
3. Motorcycle ownership. Do you (or your family living with you) own a
motorcycle? Please tick the appropriate box. Please indicate the total number of motorcycles owned in the household and the number used primarily by yourself in the box provided.
Total number of Number of motorcycles used motorcycles in household primarily by yourself
Yes No
If you answered Yes to question c) above please proceed to question d) below. If you answered no please proceed to question e).
4. Motorcycle usage. If you answered Yes to question c), please provide the
approximate proportion use for all motorcycles owned by the household for the
%
%
%
%
%
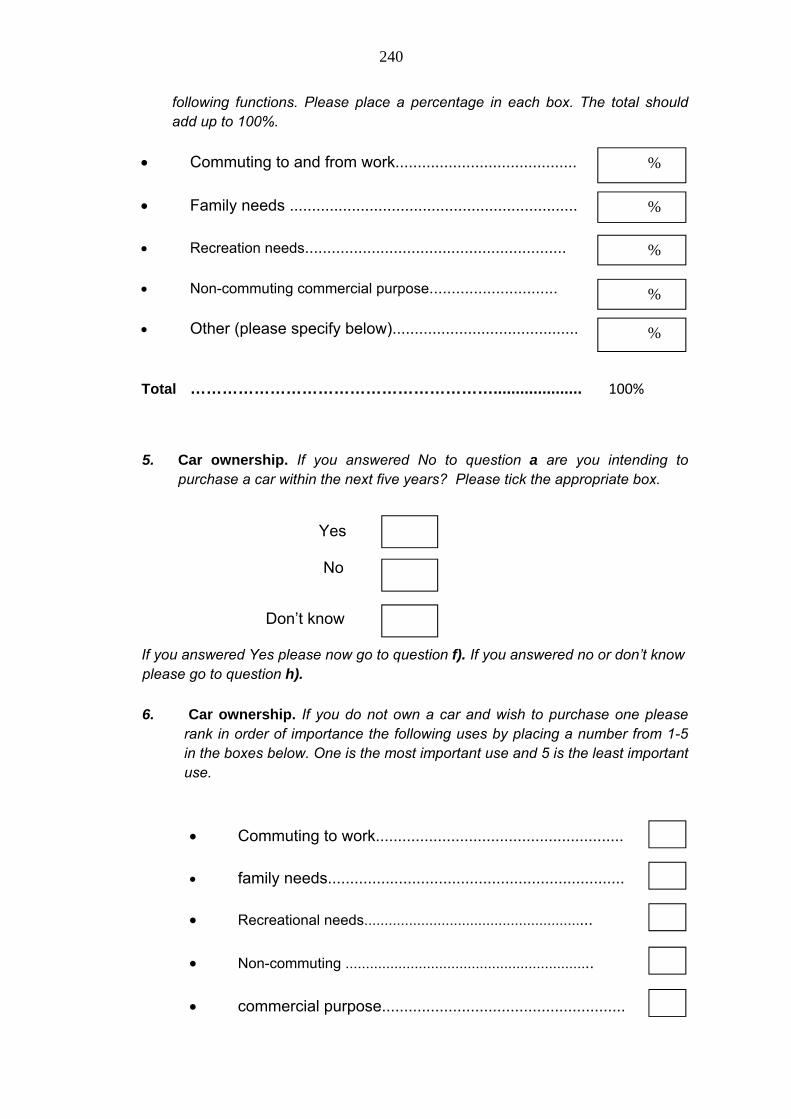
240
following functions. Please place a percentage in each box. The total should add up to 100%.
Commuting to and from work......................................... Family needs ................................................................. Recreation needs...........................................................
Non-commuting commercial purpose.............................
Other (please specify below)..........................................
Total ………………………………………………….................... 100%
5. Car ownership. If you answered No to question a are you intending to
purchase a car within the next five years? Please tick the appropriate box.
Yes No
Don’t know If you answered Yes please now go to question f). If you answered no or don’t know please go to question h).
6. Car ownership. If you do not own a car and wish to purchase one please
rank in order of importance the following uses by placing a number from 1-5 in the boxes below. One is the most important use and 5 is the least important use.
Commuting to work........................................................ family needs...................................................................
Recreational needs........................................................
Non-commuting .............................................................
commercial purpose.......................................................
%
%
%
%
%
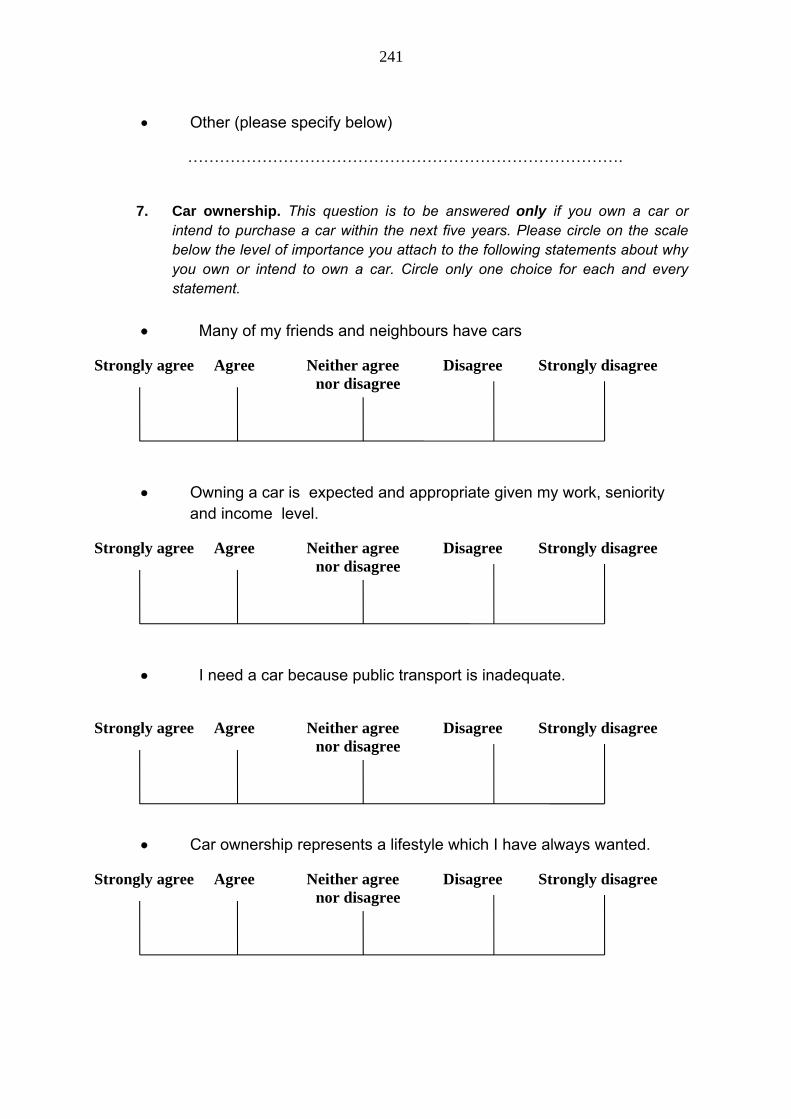
241
Other (please specify below)
……………………………………………………………………….
7. Car ownership. This question is to be answered only if you own a car or intend to purchase a car within the next five years. Please circle on the scale below the level of importance you attach to the following statements about why you own or intend to own a car. Circle only one choice for each and every statement.
Many of my friends and neighbours have cars
Strongly agree Agree Neither agree Disagree Strongly disagree nor disagree
Owning a car is expected and appropriate given my work, seniority
and income level.
Strongly agree Agree Neither agree Disagree Strongly disagree nor disagree
I need a car because public transport is inadequate.
Strongly agree Agree Neither agree Disagree Strongly disagree
nor disagree
Car ownership represents a lifestyle which I have always wanted.
Strongly agree Agree Neither agree Disagree Strongly disagree nor disagree
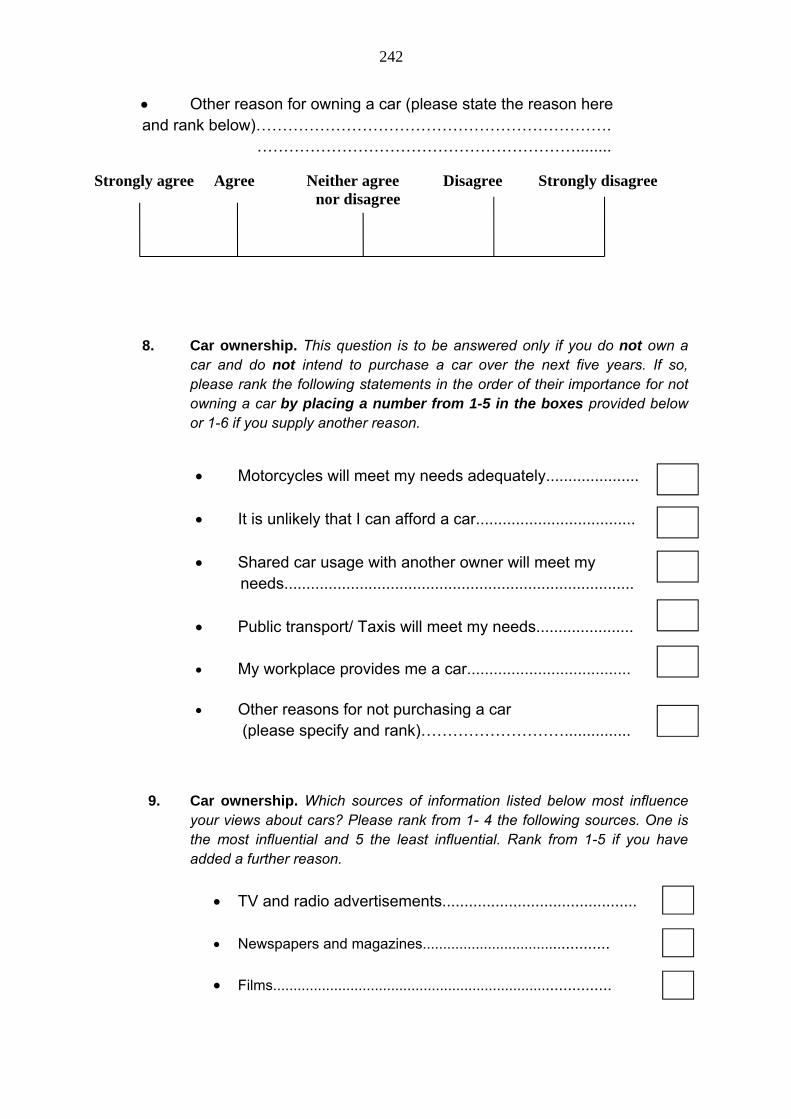
242
Other reason for owning a car (please state the reason here and rank below)…………………………………………………………. ……………………………………………………........
Strongly agree Agree Neither agree Disagree Strongly disagree nor disagree
8. Car ownership. This question is to be answered only if you do not own a
car and do not intend to purchase a car over the next five years. If so, please rank the following statements in the order of their importance for not owning a car by placing a number from 1-5 in the boxes provided below or 1-6 if you supply another reason.
Motorcycles will meet my needs adequately.....................
It is unlikely that I can afford a car.................................... Shared car usage with another owner will meet my needs............................................................................... Public transport/ Taxis will meet my needs...................... My workplace provides me a car.....................................
Other reasons for not purchasing a car (please specify and rank)………………………...............
9. Car ownership. Which sources of information listed below most influence
your views about cars? Please rank from 1- 4 the following sources. One is the most influential and 5 the least influential. Rank from 1-5 if you have added a further reason.
TV and radio advertisements............................................
Newspapers and magazines.............................................
Films..................................................................................
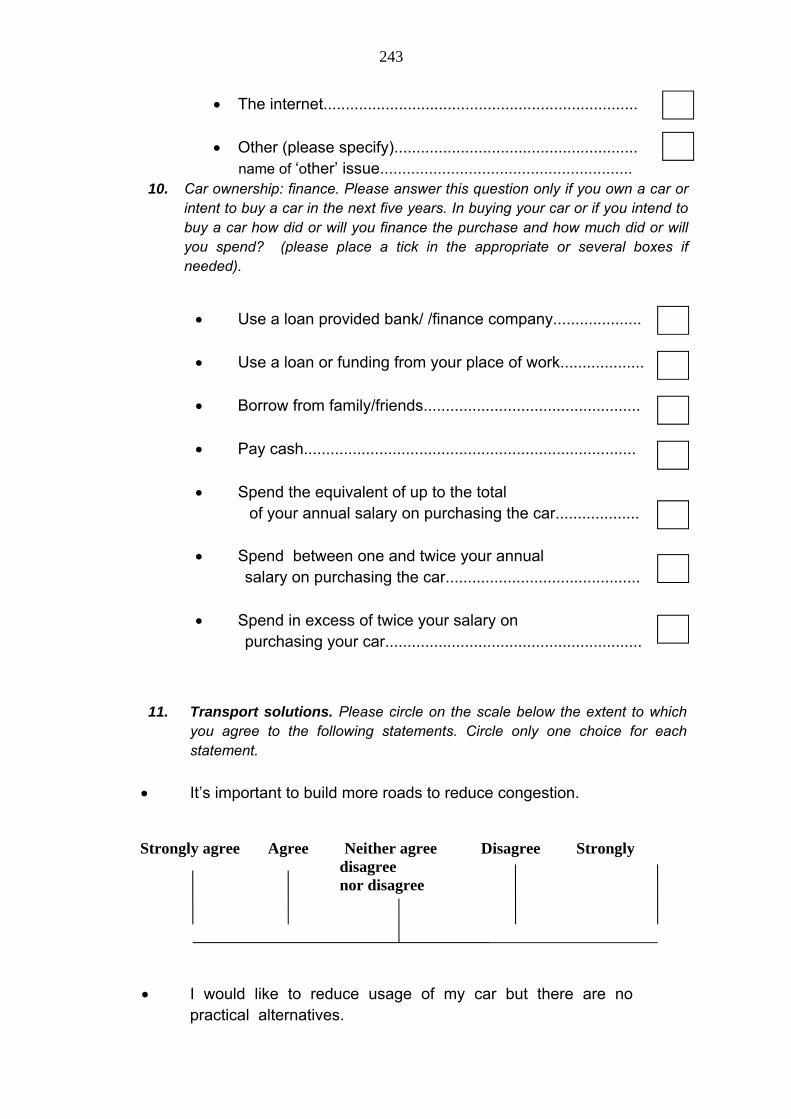
243
The internet.......................................................................
Other (please specify)....................................................... name of ‘other’ issue.........................................................
10. Car ownership: finance. Please answer this question only if you own a car or intent to buy a car in the next five years. In buying your car or if you intend to buy a car how did or will you finance the purchase and how much did or will you spend? (please place a tick in the appropriate or several boxes if needed).
Use a loan provided bank/ /finance company.................... Use a loan or funding from your place of work................... Borrow from family/friends................................................. Pay cash........................................................................... Spend the equivalent of up to the total of your annual salary on purchasing the car...................
Spend between one and twice your annual salary on purchasing the car............................................ Spend in excess of twice your salary on purchasing your car..........................................................
11. Transport solutions. Please circle on the scale below the extent to which you agree to the following statements. Circle only one choice for each statement.
It’s important to build more roads to reduce congestion.
Strongly agree Agree Neither agree Disagree Strongly disagree nor disagree
I would like to reduce usage of my car but there are no
practical alternatives.
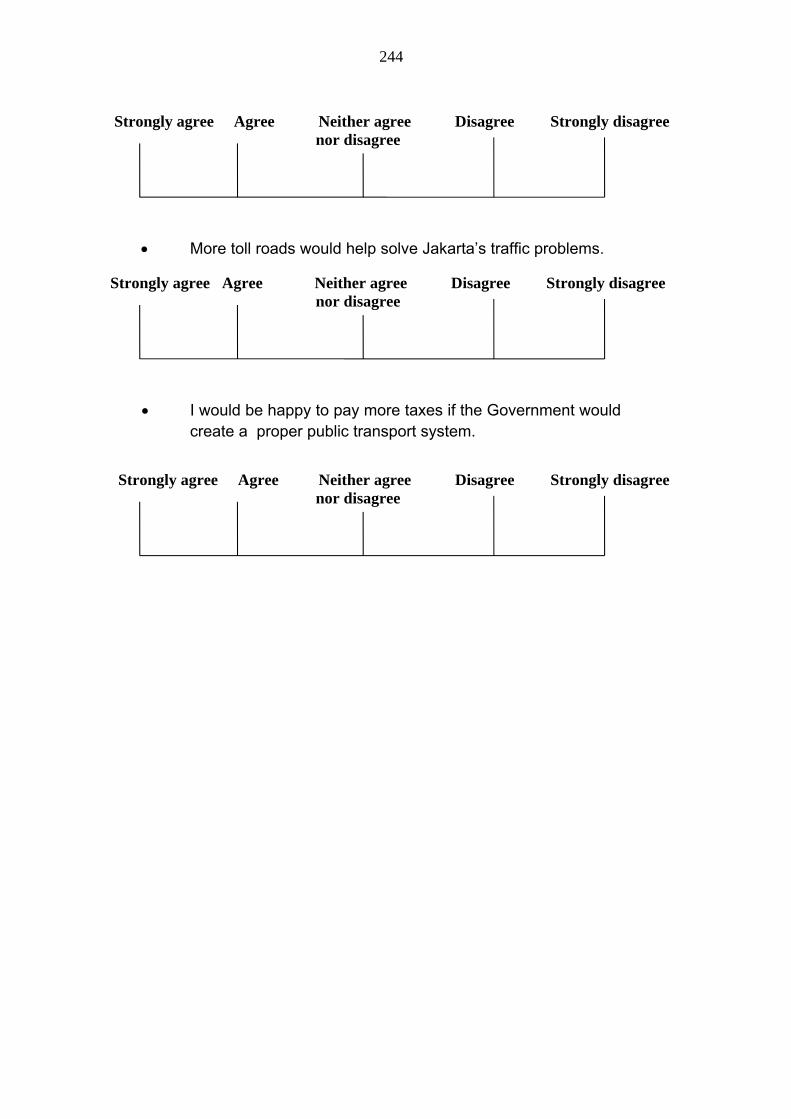
244
Strongly agree Agree Neither agree Disagree Strongly disagree
nor disagree
More toll roads would help solve Jakarta’s traffic problems.
Strongly agree Agree Neither agree Disagree Strongly disagree nor disagree
I would be happy to pay more taxes if the Government would
create a proper public transport system.
Strongly agree Agree Neither agree Disagree Strongly disagree nor disagree
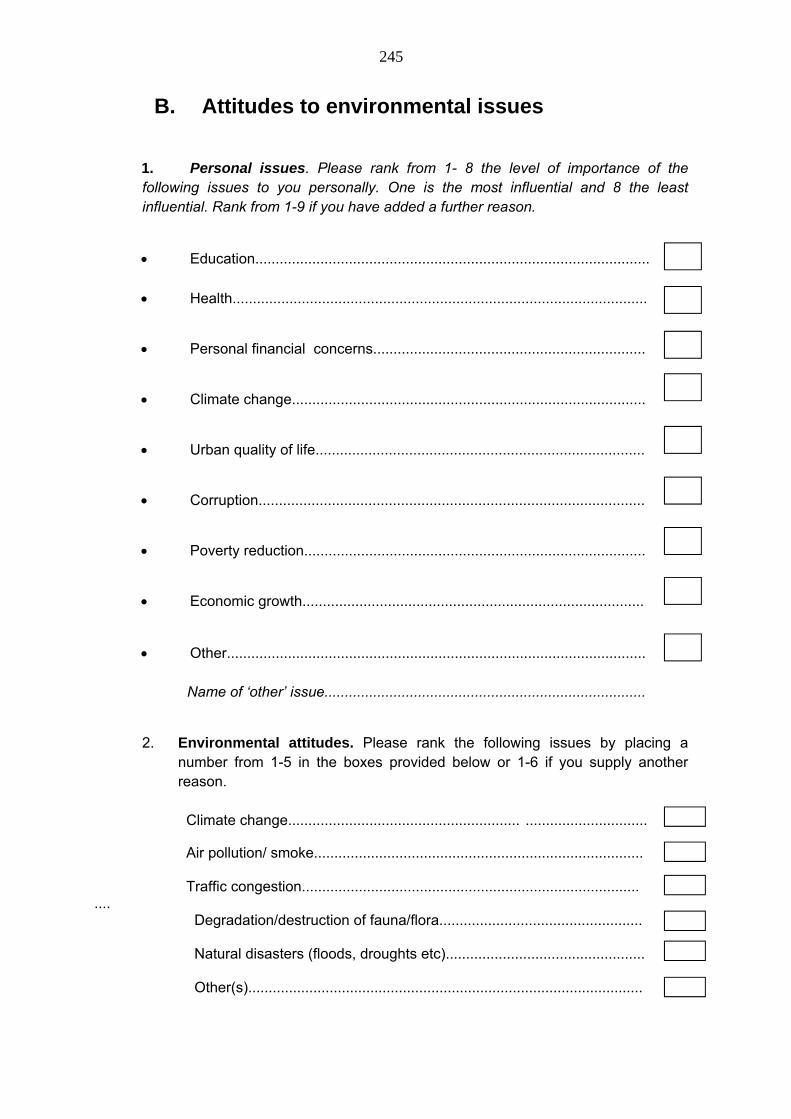
245
B. Attitudes to environmental issues
1. Personal issues. Please rank from 1- 8 the level of importance of the following issues to you personally. One is the most influential and 8 the least influential. Rank from 1-9 if you have added a further reason.
Education................................................................................................. Health......................................................................................................
Personal financial concerns...................................................................
Climate change.......................................................................................
Urban quality of life.................................................................................
Corruption...............................................................................................
Poverty reduction....................................................................................
Economic growth....................................................................................
Other....................................................................................................... Name of ‘other’ issue...............................................................................
2. Environmental attitudes. Please rank the following issues by placing a
number from 1-5 in the boxes provided below or 1-6 if you supply another reason.
Climate change......................................................... ..............................
Air pollution/ smoke................................................................................. Traffic congestion...................................................................................
.... Degradation/destruction of fauna/flora.................................................. Natural disasters (floods, droughts etc).................................................
Other(s).................................................................................................

246
Please name other issue................................................................
3. Environmental attitudes. In relation climate change’s effect on the environment,
Please rank the following statements in the order of their importance for not owning a car by placing a number from 1-4 in the boxes provided below or 1-5 if you supply another reason.
Rising temperatures................................................................................. Sea level rises.......................................................................................... Natural climatic disasters/severe weather events....................................
The spread of disease............................................................................. Other........................................................................................................ Name of ‘other’ issue .............................................................................
4. Environmental attitudes. Do you consider that environmental pollution caused by transport is a major cause of the following? Please place a tick in the box next to those you agree with. You may tick more than one box.
Respiratory disease (e.g. asthma, allergies, etc)………………….. Greenhouse gas emissions (carbon dioxide)................................. Loss of productivity through congestion........................................ Yes No Has your health been affected by pollution?................. How many days work a year have you lost by illness caused by pollution? (please insert number of days) ...............................................................
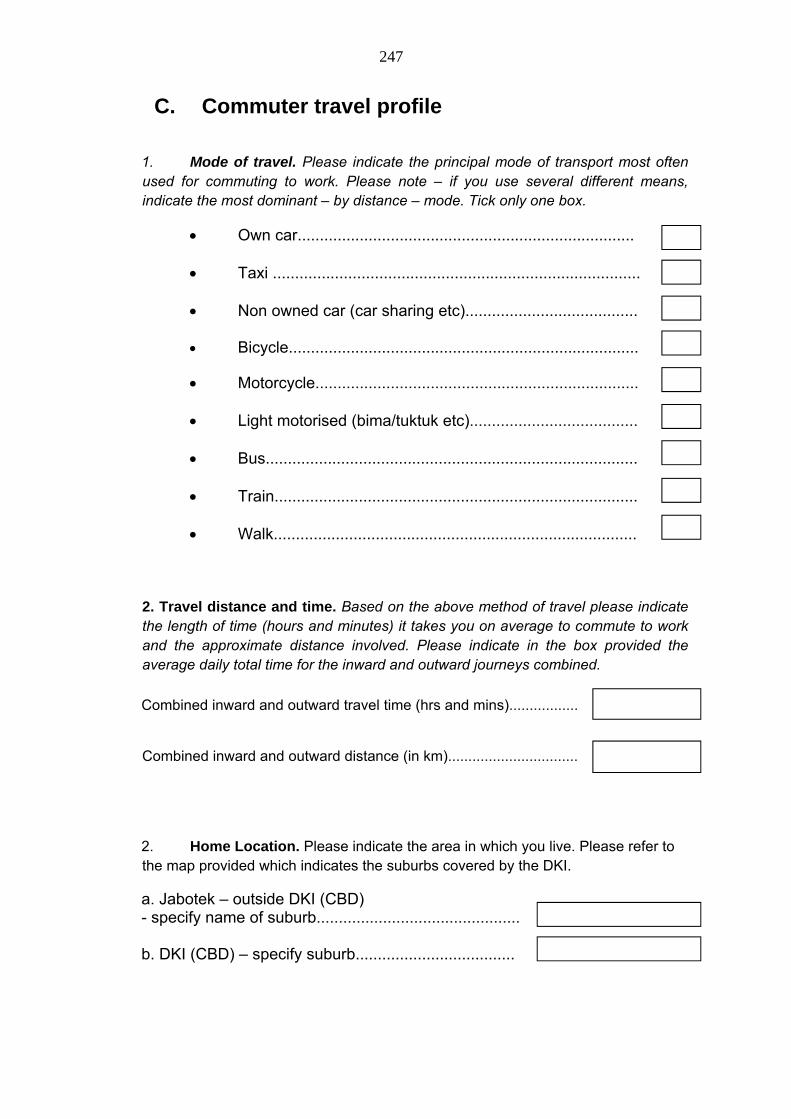
247
C. Commuter travel profile
1. Mode of travel. Please indicate the principal mode of transport most often used for commuting to work. Please note – if you use several different means, indicate the most dominant – by distance – mode. Tick only one box.
Own car............................................................................ Taxi ................................................................................... Non owned car (car sharing etc)....................................... Bicycle...............................................................................
Motorcycle......................................................................... Light motorised (bima/tuktuk etc)...................................... Bus.................................................................................... Train.................................................................................. Walk..................................................................................
2. Travel distance and time. Based on the above method of travel please indicate the length of time (hours and minutes) it takes you on average to commute to work and the approximate distance involved. Please indicate in the box provided the average daily total time for the inward and outward journeys combined.
Combined inward and outward travel time (hrs and mins).................
Combined inward and outward distance (in km)................................ 2. Home Location. Please indicate the area in which you live. Please refer to the map provided which indicates the suburbs covered by the DKI.
a. Jabotek – outside DKI (CBD) - specify name of suburb.............................................. b. DKI (CBD) – specify suburb....................................
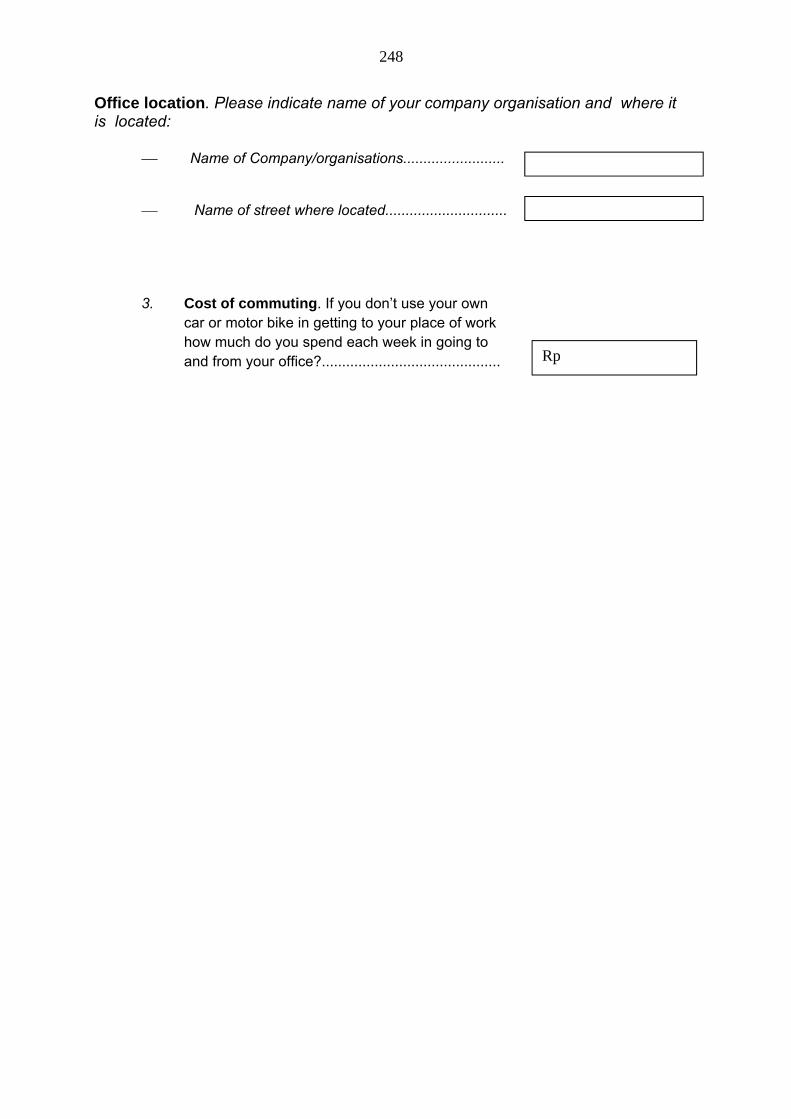
248
Office location. Please indicate name of your company organisation and where it is located:
Name of Company/organisations.........................
Name of street where located..............................
3. Cost of commuting. If you don’t use your own
car or motor bike in getting to your place of work how much do you spend each week in going to and from your office?............................................
Rp
249
D. Choice experiment questionnaire
Explanatory notes for choice questionnaire This following are a set of choices which you are being asked to select between. They do not represent any actual laws or taxes. The choices involve placing a limit on the increase in the number of cars allowed in Jakarta each year for a period of five years – through to 2015. The limits are 2.5% annual increase and 5% annual increase. It is assumed if you chose not to place a limit then the number of cars will continue to increase at the current rate of 12 per year over the next five years. The choices also involve the option to pay a congestion tax to enter the Jakarta CBD where you work. There are two levels of tax for both cars and motorcycles – Rp 16,000/Rp5,000; Rp32,600/Rp10,00 respectively. Each set of choices which you are given involve choosing between a combination of tax levels and allowable increases in car numbers. You can choose neither which is shown here as No cap on registrations and no entry tax. For each choice there are different consequences. These are the cumulative consequences over a five year period during which the taxes and restrictions on car numbers are applied. The choices therefore show the cumulative five year increase (or decrease) of: The cost of driving a car per kilometre The level of congestion The level of ill health due to transport pollution The level of GHG of transport vehicles
The proposed system to limit car numbers is similar to that currently in use in a number of cities in other countries such as Singapore, Shanghai and London. Under this system Jakarta residents would have to bid at auction each year for a predetermined number of car registration permits which are valid for 10 years. It is assumed for example that the cost of a compact car would rise in price by approximately 35% if registrations were limited to an annual increase of 2.5%. The increase in registration costs is included in the per kilometre cost of driving a car shown in the choice provided. It is assumed that revenues earned from the higher registration fees and CBD entry taxes are used to fund improved public transport.
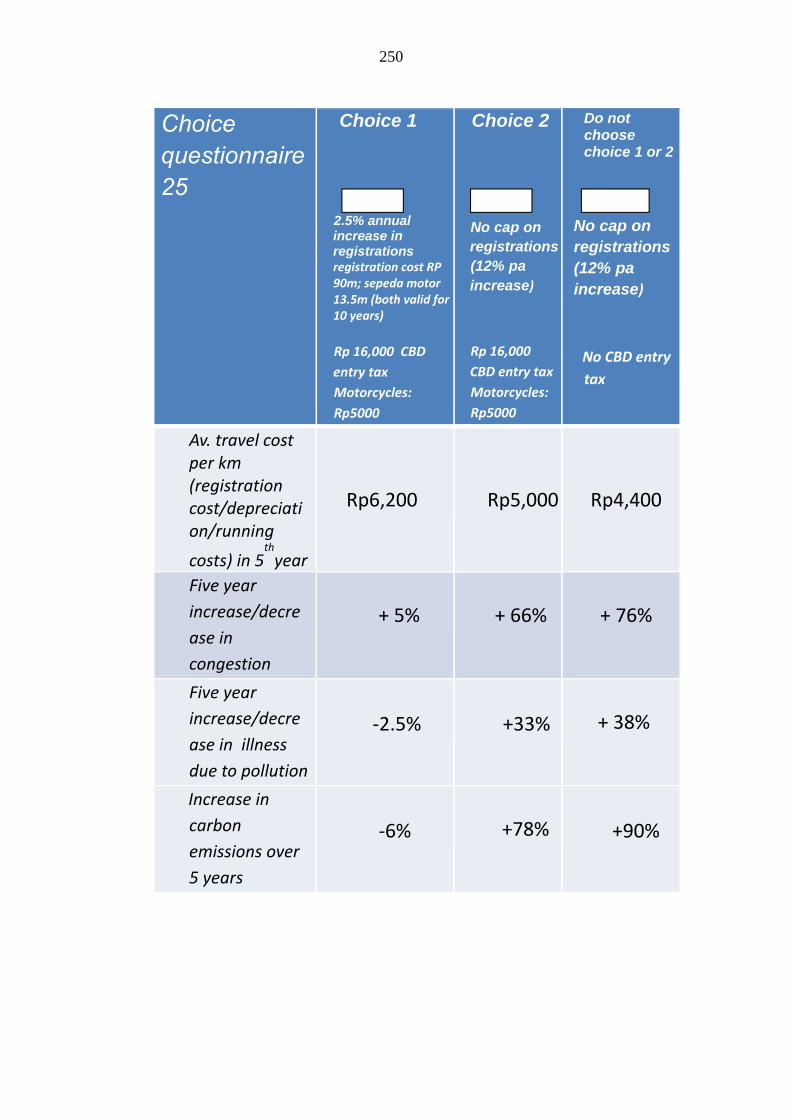
250
Choice questionnaire 25
Choice 1
2.5% annual increase in registrations registration cost RP 90m; sepeda motor 13.5m (both valid for 10 years)
Rp 16,000 CBD
entry tax
Motorcycles:
Rp5000
Choice 2
No cap on registrations(12% pa increase)
Rp 16,000
CBD entry tax
Motorcycles:
Rp5000
Do not choose choice 1 or 2
No cap on registrations (12% pa increase)
No CBD entry
tax
Av. travel cost per km (registration cost/depreciation/running
costs) in 5th
year
Rp6,200
Rp5,000
Rp4,400
Five year
increase/decre
ase in
congestion
+ 5%
+ 66%
+ 76%
Five year
increase/decre
ase in illness
due to pollution
‐2.5%
+33%
+ 38%
Increase in
carbon
emissions over
5 years
‐6%
+78%
+90%
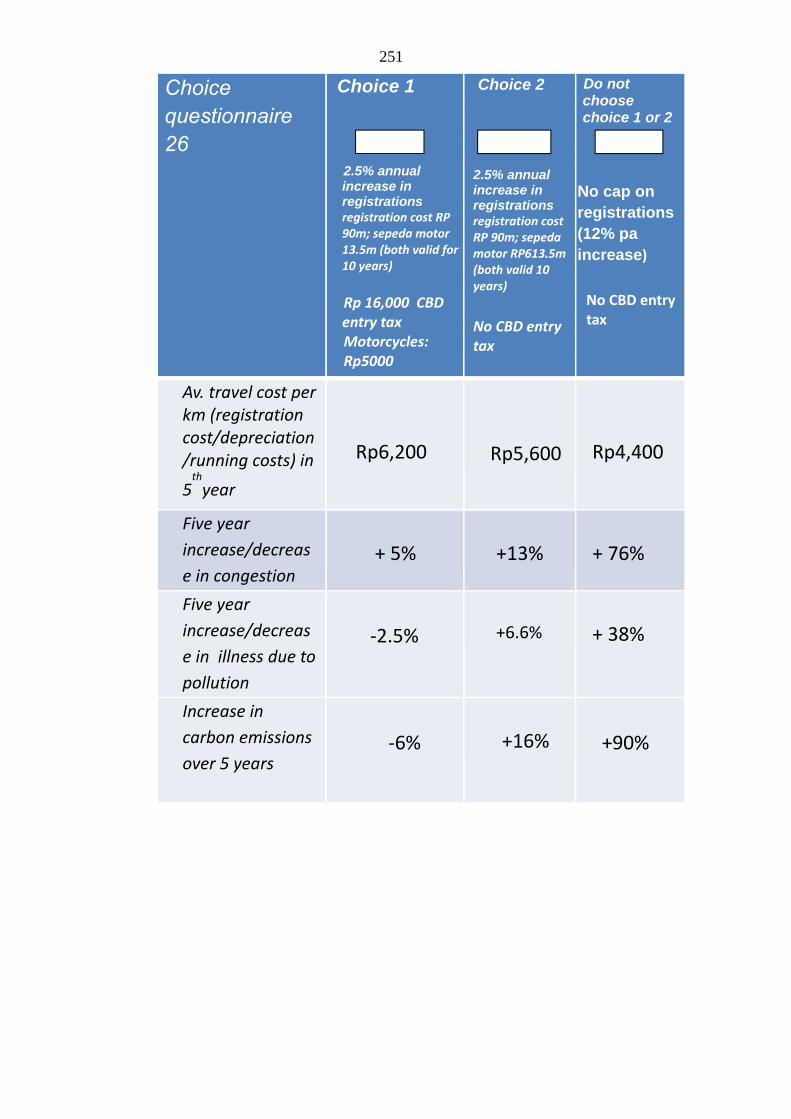
251
Choice questionnaire 26
Choice 1
2.5% annual increase in registrations registration cost RP 90m; sepeda motor 13.5m (both valid for 10 years)
Rp 16,000 CBD entry tax Motorcycles: Rp5000
Choice 2
2.5% annual increase in registrations registration cost RP 90m; sepeda motor RP613.5m (both valid 10 years)
No CBD entry tax
Do not choose choice 1 or 2
No cap on registrations (12% pa increase)
No CBD entry tax
Av. travel cost per km (registration cost/depreciation /running costs) in
5th
year
Rp6,200
Rp5,600
Rp4,400
Five year
increase/decreas
e in congestion
+ 5%
+13%
+ 76%
Five year
increase/decreas
e in illness due to
pollution
‐2.5%
+6.6%
+ 38%
Increase in
carbon emissions
over 5 years
‐6%
+16%
+90%
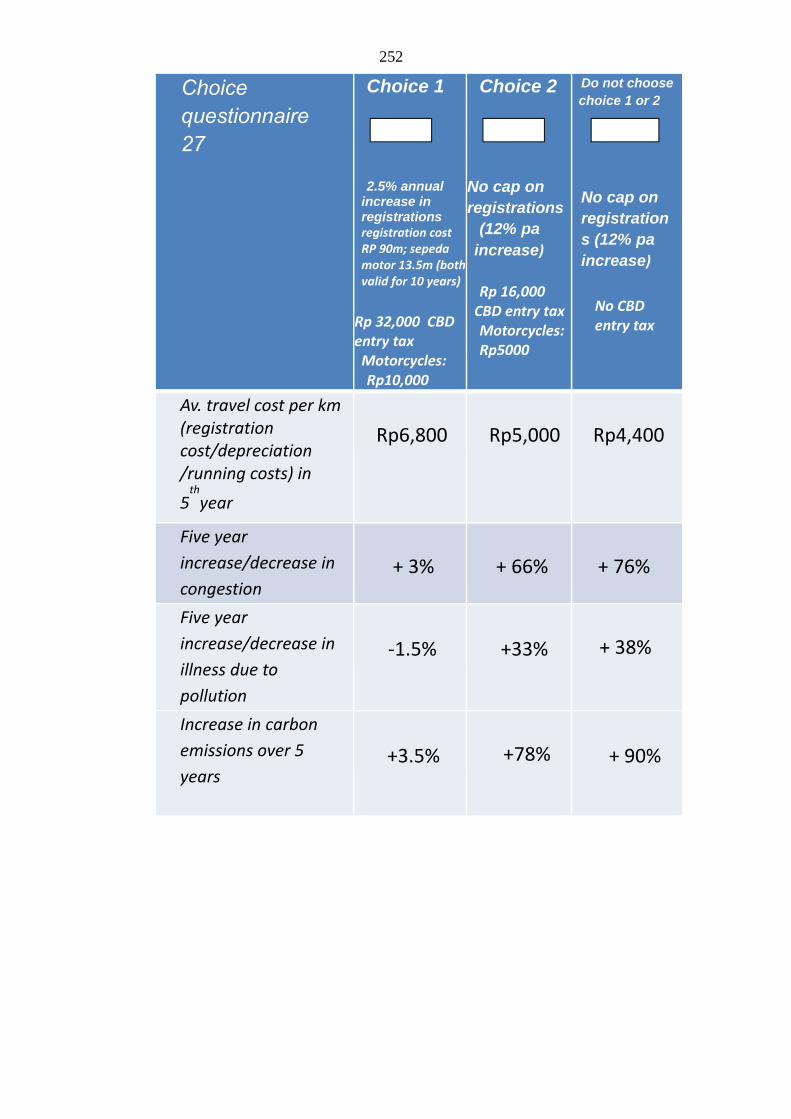
252
Choice questionnaire 27
Choice 1 2.5% annual
increase in registrations registration cost RP 90m; sepeda motor 13.5m (both valid for 10 years)
Rp 32,000 CBD entry tax Motorcycles: Rp10,000
Choice 2
No cap on registrations
(12% pa increase)
Rp 16,000 CBD entry tax Motorcycles: Rp5000
Do not choose choice 1 or 2
No cap on registrations (12% pa increase)
No CBD entry tax
Av. travel cost per km (registration cost/depreciation /running costs) in
5th
year
Rp6,800
Rp5,000
Rp4,400
Five year
increase/decrease in
congestion
+ 3%
+ 66%
+ 76%
Five year
increase/decrease in
illness due to
pollution
‐1.5%
+33%
+ 38%
Increase in carbon
emissions over 5
years
+3.5%
+78%
+ 90%
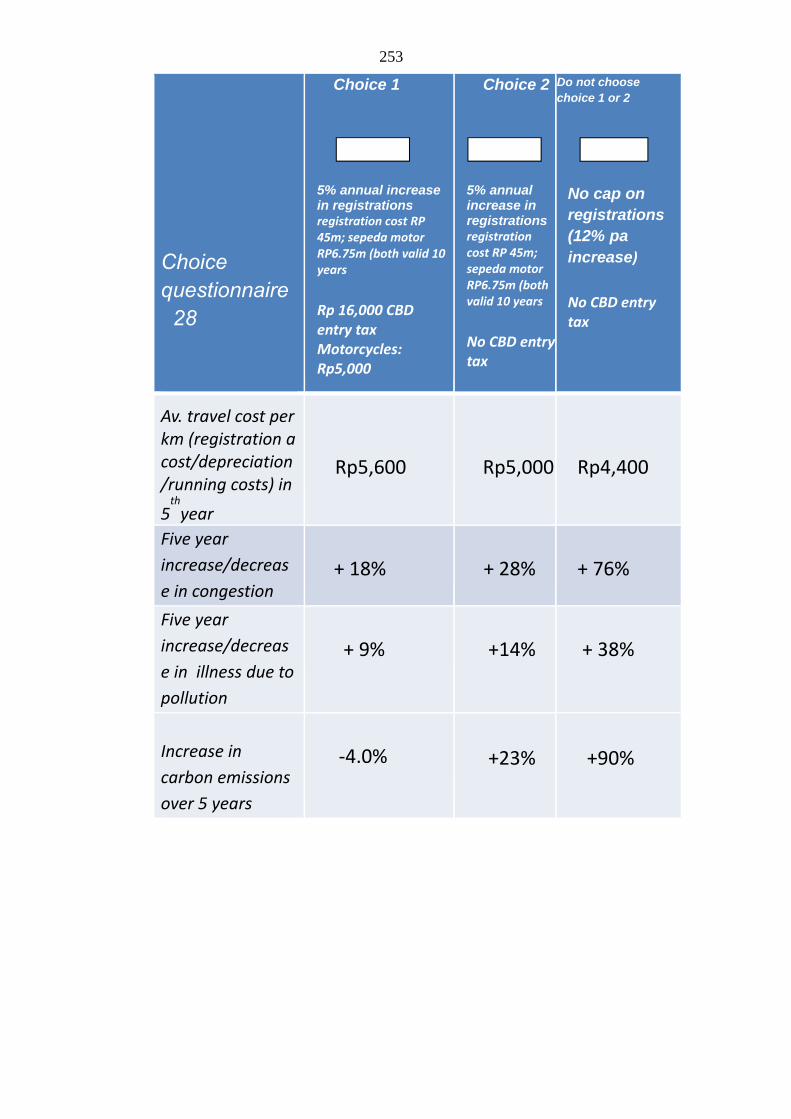
253
Choice questionnaire
28
Choice 1
5% annual increase in registrations registration cost RP 45m; sepeda motor RP6.75m (both valid 10 years
Rp 16,000 CBD entry tax Motorcycles: Rp5,000
Choice 2
5% annual increase in registrations registration cost RP 45m; sepeda motor RP6.75m (both valid 10 years
No CBD entry tax
Do not choose choice 1 or 2
No cap on registrations (12% pa increase)
No CBD entry tax
Av. travel cost per km (registration a cost/depreciation /running costs) in
5th
year
Rp5,600
Rp5,000
Rp4,400
Five year
increase/decreas
e in congestion
+ 18%
+ 28%
+ 76%
Five year
increase/decreas
e in illness due to
pollution
+ 9%
+14%
+ 38%
Increase in
carbon emissions
over 5 years
‐4.0%
+23%
+90%
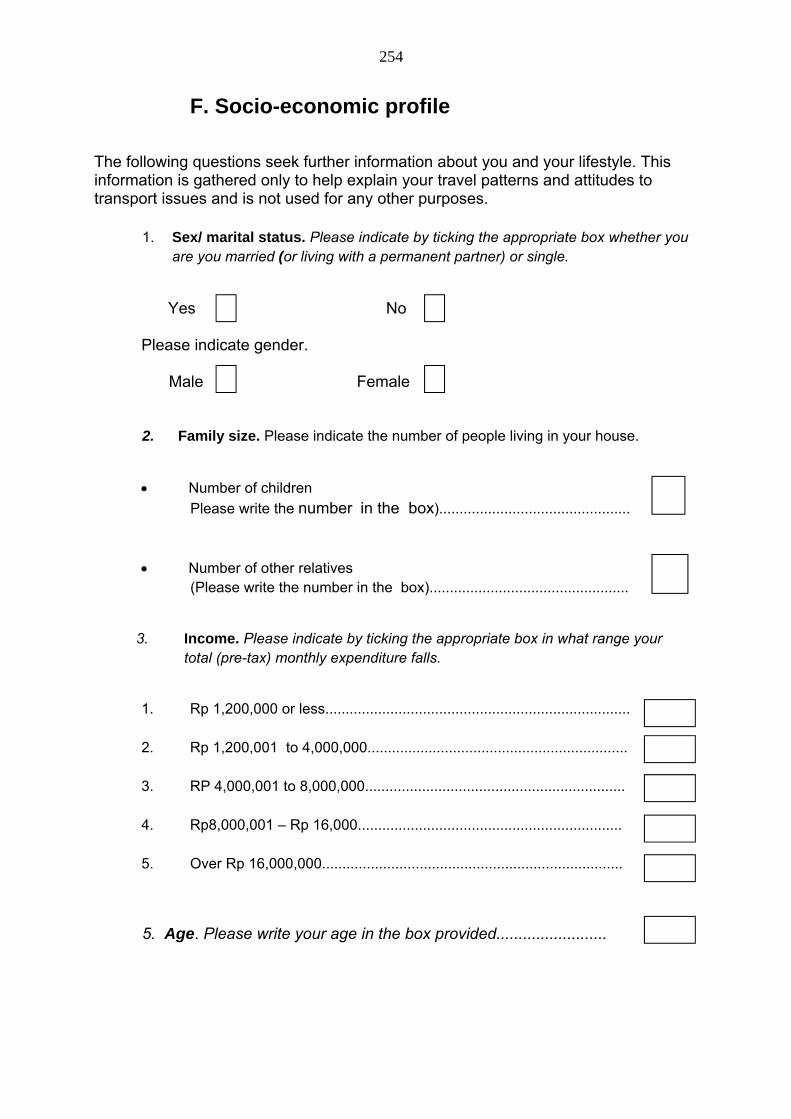
254
F. Socio-economic profile
The following questions seek further information about you and your lifestyle. This information is gathered only to help explain your travel patterns and attitudes to transport issues and is not used for any other purposes.
1. Sex/ marital status. Please indicate by ticking the appropriate box whether you
are you married (or living with a permanent partner) or single.
Yes No Please indicate gender. Male Female 2. Family size. Please indicate the number of people living in your house.
Number of children
Please write the number in the box)............................................... Number of other relatives (Please write the number in the box).................................................
3. Income. Please indicate by ticking the appropriate box in what range your
total (pre-tax) monthly expenditure falls.
1. Rp 1,200,000 or less........................................................................... 2. Rp 1,200,001 to 4,000,000................................................................ 3. RP 4,000,001 to 8,000,000................................................................ 4. Rp8,000,001 – Rp 16,000................................................................. 5. Over Rp 16,000,000..........................................................................
5. Age. Please write your age in the box provided.........................
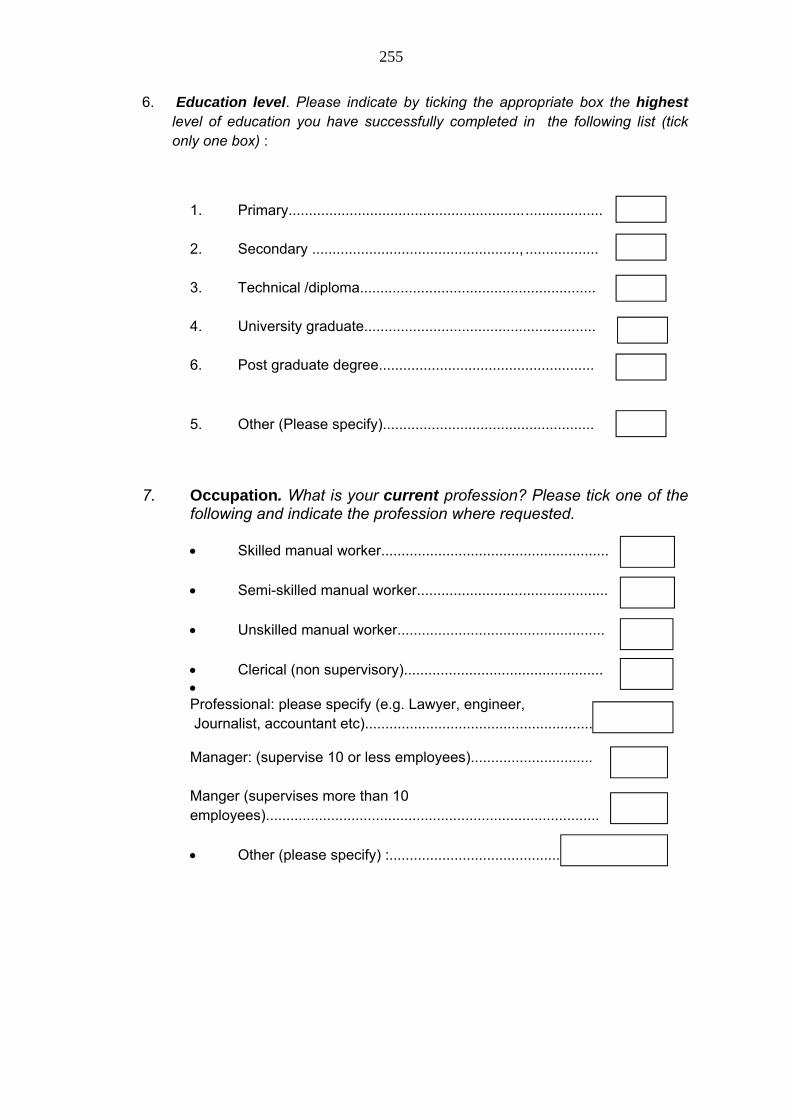
255
6. Education level. Please indicate by ticking the appropriate box the highest level of education you have successfully completed in the following list (tick only one box) :
1. Primary.......................................................... ...................
2. Secondary ..................................................., .................. 3. Technical /diploma.......................................................... 4. University graduate......................................................... 6. Post graduate degree.....................................................
5. Other (Please specify)....................................................
7. Occupation. What is your current profession? Please tick one of the
following and indicate the profession where requested.
Skilled manual worker........................................................ Semi-skilled manual worker............................................... Unskilled manual worker...................................................
Clerical (non supervisory)................................................. Professional: please specify (e.g. Lawyer, engineer, Journalist, accountant etc)........................................................ Manager: (supervise 10 or less employees).............................. Manger (supervises more than 10 employees).................................................................................. Other (please specify) :.....................................................
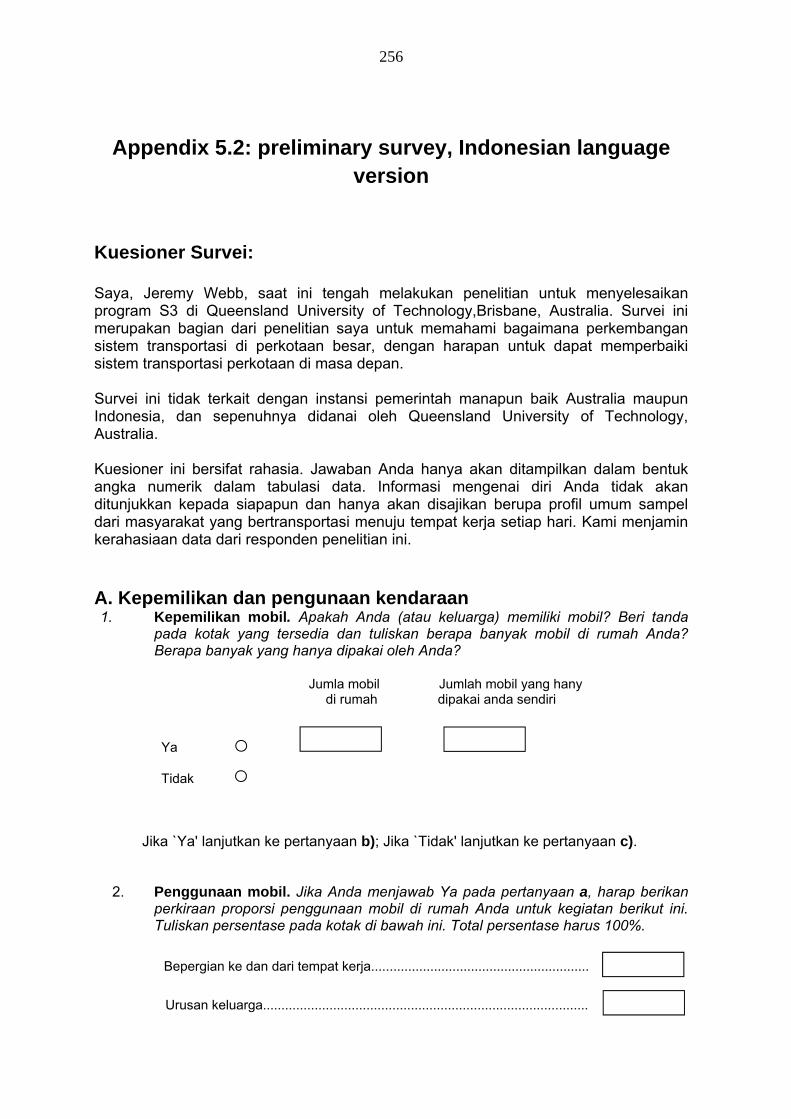
256
Appendix 5.2: preliminary survey, Indonesian language version
Kuesioner Survei: Saya, Jeremy Webb, saat ini tengah melakukan penelitian untuk menyelesaikan program S3 di Queensland University of Technology,Brisbane, Australia. Survei ini merupakan bagian dari penelitian saya untuk memahami bagaimana perkembangan sistem transportasi di perkotaan besar, dengan harapan untuk dapat memperbaiki sistem transportasi perkotaan di masa depan. Survei ini tidak terkait dengan instansi pemerintah manapun baik Australia maupun Indonesia, dan sepenuhnya didanai oleh Queensland University of Technology, Australia. Kuesioner ini bersifat rahasia. Jawaban Anda hanya akan ditampilkan dalam bentuk angka numerik dalam tabulasi data. Informasi mengenai diri Anda tidak akan ditunjukkan kepada siapapun dan hanya akan disajikan berupa profil umum sampel dari masyarakat yang bertransportasi menuju tempat kerja setiap hari. Kami menjamin kerahasiaan data dari responden penelitian ini. A. Kepemilikan dan pengunaan kendaraan 1. Kepemilikan mobil. Apakah Anda (atau keluarga) memiliki mobil? Beri tanda
pada kotak yang tersedia dan tuliskan berapa banyak mobil di rumah Anda? Berapa banyak yang hanya dipakai oleh Anda?
Jumla mobil
di rumah
Jumlah mobil yang hany dipakai anda sendiri
Ya
Tidak
Jika `Ya' lanjutkan ke pertanyaan b); Jika `Tidak' lanjutkan ke pertanyaan c).
2. Penggunaan mobil. Jika Anda menjawab Ya pada pertanyaan a, harap berikan perkiraan proporsi penggunaan mobil di rumah Anda untuk kegiatan berikut ini. Tuliskan persentase pada kotak di bawah ini. Total persentase harus 100%.
Bepergian ke dan dari tempat kerja...........................................................
Urusan keluarga........................................................................................
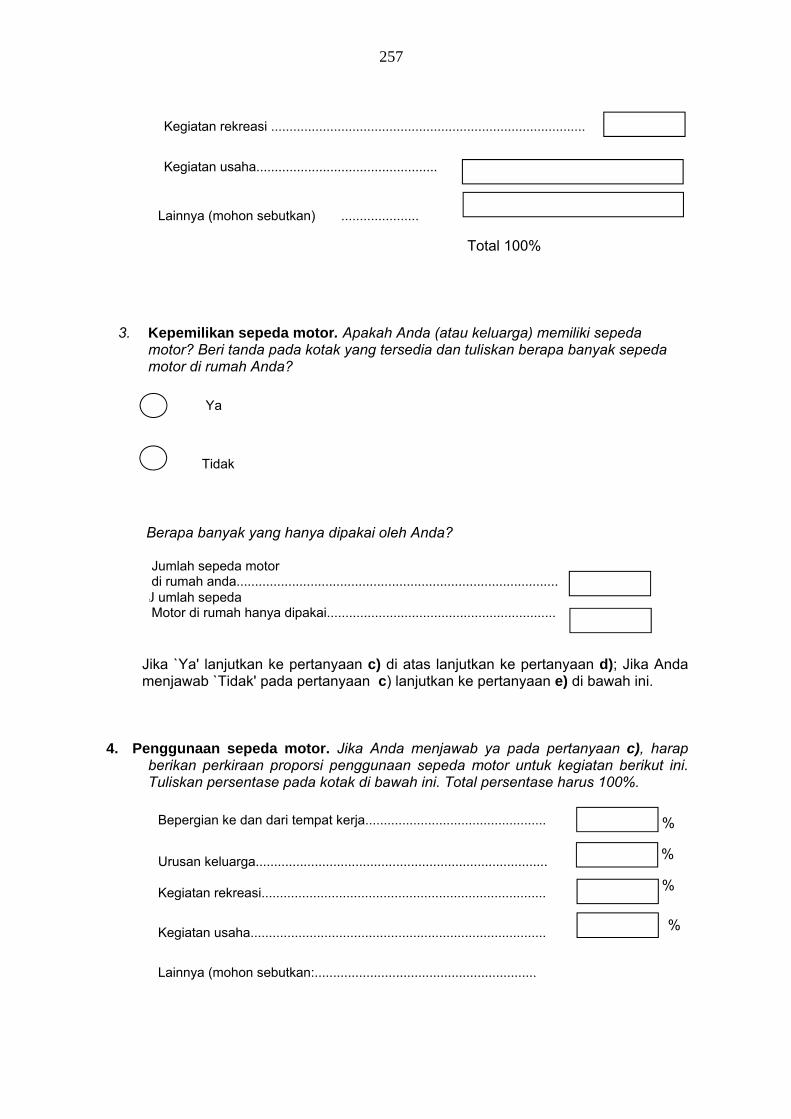
257
Kegiatan rekreasi .....................................................................................
Kegiatan usaha.................................................
Lainnya (mohon sebutkan) .....................
Total 100%
3. Kepemilikan sepeda motor. Apakah Anda (atau keluarga) memiliki sepeda motor? Beri tanda pada kotak yang tersedia dan tuliskan berapa banyak sepeda motor di rumah Anda?
Ya
Tidak
Berapa banyak yang hanya dipakai oleh Anda?
Jumlah sepeda motor
di rumah anda.......................................................................................
J umlah sepeda Motor di rumah hanya dipakai..............................................................
Jika `Ya' lanjutkan ke pertanyaan c) di atas lanjutkan ke pertanyaan d); Jika Anda menjawab `Tidak' pada pertanyaan c) lanjutkan ke pertanyaan e) di bawah ini.
4. Penggunaan sepeda motor. Jika Anda menjawab ya pada pertanyaan c), harap berikan perkiraan proporsi penggunaan sepeda motor untuk kegiatan berikut ini. Tuliskan persentase pada kotak di bawah ini. Total persentase harus 100%.
Bepergian ke dan dari tempat kerja................................................. %
Urusan keluarga............................................................................... %
Kegiatan rekreasi............................................................................. %
Kegiatan usaha................................................................................ %
Lainnya (mohon sebutkan:............................................................
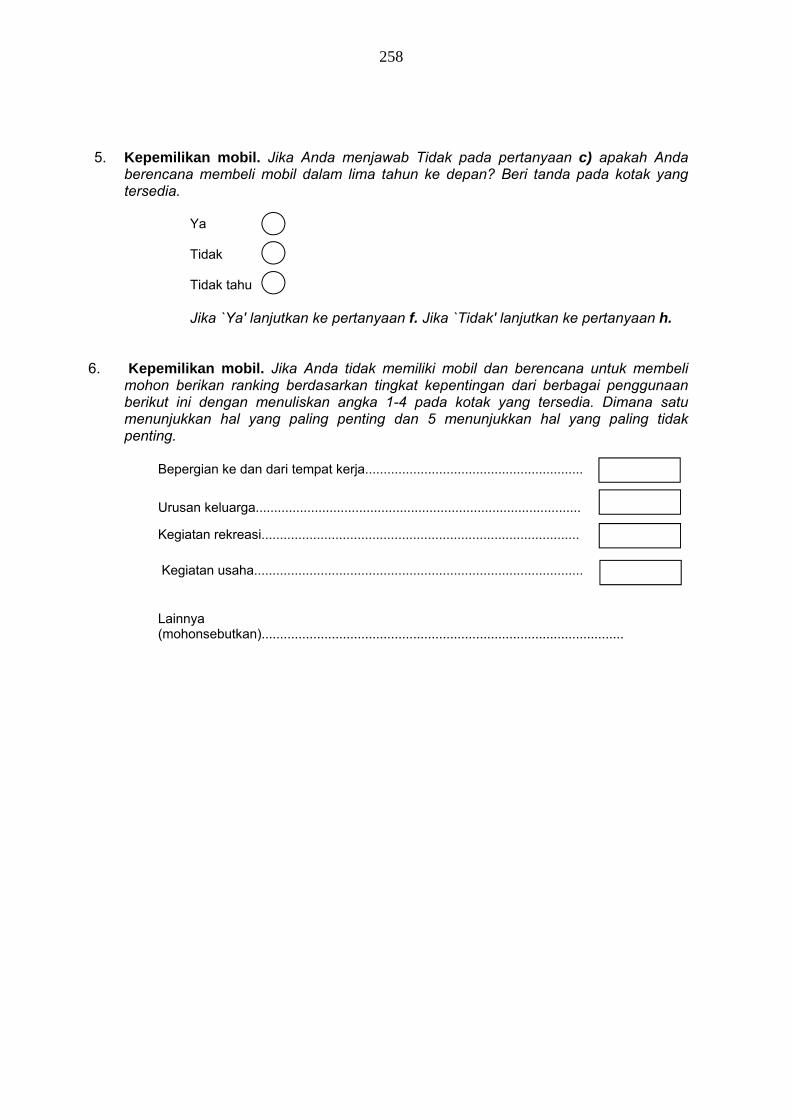
258
5. Kepemilikan mobil. Jika Anda menjawab Tidak pada pertanyaan c) apakah Anda berencana membeli mobil dalam lima tahun ke depan? Beri tanda pada kotak yang tersedia.
Ya Tidak Tidak tahu
Jika `Ya' lanjutkan ke pertanyaan f. Jika `Tidak' lanjutkan ke pertanyaan h.
6. Kepemilikan mobil. Jika Anda tidak memiliki mobil dan berencana untuk membeli
mohon berikan ranking berdasarkan tingkat kepentingan dari berbagai penggunaan berikut ini dengan menuliskan angka 1-4 pada kotak yang tersedia. Dimana satu menunjukkan hal yang paling penting dan 5 menunjukkan hal yang paling tidak penting.
Bepergian ke dan dari tempat kerja...........................................................
Urusan keluarga........................................................................................
Kegiatan rekreasi......................................................................................
Kegiatan usaha.........................................................................................
Lainnya (mohonsebutkan)..................................................................................................
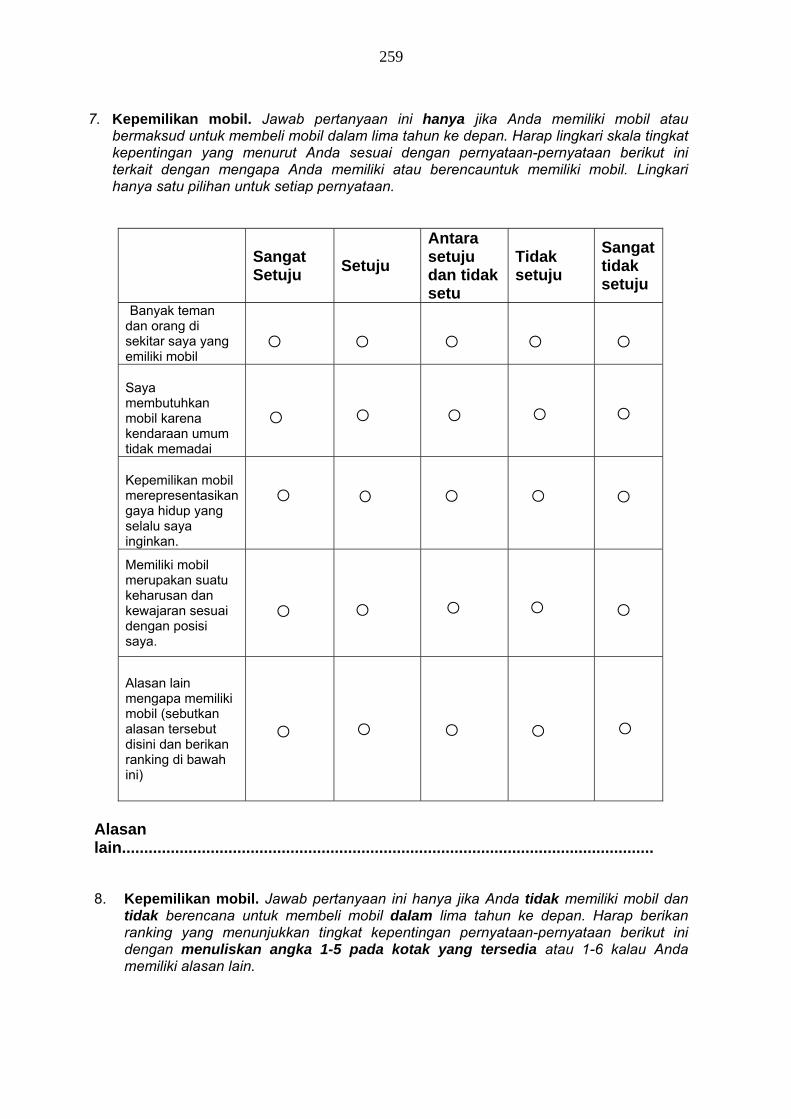
259
7. Kepemilikan mobil. Jawab pertanyaan ini hanya jika Anda memiliki mobil atau
bermaksud untuk membeli mobil dalam lima tahun ke depan. Harap lingkari skala tingkat kepentingan yang menurut Anda sesuai dengan pernyataan-pernyataan berikut ini terkait dengan mengapa Anda memiliki atau berencauntuk memiliki mobil. Lingkari hanya satu pilihan untuk setiap pernyataan.
Sangat Setuju
Setuju
Antara setuju dan tidak setu
Tidak setuju
Sangat tidak setuju
Banyak teman dan orang di sekitar saya yang emiliki mobil
Saya membutuhkan mobil karena kendaraan umum tidak memadai
Kepemilikan mobil merepresentasikan gaya hidup yang selalu saya inginkan.
Memiliki mobil merupakan suatu keharusan dan kewajaran sesuai dengan posisi saya.
Alasan lain mengapa memiliki mobil (sebutkan alasan tersebut disini dan berikan ranking di bawah ini)
Alasan lain........................................................................................................................ 8. Kepemilikan mobil. Jawab pertanyaan ini hanya jika Anda tidak memiliki mobil dan
tidak berencana untuk membeli mobil dalam lima tahun ke depan. Harap berikan ranking yang menunjukkan tingkat kepentingan pernyataan-pernyataan berikut ini dengan menuliskan angka 1-5 pada kotak yang tersedia atau 1-6 kalau Anda memiliki alasan lain.
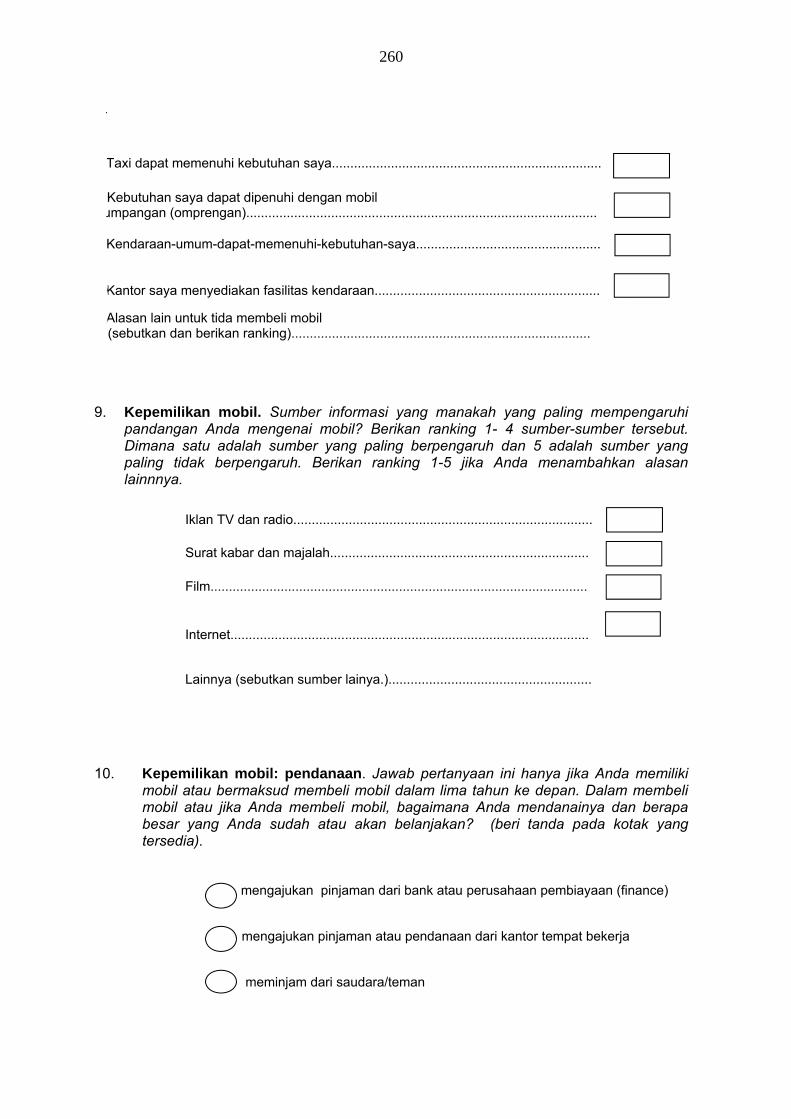
260
T
Taxi dapat memenuhi kebutuhan saya.........................................................................
Kebutuhan saya dapat dipenuhi dengan mobil umpangan (omprengan)...............................................................................................
Kendaraan-umum-dapat-memenuhi-kebutuhan-saya..................................................
Kantor saya menyediakan fasilitas kendaraan.............................................................
Alasan lain untuk tida membeli mobil (sebutkan dan berikan ranking).................................................................................
9. Kepemilikan mobil. Sumber informasi yang manakah yang paling mempengaruhi
pandangan Anda mengenai mobil? Berikan ranking 1- 4 sumber-sumber tersebut. Dimana satu adalah sumber yang paling berpengaruh dan 5 adalah sumber yang paling tidak berpengaruh. Berikan ranking 1-5 jika Anda menambahkan alasan lainnnya.
Iklan TV dan radio.................................................................................
Surat kabar dan majalah......................................................................
Film......................................................................................................
Internet.................................................................................................
Lainnya (sebutkan sumber lainya.).......................................................
10. Kepemilikan mobil: pendanaan. Jawab pertanyaan ini hanya jika Anda memiliki
mobil atau bermaksud membeli mobil dalam lima tahun ke depan. Dalam membeli mobil atau jika Anda membeli mobil, bagaimana Anda mendanainya dan berapa besar yang Anda sudah atau akan belanjakan? (beri tanda pada kotak yang tersedia).
mengajukan pinjaman dari bank atau perusahaan pembiayaan (finance) mengajukan pinjaman atau pendanaan dari kantor tempat bekerja meminjam dari saudara/teman

261
beli mobil dengan harga tidak lebih dari total gaji Anda dalamsetahun
beli mobil dalam rentang harga antara satu sampai dua kali gaji Anda dalam setahun
beli mobil dengan harga lebih dari dua kali gaji Anda dalam setahun
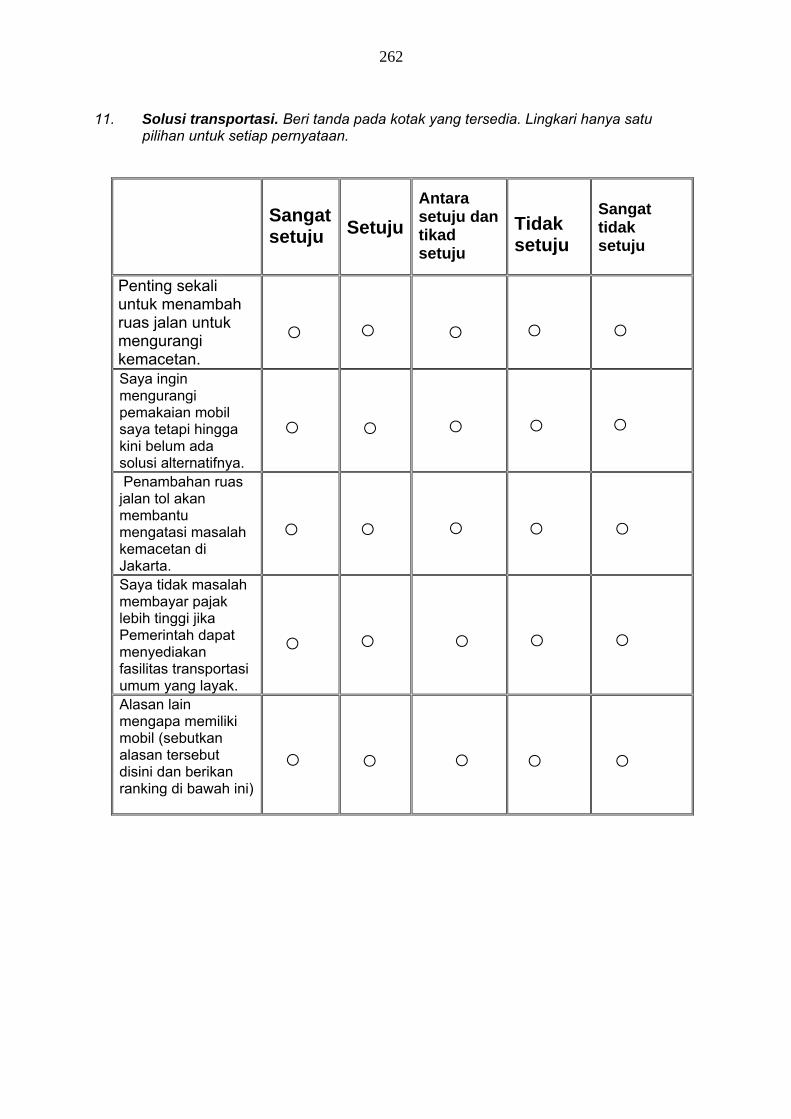
262
11. Solusi transportasi. Beri tanda pada kotak yang tersedia. Lingkari hanya satu
pilihan untuk setiap pernyataan.
Sangat setuju
Setuju
Antara setuju dan tikad setuju
Tidak setuju
Sangat tidak setuju
Penting sekali untuk menambah ruas jalan untuk mengurangi kemacetan.
Saya ingin mengurangi pemakaian mobil saya tetapi hingga kini belum ada solusi alternatifnya.
Penambahan ruas jalan tol akan membantu mengatasi masalah kemacetan di Jakarta.
Saya tidak masalah membayar pajak lebih tinggi jika Pemerintah dapat menyediakan fasilitas transportasi umum yang layak.
Alasan lain mengapa memiliki mobil (sebutkan alasan tersebut disini dan berikan ranking di bawah ini)
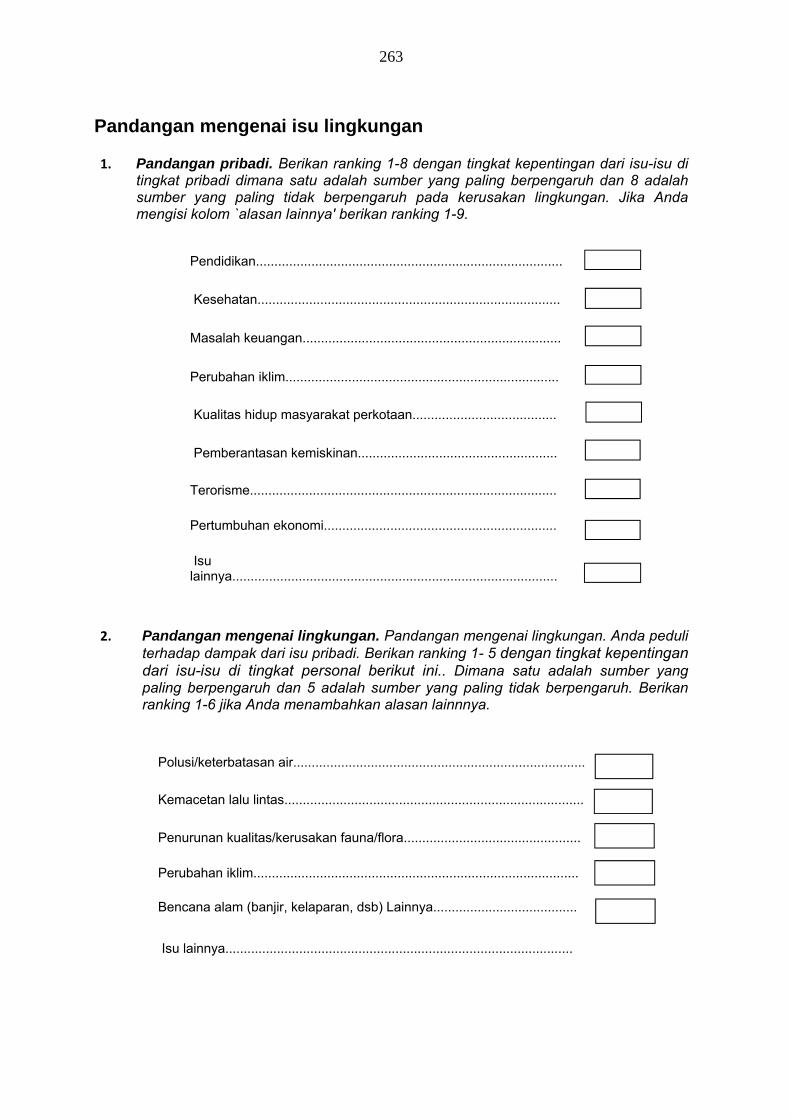
263
Pandangan mengenai isu lingkungan
1. Pandangan pribadi. Berikan ranking 1-8 dengan tingkat kepentingan dari isu-isu di
tingkat pribadi dimana satu adalah sumber yang paling berpengaruh dan 8 adalah sumber yang paling tidak berpengaruh pada kerusakan lingkungan. Jika Anda mengisi kolom `alasan lainnya' berikan ranking 1-9.
Pendidikan...................................................................................
Kesehatan..................................................................................
Masalah keuangan......................................................................
Perubahan iklim..........................................................................
Kualitas hidup masyarakat perkotaan.......................................
Pemberantasan kemiskinan......................................................
Terorisme...................................................................................
Pertumbuhan ekonomi...............................................................
Isu lainnya........................................................................................
2. Pandangan mengenai lingkungan. Pandangan mengenai lingkungan. Anda peduli
terhadap dampak dari isu pribadi. Berikan ranking 1- 5 dengan tingkat kepentingan dari isu-isu di tingkat personal berikut ini.. Dimana satu adalah sumber yang paling berpengaruh dan 5 adalah sumber yang paling tidak berpengaruh. Berikan ranking 1-6 jika Anda menambahkan alasan lainnnya.
Polusi/keterbatasan air...............................................................................
Kemacetan lalu lintas.................................................................................
Penurunan kualitas/kerusakan fauna/flora................................................
Perubahan iklim........................................................................................
Bencana alam (banjir, kelaparan, dsb) Lainnya.......................................
Isu lainnya..............................................................................................
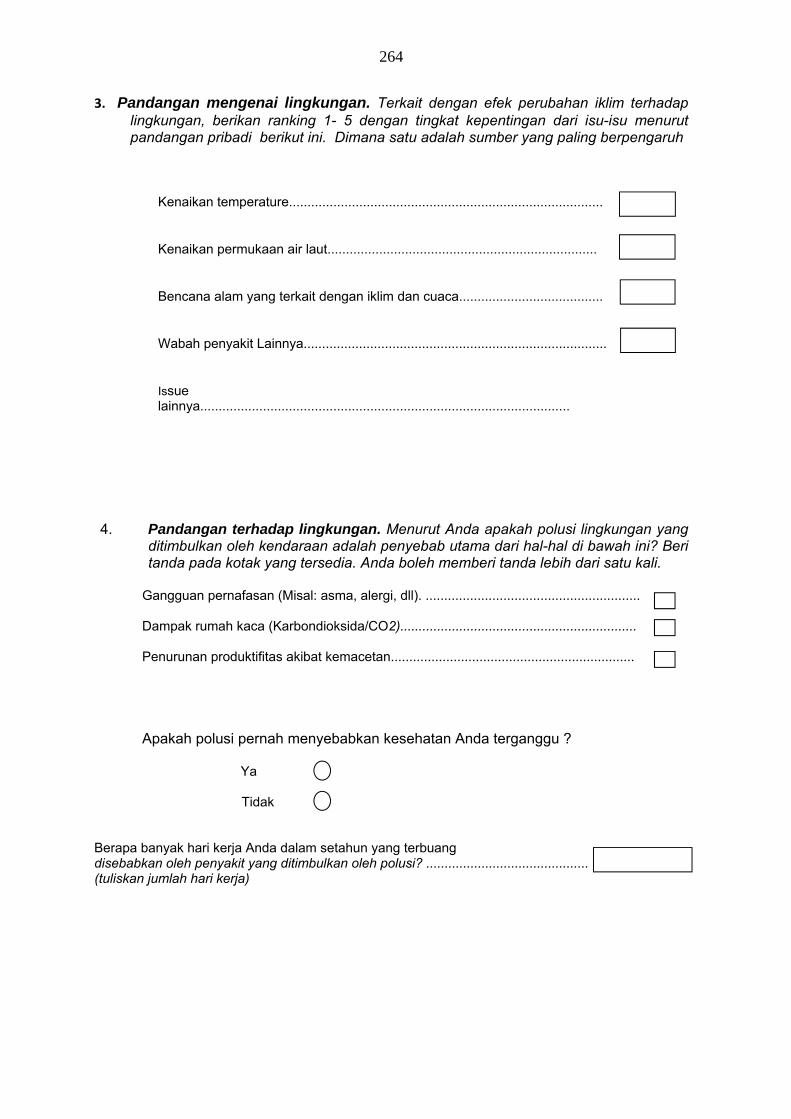
264
3. Pandangan mengenai lingkungan. Terkait dengan efek perubahan iklim terhadap lingkungan, berikan ranking 1- 5 dengan tingkat kepentingan dari isu-isu menurut pandangan pribadi berikut ini. Dimana satu adalah sumber yang paling berpengaruh
Kenaikan temperature.....................................................................................
Kenaikan permukaan air laut.........................................................................
Bencana alam yang terkait dengan iklim dan cuaca.......................................
Wabah penyakit Lainnya..................................................................................
Issue lainnya....................................................................................................
4. Pandangan terhadap lingkungan. Menurut Anda apakah polusi lingkungan yang
ditimbulkan oleh kendaraan adalah penyebab utama dari hal-hal di bawah ini? Beri tanda pada kotak yang tersedia. Anda boleh memberi tanda lebih dari satu kali.
Gangguan pernafasan (Misal: asma, alergi, dll). ..........................................................
Dampak rumah kaca (Karbondioksida/CO2)................................................................ Penurunan produktifitas akibat kemacetan..................................................................
Apakah polusi pernah menyebabkan kesehatan Anda terganggu ? Ya Tidak Berapa banyak hari kerja Anda dalam setahun yang terbuang disebabkan oleh penyakit yang ditimbulkan oleh polusi? ............................................ (tuliskan jumlah hari kerja)
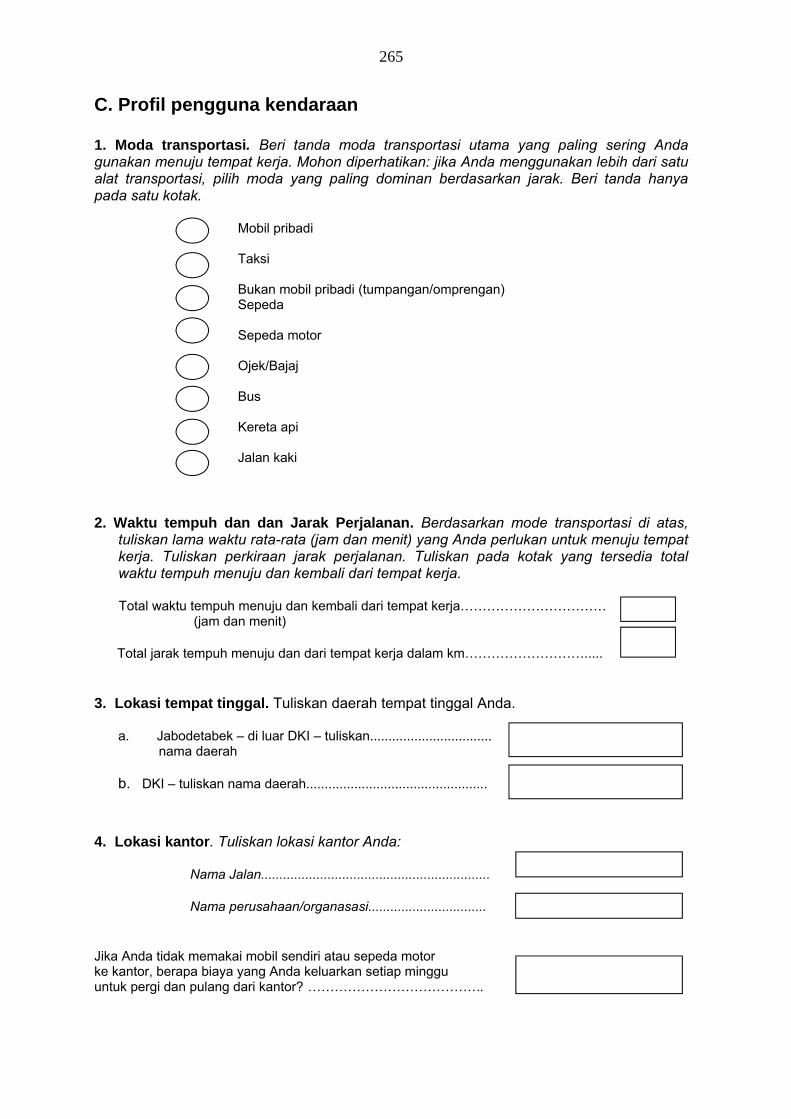
265
C. Profil pengguna kendaraan 1. Moda transportasi. Beri tanda moda transportasi utama yang paling sering Anda gunakan menuju tempat kerja. Mohon diperhatikan: jika Anda menggunakan lebih dari satu alat transportasi, pilih moda yang paling dominan berdasarkan jarak. Beri tanda hanya pada satu kotak. Mobil pribadi Taksi Bukan mobil pribadi (tumpangan/omprengan) Sepeda Sepeda motor Ojek/Bajaj Bus Kereta api Jalan kaki 2. Waktu tempuh dan dan Jarak Perjalanan. Berdasarkan mode transportasi di atas,
tuliskan lama waktu rata-rata (jam dan menit) yang Anda perlukan untuk menuju tempat kerja. Tuliskan perkiraan jarak perjalanan. Tuliskan pada kotak yang tersedia total waktu tempuh menuju dan kembali dari tempat kerja.
Total waktu tempuh menuju dan kembali dari tempat kerja……………………………
(jam dan menit)
Total jarak tempuh menuju dan dari tempat kerja dalam km………………………..... 3. Lokasi tempat tinggal. Tuliskan daerah tempat tinggal Anda.
a. Jabodetabek – di luar DKI – tuliskan................................. nama daerah
b. DKI – tuliskan nama daerah.................................................
4. Lokasi kantor. Tuliskan lokasi kantor Anda:
Nama Jalan..............................................................
Nama perusahaan/organasasi................................ Jika Anda tidak memakai mobil sendiri atau sepeda motor ke kantor, berapa biaya yang Anda keluarkan setiap minggu untuk pergi dan pulang dari kantor? ………………………………….
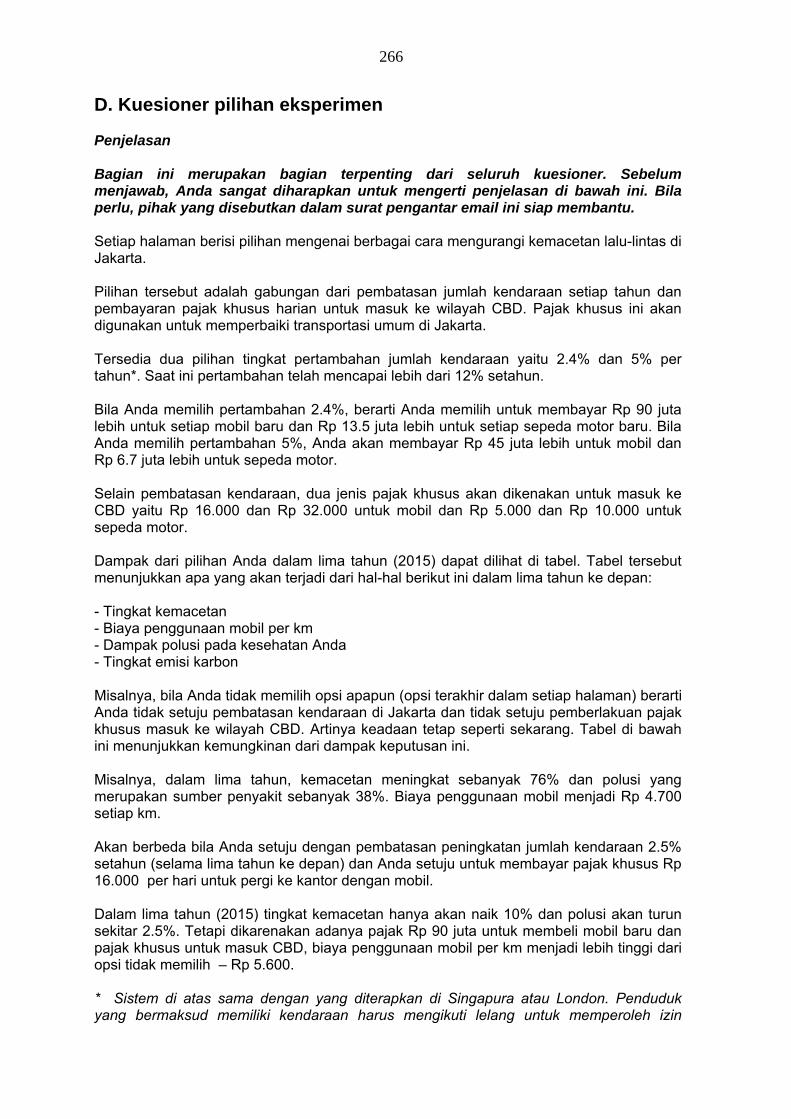
266
D. Kuesioner pilihan eksperimen Penjelasan Bagian ini merupakan bagian terpenting dari seluruh kuesioner. Sebelum menjawab, Anda sangat diharapkan untuk mengerti penjelasan di bawah ini. Bila perlu, pihak yang disebutkan dalam surat pengantar email ini siap membantu. Setiap halaman berisi pilihan mengenai berbagai cara mengurangi kemacetan lalu-lintas di Jakarta. Pilihan tersebut adalah gabungan dari pembatasan jumlah kendaraan setiap tahun dan pembayaran pajak khusus harian untuk masuk ke wilayah CBD. Pajak khusus ini akan digunakan untuk memperbaiki transportasi umum di Jakarta. Tersedia dua pilihan tingkat pertambahan jumlah kendaraan yaitu 2.4% dan 5% per tahun*. Saat ini pertambahan telah mencapai lebih dari 12% setahun. Bila Anda memilih pertambahan 2.4%, berarti Anda memilih untuk membayar Rp 90 juta lebih untuk setiap mobil baru dan Rp 13.5 juta lebih untuk setiap sepeda motor baru. Bila Anda memilih pertambahan 5%, Anda akan membayar Rp 45 juta lebih untuk mobil dan Rp 6.7 juta lebih untuk sepeda motor. Selain pembatasan kendaraan, dua jenis pajak khusus akan dikenakan untuk masuk ke CBD yaitu Rp 16.000 dan Rp 32.000 untuk mobil dan Rp 5.000 dan Rp 10.000 untuk sepeda motor. Dampak dari pilihan Anda dalam lima tahun (2015) dapat dilihat di tabel. Tabel tersebut menunjukkan apa yang akan terjadi dari hal-hal berikut ini dalam lima tahun ke depan: - Tingkat kemacetan - Biaya penggunaan mobil per km - Dampak polusi pada kesehatan Anda - Tingkat emisi karbon Misalnya, bila Anda tidak memilih opsi apapun (opsi terakhir dalam setiap halaman) berarti Anda tidak setuju pembatasan kendaraan di Jakarta dan tidak setuju pemberlakuan pajak khusus masuk ke wilayah CBD. Artinya keadaan tetap seperti sekarang. Tabel di bawah ini menunjukkan kemungkinan dari dampak keputusan ini. Misalnya, dalam lima tahun, kemacetan meningkat sebanyak 76% dan polusi yang merupakan sumber penyakit sebanyak 38%. Biaya penggunaan mobil menjadi Rp 4.700 setiap km. Akan berbeda bila Anda setuju dengan pembatasan peningkatan jumlah kendaraan 2.5% setahun (selama lima tahun ke depan) dan Anda setuju untuk membayar pajak khusus Rp 16.000 per hari untuk pergi ke kantor dengan mobil. Dalam lima tahun (2015) tingkat kemacetan hanya akan naik 10% dan polusi akan turun sekitar 2.5%. Tetapi dikarenakan adanya pajak Rp 90 juta untuk membeli mobil baru dan pajak khusus untuk masuk CBD, biaya penggunaan mobil per km menjadi lebih tinggi dari opsi tidak memilih – Rp 5.600. * Sistem di atas sama dengan yang diterapkan di Singapura atau London. Penduduk yang bermaksud memiliki kendaraan harus mengikuti lelang untuk memperoleh izin

267
registrasi yang berlaku selama 10 tahun. Diasumsikan biaya penggunaan sebuah mobil diperkirakan akan naik sekitar 35% bila pendaftaran dibatasi pada 2.5% setiap tahun. Kenaikan biaya pendaftaran dimasukkan dalam biaya penggunaan mobil setiap kilometer seperti tertera dalam pilihan.
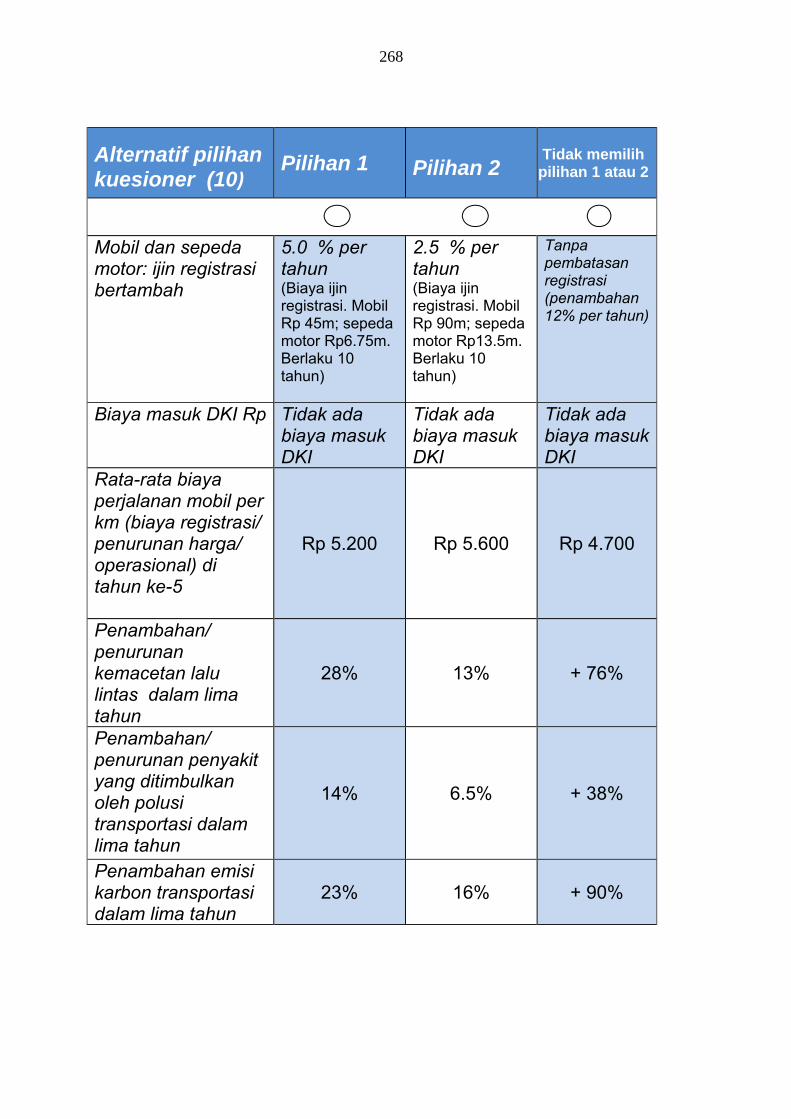
268
Alternatif pilihan kuesioner (10)
Pilihan 1
Pilihan 2 Tidak memilih
pilihan 1 atau 2
Mobil dan sepeda motor: ijin registrasi bertambah
5.0 % per tahun (Biaya ijin registrasi. Mobil Rp 45m; sepeda motor Rp6.75m. Berlaku 10 tahun)
2.5 % per tahun (Biaya ijin registrasi. Mobil Rp 90m; sepeda motor Rp13.5m. Berlaku 10 tahun)
Tanpa pembatasan registrasi (penambahan 12% per tahun)
Biaya masuk DKI Rp Tidak ada biaya masuk DKI
Tidak ada biaya masuk DKI
Tidak ada biaya masuk DKI
Rata-rata biaya perjalanan mobil per km (biaya registrasi/ penurunan harga/ operasional) di tahun ke-5
Rp 5.200 Rp 5.600 Rp 4.700
Penambahan/ penurunan kemacetan lalu lintas dalam lima tahun
28% 13% + 76%
Penambahan/ penurunan penyakit yang ditimbulkan oleh polusi transportasi dalam lima tahun
14% 6.5% + 38%
Penambahan emisi karbon transportasi dalam lima tahun
23% 16% + 90%
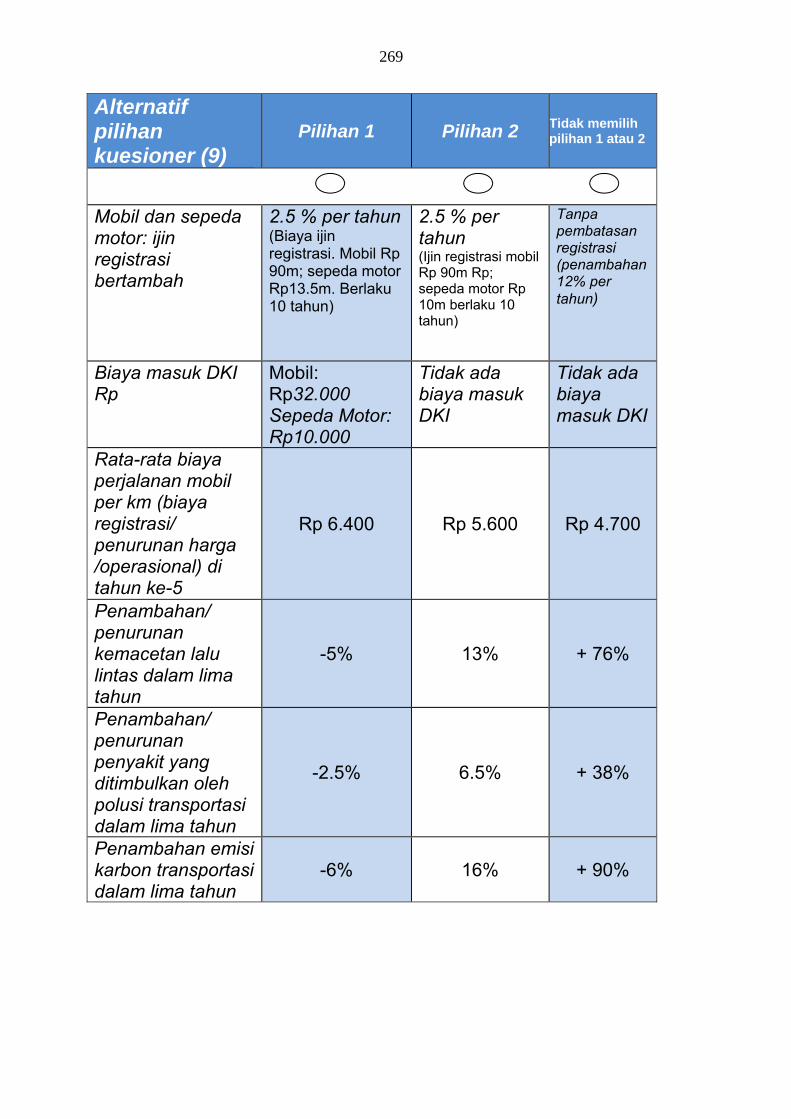
269
Alternatif pilihan kuesioner (9)
Pilihan 1 Pilihan 2 Tidak memilih pilihan 1 atau 2
Mobil dan sepeda motor: ijin registrasi bertambah
2.5 % per tahun (Biaya ijin registrasi. Mobil Rp 90m; sepeda motor Rp13.5m. Berlaku 10 tahun)
2.5 % per tahun (Ijin registrasi mobil Rp 90m Rp; sepeda motor Rp 10m berlaku 10 tahun)
Tanpa pembatasan registrasi (penambahan 12% per tahun)
Biaya masuk DKI Rp
Mobil: Rp32.000 Sepeda Motor: Rp10.000
Tidak ada biaya masuk DKI
Tidak ada biaya masuk DKI
Rata-rata biaya perjalanan mobil per km (biaya registrasi/ penurunan harga /operasional) di tahun ke-5
Rp 6.400 Rp 5.600 Rp 4.700
Penambahan/ penurunan kemacetan lalu lintas dalam lima tahun
-5% 13% + 76%
Penambahan/ penurunan penyakit yang ditimbulkan oleh polusi transportasi dalam lima tahun
-2.5% 6.5% + 38%
Penambahan emisi karbon transportasi dalam lima tahun
-6% 16% + 90%
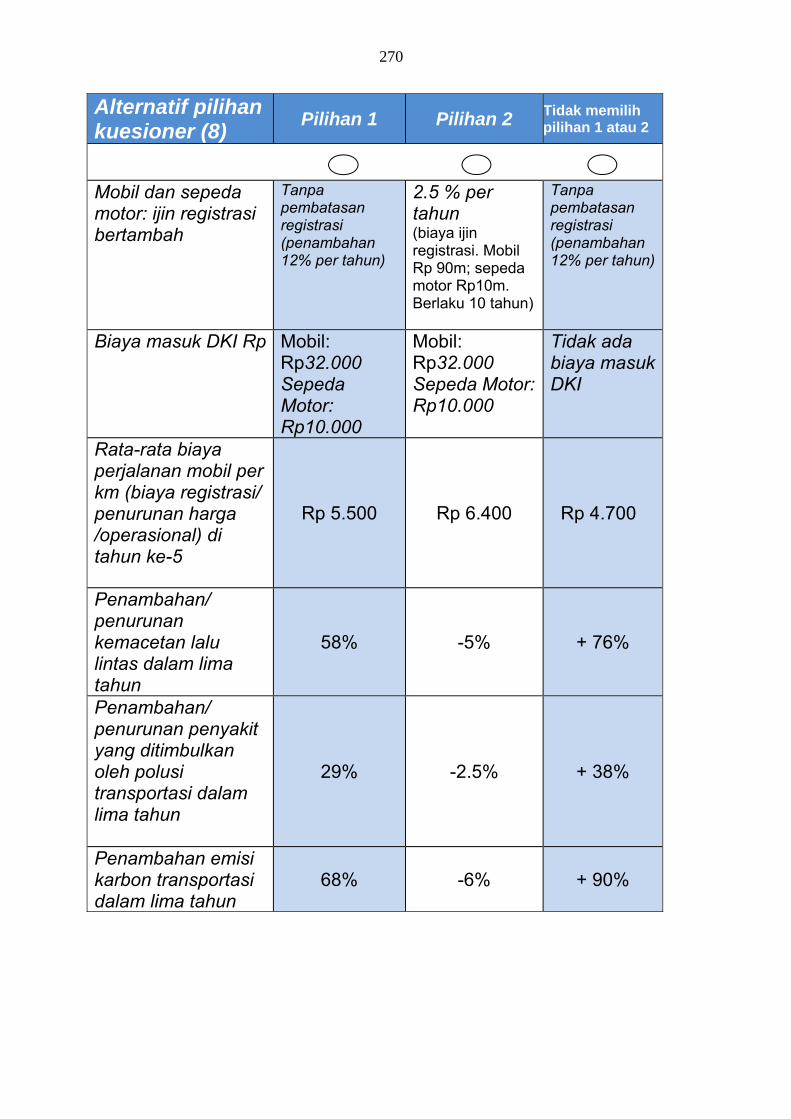
270
Alternatif pilihan kuesioner (8)
Pilihan 1 Pilihan 2 Tidak memilih pilihan 1 atau 2
Mobil dan sepeda motor: ijin registrasi bertambah
Tanpa pembatasan registrasi (penambahan 12% per tahun)
2.5 % per tahun (biaya ijin registrasi. Mobil Rp 90m; sepeda motor Rp10m. Berlaku 10 tahun)
Tanpa pembatasan registrasi (penambahan 12% per tahun)
Biaya masuk DKI Rp Mobil: Rp32.000 Sepeda Motor: Rp10.000
Mobil: Rp32.000 Sepeda Motor:Rp10.000
Tidak ada biaya masuk DKI
Rata-rata biaya perjalanan mobil per km (biaya registrasi/ penurunan harga /operasional) di tahun ke-5
Rp 5.500 Rp 6.400 Rp 4.700
Penambahan/ penurunan kemacetan lalu lintas dalam lima tahun
58% -5% + 76%
Penambahan/ penurunan penyakit yang ditimbulkan oleh polusi transportasi dalam lima tahun
29% -2.5% + 38%
Penambahan emisi karbon transportasi dalam lima tahun
68% -6% + 90%
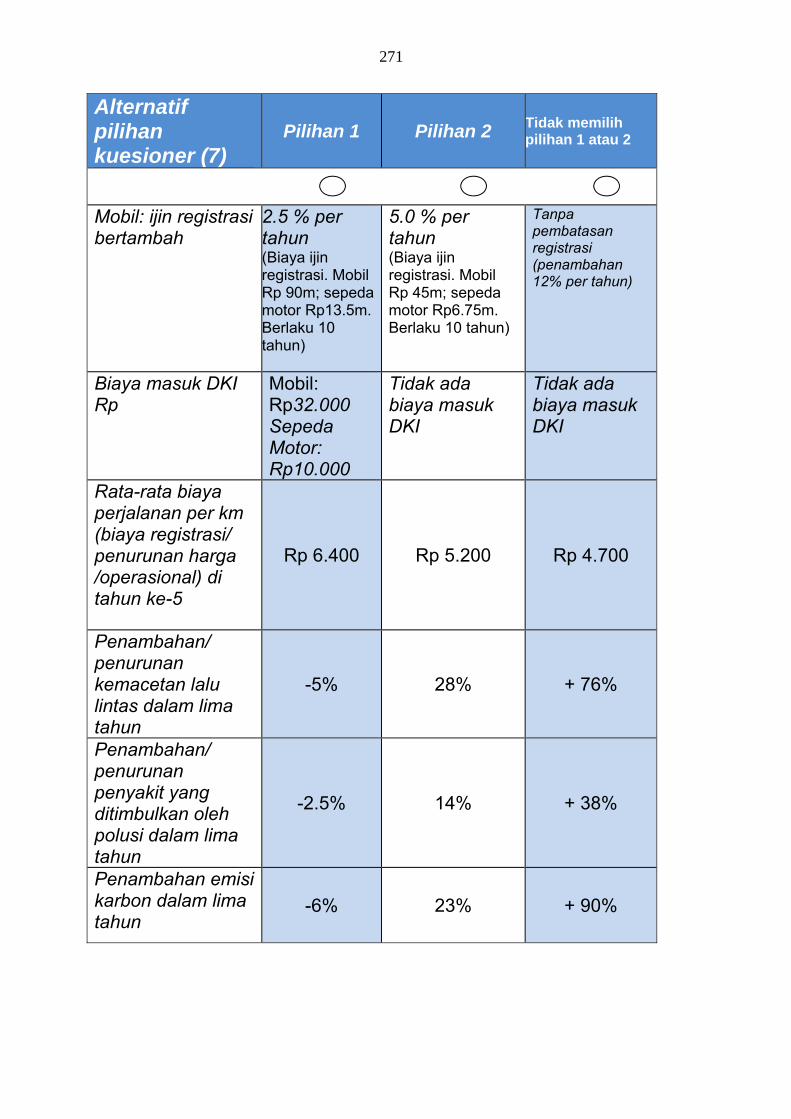
271
Alternatif pilihan kuesioner (7)
Pilihan 1 Pilihan 2 Tidak memilih pilihan 1 atau 2
Mobil: ijin registrasi bertambah
2.5 % per tahun (Biaya ijin registrasi. Mobil Rp 90m; sepeda motor Rp13.5m. Berlaku 10 tahun)
5.0 % per tahun (Biaya ijin registrasi. Mobil Rp 45m; sepeda motor Rp6.75m. Berlaku 10 tahun)
Tanpa pembatasan registrasi (penambahan 12% per tahun)
Biaya masuk DKI Rp
Mobil: Rp32.000 Sepeda Motor: Rp10.000
Tidak ada biaya masuk DKI
Tidak ada biaya masuk DKI
Rata-rata biaya perjalanan per km (biaya registrasi/ penurunan harga /operasional) di tahun ke-5
Rp 6.400 Rp 5.200 Rp 4.700
Penambahan/ penurunan kemacetan lalu lintas dalam lima tahun
-5% 28% + 76%
Penambahan/ penurunan penyakit yang ditimbulkan oleh polusi dalam lima tahun
-2.5% 14% + 38%
Penambahan emisi karbon dalam lima tahun
-6% 23% + 90%
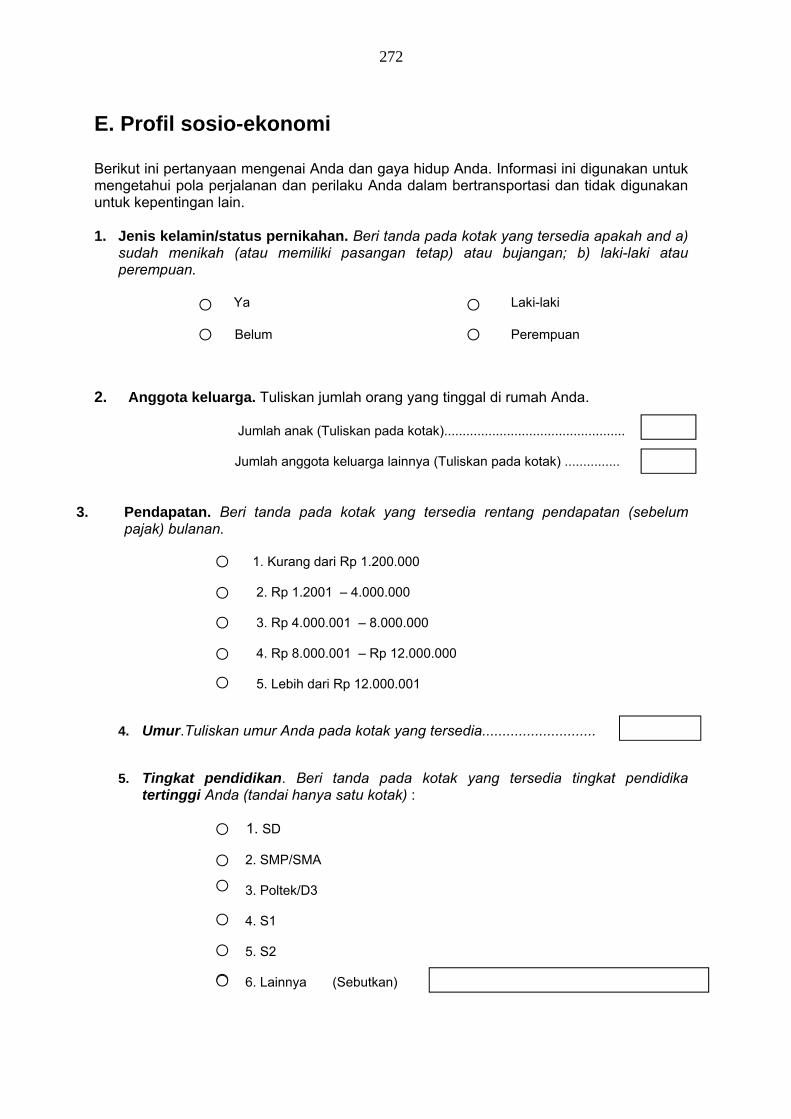
272
E. Profil sosio-ekonomi Berikut ini pertanyaan mengenai Anda dan gaya hidup Anda. Informasi ini digunakan untuk mengetahui pola perjalanan dan perilaku Anda dalam bertransportasi dan tidak digunakan untuk kepentingan lain. 1. Jenis kelamin/status pernikahan. Beri tanda pada kotak yang tersedia apakah and a)
sudah menikah (atau memiliki pasangan tetap) atau bujangan; b) laki-laki atau perempuan.
Ya Laki-laki
Belum Perempuan 2. Anggota keluarga. Tuliskan jumlah orang yang tinggal di rumah Anda. Jumlah anak (Tuliskan pada kotak)................................................. Jumlah anggota keluarga lainnya (Tuliskan pada kotak) ...............
3. Pendapatan. Beri tanda pada kotak yang tersedia rentang pendapatan (sebelum pajak) bulanan.
1. Kurang dari Rp 1.200.000 2. Rp 1.2001 – 4.000.000 3. Rp 4.000.001 – 8.000.000 4. Rp 8.000.001 – Rp 12.000.000 5. Lebih dari Rp 12.000.001
4. Umur.Tuliskan umur Anda pada kotak yang tersedia............................
5. Tingkat pendidikan. Beri tanda pada kotak yang tersedia tingkat pendidika tertinggi Anda (tandai hanya satu kotak) :
1. SD 2. SMP/SMA 3. Poltek/D3 4. S1
5. S2 6. Lainnya (Sebutkan)
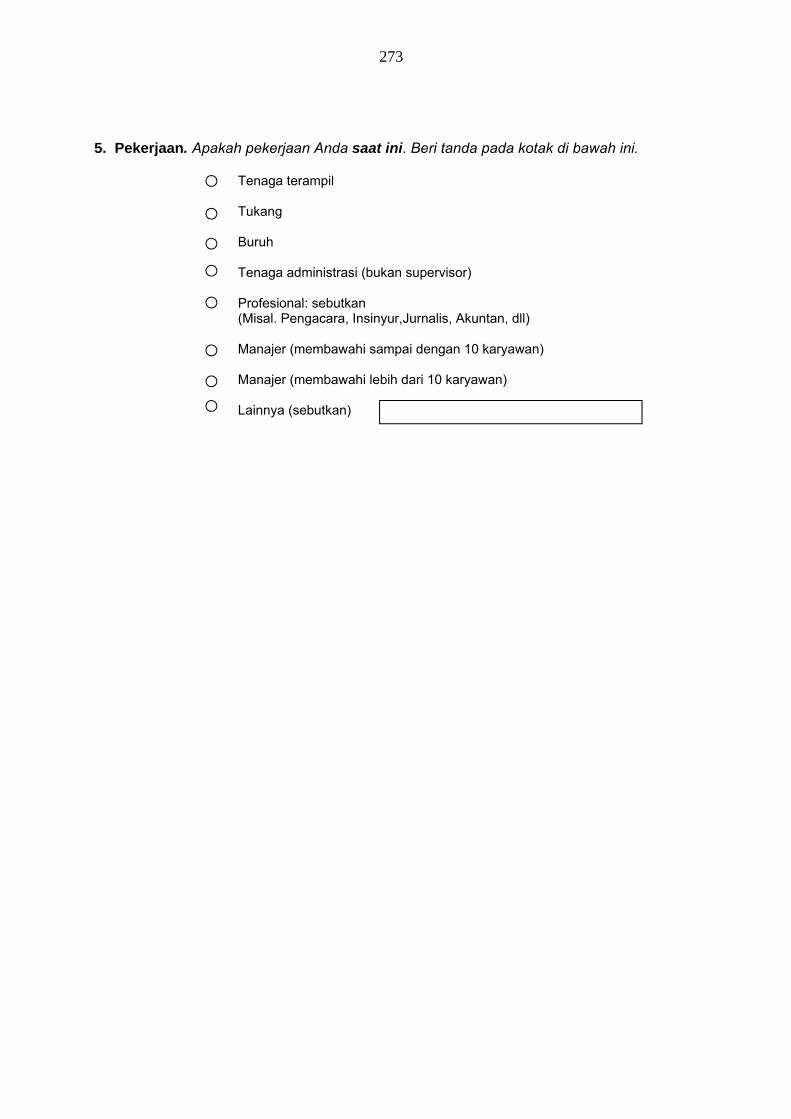
273
5. Pekerjaan. Apakah pekerjaan Anda saat ini. Beri tanda pada kotak di bawah ini. Tenaga terampil Tukang Buruh Tenaga administrasi (bukan supervisor) Profesional: sebutkan
(Misal. Pengacara, Insinyur,Jurnalis, Akuntan, dll) Manajer (membawahi sampai dengan 10 karyawan) Manajer (membawahi lebih dari 10 karyawan) Lainnya (sebutkan)
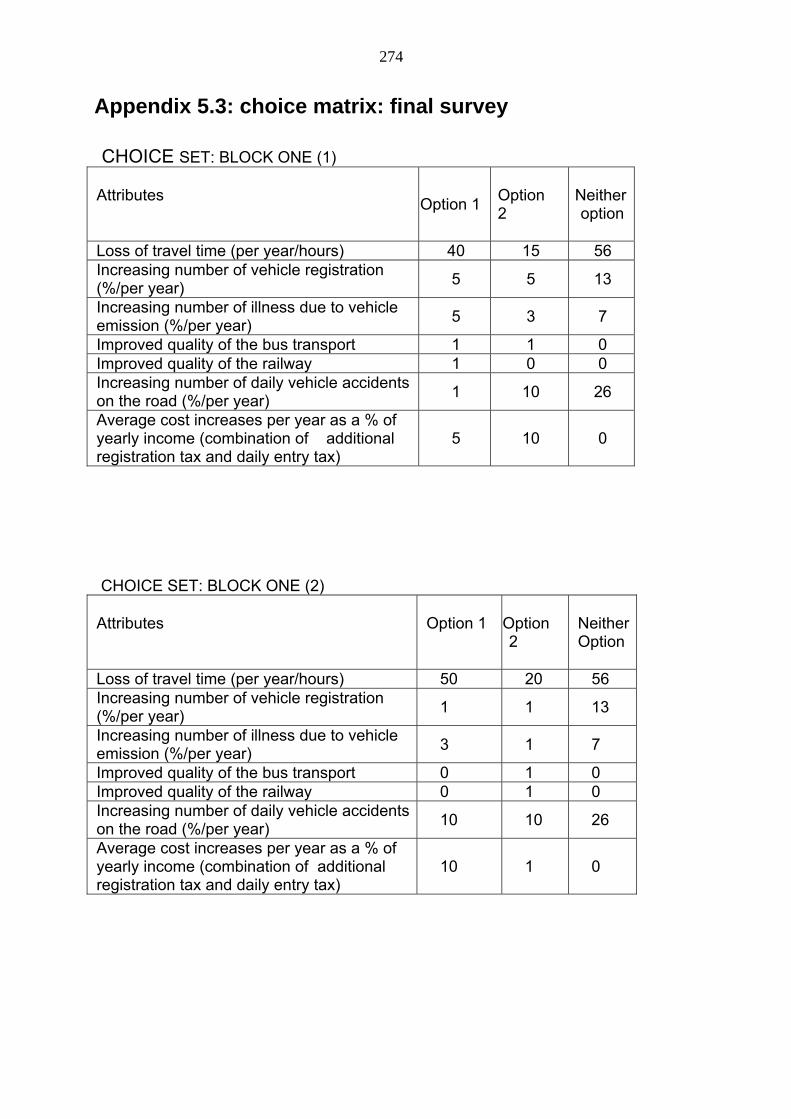
274
Appendix 5.3: choice matrix: final survey
CHOICE SET: BLOCK ONE (1) Attributes
Option 1 Option 2
Neither option
Loss of travel time (per year/hours) 40 15 56 Increasing number of vehicle registration (%/per year)
5 5 13
Increasing number of illness due to vehicle emission (%/per year)
5 3 7
Improved quality of the bus transport 1 1 0 Improved quality of the railway 1 0 0 Increasing number of daily vehicle accidents on the road (%/per year)
1 10 26
Average cost increases per year as a % of yearly income (combination of additional registration tax and daily entry tax)
5 10 0
CHOICE SET: BLOCK ONE (2) Attributes
Option 1
Option 2
Neither Option
Loss of travel time (per year/hours) 50 20 56 Increasing number of vehicle registration (%/per year)
1 1 13
Increasing number of illness due to vehicle emission (%/per year)
3 1 7
Improved quality of the bus transport 0 1 0 Improved quality of the railway 0 1 0 Increasing number of daily vehicle accidents on the road (%/per year)
10 10 26
Average cost increases per year as a % of yearly income (combination of additional registration tax and daily entry tax)
10 1 0
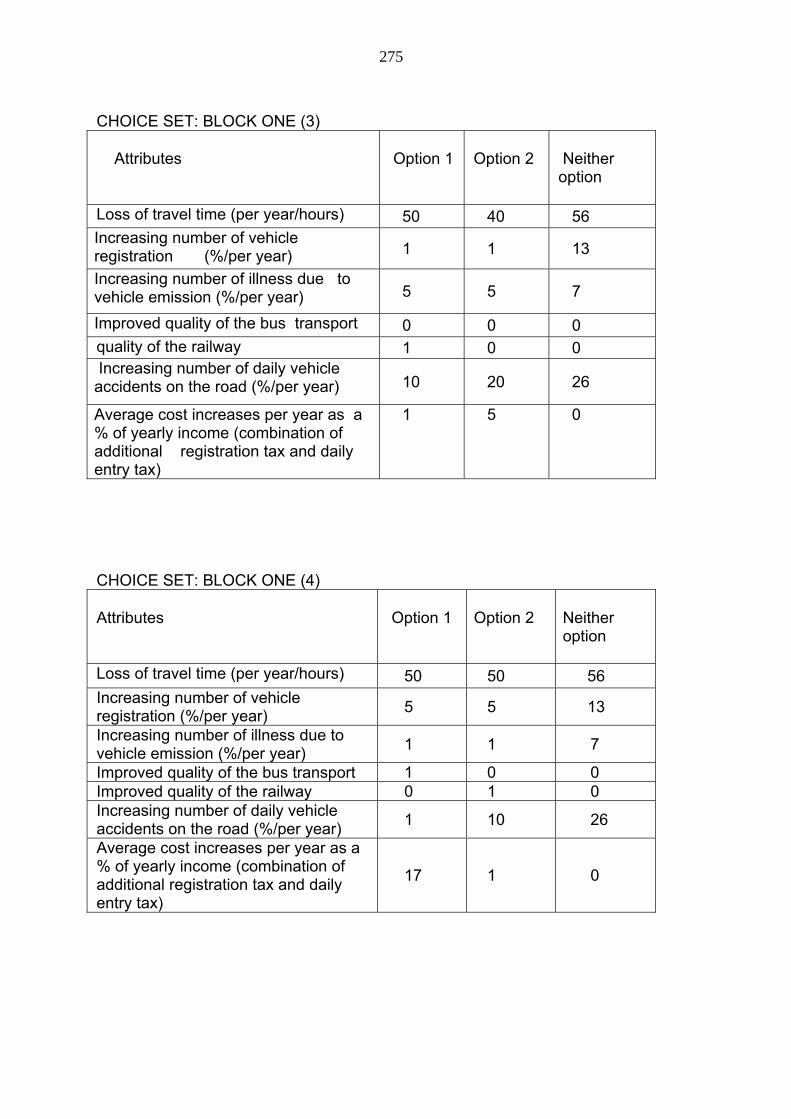
275
CHOICE SET: BLOCK ONE (3) Attributes
Option 1
Option 2
Neither option
Loss of travel time (per year/hours) 50 40 56 Increasing number of vehicle registration (%/per year) 1 1 13
Increasing number of illness due to vehicle emission (%/per year) 5 5 7
Improved quality of the bus transport 0 0 0 quality of the railway 1 0 0 Increasing number of daily vehicle accidents on the road (%/per year) 10 20 26
Average cost increases per year as a % of yearly income (combination of additional registration tax and daily entry tax)
1 5 0
CHOICE SET: BLOCK ONE (4) Attributes
Option 1
Option 2
Neither option
Loss of travel time (per year/hours) 50 50 56 Increasing number of vehicle registration (%/per year)
5 5 13
Increasing number of illness due to vehicle emission (%/per year)
1 1 7
Improved quality of the bus transport 1 0 0 Improved quality of the railway 0 1 0 Increasing number of daily vehicle accidents on the road (%/per year)
1 10 26
Average cost increases per year as a % of yearly income (combination of additional registration tax and daily entry tax)
17 1 0
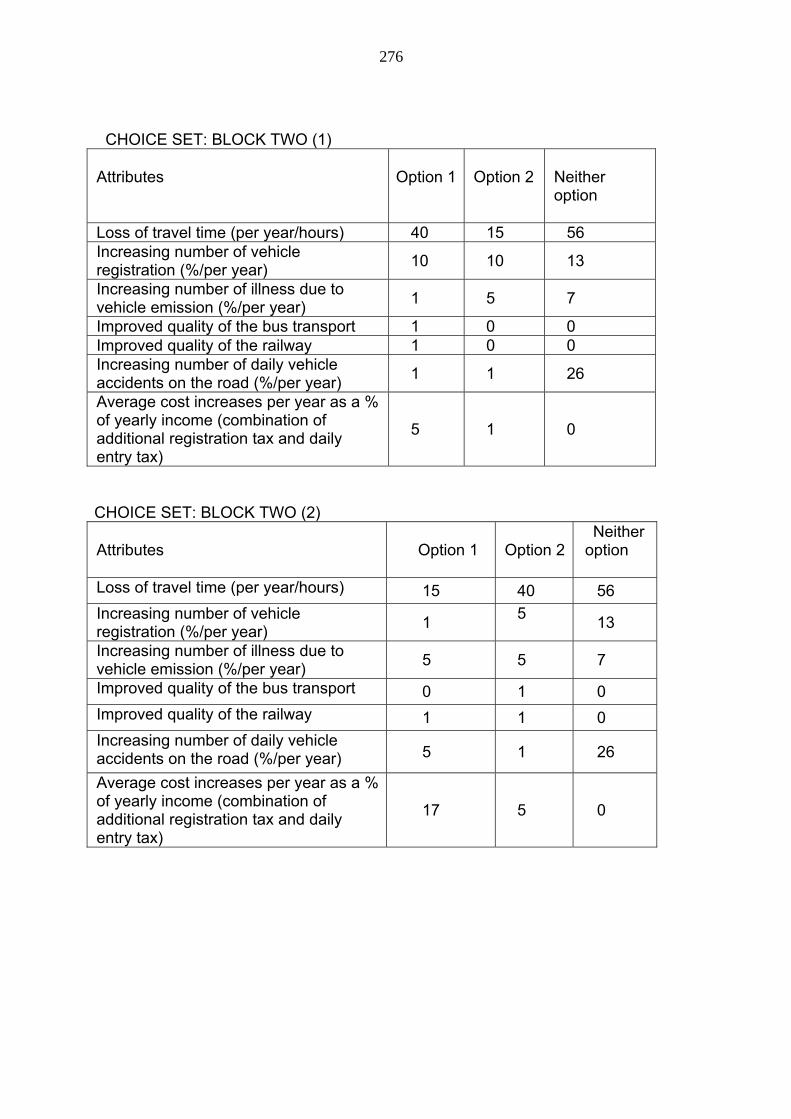
276
CHOICE SET: BLOCK TWO (1) Attributes
Option 1
Option 2
Neither option
Loss of travel time (per year/hours) 40 15 56 Increasing number of vehicle registration (%/per year)
10 10 13
Increasing number of illness due to vehicle emission (%/per year)
1 5 7
Improved quality of the bus transport 1 0 0 Improved quality of the railway 1 0 0 Increasing number of daily vehicle accidents on the road (%/per year)
1 1 26
Average cost increases per year as a % of yearly income (combination of additional registration tax and daily entry tax)
5 1 0
CHOICE SET: BLOCK TWO (2) Attributes
Option 1
Option 2
Neither option
Loss of travel time (per year/hours) 15 40 56
Increasing number of vehicle registration (%/per year)
1 5
13
Increasing number of illness due to vehicle emission (%/per year)
5 5 7
Improved quality of the bus transport 0 1 0
Improved quality of the railway 1 1 0
Increasing number of daily vehicle accidents on the road (%/per year) 5 1 26
Average cost increases per year as a % of yearly income (combination of additional registration tax and daily entry tax)
17 5 0
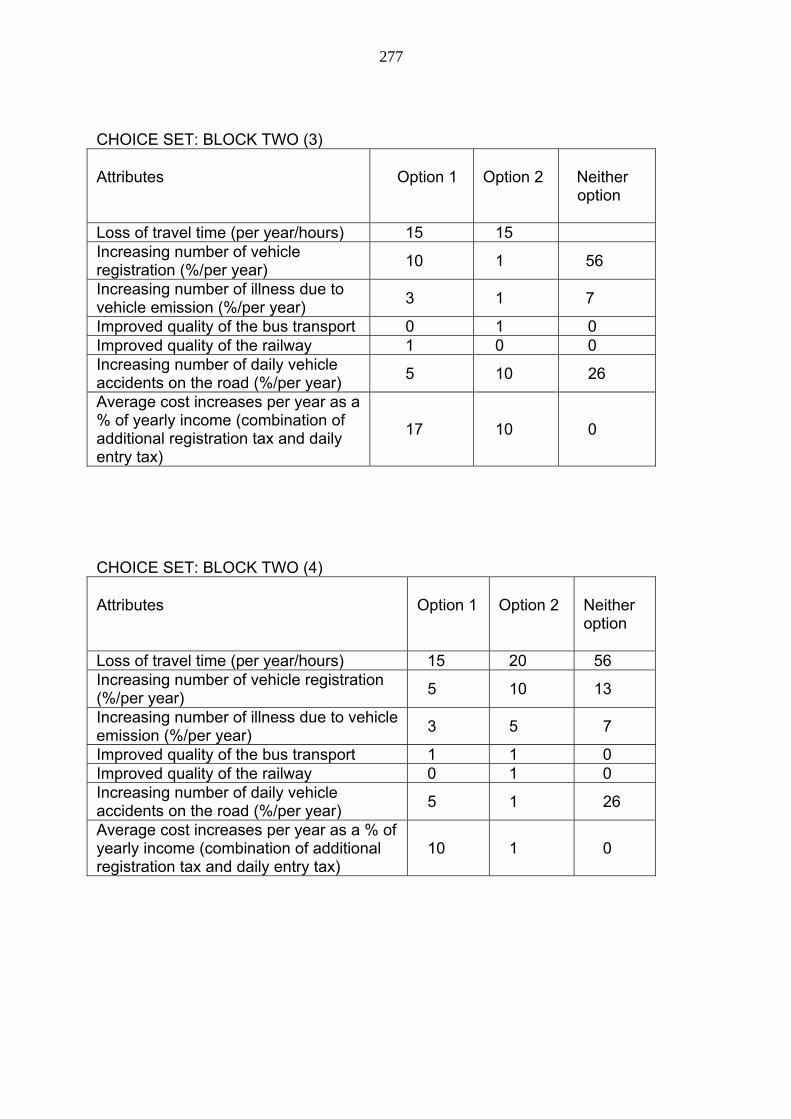
277
CHOICE SET: BLOCK TWO (3) Attributes
Option 1
Option 2
Neither
option
Loss of travel time (per year/hours) 15 15 Increasing number of vehicle registration (%/per year)
10 1 56
Increasing number of illness due to vehicle emission (%/per year)
3 1 7
Improved quality of the bus transport 0 1 0 Improved quality of the railway 1 0 0 Increasing number of daily vehicle accidents on the road (%/per year)
5 10 26
Average cost increases per year as a % of yearly income (combination of additional registration tax and daily entry tax)
17 10 0
CHOICE SET: BLOCK TWO (4) Attributes
Option 1
Option 2
Neither option
Loss of travel time (per year/hours) 15 20 56 Increasing number of vehicle registration (%/per year)
5 10 13
Increasing number of illness due to vehicle emission (%/per year)
3 5 7
Improved quality of the bus transport 1 1 0 Improved quality of the railway 0 1 0 Increasing number of daily vehicle accidents on the road (%/per year)
5 1 26
Average cost increases per year as a % of yearly income (combination of additional registration tax and daily entry tax)
10 1 0
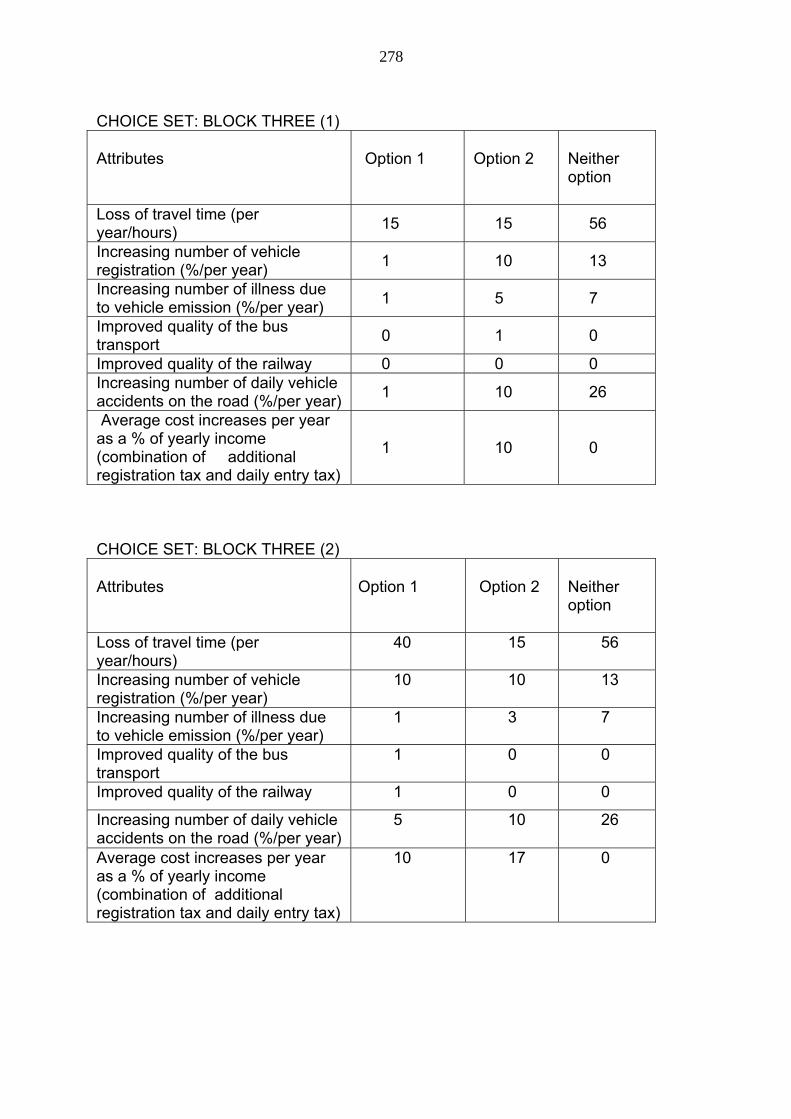
278
CHOICE SET: BLOCK THREE (1) Attributes
Option 1
Option 2
Neither option
Loss of travel time (per year/hours)
15 15 56
Increasing number of vehicle registration (%/per year)
1 10 13
Increasing number of illness due to vehicle emission (%/per year)
1 5 7
Improved quality of the bus transport
0 1 0
Improved quality of the railway 0 0 0 Increasing number of daily vehicle accidents on the road (%/per year)
1 10 26
Average cost increases per year as a % of yearly income (combination of additional registration tax and daily entry tax)
1 10 0
CHOICE SET: BLOCK THREE (2) Attributes
Option 1
Option 2
Neither option
Loss of travel time (per year/hours)
40 15 56
Increasing number of vehicle registration (%/per year)
10 10 13
Increasing number of illness due to vehicle emission (%/per year)
1 3 7
Improved quality of the bus transport
1 0 0
Improved quality of the railway 1 0 0
Increasing number of daily vehicle accidents on the road (%/per year)
5 10 26
Average cost increases per year as a % of yearly income (combination of additional registration tax and daily entry tax)
10 17 0
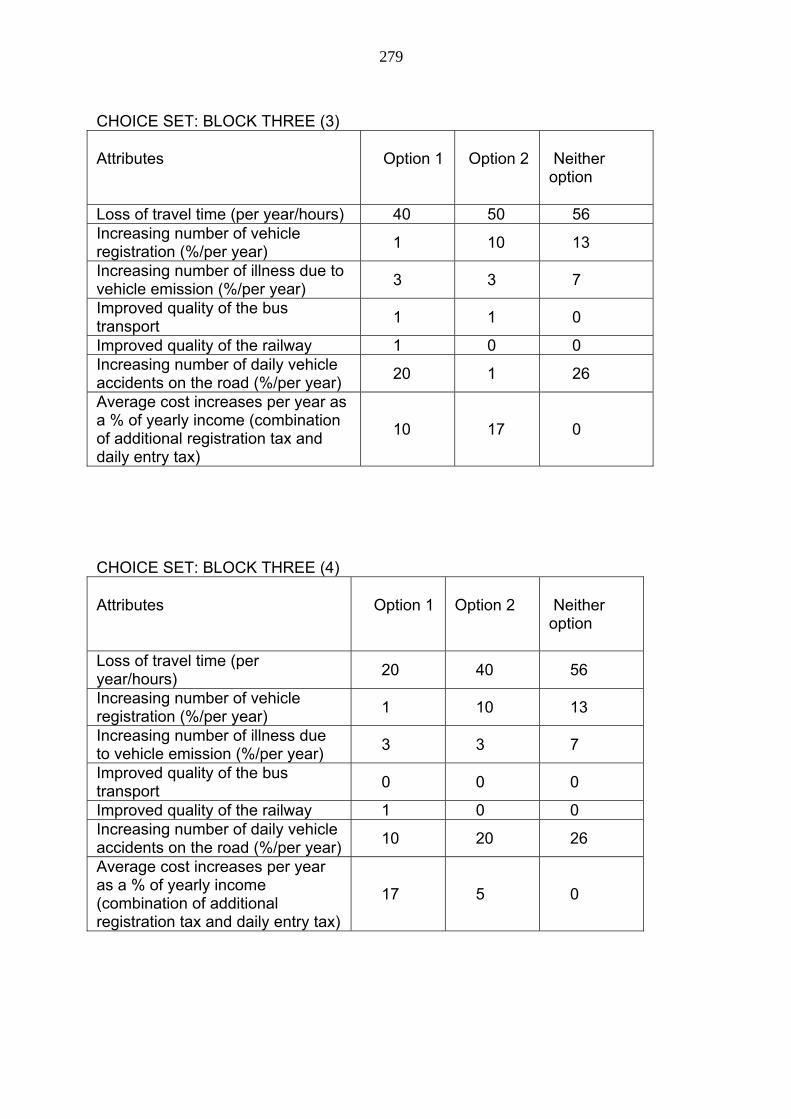
279
CHOICE SET: BLOCK THREE (3) Attributes
Option 1
Option 2
Neither option
Loss of travel time (per year/hours) 40 50 56 Increasing number of vehicle registration (%/per year)
1 10 13
Increasing number of illness due to vehicle emission (%/per year)
3 3 7
Improved quality of the bus transport
1 1 0
Improved quality of the railway 1 0 0 Increasing number of daily vehicle accidents on the road (%/per year)
20 1 26
Average cost increases per year as a % of yearly income (combination of additional registration tax and daily entry tax)
10 17 0
CHOICE SET: BLOCK THREE (4) Attributes
Option 1
Option 2
Neither option
Loss of travel time (per year/hours)
20 40 56
Increasing number of vehicle registration (%/per year)
1 10 13
Increasing number of illness due to vehicle emission (%/per year)
3 3 7
Improved quality of the bus transport
0 0 0
Improved quality of the railway 1 0 0 Increasing number of daily vehicle accidents on the road (%/per year)
10 20 26
Average cost increases per year as a % of yearly income (combination of additional registration tax and daily entry tax)
17 5 0
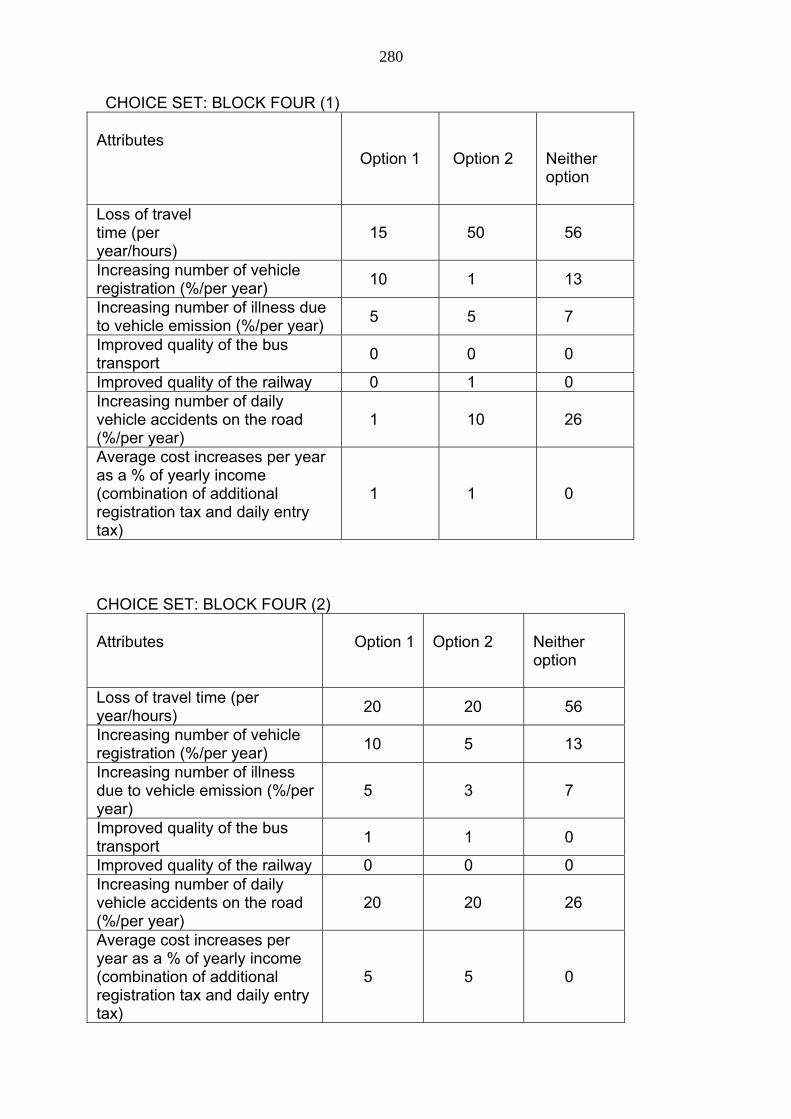
280
CHOICE SET: BLOCK FOUR (1) Attributes
Option 1
Option 2
Neither option
Loss of travel time (per year/hours)
15 50 56
Increasing number of vehicle registration (%/per year)
10 1 13
Increasing number of illness due to vehicle emission (%/per year)
5 5 7
Improved quality of the bus transport
0 0 0
Improved quality of the railway 0 1 0 Increasing number of daily vehicle accidents on the road (%/per year)
1 10 26
Average cost increases per year as a % of yearly income (combination of additional registration tax and daily entry tax)
1 1 0
CHOICE SET: BLOCK FOUR (2) Attributes
Option 1
Option 2
Neither option
Loss of travel time (per year/hours)
20 20 56
Increasing number of vehicle registration (%/per year)
10 5 13
Increasing number of illness due to vehicle emission (%/per year)
5 3 7
Improved quality of the bus transport
1 1 0
Improved quality of the railway 0 0 0 Increasing number of daily vehicle accidents on the road (%/per year)
20 20 26
Average cost increases per year as a % of yearly income (combination of additional registration tax and daily entry tax)
5 5 0
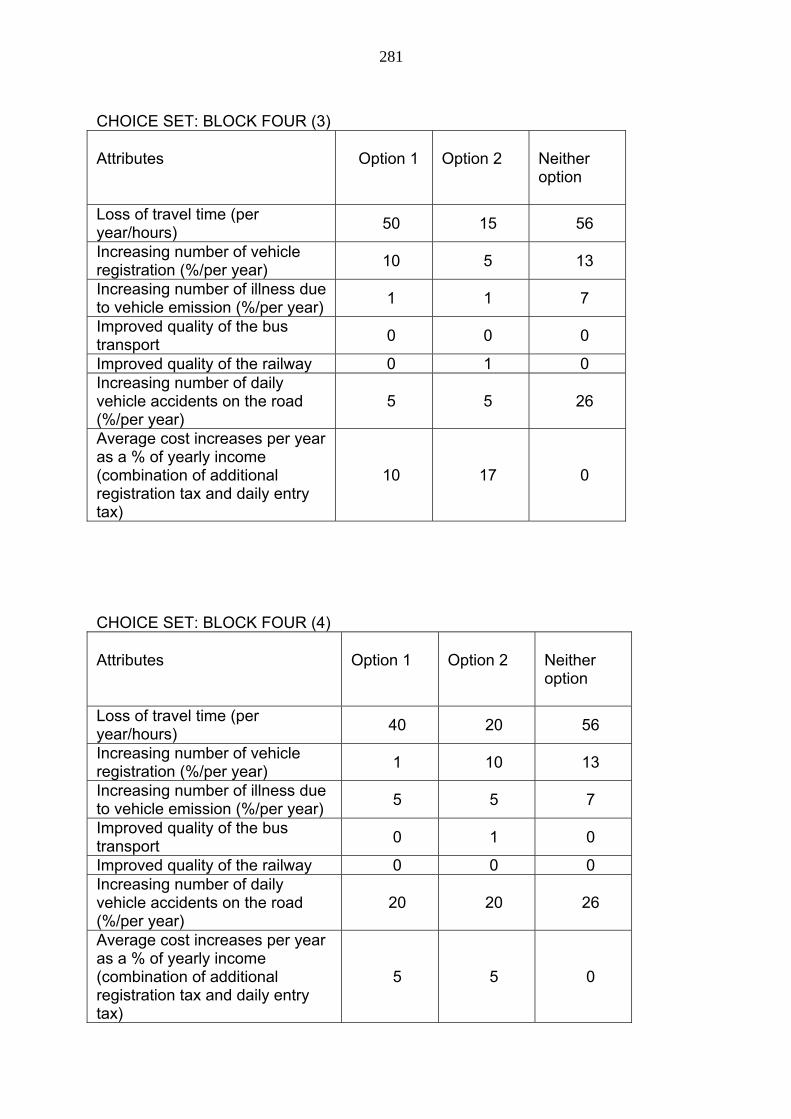
281
CHOICE SET: BLOCK FOUR (3) Attributes
Option 1
Option 2
Neither option
Loss of travel time (per year/hours)
50 15 56
Increasing number of vehicle registration (%/per year)
10 5 13
Increasing number of illness due to vehicle emission (%/per year)
1 1 7
Improved quality of the bus transport
0 0 0
Improved quality of the railway 0 1 0 Increasing number of daily vehicle accidents on the road (%/per year)
5 5 26
Average cost increases per year as a % of yearly income (combination of additional registration tax and daily entry tax)
10 17 0
CHOICE SET: BLOCK FOUR (4) Attributes
Option 1
Option 2
Neither option
Loss of travel time (per year/hours)
40 20 56
Increasing number of vehicle registration (%/per year)
1 10 13
Increasing number of illness due to vehicle emission (%/per year)
5 5 7
Improved quality of the bus transport
0 1 0
Improved quality of the railway 0 0 0 Increasing number of daily vehicle accidents on the road (%/per year)
20 20 26
Average cost increases per year as a % of yearly income (combination of additional registration tax and daily entry tax)
5 5 0
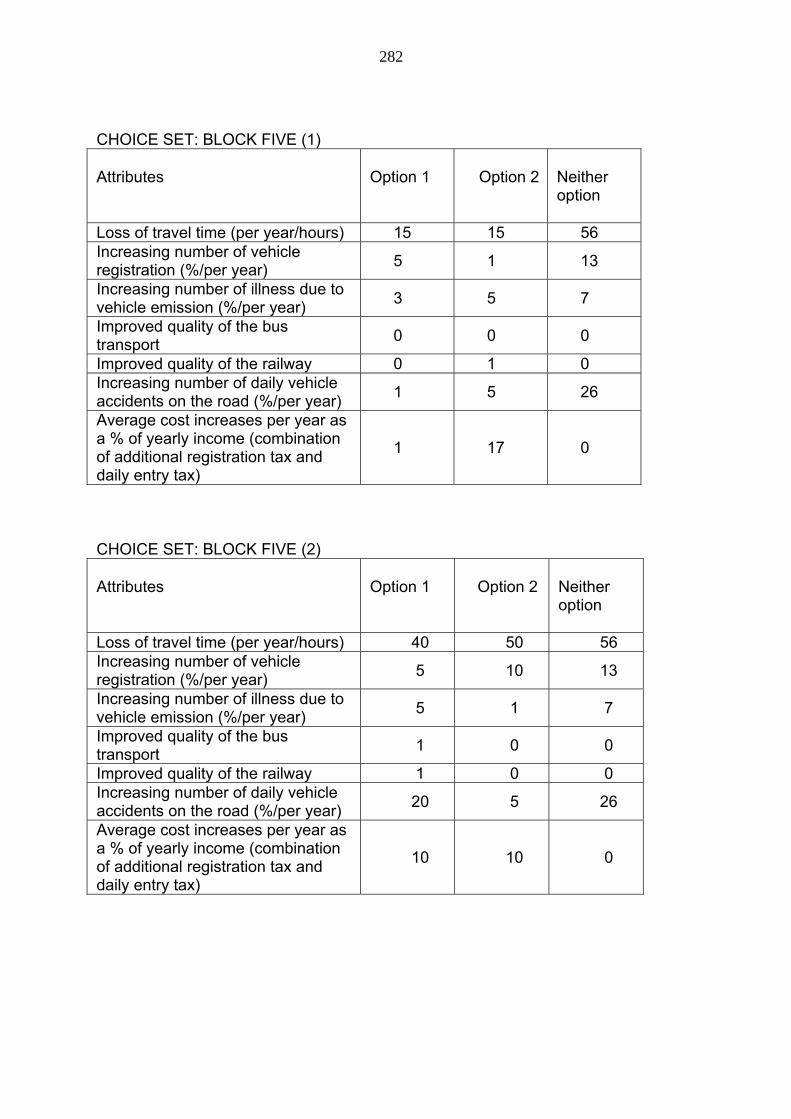
282
CHOICE SET: BLOCK FIVE (1) Attributes
Option 1
Option 2
Neither option
Loss of travel time (per year/hours) 15 15 56 Increasing number of vehicle registration (%/per year)
5 1 13
Increasing number of illness due to vehicle emission (%/per year)
3 5 7
Improved quality of the bus transport
0 0 0
Improved quality of the railway 0 1 0 Increasing number of daily vehicle accidents on the road (%/per year)
1 5 26
Average cost increases per year as a % of yearly income (combination of additional registration tax and daily entry tax)
1 17 0
CHOICE SET: BLOCK FIVE (2) Attributes
Option 1
Option 2
Neither option
Loss of travel time (per year/hours) 40 50 56 Increasing number of vehicle registration (%/per year)
5 10 13
Increasing number of illness due to vehicle emission (%/per year)
5 1 7
Improved quality of the bus transport
1 0 0
Improved quality of the railway 1 0 0 Increasing number of daily vehicle accidents on the road (%/per year)
20 5 26
Average cost increases per year as a % of yearly income (combination of additional registration tax and daily entry tax)
10 10 0
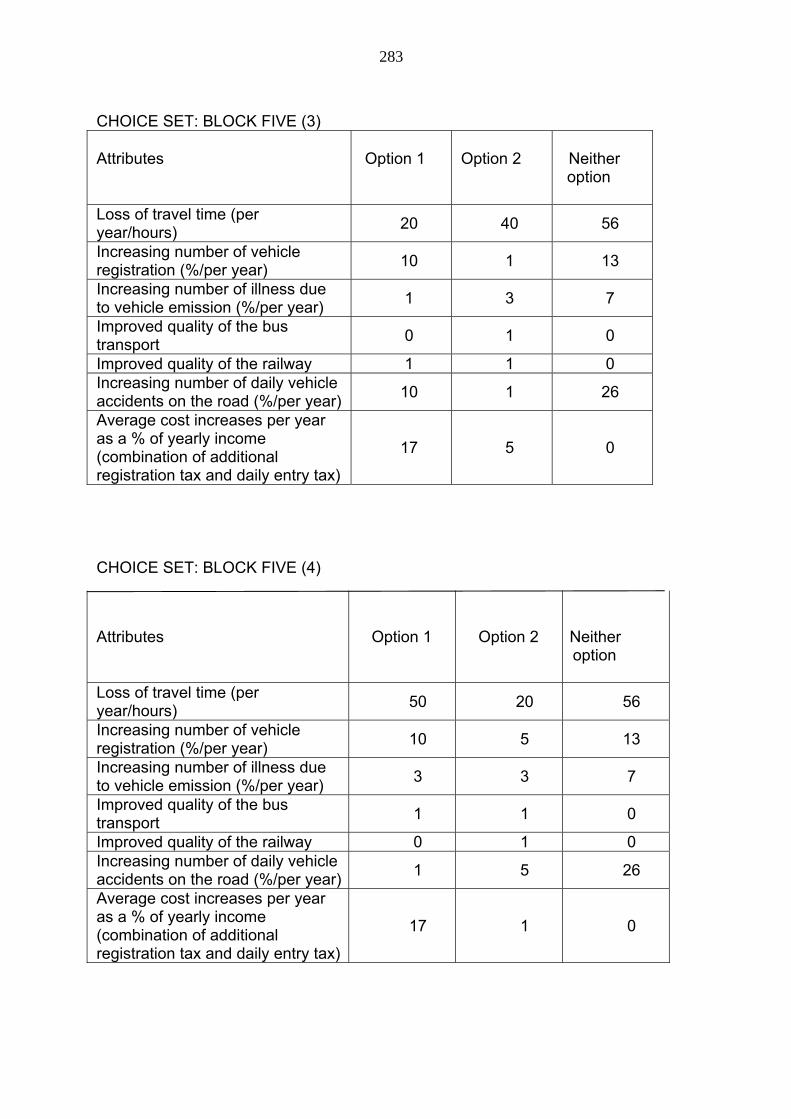
283
CHOICE SET: BLOCK FIVE (3) Attributes
Option 1
Option 2
Neither
option
Loss of travel time (per year/hours)
20 40 56
Increasing number of vehicle registration (%/per year)
10 1 13
Increasing number of illness due to vehicle emission (%/per year)
1 3 7
Improved quality of the bus transport
0 1 0
Improved quality of the railway 1 1 0 Increasing number of daily vehicle accidents on the road (%/per year)
10 1 26
Average cost increases per year as a % of yearly income (combination of additional registration tax and daily entry tax)
17 5 0
CHOICE SET: BLOCK FIVE (4)
Attributes
Option 1
Option 2
Neither option
Loss of travel time (per year/hours)
50 20 56
Increasing number of vehicle registration (%/per year)
10 5 13
Increasing number of illness due to vehicle emission (%/per year)
3 3 7
Improved quality of the bus transport
1 1 0
Improved quality of the railway 0 1 0 Increasing number of daily vehicle accidents on the road (%/per year)
1 5 26
Average cost increases per year as a % of yearly income (combination of additional registration tax and daily entry tax)
17 1 0
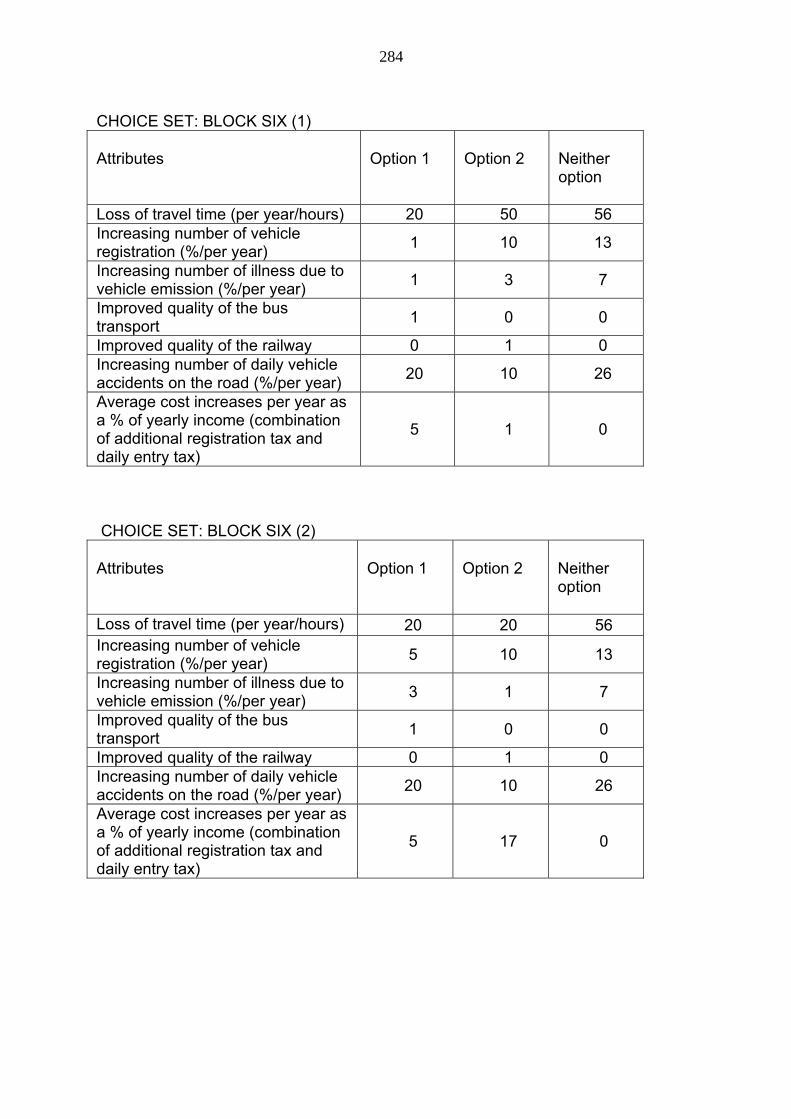
284
CHOICE SET: BLOCK SIX (1) Attributes
Option 1
Option 2
Neither option
Loss of travel time (per year/hours) 20 50 56 Increasing number of vehicle registration (%/per year)
1 10 13
Increasing number of illness due to vehicle emission (%/per year)
1 3 7
Improved quality of the bus transport
1 0 0
Improved quality of the railway 0 1 0 Increasing number of daily vehicle accidents on the road (%/per year)
20 10 26
Average cost increases per year as a % of yearly income (combination of additional registration tax and daily entry tax)
5 1 0
CHOICE SET: BLOCK SIX (2) Attributes
Option 1
Option 2
Neither option
Loss of travel time (per year/hours) 20 20 56 Increasing number of vehicle registration (%/per year)
5 10 13
Increasing number of illness due to vehicle emission (%/per year)
3 1 7
Improved quality of the bus transport
1 0 0
Improved quality of the railway 0 1 0 Increasing number of daily vehicle accidents on the road (%/per year)
20 10 26
Average cost increases per year as a % of yearly income (combination of additional registration tax and daily entry tax)
5 17 0
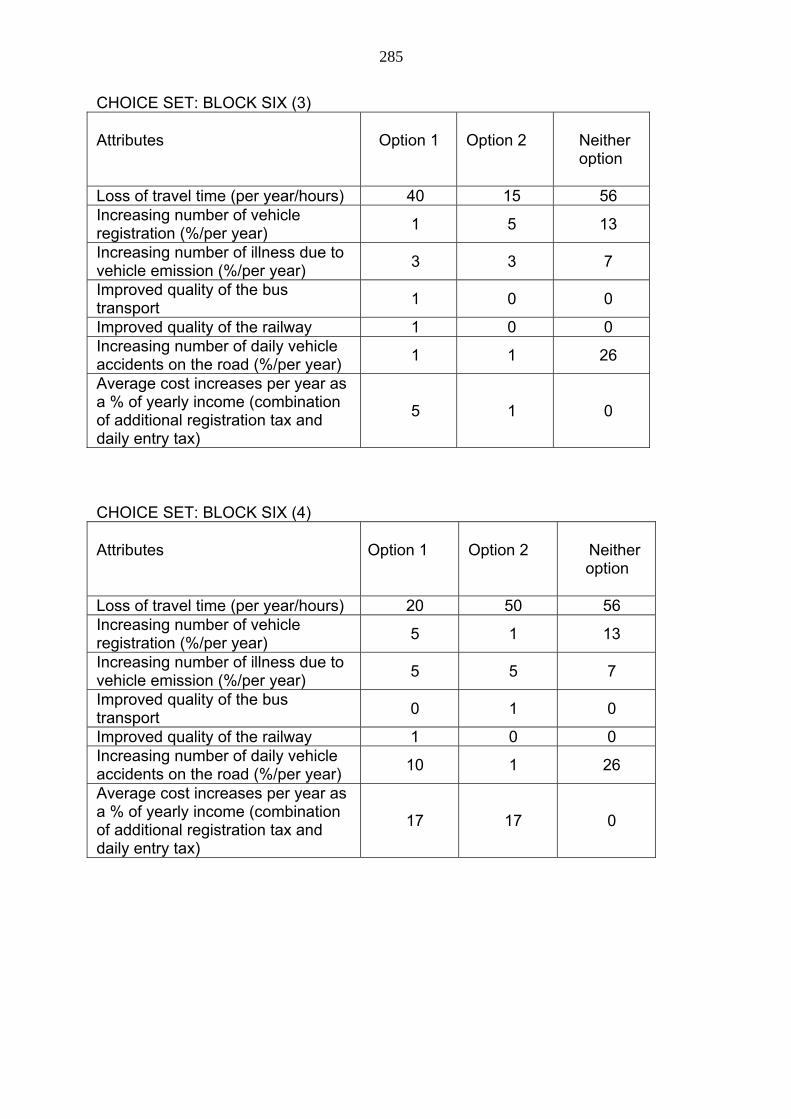
285
CHOICE SET: BLOCK SIX (3) Attributes
Option 1
Option 2
Neither option
Loss of travel time (per year/hours) 40 15 56 Increasing number of vehicle registration (%/per year)
1 5 13
Increasing number of illness due to vehicle emission (%/per year)
3 3 7
Improved quality of the bus transport
1 0 0
Improved quality of the railway 1 0 0 Increasing number of daily vehicle accidents on the road (%/per year)
1 1 26
Average cost increases per year as a % of yearly income (combination of additional registration tax and daily entry tax)
5 1 0
CHOICE SET: BLOCK SIX (4) Attributes
Option 1
Option 2
Neither
option
Loss of travel time (per year/hours) 20 50 56 Increasing number of vehicle registration (%/per year)
5 1 13
Increasing number of illness due to vehicle emission (%/per year)
5 5 7
Improved quality of the bus transport
0 1 0
Improved quality of the railway 1 0 0 Increasing number of daily vehicle accidents on the road (%/per year)
10 1 26
Average cost increases per year as a % of yearly income (combination of additional registration tax and daily entry tax)
17 17 0
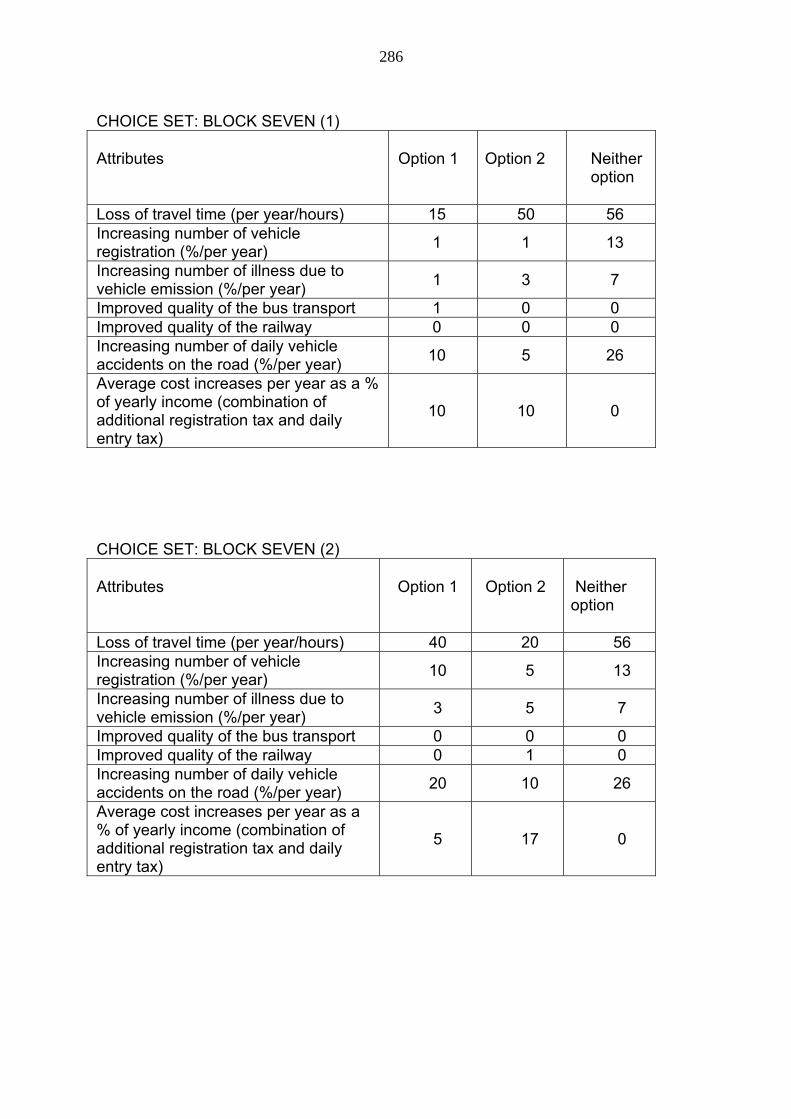
286
CHOICE SET: BLOCK SEVEN (1) Attributes
Option 1
Option 2
Neither option
Loss of travel time (per year/hours) 15 50 56 Increasing number of vehicle registration (%/per year)
1 1 13
Increasing number of illness due to vehicle emission (%/per year)
1 3 7
Improved quality of the bus transport 1 0 0 Improved quality of the railway 0 0 0 Increasing number of daily vehicle accidents on the road (%/per year)
10 5 26
Average cost increases per year as a % of yearly income (combination of additional registration tax and daily entry tax)
10 10 0
CHOICE SET: BLOCK SEVEN (2) Attributes
Option 1
Option 2
Neither option
Loss of travel time (per year/hours) 40 20 56 Increasing number of vehicle registration (%/per year)
10 5 13
Increasing number of illness due to vehicle emission (%/per year)
3 5 7
Improved quality of the bus transport 0 0 0 Improved quality of the railway 0 1 0 Increasing number of daily vehicle accidents on the road (%/per year)
20 10 26
Average cost increases per year as a % of yearly income (combination of additional registration tax and daily entry tax)
5 17 0
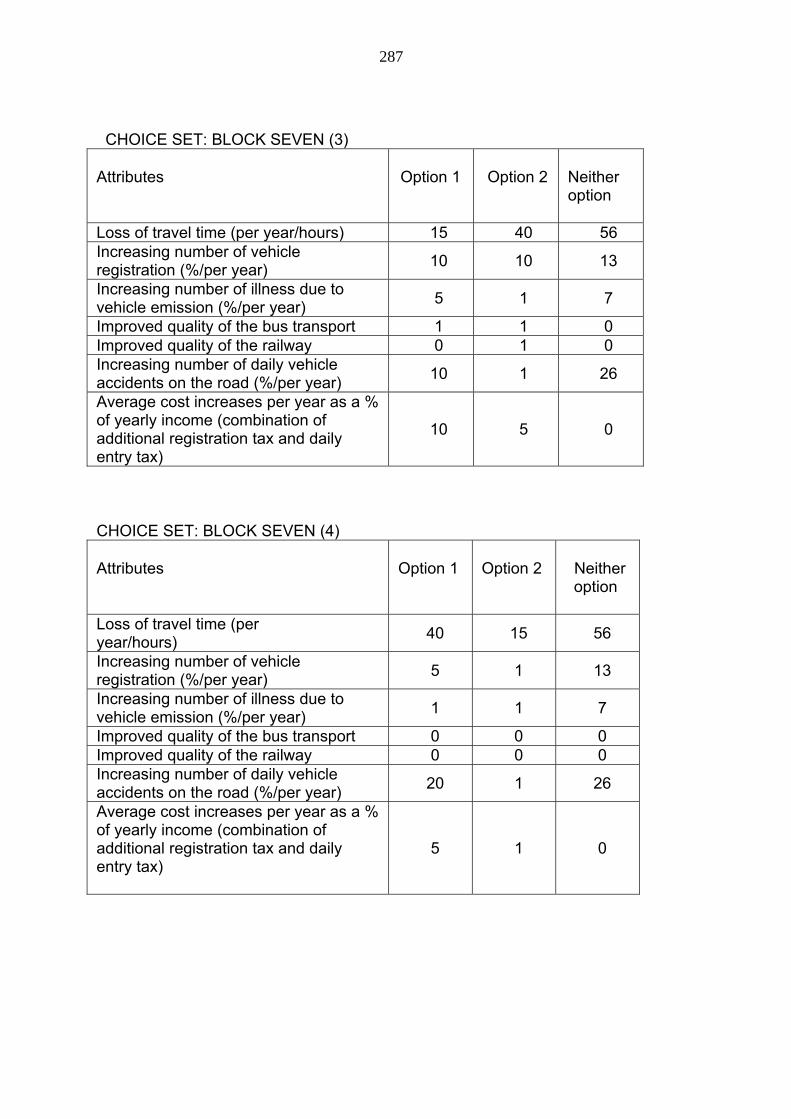
287
CHOICE SET: BLOCK SEVEN (3) Attributes
Option 1
Option 2
Neither option
Loss of travel time (per year/hours) 15 40 56 Increasing number of vehicle registration (%/per year)
10 10 13
Increasing number of illness due to vehicle emission (%/per year)
5 1 7
Improved quality of the bus transport 1 1 0 Improved quality of the railway 0 1 0 Increasing number of daily vehicle accidents on the road (%/per year)
10 1 26
Average cost increases per year as a % of yearly income (combination of additional registration tax and daily entry tax)
10 5 0
CHOICE SET: BLOCK SEVEN (4) Attributes
Option 1
Option 2
Neither option
Loss of travel time (per year/hours)
40 15 56
Increasing number of vehicle registration (%/per year)
5 1 13
Increasing number of illness due to vehicle emission (%/per year)
1 1 7
Improved quality of the bus transport 0 0 0 Improved quality of the railway 0 0 0 Increasing number of daily vehicle accidents on the road (%/per year)
20 1 26
Average cost increases per year as a % of yearly income (combination of additional registration tax and daily entry tax)
5 1 0
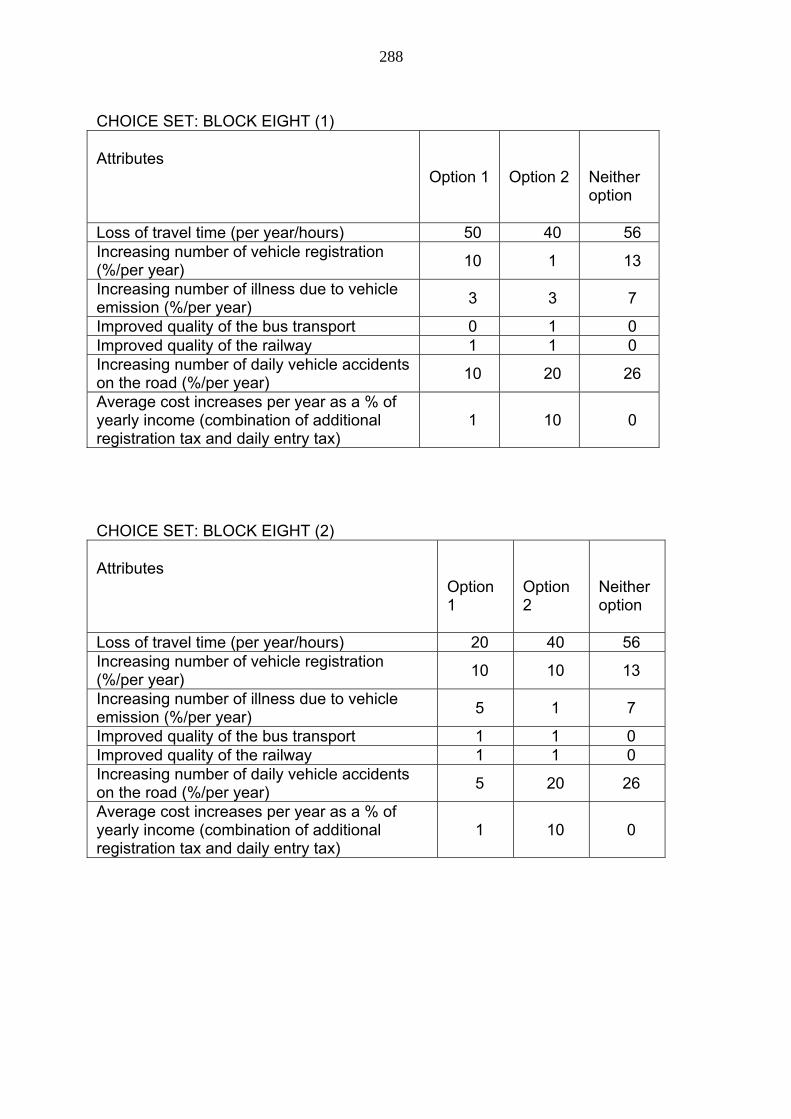
288
CHOICE SET: BLOCK EIGHT (1) Attributes
Option 1
Option 2
Neither option
Loss of travel time (per year/hours) 50 40 56 Increasing number of vehicle registration (%/per year)
10 1 13
Increasing number of illness due to vehicle emission (%/per year)
3 3 7
Improved quality of the bus transport 0 1 0 Improved quality of the railway 1 1 0 Increasing number of daily vehicle accidents on the road (%/per year)
10 20 26
Average cost increases per year as a % of yearly income (combination of additional registration tax and daily entry tax)
1 10 0
CHOICE SET: BLOCK EIGHT (2) Attributes
Option 1
Option 2
Neither option
Loss of travel time (per year/hours) 20 40 56 Increasing number of vehicle registration (%/per year)
10 10 13
Increasing number of illness due to vehicle emission (%/per year)
5 1 7
Improved quality of the bus transport 1 1 0 Improved quality of the railway 1 1 0 Increasing number of daily vehicle accidents on the road (%/per year)
5 20 26
Average cost increases per year as a % of yearly income (combination of additional registration tax and daily entry tax)
1 10 0
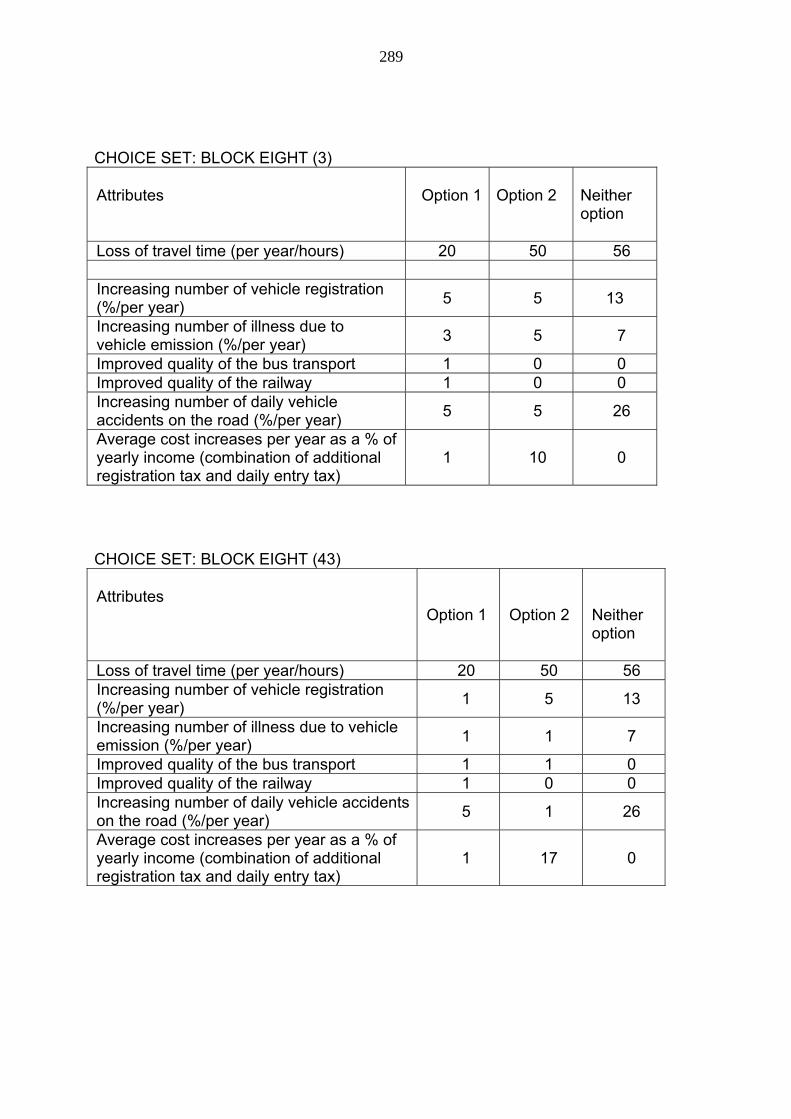
289
CHOICE SET: BLOCK EIGHT (3) Attributes Option 1
Option 2
Neither option
Loss of travel time (per year/hours) 20 50 56
Increasing number of vehicle registration (%/per year)
5 5 13
Increasing number of illness due to vehicle emission (%/per year)
3 5 7
Improved quality of the bus transport 1 0 0 Improved quality of the railway 1 0 0 Increasing number of daily vehicle accidents on the road (%/per year)
5 5 26
Average cost increases per year as a % of yearly income (combination of additional registration tax and daily entry tax)
1 10 0
CHOICE SET: BLOCK EIGHT (43) Attributes
Option 1
Option 2
Neither option
Loss of travel time (per year/hours) 20 50 56 Increasing number of vehicle registration (%/per year)
1 5 13
Increasing number of illness due to vehicle emission (%/per year)
1 1 7
Improved quality of the bus transport 1 1 0 Improved quality of the railway 1 0 0 Increasing number of daily vehicle accidents on the road (%/per year)
5 1 26
Average cost increases per year as a % of yearly income (combination of additional registration tax and daily entry tax)
1 17 0
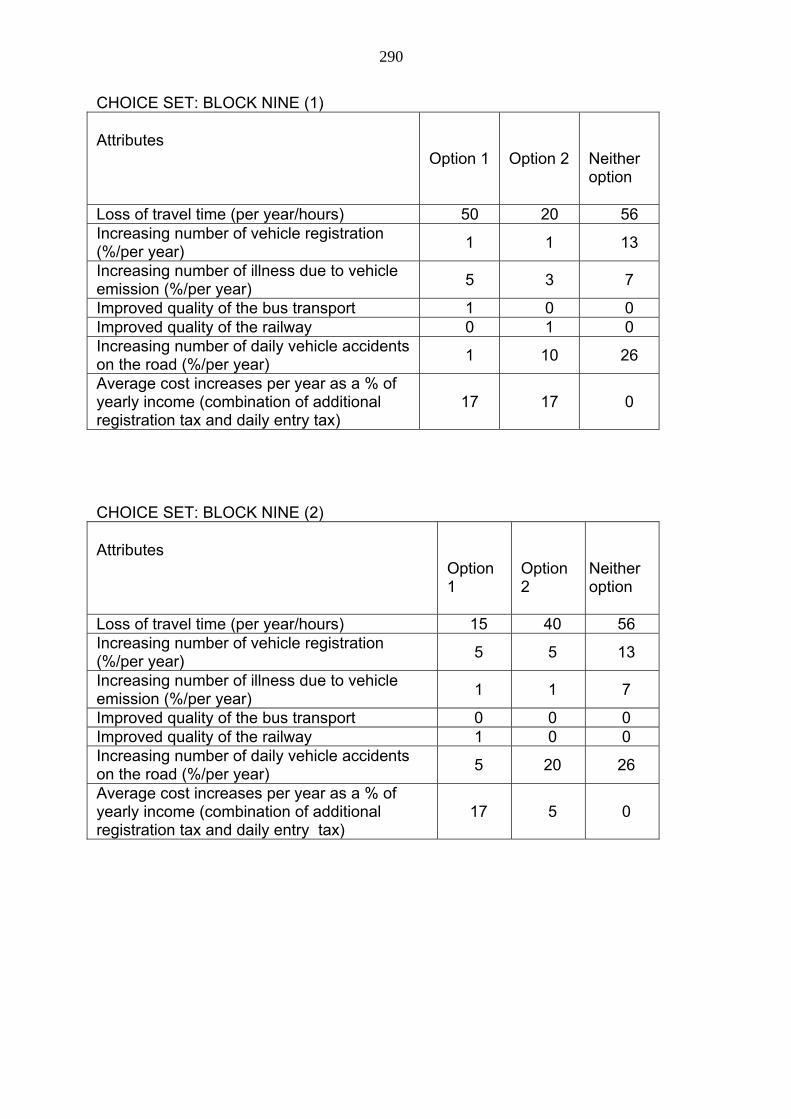
290
CHOICE SET: BLOCK NINE (1) Attributes
Option 1
Option 2
Neither option
Loss of travel time (per year/hours) 50 20 56 Increasing number of vehicle registration (%/per year)
1 1 13
Increasing number of illness due to vehicle emission (%/per year)
5 3 7
Improved quality of the bus transport 1 0 0 Improved quality of the railway 0 1 0 Increasing number of daily vehicle accidents on the road (%/per year)
1 10 26
Average cost increases per year as a % of yearly income (combination of additional registration tax and daily entry tax)
17 17 0
CHOICE SET: BLOCK NINE (2) Attributes
Option 1
Option 2
Neither option
Loss of travel time (per year/hours) 15 40 56 Increasing number of vehicle registration (%/per year)
5 5 13
Increasing number of illness due to vehicle emission (%/per year)
1 1 7
Improved quality of the bus transport 0 0 0 Improved quality of the railway 1 0 0 Increasing number of daily vehicle accidents on the road (%/per year)
5 20 26
Average cost increases per year as a % of yearly income (combination of additional registration tax and daily entry tax)
17 5 0
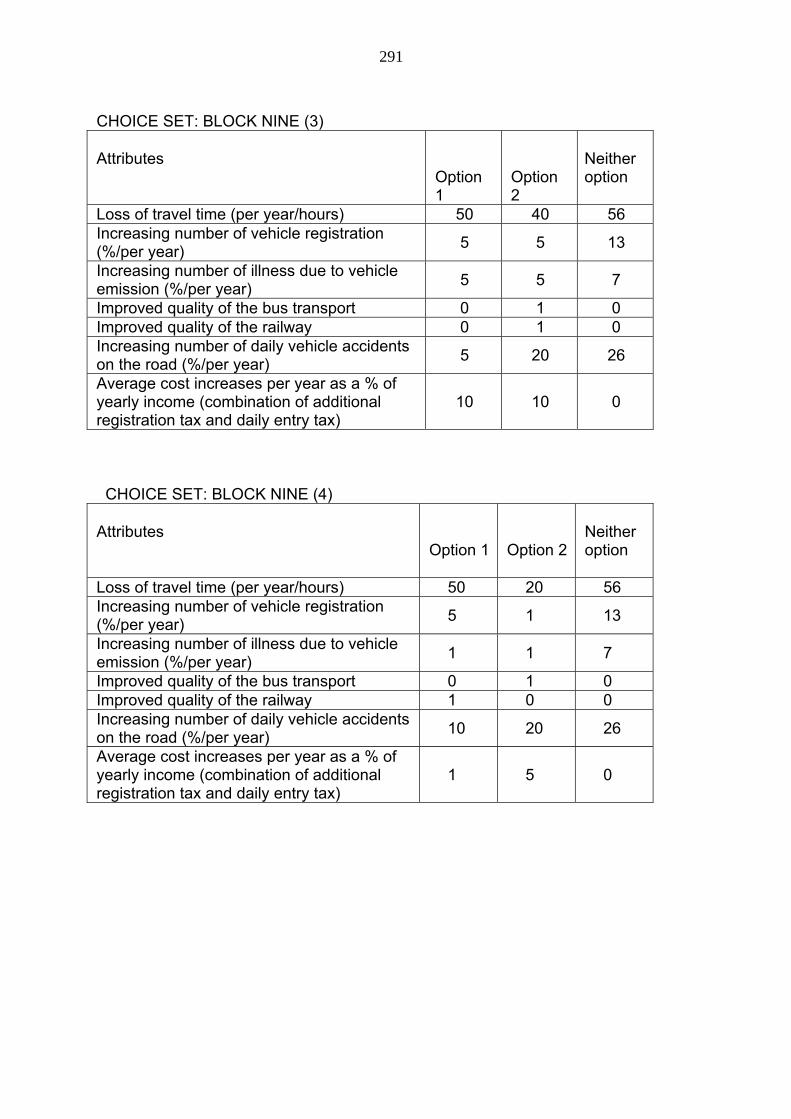
291
CHOICE SET: BLOCK NINE (3) Attributes
Option 1
Option 2
Neither option
Loss of travel time (per year/hours) 50 40 56 Increasing number of vehicle registration (%/per year)
5 5 13
Increasing number of illness due to vehicle emission (%/per year)
5 5 7
Improved quality of the bus transport 0 1 0 Improved quality of the railway 0 1 0 Increasing number of daily vehicle accidents on the road (%/per year)
5 20 26
Average cost increases per year as a % of yearly income (combination of additional registration tax and daily entry tax)
10 10 0
CHOICE SET: BLOCK NINE (4) Attributes
Option 1
Option 2
Neither option
Loss of travel time (per year/hours) 50 20 56 Increasing number of vehicle registration (%/per year)
5 1 13
Increasing number of illness due to vehicle emission (%/per year)
1 1 7
Improved quality of the bus transport 0 1 0 Improved quality of the railway 1 0 0 Increasing number of daily vehicle accidents on the road (%/per year)
10 20 26
Average cost increases per year as a % of yearly income (combination of additional registration tax and daily entry tax)
1 5 0

292
Appendix 5.4: final survey: English version
This survey is part of a university research project being carried out by Jeremy Webb a PhD student at The Queensland University of Technology in Brisbane Australia. The research is concerned with how urban transport systems develop in large urban areas and is designed to examine way of improving the future design of traffic systems. The survey is not in any way connected with any government authorities in Australia or Indonesia and is wholly funded by the Queensland University of Technology in Australia. The questionnaire is confidential and your response will only be recorded numerically in the data gathered. Information about yourselves is therefore never revealed to others and is only used in the research to create an overall profile of a representative sample of those who commute to work on a regular basis. Anonymity is assured.
A. Car ownership and use
1. Car ownership. Do you own a car? . Yes No
2. Motorcycle ownership. Do own a motorcycle? Yes No
3 Mode of travel. Please indicate the principal mode of transport most often used for commuting to work. Please note – if you use several different means, indicate the most dominant – by distance – mode. Tick only one box.
Own car............................................................................................ Taxi.................................................................................................. Non owned car (car sharing etc)...................................................... Bicycle............................................................................................. Motorcycle........................................................................................ Light motorised (bima/tuktuk etc)...................................................... Bus................................................................................................... Train................................................................................................
Walk.............................................................................................

293
4. Travel time. Based on the above method of travel please indicate the length of time (hours and minutes) it takes you on average to commute to work. Please indicate in the box provided the average daily total time for the inward and outward journeys combined.
Combined inward and outward travel time (hrs and mins)..........
Combined distance travelled to and from work............................
hours …….......... minutes................
km .......……....
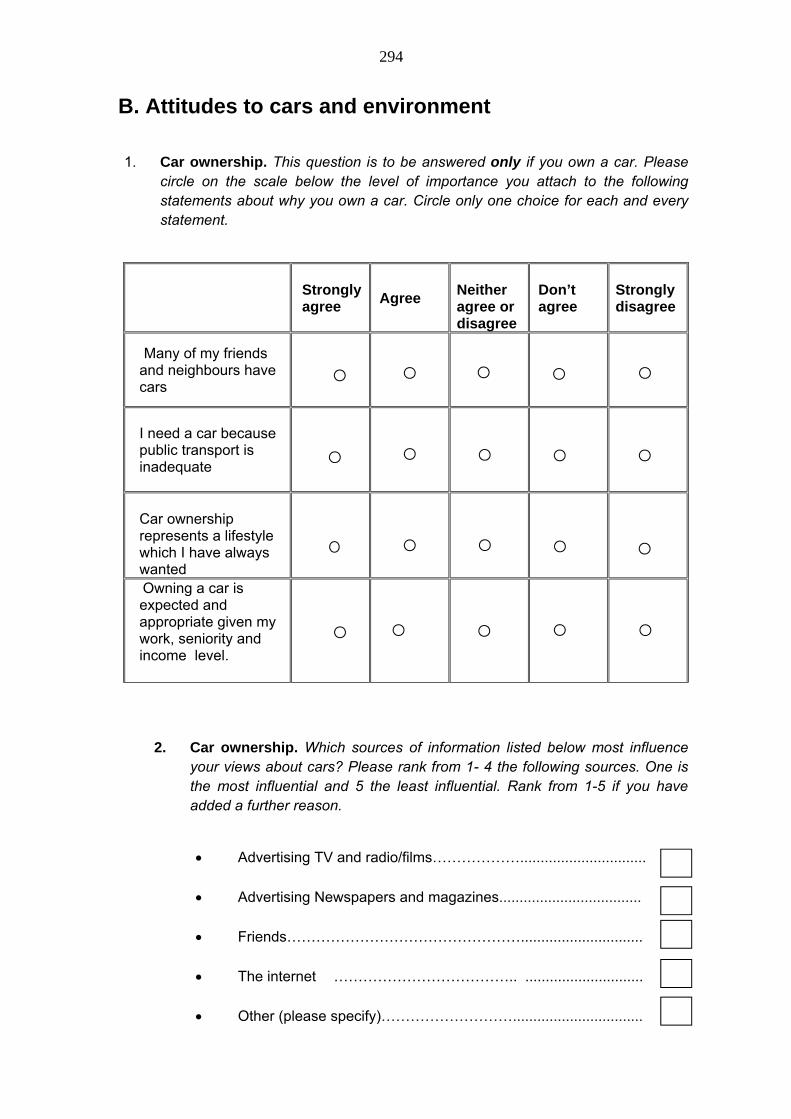
294
B. Attitudes to cars and environment
1. Car ownership. This question is to be answered only if you own a car. Please
circle on the scale below the level of importance you attach to the following statements about why you own a car. Circle only one choice for each and every statement.
Strongly
agree Agree
Neither agree or disagree
Don’t agree
Strongly disagree
Many of my friends and neighbours have cars
I need a car because public transport is inadequate
Car ownership represents a lifestyle which I have always wanted
Owning a car is expected and appropriate given my work, seniority and income level.
2. Car ownership. Which sources of information listed below most influence
your views about cars? Please rank from 1- 4 the following sources. One is the most influential and 5 the least influential. Rank from 1-5 if you have added a further reason.
Advertising TV and radio/films………………............................... Advertising Newspapers and magazines...................................
Friends………………………………………….............................. The internet ……………………………….. ............................. Other (please specify)………………………................................
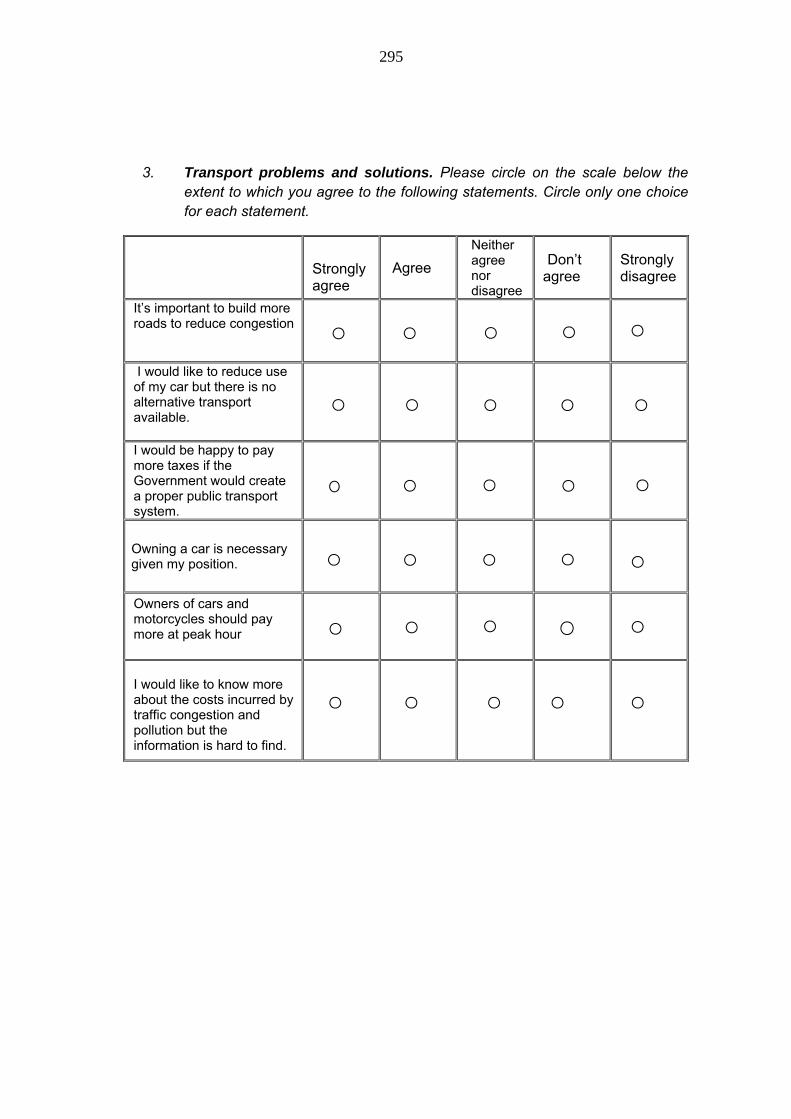
295
3. Transport problems and solutions. Please circle on the scale below the
extent to which you agree to the following statements. Circle only one choice for each statement.
Strongly agree
Agree
Neither agree nor disagree
Don’t agree
Strongly disagree
It’s important to build more roads to reduce congestion
I would like to reduce use of my car but there is no alternative transport available.
I would be happy to pay more taxes if the Government would create a proper public transport system.
Owning a car is necessary given my position.
Owners of cars and motorcycles should pay more at peak hour
I would like to know more about the costs incurred by traffic congestion and pollution but the information is hard to find.

296
C. Attitudes to environmental issues 1. Personal issues. Please rank from 1- 8 the level of importance of the following issues to you personally. One is the most influential and 8 the least influential. Rank from 1-9 if you have added a further reason.
Education.......................................................................................... Health...............................................................................................
Personal financial concerns............................................................ Environment....................................................................................
Urban quality of life.........................................................................
Corruption...................................................................................... Poverty reduction..........................................................................
Economic growth............................................................................ Other. Name of other issue.....................
12. Environmental attitudes. Please rank the following issues by placing a number from 1-5 in the boxes provided below or 1-6 if you supply another reason. Climate change………………………….....................................................
Air pollution……………………………….................................................... Traffic congestion………………………...................................................... Degradation/destruction of fauna/flora………........................................... Natural disasters (floods, droughts etc…………........................................
Other(s). Please name other issue…………………………................................
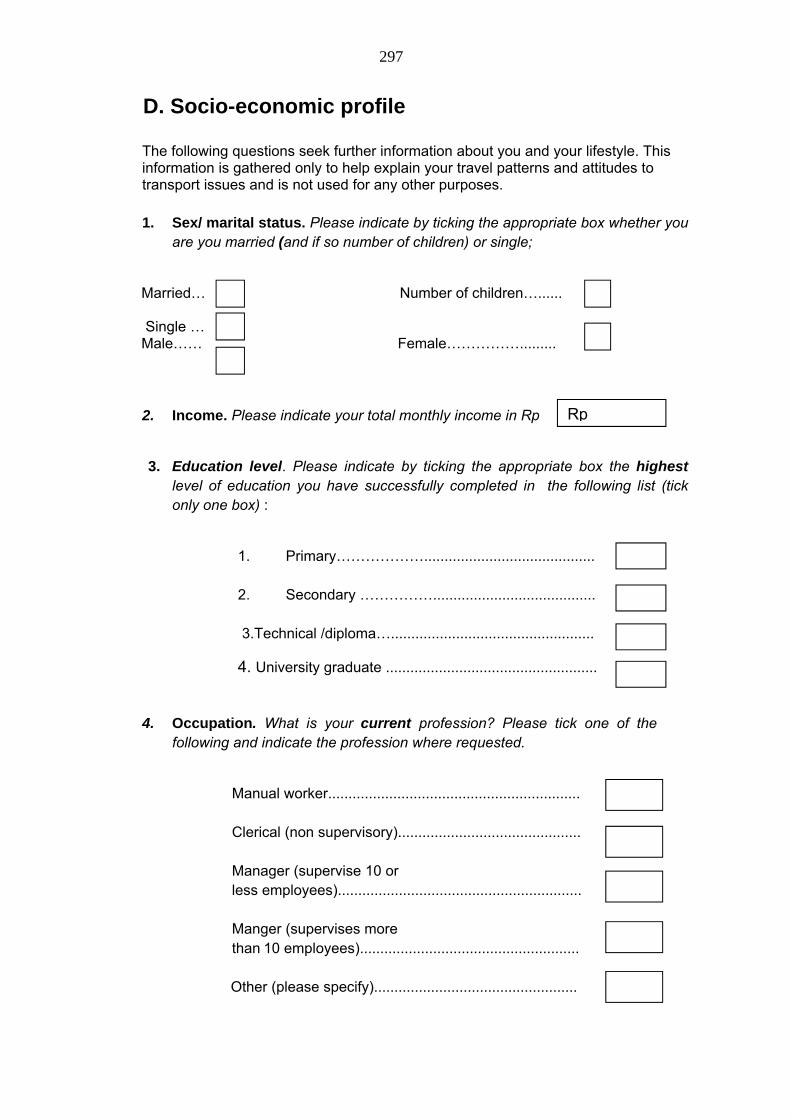
297
D. Socio-economic profile
The following questions seek further information about you and your lifestyle. This information is gathered only to help explain your travel patterns and attitudes to transport issues and is not used for any other purposes. 1. Sex/ marital status. Please indicate by ticking the appropriate box whether you
are you married (and if so number of children) or single;
Married… Number of children…...... Single … Male…… Female……………......... 2. Income. Please indicate your total monthly income in Rp
3. Education level. Please indicate by ticking the appropriate box the highest
level of education you have successfully completed in the following list (tick only one box) :
1. Primary……………….......................................... 2. Secondary ……………........................................ 3.Technical /diploma…..................................................
4. University graduate .................................................... 4. Occupation. What is your current profession? Please tick one of the
following and indicate the profession where requested.
Manual worker.............................................................. Clerical (non supervisory)............................................. Manager (supervise 10 or less employees)............................................................ Manger (supervises more than 10 employees)......................................................
Other (please specify)..................................................
Rp
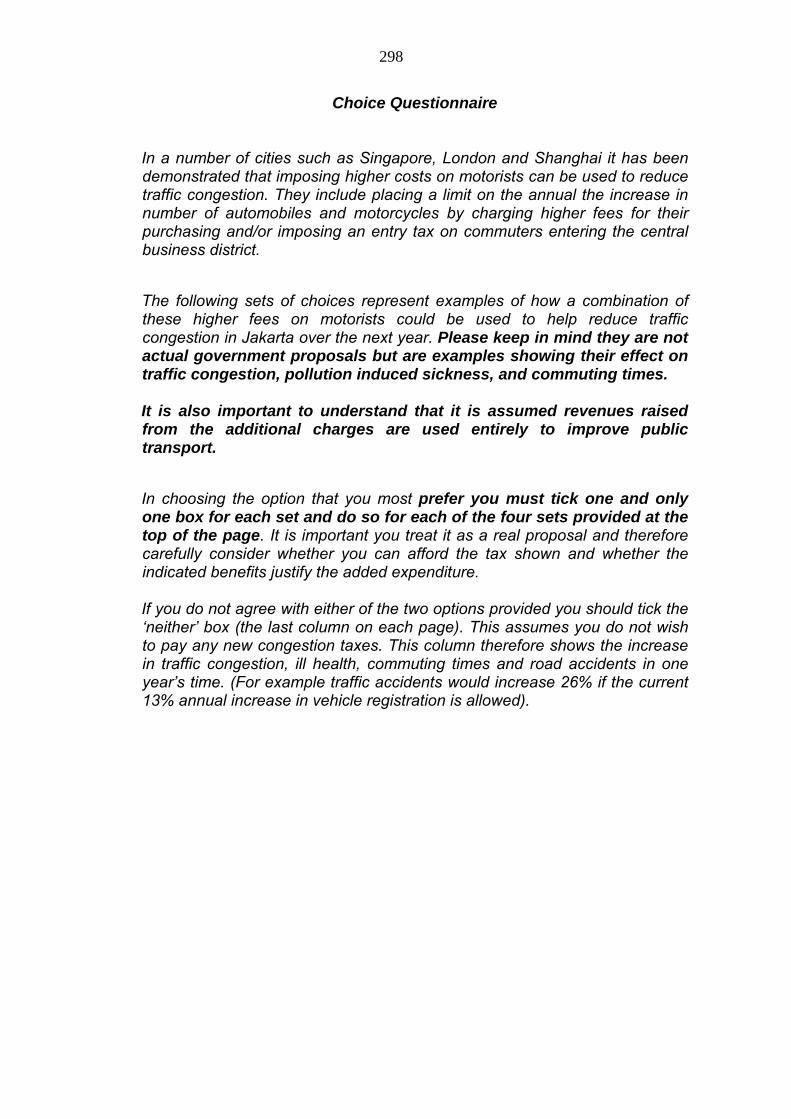
298
Choice Questionnaire In a number of cities such as Singapore, London and Shanghai it has been demonstrated that imposing higher costs on motorists can be used to reduce traffic congestion. They include placing a limit on the annual the increase in number of automobiles and motorcycles by charging higher fees for their purchasing and/or imposing an entry tax on commuters entering the central business district.
The following sets of choices represent examples of how a combination of these higher fees on motorists could be used to help reduce traffic congestion in Jakarta over the next year. Please keep in mind they are not actual government proposals but are examples showing their effect on traffic congestion, pollution induced sickness, and commuting times. It is also important to understand that it is assumed revenues raised from the additional charges are used entirely to improve public transport.
In choosing the option that you most prefer you must tick one and only one box for each set and do so for each of the four sets provided at the top of the page. It is important you treat it as a real proposal and therefore carefully consider whether you can afford the tax shown and whether the indicated benefits justify the added expenditure. If you do not agree with either of the two options provided you should tick the ‘neither’ box (the last column on each page). This assumes you do not wish to pay any new congestion taxes. This column therefore shows the increase in traffic congestion, ill health, commuting times and road accidents in one year’s time. (For example traffic accidents would increase 26% if the current 13% annual increase in vehicle registration is allowed).
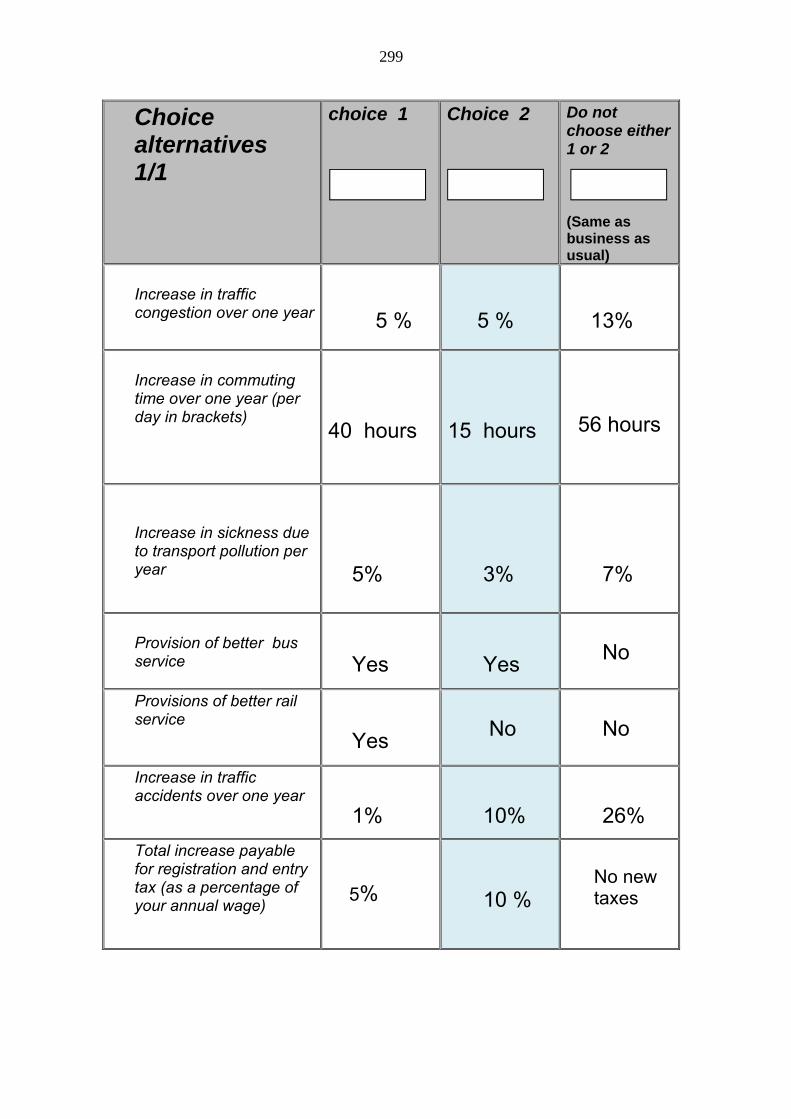
299
Choice alternatives 1/1
choice 1
Choice 2
Do not choose either 1 or 2
(Same as business as usual)
Increase in traffic congestion over one year
5 %
5 %
13%
Increase in commuting time over one year (per day in brackets)
40 hours
15 hours
56 hours
Increase in sickness due to transport pollution per year
5%
3%
7%
Provision of better bus service
Yes
Yes
No
Provisions of better rail service
Yes
No
No
Increase in traffic accidents over one year
1%
10%
26%
Total increase payable for registration and entry tax (as a percentage of your annual wage)
5%
10 %
No new taxes
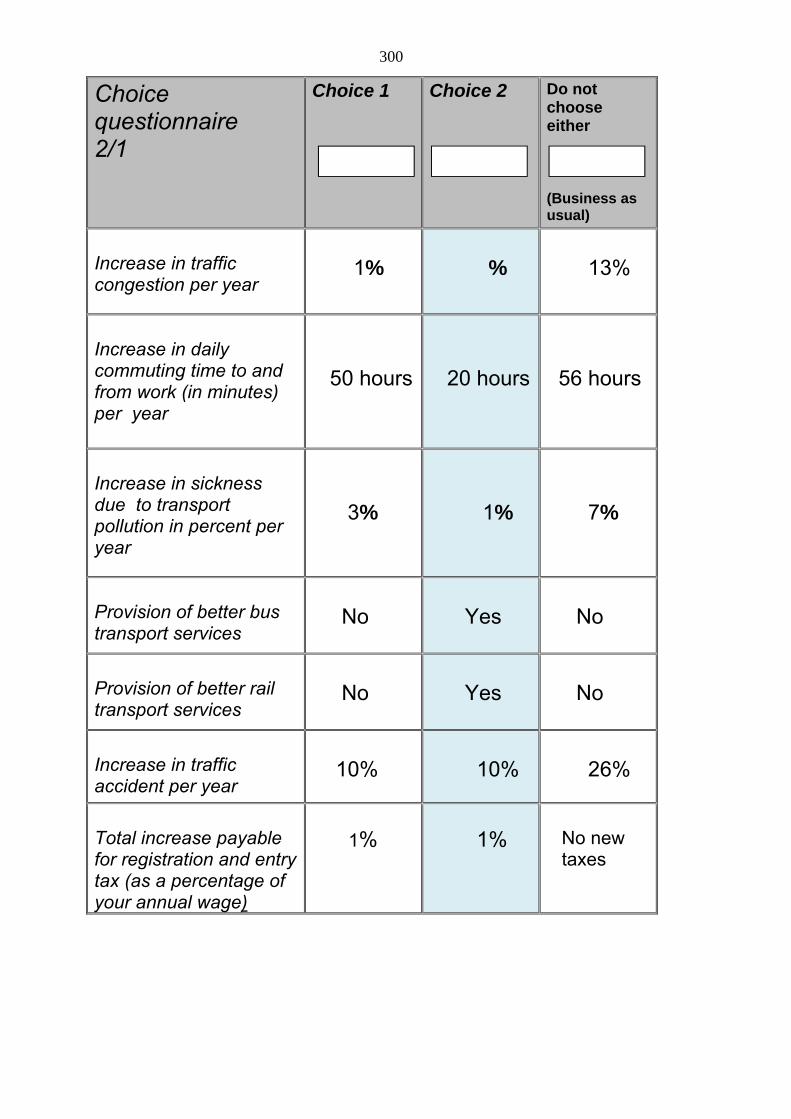
300
Choice questionnaire 2/1
Choice 1
Choice 2
Do not choose either (Business as usual)
Increase in traffic congestion per year
1%
%
13%
Increase in daily commuting time to and from work (in minutes) per year
50 hours
20 hours
56 hours
Increase in sickness due to transport pollution in percent per year
3%
1%
7%
Provision of better bus transport services
No
Yes
No
Provision of better rail transport services
No
Yes
No
Increase in traffic accident per year
10%
10%
26%
Total increase payable for registration and entry tax (as a percentage of your annual wage)
1%
1%
No new taxes
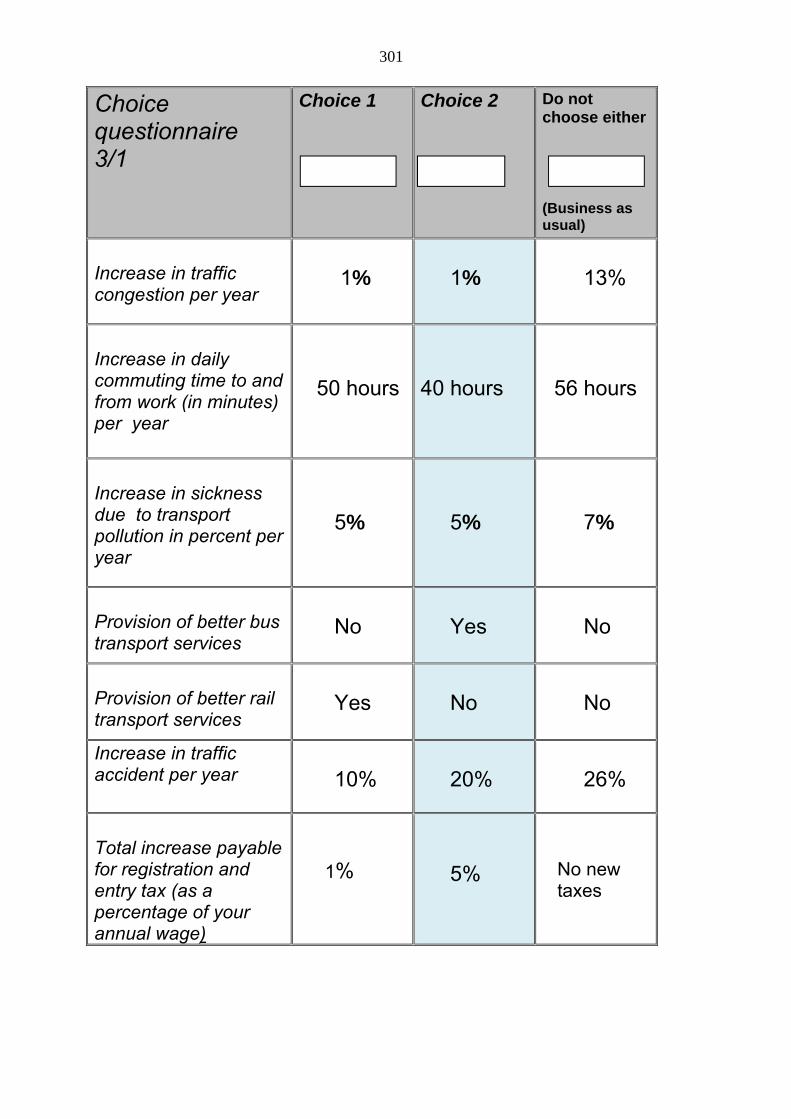
301
Choice questionnaire 3/1
Choice 1
Choice 2
Do not choose either (Business as usual)
Increase in traffic congestion per year
1%
1%
13%
Increase in daily commuting time to and from work (in minutes) per year
50 hours
40 hours
56 hours
Increase in sickness due to transport pollution in percent per year
5%
5%
7%
Provision of better bus transport services
No
Yes
No
Provision of better rail transport services
Yes
No
No
Increase in traffic accident per year
10%
20%
26%
Total increase payable for registration and entry tax (as a percentage of your annual wage)
1%
5%
No new taxes
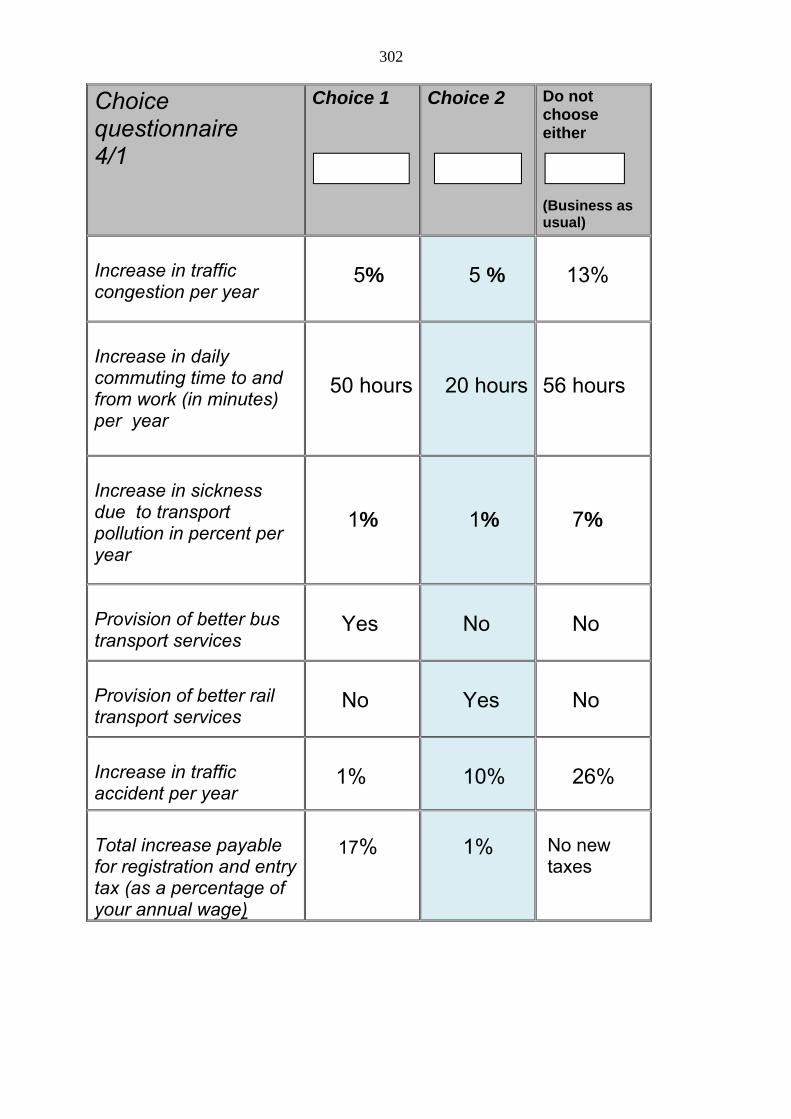
302
Choice questionnaire 4/1
Choice 1
Choice 2
Do not choose either (Business as usual)
Increase in traffic congestion per year
5%
5 %
13%
Increase in daily commuting time to and from work (in minutes) per year
50 hours
20 hours
56 hours
Increase in sickness due to transport pollution in percent per year
1%
1%
7%
Provision of better bus transport services
Yes
No
No
Provision of better rail transport services
No
Yes
No
Increase in traffic accident per year
1%
10%
26%
Total increase payable for registration and entry tax (as a percentage of your annual wage)
17%
1%
No new taxes
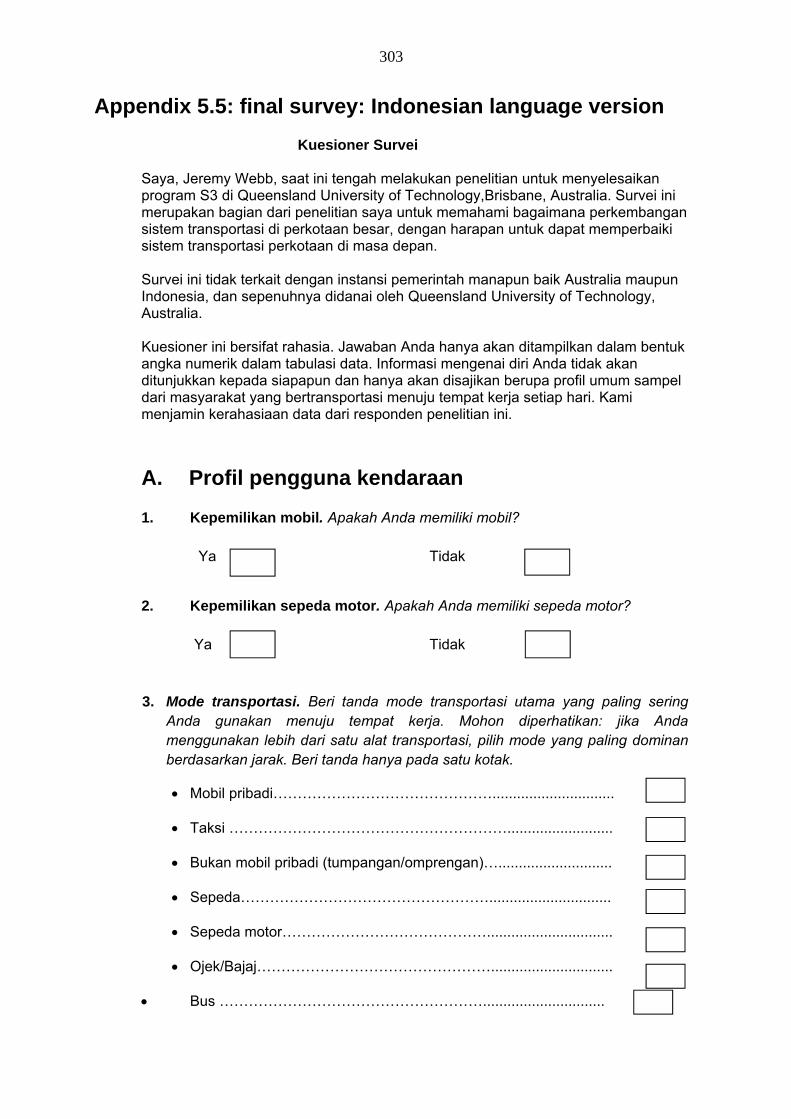
303
Appendix 5.5: final survey: Indonesian language version
Kuesioner Survei Saya, Jeremy Webb, saat ini tengah melakukan penelitian untuk menyelesaikan program S3 di Queensland University of Technology,Brisbane, Australia. Survei ini merupakan bagian dari penelitian saya untuk memahami bagaimana perkembangan sistem transportasi di perkotaan besar, dengan harapan untuk dapat memperbaiki sistem transportasi perkotaan di masa depan. Survei ini tidak terkait dengan instansi pemerintah manapun baik Australia maupun Indonesia, dan sepenuhnya didanai oleh Queensland University of Technology, Australia. Kuesioner ini bersifat rahasia. Jawaban Anda hanya akan ditampilkan dalam bentuk angka numerik dalam tabulasi data. Informasi mengenai diri Anda tidak akan ditunjukkan kepada siapapun dan hanya akan disajikan berupa profil umum sampel dari masyarakat yang bertransportasi menuju tempat kerja setiap hari. Kami menjamin kerahasiaan data dari responden penelitian ini.
A. Profil pengguna kendaraan 1. Kepemilikan mobil. Apakah Anda memiliki mobil? Ya Tidak
2. Kepemilikan sepeda motor. Apakah Anda memiliki sepeda motor? Ya Tidak
3. Mode transportasi. Beri tanda mode transportasi utama yang paling sering
Anda gunakan menuju tempat kerja. Mohon diperhatikan: jika Anda menggunakan lebih dari satu alat transportasi, pilih mode yang paling dominan berdasarkan jarak. Beri tanda hanya pada satu kotak.
Mobil pribadi……………………………………….............................. Taksi ………………………………………………….......................... Bukan mobil pribadi (tumpangan/omprengan)…............................ Sepeda…………………………………………….............................. Sepeda motor……………………………………............................... Ojek/Bajaj…………………………………………..............................
Bus ………………………………………………..............................
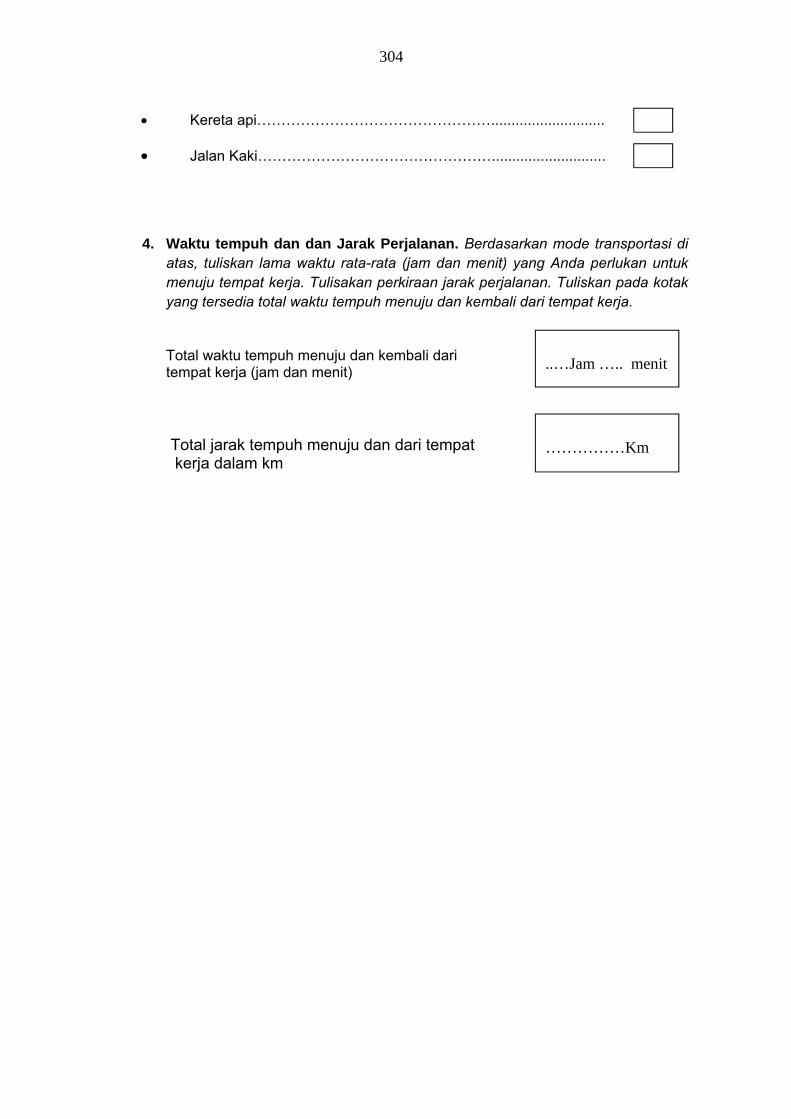
304
Kereta api…………………………………………............................ Jalan Kaki…………………………………………............................
4. Waktu tempuh dan dan Jarak Perjalanan. Berdasarkan mode transportasi di
atas, tuliskan lama waktu rata-rata (jam dan menit) yang Anda perlukan untuk menuju tempat kerja. Tulisakan perkiraan jarak perjalanan. Tuliskan pada kotak yang tersedia total waktu tempuh menuju dan kembali dari tempat kerja.
Total waktu tempuh menuju dan kembali dari tempat kerja (jam dan menit)
Total jarak tempuh menuju dan dari tempat kerja dalam km
..…Jam ….. menit
……………Km
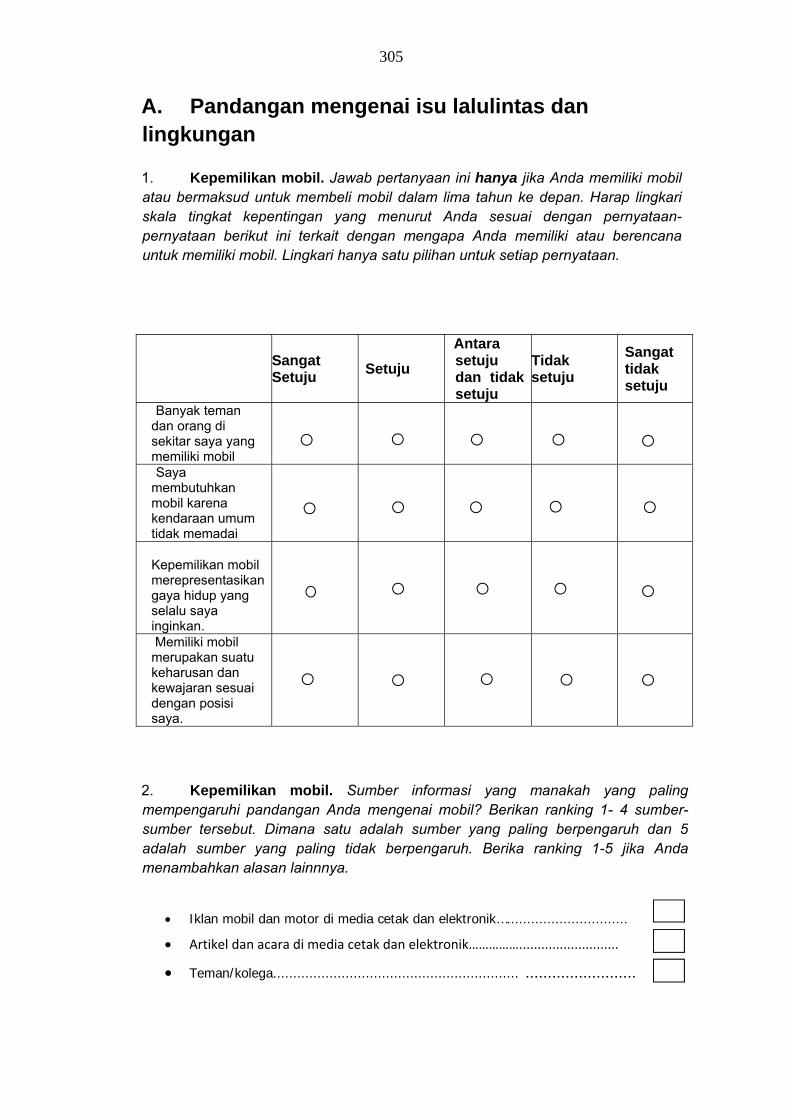
305
A. Pandangan mengenai isu lalulintas dan lingkungan 1. Kepemilikan mobil. Jawab pertanyaan ini hanya jika Anda memiliki mobil atau bermaksud untuk membeli mobil dalam lima tahun ke depan. Harap lingkari skala tingkat kepentingan yang menurut Anda sesuai dengan pernyataan-pernyataan berikut ini terkait dengan mengapa Anda memiliki atau berencana untuk memiliki mobil. Lingkari hanya satu pilihan untuk setiap pernyataan.
Sangat Setuju
Setuju
Antara setuju dan tidak setuju
Tidak setuju
Sangat tidak setuju
Banyak teman dan orang di sekitar saya yang memiliki mobil
Saya membutuhkan mobil karena kendaraan umum tidak memadai
Kepemilikan mobil merepresentasikan gaya hidup yang selalu saya inginkan.
Memiliki mobil merupakan suatu keharusan dan kewajaran sesuai dengan posisi saya.
2. Kepemilikan mobil. Sumber informasi yang manakah yang paling mempengaruhi pandangan Anda mengenai mobil? Berikan ranking 1- 4 sumber-sumber tersebut. Dimana satu adalah sumber yang paling berpengaruh dan 5 adalah sumber yang paling tidak berpengaruh. Berika ranking 1-5 jika Anda menambahkan alasan lainnnya.
Iklan mobil dan motor di media cetak dan elektronik…..............................
Artikel dan acara di media cetak dan elektronik……………...........................
Teman/kolega............................................................. .........................
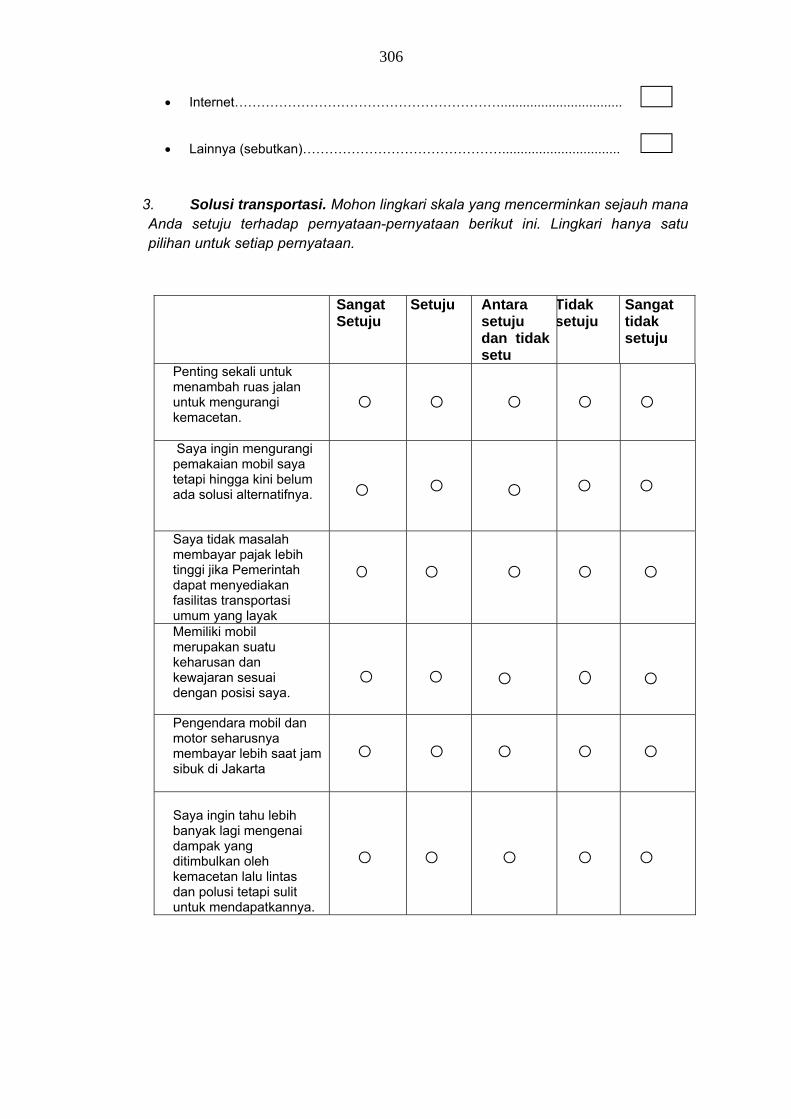
306
Internet…………………………………………………….................................
Lainnya (sebutkan)………………………………………................................
3. Solusi transportasi. Mohon lingkari skala yang mencerminkan sejauh mana Anda setuju terhadap pernyataan-pernyataan berikut ini. Lingkari hanya satu pilihan untuk setiap pernyataan.
Sangat Setuju
Setuju Antara setuju dan tidak setu
Tidak setuju
Sangat tidak setuju
Penting sekali untuk menambah ruas jalan untuk mengurangi kemacetan.
Saya ingin mengurangi pemakaian mobil saya tetapi hingga kini belum ada solusi alternatifnya.
Saya tidak masalah membayar pajak lebih tinggi jika Pemerintah dapat menyediakan fasilitas transportasi umum yang layak
Memiliki mobil merupakan suatu keharusan dan kewajaran sesuai dengan posisi saya.
Pengendara mobil dan motor seharusnya membayar lebih saat jam sibuk di Jakarta
Saya ingin tahu lebih banyak lagi mengenai dampak yang ditimbulkan oleh kemacetan lalu lintas dan polusi tetapi sulit untuk mendapatkannya.
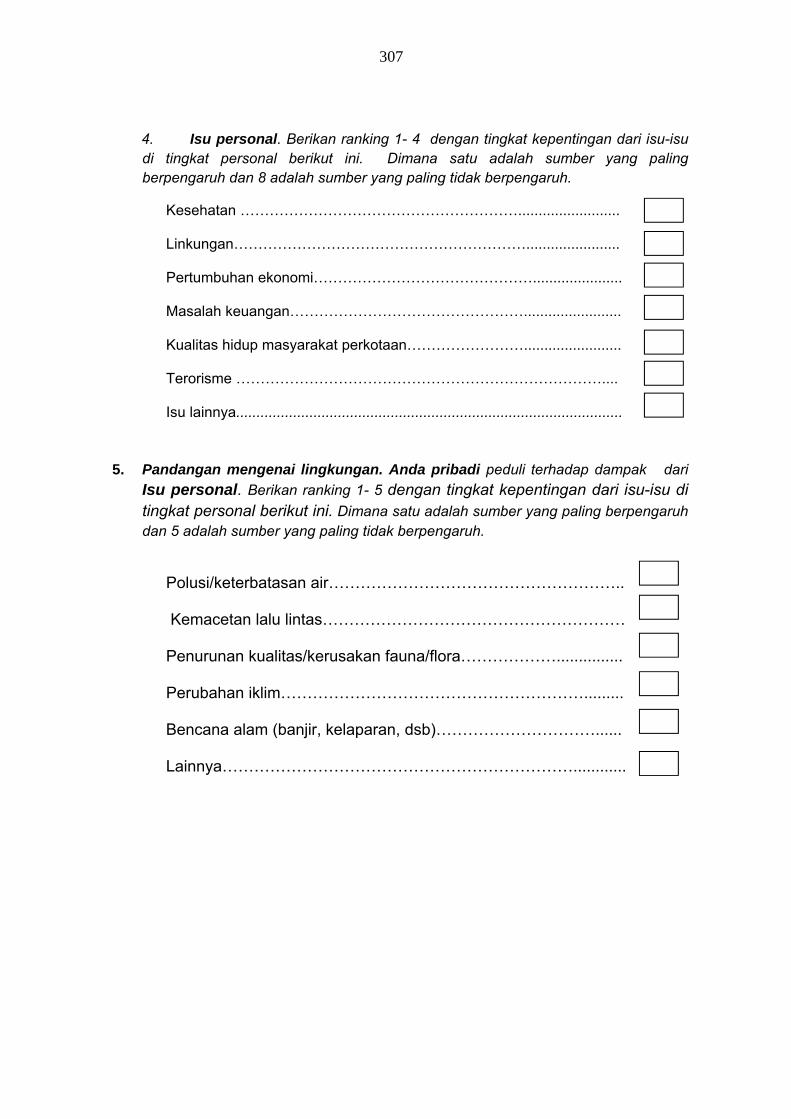
307
4. Isu personal. Berikan ranking 1- 4 dengan tingkat kepentingan dari isu-isu di tingkat personal berikut ini. Dimana satu adalah sumber yang paling berpengaruh dan 8 adalah sumber yang paling tidak berpengaruh.
Kesehatan …………………………………………………......................... Linkungan……………………………………………………....................... Pertumbuhan ekonomi………………………………………...................... Masalah keuangan…………………………………………........................ Kualitas hidup masyarakat perkotaan……………………........................ Terorisme ………………………………………………………………….... Isu lainnya...............................................................................................
5. Pandangan mengenai lingkungan. Anda pribadi peduli terhadap dampak dari
Isu personal. Berikan ranking 1- 5 dengan tingkat kepentingan dari isu-isu di tingkat personal berikut ini. Dimana satu adalah sumber yang paling berpengaruh dan 5 adalah sumber yang paling tidak berpengaruh.
Polusi/keterbatasan air………………………………………………..
Kemacetan lalu lintas………………………………………………… Penurunan kualitas/kerusakan fauna/flora………………............... Perubahan iklim…………………………………………………......... Bencana alam (banjir, kelaparan, dsb)…………………………...... Lainnya…………………………………………………………............
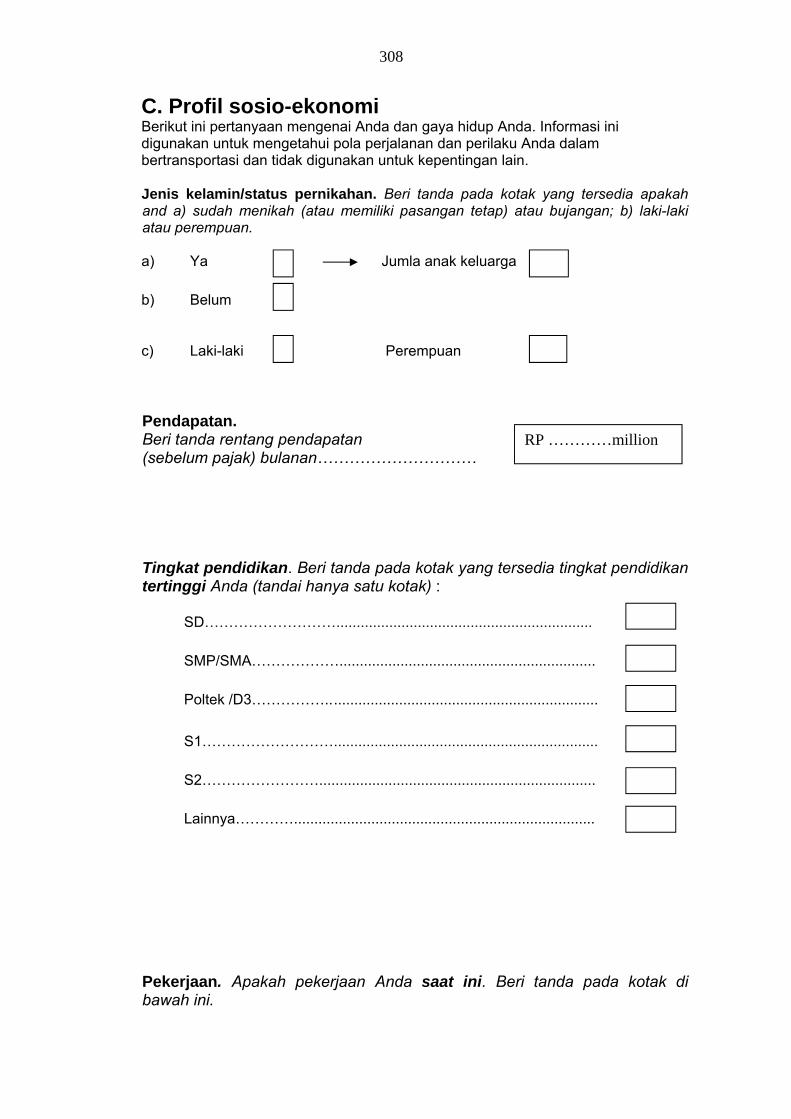
308
C. Profil sosio-ekonomi Berikut ini pertanyaan mengenai Anda dan gaya hidup Anda. Informasi ini digunakan untuk mengetahui pola perjalanan dan perilaku Anda dalam bertransportasi dan tidak digunakan untuk kepentingan lain.
Jenis kelamin/status pernikahan. Beri tanda pada kotak yang tersedia apakah and a) sudah menikah (atau memiliki pasangan tetap) atau bujangan; b) laki-laki atau perempuan. a) Ya Jumla anak keluarga b) Belum
c) Laki-laki Perempuan
Pendapatan. Beri tanda rentang pendapatan (sebelum pajak) bulanan…………………………
Tingkat pendidikan. Beri tanda pada kotak yang tersedia tingkat pendidikan tertinggi Anda (tandai hanya satu kotak) :
SD………………………............................................................... SMP/SMA………………............................................................... Poltek /D3…………….. .................................................................
S1………………………................................................................. S2……………………....................................................................
Lainnya…………..........................................................................
Pekerjaan. Apakah pekerjaan Anda saat ini. Beri tanda pada kotak di bawah ini.
RP …………million
309
Tenaga terampil..........................................................................
Tenaga administrasi (bukan supervisor).....................................
Manajer: (membawahi sampai dengan 10 karyawan)................
Manajer ..(membawahi lebih dari 10 karyawan) .........................
Lainnya (sebutkan)...............................................
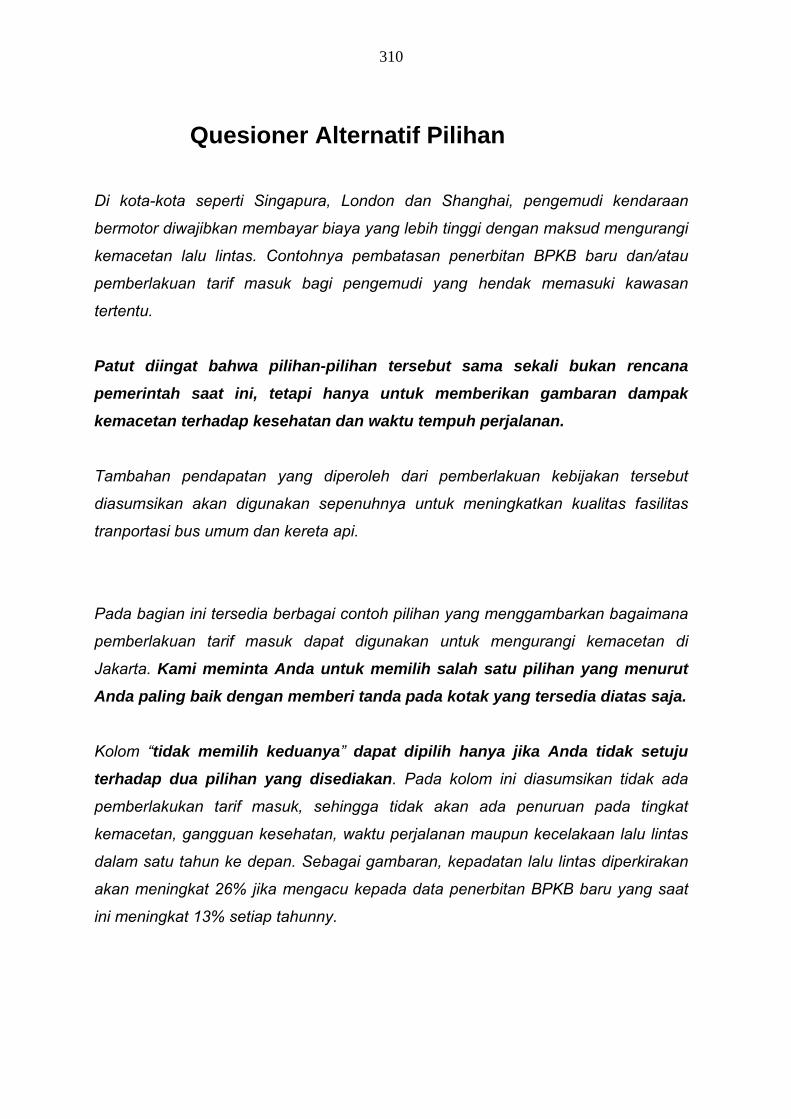
310
Quesioner Alternatif Pilihan
Di kota-kota seperti Singapura, London dan Shanghai, pengemudi kendaraan
bermotor diwajibkan membayar biaya yang lebih tinggi dengan maksud mengurangi
kemacetan lalu lintas. Contohnya pembatasan penerbitan BPKB baru dan/atau
pemberlakuan tarif masuk bagi pengemudi yang hendak memasuki kawasan
tertentu.
Patut diingat bahwa pilihan-pilihan tersebut sama sekali bukan rencana
pemerintah saat ini, tetapi hanya untuk memberikan gambaran dampak
kemacetan terhadap kesehatan dan waktu tempuh perjalanan.
Tambahan pendapatan yang diperoleh dari pemberlakuan kebijakan tersebut
diasumsikan akan digunakan sepenuhnya untuk meningkatkan kualitas fasilitas
tranportasi bus umum dan kereta api.
Pada bagian ini tersedia berbagai contoh pilihan yang menggambarkan bagaimana
pemberlakuan tarif masuk dapat digunakan untuk mengurangi kemacetan di
Jakarta. Kami meminta Anda untuk memilih salah satu pilihan yang menurut
Anda paling baik dengan memberi tanda pada kotak yang tersedia diatas saja.
Kolom “tidak memilih keduanya” dapat dipilih hanya jika Anda tidak setuju
terhadap dua pilihan yang disediakan. Pada kolom ini diasumsikan tidak ada
pemberlakukan tarif masuk, sehingga tidak akan ada penuruan pada tingkat
kemacetan, gangguan kesehatan, waktu perjalanan maupun kecelakaan lalu lintas
dalam satu tahun ke depan. Sebagai gambaran, kepadatan lalu lintas diperkirakan
akan meningkat 26% jika mengacu kepada data penerbitan BPKB baru yang saat
ini meningkat 13% setiap tahunny.
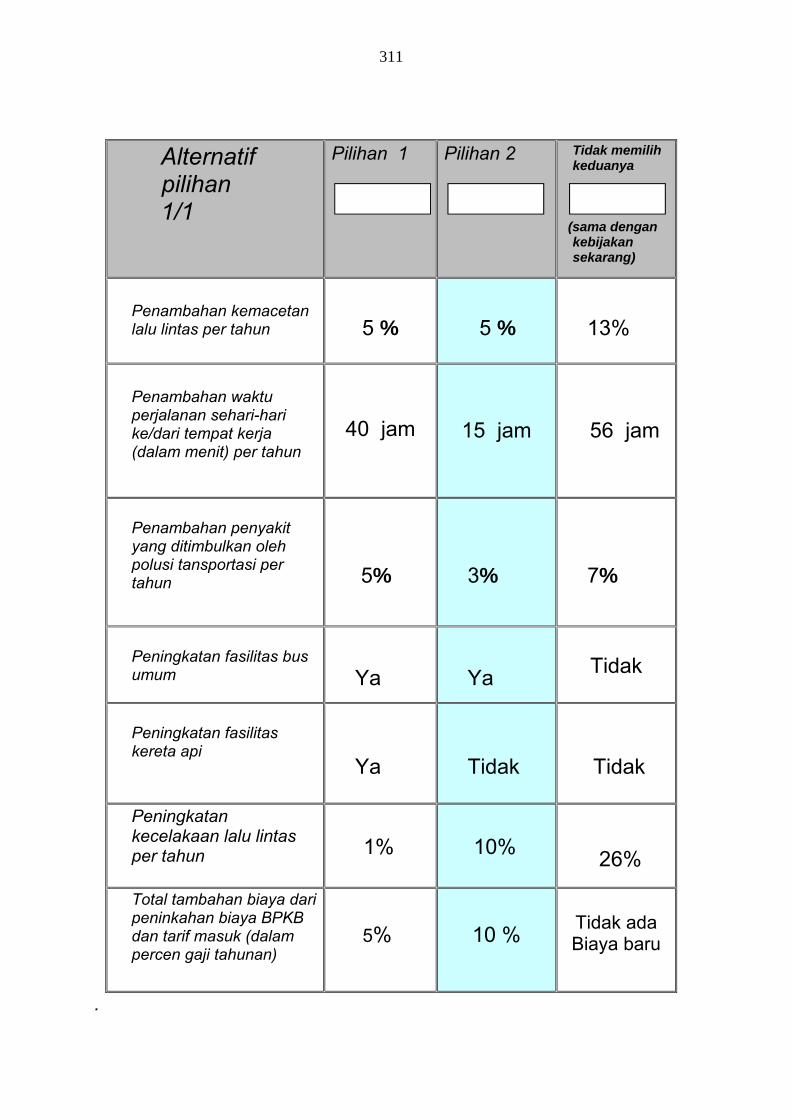
311
.
Alternatif pilihan 1/1
Pilihan 1
Pilihan 2
Tidak memilih keduanya
(sama dengan kebijakan sekarang)
Penambahan kemacetan lalu lintas per tahun
5 %
5 %
13%
Penambahan waktu perjalanan sehari-hari ke/dari tempat kerja (dalam menit) per tahun
40 jam
15 jam
56 jam
Penambahan penyakit yang ditimbulkan oleh polusi tansportasi per tahun
5%
3%
7%
Peningkatan fasilitas bus umum
Ya
Ya
Tidak
Peningkatan fasilitas kereta api
Ya
Tidak
Tidak
Peningkatan kecelakaan lalu lintas per tahun
1% 10%
26%
Total tambahan biaya dari peninkahan biaya BPKB dan tarif masuk (dalam percen gaji tahunan)
5%
10 %
Tidak ada Biaya baru
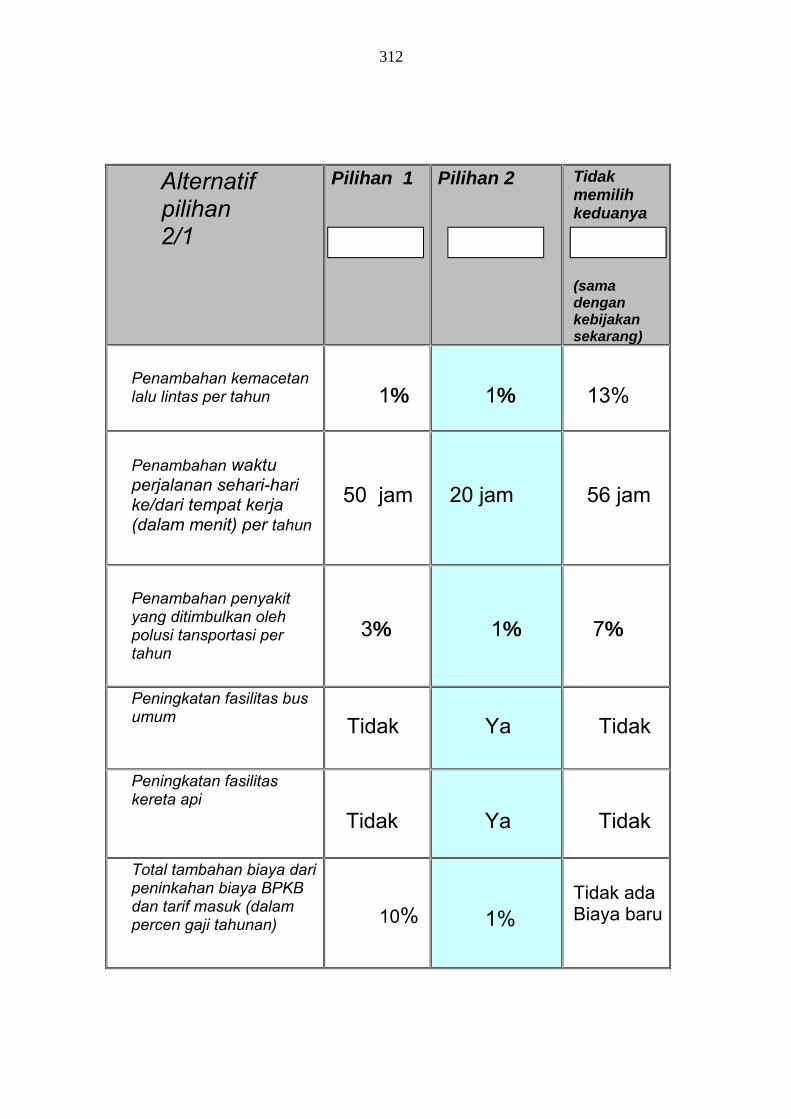
312
Alternatif pilihan 2/1
Pilihan 1
Pilihan 2
Tidak memilih keduanya (sama dengan kebijakan sekarang)
Penambahan kemacetan lalu lintas per tahun
1%
1%
13%
Penambahan waktu perjalanan sehari-hari ke/dari tempat kerja (dalam menit) per tahun
50 jam
20 jam
56 jam
Penambahan penyakit yang ditimbulkan oleh polusi tansportasi per tahun
3%
1%
7%
Peningkatan fasilitas bus umum
Tidak
Ya
Tidak
Peningkatan fasilitas kereta api
Tidak
Ya
Tidak
Total tambahan biaya dari peninkahan biaya BPKB dan tarif masuk (dalam percen gaji tahunan)
10%
1%
Tidak ada Biaya baru
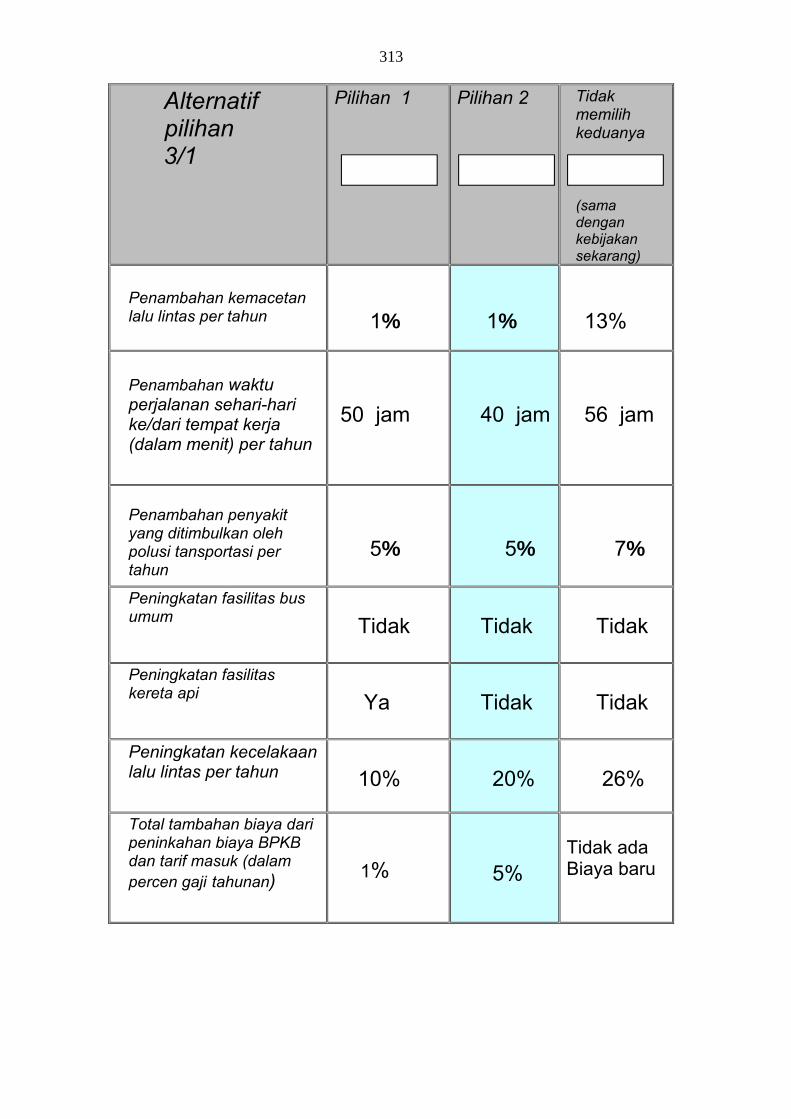
313
Alternatif pilihan 3/1
Pilihan 1
Pilihan 2
Tidak memilih keduanya (sama dengan kebijakan sekarang)
Penambahan kemacetan lalu lintas per tahun
1%
1%
13%
Penambahan waktu perjalanan sehari-hari ke/dari tempat kerja (dalam menit) per tahun
50 jam
40 jam
56 jam
Penambahan penyakit yang ditimbulkan oleh polusi tansportasi per tahun
5%
5%
7%
Peningkatan fasilitas bus umum
Tidak
Tidak
Tidak
Peningkatan fasilitas kereta api
Ya
Tidak
Tidak
Peningkatan kecelakaan lalu lintas per tahun
10%
20%
26%
Total tambahan biaya dari peninkahan biaya BPKB dan tarif masuk (dalam percen gaji tahunan)
1%
5%
Tidak ada Biaya baru
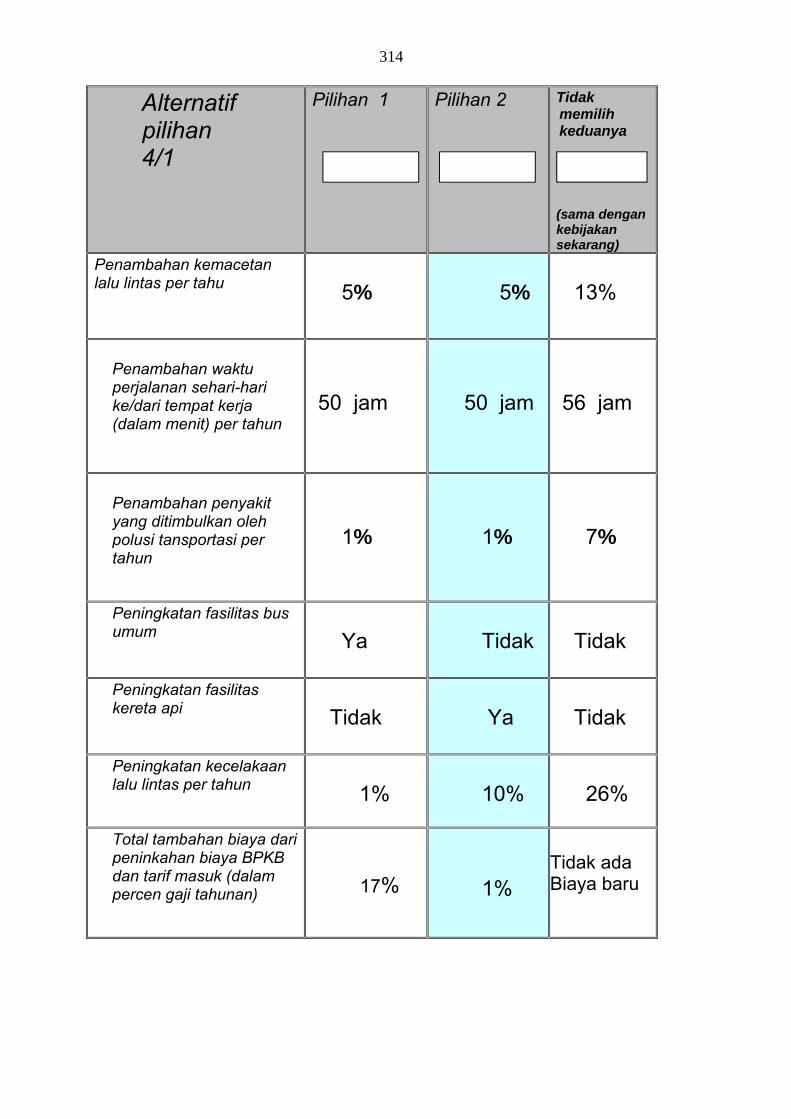
314
Alternatif pilihan 4/1
Pilihan 1
Pilihan 2
Tidak memilih keduanya (sama dengan kebijakan sekarang)
Penambahan kemacetan lalu lintas per tahu
5%
5%
13%
Penambahan waktu perjalanan sehari-hari ke/dari tempat kerja (dalam menit) per tahun
50 jam
50 jam
56 jam
Penambahan penyakit yang ditimbulkan oleh polusi tansportasi per tahun
1%
1%
7%
Peningkatan fasilitas bus umum
Ya
Tidak
Tidak
Peningkatan fasilitas kereta api
Tidak
Ya
Tidak
Peningkatan kecelakaan lalu lintas per tahun
1%
10%
26%
Total tambahan biaya dari peninkahan biaya BPKB dan tarif masuk (dalam percen gaji tahunan)
17%
1%
Tidak ada Biaya baru
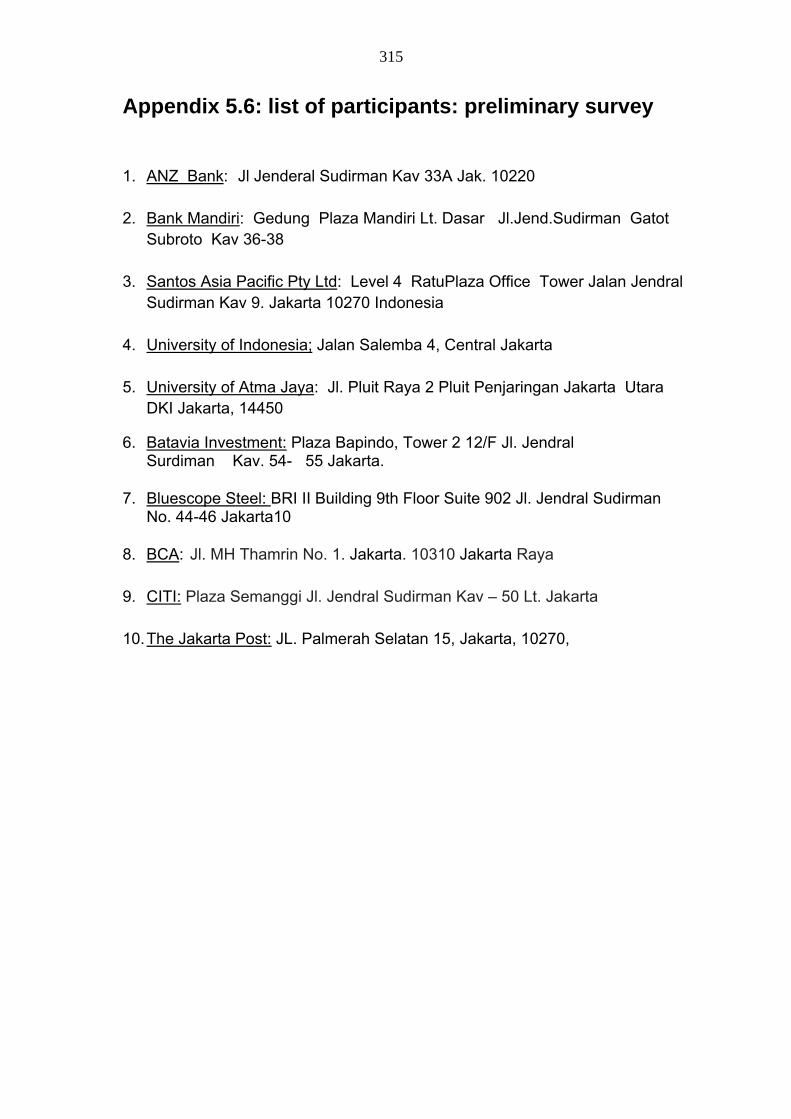
315
Appendix 5.6: list of participants: preliminary survey
1. ANZ Bank: Jl Jenderal Sudirman Kav 33A Jak. 10220
2. Bank Mandiri: Gedung Plaza Mandiri Lt. Dasar Jl.Jend.Sudirman Gatot
Subroto Kav 36-38
3. Santos Asia Pacific Pty Ltd: Level 4 RatuPlaza Office Tower Jalan Jendral Sudirman Kav 9. Jakarta 10270 Indonesia
4. University of Indonesia; Jalan Salemba 4, Central Jakarta
5. University of Atma Jaya: Jl. Pluit Raya 2 Pluit Penjaringan Jakarta Utara DKI Jakarta, 14450
6. Batavia Investment: Plaza Bapindo, Tower 2 12/F Jl. Jendral Surdiman Kav. 54- 55 Jakarta.
7. Bluescope Steel: BRI II Building 9th Floor Suite 902 Jl. Jendral Sudirman No. 44-46 Jakarta10
8. BCA: Jl. MH Thamrin No. 1. Jakarta. 10310 Jakarta Raya
9. CITI: Plaza Semanggi Jl. Jendral Sudirman Kav – 50 Lt. Jakarta
10. The Jakarta Post: JL. Palmerah Selatan 15, Jakarta, 10270,
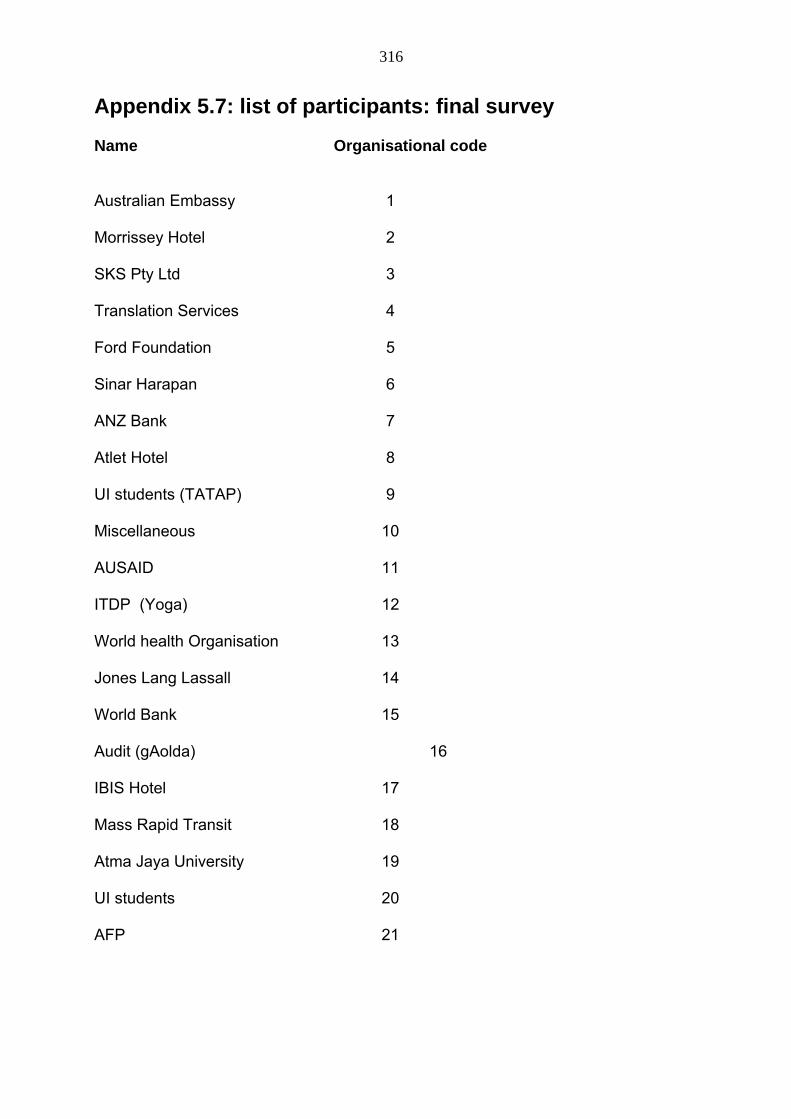
316
Appendix 5.7: list of participants: final survey Name Organisational code
Australian Embassy 1
Morrissey Hotel 2
SKS Pty Ltd 3
Translation Services 4
Ford Foundation 5
Sinar Harapan 6
ANZ Bank 7
Atlet Hotel 8
UI students (TATAP) 9
Miscellaneous 10
AUSAID 11
ITDP (Yoga) 12
World health Organisation 13
Jones Lang Lassall 14
World Bank 15
Audit (gAolda) 16
IBIS Hotel 17
Mass Rapid Transit 18
Atma Jaya University 19
UI students 20
AFP 21