jeane thorman elementary school school accountability ... · jeane thorman elementary school school...
TRANSCRIPT

2015-16 School Accountability Report Card for Jeane Thorman Elementary School Page 1 of 13
Jeane Thorman Elementary School
School Accountability Report Card
Reported Using Data from the 2015-16 School Year
Published During 2016-17
By February 1 of each year, every school in California is required by state law to publish a School Accountability Report Card (SARC). The SARC contains information about the condition and performance of each California public school. Under the Local Control Funding Formula (LCFF) all local educational agencies (LEAs) are required to prepare a Local Control and Accountability Plan (LCAP), which describes how they intend to meet annual school-specific goals for all pupils, with specific activities to address state and local priorities. Additionally, data reported in an LCAP is to be consistent with data reported in the SARC. • For more information about SARC requirements, see the California Department of Education (CDE) SARC Web page at
http://www.cde.ca.gov/ta/ac/sa/. • For more information about the LCFF or LCAP, see the CDE LCFF Web page at http://www.cde.ca.gov/fg/aa/lc/. • For additional information about the school, parents/guardians and community members should contact the school principal or
the district office. DataQuest DataQuest is an online data tool located on the CDE DataQuest Web page at http://dq.cde.ca.gov/dataquest/ that contains additional information about this school and comparisons of the school to the district and the county. Specifically, DataQuest is a dynamic system that provides reports for accountability (e.g., test data, enrollment, high school graduates, dropouts, course enrollments, staffing, and data regarding English learners). Internet Access Internet access is available at public libraries and other locations that are publicly accessible (e.g., the California State Library). Access to the Internet at libraries and public locations is generally provided on a first-come, first-served basis. Other use restrictions may include the hours of operation, the length of time that a workstation may be used (depending on availability), the types of software programs available on a workstation, and the ability to print documents.
About This School Contact Information (School Year 2016-17)
School Contact Information
School Name------- Jeane Thorman Elementary School
Street------- 1402 Sycamore Ave.
City, State, Zip------- Tustin, CA 92780
Phone Number------- (714) 730-7364
Principal------- Deanna Parks
E-mail Address------- [email protected]
CDS Code 30-73643-6085369

2015-16 School Accountability Report Card for Jeane Thorman Elementary School Page 2 of 13
District Contact Information
District Name------- Tustin Unified School District
Phone Number------- (714) 730-7301
Superintendent-------
Gregory A. Franklin, Ed.D.
E-mail Address------- [email protected]
Web Site------- http://www.tustin.k12.ca.us
School Description and Mission Statement (School Year 2016-17)
Again during the 2016-2017 school year, Jeane Thorman Elementary School embraced an instructional shift in our TUSD Connect classrooms. The schools' focus on Student Engagement, Rigorous Standards supported by technology led to increased student learning and a comprehensive learning experience. Students continued to learn the importance of being ALERT. To help accomplish our mission and vision, the administration, students, staff and parents are encouraged to instill five core values that best represent Jeane Thorman Elementary. Those five core values are Attentive, Likeable, Eager, Reliable, and Thoughtful (ALERT). We believe in the importance of developing resilience within our school community of being determine during tough times to work through the difficulties our students face on a daily basis. We are accountable to ourselves, as staff, students, parents and community members to prioritize, embrace challenges, set goals, practice, take risks, compete and finish strong in all we endeavor. We will work in unity toward common goals with consistency in learning and behavioral expectations, instructional strategies, and supports to aid all students in meeting high levels of achievement. Our students will develop the courage and personal integrity to take academic risks, to achieve high levels of achievement by setting goals, and stretching beyond their comfort levels. We believe a promising strategy for achieving the mission of Jeane Thorman Elementary School is to develop our capacity to function as a professional learning community. We will create a school in which all stakeholders have high expectations for all and we accept no excuses for below standard work. With the implementation and reinforcement of our core values, as well as the data that is collected to help drive our instruction, we are confident that all students will work at the highest of levels. Student Enrollment by Grade Level (School Year 2015-16)
Grade Number of
Level Students
Kindergarten 96
Grade 1 90
Grade 2 96
Grade 3 90
Grade 4 96
Grade 5 104
Total Enrollment 572
2015-16 School Accountability Report Card for Jeane Thorman Elementary School Page 3 of 13
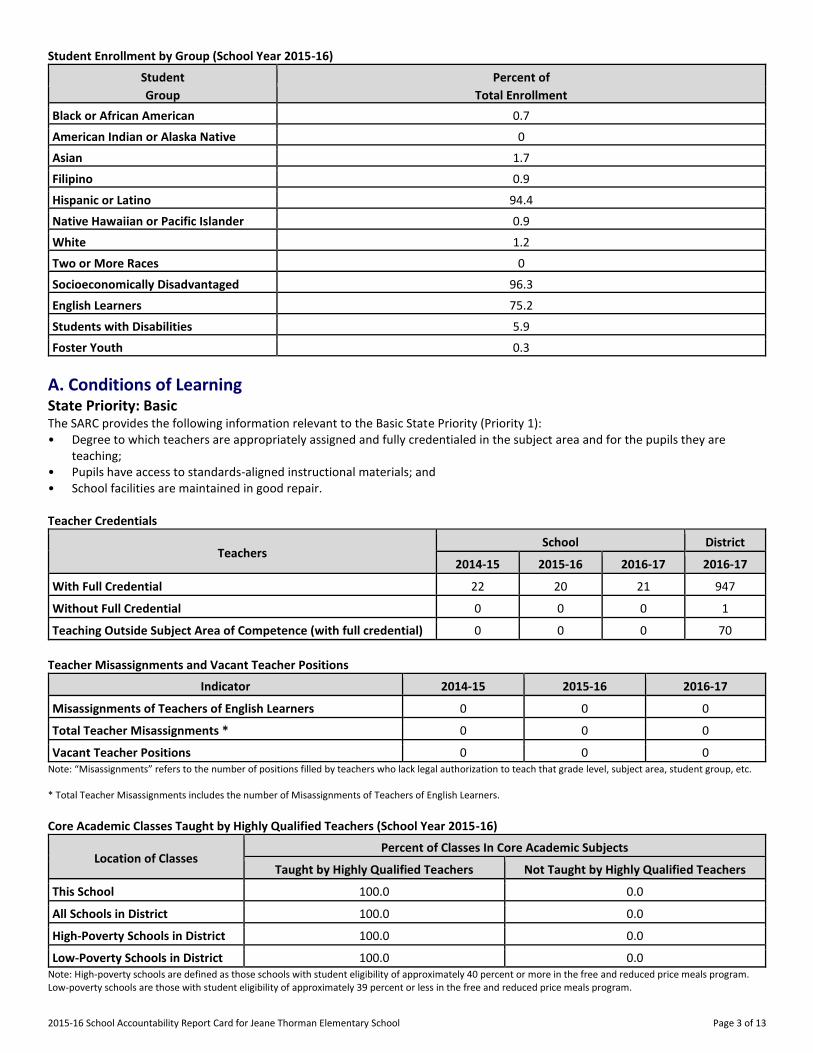
Student Enrollment by Group (School Year 2015-16)
Student Percent of
Group Total Enrollment
Black or African American 0.7
American Indian or Alaska Native 0
Asian 1.7
Filipino 0.9
Hispanic or Latino 94.4
Native Hawaiian or Pacific Islander 0.9
White 1.2
Two or More Races 0
Socioeconomically Disadvantaged 96.3
English Learners 75.2
Students with Disabilities 5.9
Foster Youth 0.3
A. Conditions of Learning State Priority: Basic The SARC provides the following information relevant to the Basic State Priority (Priority 1): • Degree to which teachers are appropriately assigned and fully credentialed in the subject area and for the pupils they are
teaching; • Pupils have access to standards-aligned instructional materials; and • School facilities are maintained in good repair. Teacher Credentials
Teachers School District
2014-15 2015-16 2016-17 2016-17
With Full Credential 22 20 21 947
Without Full Credential 0 0 0 1
Teaching Outside Subject Area of Competence (with full credential) 0 0 0 70
Teacher Misassignments and Vacant Teacher Positions
Indicator 2014-15 2015-16 2016-17
Misassignments of Teachers of English Learners 0 0 0
Total Teacher Misassignments * 0 0 0
Vacant Teacher Positions 0 0 0 Note: “Misassignments” refers to the number of positions filled by teachers who lack legal authorization to teach that grade level, subject area, student group, etc. * Total Teacher Misassignments includes the number of Misassignments of Teachers of English Learners. Core Academic Classes Taught by Highly Qualified Teachers (School Year 2015-16)
Location of Classes Percent of Classes In Core Academic Subjects
Taught by Highly Qualified Teachers Not Taught by Highly Qualified Teachers
This School 100.0 0.0
All Schools in District 100.0 0.0
High-Poverty Schools in District 100.0 0.0
Low-Poverty Schools in District 100.0 0.0 Note: High-poverty schools are defined as those schools with student eligibility of approximately 40 percent or more in the free and reduced price meals program. Low-poverty schools are those with student eligibility of approximately 39 percent or less in the free and reduced price meals program.
2015-16 School Accountability Report Card for Jeane Thorman Elementary School Page 4 of 13
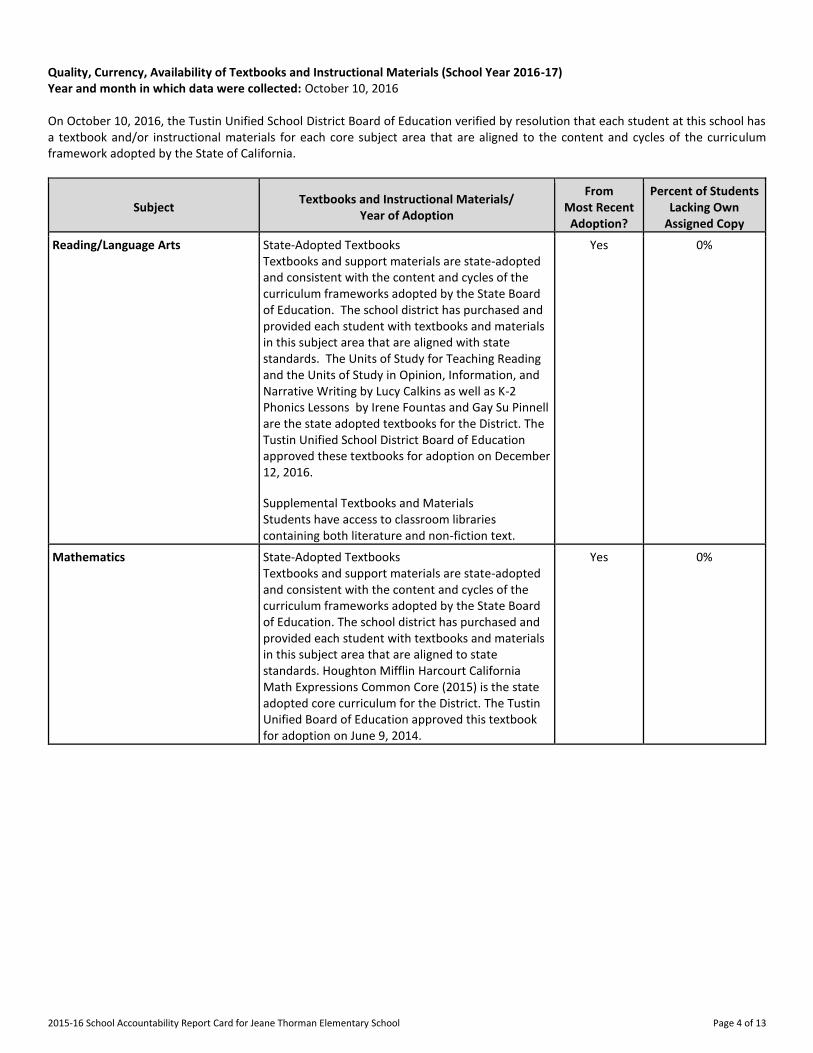
Quality, Currency, Availability of Textbooks and Instructional Materials (School Year 2016-17) Year and month in which data were collected: October 10, 2016 On October 10, 2016, the Tustin Unified School District Board of Education verified by resolution that each student at this school has a textbook and/or instructional materials for each core subject area that are aligned to the content and cycles of the curriculum framework adopted by the State of California.
Subject Textbooks and Instructional Materials/
Year of Adoption
From Most Recent
Adoption?
Percent of Students Lacking Own
Assigned Copy
Reading/Language Arts State-Adopted Textbooks
Textbooks and support materials are state-adopted and consistent with the content and cycles of the curriculum frameworks adopted by the State Board of Education. The school district has purchased and provided each student with textbooks and materials in this subject area that are aligned with state standards. The Units of Study for Teaching Reading and the Units of Study in Opinion, Information, and Narrative Writing by Lucy Calkins as well as K-2 Phonics Lessons by Irene Fountas and Gay Su Pinnell are the state adopted textbooks for the District. The Tustin Unified School District Board of Education approved these textbooks for adoption on December 12, 2016.
Supplemental Textbooks and Materials
Students have access to classroom libraries containing both literature and non-fiction text.
Yes 0%
Mathematics State-Adopted Textbooks
Textbooks and support materials are state-adopted and consistent with the content and cycles of the curriculum frameworks adopted by the State Board of Education. The school district has purchased and provided each student with textbooks and materials in this subject area that are aligned to state standards. Houghton Mifflin Harcourt California Math Expressions Common Core (2015) is the state adopted core curriculum for the District. The Tustin Unified Board of Education approved this textbook for adoption on June 9, 2014.
Yes 0%
2015-16 School Accountability Report Card for Jeane Thorman Elementary School Page 5 of 13
Subject Textbooks and Instructional Materials/
Year of Adoption
From Most Recent
Adoption?
Percent of Students Lacking Own
Assigned Copy
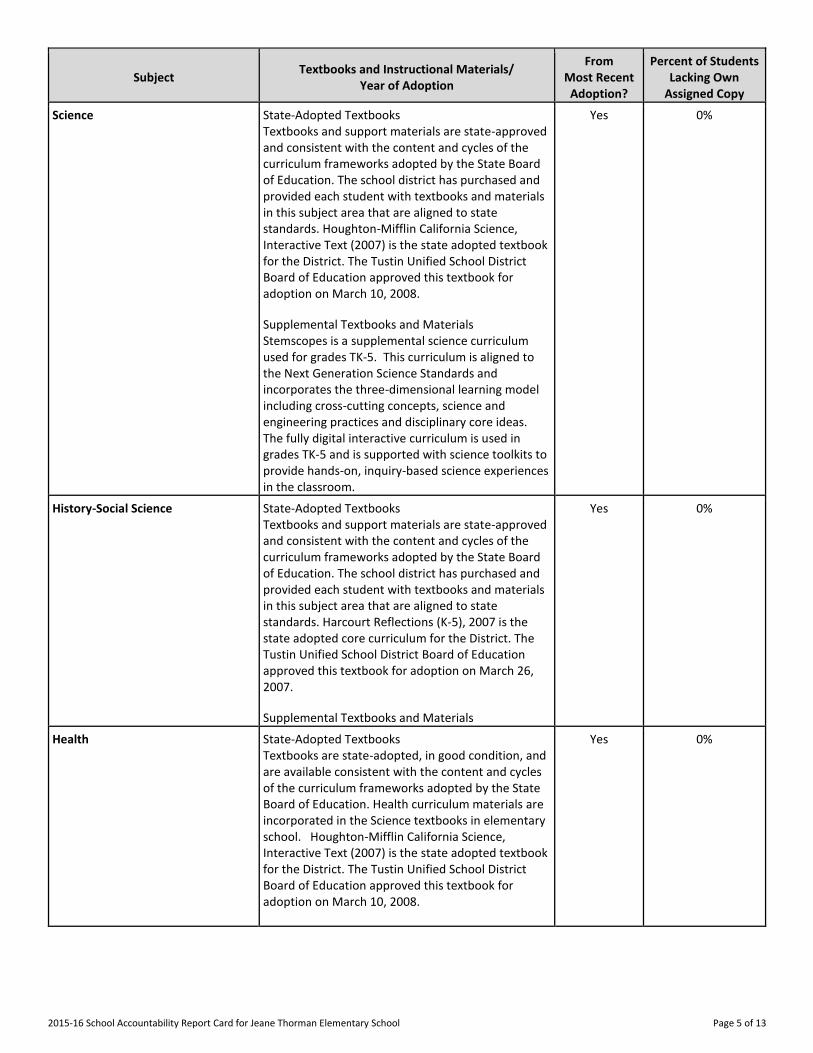
Science State-Adopted Textbooks
Textbooks and support materials are state-approved and consistent with the content and cycles of the curriculum frameworks adopted by the State Board of Education. The school district has purchased and provided each student with textbooks and materials in this subject area that are aligned to state standards. Houghton-Mifflin California Science, Interactive Text (2007) is the state adopted textbook for the District. The Tustin Unified School District Board of Education approved this textbook for adoption on March 10, 2008.
Supplemental Textbooks and Materials
Stemscopes is a supplemental science curriculum used for grades TK-5. This curriculum is aligned to the Next Generation Science Standards and incorporates the three-dimensional learning model including cross-cutting concepts, science and engineering practices and disciplinary core ideas. The fully digital interactive curriculum is used in grades TK-5 and is supported with science toolkits to provide hands-on, inquiry-based science experiences in the classroom.
Yes 0%
History-Social Science State-Adopted Textbooks
Textbooks and support materials are state-approved and consistent with the content and cycles of the curriculum frameworks adopted by the State Board of Education. The school district has purchased and provided each student with textbooks and materials in this subject area that are aligned to state standards. Harcourt Reflections (K-5), 2007 is the state adopted core curriculum for the District. The Tustin Unified School District Board of Education approved this textbook for adoption on March 26, 2007.
Supplemental Textbooks and Materials
Yes 0%
Health State-Adopted Textbooks
Textbooks are state-adopted, in good condition, and are available consistent with the content and cycles of the curriculum frameworks adopted by the State Board of Education. Health curriculum materials are incorporated in the Science textbooks in elementary school. Houghton-Mifflin California Science, Interactive Text (2007) is the state adopted textbook for the District. The Tustin Unified School District Board of Education approved this textbook for adoption on March 10, 2008.
Yes 0%

2015-16 School Accountability Report Card for Jeane Thorman Elementary School Page 6 of 13
School Facility Conditions and Planned Improvements (Most Recent Year)
The Tustin Unified School District takes great efforts to ensure that all schools are clean, safe, and functional. To assist in this effort, the District uses a facility survey instrument developed by the State of California Office of Public School Construction (OPSC). The results of this survey are available at the school office, the District office, or on the Internet at http://www.tustin.k12.ca.us/Domain/3505. The District maintenance staff ensures that the repairs necessary to keep the school in good repair and working order are completed in a timely manner. A work order process is used to ensure efficient service and that emergency repairs are given the highest priority. A complete modernization of Thorman was completed in September of 2016. Included in the project are all new classrooms and new exterior doors, classroom furniture, interior casework, lighting, windows/solar tubes and a brand new library. Thorman Elementary School provides a safe, clean environment for students, staff, and volunteers. A scheduled maintenance program is administered by the District to ensure that all classrooms and facilities are adequately maintained. The school is in compliance with all laws, rules, and regulations pertaining to hazardous materials and State earthquake standards. Regular monitoring of school grounds before, during and after school is performed by assigned staff. The school's large, grass-covered sports fields serve as a hub of school and community athletic events after school and on weekends. School Facility Good Repair Status (Most Recent Year)
School Facility Good Repair Status (Most Recent Year) Year and month of the most recent FIT report: 9/07/2016
System Inspected Repair Status Repair Needed and
Action Taken or Planned Good Fair Poor
Systems: Gas Leaks, Mechanical/HVAC, Sewer
X
Interior: Interior Surfaces X
Cleanliness: Overall Cleanliness, Pest/ Vermin Infestation
X
Electrical: Electrical X
Restrooms/Fountains: Restrooms, Sinks/ Fountains
X
Safety: Fire Safety, Hazardous Materials X
Structural: Structural Damage, Roofs X
External: Playground/School Grounds, Windows/ Doors/Gates/Fences
X
Overall Facility Rating (Most Recent Year)
Year and month of the most recent FIT report: 9/07/2016
Overall Rating Exemplary Good Fair Poor
X
2015-16 School Accountability Report Card for Jeane Thorman Elementary School Page 7 of 13
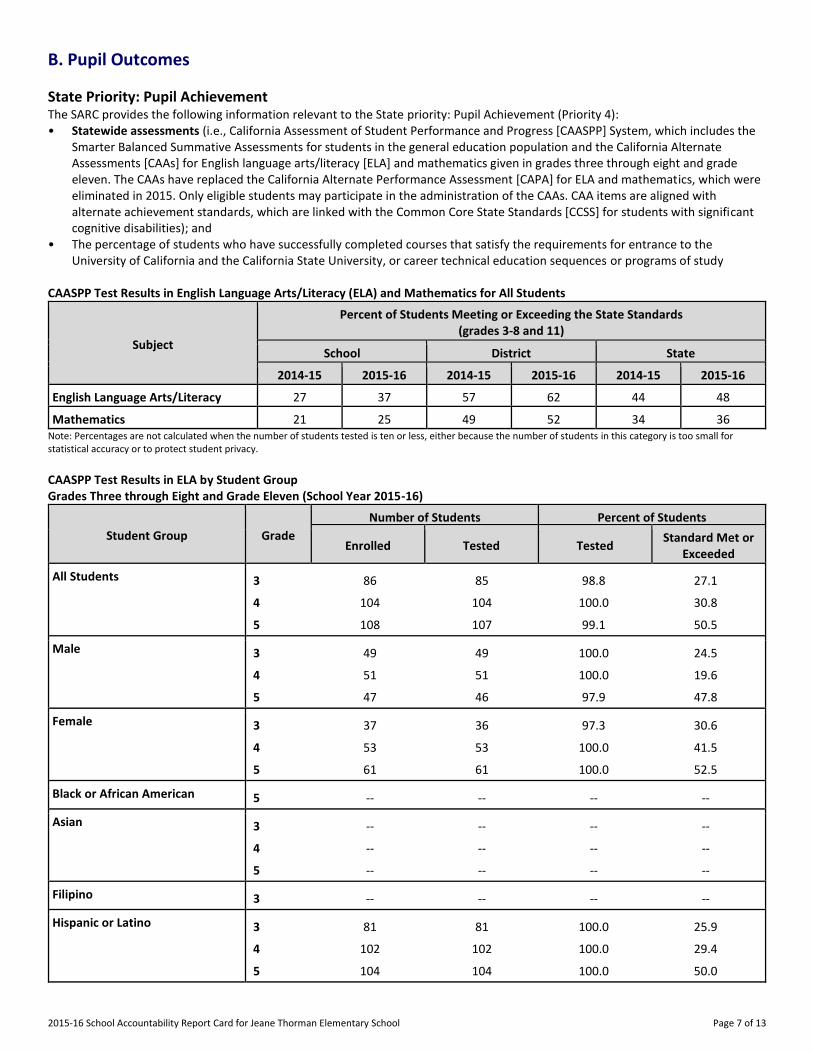
B. Pupil Outcomes
State Priority: Pupil Achievement The SARC provides the following information relevant to the State priority: Pupil Achievement (Priority 4): • Statewide assessments (i.e., California Assessment of Student Performance and Progress [CAASPP] System, which includes the
Smarter Balanced Summative Assessments for students in the general education population and the California Alternate Assessments [CAAs] for English language arts/literacy [ELA] and mathematics given in grades three through eight and grade eleven. The CAAs have replaced the California Alternate Performance Assessment [CAPA] for ELA and mathematics, which were eliminated in 2015. Only eligible students may participate in the administration of the CAAs. CAA items are aligned with alternate achievement standards, which are linked with the Common Core State Standards [CCSS] for students with significant cognitive disabilities); and
• The percentage of students who have successfully completed courses that satisfy the requirements for entrance to the University of California and the California State University, or career technical education sequences or programs of study
CAASPP Test Results in English Language Arts/Literacy (ELA) and Mathematics for All Students
Subject
Percent of Students Meeting or Exceeding the State Standards (grades 3-8 and 11)
School District State
2014-15 2015-16 2014-15 2015-16 2014-15 2015-16
English Language Arts/Literacy 27 37 57 62 44 48
Mathematics 21 25 49 52 34 36 Note: Percentages are not calculated when the number of students tested is ten or less, either because the number of students in this category is too small for statistical accuracy or to protect student privacy.
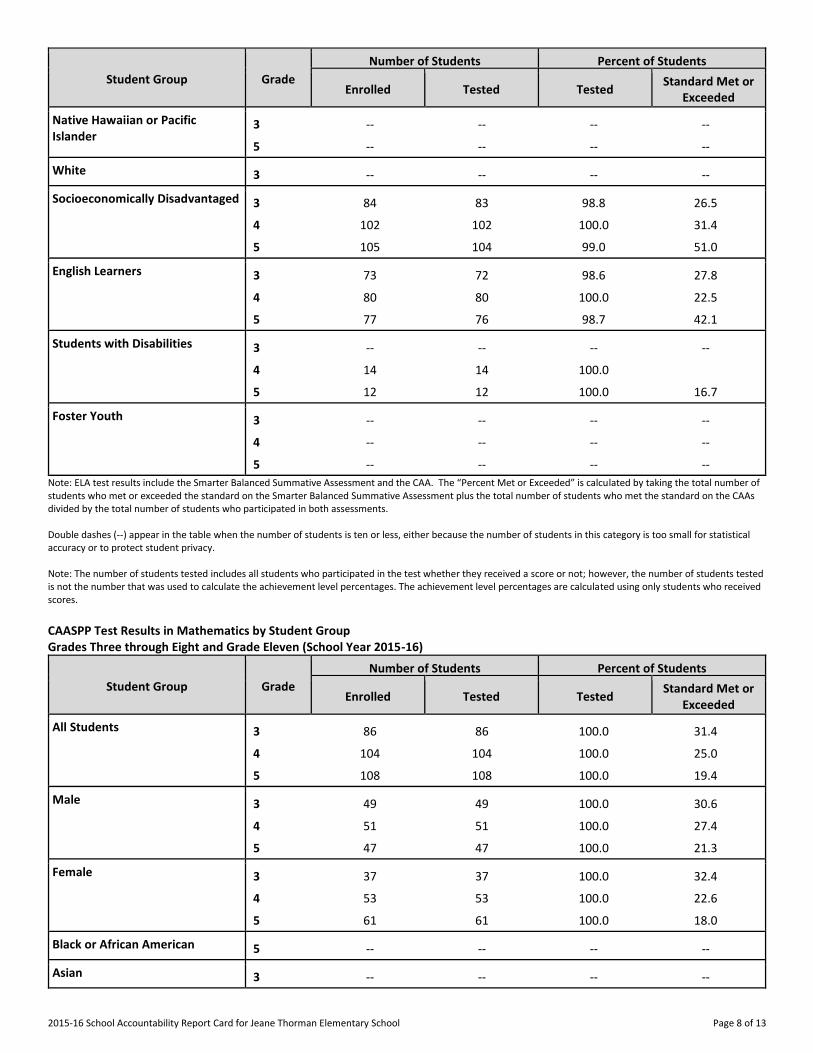
CAASPP Test Results in ELA by Student Group Grades Three through Eight and Grade Eleven (School Year 2015-16)
Student Group Grade
Number of Students Percent of Students
Enrolled Tested Tested Standard Met or
Exceeded
All Students 3 86 85 98.8 27.1
4 104 104 100.0 30.8
5 108 107 99.1 50.5
Male 3 49 49 100.0 24.5
4 51 51 100.0 19.6
5 47 46 97.9 47.8
Female 3 37 36 97.3 30.6
4 53 53 100.0 41.5
5 61 61 100.0 52.5
Black or African American 5 -- -- -- --
Asian 3 -- -- -- --
4 -- -- -- --
5 -- -- -- --
Filipino 3 -- -- -- --
Hispanic or Latino 3 81 81 100.0 25.9
4 102 102 100.0 29.4
5 104 104 100.0 50.0
2015-16 School Accountability Report Card for Jeane Thorman Elementary School Page 8 of 13
Student Group Grade
Number of Students Percent of Students
Enrolled Tested Tested Standard Met or
Exceeded
Native Hawaiian or Pacific Islander
3 -- -- -- --
5 -- -- -- --
White 3 -- -- -- --
Socioeconomically Disadvantaged 3 84 83 98.8 26.5
4 102 102 100.0 31.4
5 105 104 99.0 51.0
English Learners 3 73 72 98.6 27.8
4 80 80 100.0 22.5
5 77 76 98.7 42.1
Students with Disabilities 3 -- -- -- --
4 14 14 100.0
5 12 12 100.0 16.7
Foster Youth 3 -- -- -- --
4 -- -- -- --
5 -- -- -- --
Note: ELA test results include the Smarter Balanced Summative Assessment and the CAA. The “Percent Met or Exceeded” is calculated by taking the total number of students who met or exceeded the standard on the Smarter Balanced Summative Assessment plus the total number of students who met the standard on the CAAs divided by the total number of students who participated in both assessments. Double dashes (--) appear in the table when the number of students is ten or less, either because the number of students in this category is too small for statistical accuracy or to protect student privacy. Note: The number of students tested includes all students who participated in the test whether they received a score or not; however, the number of students tested is not the number that was used to calculate the achievement level percentages. The achievement level percentages are calculated using only students who received scores.
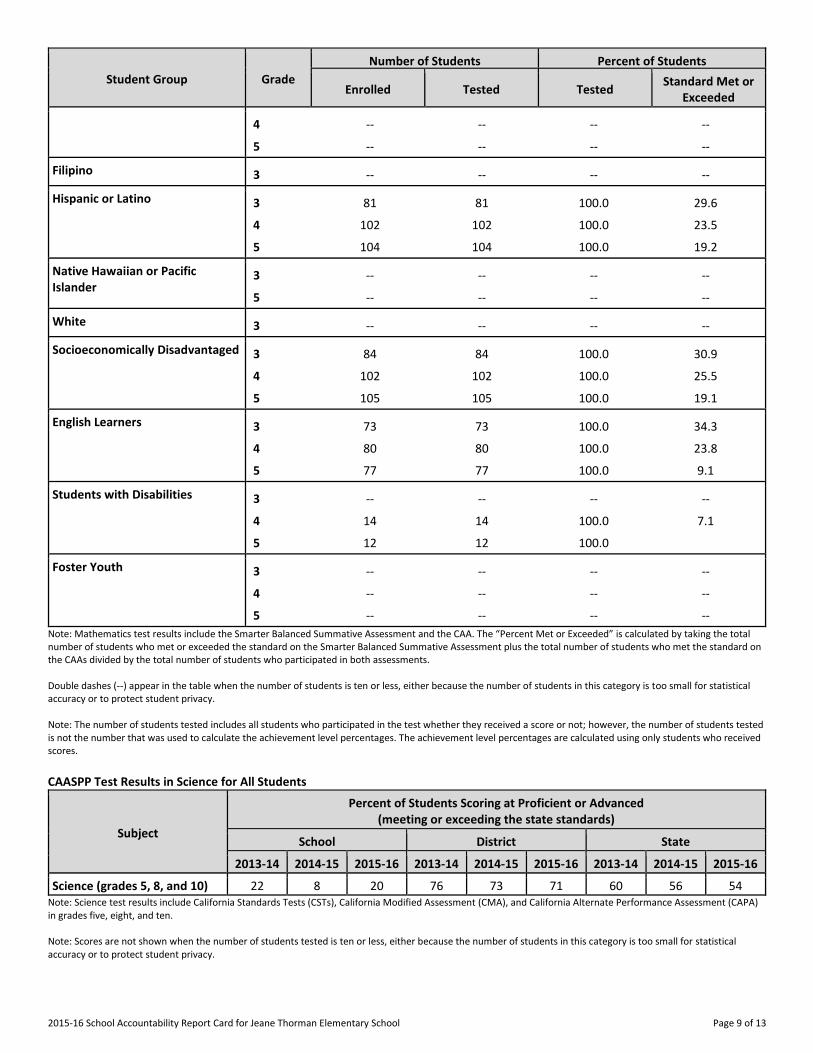
CAASPP Test Results in Mathematics by Student Group Grades Three through Eight and Grade Eleven (School Year 2015-16)
Student Group Grade
Number of Students Percent of Students
Enrolled Tested Tested Standard Met or
Exceeded
All Students 3 86 86 100.0 31.4
4 104 104 100.0 25.0
5 108 108 100.0 19.4
Male 3 49 49 100.0 30.6
4 51 51 100.0 27.4
5 47 47 100.0 21.3
Female 3 37 37 100.0 32.4
4 53 53 100.0 22.6
5 61 61 100.0 18.0
Black or African American 5 -- -- -- --
Asian 3 -- -- -- --
2015-16 School Accountability Report Card for Jeane Thorman Elementary School Page 9 of 13
Student Group Grade
Number of Students Percent of Students
Enrolled Tested Tested Standard Met or
Exceeded
4 -- -- -- --
5 -- -- -- --
Filipino 3 -- -- -- --
Hispanic or Latino 3 81 81 100.0 29.6
4 102 102 100.0 23.5
5 104 104 100.0 19.2
Native Hawaiian or Pacific Islander
3 -- -- -- --
5 -- -- -- --
White 3 -- -- -- --
Socioeconomically Disadvantaged 3 84 84 100.0 30.9
4 102 102 100.0 25.5
5 105 105 100.0 19.1
English Learners 3 73 73 100.0 34.3
4 80 80 100.0 23.8
5 77 77 100.0 9.1
Students with Disabilities 3 -- -- -- --
4 14 14 100.0 7.1
5 12 12 100.0
Foster Youth 3 -- -- -- --
4 -- -- -- --
5 -- -- -- --
Note: Mathematics test results include the Smarter Balanced Summative Assessment and the CAA. The “Percent Met or Exceeded” is calculated by taking the total number of students who met or exceeded the standard on the Smarter Balanced Summative Assessment plus the total number of students who met the standard on the CAAs divided by the total number of students who participated in both assessments. Double dashes (--) appear in the table when the number of students is ten or less, either because the number of students in this category is too small for statistical accuracy or to protect student privacy. Note: The number of students tested includes all students who participated in the test whether they received a score or not; however, the number of students tested is not the number that was used to calculate the achievement level percentages. The achievement level percentages are calculated using only students who received scores.
CAASPP Test Results in Science for All Students
Subject
Percent of Students Scoring at Proficient or Advanced (meeting or exceeding the state standards)
School District State
2013-14 2014-15 2015-16 2013-14 2014-15 2015-16 2013-14 2014-15 2015-16
Science (grades 5, 8, and 10) 22 8 20 76 73 71 60 56 54 Note: Science test results include California Standards Tests (CSTs), California Modified Assessment (CMA), and California Alternate Performance Assessment (CAPA) in grades five, eight, and ten. Note: Scores are not shown when the number of students tested is ten or less, either because the number of students in this category is too small for statistical accuracy or to protect student privacy.
2015-16 School Accountability Report Card for Jeane Thorman Elementary School Page 10 of 13
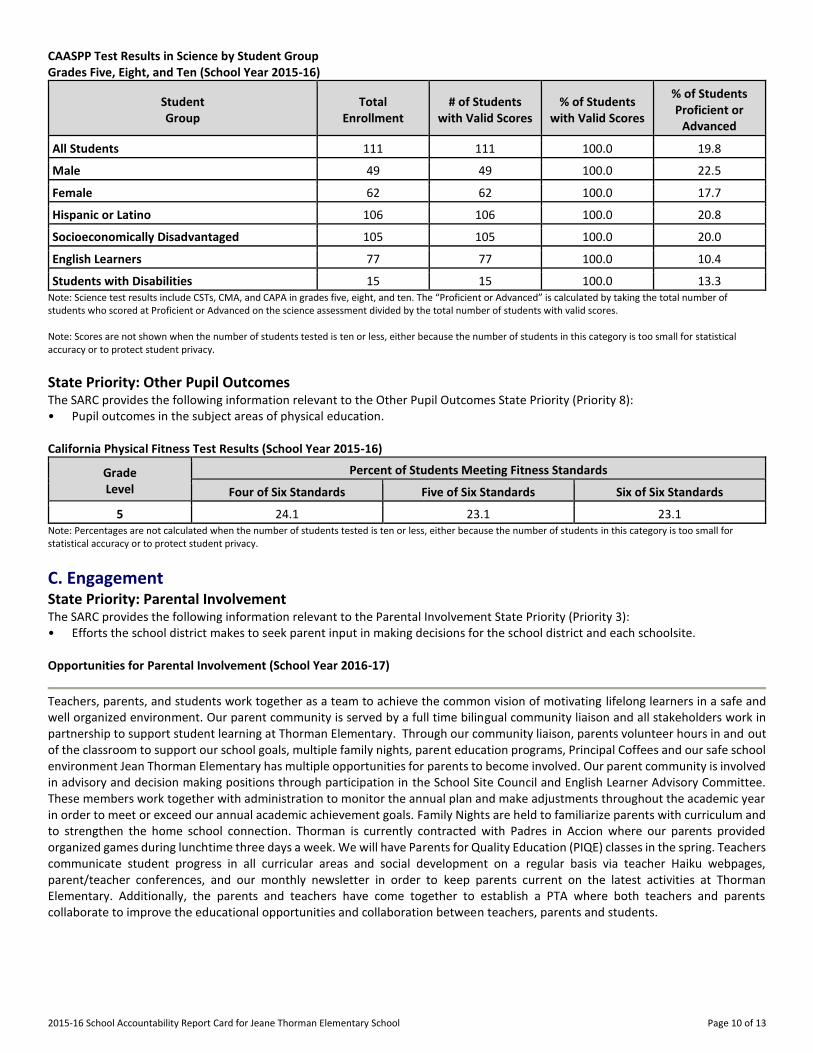
CAASPP Test Results in Science by Student Group Grades Five, Eight, and Ten (School Year 2015-16)
Student Group
Total Enrollment
# of Students with Valid Scores
% of Students with Valid Scores
% of Students Proficient or
Advanced
All Students 111 111 100.0 19.8
Male 49 49 100.0 22.5
Female 62 62 100.0 17.7
Hispanic or Latino 106 106 100.0 20.8
Socioeconomically Disadvantaged 105 105 100.0 20.0
English Learners 77 77 100.0 10.4
Students with Disabilities 15 15 100.0 13.3 Note: Science test results include CSTs, CMA, and CAPA in grades five, eight, and ten. The “Proficient or Advanced” is calculated by taking the total number of students who scored at Proficient or Advanced on the science assessment divided by the total number of students with valid scores. Note: Scores are not shown when the number of students tested is ten or less, either because the number of students in this category is too small for statistical accuracy or to protect student privacy.
State Priority: Other Pupil Outcomes The SARC provides the following information relevant to the Other Pupil Outcomes State Priority (Priority 8): • Pupil outcomes in the subject areas of physical education. California Physical Fitness Test Results (School Year 2015-16)
Grade Level
Percent of Students Meeting Fitness Standards
Four of Six Standards Five of Six Standards Six of Six Standards
---5--- 24.1 23.1 23.1 Note: Percentages are not calculated when the number of students tested is ten or less, either because the number of students in this category is too small for statistical accuracy or to protect student privacy.
C. Engagement State Priority: Parental Involvement The SARC provides the following information relevant to the Parental Involvement State Priority (Priority 3): • Efforts the school district makes to seek parent input in making decisions for the school district and each schoolsite. Opportunities for Parental Involvement (School Year 2016-17)
Teachers, parents, and students work together as a team to achieve the common vision of motivating lifelong learners in a safe and well organized environment. Our parent community is served by a full time bilingual community liaison and all stakeholders work in partnership to support student learning at Thorman Elementary. Through our community liaison, parents volunteer hours in and out of the classroom to support our school goals, multiple family nights, parent education programs, Principal Coffees and our safe school environment Jean Thorman Elementary has multiple opportunities for parents to become involved. Our parent community is involved in advisory and decision making positions through participation in the School Site Council and English Learner Advisory Committee. These members work together with administration to monitor the annual plan and make adjustments throughout the academic year in order to meet or exceed our annual academic achievement goals. Family Nights are held to familiarize parents with curriculum and to strengthen the home school connection. Thorman is currently contracted with Padres in Accion where our parents provided organized games during lunchtime three days a week. We will have Parents for Quality Education (PIQE) classes in the spring. Teachers communicate student progress in all curricular areas and social development on a regular basis via teacher Haiku webpages, parent/teacher conferences, and our monthly newsletter in order to keep parents current on the latest activities at Thorman Elementary. Additionally, the parents and teachers have come together to establish a PTA where both teachers and parents collaborate to improve the educational opportunities and collaboration between teachers, parents and students.
2015-16 School Accountability Report Card for Jeane Thorman Elementary School Page 11 of 13
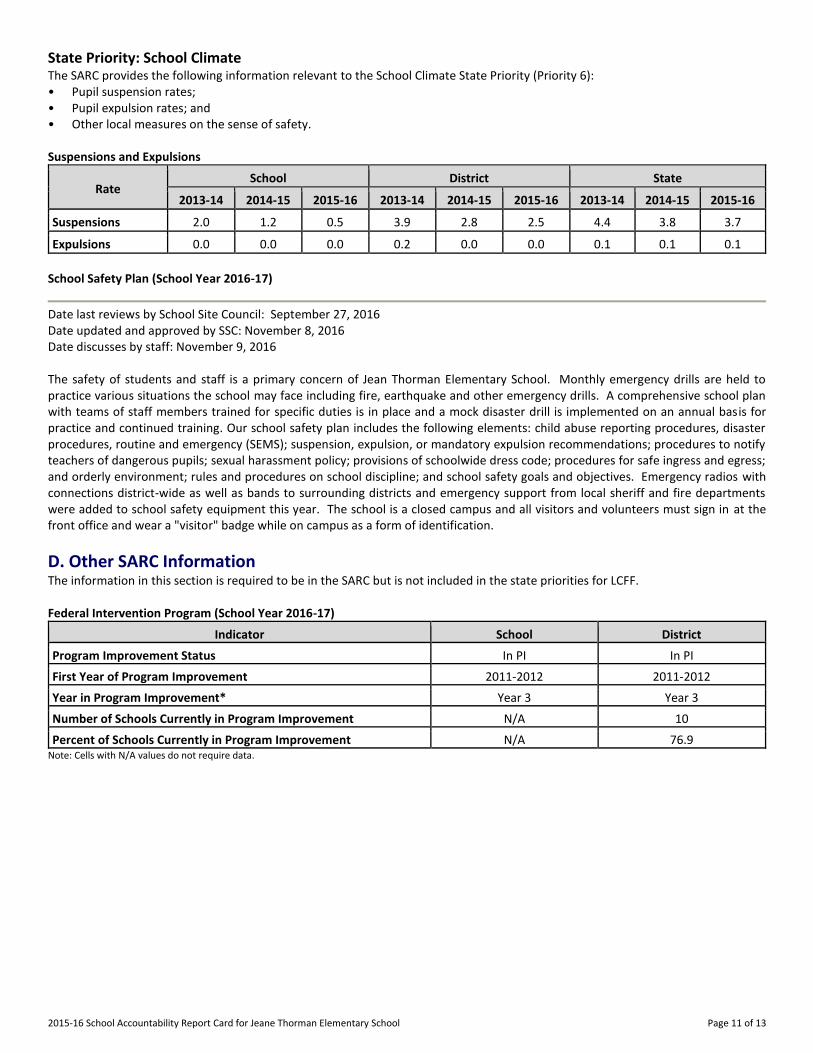
State Priority: School Climate The SARC provides the following information relevant to the School Climate State Priority (Priority 6): • Pupil suspension rates; • Pupil expulsion rates; and • Other local measures on the sense of safety. Suspensions and Expulsions
Rate School District State
2013-14 2014-15 2015-16 2013-14 2014-15 2015-16 2013-14 2014-15 2015-16
Suspensions------- 2.0 1.2 0.5 3.9 2.8 2.5 4.4 3.8 3.7
Expulsions------- 0.0 0.0 0.0 0.2 0.0 0.0 0.1 0.1 0.1
School Safety Plan (School Year 2016-17)
Date last reviews by School Site Council: September 27, 2016 Date updated and approved by SSC: November 8, 2016 Date discusses by staff: November 9, 2016 The safety of students and staff is a primary concern of Jean Thorman Elementary School. Monthly emergency drills are held to practice various situations the school may face including fire, earthquake and other emergency drills. A comprehensive school plan with teams of staff members trained for specific duties is in place and a mock disaster drill is implemented on an annual basis for practice and continued training. Our school safety plan includes the following elements: child abuse reporting procedures, disaster procedures, routine and emergency (SEMS); suspension, expulsion, or mandatory expulsion recommendations; procedures to notify teachers of dangerous pupils; sexual harassment policy; provisions of schoolwide dress code; procedures for safe ingress and egress; and orderly environment; rules and procedures on school discipline; and school safety goals and objectives. Emergency radios with connections district-wide as well as bands to surrounding districts and emergency support from local sheriff and fire departments were added to school safety equipment this year. The school is a closed campus and all visitors and volunteers must sign in at the front office and wear a "visitor" badge while on campus as a form of identification.
D. Other SARC Information The information in this section is required to be in the SARC but is not included in the state priorities for LCFF. Federal Intervention Program (School Year 2016-17)
Indicator School District
Program Improvement Status In PI In PI
First Year of Program Improvement 2011-2012 2011-2012
Year in Program Improvement* Year 3 Year 3
Number of Schools Currently in Program Improvement N/A 10
Percent of Schools Currently in Program Improvement N/A 76.9 Note: Cells with N/A values do not require data.
2015-16 School Accountability Report Card for Jeane Thorman Elementary School Page 12 of 13
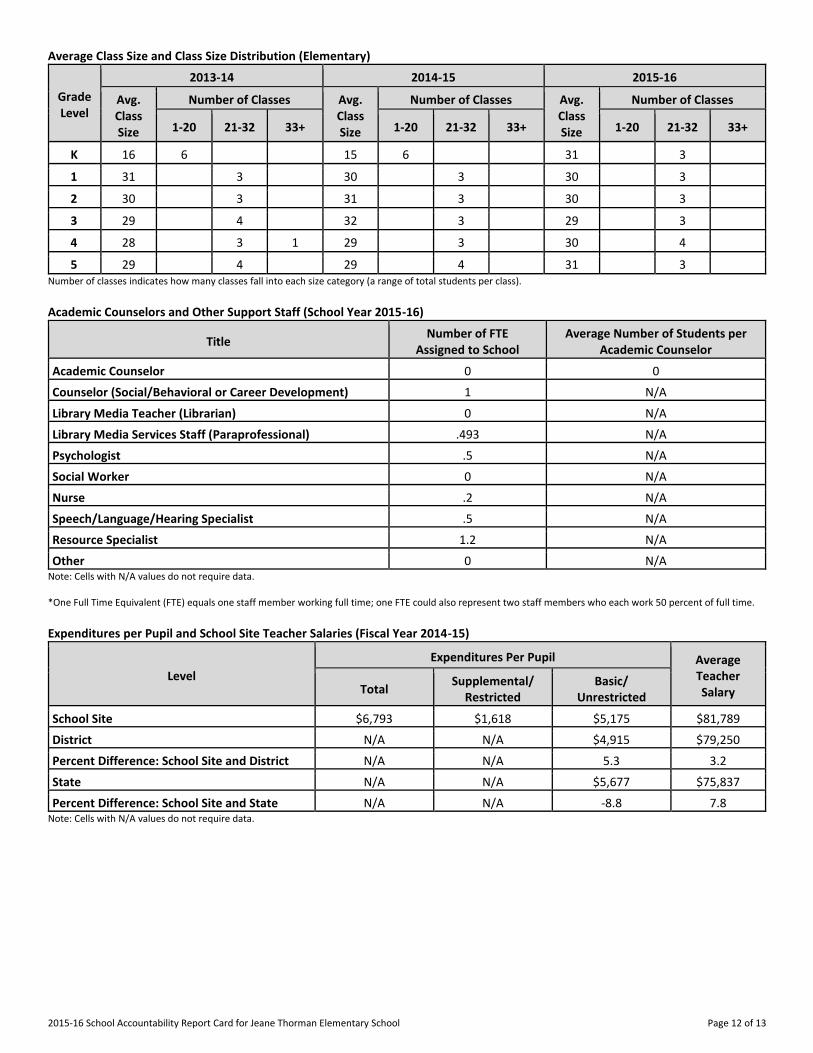
Average Class Size and Class Size Distribution (Elementary)
Grade Level
2013-14 2014-15 2015-16
Avg. Class Size
Number of Classes Avg. Class Size
Number of Classes Avg. Class Size
Number of Classes
1-20 21-32 33+ 1-20 21-32 33+ 1-20 21-32 33+
K
16 6 15 6 31 3
1
31 3 30 3 30 3
2
30 3 31 3 30 3
3
29 4 32 3 29 3
4
28 3 1 29 3 30 4
5
29 4 29 4 31 3 Number of classes indicates how many classes fall into each size category (a range of total students per class).
Academic Counselors and Other Support Staff (School Year 2015-16)
Title Number of FTE
Assigned to School Average Number of Students per
Academic Counselor
Academic Counselor------- 0 0
Counselor (Social/Behavioral or Career Development) 1 N/A
Library Media Teacher (Librarian) 0 N/A
Library Media Services Staff (Paraprofessional) .493 N/A
Psychologist------- .5 N/A
Social Worker------- 0 N/A
Nurse------- .2 N/A
Speech/Language/Hearing Specialist .5 N/A
Resource Specialist------- 1.2 N/A
Other------- 0 N/A Note: Cells with N/A values do not require data. *One Full Time Equivalent (FTE) equals one staff member working full time; one FTE could also represent two staff members who each work 50 percent of full time.
Expenditures per Pupil and School Site Teacher Salaries (Fiscal Year 2014-15)
Level
Expenditures Per Pupil Average Teacher Salary Total
Supplemental/ Restricted
Basic/ Unrestricted
School Site------- $6,793 $1,618 $5,175 $81,789
District------- N/A N/A $4,915 $79,250
Percent Difference: School Site and District N/A N/A 5.3 3.2
State------- N/A N/A $5,677 $75,837
Percent Difference: School Site and State N/A N/A -8.8 7.8 Note: Cells with N/A values do not require data.
2015-16 School Accountability Report Card for Jeane Thorman Elementary School Page 13 of 13
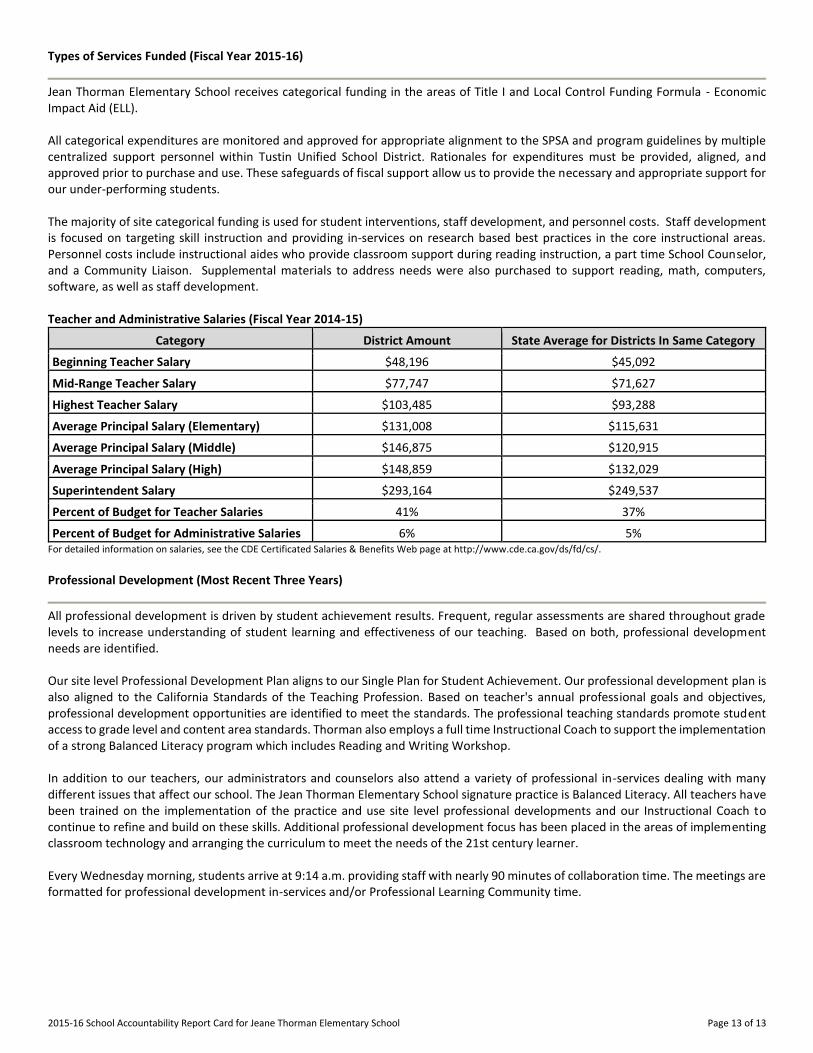
Types of Services Funded (Fiscal Year 2015-16)
Jean Thorman Elementary School receives categorical funding in the areas of Title I and Local Control Funding Formula - Economic Impact Aid (ELL). All categorical expenditures are monitored and approved for appropriate alignment to the SPSA and program guidelines by multiple centralized support personnel within Tustin Unified School District. Rationales for expenditures must be provided, aligned, and approved prior to purchase and use. These safeguards of fiscal support allow us to provide the necessary and appropriate support for our under-performing students. The majority of site categorical funding is used for student interventions, staff development, and personnel costs. Staff development is focused on targeting skill instruction and providing in-services on research based best practices in the core instructional areas. Personnel costs include instructional aides who provide classroom support during reading instruction, a part time School Counselor, and a Community Liaison. Supplemental materials to address needs were also purchased to support reading, math, computers, software, as well as staff development. Teacher and Administrative Salaries (Fiscal Year 2014-15)
Category District Amount State Average for Districts In Same Category
Beginning Teacher Salary $48,196 $45,092
Mid-Range Teacher Salary $77,747 $71,627
Highest Teacher Salary $103,485 $93,288
Average Principal Salary (Elementary) $131,008 $115,631
Average Principal Salary (Middle) $146,875 $120,915
Average Principal Salary (High) $148,859 $132,029
Superintendent Salary $293,164 $249,537
Percent of Budget for Teacher Salaries 41% 37%
Percent of Budget for Administrative Salaries 6% 5% For detailed information on salaries, see the CDE Certificated Salaries & Benefits Web page at http://www.cde.ca.gov/ds/fd/cs/. Professional Development (Most Recent Three Years)
All professional development is driven by student achievement results. Frequent, regular assessments are shared throughout grade levels to increase understanding of student learning and effectiveness of our teaching. Based on both, professional development needs are identified. Our site level Professional Development Plan aligns to our Single Plan for Student Achievement. Our professional development plan is also aligned to the California Standards of the Teaching Profession. Based on teacher's annual professional goals and objectives, professional development opportunities are identified to meet the standards. The professional teaching standards promote student access to grade level and content area standards. Thorman also employs a full time Instructional Coach to support the implementation of a strong Balanced Literacy program which includes Reading and Writing Workshop. In addition to our teachers, our administrators and counselors also attend a variety of professional in-services dealing with many different issues that affect our school. The Jean Thorman Elementary School signature practice is Balanced Literacy. All teachers have been trained on the implementation of the practice and use site level professional developments and our Instructional Coach to continue to refine and build on these skills. Additional professional development focus has been placed in the areas of implementing classroom technology and arranging the curriculum to meet the needs of the 21st century learner. Every Wednesday morning, students arrive at 9:14 a.m. providing staff with nearly 90 minutes of collaboration time. The meetings are formatted for professional development in-services and/or Professional Learning Community time.