japan’s great tohoku earthquake - insurance …€™s great tohoku earthquake scale scope and...
TRANSCRIPT
Japan’s Great Tohoku Earthquake Scale Scope and Insurance and ReinsuranceScale, Scope and Insurance and Reinsurance
Markets In the Aftermath of the March 11, 2011 EarthquakeMarch 11, 2011 EarthquakeInsurance Information Institute
March 15 2011March 15, 2011
www.iii.org/facts_statistics/earthquakes-and-tsunamis.htmlRobert P. Hartwig, Ph.D., CPCU, President & Economist
Insurance Information Institute ♦ 110 William Street ♦ New York, NY 10038Tel: 212.346.5520 ♦ Cell: 917.453.1885 ♦ [email protected] ♦ www.iii.org
Presentation Outline
Recent Major Global Catastrophes
Summary of March 11, 2011, Earthquake in Japan
Discussion by Peril
Historical Analysis of Japanese Earthquake Risk
Hi t i l A l i f Gl b l E th k Ri kHistorical Analysis of Global Earthquake Risk
Historical Analysis of U.S. Earthquake Risk
2010 Catastrophe Loss Summary and Long-Term Trends
ADDITIONAL DETAILS AVAILABLE AT:
2
ADDITIONAL DETAILS AVAILABLE AT:
http://www.iii.org/facts_statistics/earthquakes-and-tsunamis.html
Summary of Recent MajorSummary of Recent Major Catastrophe Loss Activity
Earthquake Losses DominateEarthquake Losses Dominate
3
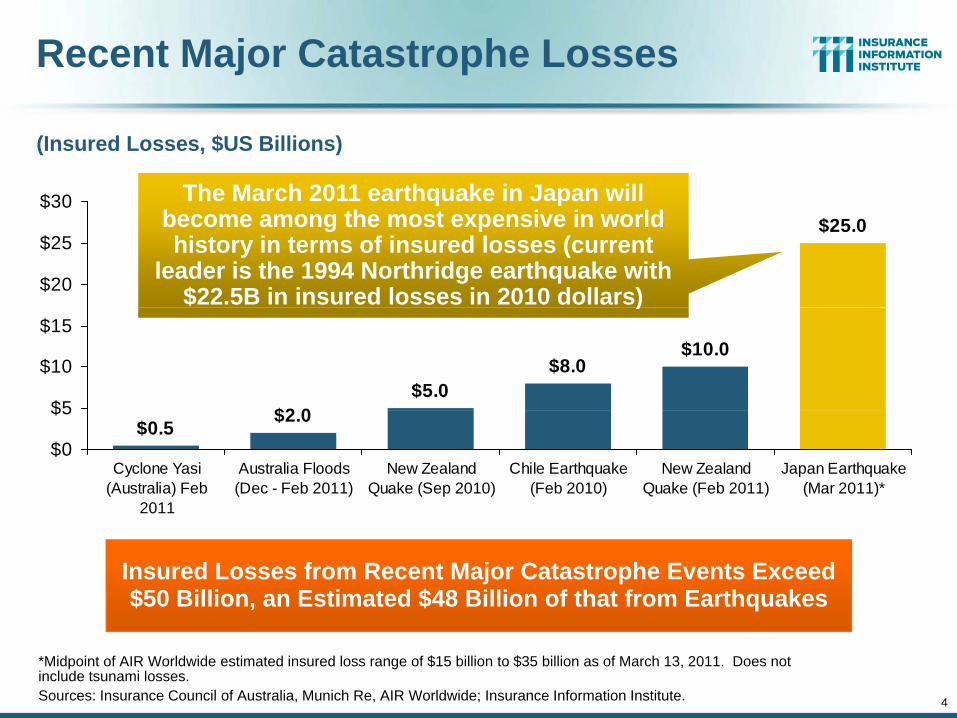
Recent Major Catastrophe Losses
(Insured Losses, $US Billions)
$30 The March 2011 earthquake in Japan will $25.0
$20
$25
$30 q pbecome among the most expensive in world history in terms of insured losses (current
leader is the 1994 Northridge earthquake with $22.5B in insured losses in 2010 dollars)
$10.0$8.0
$5.0$2 0$5
$10
$15)
$2.0$0.5$0
$5
Cyclone Yasi(Australia) Feb
2011
Australia Floods(Dec - Feb 2011)
New ZealandQuake (Sep 2010)
Chile Earthquake(Feb 2010)
New ZealandQuake (Feb 2011)
Japan Earthquake(Mar 2011)*
2011
Insured Losses from Recent Major Catastrophe Events Exceed $50 Billion, an Estimated $48 Billion of that from Earthquakes
4
*Midpoint of AIR Worldwide estimated insured loss range of $15 billion to $35 billion as of March 13, 2011. Does not include tsunami losses.Sources: Insurance Council of Australia, Munich Re, AIR Worldwide; Insurance Information Institute.
Summary of March 11 2011Summary of March 11, 2011 Japanese Earthquake Activity
March 11 Earthquake Is Among theMarch 11 Earthquake Is Among the Strongest in Recorded History
5
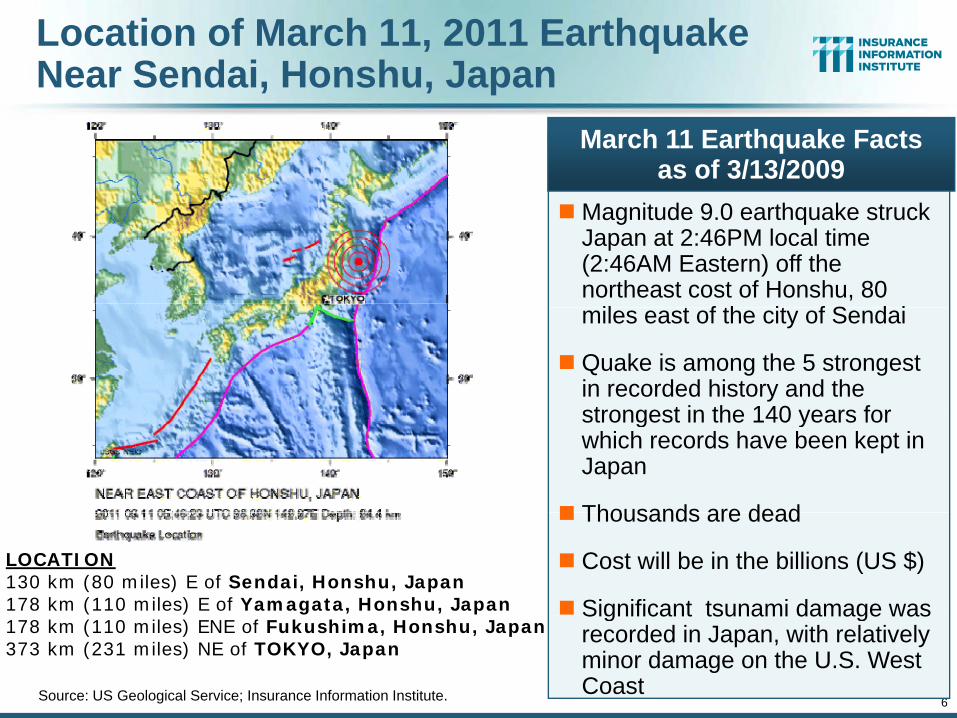
Location of March 11, 2011 Earthquake Near Sendai, Honshu, Japan
M it d 9 0 th k t k
March 11 Earthquake Factsas of 3/13/2009
Magnitude 9.0 earthquake struck Japan at 2:46PM local time (2:46AM Eastern) off the northeast cost of Honshu, 80
il t f th it f S d imiles east of the city of Sendai
Quake is among the 5 strongest in recorded history and the strongest in the 140 years forstrongest in the 140 years for which records have been kept in Japan
Thousands are deadThousands are dead
Cost will be in the billions (US $)
Significant tsunami damage was
LOCATION130 km (80 miles) E of Sendai, Honshu, Japan178 km (110 miles) E of Yamagata, Honshu, Japan
6Source: US Geological Service; Insurance Information Institute.
Significant tsunami damage was recorded in Japan, with relatively minor damage on the U.S. West Coast
178 km (110 miles) ENE of Fukushima, Honshu, Japan373 km (231 miles) NE of TOKYO, Japan
Loss Estimates
Early estimates from the catastrophe modeling firm AIR Worldwide put insured property losses, not including the costs of the tsunami, at $15 billion to $35 billion.
AIR’s estimates reflect insured losses from shaking and “fire following” damage to onshore residential and commercial buildings and contents.
The estimates also include some agricultural losses. The figures are net of Japan Earthquake Reinsurance recoveries.
Many of the properties destroyed by the tsunami first sustained damage y p p y y gfrom ground shaking and fire. However, any other estimates of tsunami losses should not be added to the loss estimates provided here, as that would result in significant double counting.
These losses do not include uninsured property losses. According to AIR Worldwide, earthquake insurance penetration in Japan is relatively low (ranging between 14 to 17 percent nationwide).
7
Estimates of fatalities are still evolving, but are expected to be in the thousands.
Source: AIR Worldwide, March 13, 2011.
Earthquake Damage
Strong shaking from the quake was felt over most of the country’s northern Honshu region. Roads across the region buckled and several landslides were reported.
High-rise office and apartment buildings in Tokyo—some 370 km from the epicenter—shook visibly. Trains and subways in the capital were halted and elevators shut down. Shaking was felt as far south as Kyoto and Osaka.
In Japan about 70% of all residential construction is made of wood and about 25% of concrete. Commercial construction consists of more than 50% ductile reinforced concrete, about one-third light metal or steel and less than 10% wood.
Residential structures in the region of Japan impacted by the March 11 quake are generally resistant to earthquake shaking. However, some vulnerable structures do exist. These are comprised primarily of non-ductile reinforced concrete frame and heavy wood-frame construction.y
There have been relatively few reports of major structural damage in the Tokyo and Chiba areas, though several serious fires broke out. Many instances of non-structural damage and damage to contents are expected to be reported.
8
g g p p
Power outages plagued the northern Honshu region, and many homes are without running water. Source: AIR Worldwide, March 13, 2011.
Nuclear Concerns
An explosion in one of the buildings at the Fukushima Daiichi Nuclear Power Station prompted officials to evacuate a 12-mile radius around the plant, affecting as many as 170,000 people.
Officials flooded the reactor with seawater in an effort to avoid a reactor core meltdown. Reports indicated that a partial meltdown may have already occurred.
On March 13 a second reactor at the same plant was also experiencing critical failures of its cooling system. Several insurance experts have said that the plant operator, Tokyo Eclectic Power Co., will be responsible for any clean-up costs associated with radiation contamination, but that insurance is likely to have been purchased by the company directly from the Japanese government.
9Source: AIR Worldwide, March 13, 2011.
Human Cost
The death toll, expected to rise, stands at thousands.
Deaths have been reported in Miyagi, Iwate, Fukushima and Ibate f tprefectures.
A ship carrying 100 people was swept away off the northeastern coast.
At least 200 people were caught in a landslide in the province of Sendai.
10Source: AIR Worldwide, March 13, 2011.
Property Damage
Building collapses, including a nursing home, reported in Fukushima prefecture; many collapses in Iwaki-city and Fukushima-city.
B ildi ll t d i Ib ki f tBuilding collapses reported in Ibaraki prefecture.
Three buildings collapsed in Kurihara-city in Miyagi prefecture.
Building collapses in Chiba prefecture’s Narita city.
Many residential homes washed out by the tsunami in Miyagi and Iwate prefectures.p
Oil tanks were damaged in Miyagi prefecture.
More than 300 houses collapsed or were washed away in the coastal city ofMore than 300 houses collapsed or were washed away in the coastal city of Ofunato.
11Source: AIR Worldwide, March 13, 2011.
Fire Damage
Fire damage in the following prefectures, particularly at chemical plants, nuclear plants and oil refineries: Iwate, Miyagi, Akita, Fukishima, Ibaraki, Tochigi, Chiba, Tokyo and Kanagawa.
Chiba prefecture: fire and explosion at an oil refinery and fire at a steel plant.
Kanagawa: fire at a mid-rise building and at an industrial facility.
Fire at one office building in Tokyo.
12Source: AIR Worldwide, March 13, 2011.
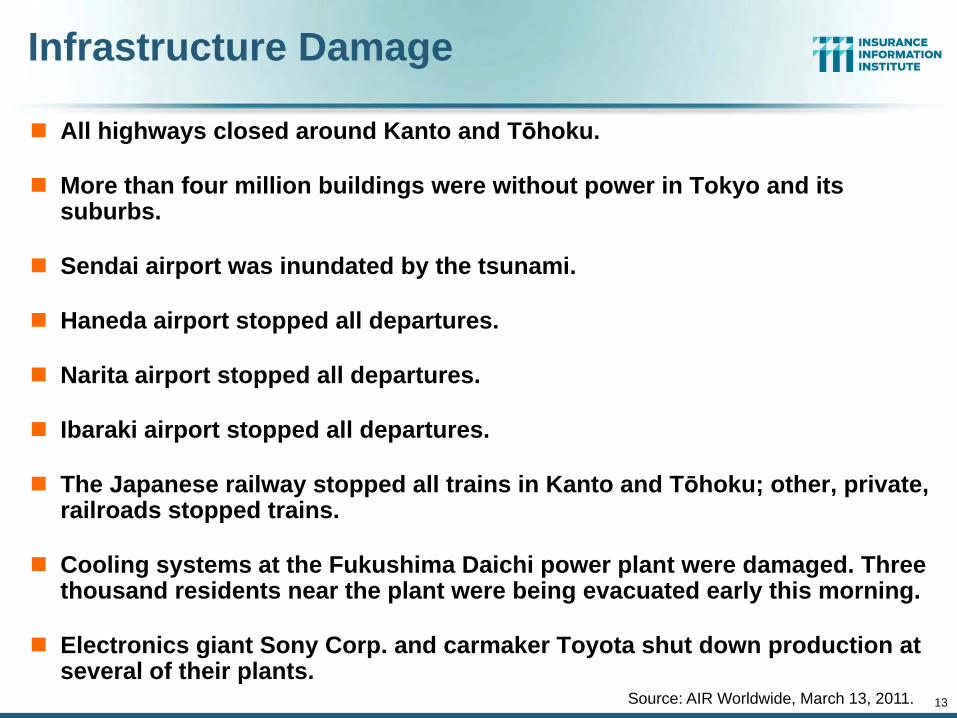
Infrastructure Damage
All highways closed around Kanto and Tōhoku.
More than four million buildings were without power in Tokyo and its b bsuburbs.
Sendai airport was inundated by the tsunami.
Haneda airport stopped all departures.
Narita airport stopped all departures.
Ibaraki airport stopped all departures.
The Japanese railway stopped all trains in Kanto and Tōhoku; other, private, railroads stopped trainsrailroads stopped trains.
Cooling systems at the Fukushima Daichi power plant were damaged. Three thousand residents near the plant were being evacuated early this morning.
13
Electronics giant Sony Corp. and carmaker Toyota shut down production at several of their plants.
Source: AIR Worldwide, March 13, 2011.
Discussion by Peril:Discussion by Peril:Japanese Earthquake
Several Different Types of PoliciesSeveral Different Types of Policies Must Be Considered
14
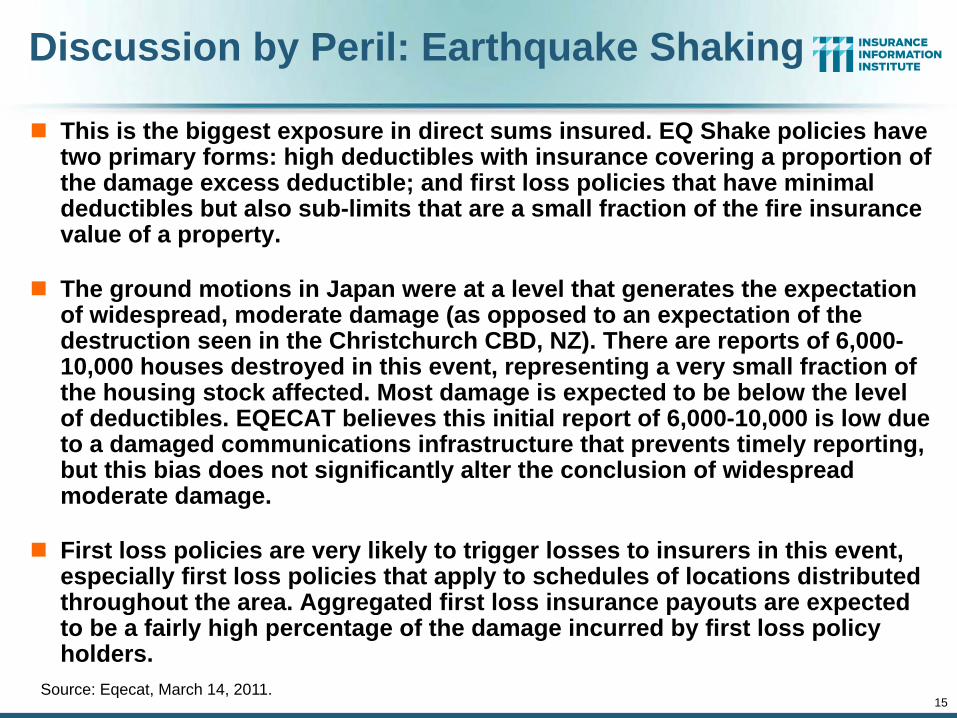
Discussion by Peril: Earthquake Shaking
This is the biggest exposure in direct sums insured. EQ Shake policies have two primary forms: high deductibles with insurance covering a proportion of the damage excess deductible; and first loss policies that have minimal deductibles but also sub limits that are a small fraction of the fire insurancedeductibles but also sub-limits that are a small fraction of the fire insurance value of a property.
The ground motions in Japan were at a level that generates the expectation f id d d t d ( d t t ti f thof widespread, moderate damage (as opposed to an expectation of the
destruction seen in the Christchurch CBD, NZ). There are reports of 6,000-10,000 houses destroyed in this event, representing a very small fraction of the housing stock affected. Most damage is expected to be below the level
f d d tibl EQECAT b li thi i iti l t f 6 000 10 000 i l dof deductibles. EQECAT believes this initial report of 6,000-10,000 is low due to a damaged communications infrastructure that prevents timely reporting, but this bias does not significantly alter the conclusion of widespread moderate damage.
First loss policies are very likely to trigger losses to insurers in this event, especially first loss policies that apply to schedules of locations distributed throughout the area. Aggregated first loss insurance payouts are expected
15
to be a fairly high percentage of the damage incurred by first loss policy holders.
Source: Eqecat, March 14, 2011.
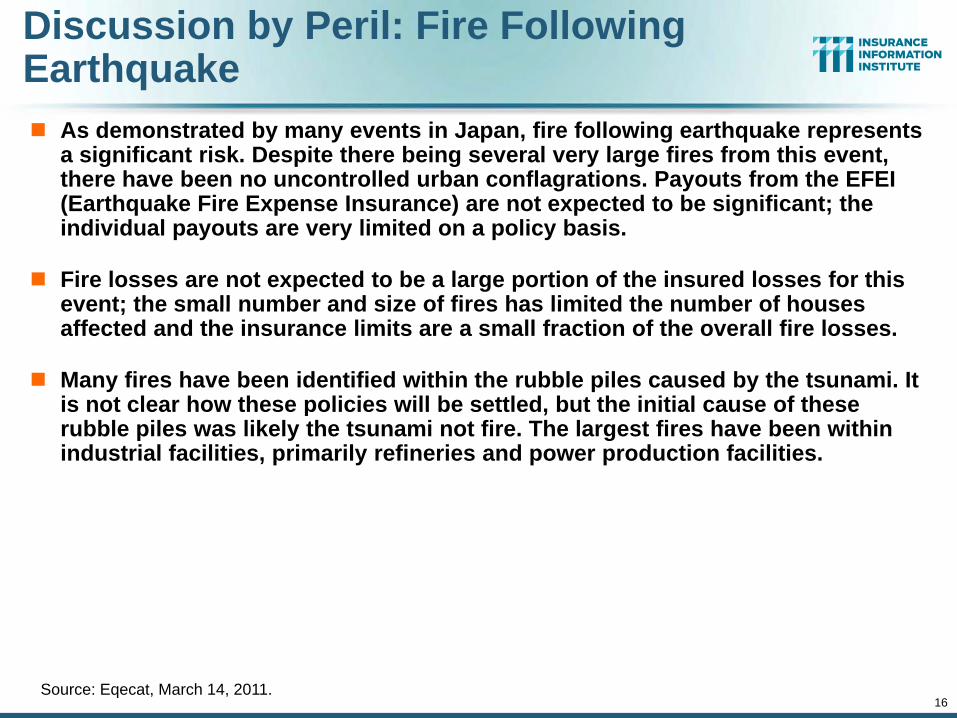
Discussion by Peril: Fire Following Earthquake
As demonstrated by many events in Japan, fire following earthquake represents a significant risk. Despite there being several very large fires from this event, there have been no uncontrolled urban conflagrations. Payouts from the EFEI (Earthquake Fire Expense Insurance) are not expected to be significant; the(Earthquake Fire Expense Insurance) are not expected to be significant; the individual payouts are very limited on a policy basis.
Fire losses are not expected to be a large portion of the insured losses for this event; the small number and size of fires has limited the number of housesevent; the small number and size of fires has limited the number of houses affected and the insurance limits are a small fraction of the overall fire losses.
Many fires have been identified within the rubble piles caused by the tsunami. It is not clear how these policies will be settled, but the initial cause of theseis not clear how these policies will be settled, but the initial cause of these rubble piles was likely the tsunami not fire. The largest fires have been within industrial facilities, primarily refineries and power production facilities.
16Source: Eqecat, March 14, 2011.
Discussion by Peril: Flood and Tsunami
Indemnification from flooding and tsunami is an optional coverage for most policies in Japan, and take-up rates are fairly low. It is currently expected that much of the losses from flooding are not insured.
The University of Tokyo (ERI) has posted a ground motion summary from the National Research Institute for Earth Science and Disaster Prevention based on data captured by networks of strong-ground-motion instruments i J (K N t d KiK N t d t ) Th d t i l d diin Japan (K-Net and KiK-Net data). The data includes many recordings closer to the fault where peak ground acceleration exceeded 0.5 g (quite strong) in some cases. Therefore, the shaking damage along the coast might have been significant in some regions; however, these same regions ( i ll th l l d h th t t h ki ld h b )(especially the lowlands where the strongest shaking would have been) were overrun by the tsunami, thus erasing any evidence of possible shaking damage.
17Source: Eqecat, March 14, 2011.
Discussion by Peril: Nuclear Contamination Evacuation
Most insurance policies contain exclusions for nuclear contamination. The experience from past earthquakes has been that there is not a lot of business interruption coverage that could be triggered by the large-scale evacuations now in progressevacuations now in progress.
18Source: Eqecat, March 14, 2011.
Discussion by Peril: Loss Estimates –Comparisons With Previous Major Quakes
Economic losses from this event are likely to exceed $100B USD, according to March 14 estimates by Eqecat. The 1995 Great Hanshin Earthquake (Kobe, Japan) was reported to have economic losses in excess of this value. The Great Hanshin event was a M6 8 earthquake located in the heart of theThe Great Hanshin event was a M6.8 earthquake located in the heart of the port of Osaka. It occurred in a larger industrial center, and was more concentrated geographically.
I d l f th 1995 t ti t d t $6 Billi USD ( tiInsured losses from the 1995 event were estimated at $6 Billion USD (a ratio of insured losses to economic losses of 6%). The relatively low ratio was due to the low propensity to buy earthquake insurance coverage in this area of perceived low risk. Last week’s Tohoku Pacific Offshore Earthquake
ff t d th t h h hi h t f i h A $100affected an area that has a much higher rate of insurance purchase. A $100 Billion USD loss represents about 2% of Japan’s Gross Domestic Product. This ratio allows a comparison of the severity of this event with other recent catastrophes.
19Source: Eqecat, March 14, 2011.
Discussion by Peril: Loss Estimates – Comparisons With Previous Major Quakes (con’t)
The 2010 Maule Earthquake (Chile) caused an estimated $30 Billion USD in economic damages. With a GDP of approximately $300 Billion USD, the 2010 Maule earthquake was a far more direct hit although about 25% of the economic losses were covered by insurance The aggregate economiceconomic losses were covered by insurance. The aggregate economic losses from the two recent Christchurch, NZ, earthquakes may approach $20 Billion USD on a GDP of approximately $120 Billion USD.
C t ti t t th t i t l 75% f th Ch i t h h lCurrent estimates note that approximately 75% of the Christchurch losses will be covered by insurance. In 2004, Hurricane Katrina caused an estimated $125 Billion USD in economic losses to an economy with a GDP of $13 Trillion USD, or about 1%, with approximately 25% of the losses
d b icovered by insurance.
Economic losses will continue to rise as significant earthquake-related events develop; serious concerns grow as officials struggle to control damage at three nuclear power plants.
20Source: Eqecat, March 14, 2011.

Japanese Nonlife Insurance Market Facts
Market Is Dominated by Large, Domestic InsurersDomestic Insurers
21
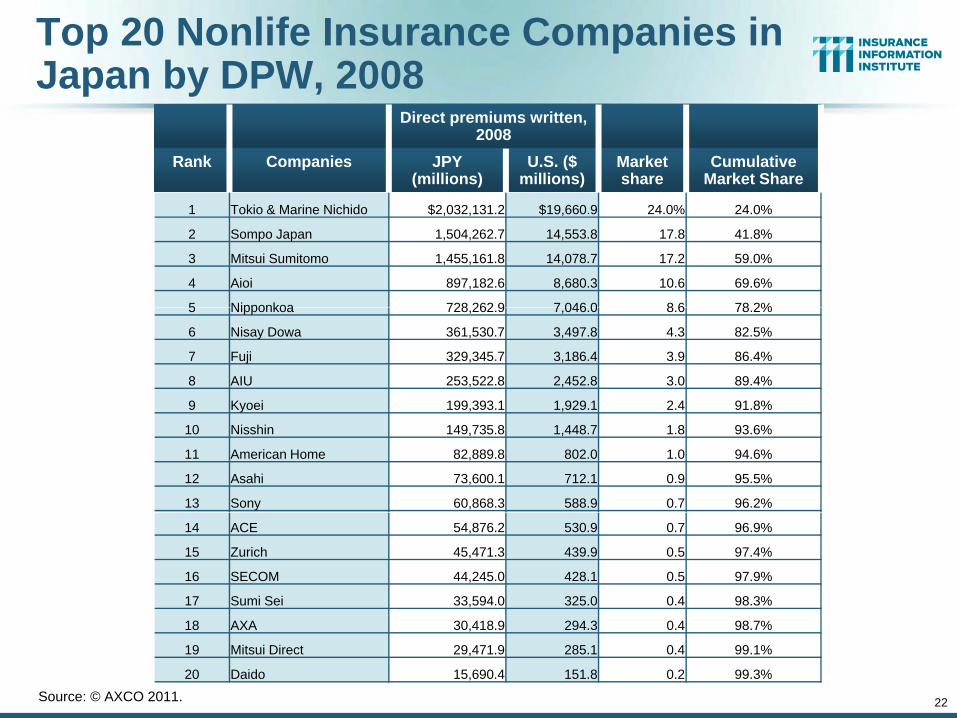
Top 20 Nonlife Insurance Companies in Japan by DPW, 2008
Direct premiums written, 2008
Rank Companies JPY (millions)
U.S. ($ millions)
Marketshare
Cumulative Market Share
1 T ki & M i Ni hid $2 032 131 2 $19 660 9 24 0% 24 0%1 Tokio & Marine Nichido $2,032,131.2 $19,660.9 24.0% 24.0%
2 Sompo Japan 1,504,262.7 14,553.8 17.8 41.8%
3 Mitsui Sumitomo 1,455,161.8 14,078.7 17.2 59.0%
4 Aioi 897,182.6 8,680.3 10.6 69.6%
5 Nipponkoa 728 262 9 7 046 0 8 6 78 2%5 Nipponkoa 728,262.9 7,046.0 8.6 78.2%
6 Nisay Dowa 361,530.7 3,497.8 4.3 82.5%
7 Fuji 329,345.7 3,186.4 3.9 86.4%
8 AIU 253,522.8 2,452.8 3.0 89.4%
9 Kyoei 199,393.1 1,929.1 2.4 91.8%y , , %
10 Nisshin 149,735.8 1,448.7 1.8 93.6%
11 American Home 82,889.8 802.0 1.0 94.6%
12 Asahi 73,600.1 712.1 0.9 95.5%
13 Sony 60,868.3 588.9 0.7 96.2%
14 ACE 54,876.2 530.9 0.7 96.9%
15 Zurich 45,471.3 439.9 0.5 97.4%
16 SECOM 44,245.0 428.1 0.5 97.9%
17 Sumi Sei 33,594.0 325.0 0.4 98.3%
22
18 AXA 30,418.9 294.3 0.4 98.7%
19 Mitsui Direct 29,471.9 285.1 0.4 99.1%
20 Daido 15,690.4 151.8 0.2 99.3%
Source: © AXCO 2011.
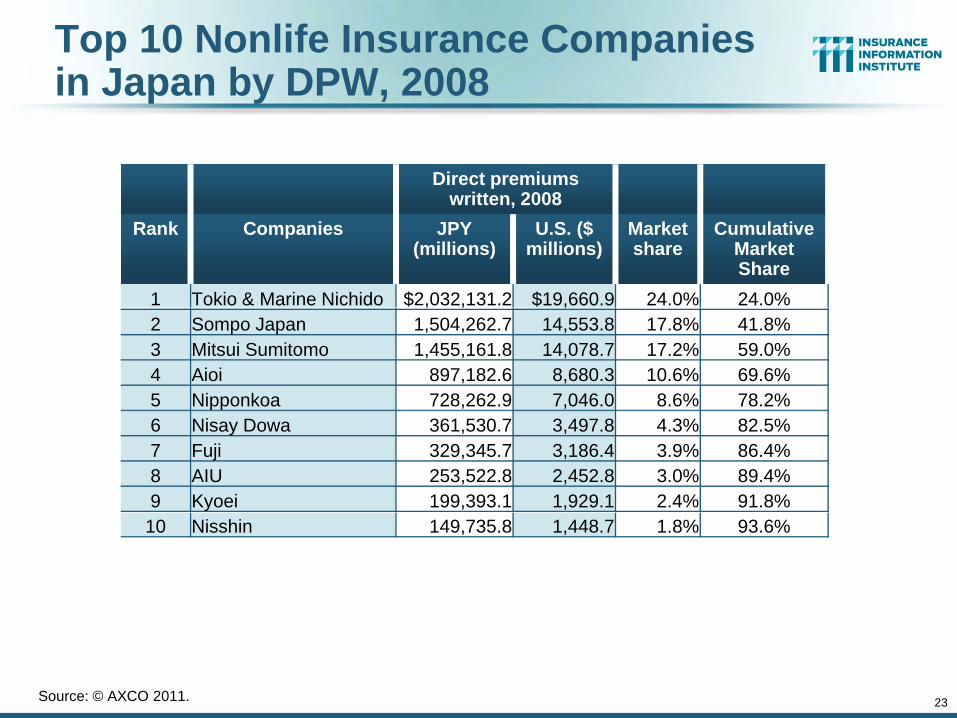
Top 10 Nonlife Insurance Companies in Japan by DPW, 2008p y
Direct premiums written, 2008written, 2008
Rank Companies JPY (millions)
U.S. ($ millions)
Marketshare
Cumulative Market Share
1 Tokio & Marine Nichido $2,032,131.2 $19,660.9 24.0% 24.0%, , ,2 Sompo Japan 1,504,262.7 14,553.8 17.8% 41.8%3 Mitsui Sumitomo 1,455,161.8 14,078.7 17.2% 59.0%4 Aioi 897,182.6 8,680.3 10.6% 69.6%5 Nipponkoa 728,262.9 7,046.0 8.6% 78.2%6 Nisay Dowa 361,530.7 3,497.8 4.3% 82.5%7 Fuji 329,345.7 3,186.4 3.9% 86.4%8 AIU 253,522.8 2,452.8 3.0% 89.4%9 Kyoei 199,393.1 1,929.1 2.4% 91.8%
10 Nisshin 149,735.8 1,448.7 1.8% 93.6%
23Source: © AXCO 2011.
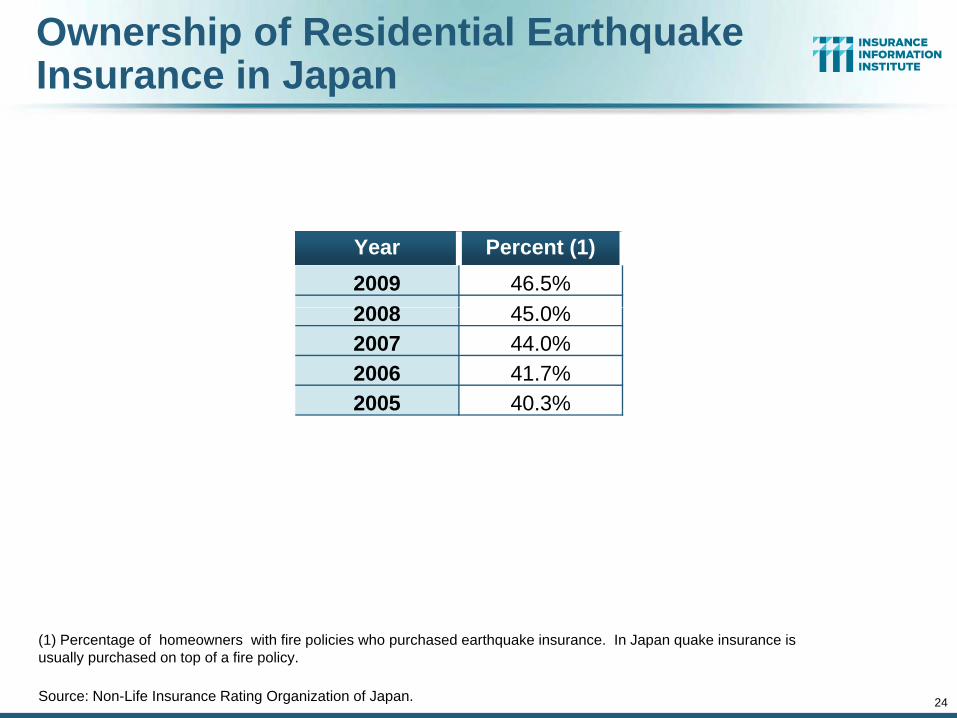
Ownership of Residential Earthquake Insurance in Japan
Year Percent (1)2009 46.5%2008 45 0%2008 45.0%2007 44.0%2006 41.7%2005 40.3%2005 40.3%
24
(1) Percentage of homeowners with fire policies who purchased earthquake insurance. In Japan quake insurance is usually purchased on top of a fire policy.
Source: Non-Life Insurance Rating Organization of Japan.
Historical Analysis ofHistorical Analysis of Japanese Earthquake Activity
Japan Has a Long and TragicJapan Has a Long and Tragic History of Earthquake Loss
25
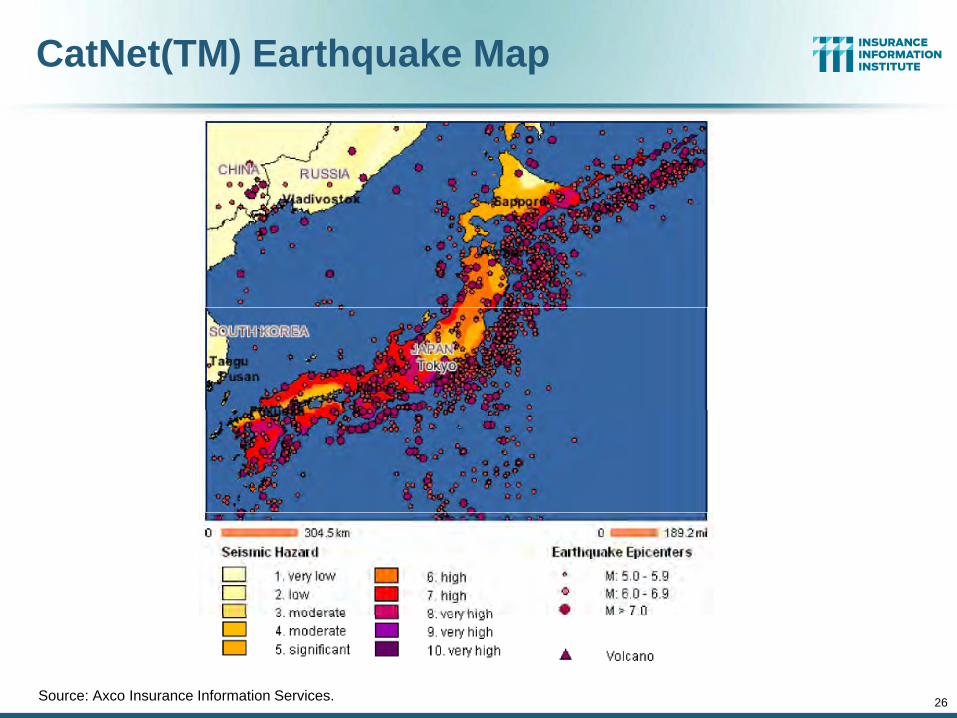
CatNet(TM) Earthquake Map
26Source: Axco Insurance Information Services.
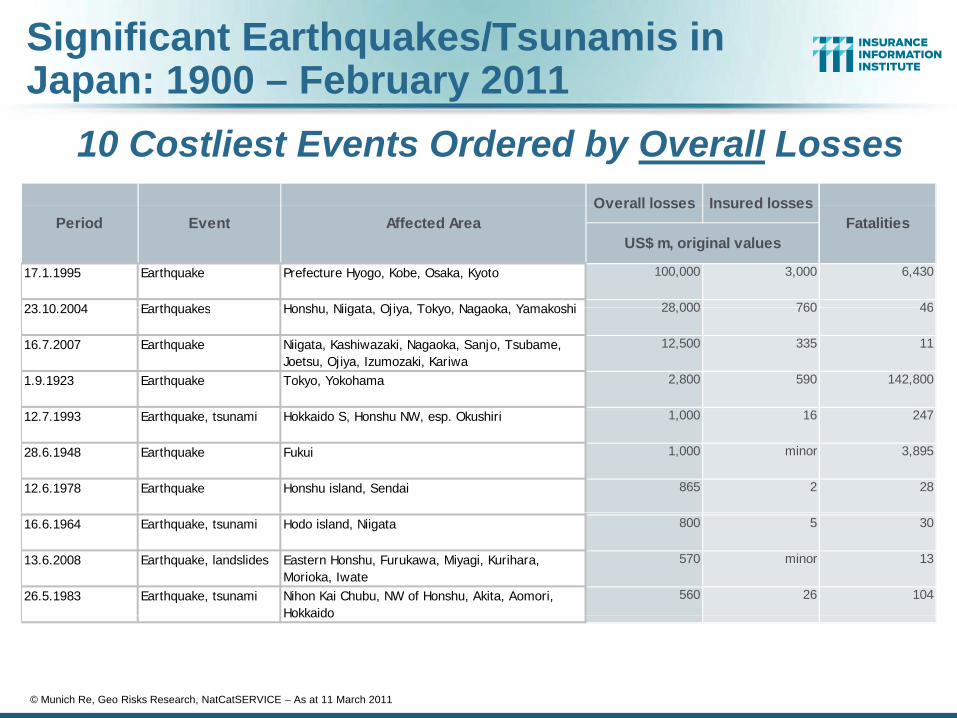
Significant Earthquakes/Tsunamis in Japan: 1900 – February 2011
Overall losses Insured losses
10 Costliest Events Ordered by Overall LossesOverall losses Insured losses
17.1.1995 Earthquake Prefecture Hyogo, Kobe, Osaka, Kyoto 100,000 3,000 6,430
23 10 2004 Earthquakes Honshu Niigata Ojiya Tokyo Nagaoka Yamakoshi 28 000 760 46
FatalitiesPeriod Event Affected AreaUS$ m, original values
23.10.2004 Earthquakes Honshu, Niigata, Ojiya, Tokyo, Nagaoka, Yamakoshi 28,000 760 46
16.7.2007 Earthquake Niigata, Kashiwazaki, Nagaoka, Sanjo, Tsubame, Joetsu, Ojiya, Izumozaki, Kariwa
12,500 335 11
1.9.1923 Earthquake Tokyo, Yokohama 2,800 590 142,800
1 000 16 2412.7.1993 Earthquake, tsunami Hokkaido S, Honshu NW, esp. Okushiri 1,000 16 247
28.6.1948 Earthquake Fukui 1,000 minor 3,895
12.6.1978 Earthquake Honshu island, Sendai 865 2 28
16.6.1964 Earthquake, tsunami Hodo island, Niigata 800 5 30
13.6.2008 Earthquake, landslides Eastern Honshu, Furukawa, Miyagi, Kurihara, Morioka, Iwate
570 minor 13
26.5.1983 Earthquake, tsunami Nihon Kai Chubu, NW of Honshu, Akita, Aomori, Hokkaido
560 26 104
© Munich Re, Geo Risks Research, NatCatSERVICE – As at 11 March 2011
Hokkaido
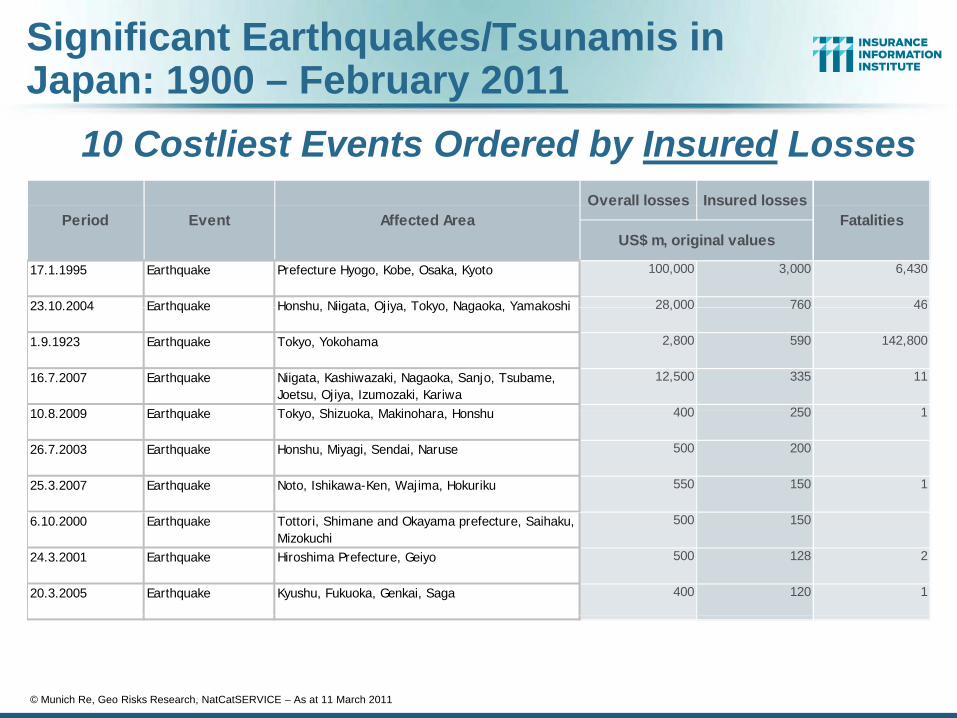
Significant Earthquakes/Tsunamis in Japan: 1900 – February 2011
Overall losses Insured losses
10 Costliest Events Ordered by Insured LossesOverall losses Insured losses
17.1.1995 Earthquake Prefecture Hyogo, Kobe, Osaka, Kyoto 100,000 3,000 6,430
23 10 2004 Earthquake Honshu Niigata Ojiya Tokyo Nagaoka Yamakoshi 28,000 760 46
Period Event Affected Area FatalitiesUS$ m, original values
23.10.2004 Earthquake Honshu, Niigata, Ojiya, Tokyo, Nagaoka, Yamakoshi 28,000 760 46
1.9.1923 Earthquake Tokyo, Yokohama 2,800 590 142,800
16.7.2007 Earthquake Niigata, Kashiwazaki, Nagaoka, Sanjo, Tsubame, Joetsu, Ojiya, Izumozaki, Kariwa
12,500 335 11
10 8 2009 E th k T k Shi k M ki h H h 400 250 110.8.2009 Earthquake Tokyo, Shizuoka, Makinohara, Honshu 400 250 1
26.7.2003 Earthquake Honshu, Miyagi, Sendai, Naruse 500 200
25.3.2007 Earthquake Noto, Ishikawa-Ken, Wajima, Hokuriku 550 150 1
6.10.2000 Earthquake Tottori, Shimane and Okayama prefecture, Saihaku, Mizokuchi
500 150
24.3.2001 Earthquake Hiroshima Prefecture, Geiyo 500 128 2
20.3.2005 Earthquake Kyushu, Fukuoka, Genkai, Saga 400 120 1
© Munich Re, Geo Risks Research, NatCatSERVICE – As at 11 March 2011
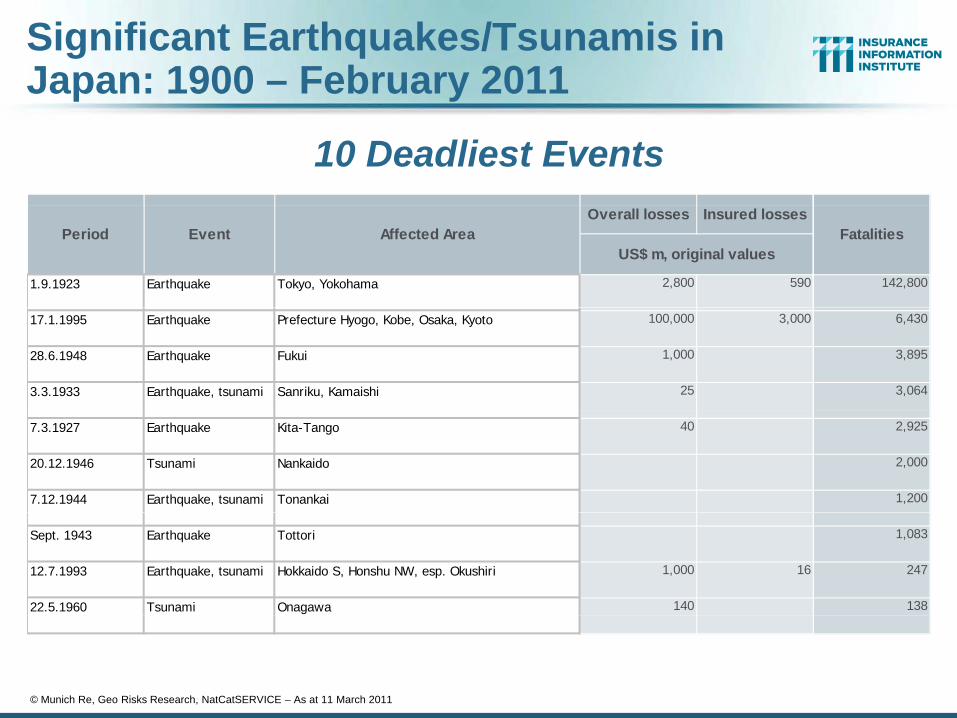
Significant Earthquakes/Tsunamis in Japan: 1900 – February 2011
10 Deadliest EventsOverall losses Insured losses
1.9.1923 Earthquake Tokyo, Yokohama 2,800 590 142,800
US$ m, original valuesFatalitiesPeriod Event Affected Area
17.1.1995 Earthquake Prefecture Hyogo, Kobe, Osaka, Kyoto 100,000 3,000 6,430
28.6.1948 Earthquake Fukui 1,000 3,895
3.3.1933 Earthquake, tsunami Sanriku, Kamaishi 25 3,064
7.3.1927 Earthquake Kita-Tango 40 2,925
20.12.1946 Tsunami Nankaido 2,000
7.12.1944 Earthquake, tsunami Tonankai 1,200
Sept. 1943 Earthquake Tottori 1,083
12.7.1993 Earthquake, tsunami Hokkaido S, Honshu NW, esp. Okushiri 1,000 16 247
22.5.1960 Tsunami Onagawa 140 138
© Munich Re, Geo Risks Research, NatCatSERVICE – As at 11 March 2011
Historical Analysis ofHistorical Analysis of Global Earthquake Activity
Earthquakes Are Often CostlyEarthquakes Are Often Costly and Deadly; Activity in 2010 and
2011 Has Been Elevated30
2011 Has Been Elevated
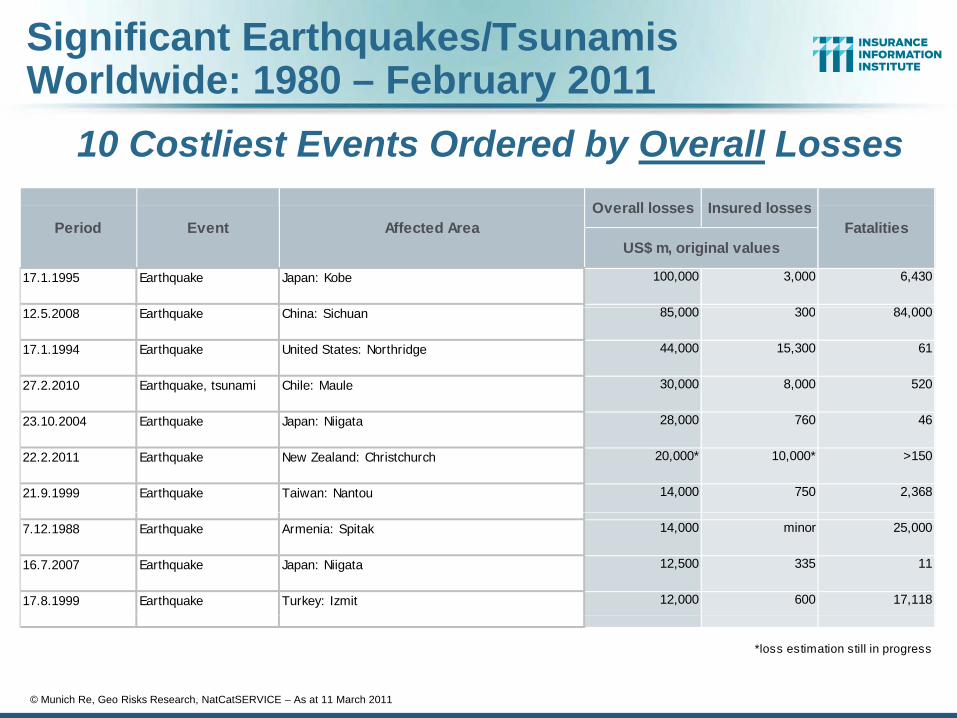
Significant Earthquakes/Tsunamis Worldwide: 1980 – February 2011
O erall losses Ins red losses
10 Costliest Events Ordered by Overall LossesOverall losses Insured losses
17.1.1995 Earthquake Japan: Kobe 100,000 3,000 6,430
85 000 300 84 000
FatalitiesPeriod Event Affected AreaUS$ m, original values
12.5.2008 Earthquake China: Sichuan 85,000 300 84,000
17.1.1994 Earthquake United States: Northridge 44,000 15,300 61
27.2.2010 Earthquake, tsunami Chile: Maule 30,000 8,000 520
23.10.2004 Earthquake Japan: Niigata 28,000 760 46
22.2.2011 Earthquake New Zealand: Christchurch 20,000* 10,000* >150
21.9.1999 Earthquake Taiwan: Nantou 14,000 750 2,368
7.12.1988 Earthquake Armenia: Spitak 14,000 minor 25,000
16.7.2007 Earthquake Japan: Niigata 12,500 335 11
17.8.1999 Earthquake Turkey: Izmit 12,000 600 17,118
*loss estimation still in progress
© Munich Re, Geo Risks Research, NatCatSERVICE – As at 11 March 2011
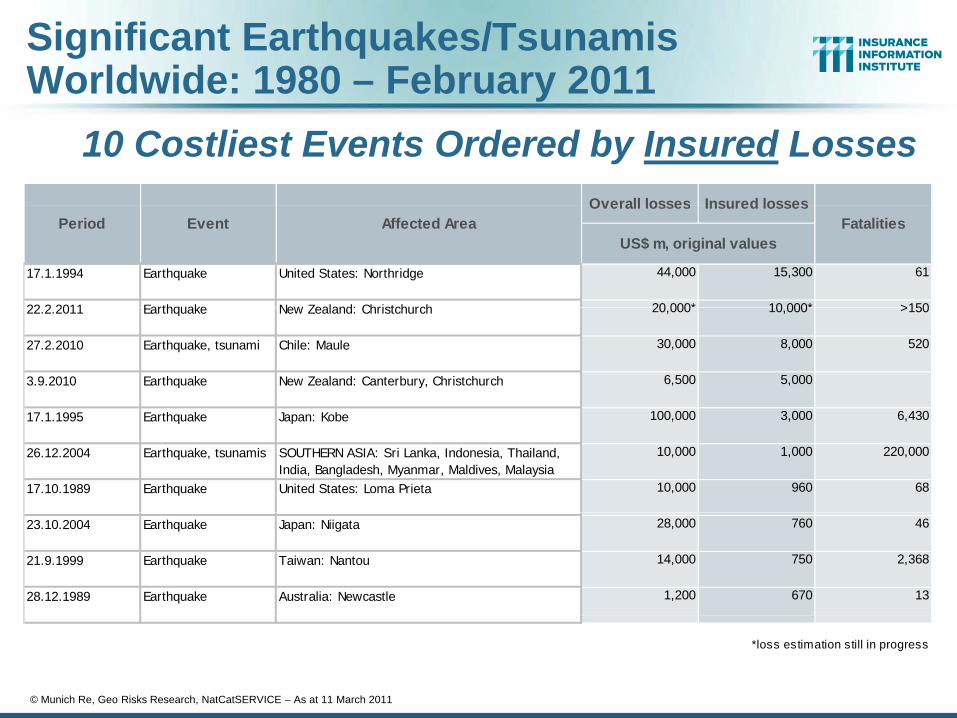
Significant Earthquakes/Tsunamis Worldwide: 1980 – February 2011
Overall losses Insured losses
10 Costliest Events Ordered by Insured LossesOverall losses Insured losses
17.1.1994 Earthquake United States: Northridge 44,000 15,300 61
22 2 2011 Earthquake New Zealand: Christchurch 20 000* 10 000* >150
Period Event Affected Area FatalitiesUS$ m, original values
22.2.2011 Earthquake New Zealand: Christchurch 20,000 10,000 >150
27.2.2010 Earthquake, tsunami Chile: Maule 30,000 8,000 520
3.9.2010 Earthquake New Zealand: Canterbury, Christchurch 6,500 5,000
17.1.1995 Earthquake Japan: Kobe 100,000 3,000 6,430
26.12.2004 Earthquake, tsunamis SOUTHERN ASIA: Sri Lanka, Indonesia, Thailand, India, Bangladesh, Myanmar, Maldives, Malaysia
10,000 1,000 220,000
17.10.1989 Earthquake United States: Loma Prieta 10,000 960 68
23.10.2004 Earthquake Japan: Niigata 28,000 760 46
21.9.1999 Earthquake Taiwan: Nantou 14,000 750 2,368
28.12.1989 Earthquake Australia: Newcastle 1,200 670 13
*loss estimation still in progress
© Munich Re, Geo Risks Research, NatCatSERVICE – As at 11 March 2011
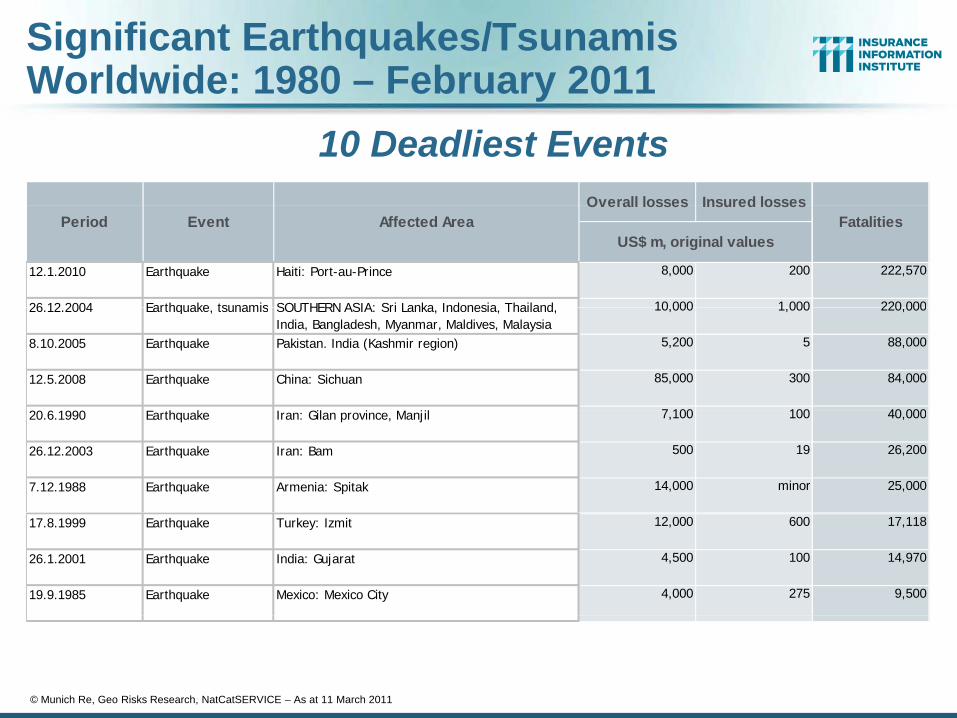
Significant Earthquakes/Tsunamis Worldwide: 1980 – February 2011
Overall losses Insured losses
10 Deadliest EventsOverall losses Insured losses
12.1.2010 Earthquake Haiti: Port-au-Prince 8,000 200 222,570
26 12 2004 Earthquake tsunamis SOUTHERN ASIA: Sri Lanka Indonesia Thailand 10 000 1 000 220 000
US$ m, original valuesFatalitiesPeriod Event Affected Area
26.12.2004 Earthquake, tsunamis SOUTHERN ASIA: Sri Lanka, Indonesia, Thailand, India, Bangladesh, Myanmar, Maldives, Malaysia
10,000 1,000 220,000
8.10.2005 Earthquake Pakistan. India (Kashmir region) 5,200 5 88,000
12.5.2008 Earthquake China: Sichuan 85,000 300 84,000
20 6 990 h k G l l 7 100 100 40 00020.6.1990 Earthquake Iran: Gilan province, Manjil 7,100 100 40,000
26.12.2003 Earthquake Iran: Bam 500 19 26,200
7.12.1988 Earthquake Armenia: Spitak 14,000 minor 25,000
17.8.1999 Earthquake Turkey: Izmit 12,000 600 17,118
26.1.2001 Earthquake India: Gujarat 4,500 100 14,970
19.9.1985 Earthquake Mexico: Mexico City 4,000 275 9,500
© Munich Re, Geo Risks Research, NatCatSERVICE – As at 11 March 2011
Historical Analysis of U.S. Earthquake Activity
Most—But Not All—MajorU S Earthquakes HaveU.S. Earthquakes Have
Occurred on the West Coast
34
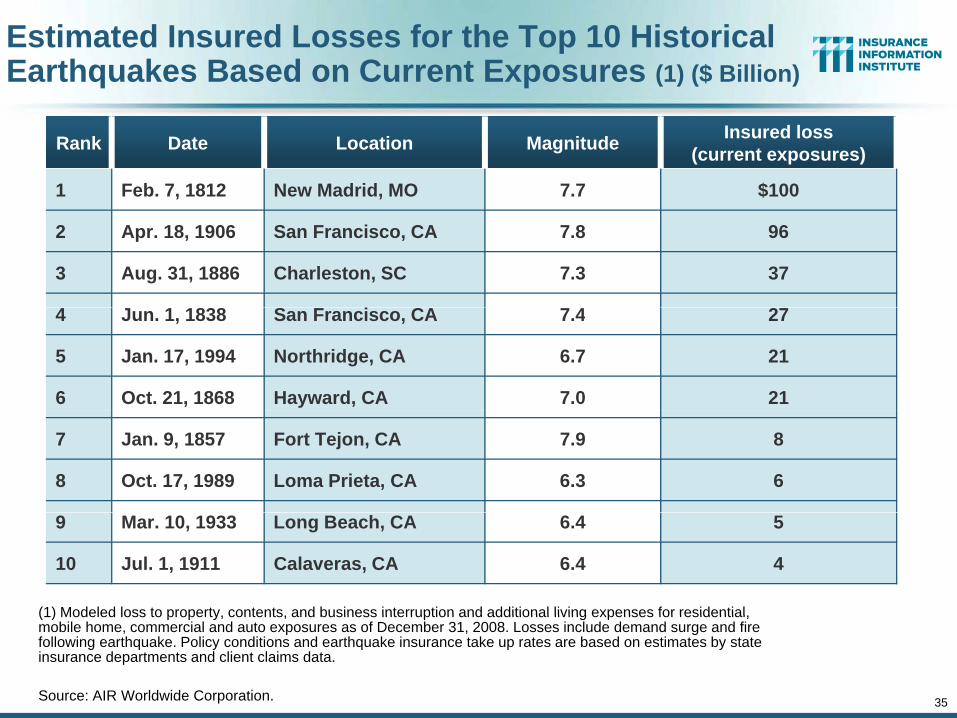
Estimated Insured Losses for the Top 10 Historical Earthquakes Based on Current Exposures (1) ($ Billion)
Rank Date Location Magnitude Insured loss(current exposures)
1 Feb. 7, 1812 New Madrid, MO 7.7 $100
2 Apr. 18, 1906 San Francisco, CA 7.8 96
3 Aug. 31, 1886 Charleston, SC 7.3 37
4 1 1838 S C 4 24 Jun. 1, 1838 San Francisco, CA 7.4 27
5 Jan. 17, 1994 Northridge, CA 6.7 21
6 Oct. 21, 1868 Hayward, CA 7.0 21
7 Jan. 9, 1857 Fort Tejon, CA 7.9 8
8 Oct. 17, 1989 Loma Prieta, CA 6.3 6
(1) Modeled loss to property contents and business interruption and additional living expenses for residential
9 Mar. 10, 1933 Long Beach, CA 6.4 5
10 Jul. 1, 1911 Calaveras, CA 6.4 4
35
(1) Modeled loss to property, contents, and business interruption and additional living expenses for residential, mobile home, commercial and auto exposures as of December 31, 2008. Losses include demand surge and fire following earthquake. Policy conditions and earthquake insurance take up rates are based on estimates by state insurance departments and client claims data.
Source: AIR Worldwide Corporation.
Catastrophe Losses AreCatastrophe Losses Are Trending Adverselyg y
36
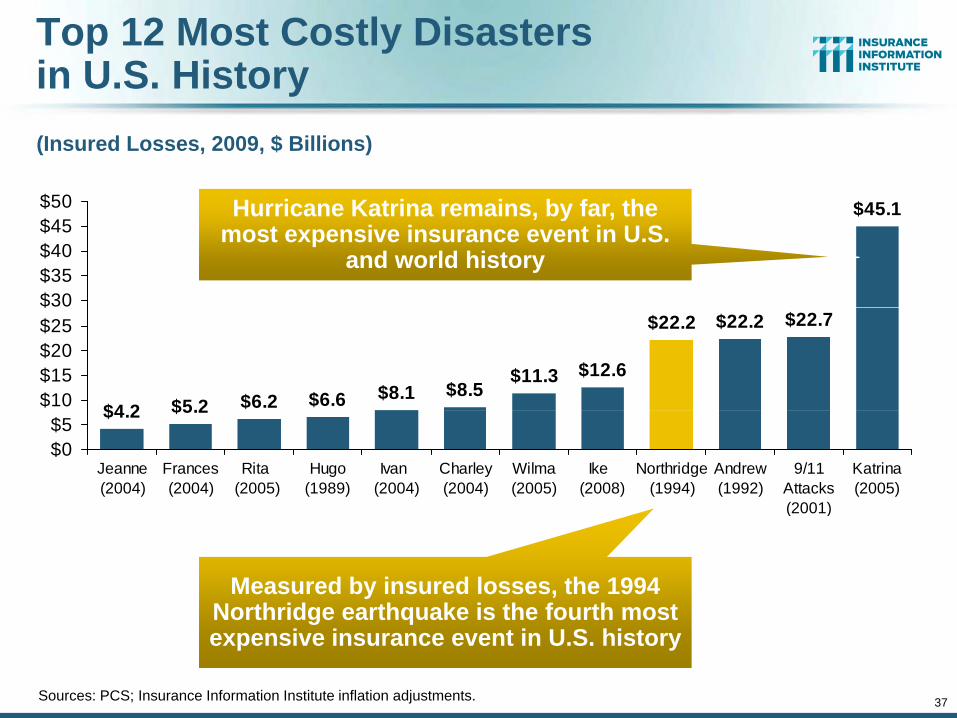
Top 12 Most Costly Disastersin U.S. History(Insured Losses, 2009, $ Billions)
$45 1$50 Hurricane Katrina remains by far the $45.1
$30$35$40$45$50 Hurricane Katrina remains, by far, the
most expensive insurance event in U.S. and world history
$11.3 $12.6
$22.2 $22.2 $22.7
$8.5$8.1$6.6$6.2$5.2$4 2$10$15$20$25$
$5.2$4.2
$0$5
Jeanne(2004)
Frances(2004)
Rita (2005)
Hugo(1989)
Ivan (2004)
Charley(2004)
Wilma(2005)
Ike (2008)
Northridge(1994)
Andrew(1992)
9/11Attacks(2001)
Katrina(2005)
(2001)
Measured by insured losses, the 1994 Northridge earthquake is the fourth most
37Sources: PCS; Insurance Information Institute inflation adjustments.
Northridge earthquake is the fourth most expensive insurance event in U.S. history
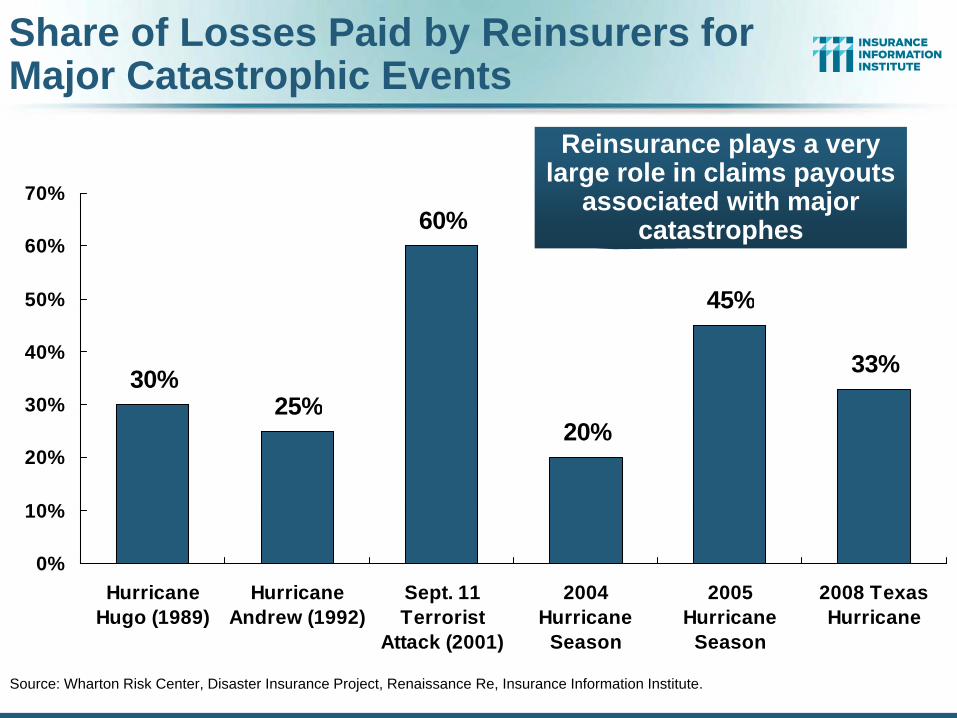
Share of Losses Paid by Reinsurers for Major Catastrophic Events
70%
Reinsurance plays a very large role in claims payouts
associated with major60%
45%50%
60%
associated with major catastrophes
30%25%
45%
33%30%
40%
25%20%
10%
20%
30%
0%
10%
HurricaneHugo (1989)
HurricaneAndrew (1992)
Sept. 11Terrorist
2004Hurricane
2005Hurricane
2008 TexasHurricaneHugo (1989) Andrew (1992) Terrorist
Attack (2001)Hurricane
SeasonHurricane
SeasonHurricane
Source: Wharton Risk Center, Disaster Insurance Project, Renaissance Re, Insurance Information Institute.
Historical Global Catastrophe Loss Summary and TrendsLoss Summary and Trends
Losses Have Been GenerallyLosses Have Been Generally Increasing on a Global Scale.
Capacity Will Need to Increase ifCapacity Will Need to Increase if Current Disaster Trends Continue
39
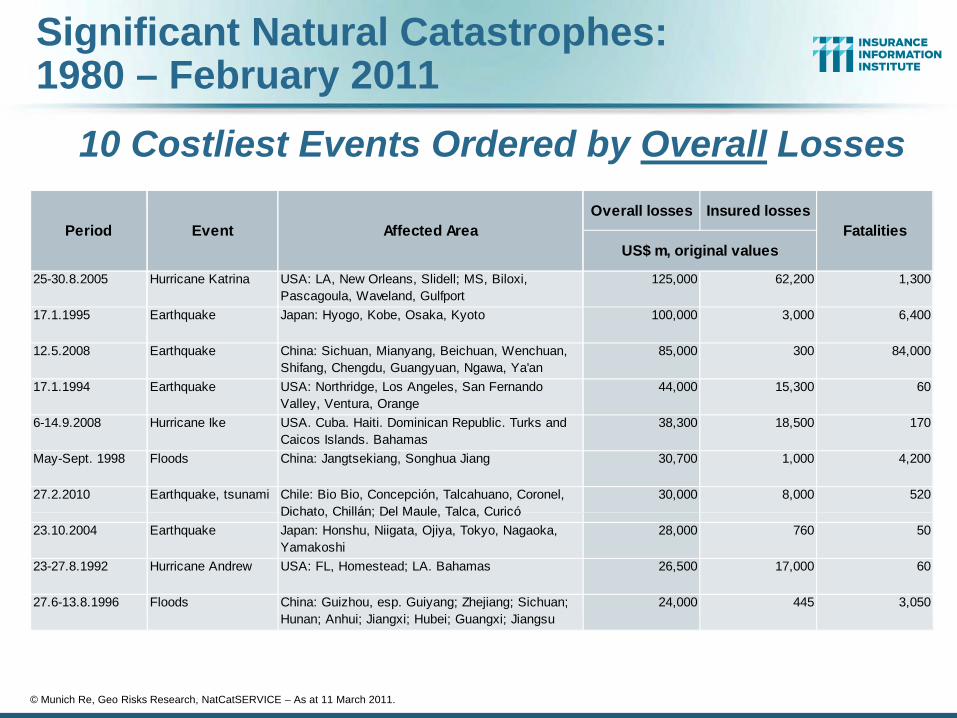
Significant Natural Catastrophes: 1980 – February 2011
O ll l I d lO ll l I d l
10 Costliest Events Ordered by Overall LossesOverall losses Insured losses
25-30.8.2005 Hurricane Katrina USA: LA, New Orleans, Slidell; MS, Biloxi, Pascagoula, Waveland, Gulfport
125,000 62,200 1,300
FatalitiesPeriod Event Affected AreaUS$ m, original values
Overall losses Insured losses
25-30.8.2005 Hurricane Katrina USA: LA, New Orleans, Slidell; MS, Biloxi, Pascagoula, Waveland, Gulfport
125,000 62,200 1,300
FatalitiesPeriod Event Affected AreaUS$ m, original values
17.1.1995 Earthquake Japan: Hyogo, Kobe, Osaka, Kyoto 100,000 3,000 6,400
12.5.2008 Earthquake China: Sichuan, Mianyang, Beichuan, Wenchuan, Shifang, Chengdu, Guangyuan, Ngawa, Ya'an
85,000 300 84,000
17.1.1994 Earthquake USA: Northridge, Los Angeles, San Fernando Valley, Ventura, Orange
44,000 15,300 60
17.1.1995 Earthquake Japan: Hyogo, Kobe, Osaka, Kyoto 100,000 3,000 6,400
12.5.2008 Earthquake China: Sichuan, Mianyang, Beichuan, Wenchuan, Shifang, Chengdu, Guangyuan, Ngawa, Ya'an
85,000 300 84,000
17.1.1994 Earthquake USA: Northridge, Los Angeles, San Fernando Valley, Ventura, Orange
44,000 15,300 60y g
6-14.9.2008 Hurricane Ike USA. Cuba. Haiti. Dominican Republic. Turks and Caicos Islands. Bahamas
38,300 18,500 170
May-Sept. 1998 Floods China: Jangtsekiang, Songhua Jiang 30,700 1,000 4,200
27.2.2010 Earthquake, tsunami Chile: Bio Bio, Concepción, Talcahuano, Coronel, Dichato Chillán; Del Maule Talca Curicó
30,000 8,000 520
y g6-14.9.2008 Hurricane Ike USA. Cuba. Haiti. Dominican Republic. Turks and
Caicos Islands. Bahamas38,300 18,500 170
May-Sept. 1998 Floods China: Jangtsekiang, Songhua Jiang 30,700 1,000 4,200
27.2.2010 Earthquake, tsunami Chile: Bio Bio, Concepción, Talcahuano, Coronel, Dichato Chillán; Del Maule Talca Curicó
30,000 8,000 520Dichato, Chillán; Del Maule, Talca, Curicó
23.10.2004 Earthquake Japan: Honshu, Niigata, Ojiya, Tokyo, Nagaoka, Yamakoshi
28,000 760 50
23-27.8.1992 Hurricane Andrew USA: FL, Homestead; LA. Bahamas 26,500 17,000 60
27.6-13.8.1996 Floods China: Guizhou, esp. Guiyang; Zhejiang; Sichuan; H A h i Ji i H b i G i Ji
24,000 445 3,050
Dichato, Chillán; Del Maule, Talca, Curicó23.10.2004 Earthquake Japan: Honshu, Niigata, Ojiya, Tokyo, Nagaoka,
Yamakoshi28,000 760 50
23-27.8.1992 Hurricane Andrew USA: FL, Homestead; LA. Bahamas 26,500 17,000 60
27.6-13.8.1996 Floods China: Guizhou, esp. Guiyang; Zhejiang; Sichuan; H A h i Ji i H b i G i Ji
24,000 445 3,050Hunan; Anhui; Jiangxi; Hubei; Guangxi; JiangsuHunan; Anhui; Jiangxi; Hubei; Guangxi; Jiangsu
© Munich Re, Geo Risks Research, NatCatSERVICE – As at 11 March 2011.
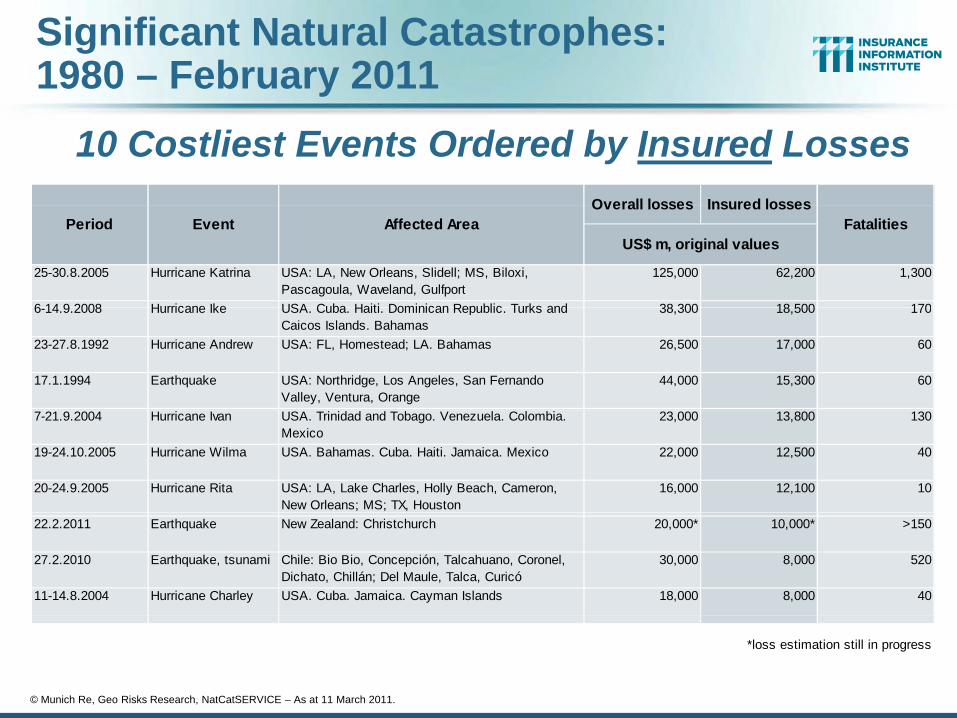
Significant Natural Catastrophes: 1980 – February 2011
Overall losses Insured losses
10 Costliest Events Ordered by Insured LossesOverall losses Insured losses
25-30.8.2005 Hurricane Katrina USA: LA, New Orleans, Slidell; MS, Biloxi, Pascagoula, Waveland, Gulfport
125,000 62,200 1,300
6 14 9 2008 Hurricane Ike USA Cuba Haiti Dominican Republic Turks and 38 300 18 500 170
Period Event Affected Area FatalitiesUS$ m, original values
6-14.9.2008 Hurricane Ike USA. Cuba. Haiti. Dominican Republic. Turks and Caicos Islands. Bahamas
38,300 18,500 170
23-27.8.1992 Hurricane Andrew USA: FL, Homestead; LA. Bahamas 26,500 17,000 60
17.1.1994 Earthquake USA: Northridge, Los Angeles, San Fernando Valley, Ventura, Orange
44,000 15,300 60
7-21.9.2004 Hurricane Ivan USA. Trinidad and Tobago. Venezuela. Colombia. Mexico
23,000 13,800 130
19-24.10.2005 Hurricane Wilma USA. Bahamas. Cuba. Haiti. Jamaica. Mexico 22,000 12,500 40
20-24.9.2005 Hurricane Rita USA: LA, Lake Charles, Holly Beach, Cameron, New Orleans; MS; TX, Houston
16,000 12,100 10
22.2.2011 Earthquake New Zealand: Christchurch 20,000* 10,000* >150
27.2.2010 Earthquake, tsunami Chile: Bio Bio, Concepción, Talcahuano, Coronel, Dichato, Chillán; Del Maule, Talca, Curicó
30,000 8,000 520
11-14.8.2004 Hurricane Charley USA. Cuba. Jamaica. Cayman Islands 18,000 8,000 40
*loss estimation still in progress
© Munich Re, Geo Risks Research, NatCatSERVICE – As at 11 March 2011.
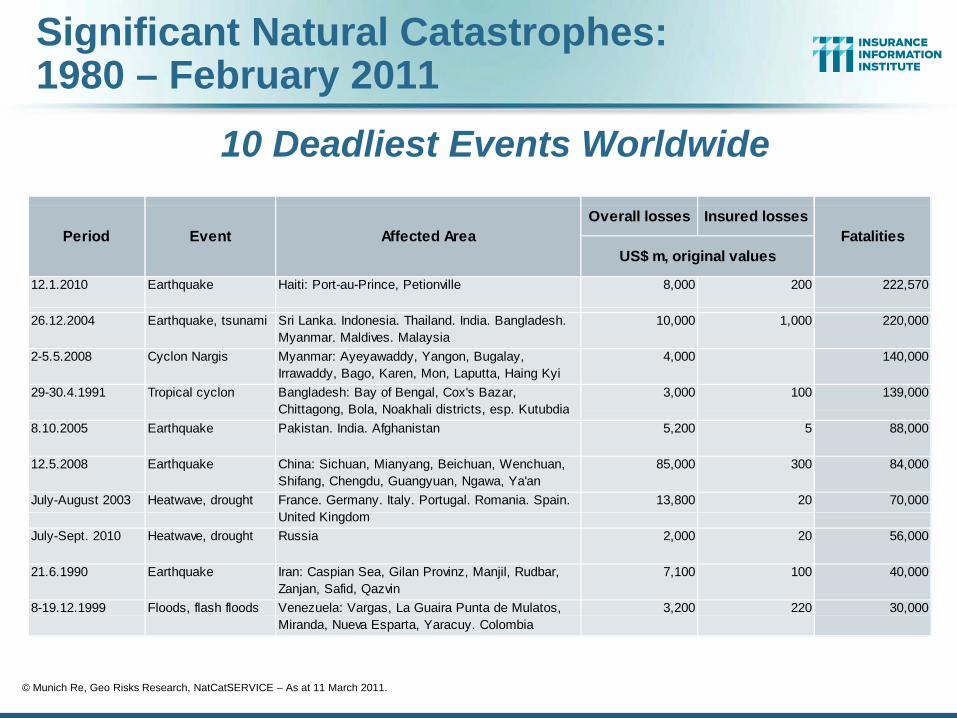
Significant Natural Catastrophes: 1980 – February 2011
10 Deadliest Events WorldwideOverall losses Insured losses
12.1.2010 Earthquake Haiti: Port-au-Prince, Petionville 8,000 200 222,570
US$ m, original valuesFatalitiesPeriod Event Affected Area
26.12.2004 Earthquake, tsunami Sri Lanka. Indonesia. Thailand. India. Bangladesh. Myanmar. Maldives. Malaysia
10,000 1,000 220,000
2-5.5.2008 Cyclon Nargis Myanmar: Ayeyawaddy, Yangon, Bugalay, Irrawaddy, Bago, Karen, Mon, Laputta, Haing Kyi
4,000 140,000
29-30.4.1991 Tropical cyclon Bangladesh: Bay of Bengal, Cox's Bazar, Chittagong Bola Noakhali districts esp Kutubdia
3,000 100 139,000Chittagong, Bola, Noakhali districts, esp. Kutubdia
8.10.2005 Earthquake Pakistan. India. Afghanistan 5,200 5 88,000
12.5.2008 Earthquake China: Sichuan, Mianyang, Beichuan, Wenchuan, Shifang, Chengdu, Guangyuan, Ngawa, Ya'an
85,000 300 84,000
July-August 2003 Heatwave, drought France. Germany. Italy. Portugal. Romania. Spain. U it d Ki d
13,800 20 70,000United Kingdom
July-Sept. 2010 Heatwave, drought Russia 2,000 20 56,000
21.6.1990 Earthquake Iran: Caspian Sea, Gilan Provinz, Manjil, Rudbar, Zanjan, Safid, Qazvin
7,100 100 40,000
8-19.12.1999 Floods, flash floods Venezuela: Vargas, La Guaira Punta de Mulatos, 3,200 220 30,000Miranda, Nueva Esparta, Yaracuy. Colombia
© Munich Re, Geo Risks Research, NatCatSERVICE – As at 11 March 2011.
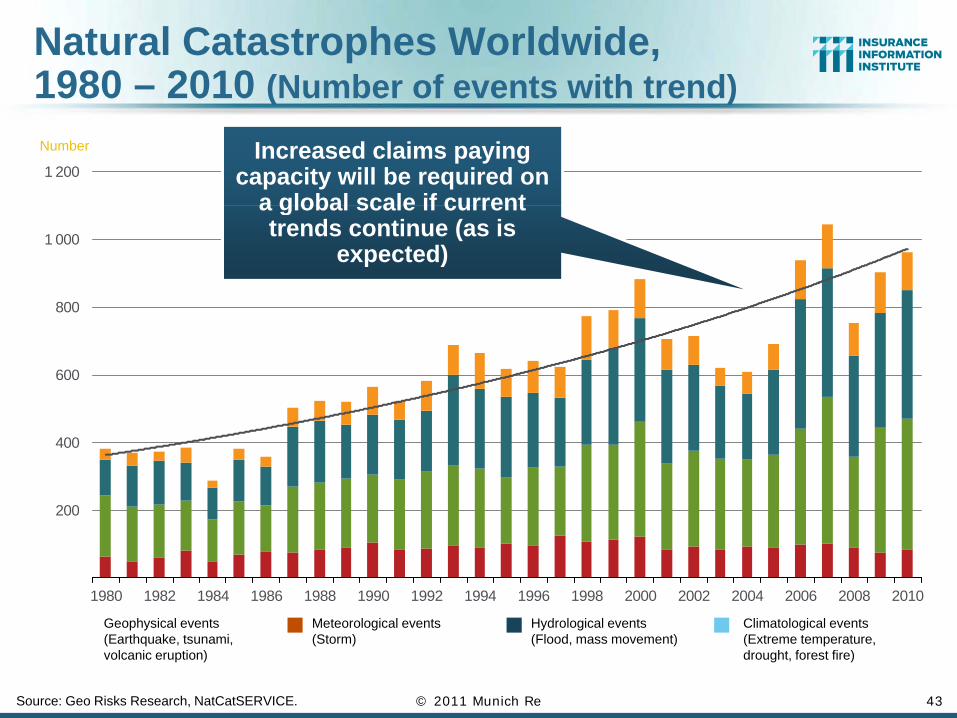
Natural Catastrophes Worldwide, 1980 – 2010 (Number of events with trend)( )Number
1 200Increased claims paying
capacity will be required on a global scale if current
800
1 000
a global scale if current trends continue (as is
expected)
600
800
200
400
200
1980 1982 1984 1986 1988 1990 1992 1994 1996 1998 2000 2002 2004 2006 2008 2010
Meteorological events(Storm)
Hydrological events(Flood, mass movement)
Climatological events(Extreme temperature, drought, forest fire)
Geophysical events(Earthquake, tsunami, volcanic eruption)
Source: Geo Risks Research, NatCatSERVICE. 43© 2011 Munich Re
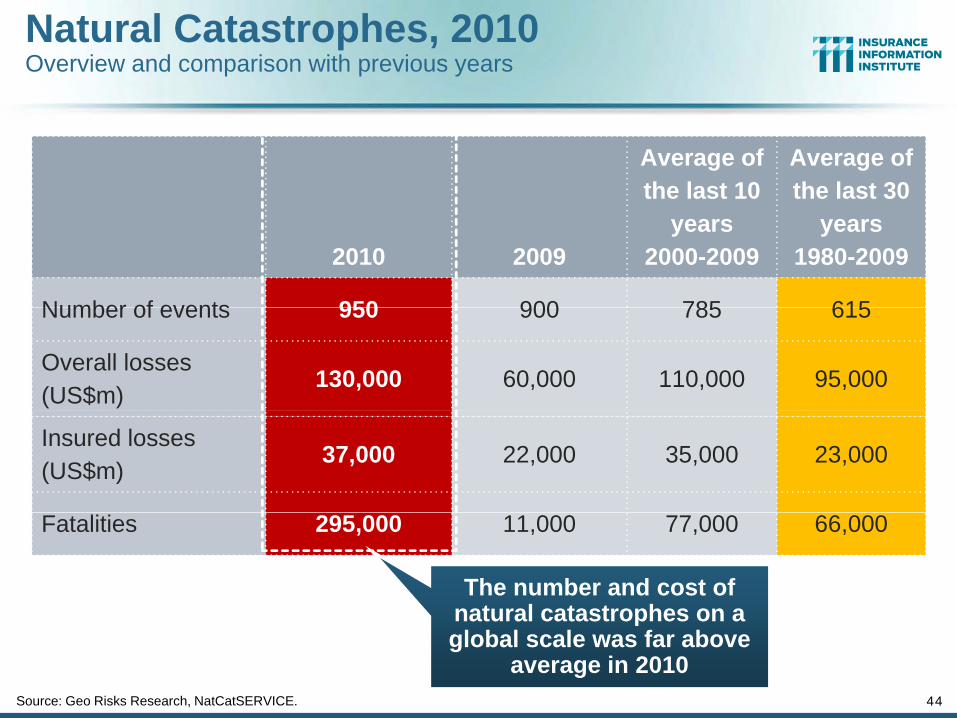
Natural Catastrophes, 2010Overview and comparison with previous years
Average of the last 10
Average of the last 30
2010 2009years
2000-2009years
1980-2009
Number of events 950 900 785 615Number of events 950 900 785 615
Overall losses (US$m)
130,000 60,000 110,000 95,000
Insured losses (US$m)
37,000 22,000 35,000 23,000
Fatalities 295,000 11,000 77,000 66,000
The number and cost of natural catastrophes on a
Source: Geo Risks Research, NatCatSERVICE. 44
natural catastrophes on a global scale was far above
average in 2010
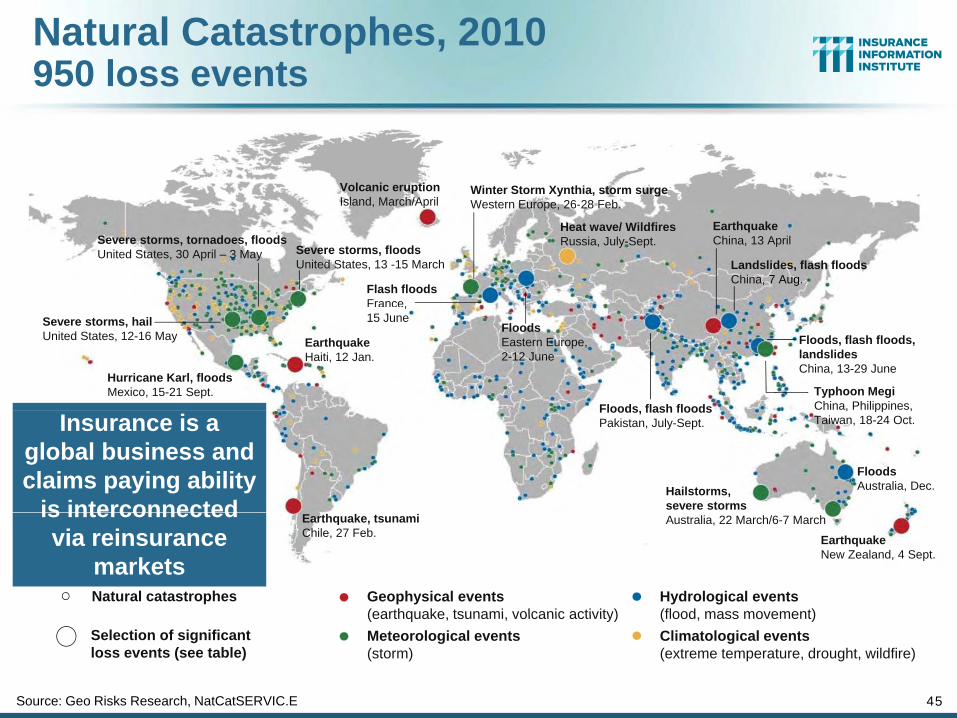
Natural Catastrophes, 2010950 loss events
Volcanic eruption Island, March/April
Winter Storm Xynthia, storm surgeWestern Europe 26-28 FebIsland, March/April
Heat wave/ WildfiresRussia, July-Sept.
Severe storms, floodsUnited States, 13 -15 March
Western Europe, 26-28 Feb.
Flash floodsFrance,
Earthquake China, 13 April
Landslides, flash floodsChina, 7 Aug.
Severe storms, tornadoes, floodsUnited States, 30 April – 3 May
EarthquakeHaiti, 12 Jan.
Hurricane Karl, floodsMexico, 15-21 Sept.
,15 June
Floods flash floods
FloodsEastern Europe, 2-12 June
Floods, flash floods,landslidesChina, 13-29 June
Severe storms, hailUnited States, 12-16 May
Typhoon MegiChina, Philippines,Floods, flash floods
Pakistan, July-Sept.
Hailstorms, severe storms
, pp ,Taiwan, 18-24 Oct.
FloodsAustralia, Dec.
Insurance is a global business and claims paying ability
is interconnected
Geophysical events(earthquake tsunami volcanic activity)
Hydrological events(flood mass movement)
Natural catastrophes
Earthquake, tsunamiChile, 27 Feb.
Australia, 22 March/6-7 March
EarthquakeNew Zealand, 4 Sept.
is interconnected via reinsurance
markets
(earthquake, tsunami, volcanic activity)Meteorological events (storm)
(flood, mass movement)Climatological events(extreme temperature, drought, wildfire)
Selection of significant loss events (see table)
Source: Geo Risks Research, NatCatSERVIC.E 45

Insurance Information Institute Online:
www iii orgwww.iii.org
Thank you for your timed tt ti !and your attention!
Twitter: twitter.com/bob_hartwig_ gDownload at www.iii.org/presentations