japan: greater energy security through renewables -...
TRANSCRIPT
0 Japan: Greater Energy Security Through Renewables
Japan: Greater Energy Security Through Renewables Electricity Transformation in a Post-Nuclear Economy
March 2017
Tim Buckley, Director of Energy Finance Studies, Australasia ([email protected]) and
Simon Nicholas, Energy Finance Analyst ([email protected])
1 Japan: Greater Energy Security Through Renewables
Table of Contents Executive Summary and Key Findings ………………………………………………………............ 2 Recent Trends in Japan’s Electricity Market …………………………………………………….…. 5 Japan’s Electricity Generation Policies ……………………………………………………………. 12 Energy Efficiency: Japan Leads …………………………………………………………………….. 16 Status of Japanese Power Generation Technologies ………………………………………….. 19 Growing Japanese Investment in Renewables Overseas……………………………………….29 IEEFA’s Japanese Electricity Model…………………………………………………………….…… 31 Conclusion ………………………………………………………………………………………………. 36
2 Japan: Greater Energy Security Through Renewables
Executive Summary This report outlines how the risks and challenges facing Japan’s electricity system can be better addressed through investment in renewable energy, which will also build energy security and reduce long-term reliance on imported fossil fuels and nuclear production.
Fundamental to our assessment is the fact that increases in energy efficiency have driven down electricity demand in Japan over the past six years and will continue to do so going forward. The positive influence of this key factor is often underplayed.
Energy efficiency in Japan supports the expansion of renewables. Our Japanese electricity sector model shows how falling demand, despite the probable strong uptake of electric vehicles, creates an ideal scenario for greater renewable energy investment. Six years after Tokyo Electric Power Co.’s Fukushima nuclear disaster, Japan is at a turning point on energy policy. Its challenges are delineated by sluggish economic growth, a shrinking population and declining electricity demand, down 11.5% from its 2010 peak.
Policies since 2011 favouring replacement of nuclear baseload with fossil fuel baseload have proven costly, resulting in lost opportunities in the development of increasingly available renewable energy, which is seeing technology gains drive rapid declines in costs.
At stake in Japan’s energy transition are issues that transcend economics; indeed, Japan’s very energy security remains a risk. Before Fukushima, Japan had enough nuclear fuel to ensure nuclear power played an important role in long-term domestic production of electricity. Since Fukushima and the reactor shutdowns, the country has become deeply reliant on fossil fuel imports. This has contributed to a reversal in trade balance from 30 years of trade surplus to a deficit that reached US$116 billion in 2014. Japan can go a long way toward delivering on its Paris climate agreement commitments and improving its energy security by increasing the share of renewable energy in its generation mix. Strong policy leadership is essential.
Key Findings 1. Energy productivity gains will drive down electricity demand from 1,140 terawatt hours
(TWh) in FY2010 to 868TWh in 2030. With population decline limiting economic growth and Japan’s world-leading energy efficiency driving further energy productivity gains, electricity demand is set to decrease until at least 2030, as it has done for the past six years. Electricity generation totalled 1,140 terawatt hours (TWh) in FY2010 and then dropped 11.5% to 1,009 in FY2015. IEEFA sees continued productivity gains of 2% annually, driving generation down to 868TWh by 2030.
3 Japan: Greater Energy Security Through Renewables
2. As Japan reconfigures its electricity industry, solar PV could account for 12% of Japan’s electricity-generation mix by 2030. As total electricity generation drops, solar PV has the potential to account for 12% of Japan’s electricity mix by 2030, up from 4% at present. Japan was the second largest installer globally of solar PV from 2013-2015. But with generous feed-in-tariffs that supported this expansion coming to an end, new policy support by the Japanese government will be required to perpetuate solar growth. A recent move towards reverse auctions for large-scale solar suggests Japan can realise significant further solar cost reductions, like those currently being achieved around the world. If introduced, a policy focus on rooftop solar and ongoing market reforms will expand Japan’s renewables footprint, while large pumped hydro storage capacity and greater regional grid connectivity will help integrate increased solar PV into the still largely regional grids.
3. Japanese offshore wind-power resources have tremendous potential, and can viably
contribute to baseload power demand. While onshore wind development has been slow due to Japan’s lengthy approvals process for the limited suitable land available, significant and overlooked opportunities exist in offshore wind development. Indeed, offshore wind-powered generation has enormous potential that has been largely missed in Japan’s long-term energy plan. Japan has one of best manufacturing industries in the world—perhaps the best—and some Japanese companies are beginning to move on this front. Mitsubishi Heavy Industries is currently researching and developing offshore wind technology as well as supplying offshore turbines via its joint venture with MHI Vestas Offshore Wind. China and the U.S. are moving now to aggressively exploit this major, underused resource. Offshore wind’s inherent absence of land constraint issues works in its favour, as do its utilization rates of 45% to 50%, which indicate it can contribute to baseload power. IEEFA models 10 gigawatts (GW) of offshore wind in Japan by FY2030. Europe and China could reach 100GW each of offshore capacity in this timeframe.
4. Japan is in a position to meet 35% of its electricity needs with renewables by 2030.
Assuming a much-needed policy push to increase solar and offshore wind capacity and factoring in the country’s probable electricity demand reduction, Japan’s total renewable energy share will double to 35% of generation by 2030. In IEEFA’s model, this includes hydro and biomass and depends on the Japanese government delivering on its COP21 pledge. It requires a major lowering of regulatory and grid barriers to renewable energy projects, changes that will allow Japan to tap capital markets to support national renewable energy programs. Similar strides have been made recently in France, where the government has launched a €7 billion green bond initiative to finance renewable energy and energy efficiency. If this happens in Japan, IEEFA estimates that its total renewable capacity will reach 100GW by the end of FY2016 and 159GW by 2030, almost triple the 2010 capacity.
5. Japan’s nuclear industry, mothballed after the Fukushima disaster, will probably not
recover. IEEFA sees only a quarter of Japan’s 40GW of offline nuclear power capacity coming back into service by 2030. Nuclear power accounts for only 8% of total electricity generation by then, well short of the government’s target of 20-22%. Although Japan is seeking to restart nuclear production as a way to diversify its generation mix and improve energy security, the industry will face strong headwinds, as financially distressed operators struggle to achieve new safety standards before reactors reach their retirement dates.
4 Japan: Greater Energy Security Through Renewables
6. Japan will very likely scale back plans to construct a new fleet of coal-fired power plants. Most of the 45 new coal-fired power plants Japan is proposing to build are still in the planning stages and — because of Japan’s declining electricity demand — many will not reach the construction phase. Whether the proposed coal fleet expansion would actually add overall capacity or merely replace existing thermal capacity is unclear anyway, and momentum for the initiative is fading. Japan’s major electricity power companies (EPCOs) have recently started to reassess their coal-fired generation plans. In January 2017, citing declining electricity demand, Kansai Electric Power Company announced a halt to a program to switch Ako power station Units 1 and 2 from oil-fired to coal-fired generation.
Even assuming no net thermal capacity expansion to 2030, lower electricity demand and increased renewable capacity will cut into utilization rates for such capacity. IEEFA sees Japanese thermal power generation declining to 40% below 2015 levels by 2030. Similar trends have been apparent now for some time in China and India, where drives to install both thermal and renewable capacity concurrently have seen coal-fired power station utilization rates drop to 47% and 56% respectively in 2016, even with electricity demand rising in those countries. IEEFA expects that only one quarter of offline nuclear reactors will come back into service. In the unlikely event that Japan’s nuclear restarts exceed this level, the result will be further downward pressure on thermal generation utilization rates. As it goes through its electricity transition, Japan can learn from global trends toward investments in smart, nationally connected grids coupled with much greater reliance on renewables and energy efficiency.
5 Japan: Greater Energy Security Through Renewables
Recent Trends in Japan’s Electricity Market Japan abruptly changed its electricity generation system in the wake of the Fukushima nuclear accident of March 11, 2011. The disaster led to the shutdown of all of the country’s nuclear reactors (42GW in total), creating widespread electricity shortages. In the fiscal year (April 1- March 31) in which the Fukushima meltdown occurred, Japan relied on nuclear power for 25% of its electricity generation. In the three years after the accident, nuclear power capacity within Japan was wound down to zero. Although the government is planning to restart some nuclear reactors, in the six years since the Fukushima accident Japan has grown increasingly — and perilously — reliant on fossil fuel imports (coal, gas and oil) for 82% of its electricity generation. This has contributed to a reversal in its trade balance from 30 years of trade surplus to a deficit that reached US$116 billion in 2014.1
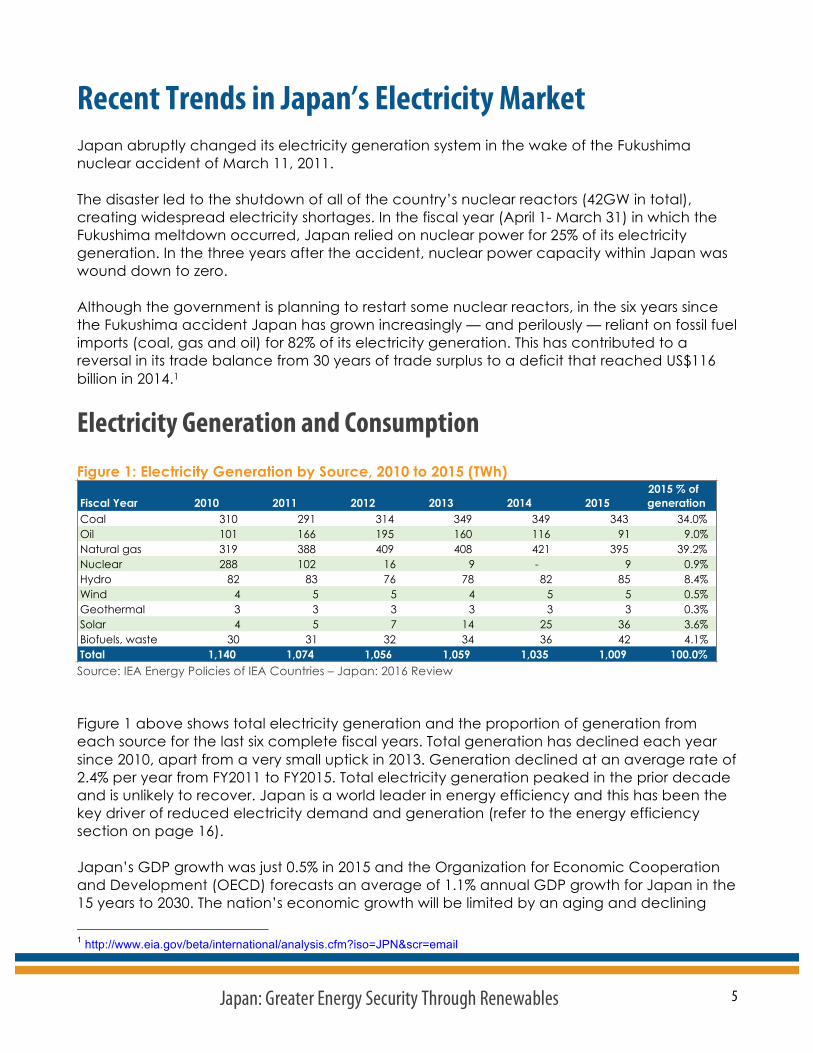
Electricity Generation and Consumption Figure 1: Electricity Generation by Source, 2010 to 2015 (TWh)
Source: IEA Energy Policies of IEA Countries – Japan: 2016 Review Figure 1 above shows total electricity generation and the proportion of generation from each source for the last six complete fiscal years. Total generation has declined each year since 2010, apart from a very small uptick in 2013. Generation declined at an average rate of 2.4% per year from FY2011 to FY2015. Total electricity generation peaked in the prior decade and is unlikely to recover. Japan is a world leader in energy efficiency and this has been the key driver of reduced electricity demand and generation (refer to the energy efficiency section on page 16). Japan’s GDP growth was just 0.5% in 2015 and the Organization for Economic Cooperation and Development (OECD) forecasts an average of 1.1% annual GDP growth for Japan in the 15 years to 2030. The nation’s economic growth will be limited by an aging and declining
1 http://www.eia.gov/beta/international/analysis.cfm?iso=JPN&scr=email
Fiscal Year 2010 2011 2012 2013 2014 20152015 % of generation
Coal 310 291 314 349 349 343 34.0%Oil 101 166 195 160 116 91 9.0%Natural gas 319 388 409 408 421 395 39.2%Nuclear 288 102 16 9 - 9 0.9%Hydro 82 83 76 78 82 85 8.4%Wind 4 5 5 4 5 5 0.5%Geothermal 3 3 3 3 3 3 0.3%Solar 4 5 7 14 25 36 3.6%Biofuels, waste 30 31 32 34 36 42 4.1%Total 1,140 1,074 1,056 1,059 1,035 1,009 100.0%
6 Japan: Greater Energy Security Through Renewables
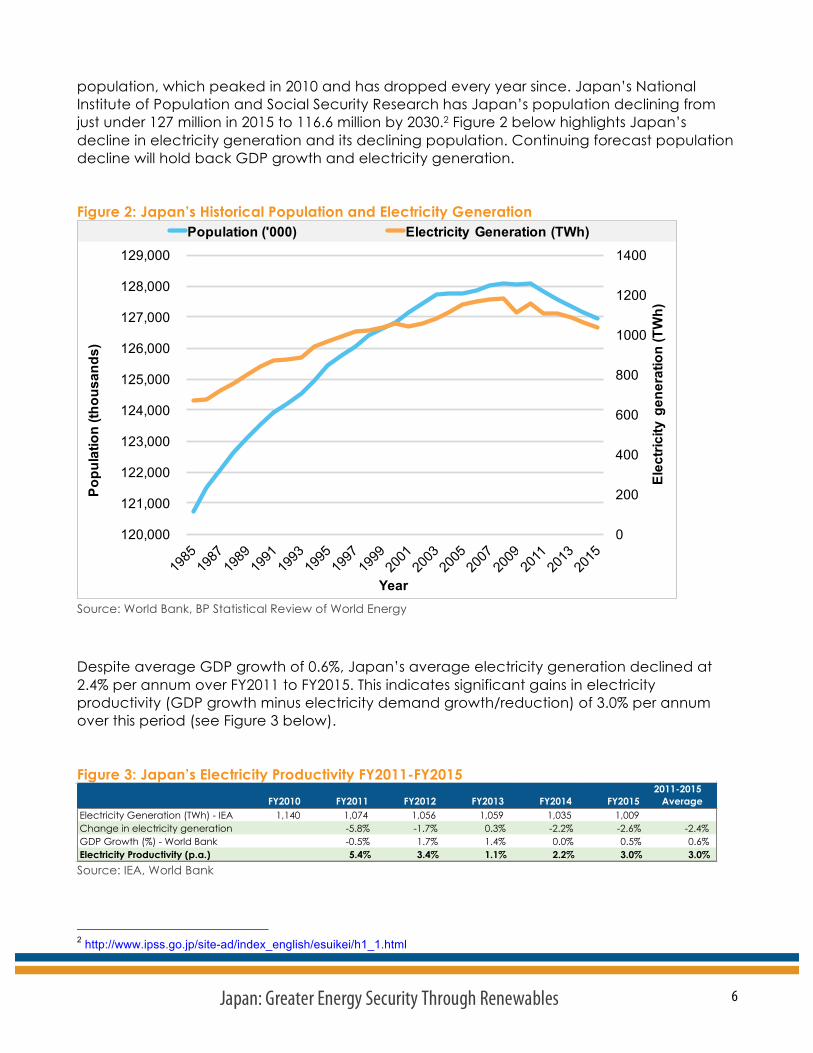
population, which peaked in 2010 and has dropped every year since. Japan’s National Institute of Population and Social Security Research has Japan’s population declining from just under 127 million in 2015 to 116.6 million by 2030.2 Figure 2 below highlights Japan’s decline in electricity generation and its declining population. Continuing forecast population decline will hold back GDP growth and electricity generation. Figure 2: Japan’s Historical Population and Electricity Generation
Source: World Bank, BP Statistical Review of World Energy Despite average GDP growth of 0.6%, Japan’s average electricity generation declined at 2.4% per annum over FY2011 to FY2015. This indicates significant gains in electricity productivity (GDP growth minus electricity demand growth/reduction) of 3.0% per annum over this period (see Figure 3 below). Figure 3: Japan’s Electricity Productivity FY2011-FY2015
Source: IEA, World Bank 2 http://www.ipss.go.jp/site-ad/index_english/esuikei/h1_1.html
0
200
400
600
800
1000
1200
1400
120,000
121,000
122,000
123,000
124,000
125,000
126,000
127,000
128,000
129,000
Elec
trici
ty g
ener
atio
n (T
Wh)
Popu
latio
n (th
ousa
nds)
Year
Population ('000) Electricity Generation (TWh)
FY2010 FY2011 FY2012 FY2013 FY2014 FY20152011-2015
AverageElectricity Generation (TWh) - IEA 1,140 1,074 1,056 1,059 1,035 1,009 Change in electricity generation -5.8% -1.7% 0.3% -2.2% -2.6% -2.4%GDP Growth (%) - World Bank -0.5% 1.7% 1.4% 0.0% 0.5% 0.6%Electricity Productivity (p.a.) 5.4% 3.4% 1.1% 2.2% 3.0% 3.0%
7 Japan: Greater Energy Security Through Renewables
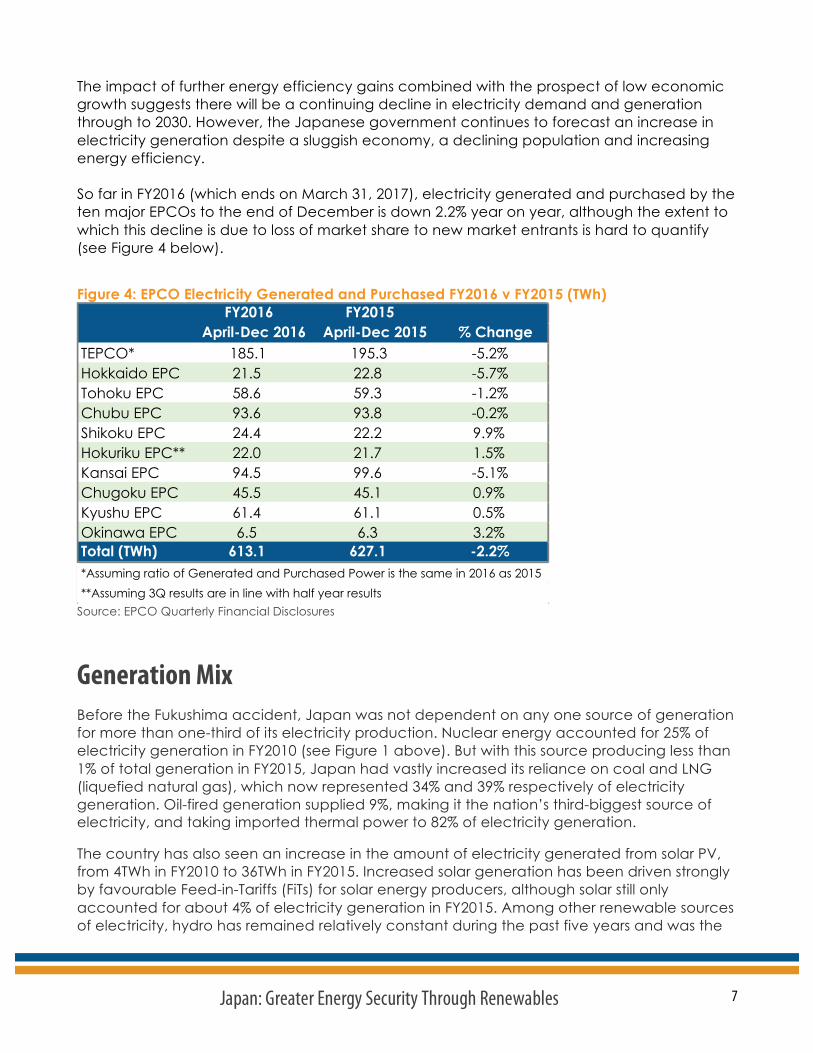
The impact of further energy efficiency gains combined with the prospect of low economic growth suggests there will be a continuing decline in electricity demand and generation through to 2030. However, the Japanese government continues to forecast an increase in electricity generation despite a sluggish economy, a declining population and increasing energy efficiency. So far in FY2016 (which ends on March 31, 2017), electricity generated and purchased by the ten major EPCOs to the end of December is down 2.2% year on year, although the extent to which this decline is due to loss of market share to new market entrants is hard to quantify (see Figure 4 below).
Figure 4: EPCO Electricity Generated and Purchased FY2016 v FY2015 (TWh)
Source: EPCO Quarterly Financial Disclosures
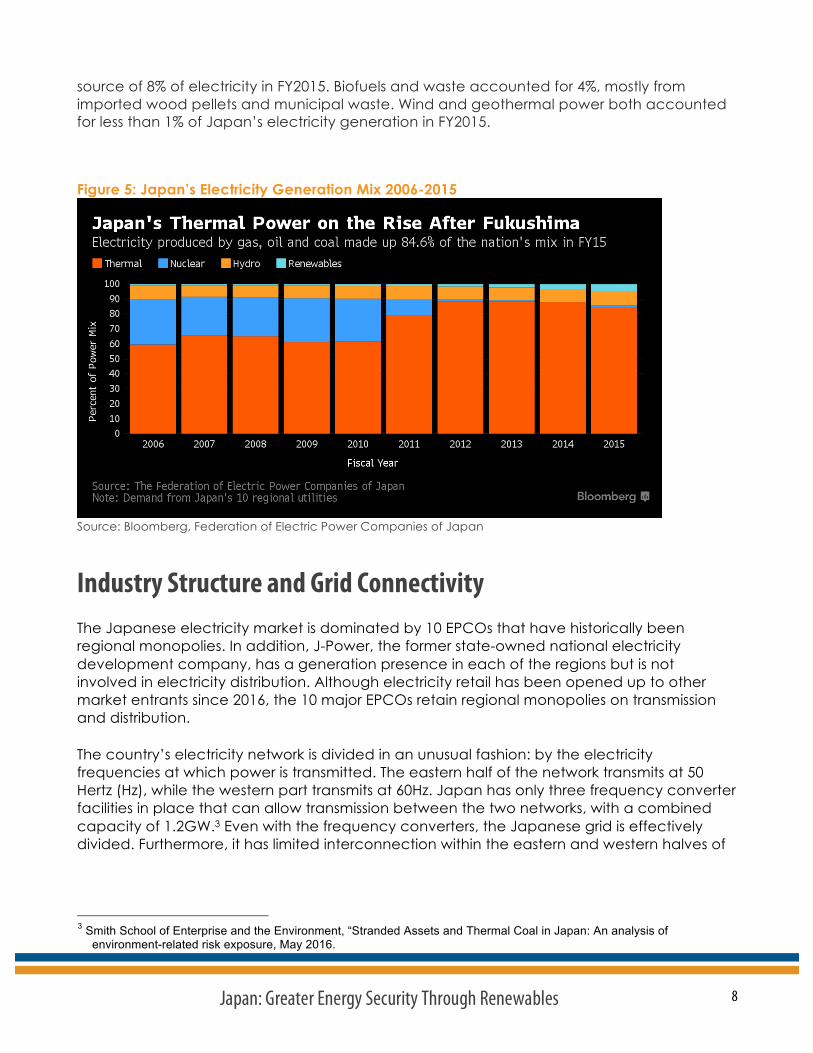
Generation Mix Before the Fukushima accident, Japan was not dependent on any one source of generation for more than one-third of its electricity production. Nuclear energy accounted for 25% of electricity generation in FY2010 (see Figure 1 above). But with this source producing less than 1% of total generation in FY2015, Japan had vastly increased its reliance on coal and LNG (liquefied natural gas), which now represented 34% and 39% respectively of electricity generation. Oil-fired generation supplied 9%, making it the nation’s third-biggest source of electricity, and taking imported thermal power to 82% of electricity generation.
The country has also seen an increase in the amount of electricity generated from solar PV, from 4TWh in FY2010 to 36TWh in FY2015. Increased solar generation has been driven strongly by favourable Feed-in-Tariffs (FiTs) for solar energy producers, although solar still only accounted for about 4% of electricity generation in FY2015. Among other renewable sources of electricity, hydro has remained relatively constant during the past five years and was the
FY2016 FY2015April-Dec 2016 April-Dec 2015 % Change
TEPCO* 185.1 195.3 -5.2%Hokkaido EPC 21.5 22.8 -5.7%Tohoku EPC 58.6 59.3 -1.2%Chubu EPC 93.6 93.8 -0.2%Shikoku EPC 24.4 22.2 9.9%Hokuriku EPC** 22.0 21.7 1.5%Kansai EPC 94.5 99.6 -5.1%Chugoku EPC 45.5 45.1 0.9%Kyushu EPC 61.4 61.1 0.5%Okinawa EPC 6.5 6.3 3.2%Total (TWh) 613.1 627.1 -2.2%*Assuming ratio of Generated and Purchased Power is the same in 2016 as 2015**Assuming 3Q results are in line with half year results
8 Japan: Greater Energy Security Through Renewables
source of 8% of electricity in FY2015. Biofuels and waste accounted for 4%, mostly from imported wood pellets and municipal waste. Wind and geothermal power both accounted for less than 1% of Japan’s electricity generation in FY2015.
Figure 5: Japan’s Electricity Generation Mix 2006-2015
Source: Bloomberg, Federation of Electric Power Companies of Japan
Industry Structure and Grid Connectivity The Japanese electricity market is dominated by 10 EPCOs that have historically been regional monopolies. In addition, J-Power, the former state-owned national electricity development company, has a generation presence in each of the regions but is not involved in electricity distribution. Although electricity retail has been opened up to other market entrants since 2016, the 10 major EPCOs retain regional monopolies on transmission and distribution.
The country’s electricity network is divided in an unusual fashion: by the electricity frequencies at which power is transmitted. The eastern half of the network transmits at 50 Hertz (Hz), while the western part transmits at 60Hz. Japan has only three frequency converter facilities in place that can allow transmission between the two networks, with a combined capacity of 1.2GW.3 Even with the frequency converters, the Japanese grid is effectively divided. Furthermore, it has limited interconnection within the eastern and western halves of
3 Smith School of Enterprise and the Environment, “Stranded Assets and Thermal Coal in Japan: An analysis of
environment-related risk exposure, May 2016.
9 Japan: Greater Energy Security Through Renewables
the system, due to the regional monopolies on transmission and distribution held by the major EPCOs. This is a key energy security risk and national policy failure.
The electricity supply-demand balance across the network is now overseen and controlled by the independent Organization for Cross-regional Coordination of Transmission Operators (OCCTO), established in 2015. The organization’s role includes planning for the strengthening of cross-regional connections, including frequency conversion, between the two halves of the network.
Grid Stability and Effectiveness The security and effectiveness of the grid is recognized as a priority in the Fourth Strategic Energy Plan 2014 (refer to “Japan’s Electricity Policies” section on page 12). The Japanese network is not interconnected with any neighboring countries (although we note the strategic merit of the very forward-looking Softbank, KEPCO, State Grid and ROSSETI proposal to examine international grid interconnectivity for north Asia4). In addition, the regional transmission and distribution monopolies have limited internal interconnection, a circumstance that has drawn a government focus on adequate baseload power in each region in hopes of overcoming this limitation. The 2014 Strategic Energy Plan (SEP) acknowledges the need for investment in power transmission to increase interconnection and stability, as the Japanese power system continues its transition and more renewable energy is brought online.
Following the shutdown of Japanese nuclear reactors, it became abruptly clear that excess capacity in the western part of the country could not be used to meet eastern demand, due to the lack of frequency conversion between western and eastern grids. Plans are in place now to make transmission upgrades and improvements, including increased interconnection between Hokkaido and Honshu islands, as well as for increasing east-west connectivity to 2.1GW by fiscal year 2020, up from 1.2GW5 at present.
In addition to helping increase national network interconnection, renewable energy can play an important role in stabilization of the grid. Japan already has flexible, renewable energy sources that can help balance variability within the network, including the highest installed capacity of pumped hydro storage per peak demand of all countries tracked by the International Energy Agency (IEA)6 (around 26GW). Japan also remains the only country to have developed sea water pumped-storage capacity. The country’s solar PV generation profile is well correlated with its load peaks, which are due mostly to demand for air-conditioning and other cooling. As a result, distributed solar PV has the demonstrated potential to reduce transmission and distribution balancing issues.
4 http://www.softbank.jp/en/corp/news/press/sb/2016/20160330_01/ 5 IEA, Energy Policies of IEA Countries – Japan: 2016 Review. 6 IEA, Energy Policies of IEA Countries – Japan: 2016 Review.
10 Japan: Greater Energy Security Through Renewables
Alternative storage technologies that have similar potential to enhance grid stability and support the construction of a smart grid are under development in Japan. A smart meter rollout that will further drive this process is due by 2024.
The model being used to develop such new technologies is similar to those used to develop the nation’s successful automobile sector7, and they reflect the recognition that Japan can use new storage options to complement and strengthen its uniquely structured electricity system and that it can do so while enhancing technology-led export opportunities. In addition to new types of batteries, Japan is looking to develop flywheel storage and hydrogen technology, which can store excess renewable power. The latter is part of Japan’s “hydrogen society” vision that it intends to showcase at the 2020 Tokyo Olympic Games.
Effect of Electric Vehicles on Demand The “hydrogen society” vision extends to Japan’s automotive sector. In 2016, the Ministry of Economy, Trade and Industry (METI) set a target of having 40,000 hydrogen-powered vehicles on the road by 2020, and the ministry is encouraging the rollout of hydrogen refuelling stations.8 Major companies are backing the hydrogen push: Toyota and Honda are among the Japanese global firms that formed the Hydrogen Council in January 2017 to promote the initiative.9 Toyota has already launched its first hydrogen-powered car.
Promoting hydrogen is a strategic industry bet by a country dependent on fuel imports. It could pay off hugely if the technology is taken up globally. Hydrogen-powered cars have advantages over electric vehicles (EVs) in terms of range and speed of refuelling. As both technologies develop, one technology may not necessarily win out and the two may end up complementing each other.
However, with all-electric vehicle prices dropping much faster than hydrogen-fuel-cell-powered cars, EVs are destined for a rapid uptake in Japan and in the rest of the developed world. The country has been an early adopter of battery-electric and plug-in hybrid models. It had more than 126,000 in use in 2015.10
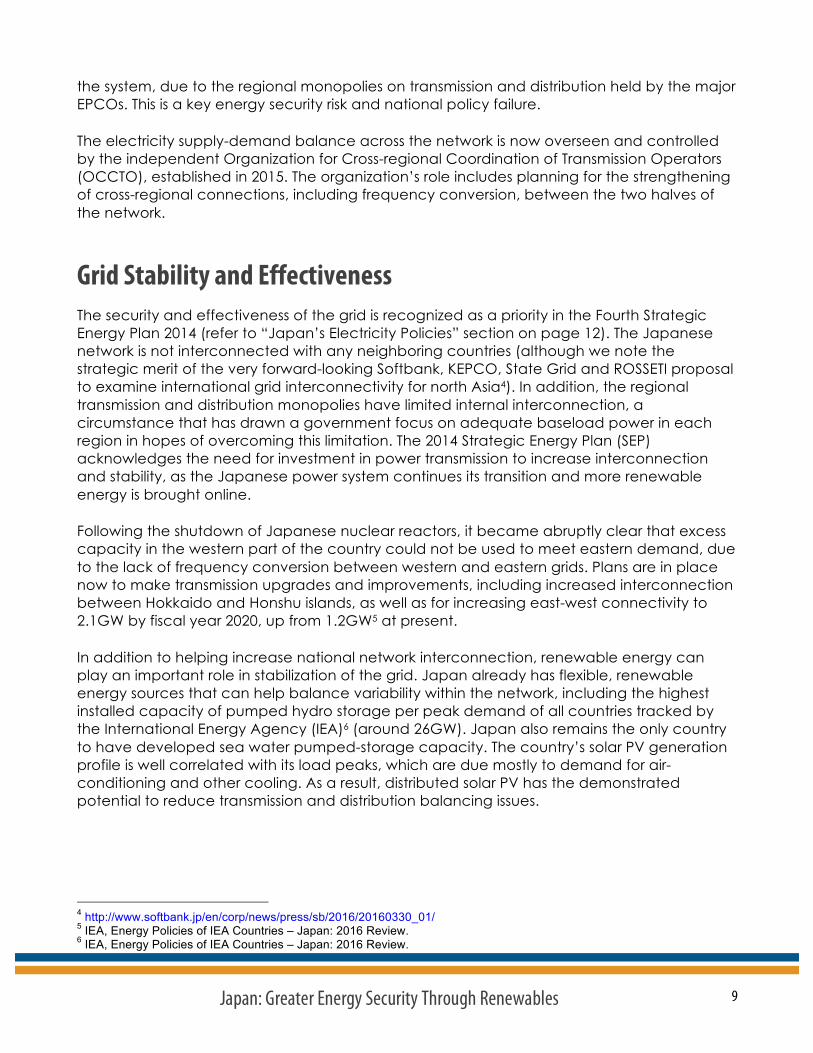
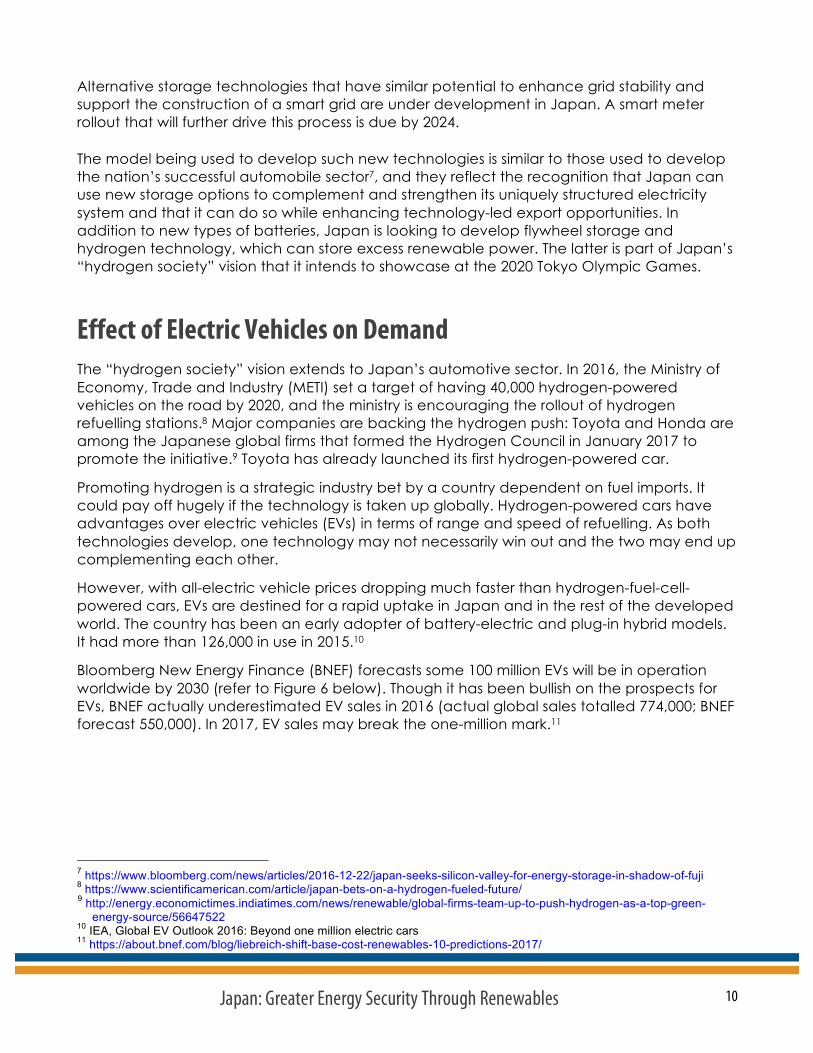
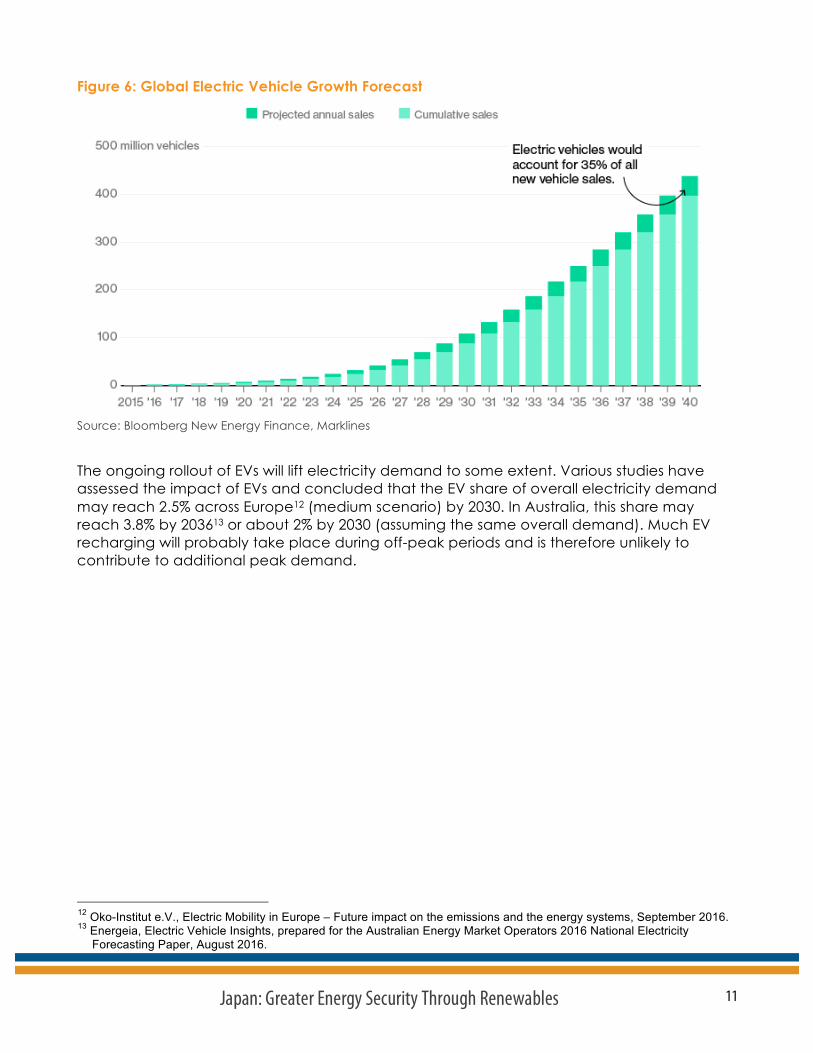
Bloomberg New Energy Finance (BNEF) forecasts some 100 million EVs will be in operation worldwide by 2030 (refer to Figure 6 below). Though it has been bullish on the prospects for EVs, BNEF actually underestimated EV sales in 2016 (actual global sales totalled 774,000; BNEF forecast 550,000). In 2017, EV sales may break the one-million mark.11
7 https://www.bloomberg.com/news/articles/2016-12-22/japan-seeks-silicon-valley-for-energy-storage-in-shadow-of-fuji 8 https://www.scientificamerican.com/article/japan-bets-on-a-hydrogen-fueled-future/ 9 http://energy.economictimes.indiatimes.com/news/renewable/global-firms-team-up-to-push-hydrogen-as-a-top-green-
energy-source/56647522 10 IEA, Global EV Outlook 2016: Beyond one million electric cars 11 https://about.bnef.com/blog/liebreich-shift-base-cost-renewables-10-predictions-2017/
11 Japan: Greater Energy Security Through Renewables
Figure 6: Global Electric Vehicle Growth Forecast
Source: Bloomberg New Energy Finance, Marklines
The ongoing rollout of EVs will lift electricity demand to some extent. Various studies have assessed the impact of EVs and concluded that the EV share of overall electricity demand may reach 2.5% across Europe12 (medium scenario) by 2030. In Australia, this share may reach 3.8% by 203613 or about 2% by 2030 (assuming the same overall demand). Much EV recharging will probably take place during off-peak periods and is therefore unlikely to contribute to additional peak demand.
12 Oko-Institut e.V., Electric Mobility in Europe – Future impact on the emissions and the energy systems, September 2016. 13 Energeia, Electric Vehicle Insights, prepared for the Australian Energy Market Operators 2016 National Electricity
Forecasting Paper, August 2016.
12 Japan: Greater Energy Security Through Renewables
Japan’s Electricity Generation Policies
Strategic Energy Policy (2014) Japanese energy policy is set out in its Strategic Energy Policies (SEPs), the fourth of which was adopted in 2014. This was the first to be developed since the Great East Japan Earthquake and the disaster at TEPCO’s Fukushima nuclear reactor. It includes significant policy shifts from the previous SEP, which had outlined a goal of 70% energy self-sufficiency and 70% zero-emissions generation ratio by 2030. The 2014 SEP recognises the vulnerability of the nation’s energy supply due to its reliance on fossil fuel imports. It also addresses the need for good diplomatic relations with fuel-providing countries, enhancement of energy efficiency and government support of overseas energy supply projects (particularly new U.S. LNG export capacity).
The plan includes continuance of a push for renewable energy installations, particularly wind and geothermal power, which are not as advanced in terms of capacity as solar PV. The role of renewables in contributing to Japan’s energy security is noted, as well as the importance of building new industries that include offshore wind power. The plan also highlights the role that battery storage and hydrogen can play in mitigating the intermittency of wind and solar.
Nuclear power is defined in the SEP as a quasi-domestic energy source as it can generate electricity for several years, using the domestic fuel stockpile.14 As such, it is seen as one element of better energy security. This view, in addition to policy provisions that favour baseload power without carbon emissions, has led to the pursuit of reactor restarts where new safety standards are met.
Despite the recognition of the large amount of greenhouse gas emissions produced by burning coal, the SEP re-evaluates coal’s importance due to its low cost (excluding externalities), low geopolitical risk and replacement of nuclear since 2011 as a provider of baseload power. Low geopolitical risk is also a factor noted for LNG, a fuel that the SEP sees as having a bigger role in Japan’s energy mix. Oil is noted as having the highest geopolitical risk and highest generation costs but the SEP also considers it as a peaking-electricity generation source.
Finally, the SEP commits to continued energy efficiency measures as well as broad reform of Japan’s electricity system and the establishment of regional grid connectivity.
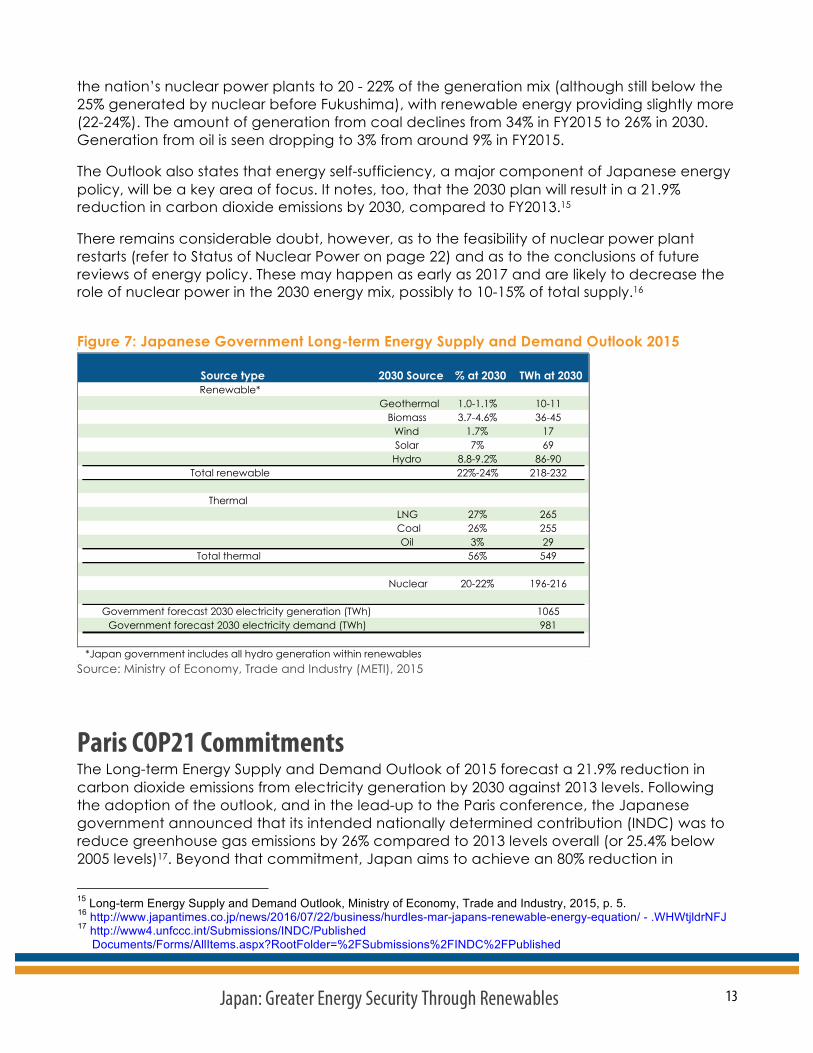
Long-term Energy Supply and Demand Outlook (2015) In 2015, METI published its Long-term Energy Supply and Demand Outlook, which forecasts the national electricity generation mix by 2030. The outlook’s desired energy supply mix is based on the overarching energy guidelines of the Fourth Strategic Energy Plan (2014). Details of the target mix are set out in Figure 7 below. The Outlook sees a rise in output from
14 Fourth Strategic Energy Plan, Ministry of Economy, Trade and Industry, 2014.
13 Japan: Greater Energy Security Through Renewables
the nation’s nuclear power plants to 20 - 22% of the generation mix (although still below the 25% generated by nuclear before Fukushima), with renewable energy providing slightly more (22-24%). The amount of generation from coal declines from 34% in FY2015 to 26% in 2030. Generation from oil is seen dropping to 3% from around 9% in FY2015.
The Outlook also states that energy self-sufficiency, a major component of Japanese energy policy, will be a key area of focus. It notes, too, that the 2030 plan will result in a 21.9% reduction in carbon dioxide emissions by 2030, compared to FY2013.15
There remains considerable doubt, however, as to the feasibility of nuclear power plant restarts (refer to Status of Nuclear Power on page 22) and as to the conclusions of future reviews of energy policy. These may happen as early as 2017 and are likely to decrease the role of nuclear power in the 2030 energy mix, possibly to 10-15% of total supply.16
Figure 7: Japanese Government Long-term Energy Supply and Demand Outlook 2015
Source: Ministry of Economy, Trade and Industry (METI), 2015
Paris COP21 Commitments The Long-term Energy Supply and Demand Outlook of 2015 forecast a 21.9% reduction in carbon dioxide emissions from electricity generation by 2030 against 2013 levels. Following the adoption of the outlook, and in the lead-up to the Paris conference, the Japanese government announced that its intended nationally determined contribution (INDC) was to reduce greenhouse gas emissions by 26% compared to 2013 levels overall (or 25.4% below 2005 levels)17. Beyond that commitment, Japan aims to achieve an 80% reduction in
15 Long-term Energy Supply and Demand Outlook, Ministry of Economy, Trade and Industry, 2015, p. 5. 16 http://www.japantimes.co.jp/news/2016/07/22/business/hurdles-mar-japans-renewable-energy-equation/ - .WHWtjldrNFJ 17 http://www4.unfccc.int/Submissions/INDC/Published
Documents/Forms/AllItems.aspx?RootFolder=%2FSubmissions%2FINDC%2FPublished
Source type 2030 Source % at 2030 TWh at 2030Renewable*
Geothermal 1.0-1.1% 10-11Biomass 3.7-4.6% 36-45
Wind 1.7% 17Solar 7% 69Hydro 8.8-9.2% 86-90
Total renewable 22%-24% 218-232
ThermalLNG 27% 265Coal 26% 255Oil 3% 29
Total thermal 56% 549
Nuclear 20-22% 196-216
Government forecast 2030 electricity generation (TWh) 1065Government forecast 2030 electricity demand (TWh) 981
*Japan government includes all hydro generation within renewables
14 Japan: Greater Energy Security Through Renewables
emissions by 2050, on the condition that such a shift would not inhibit economic growth.
Technological Innovation Strategy The technologies needed to support Japan’s 2030 energy and climate goals are already available. To support Japan’s 2050 climate goal set out in the 2015 Outlook and INDC, the government is promoting innovation via the National Energy and Environment Strategy for Technological Innovation (NESTI). The Strategy covers five areas: energy integration technologies, energy saving technologies, energy storage (including batteries and hydrogen), carbon capture and utilization technologies, and energy generation. Next generation solar PV and geothermal are targeted as development areas within energy generation.
Market Liberalization The Fourth Strategic Energy Plan acknowledges that serious weaknesses in the electricity system were laid bare by the Fukushima accident and the subsequent shutdown of nuclear power plants. As such, the SEP highlights a number of reforms that are to take place in three stages in 2018-2020. These reforms address inter-region system operation, full retail competition, neutrality of transmission and distribution, and liberalization of power generation.
The first stage was implemented in 2015 when the Organisation for Cross-regional Coordination of Transmission Operators (OCCTO) was established. Its role is to ensure the adequacy of electricity generation and transmission capacity and to assure power interchange between utilities as and when demand shifts require it. The Japanese electricity system has been maintained historically around a number of vertically integrated regional monopolies. This arrangement has restricted competition and consumer choice and has assured a low level of transmission between individual grids.
The second part of the reform process increased liberalization of the retail market, beginning in April 2016. Consumers can now choose their preferred supplier. This reform has proven popular. Within the first month of implementation alone, 820,000 customers switched suppliers.18
Ratepayers increasingly have regulatory support on their behalf. In the run-up to this reform, the Electricity Market Surveillance Commission (EMSC) was set up under METI to fulfil the role of electricity regulatory authority. Its name has since been changed to the Electricity and Gas Market Surveillance Commission (EGC) in preparation for the market liberalization of gas and heat markets.
Most baseload power generation remains in the hands of the major EPCOs, however, with limited baseload opportunities for new market entrants. Similarly, there are often few
Documents%2FJapan%2F1&FolderCTID=0x012000C7F4CA2108C0A44C8DA10218C3E5B94B&View={428EA47E-35B4-4EB0-BD45-71F71031D074}
18 IEA, Energy Policies of IEA Countries – Japan: 2016 Review.
15 Japan: Greater Energy Security Through Renewables
opportunities for new entrants to procure renewable energy. METI is now aiming to create a new market structure that will allow participants to purchase fossil fuel generation capacity and to increase access to renewable generation by 2020/21.19
The final phase of reform is due to occur in April 2020, when the EPCOs will have their transmission and distribution operations legally separated from their generation and retail businesses (although IEEFA notes economic separation will not be required).
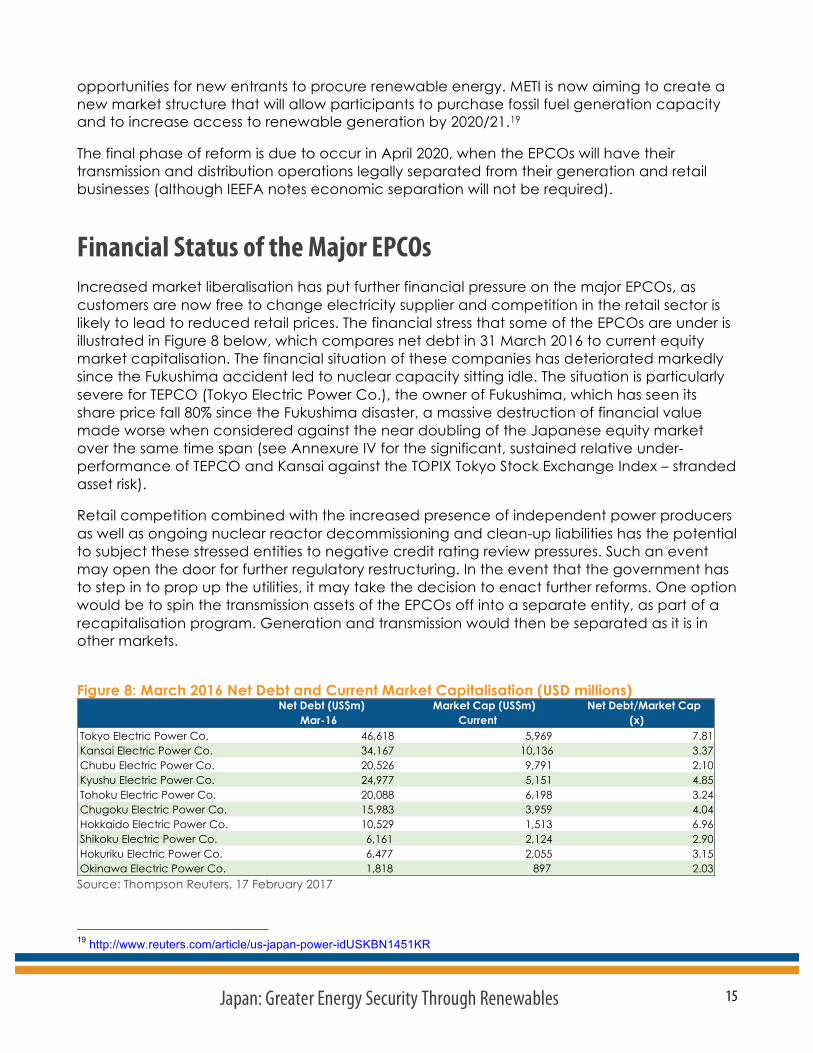
Financial Status of the Major EPCOs Increased market liberalisation has put further financial pressure on the major EPCOs, as customers are now free to change electricity supplier and competition in the retail sector is likely to lead to reduced retail prices. The financial stress that some of the EPCOs are under is illustrated in Figure 8 below, which compares net debt in 31 March 2016 to current equity market capitalisation. The financial situation of these companies has deteriorated markedly since the Fukushima accident led to nuclear capacity sitting idle. The situation is particularly severe for TEPCO (Tokyo Electric Power Co.), the owner of Fukushima, which has seen its share price fall 80% since the Fukushima disaster, a massive destruction of financial value made worse when considered against the near doubling of the Japanese equity market over the same time span (see Annexure IV for the significant, sustained relative under-performance of TEPCO and Kansai against the TOPIX Tokyo Stock Exchange Index – stranded asset risk).
Retail competition combined with the increased presence of independent power producers as well as ongoing nuclear reactor decommissioning and clean-up liabilities has the potential to subject these stressed entities to negative credit rating review pressures. Such an event may open the door for further regulatory restructuring. In the event that the government has to step in to prop up the utilities, it may take the decision to enact further reforms. One option would be to spin the transmission assets of the EPCOs off into a separate entity, as part of a recapitalisation program. Generation and transmission would then be separated as it is in other markets.
Figure 8: March 2016 Net Debt and Current Market Capitalisation (USD millions)
Source: Thompson Reuters, 17 February 2017
19 http://www.reuters.com/article/us-japan-power-idUSKBN1451KR
Net Debt (US$m) Market Cap (US$m) Net Debt/Market CapMar-16 Current (x)
Tokyo Electric Power Co. 46,618 5,969 7.81Kansai Electric Power Co. 34,167 10,136 3.37Chubu Electric Power Co. 20,526 9,791 2.10Kyushu Electric Power Co. 24,977 5,151 4.85Tohoku Electric Power Co. 20,088 6,198 3.24Chugoku Electric Power Co. 15,983 3,959 4.04Hokkaido Electric Power Co. 10,529 1,513 6.96Shikoku Electric Power Co. 6,161 2,124 2.90Hokuriku Electric Power Co. 6,477 2,055 3.15Okinawa Electric Power Co. 1,818 897 2.03
16 Japan: Greater Energy Security Through Renewables
Energy Efficiency: Japan Leads Japan is a global leader in energy efficiency (EE), having improved the energy intensity of the Japanese economy by about 40% over the past 40 years.20 More recently, from FY2010 to FY2015, Japan saw its electricity generation drop by 11.5%, according to IEA figures. This represents an average decline of 2.4% per annum (refer to Figure 3). Over the same period, Japanese GDP growth has averaged 0.6% per annum, resulting in an increase in electricity productivity of 3.0% per annum from 2010-2015.
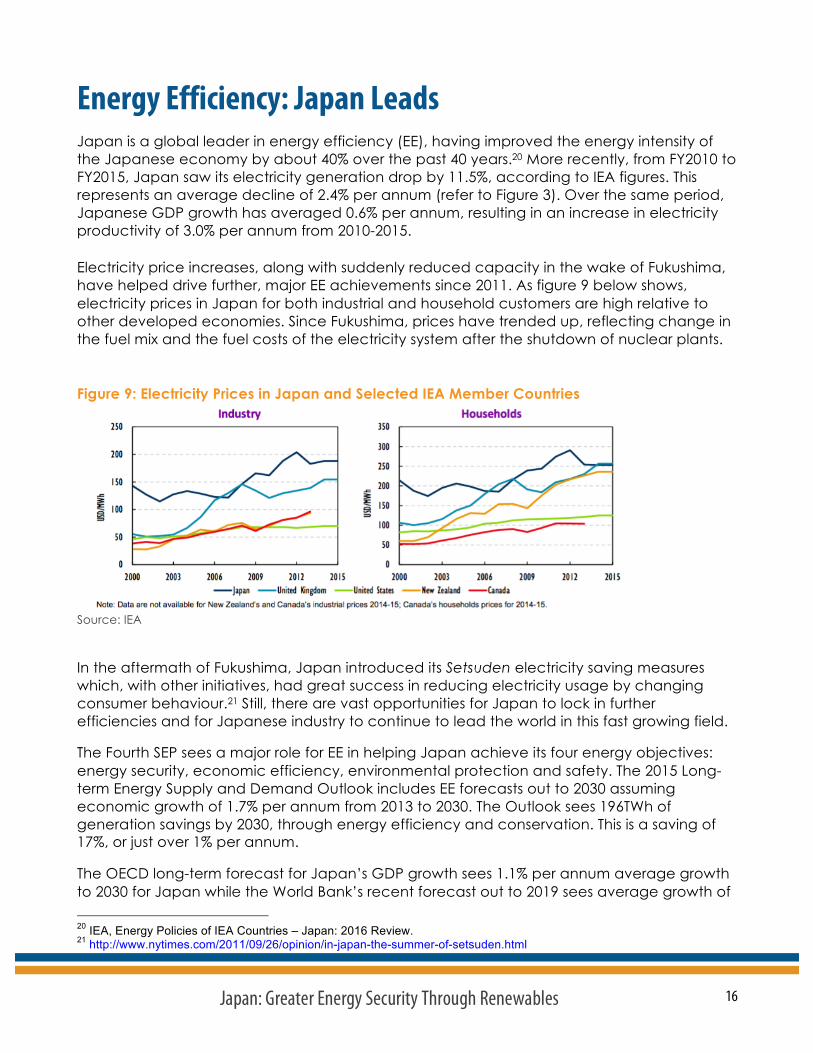
Electricity price increases, along with suddenly reduced capacity in the wake of Fukushima, have helped drive further, major EE achievements since 2011. As figure 9 below shows, electricity prices in Japan for both industrial and household customers are high relative to other developed economies. Since Fukushima, prices have trended up, reflecting change in the fuel mix and the fuel costs of the electricity system after the shutdown of nuclear plants.
Figure 9: Electricity Prices in Japan and Selected IEA Member Countries
Source: IEA
In the aftermath of Fukushima, Japan introduced its Setsuden electricity saving measures which, with other initiatives, had great success in reducing electricity usage by changing consumer behaviour.21 Still, there are vast opportunities for Japan to lock in further efficiencies and for Japanese industry to continue to lead the world in this fast growing field.
The Fourth SEP sees a major role for EE in helping Japan achieve its four energy objectives: energy security, economic efficiency, environmental protection and safety. The 2015 Long-term Energy Supply and Demand Outlook includes EE forecasts out to 2030 assuming economic growth of 1.7% per annum from 2013 to 2030. The Outlook sees 196TWh of generation savings by 2030, through energy efficiency and conservation. This is a saving of 17%, or just over 1% per annum.
The OECD long-term forecast for Japan’s GDP growth sees 1.1% per annum average growth to 2030 for Japan while the World Bank’s recent forecast out to 2019 sees average growth of 20 IEA, Energy Policies of IEA Countries – Japan: 2016 Review. 21 http://www.nytimes.com/2011/09/26/opinion/in-japan-the-summer-of-setsuden.html
17 Japan: Greater Energy Security Through Renewables
0.9% per annum. IEEFA believes the Outlook overestimates economic growth and underestimates the effect of energy efficiency (considering how electricity generation has declined on average 2.4% annually for the past five years) and that the recent impact of electricity productivity is significantly under appreciated.
Further EE gains that will see Japan beat the 2015 Outlook forecast include the expectation that smart meter rollout will occur by 2024, which will greatly enhance gains from demand management along with increasing prevalence of time-of-use electricity tariffs and smart appliances. Japan’s successful “Top Runner” program, introduced in 1998, set ambitious EE targets for a wide range of products, with over 70% of household energy consumption covered. Under the program the government sets the EE of the most efficient product in a particular category as the standard. All manufacturers and imports of products in that category are then required to match this standard within three to ten years. The success of the program is reflected by the fact that China is now implementing a similar system. Despite the EE gains made to date, product coverage has recently been extended and there are opportunities to expand the program to the commercial and industrial sectors in the future.
In January 2017, Indian Energy Minister Piyush Goyal announced plans to replicate and extend the major EE gains delivered in India in 2016 through a nation-wide rollout of low energy LED lighting. An innovative World Bank assisted US$1bn financing program is to be established that helps consumers replace, at zero upfront payment, old air conditioners (ACs) with those at least 40% more energy efficient than even the five-star rated ACs currently available in the market. The program will “bank” the value of the energy savings over three years to self-fund this investment, thereby locking in significant EE savings.22 As a world leading manufacturer of high efficiency appliances, Japan’s Daikin and Panasonic are well placed.
Japanese industry is among the world’s most energy efficient, with large companies required to make long and medium-term efficiency plans under the Act on the Rational Use of Energy. Further gains are still available, however. The introduction of a benchmarking system for EE targets has been applied to energy-intensive sectors but could be expanded more widely. Furthermore, many companies are yet to achieve their benchmarks, implying that there are EE gains yet to be realised. There is also scope to extend voluntary actions to small and medium-sized enterprises that are not covered by the Act.
Gains are yet to be made in building EE, with a system of voluntary standards due to be replaced by mandatory ones by 2020. In addition, there are also potential efficiencies yet to be realised in the existing building stock. The existing stock numbers some 50 million, compared to around one million of new buildings added each year, which are already covered by high efficiency standards. The updated building regulations revise mandatory standards for both new and retrofitted residential buildings over 300m2 and non-residential buildings over 2,000m2. There will be further opportunities going forward to apply high standards across all buildings. Zero energy residences are moving beyond a concept to now being a realistic target. It is estimated that improvements in the EE of buildings in Japan could potentially save 330 million tonnes of oil equivalent (Mtoe) cumulatively by 2030.23 This
22http://economictimes.indiatimes.com/articleshow/56481500.cms?from=mdr&utm_source=contentofinterest&utm_medium=t
ext&utm_campaign=cppst 23 IEA, Energy Efficiency Market Report 2016, p. 63.
18 Japan: Greater Energy Security Through Renewables
translates to around 3,800TWh in total or around 250TWh per annum to 203024, around 25% of Japan’s 2015 electricity generation.
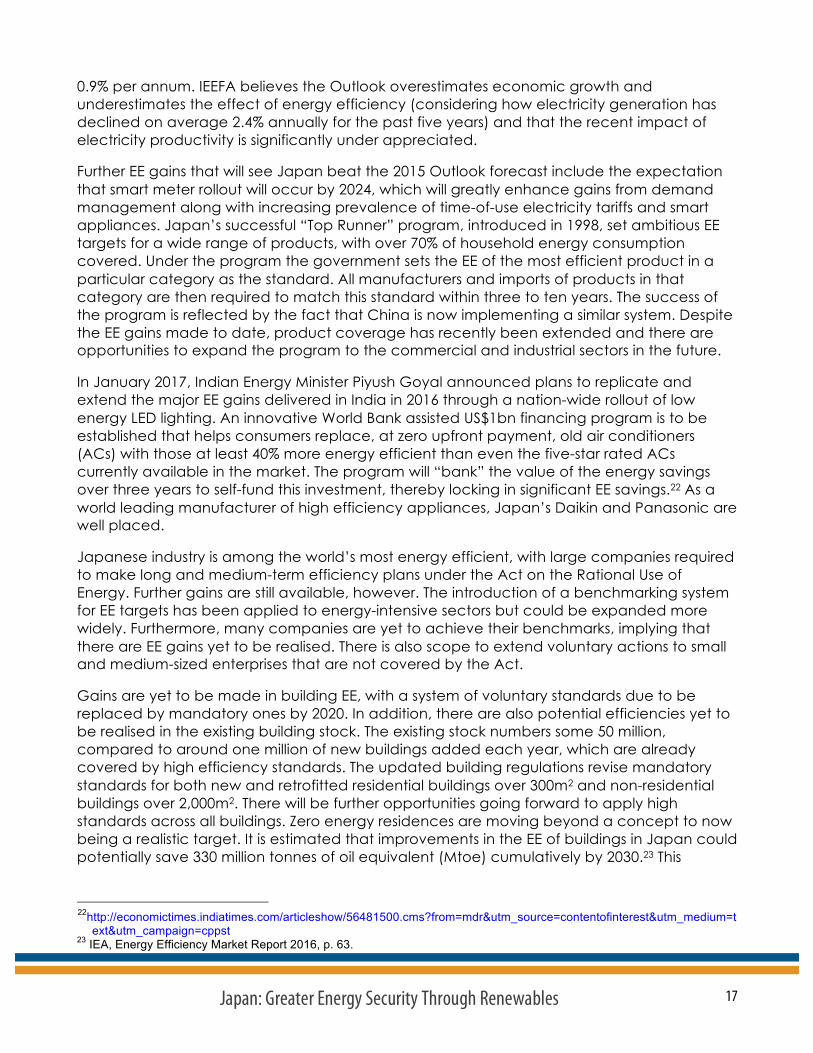
Continued focus and action on EE is key to Japan’s energy strategy: increased EE can make a major contribution to decreased greenhouse emissions, increased economic efficiency and energy security. With Japan currently reliant on fuel imports and without electricity interconnection to other countries, further gains in EE can help reduce fossil fuel imports and the associated current account deficit. For these reasons, EE will remain a major area of focus for all future Japanese governments. Figure 10 below shows the impact of EE measures since 2000 on Japan’s fuel imports and cost in 2015. In that year Japan spent US$128 billion on fuel imports, but energy efficiency improvements reduced this cost by US$19 billion or 15% of the total.25
Figure 10: Avoided fuel imports and cost savings in 2015 from energy efficiency improvements since 2000.
Source: IEA
Global investment in EE reached US$221 billion in 2015, a 6% increase over 2014.26 The EE market will continue to grow into the future, providing more and more opportunities for savings. Mergers and acquisitions of EE service firms are increasing and more players, including utilities, are joining the market. Finance for EE measures is also on the rise as regulators increasingly mandate annual EE improvements. In 2015, the total market value of green bonds issued was over US$40 billion, of which more than US$8 billion was earmarked for EE. In 2016 the green bond issuance more than doubled to over US$90 billion. and it has recently been forecast this may rise to over US$200 billion in 2017.27
As EE markets grow globally, Japanese industry will continue to be a world leader on this front, driven by effective policies to mitigate its reliance on fuel imports and benefit from its technological superiority.
24 https://www.iea.org/statistics/resources/unitconverter/ 25 IEA, Energy Efficiency Market Report 2016, p. 32. 26 IEA, Energy Efficiency Market Report 2016, p. 15. 27 http://energy.economictimes.indiatimes.com/news/renewable/moodys-global-green-bond-issuance-could-rise-to-206-
billion-in-2017-after-record-in-2016/56688483
19 Japan: Greater Energy Security Through Renewables
Status of Japanese Power Generation Technologies
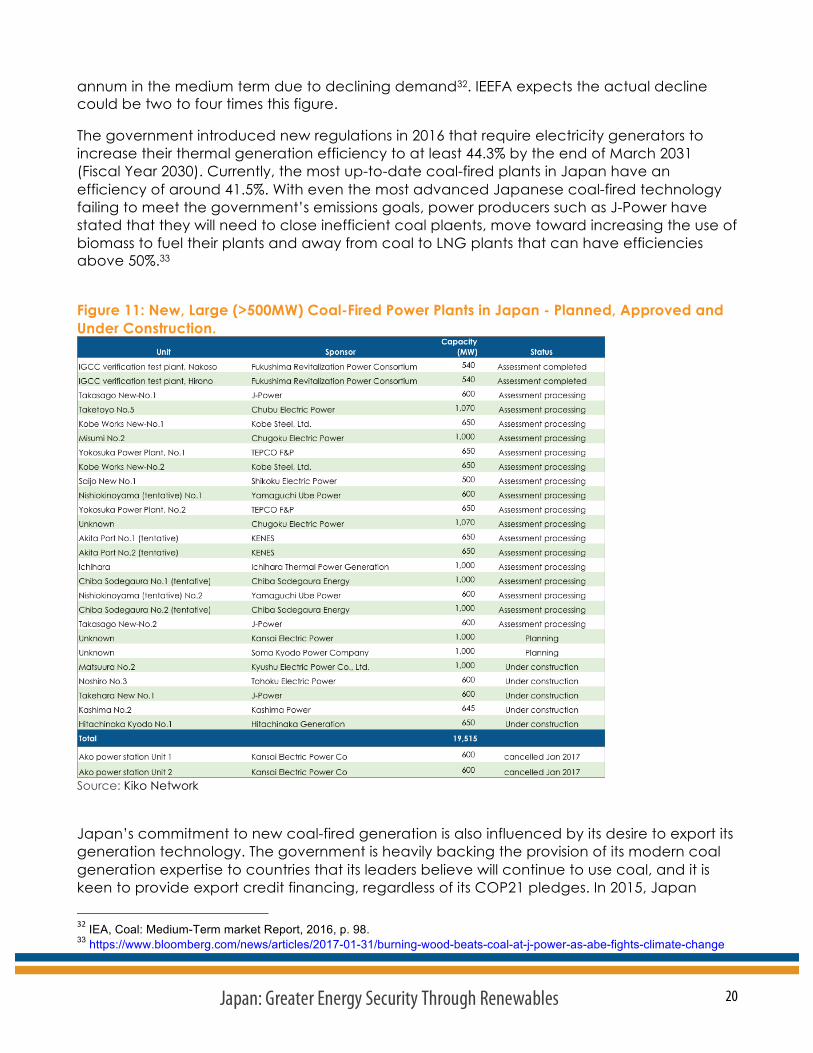
Coal Japan is planning to build a fleet of new coal-fired power plants to replace the country’s aging thermal electricity capacity and to make up for its loss of nuclear power. In the coming decade, 22GW of gross new coal-fired capacity is scheduled to come online (refer to Annexure III), equivalent to half the current thermal capacity; Figure 11 below lists planned coal-fired plants over 500MW and their status. A large number of smaller plants are also planned, many of which are intended to co-fire with biomass.
Figure 11 also shows that most of the larger plants are in the pre-permit development phase. It is highly doubtful that all of these plants will be built, simply because the need for them is so questionable in a declining overall power market. In January 2017, Kansai Electric Power Company (one of the 10 major EPCOs) announced a halt to its plan to invest US$3 billion to convert the 1,200MW Ako Power Station Units 1 and 2 from oil- to coal-fired power, citing decreasing electricity demand.28 The units will now remain oil-based and will be kept in reserve as seldom used peaking plants. The IEA forecasts that just 2GW of currently-under-construction coal-fired capacity will be commissioned by 2021. Any remaining planned high efficiency capacity that reaches construction will replace older subcritical plants. This will result in lower coal consumption for the same amount of electricity generated29.
With the government intending to bring nuclear power back online and renewable energy capacity increasing at 10GW per annum, any new coal-fired plants that are not a direct replacement for retiring plants can only have a negative impact on utilization rates across the thermal generation fleet. This has a clear precedent elsewhere in Asia: an aggressive rollout of coal-fired and renewable generation combined with lower than expected demand growth saw utilization rates of coal-fired power stations in India drop to 56% in 2016. In China, the situation is even worse, with utilization rates having dropped below 47%, meaning that these plants stand idle more than half of the time.
Early signs of the impact of renewable energy and nuclear restarts are already visible. In 2016, Japan’s thermal coal imports dropped after four years of successive record highs following Fukushima.30 The 3.4% decrease in thermal coal imports to just under 110Mt31 is due to the rise of renewable energy and EE, in addition to the handful of nuclear reactor restarts that have taken place. The IEA forecasts Japanese thermal coal imports dropping 0.8% per
28 http://www.kepco.co.jp/english/corporate/ir/brief/jobfair/pdf/20170131_e.pdf 29IEA, Coal: Medium-Term Market Report 2016, p. 77.30 http://energy.economictimes.indiatimes.com/news/coal/japan-2016-thermal-coal-imports-fall-from-record-lng-purchases-
down-for-2nd-year/56790610 31 http://www.customs.go.jp/toukei/shinbun/trade-st_e/2016/2016_114e.pdf
20 Japan: Greater Energy Security Through Renewables
annum in the medium term due to declining demand32. IEEFA expects the actual decline could be two to four times this figure.
The government introduced new regulations in 2016 that require electricity generators to increase their thermal generation efficiency to at least 44.3% by the end of March 2031 (Fiscal Year 2030). Currently, the most up-to-date coal-fired plants in Japan have an efficiency of around 41.5%. With even the most advanced Japanese coal-fired technology failing to meet the government’s emissions goals, power producers such as J-Power have stated that they will need to close inefficient coal plaents, move toward increasing the use of biomass to fuel their plants and away from coal to LNG plants that can have efficiencies above 50%.33
Figure 11: New, Large (>500MW) Coal-Fired Power Plants in Japan - Planned, Approved and Under Construction.
Source: Kiko Network
Japan’s commitment to new coal-fired generation is also influenced by its desire to export its generation technology. The government is heavily backing the provision of its modern coal generation expertise to countries that its leaders believe will continue to use coal, and it is keen to provide export credit financing, regardless of its COP21 pledges. In 2015, Japan 32IEA, Coal: Medium-Term market Report, 2016, p. 98. 33 https://www.bloomberg.com/news/articles/2017-01-31/burning-wood-beats-coal-at-j-power-as-abe-fights-climate-change
21 Japan: Greater Energy Security Through Renewables
supported an OECD membership commitment to limit export credit agency assistance for coal-fired power, but has since exploited major loopholes in the agreement (the agreement does not apply to the provision of supercritical and ultra-supercritical technology to countries hobbled by energy poverty, or to financing subcritical plants in developing nations).
As domestic power producers start to recognize that the thermal efficiency of new coal-fired plants cannot meet national emissions goals and as they turn toward increasing the role of biomass co-firing in existing thermal generation (similar to Drax in the U.K.), Japan should seek to export technologies that will assist other nations in reaching their emissions-reduction targets. These targets will see increased priority in the minds of energy policymakers going forward, and Japan is in a position to offer energy solutions that fit the emissions goals of other governments.
While Japan also has a focus on the development of carbon capture and storage (CCS), with hopes of making the export of coal-fired generation technology compatible with emissions-reduction commitments, its chances of success on this front are slim. Despite ongoing CCS pilot projects, CCS development is well behind expectations and is not developing as fast as the “two-degree” scenarios of the IPCC and IEA require. Further, renewable energy — onshore wind, solar PV and now offshore wind — are proving far less costly than CCS, which is likely to remain cost-prohibitive. It is likely that CCS technology will not be developed fast enough to keep up with the ongoing transition of the world’s energy systems, which are moving quickly toward renewables.
In short, new coal-fired power stations face becoming stranded assets either because of their cost or because of their incompatibility with COP21 commitments.
Gas Japan is dependent on fossil fuel imports and is the world’s largest importer of LNG. Power generation is the largest consumer of gas, accounting for almost 70% of gas consumption in 2014.34 In 2015, gas-fired electricity generation reached 39% of Japan’s total, thereby forming a major energy security challenge for the nation. After a decade of rising LNG imports, including an 18% post-Fukushima surge, the last two calendar years have seen declines that included a 2% drop in 2016 to 83 Mt. As with coal imports, the decline is being driven by increasing renewable energy capacity as well as the few nuclear reactor restarts that have occurred so far.
Further increases in renewable capacity and nuclear restarts will lower the utilization rates of gas-fired generators in much the same way as they will affect coal-fired generation. The regional, disconnected nature of Japan’s electricity grid may mean that nuclear restarts have a greater impact on thermal generators in the same region. Even with lower oil prices, it is probable that oil-fired generation, on which Japan has an unusually high reliance, will be the first to feel the impact of increased non fossil fuel based capacity. However, in a market seeing continuously declining electricity demand, gas-fired generation is likely to be affected by the rise and restart of competing generation sources.
34 IEA, Energy Policies of IEA Countries – Japan: 2016 Review.
22 Japan: Greater Energy Security Through Renewables
Nuclear Nuclear energy is viewed as a quasi-domestic energy source in Japan, due to the relative ease with which many years’ worth of imported nuclear fuel can be stored. As such, it played an important role in Japan’s electricity plans for its role in national energy security. This historic commitment has led to the current intention for nuclear energy to once again play an important role — even after the Fukushima disaster, the subsequent shutdown of all nuclear reactors and a clear lack of public support for reactor restarts. The current status of operating (2.5GW), potentially operational (37.5GW) and planned nuclear power stations can be found in Annexure I.
The 2015 Long-term Energy Supply and Demand Outlook sees nuclear energy supplying 20-22% of Japan’s electricity generation mix in 2030, a target that will require many reactor restarts. To date, only five reactors have come back online and two of those were quickly shut down again. The Sendai 1 and 2 reactors were restarted in August and October 2015 and the Ikata 3 reactor has been operational since August 2016.35 Takahama 4 was restarted in February 2016 but a technical problem caused an automatic shutdown a few days later and it remains offline. The Takahama 3 reactor, which was also restarted in February, was shut down by court injunction following protests by local residents. Later in 2016, the Nuclear Regulation Authority gave initial approval for the Genkai 3 and 4 reactors to restart despite most local residents being against it.36
In addition to public animosity toward the industry, aging reactors and stringent new safety standards present a barrier to restarts. Many reactors are likely to struggle to reach new standards or will reach their planned decommissioning date before they can get back online. Counteracting this trend will be the government’s desire to partially address energy security concerns with nuclear power. In addition, the Japanese government is unlikely to want to lose the capacity to enrich nuclear fuel, especially given the recent less certain nature of the U.S. security presence in Asia. Some 15.6GW of new Japanese reactors are planned, but deferred for now (refer to Annexure I).
A tendency to underestimate the difficulties that nuclear power is faced with is highlighted by Toshiba’s recent struggles, as a result of its need for a multi-billion dollar write-down of its Westinghouse nuclear business in the U.S. The ongoing struggles of the nuclear power industry is a worldwide trend.37
Faced with significant challenges, it is impossible to say which reactors will be restarted. In some cases, however, it is clear which reactors will struggle to come back online. Kashiwazaki-Kariwa, more popularly known as KK, is the world’s largest nuclear power plant, with seven reactors totalling 8GW of capacity. The newly elected governor of Niigata prefecture was voted in on an anti-nuclear stance and stated in January 2017 that he will not approve the current proposed restart of KK.38 And while the restart of KK is considered as a way for Fukushima owner TEPCO to increase
35 https://www.bloomberg.com/news/articles/2016-08-11/japan-reactor-restart-signals-latest-step-in-nuclear-rebirth 36 https://www.bloomberg.com/news/articles/2016-11-09/japan-regulator-clears-more-reactors-for-restart-amid-opposition 37 http://reneweconomy.com.au/nuclear-industry-crisis-29735/ 38 https://www.bloomberg.com/news/articles/2017-01-29/japan-s-unresolved-disaster-sways-symbol-of-nuclear-opposition
23 Japan: Greater Energy Security Through Renewables
revenue and help pay off the US$139 billion clean-up costs from the disaster, any reactor restarts will only add power generation into a market with declining demand.
As inter-regional transmission capability is currently so low, nuclear restarts will represent a significant threat to the utilization rates of same-region thermal power plants, intended as replacements for offline nuclear baseload power.
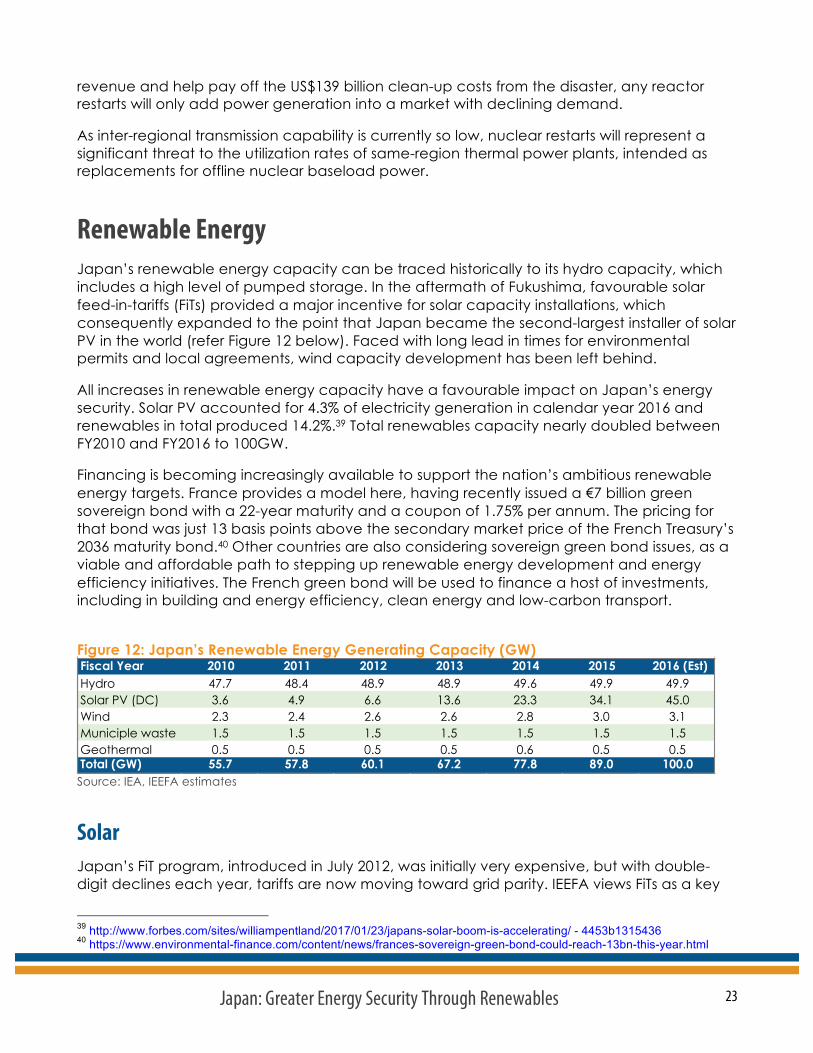
Renewable Energy Japan’s renewable energy capacity can be traced historically to its hydro capacity, which includes a high level of pumped storage. In the aftermath of Fukushima, favourable solar feed-in-tariffs (FiTs) provided a major incentive for solar capacity installations, which consequently expanded to the point that Japan became the second-largest installer of solar PV in the world (refer Figure 12 below). Faced with long lead in times for environmental permits and local agreements, wind capacity development has been left behind.
All increases in renewable energy capacity have a favourable impact on Japan’s energy security. Solar PV accounted for 4.3% of electricity generation in calendar year 2016 and renewables in total produced 14.2%.39 Total renewables capacity nearly doubled between FY2010 and FY2016 to 100GW.
Financing is becoming increasingly available to support the nation’s ambitious renewable energy targets. France provides a model here, having recently issued a €7 billion green sovereign bond with a 22-year maturity and a coupon of 1.75% per annum. The pricing for that bond was just 13 basis points above the secondary market price of the French Treasury’s 2036 maturity bond.40 Other countries are also considering sovereign green bond issues, as a viable and affordable path to stepping up renewable energy development and energy efficiency initiatives. The French green bond will be used to finance a host of investments, including in building and energy efficiency, clean energy and low-carbon transport.
Figure 12: Japan’s Renewable Energy Generating Capacity (GW)
Source: IEA, IEEFA estimates
Solar Japan’s FiT program, introduced in July 2012, was initially very expensive, but with double-digit declines each year, tariffs are now moving toward grid parity. IEEFA views FiTs as a key
39 http://www.forbes.com/sites/williampentland/2017/01/23/japans-solar-boom-is-accelerating/ - 4453b1315436 40 https://www.environmental-finance.com/content/news/frances-sovereign-green-bond-could-reach-13bn-this-year.html
Fiscal Year 2010 2011 2012 2013 2014 2015 2016 (Est)Hydro 47.7 48.4 48.9 48.9 49.6 49.9 49.9Solar PV (DC) 3.6 4.9 6.6 13.6 23.3 34.1 45.0Wind 2.3 2.4 2.6 2.6 2.8 3.0 3.1Municiple waste 1.5 1.5 1.5 1.5 1.5 1.5 1.5Geothermal 0.5 0.5 0.5 0.5 0.6 0.5 0.5Total (GW) 55.7 57.8 60.1 67.2 77.8 89.0 100.0
24 Japan: Greater Energy Security Through Renewables
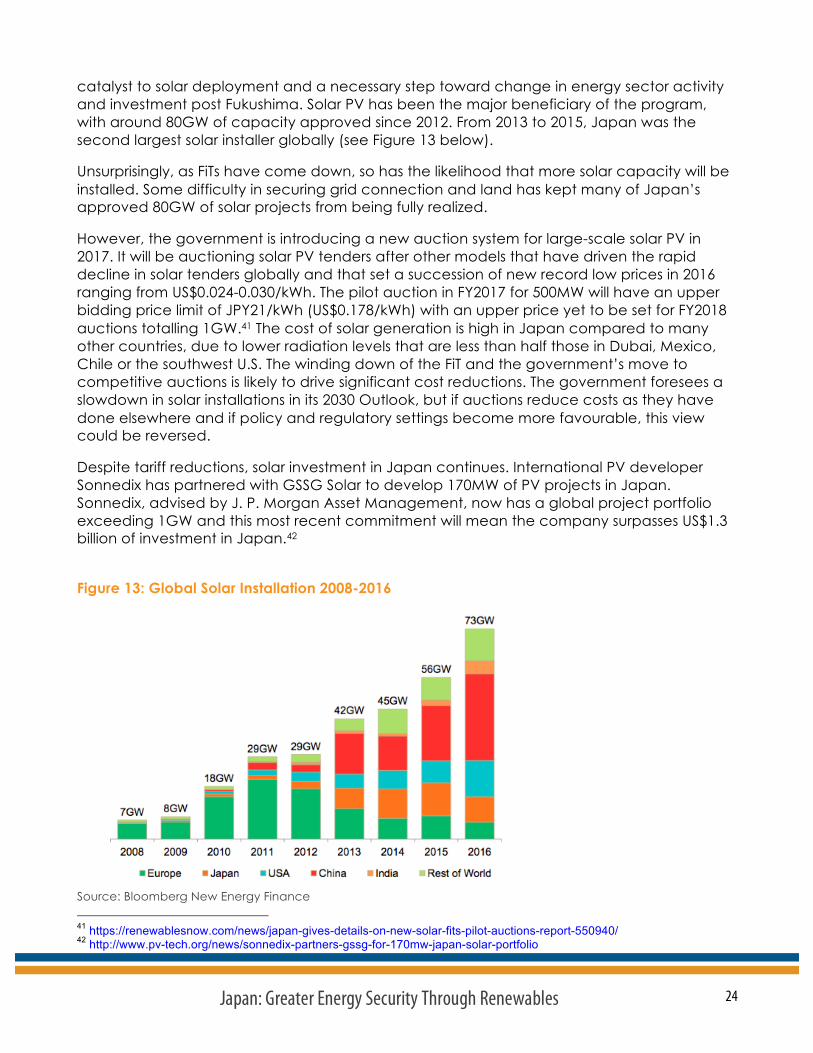
catalyst to solar deployment and a necessary step toward change in energy sector activity and investment post Fukushima. Solar PV has been the major beneficiary of the program, with around 80GW of capacity approved since 2012. From 2013 to 2015, Japan was the second largest solar installer globally (see Figure 13 below).
Unsurprisingly, as FiTs have come down, so has the likelihood that more solar capacity will be installed. Some difficulty in securing grid connection and land has kept many of Japan’s approved 80GW of solar projects from being fully realized.
However, the government is introducing a new auction system for large-scale solar PV in 2017. It will be auctioning solar PV tenders after other models that have driven the rapid decline in solar tenders globally and that set a succession of new record low prices in 2016 ranging from US$0.024-0.030/kWh. The pilot auction in FY2017 for 500MW will have an upper bidding price limit of JPY21/kWh (US$0.178/kWh) with an upper price yet to be set for FY2018 auctions totalling 1GW.41 The cost of solar generation is high in Japan compared to many other countries, due to lower radiation levels that are less than half those in Dubai, Mexico, Chile or the southwest U.S. The winding down of the FiT and the government’s move to competitive auctions is likely to drive significant cost reductions. The government foresees a slowdown in solar installations in its 2030 Outlook, but if auctions reduce costs as they have done elsewhere and if policy and regulatory settings become more favourable, this view could be reversed.
Despite tariff reductions, solar investment in Japan continues. International PV developer Sonnedix has partnered with GSSG Solar to develop 170MW of PV projects in Japan. Sonnedix, advised by J. P. Morgan Asset Management, now has a global project portfolio exceeding 1GW and this most recent commitment will mean the company surpasses US$1.3 billion of investment in Japan.42
Figure 13: Global Solar Installation 2008-2016
Source: Bloomberg New Energy Finance 41 https://renewablesnow.com/news/japan-gives-details-on-new-solar-fits-pilot-auctions-report-550940/ 42 http://www.pv-tech.org/news/sonnedix-partners-gssg-for-170mw-japan-solar-portfolio
25 Japan: Greater Energy Security Through Renewables
The regional nature of the Japanese electricity grid is a challenge to the integration of variable renewable energy. Current regional restrictions limit the amount of solar capacity that can be installed. Introducing the ability to trade electricity between EPCOs would help smooth the variability of renewable generation, but institutional barriers remain an issue. The amount of electricity traded on the wholesale market is marginal. But planned market reforms will help with the integration of increased renewable energy capacity, as will increased interconnection of regional grids.
Attention is also turning toward rooftop solar, and Bloomberg New Energy Finance reports that 65GW of rooftop solar could be added in Japan between 2016 and 2040.43 A rise in community solar schemes is also contributing to potential growth. Both the Japan Photovoltaic Energy Association (JPEA) and the nation’s Renewable Energy Institute are targeting 100GW of solar PV capacity by FY2030.44 Although slower than seen in the past few years, FY2017 solar installations may be as high as 6GW45 or 8GW46. In contrast there were some 10-11GW of additions per annum in FY2015 and FY2016.
Concentrated solar power (CSP) is currently expensive and suited best to nations with high levels of solar radiation. The IEA does not include CSP in its forecasts for Japan’s future energy mix. However, China has announced a 20-project, 1GW pilot program aimed at progressing CSP technology toward commerciality.47 As the technology and experience with CSP improves, its cost will decrease and its compatibility with solar PV48 will mean that CSP could have an important peaking capacity role to play. It is also compatible with Japan’s focus on energy storage.
Hydro Japan’s hydroelectric generation has remained relatively constant and is not likely to expand significantly due to regulatory challenges and lack of opportunities. There are already thousands of dams in place for irrigation and flood control and the great majority do not have hydro turbines.
Japan’s pumped hydro storage capacity of 26GW makes the nation the world’s leader in energy storage.49 This capacity has the potential to drive the integration of variable renewable energy into the country’s regional grids. The EPCOs still tend to see the role of pumped storage capacity as unchanged from its original purpose — to mitigate the inflexibility of nuclear generation, which operates best at full power. Even with planned reactor restarts, pumped hydro storage has an opportunity now to be redeployed to absorb peaks in demand and surpluses of renewable energy. The opening of the electricity market,
43 https://www.bloomberg.com/news/articles/2016-07-06/japan-s-solar-boom-showing-signs-of-deflating-as-subsidies-wane 44 http://www.pv-tech.org/news/with_100gw_of_solar_by_2030_japan_could_meet_11_of_demand_says_industry_gro 45 https://about.bnef.com/blog/liebreich-shift-base-cost-renewables-10-predictions-2017/ 46 http://www.forbes.com/sites/williampentland/2017/01/23/japans-solar-boom-is-accelerating/ - 4453b1315436 47 https://cleantechnica.com/2016/10/13/brightsource-gigawatt-scale-demo-dispatchable-solar-china/ 48 http://reneweconomy.com.au/gentle-reminder-cst-power-plants-10-hours-built-storage-available-now-22858/ 49 https://www.environmental-finance.com/content/news/us-to-overtake-germany-as-third-biggest-solar-market-despite-
trump.html?utm_source=250117na&utm_medium=email&utm_campaign=alert
26 Japan: Greater Energy Security Through Renewables
including the separation of generation and transmission/distribution, stands to drive more flexible use of pumped hydro storage capacity.50
Geothermal Japan’s volcanic nature means it has plentiful, viable geothermal generation options with the potential for generating 20GW51 of electricity from this source. So far only 500MW has been utilized, and the total actually fell slightly in 2015. Expansion of geothermal energy is held back by the fact that much of the potential lies within the boundaries of national parks. In addition, any proposed projects are likely to see strong resistance from the owners of hot-spring resorts (known as Onsen), which are a foundation of domestic tourism.
Onshore Wind The rise of wind energy worldwide is continuing at a significant pace. Under its New Policies Scenario, the IEA now sees wind power generation increasing from 4% of the world’s electricity generation in 2015 to 14% by 2040.52 This is 50% higher than the IEA was forecasting in 2015. The Global Wind Energy Council sees the share of wind generation increasing to as much as 29% by 2040, more than double the IEA’s latest figure. Global wind generation installations in 2016 are expected to total 60GW, a 14% increase on the 2015 cumulative installed base of 433GW.53
Wind resources in Japan are plentiful and predictable, which allows adequate cover from reserve energy sources where winds drop. The variability of the resource is reduced by the fact that wind speeds tend to change relatively slowly, allowing wind the potential to contribute to baseload generation. The Japan Wind Power Association’s roadmap for installations has an ambitious total of 10GW installed by 2020 and 27GW by 2030.
However, onshore wind capacity expansion has so far been left behind by solar PV, which has reaped most of the benefit of favourable FiTs. Wind capacity installation actually declined from 2012 to 2014. Part of the advantage that solar has had over wind is that Japan’s lengthy and onerous approvals process favours solar. Wind farms take up to seven years to permit. Any significant uptick in the rate of onshore wind installation would require a major overhaul of the approvals process.
Offshore Wind Until recently, offshore wind had been slow to make an impact outside Europe. However, 2016 saw dramatic cost reductions in the European market, which signal significantly increased offshore wind take-up globally.
50 http://spectrum.ieee.org/energy/policy/a-pumped-hydro-energystorage-renaissance 51 Smith School of Enterprise and the Environment, “Stranded Assets and Thermal Coal in Japan: An analysis of
environment-related risk exposure, May 2016. 52 Global Wind Energy Council, Global Wind Energy Outlook, October 2016, p. 40. 53 http://www.reuters.com/article/us-china-windpower-idUSKBN12I09K
27 Japan: Greater Energy Security Through Renewables
In July 2016, Dong Energy secured an offshore deal in the Netherlands at EUR72.5/MWh, half the prices seen five years previously. This record was beaten in a matter of weeks as Vattenfall won a Danish tender at EUR60/MWh54 and another at EUR49.90/MWh in November 201655. In the U.K., offshore wind is set to reach the government’s price reduction target four years early and is on a trajectory to become the country’s cheapest source of large-scale clean energy.56
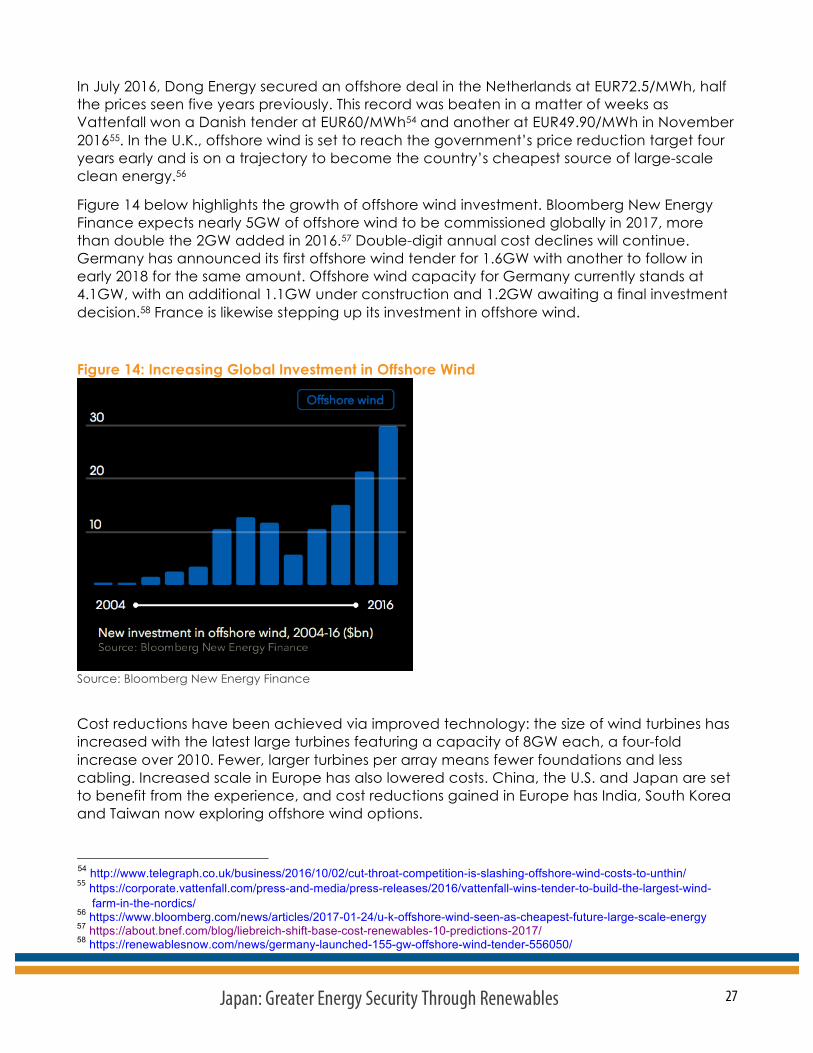
Figure 14 below highlights the growth of offshore wind investment. Bloomberg New Energy Finance expects nearly 5GW of offshore wind to be commissioned globally in 2017, more than double the 2GW added in 2016.57 Double-digit annual cost declines will continue. Germany has announced its first offshore wind tender for 1.6GW with another to follow in early 2018 for the same amount. Offshore wind capacity for Germany currently stands at 4.1GW, with an additional 1.1GW under construction and 1.2GW awaiting a final investment decision.58 France is likewise stepping up its investment in offshore wind.
Figure 14: Increasing Global Investment in Offshore Wind
Source: Bloomberg New Energy Finance
Cost reductions have been achieved via improved technology: the size of wind turbines has increased with the latest large turbines featuring a capacity of 8GW each, a four-fold increase over 2010. Fewer, larger turbines per array means fewer foundations and less cabling. Increased scale in Europe has also lowered costs. China, the U.S. and Japan are set to benefit from the experience, and cost reductions gained in Europe has India, South Korea and Taiwan now exploring offshore wind options.
54 http://www.telegraph.co.uk/business/2016/10/02/cut-throat-competition-is-slashing-offshore-wind-costs-to-unthin/ 55 https://corporate.vattenfall.com/press-and-media/press-releases/2016/vattenfall-wins-tender-to-build-the-largest-wind-
farm-in-the-nordics/56 https://www.bloomberg.com/news/articles/2017-01-24/u-k-offshore-wind-seen-as-cheapest-future-large-scale-energy 57 https://about.bnef.com/blog/liebreich-shift-base-cost-renewables-10-predictions-2017/ 58 https://renewablesnow.com/news/germany-launched-155-gw-offshore-wind-tender-556050/
28 Japan: Greater Energy Security Through Renewables
In China, a cut in the tariff for onshore wind has accelerated interest in offshore development in addition to the increasing curtailment of renewables in western China, far from the population centres on the east coast. China’s total offshore capacity of 1.9GW may increase by 77% in 2017, and the government’s target of 5GW of installations by 2020 may in fact be reached by the end of 2018.59 IEEFA sees China reach perhaps 100GW of offshore wind by 2030, a possibility enhanced by proximity to eastern coastal cities. Meanwhile in the U.S., the state of New York is seeking to develop up to 2.4GW of offshore wind by 2030.60
In Japan, with just five years of pilot development, offshore wind capacity is only just beginning61, but following cost reductions and industry experience in Europe, it has the potential to grow significantly in the coming years (as is about to happen in China).
Research and development is occurring now around floating offshore wind technology suited to the deep waters found relatively close to Japan’s shores. Although this is very much a niche area compared to the rapidly maturing fixed offshore wind sector, successful development of the technology would unlock a huge amount of potential capacity in the deeper waters around Japan.62 The Japan Wind Power Association roadmap for development sees 700MW of offshore capacity by 2020, including 100MW of floating capacity. By 2030 it sees 10GW of offshore capacity in total, including 4GW of floating capacity.63 IEEFA sees this 2030 target as entirely feasible with the right policy framework and support.
Development of floating technology is well underway now in Europe, with the largest floating wind farm to date expected to be operational off the Scottish coast by the end of 2017.64 Meanwhile, Atlantis Resources and Ideol have made a strategic agreement to develop a 1.5GW pipeline of floating offshore wind projects in the U.K.65
While offshore floating wind research, development and demonstration continues to progress, IEEFA acknowledges that commercial deployment has yet to be proven.
59 https://www.bloomberg.com/news/articles/2017-01-11/china-can-expect-a-surge-in-offshore-wind-farms-goldwind-says 60 http://www.reuters.com/article/us-new-york-windpower-idUSKBN14W2P0 61 http://www.japanfs.org/en/news/archives/news_id035650.html 62 https://www.bloomberg.com/news/articles/2016-08-24/japan-expanding-floating-wind-farm-amid-intensifying-global-race 63 http://jwpa.jp/page_216_englishsite/jwpa/detail_e.html 64 https://www.theguardian.com/environment/2016/may/16/worlds-largest-floating-windfarm-to-be-built-off-scottish-coast 65 http://ideol-offshore.com/en/actualites/ideol-partnership-atlantis-uk-bring-offshore-wind-industry-next-era-seeking-
establish-15
29 Japan: Greater Energy Security Through Renewables
Growing Japanese Investment in Renewables Overseas Several years of major US$20-30bn annual domestic solar PV investment allowed Japanese companies to gain important expertise with this technology. Now that solar investment is being wound back to more sustainable levels, it is not a surprise that leading Japanese companies are starting to look overseas for further opportunities in the renewable energy sector.
SoftBank, an early mover in the Japanese solar market, is now leveraging its expertise in other markets. SBG Cleantech, a partnership between SoftBank, Bharti Enterprises of India and Foxconn of Taiwan, to which SoftBank contributed US$10 billion, is seeking to develop US$20 billion of solar projects in India. Most recently, SBG Cleantech unsuccessfully bid for all 750MW of the Rewa solar project in Madhya Pradesh66, in an auction that smashed the previous record low for a solar tariff in India and broke through the US$45/MWh barrier. SBG Cleantech won its first solar tender in December 2015; a 350MW solar project at Ghani solar park in Andhra Pradesh with generation output to be purchased by a 25 year PPA secured by NTPC, India’s largest utility67. This builds on SoftBank’s Mongolian wind farm investments supported by Japanese International Cooperation Agency (JICA) financing.
In February 2017, JERA Co. announced it had acquired a 10% stake in Indian renewable energy firm ReNew Power Ventures Ltd for US$200 million.68 JERA is a joint venture between two of Japan’s major electric power companies: Tokyo Electric Power Co. (TEPCO) and Chubu Electric Power Co., both of which are largely dependent on thermal generation domestically. In its announcement, JERA noted that renewables investment was integral to its growth plans and cited the Indian government’s plan to install 100GW of solar and 60GW of wind by 2021/22 in its reasoning.69 ReNew Power is one of India’s leading renewable energy developers, with 1.5GW of renewable capacity in operation and another 1.8GW under construction. JICA’s Leading Asia’s Private Sector Infrastructure Fund (LEAP) provided US$390m of debt funding for ReNew Power at the same time.
In February 2017, Mitsui & Co. also announced the acquisition of SunEdison’s Commercial and Industrial division, which specialises in providing rooftop solar generation to C&I customers. Mitsui sees distributed solar as a key growth area both in Japan and abroad.70 With an equity interest in 11GW of power generation capacity worldwide, Mitsui now intends to develop its energy business in line with the global trend towards renewable and distributed energy.
Amongst its domestic power generation capacity and including solar, Japanese conglomerate Marubeni owns overseas capacity of more than 10GW. In September 2016, the company, in partnership with China’s JinkoSolar, made headlines by submitting a record low bid for the Sweihan solar project in U.A.E.. The bid of 2.42 US cents per kWh broke the
66 http://www.livemint.com/Industry/FnIG8NQF4o2YeE8NbQtzgP/Madhya-Pradesh-woosglobal-investors-with-mega-solar-
project.html 67 https://www.bloomberg.com/news/articles/2015-12-15/softbank-venture-wins-350mw-project-in-india-solar-debut 68 http://energy.economictimes.indiatimes.com/news/renewable/japans-jera-picks-10-per-cent-in-renew-power-for-200-
million/57142052 69 http://www.jera.co.jp/english/information/20170214_84.html 70 http://www.mitsui.com/jp/en/release/2017/1222451_10832.html
30 Japan: Greater Energy Security Through Renewables
previous record of 2.91 US cents set in Chile just a month earlier.71 Marubeni and JinkoSolar are also reportedly planning a huge 1.18GW solar plant, also in U.A.E.72
In an environment of negative domestic interest rates, Japan’s banks have been attracted to renewable energy infrastructure investments abroad by their strong annuity yields backed by long-term PPA’s from mostly highly rated utilities. According to Bloomberg New Energy Finance, the Japanese banks Mitsubishi UFJ Financial Group (MUFJ) and Sumitomo Mitsui Financial Group were the two largest lead arrangers globally for clean energy asset financing in the first 10 months of 2016.73 In particular, these two banks have been attracted to offshore wind in Europe. This experience with offshore wind abroad, places these banks in a good position to support the growing Japanese offshore wind industry. MUFJ has also invested in onshore wind, including a co-investment with German insurer Allianz in the 225MW Great Western wind project in Oklahoma.74 Mizuho Financial Group was also well inside the top 10 lead debt arrangers in 2016.
Mitsubishi Heavy Industries (MHI) is already building capacity in offshore wind turbines worldwide, via its joint venture with Danish wind turbine manufacturer Vestas – MHI Vestas Offshore Wind75, which took its largest ever order for 450MW of capacity in January 2017. The order is from Denmark’s DONG Energy which will use MHI Vestas Offshore Wind’s 8MW turbines for the German Borkum Riffgrund 2 project.
Battery storage is also undergoing fast development, with Panasonic a major global player in electric vehicle batteries via its partnership with Tesla and increasingly in the fast-expanding home battery storage market. Panasonic held a 74% market share of the U.S. electric vehicle battery market in 2016.
In June 2015, Inpex Corp acquired an effective 18% stake in the 330MW Sarulla geothermal power project in Sumatra, Indonesia. Once it has been commissioned by 2018, this will be the world’s largest geothermal power project. Itochu Corp and Kyushu Electric are co-equity investors alongside Ormat Technologies and PT Medco Power Indonesia.
In January 2017, JICA’s LEAP fund provided a US$109m loan to the 80MW Muara Laboh geothermal project in West Sumatra, a project being developed by Sumitomo, Engie and Supreme Energy, assisted by credit guarantees from Nippon Export and Investment Insurance (NEXI).
If Japanese government policy allows the solar PV boom to slow down and does nothing to encourage investment in wind, Japanese renewable energy companies will continue to look overseas for opportunities. Alternatively, supportive policy settings will encourage Japanese firms to apply their increasing international experience to the domestic market, a beneficial outcome for both Japanese energy security as well as Japanese renewable energy companies.
71 http://www.thenational.ae/business/energy/adwea-aims-for-second-plant-after-concluding-solar-contract-in-march 72 http://asia.nikkei.com/Business/Companies/Marubeni-to-build-1.18GW-solar-plant?page=1 73 https://www.bloomberg.com/news/articles/2016-10-31/japan-s-negative-rates-prod-megabanks-into-offshore-wind-loans 74 https://www.environmental-finance.com/content/news/allianz-and-mufg-in-us-wind-farm-tax-equity-deal.html 75 https://cleantechnica.com/2017/01/16/dong-energy-places-record-450-mw-borkum-riffgrund-wind-order-vestas/
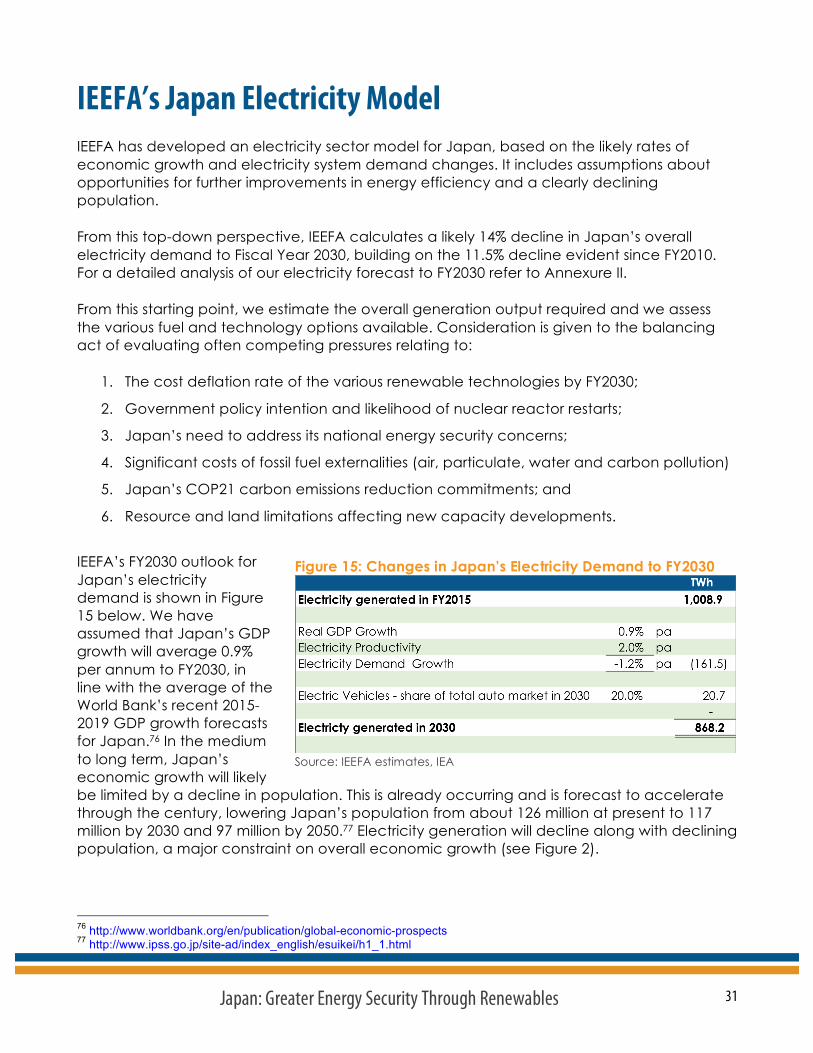
31 Japan: Greater Energy Security Through Renewables
IEEFA’s Japan Electricity Model IEEFA has developed an electricity sector model for Japan, based on the likely rates of economic growth and electricity system demand changes. It includes assumptions about opportunities for further improvements in energy efficiency and a clearly declining population.
From this top-down perspective, IEEFA calculates a likely 14% decline in Japan’s overall electricity demand to Fiscal Year 2030, building on the 11.5% decline evident since FY2010. For a detailed analysis of our electricity forecast to FY2030 refer to Annexure II.
From this starting point, we estimate the overall generation output required and we assess the various fuel and technology options available. Consideration is given to the balancing act of evaluating often competing pressures relating to:
1. The cost deflation rate of the various renewable technologies by FY2030;
2. Government policy intention and likelihood of nuclear reactor restarts;
3. Japan’s need to address its national energy security concerns;
4. Significant costs of fossil fuel externalities (air, particulate, water and carbon pollution)
5. Japan’s COP21 carbon emissions reduction commitments; and
6. Resource and land limitations affecting new capacity developments.
IEEFA’s FY2030 outlook for Japan’s electricity demand is shown in Figure 15 below. We have assumed that Japan’s GDP growth will average 0.9% per annum to FY2030, in line with the average of the World Bank’s recent 2015-2019 GDP growth forecasts for Japan.76 In the medium to long term, Japan’s economic growth will likely be limited by a decline in population. This is already occurring and is forecast to accelerate through the century, lowering Japan’s population from about 126 million at present to 117 million by 2030 and 97 million by 2050.77 Electricity generation will decline along with declining population, a major constraint on overall economic growth (see Figure 2).
76 http://www.worldbank.org/en/publication/global-economic-prospects 77 http://www.ipss.go.jp/site-ad/index_english/esuikei/h1_1.html
Figure 15: Changes in Japan’s Electricity Demand to FY2030
Source: IEEFA estimates, IEA
32 Japan: Greater Energy Security Through Renewables
Electricity Productivity
Japan’s electricity generation declined at an average of 2.4% per annum from FY2010 to FY2015. This occurred during a period when the nation’s economic growth averaged 0.6% per annum, resulting in electricity productivity for this period of 3.0%. This impressive level of productivity has been driven by Japan’s world leading energy efficiency status (refer to Energy Efficiency section for more detail). Despite the efficiency gains achieved by Japan to date, there are still many gains to be made going forward, and energy productivity is not showing any signs of slowing down.
In our electricity forecast to FY2030 we have assumed that energy productivity will continue at an average of 2.0% per annum, conservatively lower than the 3.0% average achieved across FY2010-2015.
Effect of Electric Vehicles on FY2030 Demand
IEEFA has modelled a high level of electric vehicle (EV) uptake in the FY2030 model in order to take into account future trends that are likely to lead to increased demand. An average growth rate of 35% per annum has been assumed, which leads to a total of 11.4 million EVs on Japanese roads by FY2030. The average kilometers driven per car in Japan is lower than in many countries (such as the U.S. and Australia). In our model, an average of 10,000km per vehicle each year has been assumed and an average range of 5.5km per kilowatt, which is likely to prove conservative by 2030.
The resultant additional energy demand from EVs is 20.7TWh in 2030, or just 2.4% of forecast energy demand in the absence of EVs. This is a generous estimate of the additional demand placed on the electricity system by EVs, as 11.4 million EVs in Japan by 2030 is likely to be at the top end of EV uptake scenarios.
FY2030 Generation Mix
IEEFA forecasts a significant 14% drop in electricity demand to 868TWh in FY2030 (refer to Annexure II for detailed electricity forecast). The energy productivity that drives this drop in demand is the single most important factor allowing the percentage share of renewable energy in the generation mix to increase, greatly improving Japan’s energy security and driving it toward its Paris COP21 commitments.
Under this model, renewable energy can reach almost 35% (including bioenergy and hydro) of the national generation mix by FY2030, well ahead of the government’s 22-24% target. Achieving this level of renewables penetration assumes current and future Japanese governments take progressive leadership in the promotion of renewable energy and work to clear the barriers that hold back renewables installation. With the costs of renewables
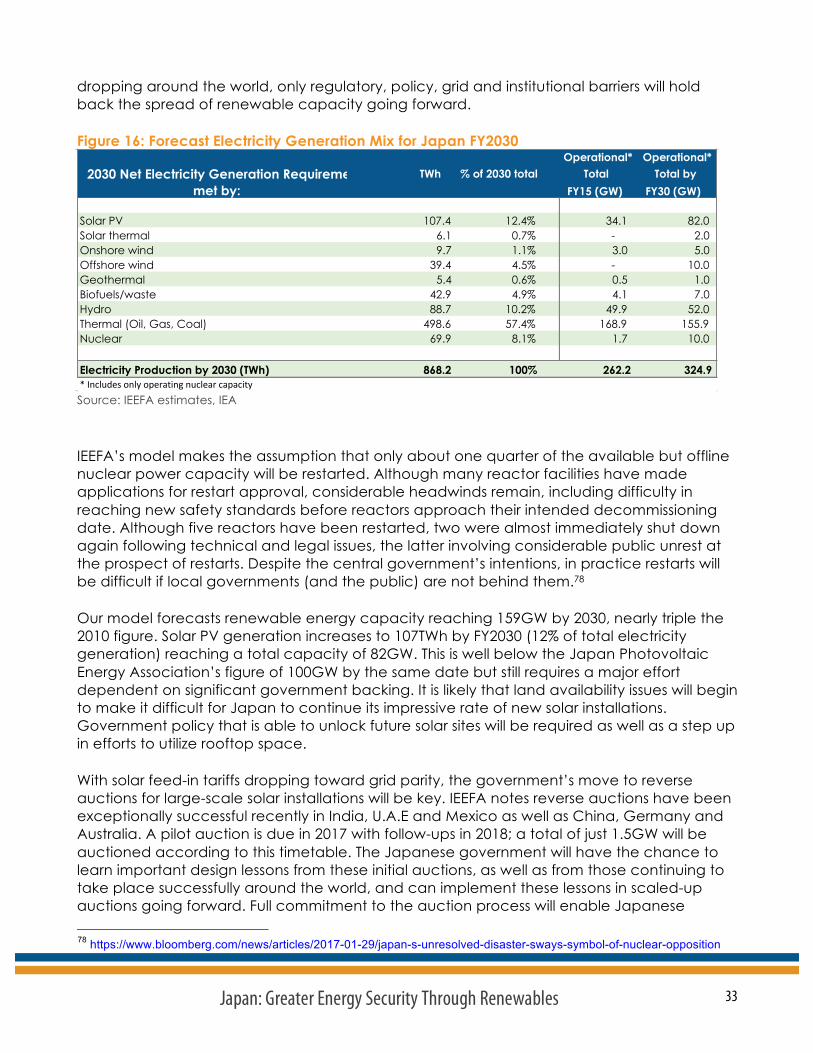
33 Japan: Greater Energy Security Through Renewables
dropping around the world, only regulatory, policy, grid and institutional barriers will hold back the spread of renewable capacity going forward.
Figure 16: Forecast Electricity Generation Mix for Japan FY2030
Source: IEEFA estimates, IEA
IEEFA’s model makes the assumption that only about one quarter of the available but offline nuclear power capacity will be restarted. Although many reactor facilities have made applications for restart approval, considerable headwinds remain, including difficulty in reaching new safety standards before reactors approach their intended decommissioning date. Although five reactors have been restarted, two were almost immediately shut down again following technical and legal issues, the latter involving considerable public unrest at the prospect of restarts. Despite the central government’s intentions, in practice restarts will be difficult if local governments (and the public) are not behind them.78
Our model forecasts renewable energy capacity reaching 159GW by 2030, nearly triple the 2010 figure. Solar PV generation increases to 107TWh by FY2030 (12% of total electricity generation) reaching a total capacity of 82GW. This is well below the Japan Photovoltaic Energy Association’s figure of 100GW by the same date but still requires a major effort dependent on significant government backing. It is likely that land availability issues will begin to make it difficult for Japan to continue its impressive rate of new solar installations. Government policy that is able to unlock future solar sites will be required as well as a step up in efforts to utilize rooftop space.
With solar feed-in tariffs dropping toward grid parity, the government’s move to reverse auctions for large-scale solar installations will be key. IEEFA notes reverse auctions have been exceptionally successful recently in India, U.A.E and Mexico as well as China, Germany and Australia. A pilot auction is due in 2017 with follow-ups in 2018; a total of just 1.5GW will be auctioned according to this timetable. The Japanese government will have the chance to learn important design lessons from these initial auctions, as well as from those continuing to take place successfully around the world, and can implement these lessons in scaled-up auctions going forward. Full commitment to the auction process will enable Japanese 78 https://www.bloomberg.com/news/articles/2017-01-29/japan-s-unresolved-disaster-sways-symbol-of-nuclear-opposition
Operational* Operational*TWh % of 2030 total Total Total by
FY15 (GW) FY30 (GW)
Solar PV 107.4 12.4% 34.1 82.0 Solar thermal 6.1 0.7% - 2.0 Onshore wind 9.7 1.1% 3.0 5.0 Offshore wind 39.4 4.5% - 10.0 Geothermal 5.4 0.6% 0.5 1.0 Biofuels/waste 42.9 4.9% 4.1 7.0 Hydro 88.7 10.2% 49.9 52.0 Thermal (Oil, Gas, Coal) 498.6 57.4% 168.9 155.9 Nuclear 69.9 8.1% 1.7 10.0
868.2 100% 262.2 324.9*Includesonlyoperatingnuclearcapacity
2030 Net Electricity Generation Requirement is met by:
Electricity Production by 2030 (TWh)
34 Japan: Greater Energy Security Through Renewables
consumers to benefit from the significant cost reductions for solar PV that are being seen globally, including a record low US$45/MWh in India in February 2017.
Our model includes 2GW of solar thermal energy (concentrated solar power – CSP) making up just 0.7% of the generation mix. Although still currently prohibitively expensive, the compatibility of CSP with variable solar PV means that Japan should seek to develop this technology, as countries like China are now doing, in order to complement its growing solar PV capacity. Beyond FY2030, CSP with storage will have an increasingly important role, alongside pumped hydro storage, as nations move beyond 50% renewable generation.
We see an 2GW increase in onshore wind capacity to reach 5GW by FY2030. This will result in onshore wind producing about 10TWh in that year, a still very minor 1.1% of generation because of current long delays in achieving planning and local approval. The real opportunity for Japan here lies in offshore wind, a huge potential resource that is currently not utilized and has been hugely underestimated by the market, given the slow pace of onshore wind development over the past five years. The absence of land constraints and the inherent high utilization rates of wind-powered generation are all in offshore wind’s favour and will ultimately allow offshore wind to contribute to baseload generation. IEEFA has modelled 10GW of offshore wind in Japan by FY2030, dependent on the necessary policy progress and removal of regulatory barriers.
IEEFA places far less emphasis on capacity expansions of hydro, geothermal, energy from waste and biomass, which jointly increase from 13% of the generation mix at present to 16% by 2030, largely as a result of reduced electricity demand. Hydro capacity expansion is limited by a lack of further site opportunities while geothermal is limited by the fact that most potential new sites are in national parks. Our model does include an expansion of biomass capacity. Japan’s biggest electricity wholesaler, J-Power, has recently stated it will expand the use of biomass in order to meet its emissions targets.79 J-Power intends to co-fire woody biomass with coal at its new Takehara plant, currently under construction.
Our model assumes that planned new thermal capacity replaces retiring thermal capacity. Although Japan plans to build 45 new coal-fired power plants, many of these are in the early planning stages with relatively few under construction. Further, there is no clear pathway for thermal plant retirements, making it hard to gauge the extent to which coal-fired generation will replace more expensive LNG, particularly given the longer-term differential will narrow medium-term when a carbon pollution price is factored in. As such, we have assumed no net thermal capacity additions with a gradual net reduction as end-of-life retirements occur.
In a market with declining demand and increasing renewable capacity, the result is reduced utilization rates for thermal capacity. From an average of 56% utilization across coal, oil and gas-fired capacity in FY2015, we model average utilization rates declining to 37% across all thermal capacity. In the event that overall thermal capacity increases in a declining market, utilization rates will fall further, with the consequent erosion of profitability accelerated.
Our model forecasts thermal power generation to decline 40% between FY2015 and FY2030.
79 https://www.bloomberg.com/news/articles/2017-01-31/burning-wood-beats-coal-at-j-power-as-abe-fights-climate-change
35 Japan: Greater Energy Security Through Renewables
Thermal Coal Imports Japan is the third largest importer of thermal coal globally, behind China and India. In 2016 thermal coal imports declined to 110Mt, down 4% year-on-year from the record high 113.8Mt in 2015. LNG imports likewise declined in 2016 after four years of successive record imports.80
With IEEFA forecasting that thermal power generation will decline by 40% between FY2015 and FY2030, Japan’s reliance on fossil fuel imports is expected to continue to decline 3% annually (by volume) over the coming decade. Japan is likely to retain oil fired power plants as peaking capacity and as an emergency reserve for energy security reasons. A progressively tighter thermal power efficiency regulatory requirement by 2031 is also likely to see coal’s current cost advantage eroded as externalities are increasingly priced in. IEEFA does not forecast the relative price dynamics of oil vs LNG vs thermal coal, but the likely 3% annual decline trajectory for fossil fuel imports is likely to apply roughly equally, with the resulting decline in utilization rates across the entire thermal power sector. Stranded asset risks are real and growing, so IEEFA concludes that most of the 22GW proposed new coal fired power plants will be deferred or in effect replace end of life existing plants. Overall demand for coal is not driven by gross capacity expansions, but rather by electricity demand and market share, both of which are forecast to fall for thermal power.
80 http://energy.economictimes.indiatimes.com/news/coal/japan-2016-thermal-coal-imports-fall-from-record-lng-purchases-
down-for-2nd-year/56790610
36 Japan: Greater Energy Security Through Renewables
Conclusions Japan is understandably prioritizing its national energy security as it aims to reduce its reliance on imported fossil fuels.
Accordingly, the government has set bold targets for nuclear reactor restarts, as it views nuclear power as a vital ‘domestic’ source of electricity that stems from the ease of storing years’ worth of nuclear-fuel stockpiles. Nuclear restarts face serious hurdles, however. That said, the likelihood that Japan’s nuclear industry won’t recover to the extent that the government hopes needn’t become a major energy security issue. Renewable energy represents Japan’s only true domestic energy source and the renewable energy industry stands ready to expand its share of Japan’s energy mix.
Japan’s world-leading expertise in energy efficiency offers a crucial and immediate foundation upon which the country can add renewables to its electricity generation mix.
Japan’s electricity demand will decrease despite a probable fast uptake of electric vehicles. Reduced demand alone will increase renewables share of generation, and Japan is positioned to double the renewables share of electricity to 35% by FY2030. Increased capacity installations will come mainly from solar PV and offshore wind. Falling feed-in-tariffs and land availability are starting to slow the rate of Japanese solar PV installations but opportunities to ramp this industry back up come from a move to large-scale auctions, which can discover lower prices. A bigger focus on rooftop solar and further market reforms are likely. Japan can take advantage of global trends toward dramatic cost reductions for solar PV seen in Latin America, India and other OECD member countries.
Offshore wind represents a considerable, untapped energy resource that gets around the land use issues and planning roadblocks that have limited onshore wind energy development in Japan. With recent developments in Europe accelerating cost reductions, offshore wind is now on the brink of breaking through worldwide. With China and the U.S. planning major offshore wind installation, Japan, with its impressive manufacturing capacity and already developing offshore wind technology, is positioned to not only take part in this surge but become a global leader by 2030.
Plans to build further coal-fired generation capacity in Japan are fraught with risk. Aside from being vulnerable to sudden global coal price and currency changes, building new thermal generation capacity in a declining market will lead to reduced utilization rates and reduced profitability. The indications are that this likelihood is being recognized in Japan, where the coal-fired power development pipeline has recently started to shrink. If Japan is serious about achieving its COP21 commitments and it rises to the challenge of investing in the development that is needed, then thermal generation utilization rates will come under further pressure.
If Japan takes the renewable-energy path forward, it will have overhauled its electricity system by 2030 in a way that will have drastically increased its energy security, reduced its current account deficit and built long-lasting technology capacities in industries of the future.
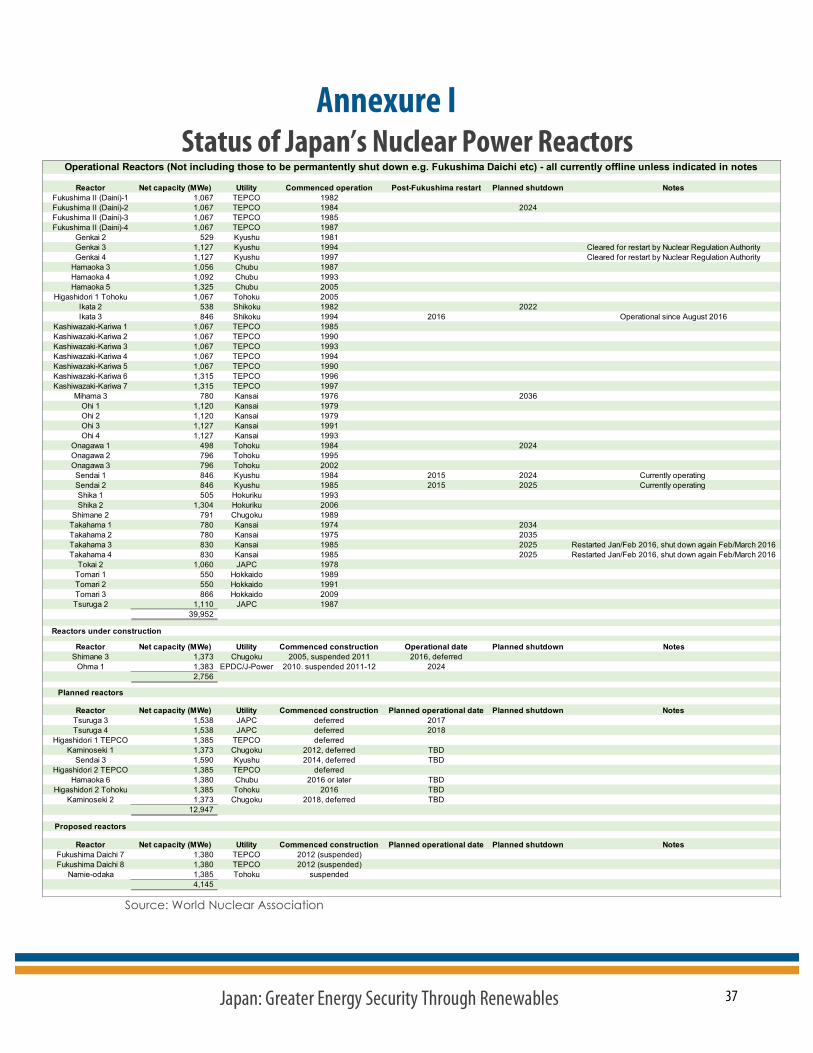
37 Japan: Greater Energy Security Through Renewables
Annexure I Status of Japan’s Nuclear Power Reactors
Source: World Nuclear Association
Reactor Net capacity (MWe) Utility Commenced operation Post-Fukushima restart Planned shutdown NotesFukushima II (Daini)-1 1,067 TEPCO 1982Fukushima II (Daini)-2 1,067 TEPCO 1984 2024Fukushima II (Daini)-3 1,067 TEPCO 1985Fukushima II (Daini)-4 1,067 TEPCO 1987
Genkai 2 529 Kyushu 1981Genkai 3 1,127 Kyushu 1994 Cleared for restart by Nuclear Regulation AuthorityGenkai 4 1,127 Kyushu 1997 Cleared for restart by Nuclear Regulation Authority
Hamaoka 3 1,056 Chubu 1987Hamaoka 4 1,092 Chubu 1993Hamaoka 5 1,325 Chubu 2005
Higashidori 1 Tohoku 1,067 Tohoku 2005Ikata 2 538 Shikoku 1982 2022Ikata 3 846 Shikoku 1994 2016 Operational since August 2016
Kashiwazaki-Kariwa 1 1,067 TEPCO 1985Kashiwazaki-Kariwa 2 1,067 TEPCO 1990Kashiwazaki-Kariwa 3 1,067 TEPCO 1993Kashiwazaki-Kariwa 4 1,067 TEPCO 1994Kashiwazaki-Kariwa 5 1,067 TEPCO 1990Kashiwazaki-Kariwa 6 1,315 TEPCO 1996Kashiwazaki-Kariwa 7 1,315 TEPCO 1997
Mihama 3 780 Kansai 1976 2036Ohi 1 1,120 Kansai 1979Ohi 2 1,120 Kansai 1979Ohi 3 1,127 Kansai 1991Ohi 4 1,127 Kansai 1993
Onagawa 1 498 Tohoku 1984 2024Onagawa 2 796 Tohoku 1995Onagawa 3 796 Tohoku 2002Sendai 1 846 Kyushu 1984 2015 2024 Currently operating Sendai 2 846 Kyushu 1985 2015 2025 Currently operating Shika 1 505 Hokuriku 1993Shika 2 1,304 Hokuriku 2006
Shimane 2 791 Chugoku 1989Takahama 1 780 Kansai 1974 2034Takahama 2 780 Kansai 1975 2035Takahama 3 830 Kansai 1985 2025 Restarted Jan/Feb 2016, shut down again Feb/March 2016Takahama 4 830 Kansai 1985 2025 Restarted Jan/Feb 2016, shut down again Feb/March 2016
Tokai 2 1,060 JAPC 1978Tomari 1 550 Hokkaido 1989Tomari 2 550 Hokkaido 1991Tomari 3 866 Hokkaido 2009Tsuruga 2 1,110 JAPC 1987
39,952
Reactors under construction
Reactor Net capacity (MWe) Utility Commenced construction Operational date Planned shutdown NotesShimane 3 1,373 Chugoku 2005, suspended 2011 2016, deferred
Ohma 1 1,383 EPDC/J-Power 2010. suspended 2011-12 20242,756
Planned reactors
Reactor Net capacity (MWe) Utility Commenced construction Planned operational date Planned shutdown NotesTsuruga 3 1,538 JAPC deferred 2017Tsuruga 4 1,538 JAPC deferred 2018
Higashidori 1 TEPCO 1,385 TEPCO deferredKaminoseki 1 1,373 Chugoku 2012, deferred TBD
Sendai 3 1,590 Kyushu 2014, deferred TBDHigashidori 2 TEPCO 1,385 TEPCO deferred
Hamaoka 6 1,380 Chubu 2016 or later TBDHigashidori 2 Tohoku 1,385 Tohoku 2016 TBD
Kaminoseki 2 1,373 Chugoku 2018, deferred TBD12,947
Proposed reactors
Reactor Net capacity (MWe) Utility Commenced construction Planned operational date Planned shutdown NotesFukushima Daichi 7 1,380 TEPCO 2012 (suspended)Fukushima Daichi 8 1,380 TEPCO 2012 (suspended)
Namie-odaka 1,385 Tohoku suspended4,145
Operational Reactors (Not including those to be permantently shut down e.g. Fukushima Daichi etc) - all currently offline unless indicated in notes
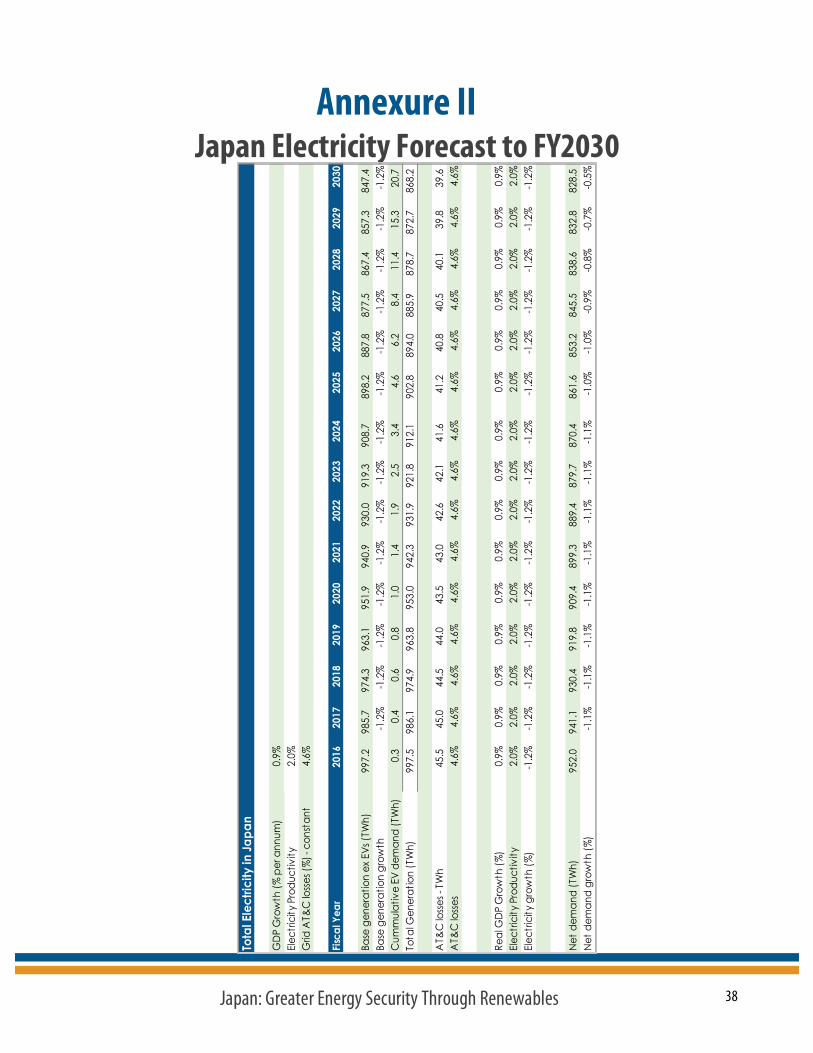
38 Japan: Greater Energy Security Through Renewables
Annexure II Japan Electricity Forecast to FY2030
Tota
l Ele
ctric
ity in
Japa
n
GD
P G
row
th (%
per
ann
um)
0.9%
Elec
tric
ity P
rodu
ctiv
ity2.
0%G
rid A
T&C
loss
es (%
) - c
onst
ant
4.6%
Fisca
l Yea
r20
1620
1720
1820
1920
2020
2120
2220
2320
2420
2520
2620
2720
2820
2920
30
Base
gen
erat
ion
ex E
Vs (T
Wh)
997.
2
98
5.7
97
4.3
963.
1
95
1.9
940.
9
93
0.0
919.
3
908.
7
898.
2
887.
8
87
7.5
86
7.4
857.
3
84
7.4
Base
gen
erat
ion
grow
th-1
.2%
-1.2
%-1
.2%
-1.2
%-1
.2%
-1.2
%-1
.2%
-1.2
%-1
.2%
-1.2
%-1
.2%
-1.2
%-1
.2%
-1.2
%C
umm
ulat
ive
EV d
eman
d (T
Wh)
0.3
0.4
0.
6
0.8
1.
0
1.4
1.
9
2.5
3.
4
4.6
6.2
8.
4
11.4
15.3
20.7
Tota
l Gen
erat
ion
(TW
h)99
7.5
986.
1
974.
9
96
3.8
953.
0
94
2.3
931.
9
92
1.8
91
2.1
90
2.8
89
4.0
885.
9
878.
7
87
2.7
868.
2
AT&
C lo
sses
- TW
h45
.5
45.0
44.5
44.0
43.5
43.0
42.6
42.1
41.6
41.2
40
.8
40
.5
40
.1
39
.8
39
.6
A
T&C
loss
es4.
6%4.
6%4.
6%4.
6%4.
6%4.
6%4.
6%4.
6%4.
6%4.
6%4.
6%4.
6%4.
6%4.
6%4.
6%
Real
GD
P G
row
th (%
)0.
9%0.
9%0.
9%0.
9%0.
9%0.
9%0.
9%0.
9%0.
9%0.
9%0.
9%0.
9%0.
9%0.
9%0.
9%El
ectr
icity
Pro
duct
ivity
2.0%
2.0%
2.0%
2.0%
2.0%
2.0%
2.0%
2.0%
2.0%
2.0%
2.0%
2.0%
2.0%
2.0%
2.0%
Elec
tric
ity g
row
th (%
)-1
.2%
-1.2
%-1
.2%
-1.2
%-1
.2%
-1.2
%-1
.2%
-1.2
%-1
.2%
-1.2
%-1
.2%
-1.2
%-1
.2%
-1.2
%-1
.2%
Net
dem
and
(TW
h)95
2.0
941.
1
930.
4
91
9.8
909.
4
89
9.3
889.
4
87
9.7
87
0.4
86
1.6
85
3.2
845.
5
838.
6
83
2.8
828.
5
N
et d
eman
d gr
owth
(%)
-1.1
%-1
.1%
-1.1
%-1
.1%
-1.1
%-1
.1%
-1.1
%-1
.1%
-1.0
%-1
.0%
-0.9
%-0
.8%
-0.7
%-0
.5%
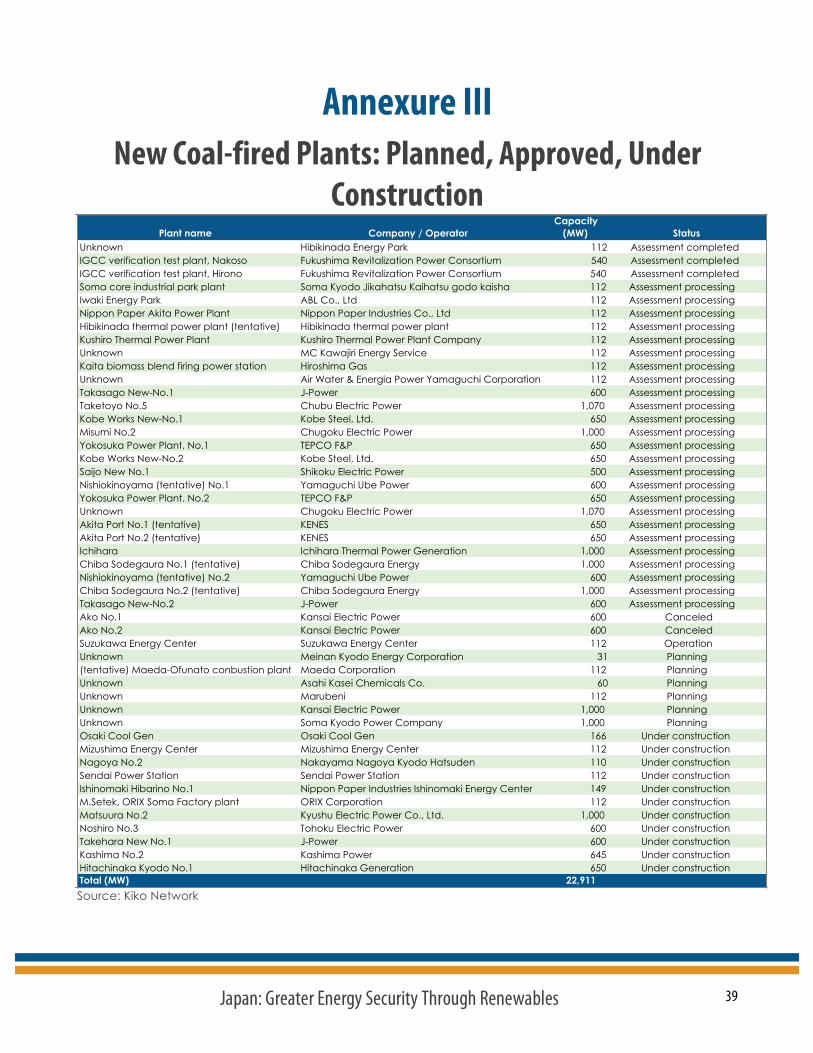
39 Japan: Greater Energy Security Through Renewables
Annexure III New Coal-fired Plants: Planned, Approved, Under
Construction
Source: Kiko Network
Area Plant name Company / OperatorCapacity
(MW) StatusFukuoka Unknown Hibikinada Energy Park 112 Assessment completedFukushima IGCC verification test plant, Nakoso Fukushima Revitalization Power Consortium 540 Assessment completedFukushima IGCC verification test plant, Hirono Fukushima Revitalization Power Consortium 540 Assessment completedFukushima Soma core industrial park plant Soma Kyodo Jikahatsu Kaihatsu godo kaisha 112 Assessment processingFukushima Iwaki Energy Park ABL Co., Ltd 112 Assessment processingAkita Nippon Paper Akita Power Plant Nippon Paper Industries Co., Ltd 112 Assessment processingFukuoka Hibikinada thermal power plant (tentative) Hibikinada thermal power plant 112 Assessment processingHokkaido Kushiro Thermal Power Plant Kushiro Thermal Power Plant Company 112 Assessment processingMiye Unknown MC Kawajiri Energy Service 112 Assessment processingHiroshima Kaita biomass blend firing power station Hiroshima Gas 112 Assessment processingYamaguchi Unknown Air Water & Energia Power Yamaguchi Corporation 112 Assessment processingHyogo Takasago New-No.1 J-Power 600 Assessment processingAichi Taketoyo No.5 Chubu Electric Power 1,070 Assessment processingHyogo Kobe Works New-No.1 Kobe Steel, Ltd. 650 Assessment processingShimane Misumi No.2 Chugoku Electric Power 1,000 Assessment processingKanagawa Yokosuka Power Plant, No.1 TEPCO F&P 650 Assessment processingHyogo Kobe Works New-No.2 Kobe Steel, Ltd. 650 Assessment processingEhime Saijo New No.1 Shikoku Electric Power 500 Assessment processingYamaguchi Nishiokinoyama (tentative) No.1 Yamaguchi Ube Power 600 Assessment processingKanagawa Yokosuka Power Plant. No.2 TEPCO F&P 650 Assessment processingChiba Unknown Chugoku Electric Power 1,070 Assessment processingAkita Akita Port No.1 (tentative) KENES 650 Assessment processingAkita Akita Port No.2 (tentative) KENES 650 Assessment processingChiba Ichihara Ichihara Thermal Power Generation 1,000 Assessment processingChiba Chiba Sodegaura No.1 (tentative) Chiba Sodegaura Energy 1,000 Assessment processingYamaguchi Nishiokinoyama (tentative) No.2 Yamaguchi Ube Power 600 Assessment processingChiba Chiba Sodegaura No.2 (tentative) Chiba Sodegaura Energy 1,000 Assessment processingHyogo Takasago New-No.2 J-Power 600 Assessment processingHyogo Ako No.1 Kansai Electric Power 600 CanceledHyogo Ako No.2 Kansai Electric Power 600 CanceledShizuoka Suzukawa Energy Center Suzukawa Energy Center 112 OperationAichi Unknown Meinan Kyodo Energy Corporation 31 PlanningIwate (tentative) Maeda-Ofunato conbustion plant Maeda Corporation 112 PlanningMiyazaki Unknown Asahi Kasei Chemicals Co. 60 PlanningIbaraki Unknown Marubeni 112 PlanningChiba Unknown Kansai Electric Power 1,000 PlanningFukushima Unknown Soma Kyodo Power Company 1,000 PlanningHiroshima Osaki Cool Gen Osaki Cool Gen 166 Under constructionOkayama Mizushima Energy Center Mizushima Energy Center 112 Under constructionAichi Nagoya No.2 Nakayama Nagoya Kyodo Hatsuden 110 Under constructionMiyagi Sendai Power Station Sendai Power Station 112 Under constructionMiyagi Ishinomaki Hibarino No.1 Nippon Paper Industries Ishinomaki Energy Center 149 Under constructionFukushima M.Setek, ORIX Soma Factory plant ORIX Corporation 112 Under constructionNagasaki Matsuura No.2 Kyushu Electric Power Co., Ltd. 1,000 Under constructionAkita Noshiro No.3 Tohoku Electric Power 600 Under constructionHiroshima Takehara New No.1 J-Power 600 Under constructionIbaraki Kashima No.2 Kashima Power 645 Under constructionIbaraki Hitachinaka Kyodo No.1 Hitachinaka Generation 650 Under constructionTotal (MW) Total (MW) 22,911
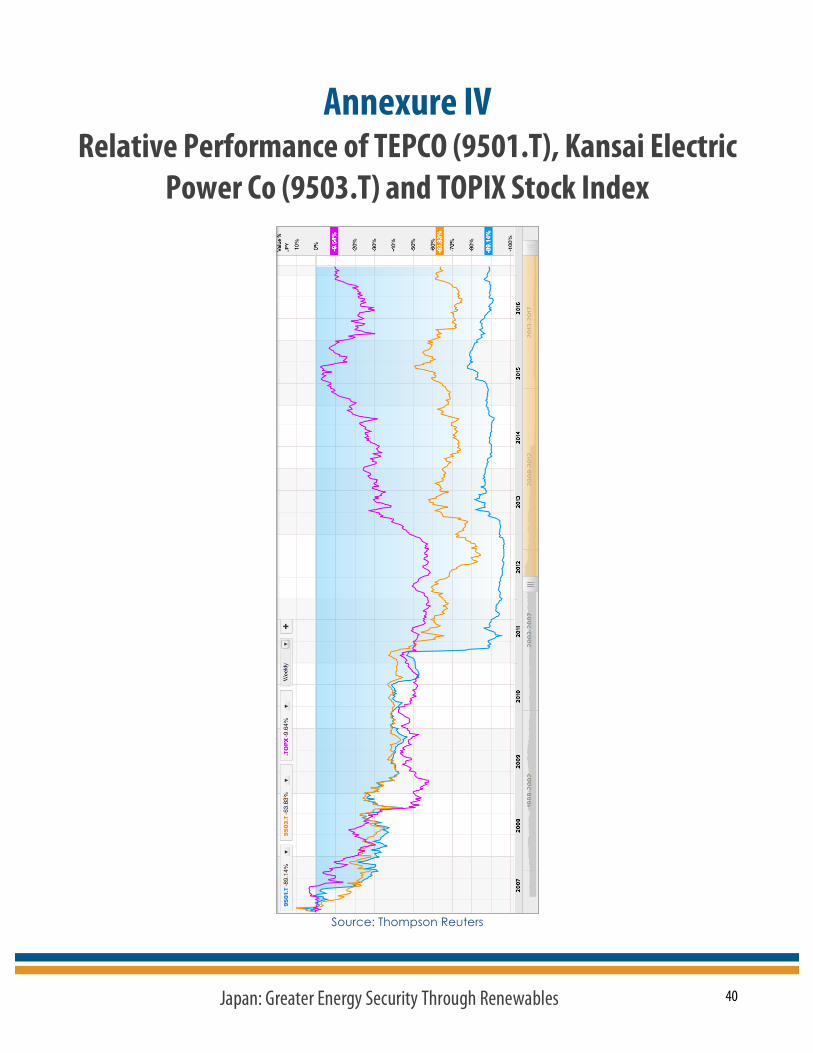
40 Japan: Greater Energy Security Through Renewables
Annexure IV Relative Performance of TEPCO (9501.T), Kansai Electric
Power Co (9503.T) and TOPIX Stock Index
Source: Thompson Reuters
41 Japan: Greater Energy Security Through Renewables
Institute for Energy Economics and Financial Analysis The Institute for Energy Economics and Financial Analysis (IEEFA) conducts research and analyses on financial and economic issues related to energy and the environment. The Institute’s mission is to accelerate the transition to a diverse, sustainable and profitable energy economy and to reduce dependence on coal and other non-renewable energy resources.
More can be found at www.ieefa.org.
About the Authors Tim Buckley Tim Buckley, IEEFA’s director of energy finance research, Australasia, has 25 years of financial market experience covering the Australian, Asian and global equity markets from both a buy and sell side perspective. Tim was a top-rated Equity Research Analyst and has covered most sectors of the Australian economy. Tim was a Managing Director, Head of Equity Research at Citigroup for many years, as well as co-Managing Director of Arkx Investment Management P/L, a global listed clean energy investment company that was jointly owned by management and Westpac Banking Group.
Simon Nicholas Simon Nicholas is a research analyst with IEEFA in Australia. Simon holds an honours degree from Imperial College, London and is a Fellow of the Institute of Chartered Accountants of England and Wales and has 16 years’ experience working within the finance sector in both London and Sydney at ABN Amro, Macquarie Bank and Commonwealth Bank of Australia.
42 Japan: Greater Energy Security Through Renewables
Important Information This report is for information and educational purposes only. The Institute for Energy Economics and Financial Analysis (“IEEFA”) does not provide tax, legal, investment or accounting advice. This report is not intended to provide, and should not be relied on for, tax, legal, investment or accounting advice. Nothing in this report is intended as investment advice, as an offer or solicitation of an offer to buy or sell, or as a recommendation, endorsement, or sponsorship of any security, company, or fund. IEEFA is not responsible for any investment decision made by you. You are responsible for your own investment research and investment decisions. This report is not meant as a general guide to investing, nor as a source of any specific investment recommendation. Unless attributed to others, any opinions expressed are our current opinions only. Certain information presented may have been provided by third parties. IEEFA believes that such third-party information is reliable, and has checked public records to verify it wherever possible, but does not guarantee its accuracy, timeliness or completeness; and it is subject to change without notice.