it's not that i’m a racist, it's that they are roma...
TRANSCRIPT

DI
SC
US
SI
ON
P
AP
ER
S
ER
IE
S
Forschungsinstitut zur Zukunft der ArbeitInstitute for the Study of Labor
“It’s not that I’m a racist, it’s that they are Roma”:Roma Discrimination and Returns to Educationin South Eastern Europe
IZA DP No. 4208
June 2009
Niall O’Higgins

“It’s not that I’m a racist, it’s that they are Roma”:
Roma Discrimination and Returns to Education in South Eastern Europe
Niall O’Higgins Celpe, DiSES, University of Salerno
and IZA
Discussion Paper No. 4208 June 2009
IZA
P.O. Box 7240 53072 Bonn
Germany
Phone: +49-228-3894-0 Fax: +49-228-3894-180
E-mail: [email protected]
Any opinions expressed here are those of the author(s) and not those of IZA. Research published in this series may include views on policy, but the institute itself takes no institutional policy positions. The Institute for the Study of Labor (IZA) in Bonn is a local and virtual international research center and a place of communication between science, politics and business. IZA is an independent nonprofit organization supported by Deutsche Post Foundation. The center is associated with the University of Bonn and offers a stimulating research environment through its international network, workshops and conferences, data service, project support, research visits and doctoral program. IZA engages in (i) original and internationally competitive research in all fields of labor economics, (ii) development of policy concepts, and (iii) dissemination of research results and concepts to the interested public. IZA Discussion Papers often represent preliminary work and are circulated to encourage discussion. Citation of such a paper should account for its provisional character. A revised version may be available directly from the author.

IZA Discussion Paper No. 4208 June 2009
ABSTRACT
“It’s not that I’m a racist, it’s that they are Roma”: Roma Discrimination and Returns to Education
in South Eastern Europe*
This paper uses a unique survey of Roma and non-Roma in South Eastern Europe to evaluate competing explanations for the poor performance of Roma in the labour market. The analysis seeks to identify the determinants of educational achievement, employment and wages for Roma and non-Roma. LIML methods are employed to control for endogenous schooling and two sources of sample selection bias in the estimates. Nonlinear and linear decomposition techniques are applied in order to identify the extent of discrimination. The key results are that: the employment returns to education are lower for Roma than for non-Roma whilst the wage returns are broadly similar for the two groups; the similar wage gains translate into a smaller absolute wage gain for Roma than for non-Roma given their lower average wages; the marginal absolute gains from education for Roma are only a little over one-third of the marginal absolute gains to education for majority populations; and, there is evidence to support the idea that a substantial part of the differential in labour market outcomes is due to discrimination. Explanations of why Roma fare so badly tend to fall into one of two camps: ‘low education’ vs. ‘discrimination’. The analysis suggests that both of these explanations have some basis in fact. Moreover, a direct implication of the lower absolute returns to education accruing to Roma is that their lower educational participation is, at least partially, due to rational economic calculus. Consequently, policy needs to address both low educational participation and labour market discrimination contemporaneously. JEL Classification: C35, J15, J24, P23 Keywords: Roma, returns to education, discrimination, transition Corresponding author: Niall O’Higgins DiSES Università degli Studi di Salerno Via Ponte Don Melillo 84084 Fisciano (SA) Italy E-mail: [email protected]
* With apologies to Giobbe Covatta – a Neapolitan Comedian who, whilst pretending to be a member of the Italian Northern League, used to remark, tongue very much in cheek, “Non siamo noi che siamo racisti, sono loro che sono Napolitani” (its not us that are racists its them that are Neapolitans). I would like to thank Jaroslav Kling, Susanne Milcher and, above-all Andrei Ivanov for discussions on the various issues involved at an earlier stage in this work. The paper has also greatly benefitted from participants’ comments at the 2007 AIEL Conference, and in particular those of Francesco Pastore and Hartmut Lehmann. Usual disclaimers apply.

2
1. Introduction Almost two decades have passed since the countries of Central and Eastern
Europe began their transition to the market. Much progress has been made in introducing market mechanisms to these countries; ten of which are now members of the EU, with more to follow. The period of transition witnessed severe recession, the emergence of mass unemployment and mass poverty for the first time since the Second World War as well as rapidly growing income and wage inequality. Recovery began during the 1990s – with much variation in dates across countries – so that by 2005 all the new EU Member States as well as some countries in South East Europe (SEE) and the ex-Soviet Union has managed to recover their pre-transition levels of per capita income.
However, one group, the Roma, have quite clearly not participated in the benefits of the new market economies. The Roma comprise a substantial proportion (between 5-10%) of the population in each of the countries considered here1. Although by no means an advantaged group under the previous system, they were at least guaranteed basic education, employment and, consequently income2. Since transition, they have largely been excluded from formal sector employment, and often also from much of the protection offered by the relatively well developed social security systems in these countries (Ivanov et al., 2006).
One problem which arises in attempting to evaluate the situation of the Roma in
the countries of Central and Eastern Europe is the lack of systematic data collection on this group. Much ink has been spilled on the Roma over the last two decades or so but relatively little of this has been based on rigorous analysis of hard data. Three notable exceptions to this are UNDP (2002), Ringold et al. (2005) and Ivanov et al. (2006). The analysis presented here uses data collected for the last of these reports in order to identify the determinants of labour market outcomes amongst the Roma and non-Roma in nine countries of South Eastern Europe. The survey covered both Roma and non-Roma populations living in proximity to each other. Thus the survey itself cannot claim to be nationally representative for each country covered – nor indeed was this its purpose - however, much effort was employed to ensure that the Roma and non-Roma samples were directly comparable one to another. It represents a systematic attempt to provide hard information on the situation of Roma in transition countries. In contrast to many previous efforts, inclusion of a comparison, non-Roma group in the UNDP sample allows
1 The ‘Roma’ in fact comprise a number of different ethnic groups not all of which would call themselves Roma, however, again for simplicity and by convention we will lump them all together here. 2 There was a curious asymetry in their treatment here. On the one hand, their status as victims of Nazi persecution meant that Roma were afforded the ‘socially progressive strata’ status. On the other, this preiveleged status was not applied to the Roma as a culturally specific group (Ivanov et al., 2006). Moreover, in some countries, socialist efforts to raise educational levels amongst the Roma created the legacy still observable today of channelling Roma children into special schools, intended for children with mental or physical disabilities (Crowe, 1994).

3
the analysis to go much further in evaluating the relative effects of, in this case, education on the employment and income of the Roma population. To my knowledge, this is the first paper to attempt to explicitly identify and quantify the contribution of low education and discrimination to the Roma’s disadvantaged position in the formerly Socialist countries of Central and Eastern Europe.
Specifically, the paper analyses the determinants of education, employment and
earnings in SEE3. As noted above, Roma were the clear losers from the transition to the market economy in the countries of Central and Eastern Europe. Nowadays they face unemployment rates well above, and incomes well below, the average of their ‘majority’ counterparts. Explanations of why Roma seem to fare so badly tend to fall into one of two, usually not disinterested, camps: the ‘low education’ and the ‘discrimination’ schools. That is, the poor employment prospects of Roma are due either to their reluctance to participate in education or because they are discriminated against in the labour market. This paper attempts to throw some light on the issue.
The next section provides information on the survey data employed here as well
as some descriptive information derived from it on the Roma situation in the region as regards employment, income and educational participation. This highlights the lower educational participation of Roma as well as their much poorer labour market performance. The subsequent section reports the results of estimations of the determinants of educational participation, employment and wages. LIML methods are used to control for endogenous school participation in the determination of employment and wages and sample selection bias in the determination of wages. The results, along with a decomposition analysis are then used to discuss the validity of the two main basic explanations for Roma disadvantage: low education vs. discrimination. The analysis suggests that both factors are at work. Moreover, they are complementary. Specifically, lower absolute returns to education for Roma imply that lower educational participation on the part of Roma is at least partially based on rational economic calculus. The final section offers some concluding comments. In particular, the implication of the complementarity between educational participation and discrimination implies that policy intervention needs to tackle both issues contemporaneously.
3 South Eastern Europe as used here comprises a subset of the formerly socialist countries of Central and Eastern Europe.

4
2. A First Look at the Roma Situation
2.1 The UNDP survey
The analysis presented here is based on data drawn from a survey of majority and Roma populations in the countries of South Eastern Europe undertaken in November/December 20044. The survey collected information on Roma and majority populations in Albania, Bosnia & Herzegovina, Bulgaria, Croatia, Kosovo, Macedonia, Montenegro, Romania, and Serbia (excluding Kosovo). Tables 1 and 2 provide information on sample sizes by country and descriptive statistics of the variables involved in the analysis below. The purpose of the survey was to provide a basis for the comparative assessment of the situation of Roma compared to majority populations living in ‘comparable’ situations. Specifically, the survey base was comprised of: (i) all the households in Roma settlements or areas of compact Roma population; and, (ii) non-Roma communities living in close proximity to Roma. Thus, whilst much effort went into ensuring that the survey covered provided a representative sample of Roma, the purpose of the majority sample was to provide a comparison group of persons who did not belong to this ethnic minority but who lived however, in close proximity to them. As such, the majority samples are not nationally representative samples of that group; rather, they are representative samples of non-Roma communities living in settlements with Roma communities of ‘average and above’ size5.
Tables 1 and 2 about here
The survey was conducted by face-to-face interview and in the case of Roma
interviewees, the interviewers were in teams of two including one Roma person to engender trust in the interviewees. In each household, one responsible person provided basic information on the household and all household members. Overall the sample comprises 29,818 individuals, of whom 17,270 were Roma. Of these 12,353 (6,234 Roma) were aged between 25 and 64, were not still in education and provided full information on all of the relevant variables and so were included in the sample used for the analysis here.
Table 2 provides descriptive statistics on the sample used here. The table illustrates the basic characteristics of Roma disadvantage. They have much lower educational levels, significantly lower family permanent incomes (indicated by the greater household size, the lower incidence of home ownership and the smaller number of
4 The survey also covered Internally Displaced Persons and Refugees. These are excluded from the sample used here. 5 This was an important element in the sample design and is discussed in some detail in Ivanov et al. (2006) to which the interested reader is referred for more information on the sampling method and other aspects of the survey methodology.

5
facilities in the home) and wages and larger family sizes. Proxies are used here to represent family permanent income for two main reasons: i) educational participation is likely to be more related to family wealth (permanent income) than current family income (available in the survey) since it requires a long-term investment on the part of families; and, ii) the proxies used here are not subject to the same degree of misreporting associated with survey responses on (family) income.
2.2 Roma and the Labour Market
On the basis of the UNDP survey, one may go into a little more detail about some of the differences between the labour market outcomes of Roma and majority populations. Thus, for example, the Roma face higher unemployment rates and receive lower wages than their majority counterparts (figure 1). This is true for both men and women in all the countries considered here.
Figures 1, 2 and 3 about here
The question immediately arises as to why this is the case. One obvious contender for the explanation lies in the much lower educational levels observable amongst the Roma population. Figure 4 illustrates this. Throughout the region, education levels amongst the Roma are much lower than those of majority populations. It is also well known that the education level of an individual is positively correlated with his or her wages more or less everywhere and, certainly in middle-high income countries, negatively correlated with the probability of finding employment (e.g. Psacharopoulos, 1994, and Psacharopoulos and Patrinos, 2004).
Moreover, those Roma who do manage to find employment are much more likely to be working in the informal economy (figure 2) and to receive lower wages than their majority counterparts (figure 3).
Figure 4 about here
Looking at the relation between education and unemployment (figure 5) and education and wages (figure 6) separately for Roma and majority populations one may observe that for the Roma, both unemployment rates and wages appear to be less sensitive to the level of education than they are for majority populations. That is, on the basis of this purely descriptive analysis, the Roma appear to have lower employment and wage returns to education. The exception are Roma with tertiary education who have median wages which are comparable to majority populations, however, one may recall from figure 5 above that this concerns a very small proportion of the Roma population so

6
that inter alia, the estimate has a relatively low degree of precision6. Taken at face value, these figures might be used to suggest that the Roma’s lower participation in education may be due in part to the lower returns accruing to this group. If, as a result of discrimination or more generally poorer access to employment opportunities, the benefits obtained from education are lower for the Roma then it is rational from a purely economic point of view for the Roma to participate less than the majority in education. Although suggestive, however, neither of these figures are sufficient to draw any firm conclusions. It is the purpose of the next section to dig a little deeper into the factors underlying Roma disadvantage and in particular to understand more clearly the role played by lower levels education and discrimination.
Figures 5 and 6 about here
6 It might also be observed that figure 6 suggests that the unemployment rates of members of the majority populations with very low levels of education have actually a higher unemployment rate that similarly qualified Roma, although this concerns a relatively small proportion of the (majority) population.
7
3. Looking for explanations: Determinants of Educational Participation, Employment and Wages
In this section I analyse the determinants of education level, employment and
wages. The analysis is limited to adults aged 25-64 and separate models are estimated for males/females and Roma/non-Roma. The determinants of years of schooling are estimated using OLS. Employment determination is estimated by univariate probit and the (natural logarithm of) monthly wages is estimated by OLS. Initially, these equations are assumed to be independent. Years of schooling are estimated as a function of variables representing permanent family income and the characteristics of the neighbourhood as well as an individual’s age. In addition to years of schooling, employment and wage equations include also terms for whether an individual is married and/or the head of the household – both current characteristics which may well effect employment and wages but which were, in all probability, temporally subsequent to the leaving school. Since such estimates are likely to be biased by the endogeneity of schooling – participation in education will depend to some extent at least, on its effect on labour market outcomes – and, in the case of wages, sample selection bias, LIML estimates are subsequently offered which control for both of these problems.
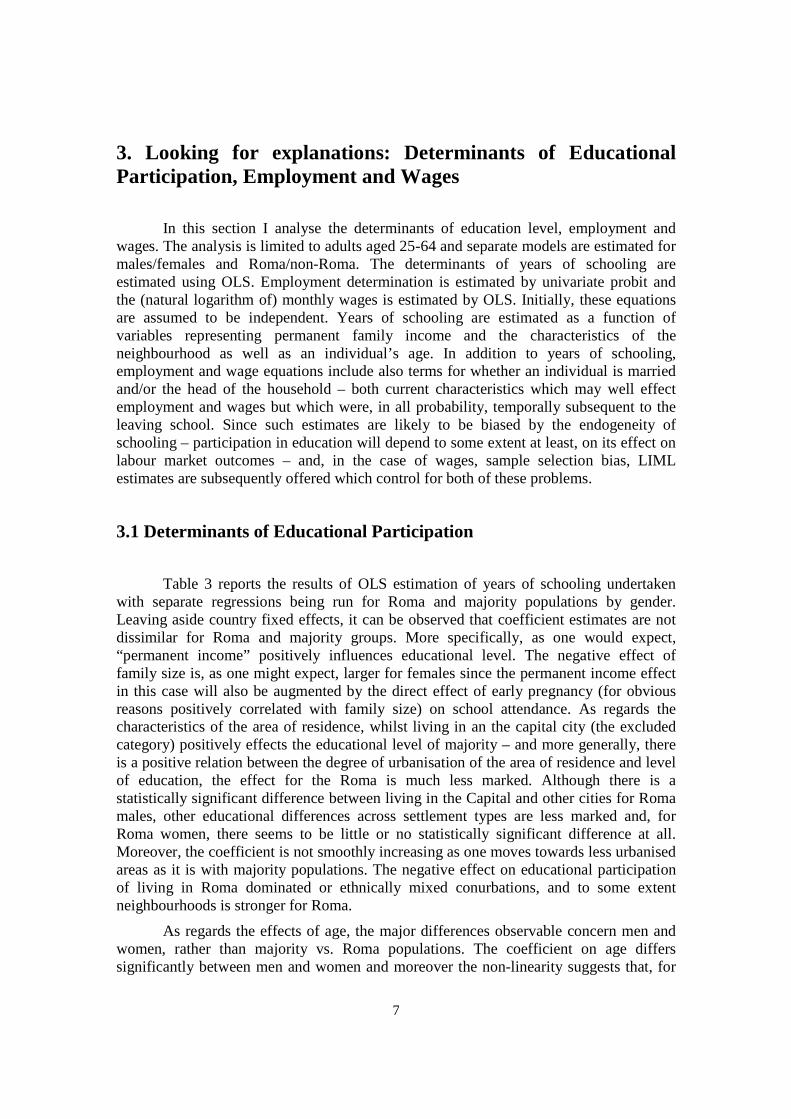
3.1 Determinants of Educational Participation
Table 3 reports the results of OLS estimation of years of schooling undertaken with separate regressions being run for Roma and majority populations by gender. Leaving aside country fixed effects, it can be observed that coefficient estimates are not dissimilar for Roma and majority groups. More specifically, as one would expect, “permanent income” positively influences educational level. The negative effect of family size is, as one might expect, larger for females since the permanent income effect in this case will also be augmented by the direct effect of early pregnancy (for obvious reasons positively correlated with family size) on school attendance. As regards the characteristics of the area of residence, whilst living in an the capital city (the excluded category) positively effects the educational level of majority – and more generally, there is a positive relation between the degree of urbanisation of the area of residence and level of education, the effect for the Roma is much less marked. Although there is a statistically significant difference between living in the Capital and other cities for Roma males, other educational differences across settlement types are less marked and, for Roma women, there seems to be little or no statistically significant difference at all. Moreover, the coefficient is not smoothly increasing as one moves towards less urbanised areas as it is with majority populations. The negative effect on educational participation of living in Roma dominated or ethnically mixed conurbations, and to some extent neighbourhoods is stronger for Roma.
As regards the effects of age, the major differences observable concern men and women, rather than majority vs. Roma populations. The coefficient on age differs significantly between men and women and moreover the non-linearity suggests that, for

8
men (both Roma and non-Roma) ceteris paribus educational level increases with age until individuals reach their late 30’s7. The implication is that, in the less advantaged areas where the survey was undertaken, the educational levels of both Roma and non-Roma men have been falling since transition. Such an effect is not evident for women with the effect of age being negative for all or almost all the age-group considered here8.
3.2 Determinants of Employment Table 4 reports the results of a simple probit model of employment determination. The model is again estimated separately for males and females and for majority and Roma populations. The table suggests that overall, years of schooling is a more important determinant for women than for men and, to a lesser degree majority rather than Roma populations. The more substantial effect for women in part arises from the well-established labour force participation effect of education for women. That is, more highly educated women are both more likely to seek - as well as to obtain, given that they seek – employment (Jaumotte, 2003). However, there is also a substantial difference in terms of the employment ‘returns’ of education. The number of years of schooling has a larger effect on the employment prospects of majority populations than it does on the Roma.
As regards the other explanatory variables, the probability of employment rises with (potential) labour market experience although, for majority males, after 13 years this has already reached a peak. The maximum talks longer to achieve for majority females (22 years), Roma males (19 years) and Roma females (29 years) possibly due to the lower overall employment rates amongst the latter three groups. For the most part, taking the sexes separately, the other explanatory variables have broadly similar effects for Roma and non-Roma. Living in an ethnically mixed or Roma dominated settlement detrimentally affects employment chances for all groups, although the effect is somewhat more pronounced for Roma – and above-all for Roma females living in Roma dominated settlements.
Table 4 about here
A significant problem with the estimates presented in table 4 is that they do not allow for the endogeneity of schooling. One – and in a pure human capital model, the - motivation for participating in education arises from the gains accruing to those remaining in education for longer in terms of improved employment prospects and higher income. Moreover, such gains are not likely to be spread evenly across individuals. Some people are more able to exploit the benefits of education than others leading to ability 7 To be precise, to age 37 for Roma and age 38 for non-Roma. 8 Specifically, for Roma women the effects of age become negative at age 25, for non-Roma women at age 26.

9
bias in the estimated coefficients for years of schooling. As is well known, ability bias will tend to be positive (Card, 1999). That is, if the more able are those who choose to participate in education for longer because they are likely to derive greater benefits from it, then the estimate of the effect of schooling will be biased upwards. More generally, if schooling decisions depend on unobserved factors which also affect the likelihood of finding employment, then the coefficient on years of schooling will be biased by the correlation between schooling and unobserved factors in the employment equation. Indeed, Instrumental Variable estimates of returns to education are typically higher than their OLS counterparts (Harmon et al., 2003). It is straightforward to control for endogeneity in the employment equation by estimating a two equation model and using the average years of schooling of other adult household members (and permanent income) as instruments for years of schooling. Specifically, following Roodman (2009), Limited Information Maximum Likelihood (LIML) is applied to obtain consistent parameter estimates of the two equation model:
� = ���� + ��� + ��� + � (1)
�∗ = ���� + �� + � (2) With,
E = 1 iff E* > 0 (3)
= � � , ��′~���, �� (4)
� = ���� �����1 (5)
Where S = years of schooling; X = explanatory variables common to both equations9; P = the three permanent income variables; �� = mean years of education of other adult (over 25) family members; E* is a latent variable representing the ‘tendency’ to be employed and which is related to its observed counterpart E (= 1 if the person is employed, = 0 otherwise) as indicated in (3). The model was estimated using the Stata ‘cmp’ routine written by Roodman (2009). Essentially equation (1) is a linear reduced form and (2) the structural equation of interest estimated by probit. The joint estimation procedure allows one to control for the endogeneity of years of schooling in the employment equation.
Table 5 about here
Table 5 reports the estimates of equation (2) including also the estimated correlation coefficient between the error terms. It will be observed that the correlation coefficient is strongly statistically significant (at p < .01 for males and p < .05 for
9 Note that potential experience replaces age also in the schooling equation in this case.

10
females) for members of the majority populations, but rather less so (p < .10 for males and p < .20) for Roma. Moreover, for majority populations it is negative implying that the single equation estimates significantly understate the impact of years of schooling on employment probability for majority populations. For Roma the estimated correlation is small and negative for males and small and positive for females. Overall, allowing for endogenous schooling leads to the emergence of a more substantial difference in the effects of education on employment chances for majority and Roma populations. Not controlling for endogeneity, the difference in the estimated coefficients on schooling between majority and Roma populations was .02 for males and .10 for females. Allowing for endogeneity, these differences rise to .06 for males and .17 for females. Although, given that labour supply effects are not separated from demand factors in the employment equation, some care should be exercised in interpreting these effects for females in particular, the implication is that participation in education does much less to improve the Roma’s chances of finding employment than it does for majority populations. In other words, the key to resolving the employment problems cannot come from simply increasing the duration of their participation in education.
More generally, one might ask to what extent are the differences in employment opportunities for Roma are a result of differences in the individual characteristics of Roma and non-Roma as opposed to differences in the impact of individual characteristics? In order to answer this question, the three-way decomposition technique proposed by Bauer & Sinning (2008) was employed. This is an extension for non-linear models of the decomposition proposed independently by Blinder (1973) and Oaxaca (1973) for the linear case, with the addition of the interaction term – the ‘third way’ - proposed by Daymont & Andrisani (1984). Table 6 reports the results based on a reduced form version of equation (2) above. The table suggests that indeed there are grounds for supposing that discrimination is playing a role. Using the majority estimates to provide the base coefficient vector, suggests that discrimination accounts for 38% of the employment probability differential or 6 percentage points from a total difference of 14 percentage point difference in employment probability. For females, the extent of discrimination, again using the majority population as the base, is 23% or 5 percentage points out of a total difference of 20 percentage points – somewhat lower than for males although one can observe from the table that this largely arises from a more substantial interaction term.
Table 6 about here
Thus, there is evidence that discrimination against Roma in terms of their employment opportunities, goes well beyond that implied by differences in the employment benefits of education. However, as far as the analysis here is presented, the key point is that there is a substantial difference in the employment benefits accruing to Roma and majority populations from staying on longer in school.
11
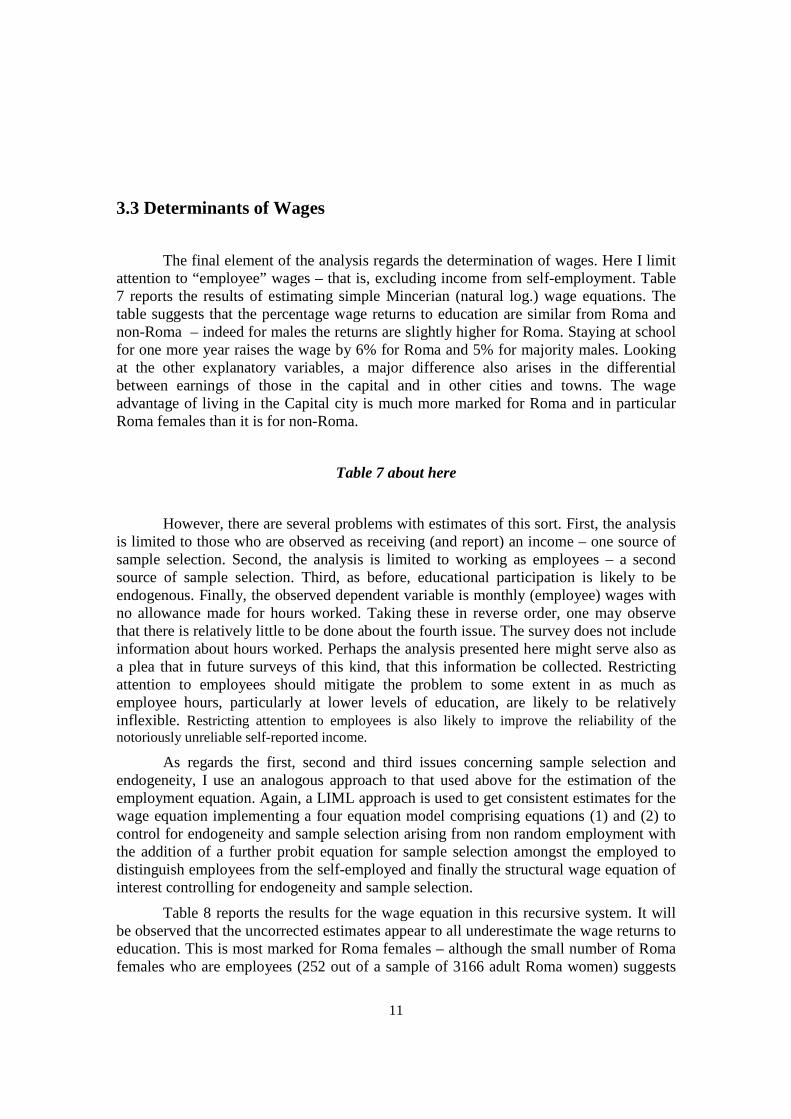
3.3 Determinants of Wages
The final element of the analysis regards the determination of wages. Here I limit attention to “employee” wages – that is, excluding income from self-employment. Table 7 reports the results of estimating simple Mincerian (natural log.) wage equations. The table suggests that the percentage wage returns to education are similar from Roma and non-Roma – indeed for males the returns are slightly higher for Roma. Staying at school for one more year raises the wage by 6% for Roma and 5% for majority males. Looking at the other explanatory variables, a major difference also arises in the differential between earnings of those in the capital and in other cities and towns. The wage advantage of living in the Capital city is much more marked for Roma and in particular Roma females than it is for non-Roma.
Table 7 about here
However, there are several problems with estimates of this sort. First, the analysis is limited to those who are observed as receiving (and report) an income – one source of sample selection. Second, the analysis is limited to working as employees – a second source of sample selection. Third, as before, educational participation is likely to be endogenous. Finally, the observed dependent variable is monthly (employee) wages with no allowance made for hours worked. Taking these in reverse order, one may observe that there is relatively little to be done about the fourth issue. The survey does not include information about hours worked. Perhaps the analysis presented here might serve also as a plea that in future surveys of this kind, that this information be collected. Restricting attention to employees should mitigate the problem to some extent in as much as employee hours, particularly at lower levels of education, are likely to be relatively inflexible. Restricting attention to employees is also likely to improve the reliability of the notoriously unreliable self-reported income.
As regards the first, second and third issues concerning sample selection and endogeneity, I use an analogous approach to that used above for the estimation of the employment equation. Again, a LIML approach is used to get consistent estimates for the wage equation implementing a four equation model comprising equations (1) and (2) to control for endogeneity and sample selection arising from non random employment with the addition of a further probit equation for sample selection amongst the employed to distinguish employees from the self-employed and finally the structural wage equation of interest controlling for endogeneity and sample selection.
Table 8 reports the results for the wage equation in this recursive system. It will be observed that the uncorrected estimates appear to all underestimate the wage returns to education. This is most marked for Roma females – although the small number of Roma females who are employees (252 out of a sample of 3166 adult Roma women) suggests
12
caution in attaching too much weight to this apparently large difference. Leaving aside Roma females, the notable thing about the results reported here is the similarity in wage returns to education for Roma and non-Roma.
Table 8 about here
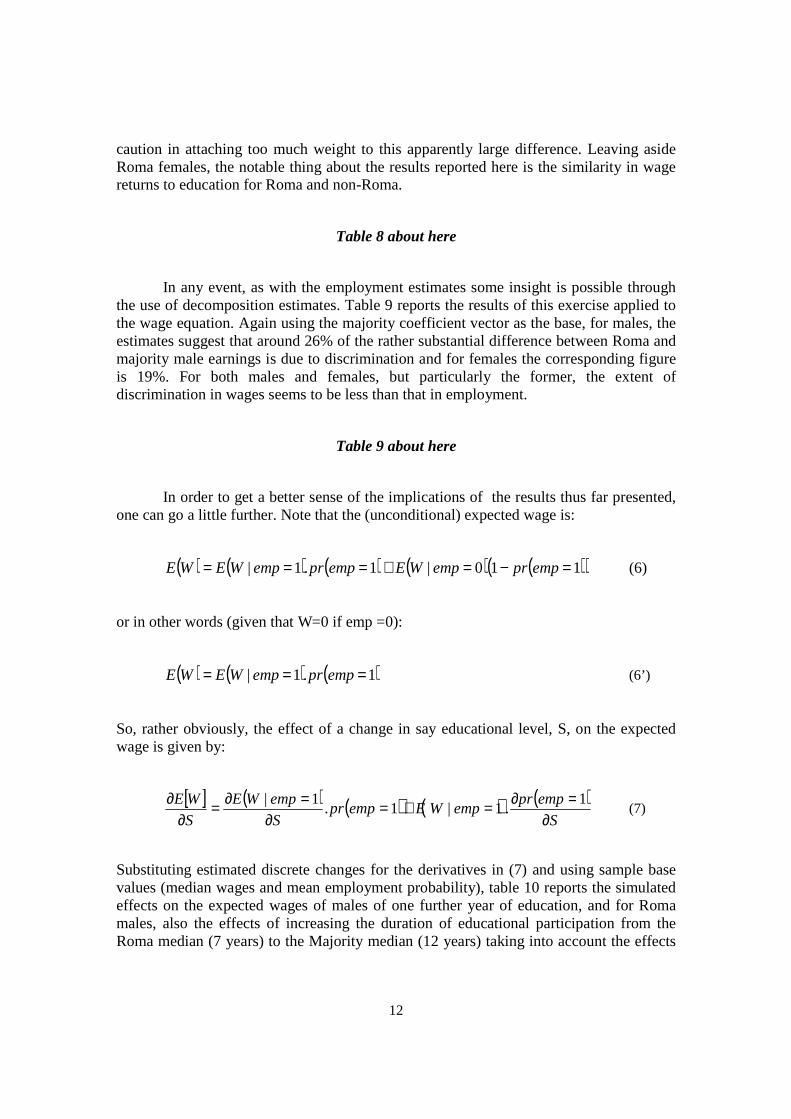
In any event, as with the employment estimates some insight is possible through the use of decomposition estimates. Table 9 reports the results of this exercise applied to the wage equation. Again using the majority coefficient vector as the base, for males, the estimates suggest that around 26% of the rather substantial difference between Roma and majority male earnings is due to discrimination and for females the corresponding figure is 19%. For both males and females, but particularly the former, the extent of discrimination in wages seems to be less than that in employment.
Table 9 about here
In order to get a better sense of the implications of the results thus far presented, one can go a little further. Note that the (unconditional) expected wage is:
( ) ( ) ( ) ( ) ( )( )110|1.1| =−=+=== empprempWEempprempWEWE (6)
or in other words (given that W=0 if emp =0):
( ) ( ) ( )1.1| === empprempWEWE (6’)
So, rather obviously, the effect of a change in say educational level, S, on the expected wage is given by:
[ ] ( ) ( ) ( ) ( )S
empprempWEemppr
S
empWE
S
WE
∂=∂=+=
∂=∂=
∂∂ 1
.1|1.1|
(7)
Substituting estimated discrete changes for the derivatives in (7) and using sample base values (median wages and mean employment probability), table 10 reports the simulated effects on the expected wages of males of one further year of education, and for Roma males, also the effects of increasing the duration of educational participation from the Roma median (7 years) to the Majority median (12 years) taking into account the effects

13
of education on both employment and wages. The table also reports the estimated effects of removing discrimination using the estimated values from tables 6 and 9.
Table 10 about here
The table suggests that the marginal wage gains from education, in absolute terms, are lower for Roma males than for majority males, €7 as opposed to €19 respectively for each additional year in education. This depends both on the smaller impact of education on the employment probabilities of Roma and the fact that the Roma base (median) wage is lower so that the broadly similar percentage returns to education translate for Roma into only about half the absolute gain accruing to majority males. Raising the educational level of Roma to the majority median is by no means sufficient to remove the gap in earnings between the two groups. Indeed, according to the estimated values, discrimination and educational disadvantage together do not fully explain the divergence.
Although one should not overemphasise the precision of the estimates arising from this type of simulation exercise, the results do suggest that both educational disadvantage and discrimination are both playing important roles in determining the wage gap. Moreover, given that the overall marginal gains from education are much lower for Roma than for majority males suggest that lower participation in education by Roma may, at least in part, depend on rational economic calculation, rather than simply being the result of differing ‘cultural’ values and attachments alluded to in many of the political discussions of this issue.

14
4. Conclusions
In this paper I have examined the situation of the Roma in the labour market in South Eastern Europe. In doing so I have sought to evaluate typical explanations of why the Roma have occupied such a disadvantaged position in these countries since the transition to the market. In particular, the main focus of the paper is on the effects of education on the labour market experiences of Roma compared to majority populations. Several interesting points emerge.
Once one controls for the endogeneity of education in the determination of employment, there is a substantial difference in the employment returns to education between Roma and non-Roma. The wage returns to education, controlling for sample selection and endogeneity of schooling, are broadly similar in percentage terms for Roma and non-Roma. Once one takes into account the poorer employment prospects and lower base wages, however, the marginal absolute wage gain from an additional year of education for Roma is only a little over one third of the analogous wage gain for majority populations. The results also support the idea of significant discrimination in both employment and wages. For Roma males, well over one-third of the employment differential is attributable to discrimination whilst for wages, discrimination accounts for around one quarter of the wage gap. For females, discrimination (based on ethnicity) appears to account for a smaller proportion of the gap – around one quarter of the difference in the employment probability and one fifth of the wage gap. Moreover, given that the absolute wage gains from education are so much lower, the decision to participate less in education may, at least in part, be attributed to rational economic calculus rather than the somewhat vague and often pejorative ‘cultural’ explanations of low educational participation amongst Roma.
In terms of the policy implications, the results clearly suggest action to raise educational levels of Roma in coincidence with measures to combat discrimination. The specific policy provisions to adopt goes beyond what can be concluded on the basis of the analysis presented here. For example, one possible way of promoting educational participation is through the provision of Conditional Cash Transfers (CCTs), although such transfers should probably be based on income or area of residence rather than ethnicity in order to avoid the risk of creating or worsening tensions between Roma and non-Roma communities. However, any measures designed to increase the educational participation of Roma would need to come to terms with the fraught issue of de facto educational segregation mentioned briefly in the first section of this article. What I hope does emerge clearly from this analysis is the need to address both issues concurrently. So long as there is significant discrimination against Roma in terms of wage and employment prospects so that the expected gains from educational participation are smaller for Roma, unilateral action on the educational front is unlikely to meet with much success.

15
References:
Bauer, T. K., and Sinning, M. (2008), “An extension of the Blinder-Oaxaca decomposition to nonlinear models,” Advances in Statistical Analysis Vol. 92, pp. 197-206.
Blinder, A. S. (1973), "Wage Discrimination: Reduced Form and Structural Variables." Journal of Human Resources, vol. 8, pp. 436-455.
Card, D. (1999), “The Causal Effect of Education on Earnings,” Aschenfelter, O. & D. Card (ed.s) Handbook of Labor Economics, Vol. 3C, pp. 1801-63.
Daymont, T. N. and Andrisani, P.J. (1984), “Job preferences, college major, and the gender gap in earnings,” Journal of Human Resources, vol. 19, pp. 408-428.
Harmon, C., Oosterbeek, H. and Walker, I. (2003), “The Returns to Education: Microeconomics”, Journal of Economic Surveys, vol. 17, pp. 115-155.
Jaumotte, F. (2003), “Female Labour Force Participation: Past Trends and Main determinants in OECD Countries,” Economics Department Working Papers no. 376, OECD, Paris.
Ivanov, A., Collins, M., Grosu, C., Kling, J., Milcher, S., O’Higgins, N., Slay, B. and Zhelyazkova, A. (2006), At Risk: Roma and the Displaced in Southeast Europe: Dimensions of Vulnerability, UNDP, Bratislava.
Oaxaca, R. (1973), "Male-Female Wage Differentials in Urban Labor Markets," International Economic Review, vol. 14, pp. 693-709.
Psacharopoulos, G. (1994), “Returns to Investment in Education: a Global Update,” World Development vol. 22, pp. 1325-1343.
Psacharopoulos, G. and H.A. Patrinos (2004), “Returns to Investment in Education: A further Update”, Education Economics, vol. 12, pp. 111-134.
Ringold, D., Orenstein, M. A. And Wilkens, E. (2005), Roma in an Expanding Europe: Breaking the Poverty Cycle, World Bank, Washington D.C..
Roodman, D. (2009), “Estimating fully observed recursive mixed-process models with cmp,” Working Paper no. 168, Center for Global Development, Washington, D.C.
UNDP (2002), Avoiding the Dependency Trap: The Roma in Central and Eastern Europe, UNDP, Bratislava.

16
Table 1: UNDP Roma Survey – Overall Sample Size by Territory and Ethnic Origin
Majority Roma Total Country: Albania 1,876 2,479 4,355 Bosnia & Herzegovina 1,240 1,941 3,181 Bulgaria 1,302 2,176 3,478 Croatia 715 1,252 1,967 Kosovo 2,275 2,223 4,498 Macedonia 1,399 1,836 3,235 Montenegro 700 699 1,399 Romania 1,771 2,905 4,676 Serbia 1,270 1,759 3,029
Total 12,548 17,270 29,818

17
Table 2: Descriptive Statistics for variables used in the analysis
Majority Roma Males Females Males Females n=2942 n=3068 n=3177 n=3166
Years of Schooling 11.68 10.72 6.21 4.73 (2.92) (3.44) (3.61) (3.57)
Mean Years of Schooling 10.53 11.03 4.91 5.73 - other adult family members (3.20) (3.17) (3.27) (3.37) Employed 0.74 0.44 0.60 0.25 Age 43.54 42.72 40.60 40.10
(11.06) (10.99) (10.79) (10.74) Potential Experience 26.86 27.00 29.38 30.37
(11.73) (12.30) (11.70) (12.00) Head of Household 0.67 0.12 0.66 0.10 Married 0.84 0.84 0.86 0.83 No. Of Household members 4.59 4.58 5.95 5.82
(2.49) (2.61) (2.92) (2.83) Home Owned by Family 0.92 0.92 0.83 0.83 No. Of "Facilities" in Home 5.76 5.78 4.00 3.94 (1.17) (1.13) (1.93) (1.93) Capital City 0.17 0.18 0.14 0.13 City 0.34 0.35 0.37 0.38 Town 0.18 0.17 0.17 0.17 Village or Unregulated Area 0.31 0.30 0.32 0.32 "Majority" Neighbour hood 0.61 0.62 0.12 0.12 Ethnically Mixed Neighbourhood 0.32 0.31 0.32 0.33 "Roma" Neighbourhood 0.07 0.07 0.56 0.56 "Majority" City/Town/Village 0.64 0.65 0.55 0.55 Ethnically Mixed Town City/Town/Village 0.30 0.29 0.35 0.35 "Roma" City/Town/Village 0.06 0.06 0.10 0.10
(n=1361) (n=830) (n=789) (n=252) Monthly Wage (€) 251.58 230.68 124.01 97.63
(192.97) (154.77) (120.07) (123.11) Note: for continuous variables, standard errors are given in parenthesis.

18
Table 3: OLS estimation of years of schooling, adults (25-64).
Majority Males Majority Females Roma Males Roma Females
Coef. std err Coef. std err Coef. std err Coef. std err
Country Bulgaria -0.484** 0.22 0.955*** 0.22 1.850*** 0.23 1.749*** 0.22 Bosnia & Herzogovina 0.137 0.22 -0.197 0.23 0.030 0.26 -0.923*** 0.26 Croatia 0.457* 0.25 1.195*** 0.26 1.333*** 0.32 1.439*** 0.32 Macedonia -0.896*** 0.19 -0.447** 0.20 1.957*** 0.24 0.994*** 0.24 Serbia 0.044 0.20 0.853*** 0.21 1.601*** 0.24 1.004*** 0.24 Montenegro 0.316 0.27 0.714** 0.27 -0.881** 0.39 -0.743** 0.38 Romania 0.295 0.24 1.173*** 0.25 1.573*** 0.24 1.433*** 0.24 Kosovo -0.041 0.20 -1.588*** 0.21 1.171*** 0.24 -0.390* 0.23 Personal Characteristics Age 0.232*** 0.04 0.152*** 0.04 0.252*** 0.04 0.110** 0.04 Age-Squared /100 -0.304*** 0.04 -0.289*** 0.04 -0.344*** 0.05 -0.220*** 0.05 Permanent income No. Of HH members -0.160*** 0.02 -0.166*** 0.02 -0.121*** 0.02 -0.146*** 0.02 Home Owned by Family 0.331* 0.18 0.188 0.19 0.684*** 0.16 0.636*** 0.16 No. Of "Facilities" in home 0.460*** 0.05 0.520*** 0.05 0.489*** 0.03 0.486*** 0.03 Characteristics of area City -0.624*** 0.15 -0.710*** 0.16 -0.619*** 0.19 -0.283 0.19 Town -1.367*** 0.18 -1.451*** 0.19 -0.365 0.23 -0.147 0.23 Village or Unregulated Area -1.928*** 0.16 -2.481*** 0.17 -0.423* 0.22 -0.075 0.22 Ethnically Mixed Neighbourhood 0.319 0.20 0.468** 0.20 0.247 0.22 -0.098 0.21 "Roma" Neighbourhood 0.308 0.29 0.486 0.30 -0.582*** 0.20 -0.771*** 0.19 Ethnically Mixed City/Town/Village -0.192 0.20 -0.552** 0.21 -0.468*** 0.18 -0.527*** 0.17 "Roma" City/Town/Village -0.669** 0.28 -1.620*** 0.30 -0.449* 0.24 -0.438* 0.24 Intercept 6.555*** 0.89 8.614*** 0.90 0.057 0.98 2.723*** 0.94 Adjusted R2 0.17 0.33 0.20 0.22
N 2942 3068 3177 3166
Note: Statistical significance indicated by: *** = p < .01; ** = .01 < p < .05; and * = .05 < p < .10. The omitted categories of categorical variables are Albania, Capital City, ‘Majority’ neighbourhood and ‘majority’ City/Town/Village respectively.

19
Table 4: Probit model of employment determinants, adults (25-64).
Majority Males Majority Females Roma Males Roma Females Coef. std err Coef. std err Coef. std err Coef. std err
Country Bulgaria -0.505*** 0.13 0.167 0.11 -0.583*** 0.09 -0.188** 0.09 Bosnia & Herzogovina -0.513*** 0.13 -0.080 0.11 -0.092 0.11 -0.267** 0.11 Croatia -0.336** 0.15 -0.017 0.12 -0.711*** 0.13 -0.617*** 0.14 Macedonia -0.716*** 0.11 -0.594*** 0.10 -0.874*** 0.10 -0.772*** 0.11 Serbia -0.382*** 0.12 0.029 0.10 -0.173* 0.10 -0.451*** 0.10 Montenegro -0.546*** 0.15 -0.314** 0.13 -0.396** 0.15 -0.619*** 0.17 Romania -0.690*** 0.14 0.142 0.12 -0.240** 0.10 -0.038 0.10 Kosovo -0.940*** 0.11 -1.226*** 0.11 -0.946*** 0.10 -1.308*** 0.13 Education Years of Schooling 0.043*** 0.01 0.134*** 0.01 0.018** 0.01 0.034*** 0.01 Personal Characteristics Potential Experience 0.029** 0.01 0.058*** 0.01 0.030*** 0.01 0.040*** 0.01 Potential Experience Squared/100 -0.110*** 0.02 -0.133*** 0.02 -0.078*** 0.02 -0.070*** 0.02 Head of Household 0.445*** 0.07 0.123 0.08 0.453*** 0.06 0.322*** 0.09 Married 0.422*** 0.08 -0.078 0.07 0.377*** 0.07 0.159** 0.07 Characteristics of area City 0.112 0.08 -0.059 0.08 0.007 0.08 -0.299*** 0.09 Town 0.034 0.10 -0.021 0.09 0.078 0.09 -0.161 0.10 Village or Unregulated Area 0.266*** 0.09 -0.131 0.09 0.207** 0.09 -0.088 0.09 Ethnically Mixed Neighbourhood 0.102 0.11 0.085 0.10 0.148* 0.09 0.006 0.10 "Roma" Neighbourhood 0.125 0.15 0.179 0.15 0.045 0.08 -0.119 0.09 Ethnically Mixed Town City/Town/Village -0.121 0.11 -0.154 0.10 -0.190*** 0.07 -0.127* 0.08 "Roma" City/Town/Village -0.253* 0.15 -0.251 0.15 -0.284*** 0.10 -0.376*** 0.11 Intercept 0.173 0.22 -1.688*** 0.21 -0.225 0.20 -0.843*** 0.23 Log-Likelihood -1433.8 -1640.4 -1941.3 -1626.3 Pseudo-R2 0.15 0.22 0.09 0.08 n 2942 3068 3177 3166
Note: Statistical significance indicated by: *** = p < .01; ** = .01 < p < .05; and * = .05 < p < .10. The omitted categories of categorical variables are Albania, Capital City, ‘Majority’ neighbourhood and ‘majority’ City/Town/Village respectively.

20
Table 5: Probit model of employment determinants controlling for endogenous educational participation, adults (25-64).
Majority Males Majority Females Roma Males Roma Females Coef. std err Coef. std err Coef. std err Coef. std err
Country Bulgaria -0.486*** 0.13 0.120 0.11 -0.627*** 0.10 -0.144 0.10 Bosnia & Herzogovina -0.523*** 0.13 -0.080 0.11 -0.108 0.11 -0.272** 0.11 Croatia -0.372** 0.15 -0.068 0.13 -0.742*** 0.13 -0.577*** 0.15 Macedonia -0.676*** 0.11 -0.577*** 0.10 -0.932*** 0.10 -0.728*** 0.11 Serbia -0.390*** 0.12 -0.009 0.10 -0.224** 0.10 -0.411*** 0.11 Montenegro -0.556*** 0.15 -0.337** 0.13 -0.378** 0.15 -0.632*** 0.17 Romania -0.683*** 0.13 0.113 0.12 -0.272** 0.10 -0.010 0.10 Kosovo -0.907*** 0.11 -1.134*** 0.12 -0.974*** 0.10 -1.303*** 0.13 Education Years of Schooling 0.097*** 0.02 0.177*** 0.02 0.040*** 0.01 0.012 0.02 Personal Characteristics Potential Experience 0.026** 0.01 0.057*** 0.01 0.034*** 0.01 0.033*** 0.01 Potential Experience Squared/100 -0.095*** 0.02 -0.121*** 0.02 -0.080*** 0.02 -0.065*** 0.02 Head of Household 0.404*** 0.07 0.102 0.08 0.431*** 0.06 0.325*** 0.09 Married 0.386*** 0.08 -0.084 0.07 0.356*** 0.07 0.172** 0.07 Characteristics of area City 0.145* 0.08 -0.033 0.08 0.014 0.08 -0.298*** 0.09 Town 0.101 0.10 0.032 0.10 0.085 0.09 -0.161 0.10 Village or Unregulated Area 0.377*** 0.10 -0.024 0.10 0.218** 0.09 -0.092 0.09 Ethnically Mixed Neighbourhood 0.080 0.11 0.069 0.10 0.145* 0.09 -0.002 0.10 "Roma" Neighbourhood 0.098 0.15 0.149 0.15 0.059 0.08 -0.140 0.09 Ethnically Mixed Town City/Town/Village -0.103 0.11 -0.132 0.10 -0.180** 0.07 -0.135* 0.08 "Roma" City/Town/Village -0.200 0.15 -0.170 0.16 -0.274 0.10 -0.383*** 0.11 Intercept -0.532 0.34 -2.273*** 0.33 -0.425* 0.23 -0.610** 0.27 Rho -0.153*** 0.06 -0.126** 0.06 -0.079* 0.04 0.079 0.05
Log-Likelihood -7952.9 -8460.0 -9478.7 -9038.0 n 2942 3068 3177 3166
Note: Statistical significance indicated by: *** = p < .01; ** = .01 < p < .05; and * = .05 < p < .10. The omitted categories of categorical variables are Albania, Capital City, ‘Majority’ neighbourhood and ‘majority’ City/Town/Village respectively. The reported Log-likelihoods are for the full two equation model.

21
Table 6: Decomposition of employment probability difference between Roma and majority
Males Females
% points % % points %
Differences due to:
Endowments 4 28 3 16
Coefficients 6 38 5 23
Interaction 5 34 12 62
Total Difference 15 100 20 100
Note: the table applies the decomposition proposed by Bauer & Sinning (2008) to the probit model of employment. The decomposition technique is applied using the majority coefficient vector as the base.

22
Table 7: OLS estimates of (log.) wage equations, adult employees (25-64)
Majority Males Majority Females Roma Males Roma Females Coef. std err Coef. std err Coef. std err Coef. std err
Country Bulgaria -0.466*** 0.06 -0.223*** 0.06 -0.086 0.08 0.215 0.14 Bosnia & Herzogovina 0.197*** 0.06 0.411*** 0.06 0.427*** 0.11 0.140 0.22 Croatia 0.899*** 0.06 1.223*** 0.06 1.449*** 0.13 1.280*** 0.23 Macedonia -0.211*** 0.06 0.059 0.06 -0.035 0.10 0.142 0.17 Serbia -0.120** 0.05 0.155*** 0.05 0.150* 0.09 0.074 0.17 Montenegro 0.155** 0.07 0.434*** 0.07 0.746*** 0.14 0.434 0.64 Romania -0.237*** 0.08 0.341*** 0.12 -0.002 0.09 -0.102 0.19 Kosovo 0.044 0.06 0.358*** 0.09 0.352*** 0.09 0.360* 0.21 Education Years of Schooling 0.054*** 0.01 0.073*** 0.01 0.062*** 0.01 0.074*** 0.01 Personal Characteristics Potential Experience 0.017*** 0.01 0.007 0.01 0.034*** 0.01 0.025 0.02 Potential Experience Squared/100 -0.032** 0.01 -0.009 0.01 -0.041** 0.02 -0.027 0.03 Characteristics of area City -0.048 0.04 -0.114*** 0.04 -0.108 0.07 -0.170 0.13 Town -0.172*** 0.05 -0.195*** 0.05 -0.369*** 0.08 -0.437*** 0.15 Village or Unregulated Area -0.184*** 0.05 -0.124** 0.06 -0.215*** 0.08 -0.390** 0.16 Ethnically Mixed Neighbourhood 0.077 0.06 -0.033 0.06 -0.002 0.08 -0.060 0.13 "Roma" Neighbourhood -0.115 0.10 -0.059 0.10 -0.030 0.07 -0.212* 0.12 Ethnically Mixed Town City/Town/Village 0.014 0.06 0.096 0.06 0.007 0.06 -0.020 0.12 "Roma" City/Town/Village -0.095 0.10 -0.232* 0.12 -0.024 0.09 0.066 0.19 Intercept 4.522*** 0.12 3.939*** 0.13 3.546*** 0.19 3.540*** 0.36
Adjusted R2 0.35 0.52 0.34 0.35 n 1361 830 789 252
Note: Statistical significance indicated by: *** = p < .01; ** = .01 < p < .05; and * = .05 < p < .10. The omitted categories of categorical variables are Albania, Capital City, ‘Majority’ neighbourhood and ‘majority’ City/Town/Village respectively.

23
Table 8: Maximum Likelihood estimation of (log.) wage equations controlling for endogenous educational participsation and sample selection bias, adult employees (25-64)
Majority Males Majority Females Roma Males Roma Females Coef. std err Coef. std err Coef. std err Coef. std err
Country Bulgaria -0.409*** 0.07 -0.316*** 0.07 0.548*** 0.11 -0.150 0.14 Bosnia & Herzogovina 0.227*** 0.07 0.451*** 0.07 0.573*** 0.13 0.220 0.21 Croatia 0.917*** 0.09 1.150*** 0.08 1.818*** 0.16 1.201*** 0.23 Macedonia -0.109 0.07 0.228*** 0.07 0.665*** 0.12 -0.061 0.17 Serbia -0.089 0.07 0.106* 0.06 0.460*** 0.12 -0.108 0.16 Montenegro 0.202** 0.09 0.486*** 0.08 1.112*** 0.19 0.734 0.60 Romania -0.196** 0.08 0.293** 0.15 0.285** 0.12 -0.238 0.19 Kosovo 0.169** 0.08 0.817*** 0.09 1.180*** 0.12 0.431** 0.20 Education Years of Schooling 0.084*** 0.01 0.080*** 0.02 0.085*** 0.01 0.151*** 0.01 Personal Characteristics Potential Experience 0.004 0.01 -0.007 0.01 0.026** 0.01 0.031 0.02 Potential Experience Squared/100 0.002 0.01 0.035** 0.02 -0.011 0.02 -0.014 0.03 Characteristics of area City -0.042 0.05 -0.065 0.05 -0.147 0.09 -0.083 0.13 Town -0.139** 0.06 -0.131** 0.06 -0.506*** 0.11 -0.386** 0.15 Village or Unregulated Area -0.153** 0.06 0.026 0.08 -0.355*** 0.10 -0.351** 0.16 Ethnically Mixed Neighbourhood 0.061 0.06 -0.056 0.06 0.015 0.10 -0.002 0.13 "Roma" Neighbourhood -0.138 0.10 -0.171 0.11 0.021 0.09 -0.008 0.12 Ethnically Mixed Town City/Town/Village 0.030 0.06 0.132** 0.06 0.048 0.08 0.070 0.12 "Roma" City/Town/Village -0.040 0.11 -0.086 0.13 0.133 0.11 0.160 0.19 Intercept 4.256*** 0.24 4.149*** 0.26 2.872*** 0.23 3.559*** 0.35
Log-Likelihood -10301.6 -9607.0 -11321.6 -9662.3 n 1361 830 789 252
Note: Statistical significance indicated by: *** = p < .01; ** = .01 < p < .05; and * = .05 < p < .10. The omitted categories of categorical variables are Albania, Capital City, ‘Majority’ neighbourhood and ‘majority’ City/Town/Village respectively. The reported Log-likelihoods are for the full four equation model.

24
Table 9: Decomposition of wage difference between Roma and majority
Males Females
Roma Wage (€/month) 95.25 69.93
Majority Wage (€/month) 203.88 166.10
Estimated difference 109.07 96.17
% of difference due to:
Endowments 60.6% 86.7%
Coefficients 25.9% 19.2%
Interaction 13.6% -5.8%
Table 10: Simulated effects on male expected wages of increasing education and removing discrimination
Majority Males Roma Males
Median Monthly Wage (A) €200 €97
Mean Employment Probability (B) .740 .597
E(Wage): (A) * (B) €148 €58
Change in E(Wage) from one extra year of education
+€19 +€7
Change in E(Wage) from raising Roma education to 12 years
-
+€49
Change in E(Wage) from removing discrimination - +€27
Note: the table reports the effects of applying formula of the form of equation (7) to sample data using the estimates reported in tables 5 and 8. The estimate regarding discrimination is based on reported values form tables 6 and 9.

25
Figure 1: Unemployment rates by gender, Roma and Majority adults aged 15-64.
Source: Author calculations, UNDP Roma survey.
Figure 2: Share of informal sector employment in total employment, Roma and Majority adults aged 15-64.
Source: Author calculations, UNDP Roma survey.
0
10
20
30
40
50
60
70
80
90
100
Albania Bosnia &Herzogovina
Bulgaria Croatia Kosovo Macedonia Montenegro Romania Serbia
Majority Males Majority Females Roma Males Roma Females
0
10
20
30
40
50
60
70
80
Albania Bulgaria Bosnia &Herzogovina
Croatia Macedonia Serbia Montenegro Romania Kosovo
Majority Roma

26
Figure 3: Median monthly wages by gender, Roma and Majority adults aged 15-64 (Majority Males =100).
Source: Author calculations, UNDP Roma survey.
Figure 4: Education levels, Roma and Majority adults aged 15-64 (Majority Males =100).
Source: Author calculations, UNDP Roma survey.
0
10
20
30
40
50
60
70
80
90
100
Albania Bulgaria Bosnia &Herzogovina
Croatia Macedonia Serbia Montenegro Romania Kosovo
Majority Males Majority Females Roma Males Roma Females
0
10
20
30
40
50
60
70
Incomplete Primary and less Primary or IncompleteSecondary
Secondary Tertiary
Majority Roma

27
Figure 5: Unemployment Rates by Education, Roma and Majority adults aged 15-64.
Source: Author calculations, UNDP Roma survey.
Figure 6: Median monthly wages by Education, Roma and Majority adults aged 15-64
Source: Author calculations, UNDP Roma survey.
0
10
20
30
40
50
60
70
80
90
Incomplete Primary andless
Primary or IncompleteSecondary
Secondary Tertiary
Majority Roma
0.00
50.00
100.00
150.00
200.00
250.00
Incomplete Primary andless
Primary or IncompleteSecondary
Secondary Tertiary
Euro
per
mon
th
.
Majority Roma