issdiwali sharekhan kar! - moneyexcel.com · 2019-07-28 · issdiwali sharekhan kar! dearinvestors,...
TRANSCRIPT


Iss Diwali Sharekhan Kar!Iss Diwali Sharekhan Kar!Dear Investors,Samvat 2074 has not been very kind for investorsSamvat 2074 has not been very kind for investors.Though the Sensex and Nifty have held out against macroeconomic headwinds, the damage has been quite severe in broader markets. Unfortunately, caution was thrown tothe winds as most investors increased exposure to low‐quality momentum stocks during the massive rally in 2017.Quality matters! Sharekhan’s Diwali Picks for Samvat 2074 has done better than the benchmark indices, clocking returns of 4% as compared to 3% return in Nifty andhandsomely outperformed the CNX midcaps index, which was down by 11% during the same period. More importantly, none of our picks have seen a drawdown of morethan 15%, even after the steep sell‐off in the past couple of months.Markets are all about learning from past mistakes. If greed had clouded reasoning last year, fear is the overpowering emotion right now. Post a sharp correction, stockmarket valuations have turned reasonable and earnings are set to grow at healthy rate over the next couple of years.Stick to basics Invest in quality companies with a healthy growth outlook and reasonable valuations Moreover building a portfolio is all about understanding theStick to basics. Invest in quality companies with a healthy growth outlook and reasonable valuations. Moreover, building a portfolio is all about understanding themacroeconomic conditions. Accordingly, these are reflected in our sector‐wise allocations.For Samvat 2075, we have hand‐picked 12 quality stocks portfolio, which are mix of both large caps and midcaps quality names.
Diwali Picks 2017: Smart Outperformance in Samvat 2074
6 0 4.03.0
0.02.04.06.0
%)
‐8.0‐6.0‐4.0‐2.0
Return (%
We wish you a Happy Diwali and a Prosperous New Year!
‐11.0‐12.0‐10.0
Diwali Pick Nifty CNX Midcap
We wish you a Happy Diwali and a Prosperous New Year!
Regards,
Sharekhan Research

Diwali 2017 Picks: Smart OutperformanceDiwali 2017 Picks: Smart OutperformanceCompany name Reco* (Rs.) CMP# (Rs.) Return (%)A robindo Pharma 744 1 747 6 0 5Aurobindo Pharma 744.1 747.6 0.5Bajaj Finserv 5,305.0 5,415.0 2.1Bata India 739 5 895 3 21 2Bata India 739.5 895.3 21.2IndusInd Bank 1,689.0 1,576.5 ‐6.6KNR Constructions 209 0 185 2 11 4KNR Constructions 209.0 185.2 ‐11.4Mahindra &Mahindra 651.0 741.5 14.0RBL Bank 516 0 505 0 ‐2 0RBL Bank 516.0 505.0 ‐2.0TV Today Network 360.0 386.3 7.5V‐Guard Industries 190 4 174 2 ‐8 5V Guard Industries 190.4 174.2 8.5Sundram Fasteners 452.0 534.7 18.3
Sharekhan Diwali Picks 4.0Nifty return 9 979 7 10 303 6 3 0Nifty return 9,979.7 10,303.6 3.0CNX Midcap 18,528.2 16,515.0 ‐11.0
• Reco price as on October 06,2017# CMP as on October 19, 2018


Sharekhan Diwali Picks 2018 (Samvat 2075)Sharekhan Diwali Picks 2018 (Samvat 2075)
Company CMP (Rs.)EPS (Rs.) PER /PBV (x) RoE (%)
FY19E FY20E FY19E FY20E FY19E FY20EFY19E FY20E FY19E FY20E FY19E FY20EAarti Industries 1249 53.1 74.8 23.5 16.7 24.1 26.4Arvind Limited 322 23.7 33.2 13.6 9.7 15.1 18.2Britannia Industries 5557 104.3 129.2 53.3 43.0 32.8 32.4Divi’s Laboratories 1289 46.0 58.8 28.0 21.9 21.3 22.9ICICI Bank 315 173 9 188 1 1 8 1 7 6 9 11 5315 173.9 188.1 1.8 1.7 6.9 11.5IndusInd Bank 1577 460.8 546.4 3.4 2.9 17.3 18.9Infosys Limited 683 36 8 42 5 18 5 16 1 26 0 31 4Infosys Limited 683 36.8 42.5 18.5 16.1 26.0 31.4Jubilant FoodWorks 1269 22.4 27.7 56.8 45.9 25.3 25.2Larsen & Toubro 1208 65.1 71.7 18.6 16.9 15.5 15.2L&T Infotech 1740 83.6 94.1 20.8 18.5 33.3 30.6Reliance Industries 1102 71.9 83.7 15.3 13.2 12.3 12.7Sundram Fasteners 535 22 3 27 3 24 0 19 6 25 7 26 2Sundram Fasteners 535 22.3 27.3 24.0 19.6 25.7 26.2* PBV multiples are for banks# CMP as on October 19, 2018

Aarti Industries (Aarti) CMP R 1 249Aarti Industries (Aarti) CMP: Rs 1,249
Sector: Specialty Chemicals
Market cap Rs 10 154 crore
Incorporated in 1984, Aarti Industries is a leading Indian manufacturer of speciality chemicals andpharmaceuticals with a global footprint. It maintains leadership position in its key products and is rankedb t 1 t t 4th iti f 75% f it i lit h i l d t tf liMarket cap Rs. 10,154 crore
52‐week high/low: Rs. 1,435/851
between 1st to 4th position for 75% of its speciality chemical product portfolio.
During FY2018‐21E, growth prospects are strong, as the company plans to expand across the benzene valuechain and has also diversified into the toluene value chain. Concerns over specialty chemical supplies from
NSE volume (No of shares): 0.3 lakh
BSE code: 524208
China will help Indian companies, including Aarti Industries, increase its market share in world trade.
Aarti has won multi year large orders worth Rs 4,000 crore for 10 years and Rs 10,000 crore for 20 years fromtwo global clients These orders indicate growing confidence in the company and can drive up its revenue inBSE code: 524208
NSE code: AARTIIND
two global clients. These orders indicate growing confidence in the company and can drive up its revenue inthe long term.
Between FY2018 and FY2021E, the company has planned capex of Rs. 2,100 crore to expand capacity,i l di f iliti t t th t l dPromoter’s Share (%) 53.1 including facilities to execute the two large orders.
Key risks: Delay in commissioning the above two facilities might affect business performance andprofitability.Valuation summary
Particulars FY2017 FY2018 FY2019E FY2020ENet sales (Rs cr) 3,163 3,806 4,641 5,784
y
EBIDTA margin (%) 20.7 18.4 18.5 18.9Net profit (Rs cr) 316 333 432 608EPS (Rs ) 38 5 41 0 53 1 74 8EPS (Rs.) 38.5 41.0 53.1 74.8PER 32.4 30.5 23.5 16.7EV/EBITDA 17.8 17.2 14.4 11.3RoCE (%) 19.1 16.6 16.8 18.6RoE (%) 25.3 22.6 24.1 26.4

Arvind Limited CMP R 322Arvind Limited CMP: Rs. 322
Sector: Consumer Discretionary
Market cap Rs 8 331 crore
Arvind Ltd has transformed itself from a pure textile manufacturer into the largest branded retail player, witha portfolio of top global brands across all market and price segments.
The management proposes to demerge its branded and retail apparel and engineering businesses as bothMarket cap Rs. 8,331 crore
52‐week high/low: Rs. 478/289
The management proposes to demerge its branded and retail apparel and engineering businesses as bothhave matured enough to enhance growth prospects in the coming years. Moreover, listing these businessesas separate entities will help boost the value of these businesses.
NSE volume (No of shares): 18.72 lakh
BSE code: 500101
After the demerger, the company plans to invest Rs. 1,500 crore in garments, knitted fabrics and technicaltextiles. Margins of the branded & retail business are likely to improve with consistent growth in powerbrands, emerging brands turning profitable and operating leverage in Unlimited Fashion.
BSE code: 500101
NSE code: ARVIND From FY2017 to FY2020, we expect the company’s revenue and profit after tax to report CAGRs of 17% and
36%, respectively.
Key risks A rise in cotton prices changes in government policies and weak demand environmentPromoter’s Share (%) 43.0 Key risks: A rise in cotton prices, changes in government policies and weak demand environment.
Valuation summary
Particulars FY2017 FY2018 FY2019E FY2020ENet sales (Rs cr) 9,236.6 10,826.1 12,725.2 14,829.7
y
EBIDTA margin (%) 10.1 8.9 10.5 11.1Net profit (Rs cr) 334.3 338.5 613.1 856.9EPS (Rs ) 12 9 13 1 23 7 33 2EPS (Rs.) 12.9 13.1 23.7 33.2PER 25.0 24.6 13.6 9.7EV/EBITDA 11.3 11.6 8.4 6.7RoCE (%) 7.2 6.2 9.2 11.1RoE (%) 10.8 9.2 15.1 18.2

Britannia Industries CMP R 5 557Britannia Industries CMP: Rs. 5,557
Sector: FMCG
Market cap Rs 66 777 crore
Britannia is one of the largest biscuit & snack manufacturers in the domestic market. It is the largest biscuitmaker in India, ahead of Parle, with a turnover of close to Rs. 10,000 crore
We expect domestic sales volumes to keep growing at 10 12% as strong growth in regional markets alongMarket cap Rs 66,777 crore
52‐week high/low: Rs. 6,944/4,400
We expect domestic sales volumes to keep growing at 10‐12%, as strong growth in regional markets alongwith better demand in the urban market will drive sales. Sustained focus on innovation and distributionexpansion in core categories is expected to drive the near‐term performance.
NSE volume (No of shares): 1.41 lakh
BSE code: 500825
In the coming years, the company can achieve double digit earnings growth by launching products with highgross margins, growing in adjacent product categories such as cakes and rusk and driving up margins throughoperating efficiencies and improving profitability in the cheese segment.
BSE code: 500825
NSE code: BRITANNIA Key risks: A rise in raw material prices and weak environment.
Promoter’s Share (%) 51.0
Valuation summary
Particulars FY2017 FY2018 FY2019E FY2020ENet sales (Rs cr) 9,054.1 9,914.0 11,240.7 12,766..0
y
EBIDTA margin (%) 14.1 15.1 16.2 17.2Net profit (Rs cr) 884.5 1,002.2 1,251.5 1,551.3EPS (Rs ) 73 7 83 5 104 3 129 2EPS (Rs.) 73.7 83.5 104.3 129.2PER 75.4 66.6 53.3 43.0EV/EBITDA 52.2 44.4 36.4 29.9RoCE (%) 69.3 52.0 47.4 47.4RoE (%) 36.9 32.9 32.8 32.4
Divi’s Laboratories (Divi’s) CMP R 1 289Divi s Laboratories (Divi s) CMP: Rs. 1,289
Sector: Pharmaceuticals
Market cap Rs 34 212 crore
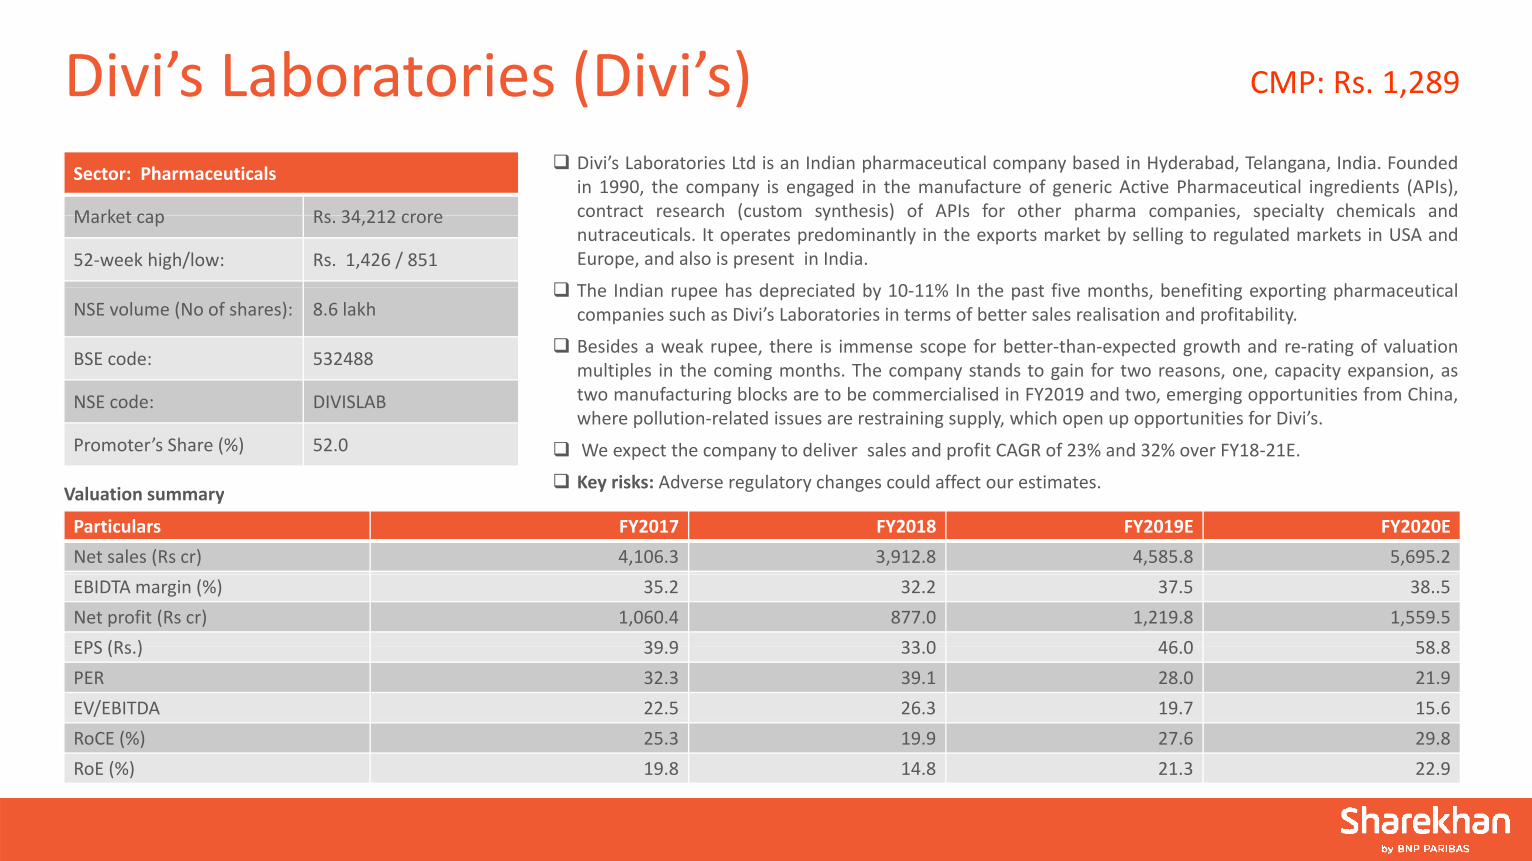
Divi’s Laboratories Ltd is an Indian pharmaceutical company based in Hyderabad, Telangana, India. Foundedin 1990, the company is engaged in the manufacture of generic Active Pharmaceutical ingredients (APIs),contract research (custom synthesis) of APIs for other pharma companies, specialty chemicals andMarket cap Rs. 34,212 crore
52‐week high/low: Rs. 1,426 / 851
contract research (custom synthesis) of APIs for other pharma companies, specialty chemicals andnutraceuticals. It operates predominantly in the exports market by selling to regulated markets in USA andEurope, and also is present in India.
Th I di h d i t d b 10 11% I th t fi th b fiti ti h ti lNSE volume (No of shares): 8.6 lakh
BSE code: 532488
The Indian rupee has depreciated by 10‐11% In the past five months, benefiting exporting pharmaceuticalcompanies such as Divi’s Laboratories in terms of better sales realisation and profitability.
Besides a weak rupee, there is immense scope for better‐than‐expected growth and re‐rating of valuationBSE code: 532488
NSE code: DIVISLAB
multiples in the coming months. The company stands to gain for two reasons, one, capacity expansion, astwo manufacturing blocks are to be commercialised in FY2019 and two, emerging opportunities from China,where pollution‐related issues are restraining supply, which open up opportunities for Divi’s.
Promoter’s Share (%) 52.0 We expect the company to deliver sales and profit CAGR of 23% and 32% over FY18‐21E.
Key risks: Adverse regulatory changes could affect our estimates.Valuation summary
Particulars FY2017 FY2018 FY2019E FY2020ENet sales (Rs cr) 4,106.3 3,912.8 4,585.8 5,695.2
y
EBIDTA margin (%) 35.2 32.2 37.5 38..5Net profit (Rs cr) 1,060.4 877.0 1,219.8 1,559.5EPS (Rs ) 39 9 33 0 46 0 58 8EPS (Rs.) 39.9 33.0 46.0 58.8PER 32.3 39.1 28.0 21.9EV/EBITDA 22.5 26.3 19.7 15.6RoCE (%) 25.3 19.9 27.6 29.8RoE (%) 19.8 14.8 21.3 22.9

ICICI Bank CMP R 315ICICI Bank CMP: Rs. 315
ICICI B k i f I di ’ l t i t t b k d l h b idi i hi h t i fi i lSector: Banks & Finance
Market cap Rs 202 655 crore
ICICI Bank is one of India’s largest private sector banks and also has subsidiaries which operate in financialservices and insurance (BFSI) space.
We believe that non‐performing assets (NPAs) cycle has peaked and though incremental loan slippages areMarket cap Rs. 202,655 crore
52‐week high/low: Rs. 365 / 256
likely to be elevated for medium term, but are expected to trend downwards.
ICICI Bank is well capitalised, with a capital to risk (weighted) assets ratio (CRAR ) of 18.3% and tier‐1 capitalreserve of 15 8% This will enable it to make the most of opportunities in the retail and corporate loan
NSE volume (No of shares): 209.4 lakh
BSE code: 532174
reserve of 15.8%. This will enable it to make the most of opportunities in the retail and corporate loansegment as PSU banks & NBFCs grapple with their own challenges.
ICICI Bank has got a strong liability franchise, where current and savings account (CASA) deposits constitute50 5% f ll d it hi h h l th b k it t f f d d i t t i it t i t tBSE code: 532174
NSE code: ICICIBANK
50.5% of overall deposits, which helps the bank manage its cost of funds and in turn sustain its net interestmargins.
Uncertainty regarding the leadership have been addressed to with the RBI giving approval of thePromoter’s Share (%) ‐ appointment of the new MD & CEO.
Key risks: Higher than anticipated haircuts in large cases at the National Company Law Tribunal (NCLT) couldnear term affect profitsValuation summary
Particulars FY2017 FY2018 FY2019E FY2020ENet Interest Income 21,737.3 23,025.8 26,587.6 32,246.5
near term affect profits.y
Growth % 2.4 5.9 15.5 21.3PAT 9,801.1 6,777.2 7,152.4 12,638.9Growth % 0 8 30 9 5 5 76 7Growth % 0.8 ‐30.9 5.5 76.7EPS 16.8 10.6 12.3 21.7BVPS 164.6 150.9 173.9 188.1P/E (x) 18.7 29.7 25.6 14.5P/BV (x) 1.9 2.1 1.8 1.7

IndusInd Bank CMP R 1 577IndusInd Bank CMP: Rs. 1,577
Sector: Banks & Finance
Market cap Rs 94 816 crore
With superior metrics, IndusInd Bank has been among the best‐performing private sector banks. DuringFY2014‐FY2018, the bank’s advances recorded a 26.7% CAGR, while net profit clocked a CAGR of 27.7% inthe same period. In FY2018, net interest margin stood at a healthy 4.0%.Market cap Rs. 94,816 crore
52‐week high/low: Rs. 2,037 / 1,553
the same period. In FY2018, net interest margin stood at a healthy 4.0%.
Despite the banking sector being marred by non‐performing asset (NPA)‐related issues, IndusInd Bank hasbeen able to maintain good asset quality with a gross NPA ratio of 1.09% as of Q2FY19, which iscommendable
NSE volume (No of shares): 14.3 lakh
BSE code: 532187
commendable.
In the last few quarters, advances have gathered pace. We expect the growth momentum to stay steady,which would aided by a rise in loans for commercial vehicles. The bank is also well‐capitalised to take
BSE code: 532187
NSE code: INDUSINDBK
advantage of opportunities as PSU banks are starved of capital. The merger with Bharat Financial Inclusioncould also give IndusInd Bank access to a new customers and increase cross‐selling opportunities.
We expect margins to normalise as the effect of a rise in lending rates comes in with a lag.Promoter’s Share (%) 16.7
We expect margins to normalise as the effect of a rise in lending rates comes in with a lag.
Key risks: An increase in credit risk that arises from the merger with Bharat Financial Inclusion Ltd.
Valuation summary
Particulars FY2017 FY2018 FY2019E FY2020ENet Interest Income 6,063 7,497 9,898 13,044
y
Growth % 34.2 23.7 32.0 31.8PAT 2,868 3,606 4,474 5,727 Growth % 25 4 25 7 24 1 28 0Growth % 25.4 25.7 24.1 28.0EPS 48.2 60.1 75.2 96.3BVPS 340.6 390.9 460.8 546.4P/E (x) 32.7 26.2 21.0 16.4P/BV (x) 4.6 4.0 3.4 2.9

Infosys Limited CMP R 683Infosys Limited CMP: Rs.683
Sector: Information Technology
Market cap Rs 2 98 186 crore
❑ Infosys is India’s second‐largest IT services company in terms of export revenue, $10,939 million in FY2018.
❑ Infosys focuses on a four‐pronged strategy to navigate clients’ digital journey, as it provides significant roomfor growth given there are opportunities worth $160 200 billion in the agile digital marketMarket cap Rs. 2,98,186 crore
52‐week high/low: Rs. 754/457
for growth, given there are opportunities worth $160‐200 billion in the agile digital market.
❑ The company has stepped up its investments and acquired companies such as Fluido, WongDoody, etc tobuild up its digital capabilities and catch up with large competitors. Rapid revenue growth in the digital
NSE volume (No of shares): 50.9 lakh
BSE code: 500209
business has showed initial signs of progress.
❑With a strong leadership bench, a rise in the value of total contracts signed under the new leadership andbetter business visibility, we expect Infosys to deliver strong revenue growth in FY2020 as compared toBSE code: 500209
NSE code: INFY
better business visibility, we expect Infosys to deliver strong revenue growth in FY2020 as compared toFY2019.
❑ The stock currently trades at 16 times its FY20E earnings, a meaningful discount to TCS. We believe that thevaluation gap would gradually narrow as Infosys catches up with TCS on most parametersPromoter’s Share (%) 12.8 valuation gap would gradually narrow as Infosys catches up with TCS on most parameters.
❑ Key risks: A rise in managerial level exits and a growing protectionism stance in the US.Valuation summary
Particulars FY2017 FY2018 FY2019E FY2020ENet sales (Rs cr) 68,484.0 70,522.0 81,947.8 91,381.6
y
EBIDTA margin (%) 27.2 27.0 26.1 26.5Net profit (Rs cr) 14,357.0 14,597.0 16,005.4 18,478.9EPS (Rs ) 33 0 33 6 36 8 42 5EPS (Rs.) 33.0 33.6 36.8 42.5PER 20.7 20.3 18.5 16.1EV/EBITDA 6.7 6.9 6.3 5.6RoCE (%) 30.5 30.2 35.5 42.0 RoE (%) 22.0 23.9 26.0 31.4

Jubilant FoodWorks (JFL) CMP R 1 269Jubilant FoodWorks (JFL) CMP: Rs. 1,269
Sector: Consumer Discretionary
Market cap Rs 16 748 crore
JFL, India’s largest food service company had shifted its focus to customer satisfaction from store additions toimprove its store fundamentals over the long run, which has fructified in the near term, as desired.
The management is focusing on offering superior value for money products and improve the customerMarket cap Rs. 16,748 crore
52‐week high/low: Rs. 1,575/748
The management is focusing on offering superior, value‐for‐money products and improve the customerexperience. The move to use digitilisation to improve product delivery has also worked well. The company’ssame‐store‐sales growth of 25.9% in Q1FY2019 and 26.5% in Q4FY18 were the highest in last few years andis expected to remain robust going ahead too
NSE volume (No of shares): 12.37 lakh
BSE code: 533155
is expected to remain robust going ahead too.
A sustained focus on efficiencies and a lower losses of Dunkin Donuts is expected to drive up operatingmargin to 16‐17% from 15% in FY2018.
BSE code: 533155
NSE code: JUBLFOOD JFL would be one of the key beneficiaries of improvement in the discretionary environment in the domestic
market.
Key risks: A rise in raw material prices weak demand environment and rising competitionPromoter’s Share (%) 45.0 Key risks: A rise in raw material prices, weak demand environment and rising competition.
Valuation summary
Particulars FY2017 FY2018 FY2019E FY2020ENet sales (Rs cr) 2,546.1 2,980.4 3,531.3 4,017.9
y
EBIDTA margin (%) 9.7 15.0 16.3 17.0Net profit (Rs cr) 75.8 206.4 295.0 365.1EPS (Rs ) 5 7 15 6 22 4 27 7EPS (Rs.) 5.7 15.6 22.4 27.7PER 221.1 81.1 56.8 45.9EV/EBITDA 67.5 36.5 27.7 22.9RoCE (%) 12.3 31.0 36.6 36.7RoE (%) 9.2 21.8 25.3 25.2

Larsen & Toubro (L&T) CMP R 1 208Larsen & Toubro (L&T) CMP: Rs. 1,208
Sector: Capital Goods & Engineering
Market cap Rs 169 409 crore
L&T is the best play on the recovery in the domestic capex cycle. The management is focusing on a multi‐pronged strategy ‐ achieving profitable growth, driving up return on equity (RoE) in the medium term andsuperior capital allocation. This augurs well for the company’s earnings that can clock an 18% CAGR fromMarket cap Rs. 169,409 crore
52‐week high/low: Rs. 1,470/1,124
superior capital allocation. This augurs well for the company s earnings that can clock an 18% CAGR fromFY2018 to FY2020E.
L&T began FY2019 with strong order inflows in the infrastructure, hydrocarbon and heavy engineeringbusinesses that took the total order backlog to Rs 2 7 lakh crore for Q1FY2019 These orders offer revenue
NSE volume (No of shares): 23.6Lakh
BSE code: 500510
businesses that took the total order backlog to Rs. 2.7 lakh crore for Q1FY2019. These orders offer revenuevisibility for 2.2 years on a trailing twelve month (TTM) basis.
The management has retained its forecast of a 10‐12% and 12‐15% rise in order inflow and topline,BSE code: 500510
NSE code: LT
respectively. Consolidated margin is expected to rise by 50 bps. Expectation of a strong earningsperformance is backed by growth in order inflows that is likely to be led by government capex and continuedgrowth momentum in subsidiaries.
Promoter’s Share (%) ‐ Key risks: Slowdown in government and private capex led by macroeconomic issues such as rising interestrates, higher crude oil prices and a liquidity crunch among others.
Valuation summary
Particulars FY2017 FY2018 FY2019E FY2020ENet sales (Rs cr) 109,312 119,683 135,379 148,772
y
EBIDTA margin (%) 10.1 11.3 11.4 11.4 Net profit (Rs cr) 5,920 7,247 9,124 10,053 EPS (Rs ) 42 2 51 7 65 1 71 7EPS (Rs.) 42.2 51.7 65.1 71.7 PER 28.6 23.4 18.6 16.9EV/EBITDA 19.7 16.9 14.5 13.3 RoCE (%) 6.2 7.8 8.4 9.1 RoE (%) 12.8 13.9 15.5 15.2

Larsen & Toubro Infotech (LTI) CMP R 1 740Larsen & Toubro Infotech (LTI) CMP: Rs.1,740
Sector: Information Technology
Market cap Rs 30 116 crore
❑ Set up by L&T in 1996, LTI is India’s sixth‐largest IT services company in terms of revenue, $1,132 million inFY2018. It is also among the top‐20 IT service providers globally.
❑ The company’s prudent strategies and efficient sales force have helped it gain share in large accounts andMarket cap Rs. 30,116 crore
52‐week high/low: Rs. 1,990/790
❑ The company’s prudent strategies and efficient sales force have helped it gain share in large accounts andnew logo wins.
❑ Digital revenue currently contributes 34% of the company’s overall revenue as against 25‐30% for the top
NSE volume (No of shares): 2.7 lakh
BSE code: 540005
four Indian IT companies.
❑ Investments in sales resources, focus on large deal wins and efforts to strengthen ties with top 50 clients areexpected to continue reaping rich dividends for LTI going ahead.BSE code: 540005
NSE code: LTI
expected to continue reaping rich dividends for LTI going ahead.
❑ Over FY2018‐FY2020E, LTI is well placed to deliver industry‐leading revenue and earnings CAGR of 20% and22%, respectively.
Promoter’s Share (%) 75.0 ❑ Key risks: A rising protectionist stance in the US and hostile regulatory developments against current VISAregime.
Valuation summary
Particulars FY2017 FY2018 FY2019E FY2020ENet sales (Rs cr) 6,500.9 7,306.5 9,268.7 10,566.3
y
EBIDTA margin (%) 18.9 17.1 18.5 18.7 Net profit (Rs cr) 970.9 1,112.6 1,464.6 1,649.2 EPS (Rs ) 55 8 63 9 83 6 94 1EPS (Rs.) 55.8 63.9 83.6 94.1 PER 31.2 27.2 20.8 18.5EV/EBITDA 23.4 23.0 16.8 14.6 RoCE (%) 38.2 28.8 35.7 33.8 RoE (%) 37.5 31.8 33.3 30.6

Reliance Industries (RIL) CMP R 1 102Reliance Industries (RIL) CMP: Rs.1,102
RIL i di ifi d l t ith b i i t t i f fi i t h i lSector: Oil & Gas
Market cap Rs 698 278 crore
RIL is a diversified conglomerate with business interests spanning from refineries, petrochemicals,exploration & production, retail and digital services.
We expect refining margins to be robust in H2FY2019E and FY2020E, riding on a gradual ramp‐up of theMarket cap Rs. 698,278 crore
52‐week high/low: Rs. 1,329/862
petcoke gasification project over H2FY2019. Moreover, the relatively better economics of the petcokegasification project, given rising crude oil prices and implementation of the revised International MaritimeOrganization (IMO) regulations from January 2020 to lower sulphur content for marine fuels would further
NSE volume (No of shares): 82 Lakh
BSE code: 500325
drive up gross refining margins.
As the paraxylene and refinery off‐gas cracker (RoGC) projects are commissioned, the company’spetrochemical volumes and profitability are likely to increase significantly during FY2019E‐FY2020EBSE code: 500325
NSE code: RELIANCE
petrochemical volumes and profitability are likely to increase significantly during FY2019E FY2020E.
Financials of the telecom business are likely to improve as we expect Reliance JIO to gain revenue marketshare; margins are likely to widen on account of operating leverage. Moreover, the launch of fixed‐lineb db d i (JIO Gi fib ) ld dd t f th di it l i b i Th t il b iPromoter’s Share (%) 47.4 broadband services (JIO Gigafiber) would add to revenues of the digital services business. The retail businessis also doing well with high double‐digit revenue and EBITDA growth.
Key risks: Lower‐than‐expected refining and petrochemical margins.Valuation summary
Particulars FY2017 FY2018 FY2019E FY2020ENet sales (Rs cr) 305,382 391,677 503,440 529,164
y
EBIDTA margin (%) 15.1 16.4 16.4 17.7Net profit (Rs cr) 29,833 34,993 42,575 49,545EPS (Rs ) 50 4 59 1 71 9 83 7EPS (Rs.) 50.4 59.1 71.9 83.7PER 21.9 18.6 15.3 13.2EV/EBITDA 17.9 12.9 10.1 8.9RoCE (%) 9.3 10.6 11.4 11.7RoE (%) 11.2 11.9 12.3 12.7

Sundram Fasteners (SFL) CMP R 535Sundram Fasteners (SFL) CMP: Rs. 535
Sector: Auto & Ancilliaries
Market cap Rs 11 235 crore
Sundram Fasteners Ltd (SFL) ) is witnessing a healthy traction across geographies. Strong demand tractionfrom the OEM’s and a rise in content per vehicle (on back of technologically advanced and value addedproducts) is likely to drive the domestic operations (65% of sales).Further, capacity expansion in fast‐growingMarket cap Rs. 11,235 crore
52‐week high/low: Rs. 688/470
products) is likely to drive the domestic operations (65% of sales).Further, capacity expansion in fast growinggeographies (SFL recently expanded capacity in China) and a rise in share of business in existing markets suchas North America would drive up exports that account for 35% of sales.
Operating leverage a better product mix as value added products gain share would lead to marginNSE volume (No of shares): 1.08 Lakh
BSE code: 500403
Operating leverage, a better product mix, as value‐added products gain share, would lead to marginexpansion. Further, the company’s subsidiaries have seen their financials improve significantly in FY2018.This trend is likely to sustain, further aiding growth momentum. SFL is poised to clock a strong 22% earningsCAGR over the next two yearsBSE code: 500403
NSE code: SUNDRMFAST
CAGR over the next two years.
SFL is a quality auto‐ancillary stock with return ratios of over 25%. Earnings are poised to outpace growth inthe automotive industry over the medium term. Strong return ratios and robust growth make it an attractive
Promoter’s Share (%) 49.5 investment bet.
Key risks: Slowdown in automobile demand and Adverse currency movementValuation summaryy
Particulars FY2017 FY2018 FY2019E FY2020E Net sales (Rs cr) 3,302.9 3,831.2 4,553.1 5,381.4( ) , , , ,EBIDTA margin (%) 17.8 17.8 18.2 18.6Net profit (Rs cr) 340.7 386.6 469.3 572.7EPS (Rs ) 16 2 18 4 22 3 27 3EPS (Rs.) 16.2 18.4 22.3 27.3PER 33.0 29.1 24.0 19.6EV/EBITDA 20.1 17.3 14.2 11.8RoCE (%) 23.4 23.7 26.5 28.1RoE (%) 27.6 25.2 25.7 26.2

Disclaimer: This document has been prepared by Sharekhan Ltd. (SHAREKHAN) and is intended for use only by the person or entity to which it is addressed to. This Document may contain confidential and/ori il d i l d i f f i l i d i i i h i i l hibi d hi i bj h i h i i hi d dprivileged material and is not for any type of circulation and any review, retransmission, or any other use is strictly prohibited. This Document is subject to changes without prior notice. This document does not
constitute an offer to sell or solicitation for the purchase or sale of any financial instrument or as an official confirmation of any transaction. Though disseminated to all customers who are due to receive the same,not all customers may receive this report at the same time. SHAREKHAN will not treat recipients as customers by virtue of their receiving this report.
The information contained herein is obtained from publicly available data or other sources believed to be reliable and SHAREKHAN has not independently verified the accuracy and completeness of the said data andThe information contained herein is obtained from publicly available data or other sources believed to be reliable and SHAREKHAN has not independently verified the accuracy and completeness of the said data andhence it should not be relied upon as such. While we would endeavour to update the information herein on reasonable basis, SHAREKHAN, its subsidiaries and associated companies, their directors and employees(“SHAREKHAN and affiliates”) are under no obligation to update or keep the information current. Also, there may be regulatory, compliance, or other reasons that may prevent SHAREKHAN and affiliates from doingso. This document is prepared for assistance only and is not intended to be and must not alone be taken as the basis for an investment decision. Recipients of this report should also be aware that past performanceis not necessarily a guide to future performance and value of investments can go down as well. The user assumes the entire risk of any use made of this information. Each recipient of this document should makesuch investigations as it deems necessary to arrive at an independent evaluation of an investment in the securities of companies referred to in this document (including the merits and risks involved), and shouldconsult its own advisors to determine the merits and risks of such an investment. The investment discussed or views expressed may not be suitable for all investors. We do not undertake to advise you as to anychange of our views. Affiliates of Sharekhan may have issued other reports that are inconsistent with and reach different conclusions from the information presented in this report.
This report is not directed or intended for distribution to, or use by, any person or entity who is a citizen or resident of or located in any locality, state, country or other jurisdiction, where such distribution,publication, availability or use would be contrary to law, regulation or which would subject SHAREKHAN and affiliates to any registration or licencing requirement within such jurisdiction. The securities describedherein may or may not be eligible for sale in all jurisdictions or to certain category of investors. Persons in whose possession this document may come are required to inform themselves of and to observe suchrestriction.
The analyst certifies that the analyst has not dealt or traded directly or indirectly in securities of the company and that all of the views expressed in this document accurately reflect his or her personal views aboutthe subject company or companies and its or their securities and do not necessarily reflect those of SHAREKHAN. The analyst further certifies that neither he nor his relatives has any direct or indirect financiali t t h t l b fi i l hi f 1% i th iti f th h t i l fli t f i t t h d ffi di t l d i k t kiinterest nor have actual or beneficial ownership of 1% or more in the securities of the company nor have any material conflict of interest nor has served as officer, director or employee or engaged in market makingactivity of the company. Further, the analyst has also not been a part of the team which has managed or co‐managed the public offerings of the company and no part of the analyst’s compensation was, is or will be,directly or indirectly related to specific recommendations or views expressed in this document.
Either SHAREKHAN or its affiliates or its directors or employees / representatives / clients or their relatives may have position(s) make market act as principal or engage in transactions of purchase or sell ofEither SHAREKHAN or its affiliates or its directors or employees / representatives / clients or their relatives may have position(s), make market, act as principal or engage in transactions of purchase or sell ofsecurities, from time to time or may be materially interested in any of the securities or related securities referred to in this report and they may have used the information set forth herein before publication.SHAREKHAN may from time to time solicit from, or perform investment banking, or other services for, any company mentioned herein. Without limiting any of the foregoing, in no event shall SHAREKHAN, any of itsaffiliates or any third party involved in, or related to, computing or compiling the information have any liability for any damages of any kind.
Compliance Officer: Mr. Joby John Meledan; Tel: 022‐61150000; email id: [email protected]; For any queries or grievances kindly email [email protected] or contact: [email protected]
Registered Office: Sharekhan Limited, 10th Floor, Beta Building, Lodha iThink Techno Campus, Off. JVLR, Opp. Kanjurmarg Railway Station, Kanjurmarg (East), Mumbai – 400042, Maharashtra.T l 022 61150000 Sh kh Ltd SEBI R N BSE / NSE / MSEI (CASH / F&O / CD) / MCX C dit INZ000171337 DP NSDL/CDSL IN DP 365 2018 PMS INP000005786 M t l F d ARN 20669Tel: 022 ‐ 61150000. Sharekhan Ltd.: SEBI Regn. Nos.: BSE / NSE / MSEI (CASH / F&O / CD) / MCX ‐ Commodity: INZ000171337; DP: NSDL/CDSL‐IN‐DP‐365‐2018; PMS: INP000005786; Mutual Fund: ARN 20669;Research Analyst: INH000006183;Disclaimer: Client should read the Risk Disclosure Document issued by SEBI & relevant exchanges and the T&C on www.sharekhan.com; Investment in securities market are subject to market risks, read all the relateddocuments carefully before investing.