ismi predictive preventive maintenance (ppm) data · pdf fileismi predictive preventive...
TRANSCRIPT
ISMI Predictive Preventive Maintenance (PPM) Data Requirements
International SEMATECH Manufacturing Initiative Technology Transfer #10105120A-TR

© 2010 International SEMATECH Manufacturing Initiative, Inc.
Advanced Materials Research Center, AMRC, International SEMATECH Manufacturing Initiative, and ISMI are servicemarks of SEMATECH, Inc. SEMATECH and the SEMATECH logo are registered servicemarks
of SEMATECH, Inc. All other servicemarks and trademarks are the property of their respective owners.
ISMI Predictive Preventive Maintenance (PPM) Data Requirements Technology Transfer #10105120A-TR
International SEMATECH Manufacturing Initiative October 25, 2010
Abstract: This document from the MFGM032M project provides guidance for semiconductor equipment suppliers, device makers, and other implementers of Prognostics and Health Management (PHM) systems. The requirements for the integration of predictive and non-predictive condition-based maintenance (CBM), scheduled preventive maintenance (PM), and maintenance optimizer applications are discussed. The document introduces common language to describe the data requirements and functionalities of the equipment and factory systems and uses examples to justify extending existing PM factory systems to create an optimized maintenance system.
Note on Terminology: Predictive preventive maintenance (PPM) as a term is an invention of ISMI. ISMI has defined PPM as “the integration of predictive maintenance (PdM), CBM, and scheduled maintenance to optimize factory performance.” The broader industry-accepted term is PHM, defined as “the discipline that links studies of failure mechanisms to system lifecycle management.” The broader industry-accepted terms for PdM and CBM, as used by ISMI, are predictive CBM and non-predictive CBM. In the interest of using broadly accepted terminology, PHM, predictive CBM, and non-predictive CBM will be used throughout this document.
Keywords:
Authors: David Stark
Approvals: David Stark, Author Sue Gnat, Technology Transfer Team Leader

iii
ISMI Technology Transfer #10105120A-TR
Table of Contents
1 EXECUTIVE SUMMARY .....................................................................................................1
2 INTENDED AUDIENCE........................................................................................................1
3 BACKGROUND.....................................................................................................................1
4 INTEGRATION NOTE...........................................................................................................2
5 SUBSYSTEMS OF A COMPLETE PHM SYSTEM .............................................................2 5.1 Scheduled PM .................................................................................................................2
5.1.1 Basic Scheduled PM System Inputs and Outputs ...............................................3 5.1.2 Scheduled Maintenance Data Quality.................................................................5
5.2 Non-Predictive CBM ......................................................................................................6 5.2.1 Non-Predictive CBM Data Quality...................................................................10
5.3 Predictive CBM.............................................................................................................11 5.3.1 Predictive CBM Data Quality ...........................................................................15
5.4 Decision Making Application .......................................................................................15 5.4.1 Decision Application Data Quality ...................................................................16
6 PHM SYSTEM FACTORY ARCHITECTURE ...................................................................17
7 SUMMARY...........................................................................................................................19
8 REFERENCES......................................................................................................................19 8.1 Documents ....................................................................................................................19 8.2 ISMI Programs/Project Material ...................................................................................19
iv
Technology Transfer #10105120A-TR ISMI
List of Figures
Figure 1 High Level View of PHM System..............................................................................3
Figure 2 Scheduled Maintenance System Example..................................................................4
Figure 3 Example of Health Indicator Visualization Output ....................................................9
Figure 4 Manual Visualization Job Build and Execution Example ..........................................9
Figure 5 Non-Predictive CBM System Functions and Libraries............................................10
Figure 6 Predictive CBM System Functions and Libraries ....................................................14
Figure 7 Predictive CBM User Set-Up and Manual Visualization Job Build and Execution Example ..................................................................................................14
Figure 8 Decision Application Functions and Libraries .........................................................16
Figure 9 Integrated PHM System Data Flow .........................................................................18
Figure 10 PHM System Integrated to Fab Information ............................................................18
List of Tables
Table 1 Data Quality for Input and Output for Scheduled PM Module..................................5
Table 2 Data Quality for Input and Output for Non-Predictive CBM Module .....................11
Table 3 Data Quality for Input and Output for Predictive CBM Module .............................15
Table 4 Data Quality for Input and Output for Decision Application...................................17
v
ISMI Technology Transfer #10105120A-TR
Acronyms and Abbreviations
AEC Advanced Equipment Control ALID Alarm Event Identifier AMHS Automated Material Handling System APC Advanced Process Control CBM Condition Based Maintenance CD Critical Dimension CEID Collection Event Identifier CIM Computer Integrated Manufacturing CMP Chemical Mechanical Polish CVD Chemical Vapor Deposition DCP Data Collection Plan DOE Design of Experiments DQ Data Quality EDA Equipment Data Acquisition EI Equipment Integration EPI Equipment Performance Index FDC Fault Detection & Classification FICS Fab Information & Control System IDM Integrated Device Manufacturer ISMI International SEMATECH Manufacturing Initiative JIT Just-In-Time MES Manufacturing Execution System MTTF Mean Time to Failure NGF Next Generation Factory OCAP Out of Control Action Plan OEE Overall Equipment Efficiency OEM Original Equipment Manufacturer PCA Principal Component Analysis PCR Principal Component Regression PdM Predictive Maintenance PHM Prognostics & Health Management PLS Partial Least Squares PM Preventive Maintenance RUL Remaining Useful Life SEMI Semiconductor Equipment and Materials International SECS-II Semiconductor Equipment Communications Standards SPC Statistical Process Control SVID Status Variable Identifier TBM Time-based Maintenance UBM Usage-based Maintenance WOM Wafer Oriented Manufacturing YMS Yield Management System UBM Usage-based Maintenance
vi
Technology Transfer #10105120A-TR ISMI
Definitions
Advanced Process Control (APC) – Techniques covering both feed-forward and feedback control and automated fault detection, applied by both the equipment (in situ) and by the factory (ex situ).
Degradation Rate – Rate at which the operational quality of an equipment system, subsystem, or component decreases over time.
Equipment Data Acquisition (EDA) – The suite of SEMI Diagnostic Data Acquisition (DDA) standards; at this writing, the suite includes SEMI E120, E125, E132, and E134. Also referenced by Interface A are SEMI E128 and E138.
Equipment Performance Index (EPI) – Indicators composed of equipment hardware and/or factory data. They can be used to calculate system/sub-system/component health metrics.
Fault Detection & Classification (FDC) – A methodology of monitoring statistical variations in processing tool data and detecting anomalies.
Just-in-Time (JIT) Inventory – A strategy to improve the return on investment by reducing in-process inventory and its associated carrying costs.
Maintenance Event – Any activity (e.g., tests, measurements, replacements, adjustments and repairs) intended to retain or restore a functional unit in or to a specified state in which the unit can perform its required functions.
Mean Time to Failure (MTTF) – The average time between failures with the modeling assumption that the failed system is run until it fails without preventive maintenance.
Out of Control Action Plan (OCAP) – A controlled document detailing the procedure to disposition product/processes or equipment repairs or maintenance activities in response to an equipment fault indication.
Parameter Set – A set of related information that would likely be passed together as input parameters to an operation request or output parameters in a corresponding response. Specific examples include a process data set, a context data set, configuration data set, etc. It is not intended to specify any aspect of the data’s persistent storage.
Prognostics & Health Management (PHM) Information – The discipline that links studies of failure mechanisms to system lifecycle management. PHM uses information to allow early detection of impending or incipient faults, remaining useful life calculations, and logistical decision-making based on predictions.
Raw Data – Unprocessed data.
Remaining Useful Life (RUL) – A forecast of time or operating cycles remaining until a failure occurs.
Run-To-Failure Methodology – A method whereby an equipment system, subsystem, and component is fixed or replaced only after it fails.
Sensor – A component that responds to changes in the physical environment and provides an analog or digital output value.
Subsystem – An intelligent aggregate that behaves as a unit. A subsystem is made up of sensors and/or actuators and may contain mechanical assemblies. Multiple modules may share subsystems.
1
ISMI Technology Transfer #10105120A-TR
1 EXECUTIVE SUMMARY
This document provides guidance for semiconductor equipment suppliers, device makers, and other implementers of prognostics and health management (PHM) systems. It introduces the PHM system data requirements and functionalities to enable integration of the building blocks of an intelligent maintenance system; predictive CBM, non-predictive CBM, scheduled preventive maintenance (PM), and the maintenance decision making applications. Functionalities include gathering equipment and factory data, assessing equipment health, assessing conditional states, forecasting performance degradation, assessing scheduled PM calendars, optimized decision-making, messaging, and visualization.
This document complements the 2008 Predictive Preventive Maintenance (PPM) Equipment Implementation Guideline [1], the 2009 PPM Research White Paper [2], and the 2009 PPM Implementation Guide [3].
2 INTENDED AUDIENCE
An integrated intelligent maintenance system is complex. It is comprised of multiple interconnected building blocks, each of which may be developed by an equipment supplier, the integrated device manufacturer (IDM), or third-party application suppliers. The audience for this document consists of the building block developers, computer integrated manufacturing (CIM) system integrators, equipment engineers, and factory management.
3 BACKGROUND
The objective of PHM is to maximize equipment return on investment. A PHM system will optimize scheduled maintenance, predictive condition based maintenance, and non-predictive condition based maintenance. Scheduled maintenance is performed on a fixed, calendar-based schedule. Non-predictive condition-based maintenance is accomplished by instantaneous monitoring of equipment and by performing maintenance when an equipment health indicator reaches a predetermined threshold. Predictive condition based maintenance is accomplished through acquiring relevant equipment and factory data and applying an equipment degradation model to predict the equipment’s remaining useful life (RUL). A PHM system will combine scheduled maintenance, condition-based maintenance, and predictive maintenance to enable effective cost vs. performance decisions.
This document assumes a modular architecture to identify as many potential system interfaces (and hence, data sources and destinations) as possible. The document scope will not address other applications outside of the PHM building blocks, like FDC or APC, as either sources of or destinations for PHM data.
ISMI has defined PPM as “the integration of predictive condition-based maintenance (CBM), non-predictive CBM, and scheduled maintenance to optimize factory performance.” The broader industry-accepted term is Prognostics and Health Management (PHM), defined as “the discipline that links studies of failure mechanisms to system lifecycle management.” In the interest of using broadly accepted terminology, PHM will be used throughout this document.
2
Technology Transfer #10105120A-TR ISMI
4 INTEGRATION NOTE
The optimum configuration for integration of the PHM system into a factory will depend on the particular factory’s existing infrastructure. Even within the PHM system, the individual subsystems may stand alone or be combined. It is likely that the decision application and the scheduled maintenance system can be easily merged, since these two subsystems reside in the factory and consume similar data. It is also likely that the non-predictive and predictive CBM systems can be merged, since these two subsystems consume vast amounts of overlapping data from equipment and factory and may reside closer to the equipment in the factory architecture. This document will treat each subsystem of the PHM system as independent modules in the interest of maximizing flexibility in integration. A large portion of this document will discuss the modules of the complete system, their functions and libraries, and their place in the factory. This discussion of each module will be followed by a list of the data entering and exiting the module (i.e., the data flow). This data flow discussion will include a discussion of the data content and data quality for each data flow.
5 SUBSYSTEMS OF A COMPLETE PHM SYSTEM
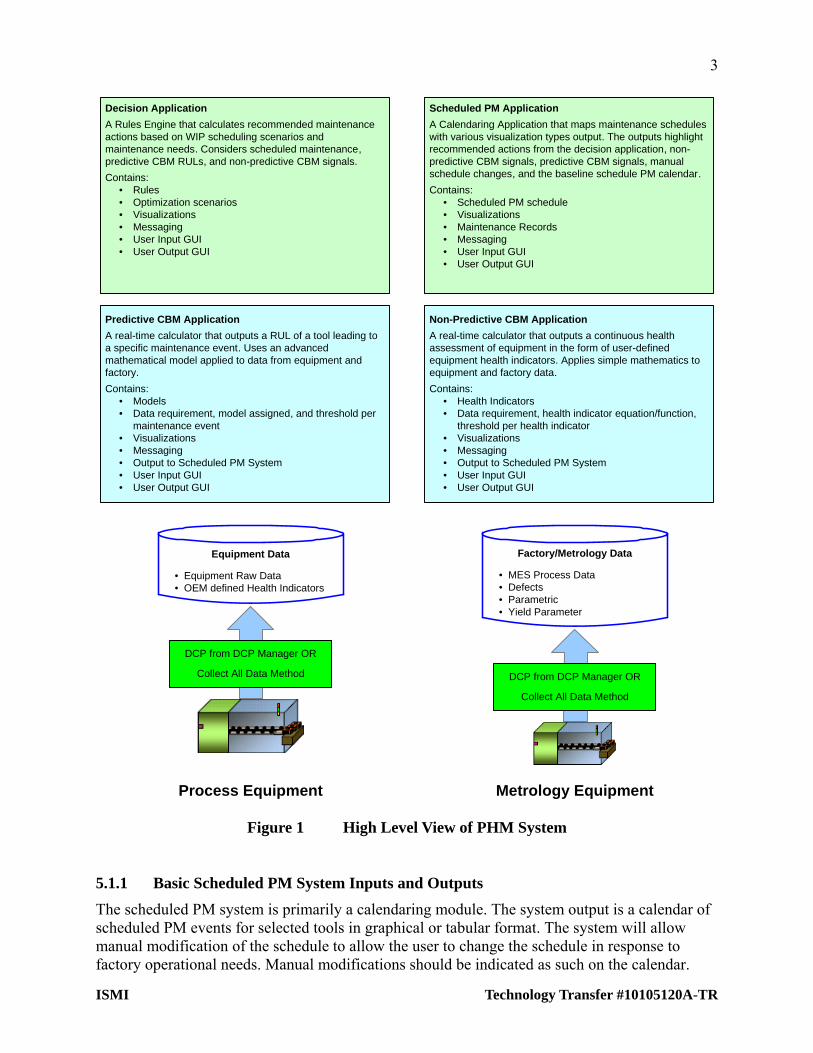
There are four subsystems of the complete PHM system: 1) preventive maintenance, 2) non-predictive condition-based maintenance, 3) predictive condition-based maintenance, and 4) the decision application. Each subsystem of the complete PHM system will be discussed. The data input and output requirements for each subsystem will be described. Figure 1 shows a high level view of the PHM system.
5.1 Scheduled PM
The scheduled PM system maintains a calendar of all scheduled PMs. Scheduled PMs are those maintenance events that are scheduled on the basis of elapsed calendar time. In the semiconductor factory, some of these scheduled PM events are monthly PM, quarterly PM, semi-annual PM, and annual PM. The content and timing of these events are typically specified by the OEM, and maintaining tools in accordance with the OEM specification is often a condition of a warranty. Every predictive CBM and non-predictive CBM related maintenance event will have a record in the database to which the CBM modules will write updated information as those modules generate the associated signals.
3
Equipment Data
• Equipment Raw Data• OEM defined Health Indicators
Factory/Metrology Data
• MES Process Data• Defects• Parametric• Yield Parameter
DCP from DCP Manager OR
Collect All Data Method DCP from DCP Manager OR
Collect All Data Method
Predictive CBM Application
A real-time calculator that outputs a RUL of a tool leading to a specific maintenance event. Uses an advanced mathematical model applied to data from equipment and factory.
Contains:• Models• Data requirement, model assigned, and threshold per
maintenance event• Visualizations• Messaging• Output to Scheduled PM System• User Input GUI• User Output GUI
Non-Predictive CBM Application
A real-time calculator that outputs a continuous health assessment of equipment in the form of user-defined equipment health indicators. Applies simple mathematics to equipment and factory data.
Contains:• Health Indicators• Data requirement, health indicator equation/function,
threshold per health indicator• Visualizations• Messaging• Output to Scheduled PM System• User Input GUI• User Output GUI
Decision Application
A Rules Engine that calculates recommended maintenance actions based on WIP scheduling scenarios and maintenance needs. Considers scheduled maintenance, predictive CBM RULs, and non-predictive CBM signals.
Contains:• Rules• Optimization scenarios• Visualizations• Messaging• User Input GUI• User Output GUI
Scheduled PM Application
A Calendaring Application that maps maintenance schedules with various visualization types output. The outputs highlight recommended actions from the decision application, non-predictive CBM signals, predictive CBM signals, manual schedule changes, and the baseline schedule PM calendar.
Contains:• Scheduled PM schedule• Visualizations• Maintenance Records• Messaging• User Input GUI• User Output GUI
Process Equipment Metrology Equipment
Figure 1 High Level View of PHM System
5.1.1 Basic Scheduled PM System Inputs and Outputs
The scheduled PM system is primarily a calendaring module. The system output is a calendar of scheduled PM events for selected tools in graphical or tabular format. The system will allow manual modification of the schedule to allow the user to change the schedule in response to factory operational needs. Manual modifications should be indicated as such on the calendar.
ISMI Technology Transfer #10105120A-TR
4
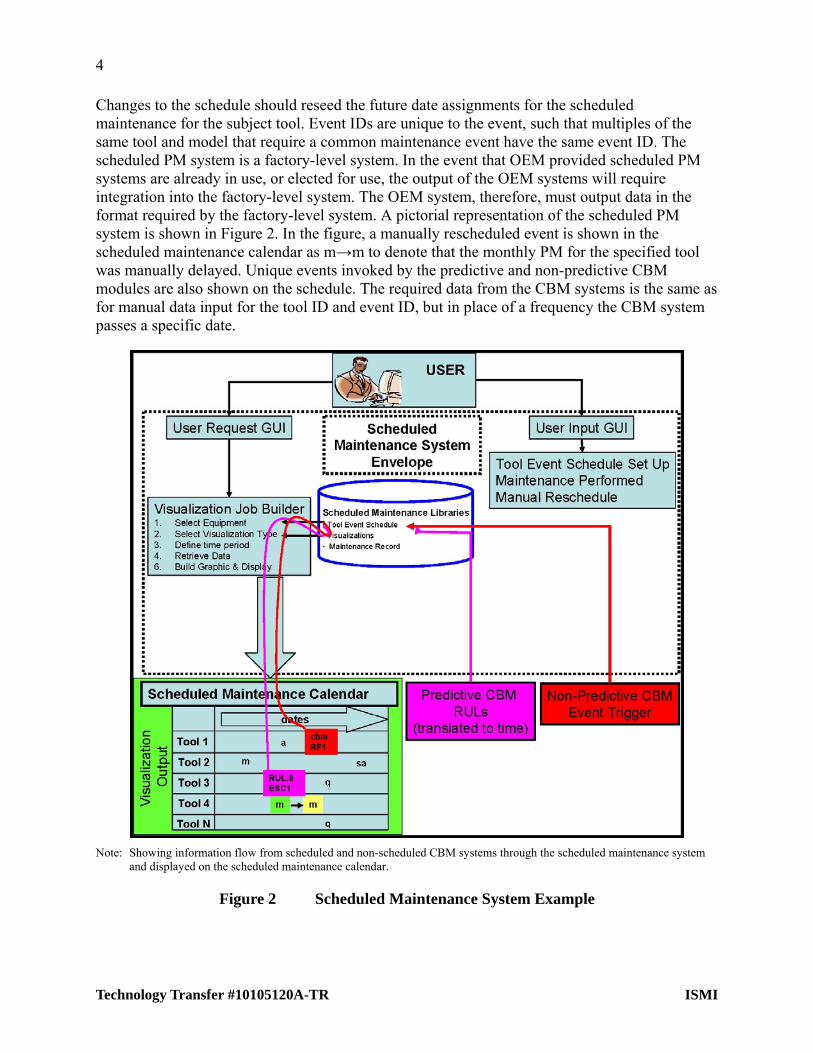
Changes to the schedule should reseed the future date assignments for the scheduled maintenance for the subject tool. Event IDs are unique to the event, such that multiples of the same tool and model that require a common maintenance event have the same event ID. The scheduled PM system is a factory-level system. In the event that OEM provided scheduled PM systems are already in use, or elected for use, the output of the OEM systems will require integration into the factory-level system. The OEM system, therefore, must output data in the format required by the factory-level system. A pictorial representation of the scheduled PM system is shown in Figure 2. In the figure, a manually rescheduled event is shown in the scheduled maintenance calendar as m→m to denote that the monthly PM for the specified tool was manually delayed. Unique events invoked by the predictive and non-predictive CBM modules are also shown on the schedule. The required data from the CBM systems is the same as for manual data input for the tool ID and event ID, but in place of a frequency the CBM system passes a specific date.
Note: Showing information flow from scheduled and non-scheduled CBM systems through the scheduled maintenance system and displayed on the scheduled maintenance calendar.
Figure 2 Scheduled Maintenance System Example
Technology Transfer #10105120A-TR ISMI
5
ISMI Technology Transfer #10105120A-TR
5.1.2 Scheduled Maintenance Data Quality
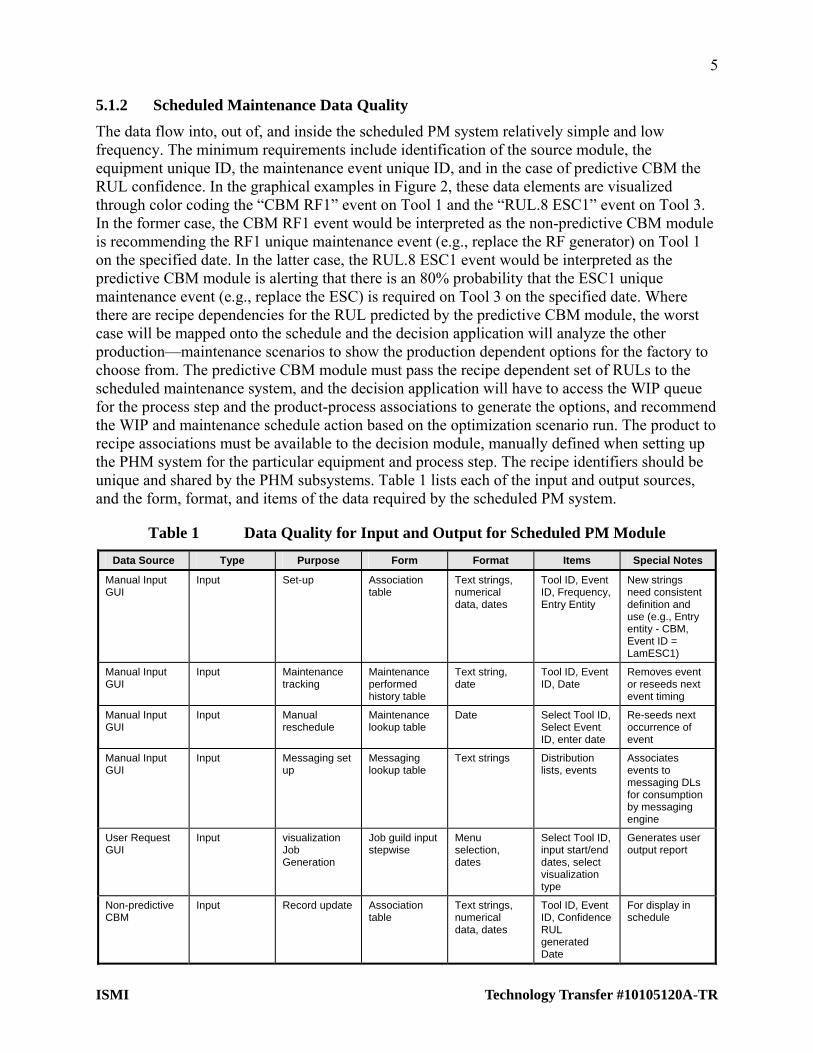
The data flow into, out of, and inside the scheduled PM system relatively simple and low frequency. The minimum requirements include identification of the source module, the equipment unique ID, the maintenance event unique ID, and in the case of predictive CBM the RUL confidence. In the graphical examples in Figure 2, these data elements are visualized through color coding the “CBM RF1” event on Tool 1 and the “RUL.8 ESC1” event on Tool 3. In the former case, the CBM RF1 event would be interpreted as the non-predictive CBM module is recommending the RF1 unique maintenance event (e.g., replace the RF generator) on Tool 1 on the specified date. In the latter case, the RUL.8 ESC1 event would be interpreted as the predictive CBM module is alerting that there is an 80% probability that the ESC1 unique maintenance event (e.g., replace the ESC) is required on Tool 3 on the specified date. Where there are recipe dependencies for the RUL predicted by the predictive CBM module, the worst case will be mapped onto the schedule and the decision application will analyze the other production—maintenance scenarios to show the production dependent options for the factory to choose from. The predictive CBM module must pass the recipe dependent set of RULs to the scheduled maintenance system, and the decision application will have to access the WIP queue for the process step and the product-process associations to generate the options, and recommend the WIP and maintenance schedule action based on the optimization scenario run. The product to recipe associations must be available to the decision module, manually defined when setting up the PHM system for the particular equipment and process step. The recipe identifiers should be unique and shared by the PHM subsystems. Table 1 lists each of the input and output sources, and the form, format, and items of the data required by the scheduled PM system.
Table 1 Data Quality for Input and Output for Scheduled PM Module
Data Source Type Purpose Form Format Items Special Notes
Manual Input GUI
Input Set-up Association table
Text strings, numerical data, dates
Tool ID, Event ID, Frequency, Entry Entity
New strings need consistent definition and use (e.g., Entry entity - CBM, Event ID = LamESC1)
Manual Input GUI
Input Maintenance tracking
Maintenance performed history table
Text string, date
Tool ID, Event ID, Date
Removes event or reseeds next event timing
Manual Input GUI
Input Manual reschedule
Maintenance lookup table
Date Select Tool ID, Select Event ID, enter date
Re-seeds next occurrence of event
Manual Input GUI
Input Messaging set up
Messaging lookup table
Text strings Distribution lists, events
Associates events to messaging DLs for consumption by messaging engine
User Request GUI
Input visualization Job Generation
Job guild input stepwise
Menu selection, dates
Select Tool ID, input start/end dates, select visualization type
Generates user output report
Non-predictive CBM
Input Record update Association table
Text strings, numerical data, dates
Tool ID, Event ID, Confidence RUL generated Date
For display in schedule
6
Technology Transfer #10105120A-TR ISMI
Data Source Type Purpose Form Format Items Special Notes
Predictive CBM Input Record update Association table
Text strings, dates
Tool ID, Event ID, date
For display in schedule
Decision application
Input Record update Association table
Text strings, dates
Tool ID, Event ID, date
For display in schedule
Visualizations Output Scheduling visualization
graphic or table or list
File File For display or output
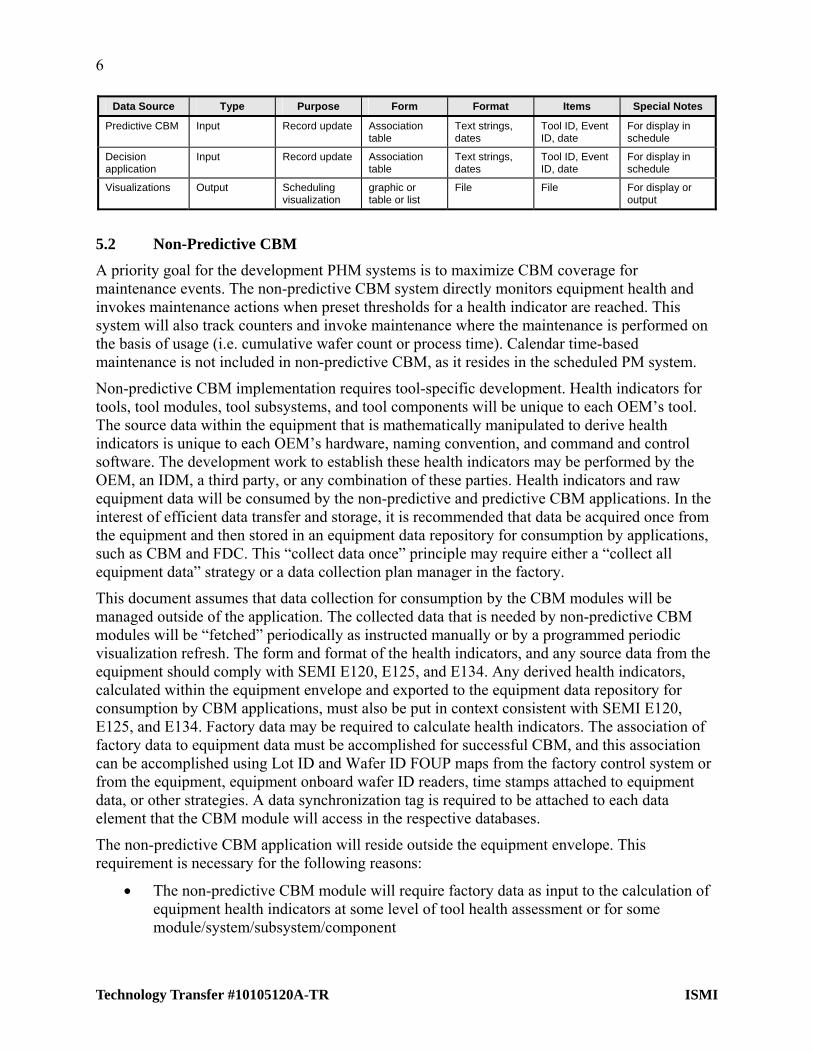
5.2 Non-Predictive CBM
A priority goal for the development PHM systems is to maximize CBM coverage for maintenance events. The non-predictive CBM system directly monitors equipment health and invokes maintenance actions when preset thresholds for a health indicator are reached. This system will also track counters and invoke maintenance where the maintenance is performed on the basis of usage (i.e. cumulative wafer count or process time). Calendar time-based maintenance is not included in non-predictive CBM, as it resides in the scheduled PM system.
Non-predictive CBM implementation requires tool-specific development. Health indicators for tools, tool modules, tool subsystems, and tool components will be unique to each OEM’s tool. The source data within the equipment that is mathematically manipulated to derive health indicators is unique to each OEM’s hardware, naming convention, and command and control software. The development work to establish these health indicators may be performed by the OEM, an IDM, a third party, or any combination of these parties. Health indicators and raw equipment data will be consumed by the non-predictive and predictive CBM applications. In the interest of efficient data transfer and storage, it is recommended that data be acquired once from the equipment and then stored in an equipment data repository for consumption by applications, such as CBM and FDC. This “collect data once” principle may require either a “collect all equipment data” strategy or a data collection plan manager in the factory.
This document assumes that data collection for consumption by the CBM modules will be managed outside of the application. The collected data that is needed by non-predictive CBM modules will be “fetched” periodically as instructed manually or by a programmed periodic visualization refresh. The form and format of the health indicators, and any source data from the equipment should comply with SEMI E120, E125, and E134. Any derived health indicators, calculated within the equipment envelope and exported to the equipment data repository for consumption by CBM applications, must also be put in context consistent with SEMI E120, E125, and E134. Factory data may be required to calculate health indicators. The association of factory data to equipment data must be accomplished for successful CBM, and this association can be accomplished using Lot ID and Wafer ID FOUP maps from the factory control system or from the equipment, equipment onboard wafer ID readers, time stamps attached to equipment data, or other strategies. A data synchronization tag is required to be attached to each data element that the CBM module will access in the respective databases.
The non-predictive CBM application will reside outside the equipment envelope. This requirement is necessary for the following reasons:
The non-predictive CBM module will require factory data as input to the calculation of equipment health indicators at some level of tool health assessment or for some module/system/subsystem/component
7
ISMI Technology Transfer #10105120A-TR
The non-predictive CBM module will include a manual modification of thresholds at the user’s discretion
Factory-based applications are easier to propagate throughout the factory
User set up of the non-predictive CBM module requires:
Equipment/module/subsystem/component hierarchy definition per SEMI E120/125/134
Health indicator and counter list with association to equipment/module/subsystem/ component
List of required data (equipment and factory) for each health indicator and counter
Health indicator and counter calculation functions
User-defined health indicator and counter thresholds
Association of health indicator and counter trigger to maintenance event ID
Messaging list per event (if messaging is active in this module)
Functions of the non-predictive CBM module are:
Calculate health indicators and increment counters
Associate health indicators and counters to equipment consistent with SEMI E120/125/134
Compare health indicators and counters to thresholds defined by the user
Provide or invoke messaging of maintenance event triggered
Provide visualization of equipment health status either continuously or upon manual request for selected tools
Provide input to scheduled PM system for calendar visualization including CBM invoked maintenance events with scheduled PMs
Outputs of the non-predictive CBM module are:
Messaging: Direct messaging of triggered maintenance event OR invoked message command with relevant association information (tool ID, maintenance event ID)
Visualization output to user via user interface: Equipment health dashboard, either real-time continuously OR when manually requested for selected tools. Includes health metric or counter value graphic versus threshold, current status and historical graphic
Output to scheduled PM module: CBM invoked maintenance event with relevant tool ID and maintenance event ID as input to scheduled PM module for calendar visualization
8
Technology Transfer #10105120A-TR ISMI
User Interface – User Requests
The user will access the system through the user interface to change any health indicator or counter thresholds manually
The user can manually request any health indicator or counter graphic output – select from health indicator and counter library, select time period, select visualization type from library.
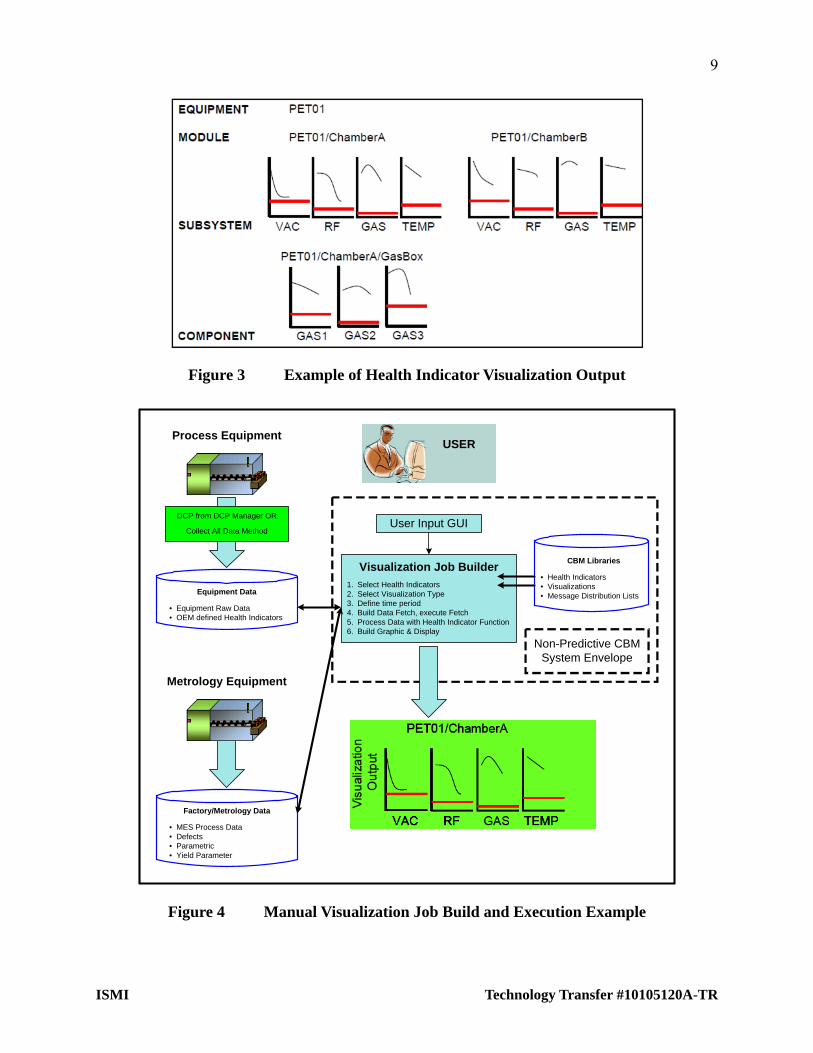
An example output of a health indicator visualization (select X-Y graph for defined time period) for one tool with two process chambers, four subsystems per chamber, and three components for one chamber subsystem is shown in Figure 3. This particular example is for equipment: Lam plasma etcher ID PET01; modules: Chambers A and B; subsystem: health indicators for vacuum (VAC) and RF (RF) and gasbox (GAS) and temperature (TEMP); and the component: health indicators for Chamber A Gasbox Gas1 and Gas2 and Gas3.
Figure 4 shows graphically a user request for health indicator visualization. From the figure, the process is as follows (process step is denoted in the list below, and in Figure 4):
0. User accesses the CBM User Input GUI.
1. User selects a list of health indicators for visualization. The health indicators are stored in the CBM health indicator library, with their associated contextual information per SEMI E120/125/134, with all associated raw data required to construct the health indicator, and with the specific health indicator calculation function. In the example, user selected PET01/ChamberA/VAC, PET01/ChamberA/RF, PET01/ChamberA/GAS, PET01/ChamberA/TEMP health indicators for visualization. This selection step results in an assembled list of health indicators and their associated component data elements, in a format that can be translated into a data extraction when merged with the time period specified in step 3.
2. User selects the visualization type from a list of generic visualizations stored in the library. In the example case, the user selected X-Y graph of health indicator vs. time.
3. User defines a time period. In the example the tile period is somewhat ambiguous, but in a real example the time period is displayed on the X axis of the graphical output.
4. The CBM system builds the data extraction (termed data fetch) and gathers the data from the equipment database and factory metrology database. This step involves two processes. The first process involves the organization of the data extraction from the CBM library information in step 1 and the time period specified in step 3 into a data extraction plan. The second step is to execute the data extraction plan, which results in a chronological tabular data file for health indicator generation.
5. The CBM system processes the chronological tabular data file from step 4 using the calculation function from step 1, resulting in the chronological tabular data for each health indicator selected organized for visualization.
6. The CBM system builds the user selected visualization from step 2 using the health indicator data file from step 5. The CBM System outputs to the user the visualizations requested.
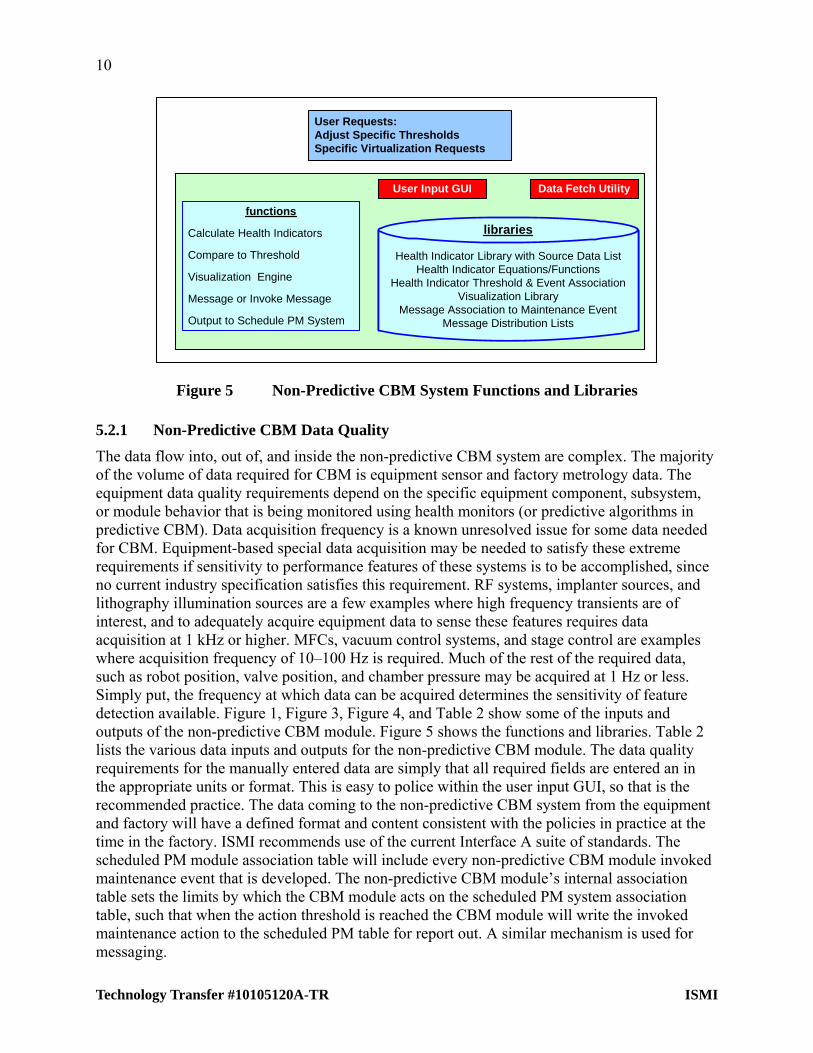
Figure 5 shows a summary of the non-predictive CBM module functions and libraries.
9
Figure 3 Example of Health Indicator Visualization Output
Equipment Data
• Equipment Raw Data• OEM defined Health Indicators
DCP from DCP Manager OR
Collect All Data Method
Process Equipment
Metrology Equipment
Factory/Metrology Data
• MES Process Data• Defects• Parametric• Yield Parameter
USER
User Input GUI
Visualization Job Builder
1. Select Health Indicators2. Select Visualization Type3. Define time period4. Build Data Fetch, execute Fetch5. Process Data with Health Indicator Function6. Build Graphic & Display
CBM Libraries
• Health Indicators• Visualizations• Message Distribution Lists
Non-Predictive CBMSystem Envelope
Figure 4 Manual Visualization Job Build and Execution Example
ISMI Technology Transfer #10105120A-TR
10
Health Indicator Library with Source Data ListHealth Indicator Equations/Functions
Health Indicator Threshold & Event AssociationVisualization Library
Message Association to Maintenance EventMessage Distribution Lists
functions
Calculate Health Indicators
Compare to Threshold
Visualization Engine
Message or Invoke Message
Output to Schedule PM System
User Input GUI Data Fetch Utility
User Requests:Adjust Specific ThresholdsSpecific Virtualization Requests
libraries
Figure 5 Non-Predictive CBM System Functions and Libraries
5.2.1 Non-Predictive CBM Data Quality
The data flow into, out of, and inside the non-predictive CBM system are complex. The majority of the volume of data required for CBM is equipment sensor and factory metrology data. The equipment data quality requirements depend on the specific equipment component, subsystem, or module behavior that is being monitored using health monitors (or predictive algorithms in predictive CBM). Data acquisition frequency is a known unresolved issue for some data needed for CBM. Equipment-based special data acquisition may be needed to satisfy these extreme requirements if sensitivity to performance features of these systems is to be accomplished, since no current industry specification satisfies this requirement. RF systems, implanter sources, and lithography illumination sources are a few examples where high frequency transients are of interest, and to adequately acquire equipment data to sense these features requires data acquisition at 1 kHz or higher. MFCs, vacuum control systems, and stage control are examples where acquisition frequency of 10–100 Hz is required. Much of the rest of the required data, such as robot position, valve position, and chamber pressure may be acquired at 1 Hz or less. Simply put, the frequency at which data can be acquired determines the sensitivity of feature detection available. Figure 1, Figure 3, Figure 4, and Table 2 show some of the inputs and outputs of the non-predictive CBM module. Figure 5 shows the functions and libraries. Table 2 lists the various data inputs and outputs for the non-predictive CBM module. The data quality requirements for the manually entered data are simply that all required fields are entered an in the appropriate units or format. This is easy to police within the user input GUI, so that is the recommended practice. The data coming to the non-predictive CBM system from the equipment and factory will have a defined format and content consistent with the policies in practice at the time in the factory. ISMI recommends use of the current Interface A suite of standards. The scheduled PM module association table will include every non-predictive CBM module invoked maintenance event that is developed. The non-predictive CBM module’s internal association table sets the limits by which the CBM module acts on the scheduled PM system association table, such that when the action threshold is reached the CBM module will write the invoked maintenance action to the scheduled PM table for report out. A similar mechanism is used for messaging.
Technology Transfer #10105120A-TR ISMI
11
ISMI Technology Transfer #10105120A-TR
Table 2 Data Quality for Input and Output for Non-Predictive CBM Module
Data Source Type Purpose Form Format Items Special Notes
User Input GUI Input Set-up Association table
Text strings, SVIDs
Tool/component ID, Health indicator ID, source data IDs, equation/function
Unique equipment health indicators, the data elements required to generate the health indicator, and the function to use from the function library
User Input GUI Input Threshold setting and event association set-up
Association table
Text strings, numerical data
Health indicator ID, threshold, maintenance event ID
User sets health indicator threshold for maintenance event trigger and/or messaging trigger
Manual Input GUI
Input Messaging set-up
Messaging lookup table
Text strings Distribution lists, events
Associates events to messaging DLs for consumption by messaging engine
User Request GUI
Input Visualization job generation
Job build input stepwise
Manu selection, dates
Select Tool ID, health indicators, input start/end dates, select visualization type
Generates user output report
Maintenance trigger to scheduled PM module
Output Record update Association table update
Text strings, dates
Tool ID, Event ID, date
For display in schedule
Visualizations Output Health dashboard
Graphic or table or list
File File For display or output
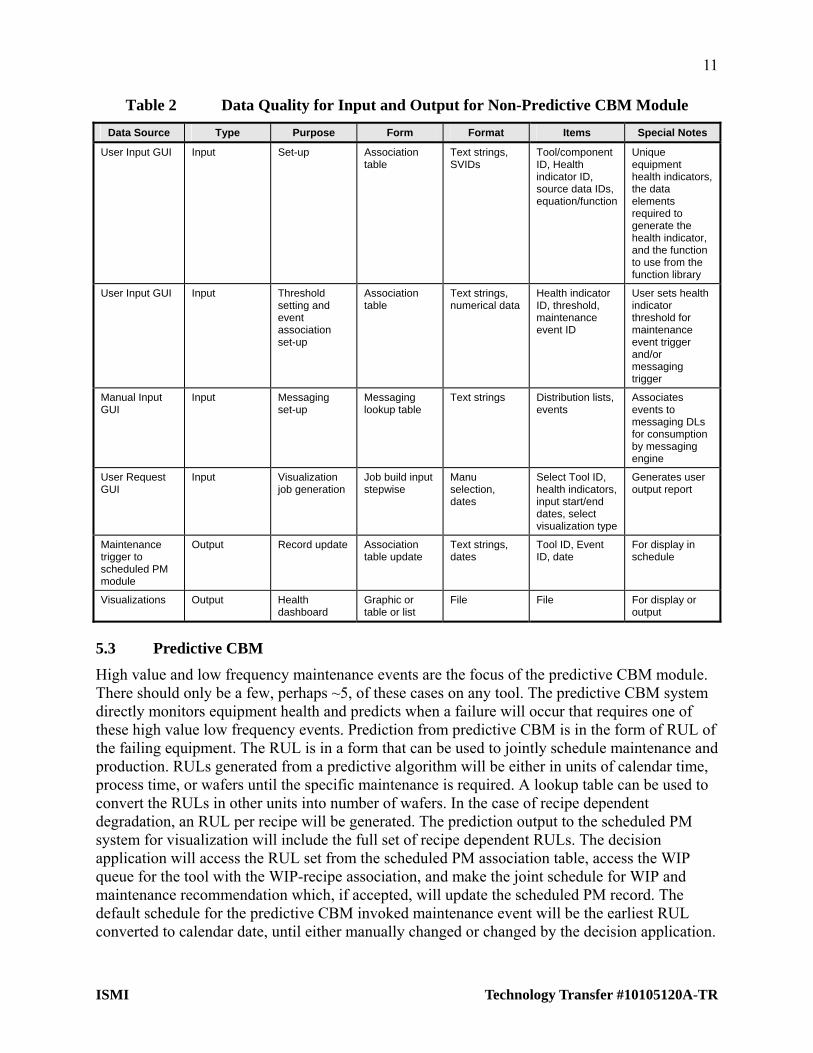
5.3 Predictive CBM
High value and low frequency maintenance events are the focus of the predictive CBM module. There should only be a few, perhaps ~5, of these cases on any tool. The predictive CBM system directly monitors equipment health and predicts when a failure will occur that requires one of these high value low frequency events. Prediction from predictive CBM is in the form of RUL of the failing equipment. The RUL is in a form that can be used to jointly schedule maintenance and production. RULs generated from a predictive algorithm will be either in units of calendar time, process time, or wafers until the specific maintenance is required. A lookup table can be used to convert the RULs in other units into number of wafers. In the case of recipe dependent degradation, an RUL per recipe will be generated. The prediction output to the scheduled PM system for visualization will include the full set of recipe dependent RULs. The decision application will access the RUL set from the scheduled PM association table, access the WIP queue for the tool with the WIP-recipe association, and make the joint schedule for WIP and maintenance recommendation which, if accepted, will update the scheduled PM record. The default schedule for the predictive CBM invoked maintenance event will be the earliest RUL converted to calendar date, until either manually changed or changed by the decision application.
12
Technology Transfer #10105120A-TR ISMI
The large overlap in data requirements and functionality between non-predictive CBM and predictive CBM leads to a conclusion that the modules may be merged into one CBM system. Although this is logical, and time may prove that this is the preferred integration option, this document will assume separate non-predictive and predictive CBM modules. This allows for maximum flexibility, and addresses the significant differences in complexity (and thus required expertise to develop) of health indicator development in non-predictive CBM and prediction of RUL in predictive CBM.
Predictive CBM implementation requires tool-specific development. Predictive model construction will be unique to each OEM’s tool. The source data within the equipment that is consumed in the predictive models are unique to each OEM’s hardware, naming convention, and command and control software. The development work to establish these models may be performed by the OEM, an IDM, a third party, or any combination of these parties. Health indicators, raw equipment data, and factory data will be consumed by the predictive CBM application. In the interest of efficient data transfer and storage, it is recommended that data be acquired once from the equipment and then stored in an equipment data repository for consumption by applications, such as CBM and FDC. This “collect data once” principle may require either a “collect all equipment data” strategy or a data collection plan manager in the factory.
This document assumes that data collection for consumption by the CBM modules will be managed outside of the application. The collected data that is needed by predictive CBM modules will be “fetched” periodically as instructed manually or by a programmed periodic refresh. The form and format of the health indicators, and any source data from the equipment should comply with SEMI E120, E125, and E134. Any derived health indicators, calculated within the equipment envelope and exported to the equipment data repository for consumption by CBM applications, must also be put in context consistent with SEMI E120, E125, and E134. Factory data may be required to calculate RULs. The association of factory data to equipment data is accomplished as discussed in Section 5.2.
The predictive CBM application will reside outside the equipment envelope. This requirement is necessary for the following reasons:
The predictive CMB module will require factory data as input to the calculation of RUL for some cases
The predictive CBM module will include a manual modification of models at the user’s discretion
Factory-based applications are easier to propagate common elements of the application throughout the factory
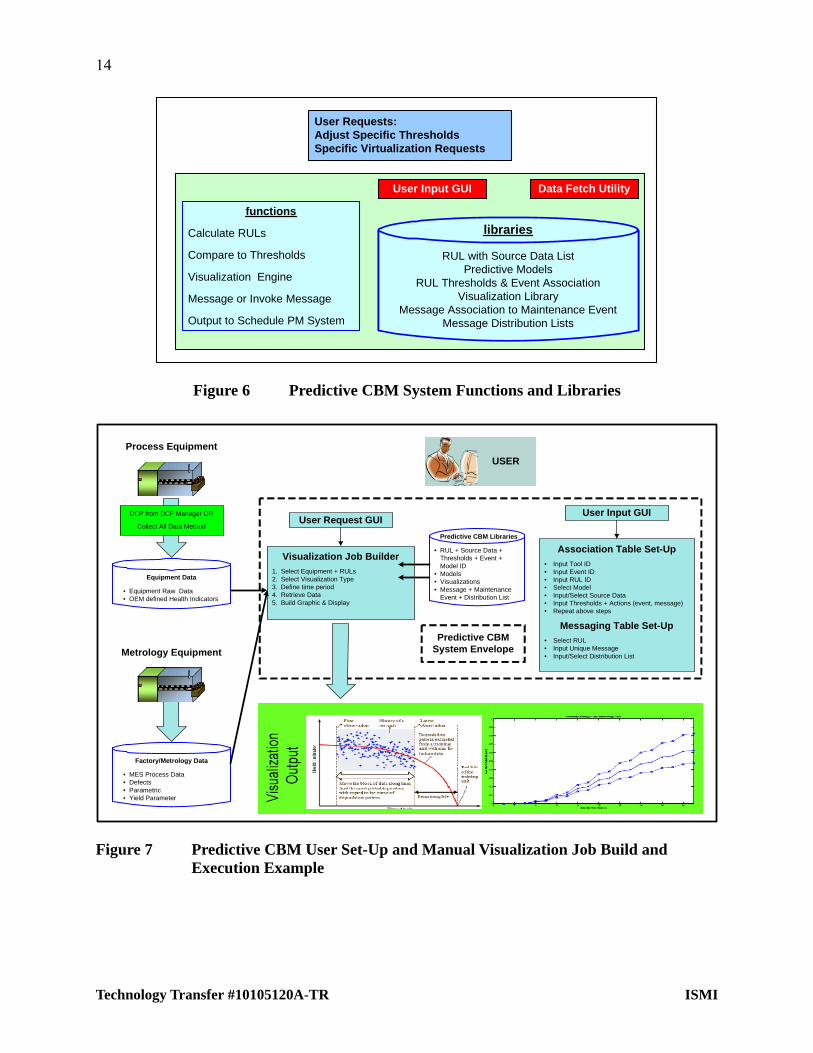
Figure 6 shows a summary of the predictive CBM module functions and libraries. Figure 7 shows user set-up and visualization job building example.
User set up of the predictive CBM module requires:
Model list with output RUL association to equipment/module/subsystem/component
List of required data (equipment and factory) for each predictive model
Definition of the predictive models (modular code input to model library)
13
ISMI Technology Transfer #10105120A-TR
Association of RUL to maintenance event ID
Threshold for each RUL to trigger messaging
Messaging List per event (if messaging is active in this module)
Functions of the predictive CBM module are:
Calculate RULs
Compare RULs to thresholds defined by the user for messaging
Provide or invoke messaging of RUL when RUL threshold is triggered
Provide visualization of prediction either continuously or upon manual request
Provide input to scheduled PM System for calendar visualization including predicted maintenance events
Outputs of the predictive CBM module are:
Messaging : Direct messaging of triggered maintenance event OR invoked message command with relevant association information (tool ID, maintenance event ID, RUL, confidence value)
Visualization output to user via user interface: real-time continuously OR when manually requested for selected tools. Includes RUL and recipe matrix with prediction confidence interval and historical graphic
Output to scheduled PM module: CBM invoked maintenance event with relevant tool ID, maintenance event ID, RUL, and recipe matrix, and confidence values as input to scheduled PM module for calendar visualization
User Interface – User Requests
The user will access the system through the user interface to change any assignments made in the user set-up section (above) including adjusting thresholds, messaging distribution lists, etc
The user can manually request any RUL set graphic output – select from event or fault specific RUL library, select time period, select visualization type from library.
Output will be similar to that of the health indicator visualization shown in the non-predictive CBM module section of this document.
14
RUL with Source Data ListPredictive Models
RUL Thresholds & Event AssociationVisualization Library
Message Association to Maintenance EventMessage Distribution Lists
functions
Calculate RULs
Compare to Thresholds
Visualization Engine
Message or Invoke Message
Output to Schedule PM System
User Input GUI Data Fetch Utility
User Requests:Adjust Specific ThresholdsSpecific Virtualization Requests
libraries
Figure 6 Predictive CBM System Functions and Libraries
Equipment Data
• Equipment Raw Data• OEM defined Health Indicators
DCP from DCP Manager OR
Collect All Data Method
Process Equipment
Metrology Equipment
Factory/Metrology Data
• MES Process Data• Defects• Parametric• Yield Parameter
USER
User Request GUI
Visualization Job Builder
1. Select Equipment + RULs2. Select Visualization Type3. Define time period4. Retrieve Data5. Build Graphic & Display
Predictive CBM Libraries
• RUL + Source Data +Thresholds + Event +Model ID
• Models• Visualizations• Message + Maintenance
Event + Distribution List
Predictive CBMSystem Envelope
Association Table Set-Up
• Input Tool ID• Input Event ID• Input RUL ID• Select Model• Input/Select Source Data• Input Thresholds + Actions (event, message)• Repeat above steps
Messaging Table Set-Up
• Select RUL• Input Unique Message• Input/Select Distribution List
User Input GUI
Figure 7 Predictive CBM User Set-Up and Manual Visualization Job Build and Execution Example
Technology Transfer #10105120A-TR ISMI
15
ISMI Technology Transfer #10105120A-TR
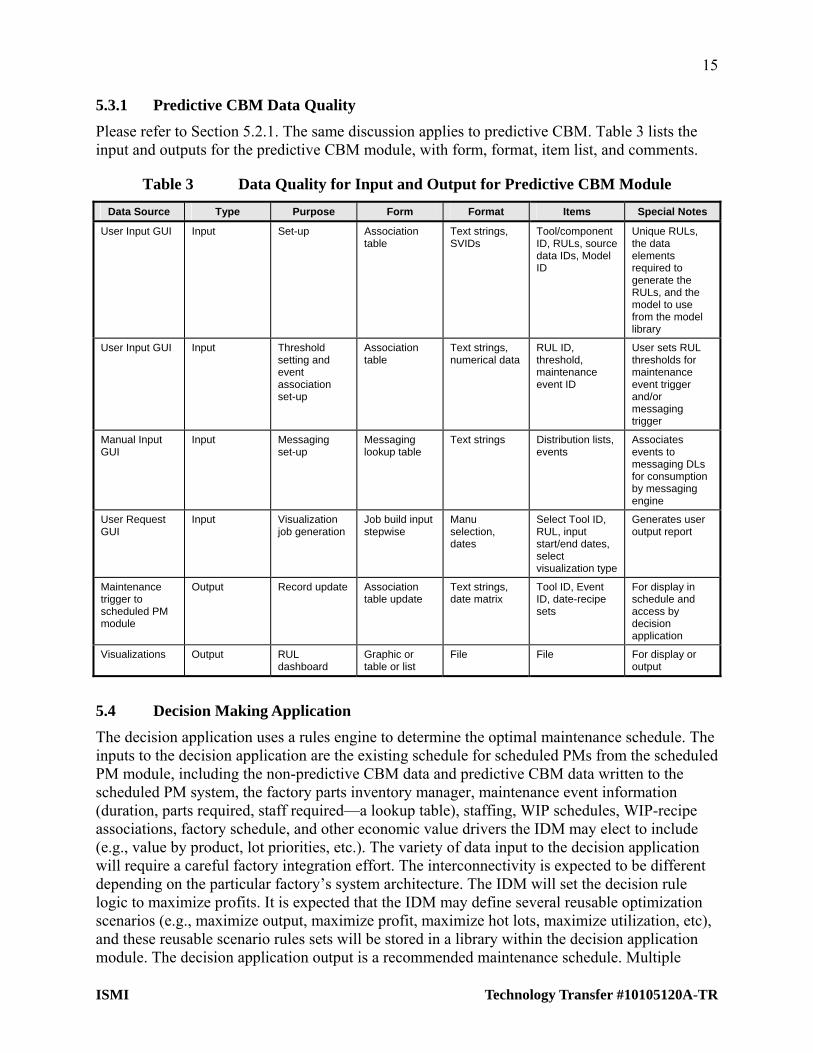
5.3.1 Predictive CBM Data Quality
Please refer to Section 5.2.1. The same discussion applies to predictive CBM. Table 3 lists the input and outputs for the predictive CBM module, with form, format, item list, and comments.
Table 3 Data Quality for Input and Output for Predictive CBM Module
Data Source Type Purpose Form Format Items Special Notes
User Input GUI Input Set-up Association table
Text strings, SVIDs
Tool/component ID, RULs, source data IDs, Model ID
Unique RULs, the data elements required to generate the RULs, and the model to use from the model library
User Input GUI Input Threshold setting and event association set-up
Association table
Text strings, numerical data
RUL ID, threshold, maintenance event ID
User sets RUL thresholds for maintenance event trigger and/or messaging trigger
Manual Input GUI
Input Messaging set-up
Messaging lookup table
Text strings Distribution lists, events
Associates events to messaging DLs for consumption by messaging engine
User Request GUI
Input Visualization job generation
Job build input stepwise
Manu selection, dates
Select Tool ID, RUL, input start/end dates, select visualization type
Generates user output report
Maintenance trigger to scheduled PM module
Output Record update Association table update
Text strings, date matrix
Tool ID, Event ID, date-recipe sets
For display in schedule and access by decision application
Visualizations Output RUL dashboard
Graphic or table or list
File File For display or output
5.4 Decision Making Application
The decision application uses a rules engine to determine the optimal maintenance schedule. The inputs to the decision application are the existing schedule for scheduled PMs from the scheduled PM module, including the non-predictive CBM data and predictive CBM data written to the scheduled PM system, the factory parts inventory manager, maintenance event information (duration, parts required, staff required—a lookup table), staffing, WIP schedules, WIP-recipe associations, factory schedule, and other economic value drivers the IDM may elect to include (e.g., value by product, lot priorities, etc.). The variety of data input to the decision application will require a careful factory integration effort. The interconnectivity is expected to be different depending on the particular factory’s system architecture. The IDM will set the decision rule logic to maximize profits. It is expected that the IDM may define several reusable optimization scenarios (e.g., maximize output, maximize profit, maximize hot lots, maximize utilization, etc), and these reusable scenario rules sets will be stored in a library within the decision application module. The decision application output is a recommended maintenance schedule. Multiple
16
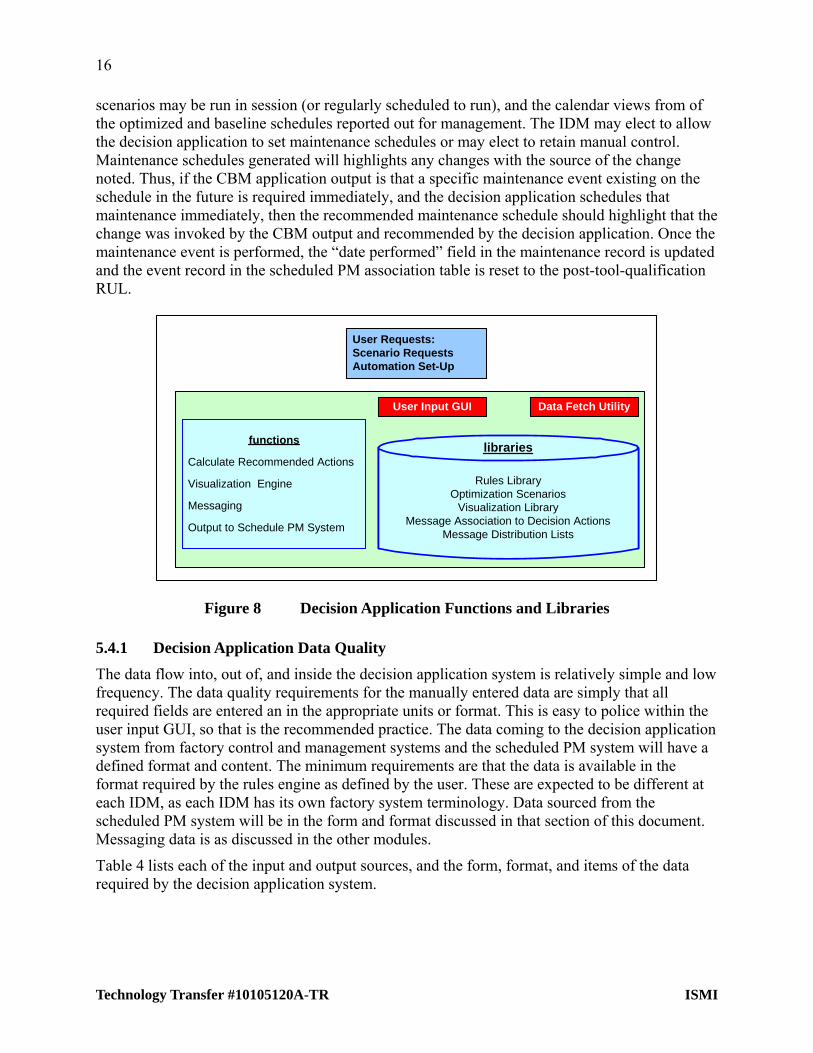
scenarios may be run in session (or regularly scheduled to run), and the calendar views from of the optimized and baseline schedules reported out for management. The IDM may elect to allow the decision application to set maintenance schedules or may elect to retain manual control. Maintenance schedules generated will highlights any changes with the source of the change noted. Thus, if the CBM application output is that a specific maintenance event existing on the schedule in the future is required immediately, and the decision application schedules that maintenance immediately, then the recommended maintenance schedule should highlight that the change was invoked by the CBM output and recommended by the decision application. Once the maintenance event is performed, the “date performed” field in the maintenance record is updated and the event record in the scheduled PM association table is reset to the post-tool-qualification RUL.
Rules LibraryOptimization Scenarios
Visualization LibraryMessage Association to Decision Actions
Message Distribution Lists
functions
Calculate Recommended Actions
Visualization Engine
Messaging
Output to Schedule PM System
User Input GUI Data Fetch Utility
User Requests:Scenario RequestsAutomation Set-Up
libraries
Figure 8 Decision Application Functions and Libraries
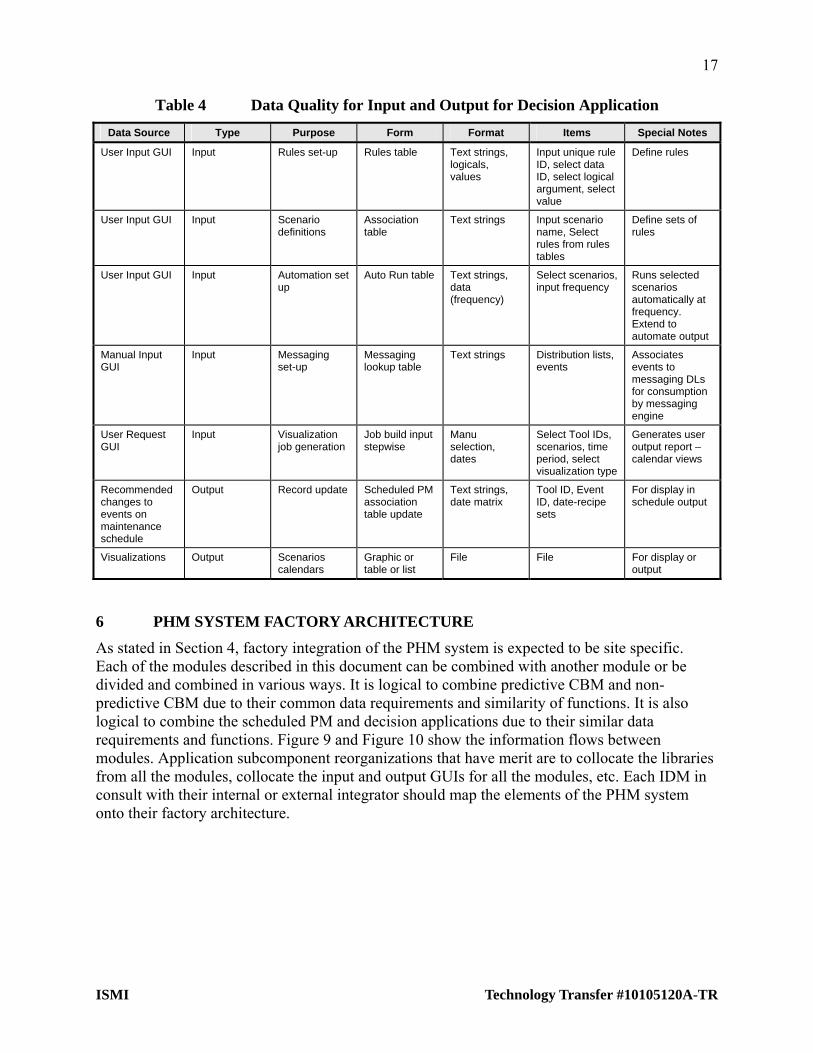
5.4.1 Decision Application Data Quality
The data flow into, out of, and inside the decision application system is relatively simple and low frequency. The data quality requirements for the manually entered data are simply that all required fields are entered an in the appropriate units or format. This is easy to police within the user input GUI, so that is the recommended practice. The data coming to the decision application system from factory control and management systems and the scheduled PM system will have a defined format and content. The minimum requirements are that the data is available in the format required by the rules engine as defined by the user. These are expected to be different at each IDM, as each IDM has its own factory system terminology. Data sourced from the scheduled PM system will be in the form and format discussed in that section of this document. Messaging data is as discussed in the other modules.
Table 4 lists each of the input and output sources, and the form, format, and items of the data required by the decision application system.
Technology Transfer #10105120A-TR ISMI
17
ISMI Technology Transfer #10105120A-TR
Table 4 Data Quality for Input and Output for Decision Application
Data Source Type Purpose Form Format Items Special Notes
User Input GUI Input Rules set-up Rules table Text strings, logicals, values
Input unique rule ID, select data ID, select logical argument, select value
Define rules
User Input GUI Input Scenario definitions
Association table
Text strings Input scenario name, Select rules from rules tables
Define sets of rules
User Input GUI Input Automation set up
Auto Run table Text strings, data (frequency)
Select scenarios, input frequency
Runs selected scenarios automatically at frequency. Extend to automate output
Manual Input GUI
Input Messaging set-up
Messaging lookup table
Text strings Distribution lists, events
Associates events to messaging DLs for consumption by messaging engine
User Request GUI
Input Visualization job generation
Job build input stepwise
Manu selection, dates
Select Tool IDs, scenarios, time period, select visualization type
Generates user output report – calendar views
Recommended changes to events on maintenance schedule
Output Record update Scheduled PM association table update
Text strings, date matrix
Tool ID, Event ID, date-recipe sets
For display in schedule output
Visualizations Output Scenarios calendars
Graphic or table or list
File File For display or output
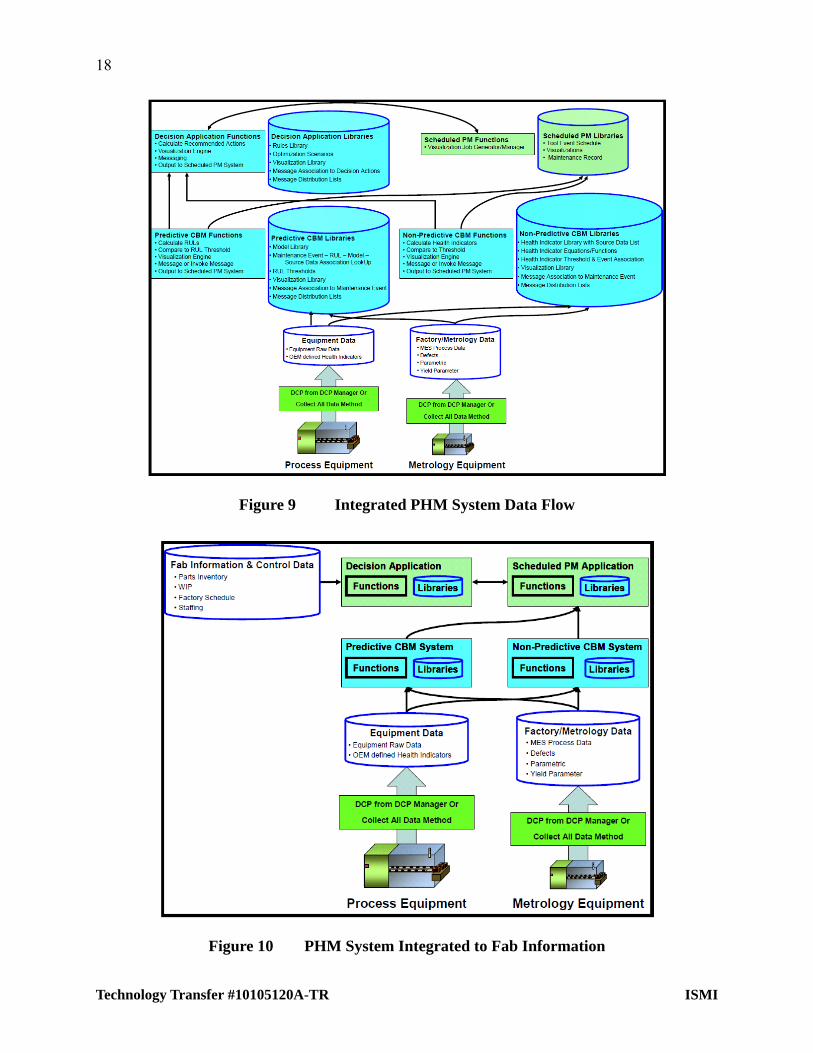
6 PHM SYSTEM FACTORY ARCHITECTURE
As stated in Section 4, factory integration of the PHM system is expected to be site specific. Each of the modules described in this document can be combined with another module or be divided and combined in various ways. It is logical to combine predictive CBM and non-predictive CBM due to their common data requirements and similarity of functions. It is also logical to combine the scheduled PM and decision applications due to their similar data requirements and functions. Figure 9 and Figure 10 show the information flows between modules. Application subcomponent reorganizations that have merit are to collocate the libraries from all the modules, collocate the input and output GUIs for all the modules, etc. Each IDM in consult with their internal or external integrator should map the elements of the PHM system onto their factory architecture.
18
Figure 9 Integrated PHM System Data Flow
Figure 10 PHM System Integrated to Fab Information
Technology Transfer #10105120A-TR ISMI
19
ISMI Technology Transfer #10105120A-TR
7 SUMMARY
PHM calls for a paradigm shift from scheduled preventive maintenance plus unscheduled maintenance towards continuous, data-driven, condition-based monitoring using CBM strategies. Proper application of these CBM strategies in a PHM system with joint production and maintenance scheduling will allow the IDM optimize factory performance. Integration will necessarily be a complicated IDM-specific challenge that can be eased only partially through standardization or modular development strategies. Health assessment, degradation forecasting, maintenance and production scheduling can be merged in a PHM system to raise maintenance activities to next generation standards.
8 REFERENCES
8.1 Documents
SEMI E120: Specification for the Common Equipment Model (CEM)
SEMI E128: Provisional Specification for XML Message Structures
SEMI E125: Specification for Equipment Self Description (EqSD)
SEMI E132: Specification for Equipment Client Authentication and Authorization
SEMI E134: Specification for Data Collection Management
SEMI E138: XML Semiconductor Common Components
SEMI E139: Specification for Recipe and Parameter Management (RaP)
Various AEC/APC Conference Proceedings. (Asia, Europe, U.S., 2005-2008)
W3C: XML Schema Part 2: Datatypes Second Edition
8.2 ISMI Programs/Project Material
[1] ISMI Predictive Preventive Maintenance (PPM) Equipment Implementation Guidelines (SEMATECH Technology Transfer #08064934A-ENG)
[2] 2009 PPM Research White Paper from AWA (TTID 33662)
[3] 2009 Predictive Preventive Maintenance (PPM) Implementation Guideline (TTID 34009TD)


International SEMATECH Manufacturing Initiative Technology Transfer
2706 Montopolis Drive Austin, TX 78741
http://ismi.sematech.org e-mail: [email protected]