is u.s. ceo compensation broken?
TRANSCRIPT
APPLIED CORPORATE FINANCEJournal of
A M O R G A N S T A N L E Y P U B L I C A T I O N
In This Issue: Executive Pay and Corporate Governance
Pay Without Performance: Overview of the Issues 8 Lucian A. Bebchuk, Harvard Law School, and
Jesse M. Fried, University of California at Berkeley
A Remedy for the Executive Pay Problem: The Case for “Compensation Discussion and Analysis”
24 Jeffrey N. Gordon, Columbia University
Developments in Remuneration Policy 36 Alastair Ross Goobey, International Corporate
Governance Network and Morgan Stanley Europe
Corporate Culture and the Problem of Executive Compensation 41 Arthur Levitt, Jr., The Carlyle Group
Taking Shareholder Protection Seriously? Corporate Governance in the U.S. and Germany
44 Theodor Baums, University of Frankfurt, and
Kenneth E. Scott, Stanford Law School and
Hoover Institution
University of Rochester Roundtable onCorporate M&A and Shareholder Value
64 Panelists: Robert Bruner, University of Virginia;
Cliff Smith and Gregg Jarrell, University of Rochester;
James Owen, The Bank Street Group; Marla Sincavage,
Ernst & Young; and Matt Ostrower, Morgan Stanley.
Moderated by Mark Zupan, University of Rochester.
Takeover Defenses and Bargaining Power 85 Guhan Subramanian, Harvard Law School
Is U.S. CEO Compensation Broken? 97 John E. Core and Wayne R. Guay, University of
Pennsylvania, and Randall S. Thomas, Vanderbilt University
Top Management Incentives and Corporate Performance 105 Stephen F. O’Byrne, Shareholder Value Advisors, and
S. David Young, INSEAD
Letting Go of Norm: How Executive Compensation Can Do Better Than “Best Practices”
115 Marc Hodak, Hodak Value Advisors
Finance, Politics, and the Accounting for Stock Options 125 Conrad Ciccotello, Georgia State University,
C. Terry Grant, California State University, Fullerton, and
W. Mark Wilder, University of Mississippi
U.S. Family-Run Companies—They May Be Better Than You Think 134 Henry McVey and Jason Draho, Morgan Stanley
The Limits of Organizational Theory and Incentives (Or, Why Corporate Success Is Not Just About Money)
144 Ronald Schmidt, University of Rochester
VOLUME 17 | NUMBER 4 | FALL 2005
Journal of Applied Corporate Finance • Volume 17 Number 4 A Morgan Stanley Publication • Fall 2005 97
T
Is U.S. CEO Compensation Broken?
by John E. Core and Wayne R. Guay, University of Pennsylvania, and Randall S. Thomas, Vanderbilt University*
ritics of U.S. executive pay practices have raised four major concerns: 1) executive pay is too high; 2) CEO contracts do not provide strong enough incentives to increase value (that is, there is too
little pay for performance); 3) options and other equity-based pay provide “windfalls,” large payoffs that reflect good luck more than good performance; and 4) CEOs have too much freedom to unwind their incentives.1 This negative, and increasingly mainstream, assessment of the state of U.S. executive compensation has led many observers to conclude that executive pay practices are fundamentally flawed and that systemic reform is needed. The purpose of this article is to shed light on some common misconceptions about exec-utive pay and, in so doing, to provide some balance to what we find to be an increasingly one-sided debate.
Before getting into the details, we think it is important to keep in mind a number of facts about the performance of U.S. companies relative to their international competitors. In a recent article in this journal called “The State of U.S. Corpo-rate Governance,” MIT’s Bengt Holmstrom and the University of Chicago’s Steve Kaplan offered the following assessment:
[T]he U.S. stock market has generated returns at least as high as those of the European and Pacific markets during each of the five time periods [we] considered—since 2001, since 1997, since 1992, since 1987, and since 1982…Stock returns…reflect publicly avail-able information about executive compensation…[and,] therefore, are measured net of executive compensation payments. The fact that the shareholders of U.S. companies earned higher returns even after payments to management does not support the claim that the U.S. executive pay system is designed inefficiently; if anything, shareholders appear better off with the U.S. system of executive pay than with the systems that prevail in other countries.2
Our objective in this article is not to convince the reader that U.S. CEO compensation is completely free of problems. Instead, we offer arguments for why observed
practices should not be taken as clear evidence of ineffi-ciency, and how these practices may well be part of a cost-effective contracting environment between companies and their CEOs.
U.S. CEOs Have Substantial Performance IncentivesIn this section, we show that U.S. CEOs do in fact have substantial incentives to increase corporate efficiency and value. We define a CEO as having greater incentives when his or her wealth is more sensitive to changes in a given performance measure, such as the company’s stock returns.
Clearly there are both benefits and costs associated with requiring executives to bear incentive risk. The benefits of incentives come from their ability to encourage CEOs to make decisions that increase firm value. The costs of these incentives stem from the additional risk they impose on CEOs. The additional risk means that CEOs will demand higher levels of total compensation as the risk of their pay packages goes up. If a CEO’s contract imposes too much risk for the total compensation offered, the CEO will either quit and work elsewhere, or will act conservatively to reduce firm risk and may avoid valuable, but risky, new projects. But if the contract offers too much total compensation for the level of risk imposed, then the CEO’s pay could be cut without adversely affecting the probability of retention, or the CEO’s interests will not be sufficiently aligned with those of the shareholders. Thus, incentives can be too low or too high, and the appropriate level of pay depends upon the appropriate level of incentives.
There are two common ways of providing executives with incentives to increase value. One is to make their annual pay (salary and bonus plus any stock or option grants) vary with some measure of operating or stock price performance. The other is to require executives to hold company stock and options, the value of which varies directly with stock price performance.3
* This article draws on our recently published paper, “Is U.S. CEO Compensation Inef-ficient Pay Without Performance?,” Michigan Law Review (May 2005).
1. For example, see J. M. Abowd and D. S. Kaplan, “Executive Compensation: Six Questions That Need Answering,” Journal of Economic Perspectives, Vol. 13 (1999), pp. 145-168; L. A. Bebchuk and J. Fried, Pay without Performance: The Unfulfilled Promise of Executive Compensation (Cambridge, MA: Harvard University Press, 2004); and M. C. Jensen, K. J. Murphy, and E. G. Wruck, “Remuneration: Where We’ve Been, How We Got
to Here, What Are the Problems, and How to Fix Them,” Harvard NOM Working Paper No. 04-28; ECGI - Finance Working Paper No. 44/2004 (2004).
2. Bengt Holmstrom and Steven N. Kaplan, “The State of U.S. Corporate Governance: What’s Right and What’s Wrong?,” Journal of Applied Corporate Finance, Vol. 15, No. 3 (Spring 2003), p. 9.
3. In a discussion of executive compensation, it is important to distinguish between the executive’s “pay” and the executive’s “incentives.” We define incentives as the >>
C

98 Journal of Applied Corporate Finance • Volume 17 Number 4 A Morgan Stanley Publication • Fall 2005
We will show that these two methods can provide identical incentives. This illustration is instructive because many critics focus exclusively on the performance compo-nent of annual pay, which, as stated, consists mainly of salary, bonus, and new grants of stock and options. Such critics often argue that CEO annual pay does not appear particularly sensitive to firm performance. For example, a given CEO’s pay might consist of $1 million in salary, a $2 million bonus, and $2 million in option grants in a good year (say a 20% increase in stock price), and fall to $1 million in salary, a $1.5 million bonus, and $1.5 million in option grants in a bad year (say a 10% decrease in stock price). If salary, bonus, and option grants were the only components of the CEO’s compensation contract, one might conclude from the $1.0 million difference in pay between good and bad years that this pay package is relatively insensitive to performance.
But, as we point out below, if this CEO also holds $25 million in stock and previously granted options, he or she has very strong incentives to increase value, far greater than what could reasonably be provided through variation in annual pay. If the return to shareholders was -10% instead of 20%, the CEO’s portfolio would experience a $2.5 million loss instead of a $5 million gain—a difference of $7.5 million.
To see this point more clearly, suppose that a board of directors wants to provide incentives for its CEO to outper-form the market. To do this, it focuses on market-adjusted stock returns, measured as the difference between the return on the firm’s stock and the return on a broad market index. For simplicity, assume that the expected return on the firm’s stock is the same as the expected return on the market (that is, the firm has an equity beta of one). Suppose further that the CEO is worth $20 million and prefers to hold this wealth in a well-diversified portfolio that mimics the market index. Assume also that the board has decided that the right package of incentives for this CEO is one in which the CEO’s wealth increases by $100,000 for every percentage point by which the company’s stock return outperforms the market return, and drops by $100,000 for every percentage point the stock underperforms. For example, if the company’s stock return is 5% and the market return is 10%, the board wants the CEO’s wealth
to decrease by $500,000. Finally, assume that this CEO requires $2 million in annual compensation to work for the firm under these conditions. We emphasize here that the contract we use in our example rewards the CEO only when the company’s performance exceeds market performance (that is, the contract has no “windfalls”).
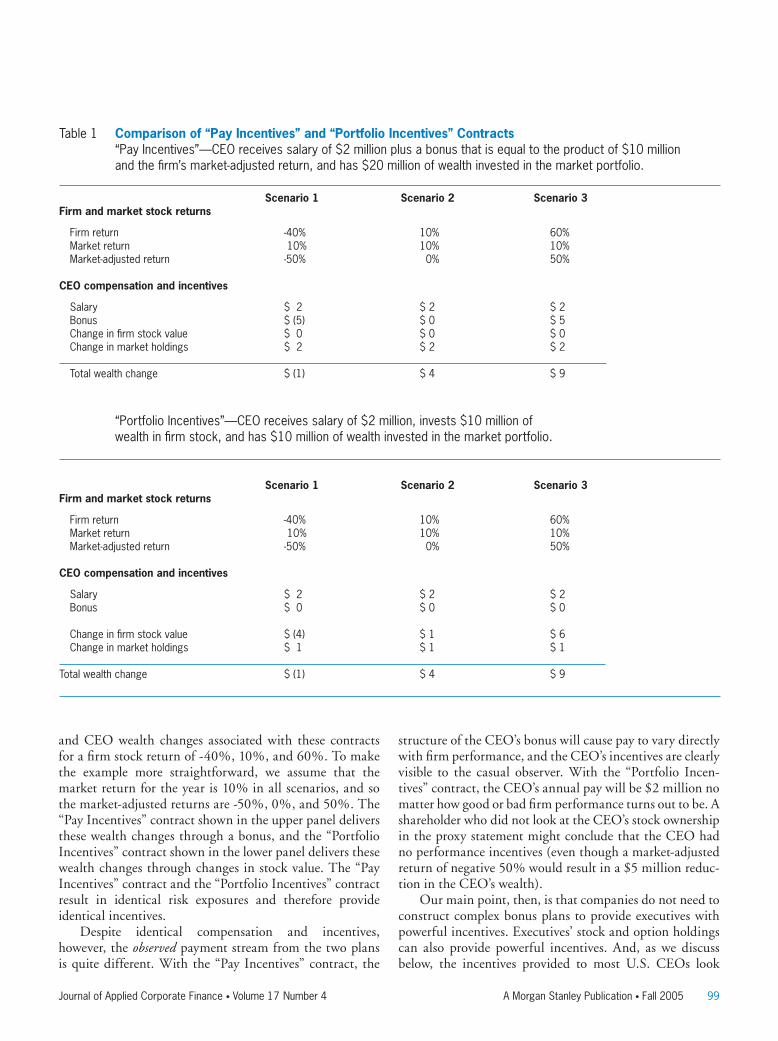
There are two different kinds of contracts that can be used to achieve these incentives—and let’s call them “Pay Incentives” and “Portfolio Incentives.” To illustrate these contracts, assume that the “Pay Incentives” contract consists of a salary of $2 million and a bonus equal to the product of $10 million and the company’s market-adjusted return. This bonus would cause the CEO’s wealth to change by $100,000 for each 1% deviation between the stock return and the market return ($10 million x 1% = $100,000). Note, moreover, that the expected bonus is zero since the expected return on the firm’s stock is the same as the expected return on the market. Let’s assume further that if the firm’s stock return is less than the market return (that is, the market-adjusted return is negative), the bonus would actually be negative. For example, as shown in Table 1, if the market-adjusted return is -50%, the CEO would have to pay the firm $5 million.4 The CEO’s expected pay from this contract is $2 million ($2 million salary + an expected bonus of zero).
To illustrate the “Portfolio Incentives” contract, we assume the firm requires the CEO to maintain $10 million in company stock (that is, half of his $20 million wealth) and pays the CEO a salary of $2 million, but does not have a bonus plan.5 By holding the $10 million position in company stock, the CEO is effectively forgoing the return on the market portfolio (which is where the CEO would like to hold all of his or her wealth). Thus, this contract also has a payoff of $100,000 for each 1% deviation between the firm return and the market return ($10 million times the market-adjusted return). Again, under the assumption that the expected returns are the same for the firm and the market, the CEO’s expected pay from this plan is $2 million ($2 million in salary).
Table 1 shows that these two contracts provide identical incentives, as measured by the change in CEO wealth for each 1% difference between the return on the firm’s stock return and the market return. The table displays payments
sensitivity of executive wealth to changes in performance, and we define pay (cash, stock, options, etc.) as the remuneration that the executive receives for the labor he or she provides the firm and the risk premium he or she demands given the imposed incentive risk. A major source of incentives is stock and options owned by the executive, which change in value when the stock price changes. Pay in the form of stock or options does not necessarily imply an increase in incentives, just as cash pay does not necessarily imply the absence of incentives. As we will illustrate below, cash pay can be structured to provide powerful incentives. Pay in the form of stock or options only provides additional incentives when either 1) the value of the stock or options granted from year to year var-ies with the executive’s performance or 2) a new grant of stock or options increases the sensitivity of the executive’s wealth to the firm’s stock price. Empirically, the former is only weakly descriptive of the data, and the latter applies only to executives who hold smaller portfolios of stock and options than their peers.
4. We recognize that although there is nothing to prevent companies from using nega-tive bonuses, they generally do not do so. Our illustration requires a negative bonus in order to generate the same negative wealth changes for poor performance that can be achieved with equity ownership incentives. For our purposes, the key point is simply that a bonus plan can be structured with high-powered incentives that mimic the incentives in equity holdings.
5. For purposes of our illustration, it does not matter precisely how the CEO satisfies the contractual requirement to hold $10 million in firm stock, whether by liquidating out-side wealth and investing it directly in firm stock, or after a “ramp up” period by allowing the firm to weight compensation in the early years of the contract toward equity pay. What is important for our illustration is simply that our CEO has settled into a portfolio position that satisfies the contractual obligation to maintain half of the CEO’s wealth in firm stock.
Journal of Applied Corporate Finance • Volume 17 Number 4 A Morgan Stanley Publication • Fall 2005 99
and CEO wealth changes associated with these contracts for a firm stock return of -40%, 10%, and 60%. To make the example more straightforward, we assume that the market return for the year is 10% in all scenarios, and so the market-adjusted returns are -50%, 0%, and 50%. The “Pay Incentives” contract shown in the upper panel delivers these wealth changes through a bonus, and the “Portfolio Incentives” contract shown in the lower panel delivers these wealth changes through changes in stock value. The “Pay Incentives” contract and the “Portfolio Incentives” contract result in identical risk exposures and therefore provide identical incentives.
Despite identical compensation and incentives, however, the observed payment stream from the two plans is quite different. With the “Pay Incentives” contract, the
structure of the CEO’s bonus will cause pay to vary directly with firm performance, and the CEO’s incentives are clearly visible to the casual observer. With the “Portfolio Incen-tives” contract, the CEO’s annual pay will be $2 million no matter how good or bad firm performance turns out to be. A shareholder who did not look at the CEO’s stock ownership in the proxy statement might conclude that the CEO had no performance incentives (even though a market-adjusted return of negative 50% would result in a $5 million reduc-tion in the CEO’s wealth).
Our main point, then, is that companies do not need to construct complex bonus plans to provide executives with powerful incentives. Executives’ stock and option holdings can also provide powerful incentives. And, as we discuss below, the incentives provided to most U.S. CEOs look
Table 1 Comparison of “Pay Incentives” and “Portfolio Incentives” Contracts “Pay Incentives”—CEO receives salary of $2 million plus a bonus that is equal to the product of $10 million
and the firm’s market-adjusted return, and has $20 million of wealth invested in the market portfolio.
Scenario 1 Scenario 2 Scenario 3Firm and market stock returns
Firm return -40% 10% 60% Market return 10% 10% 10% Market-adjusted return -50% 0% 50% CEO compensation and incentives
Salary $ 2 $ 2 $ 2 Bonus $ (5) $ 0 $ 5 Change in firm stock value $ 0 $ 0 $ 0 Change in market holdings $ 2 $ 2 $ 2 Total wealth change $ (1) $ 4 $ 9
“Portfolio Incentives”—CEO receives salary of $2 million, invests $10 million of
wealth in firm stock, and has $10 million of wealth invested in the market portfolio.
Scenario 1 Scenario 2 Scenario 3Firm and market stock returns
Firm return -40% 10% 60% Market return 10% 10% 10% Market-adjusted return -50% 0% 50% CEO compensation and incentives
Salary $ 2 $ 2 $ 2 Bonus $ 0 $ 0 $ 0 Change in firm stock value $ (4) $ 1 $ 6 Change in market holdings $ 1 $ 1 $ 1
Total wealth change $ (1) $ 4 $ 9
100 Journal of Applied Corporate Finance • Volume 17 Number 4 A Morgan Stanley Publication • Fall 2005
much more like those in the “Portfolio Incentives” contract than in the “Pay Incentives” contract.6
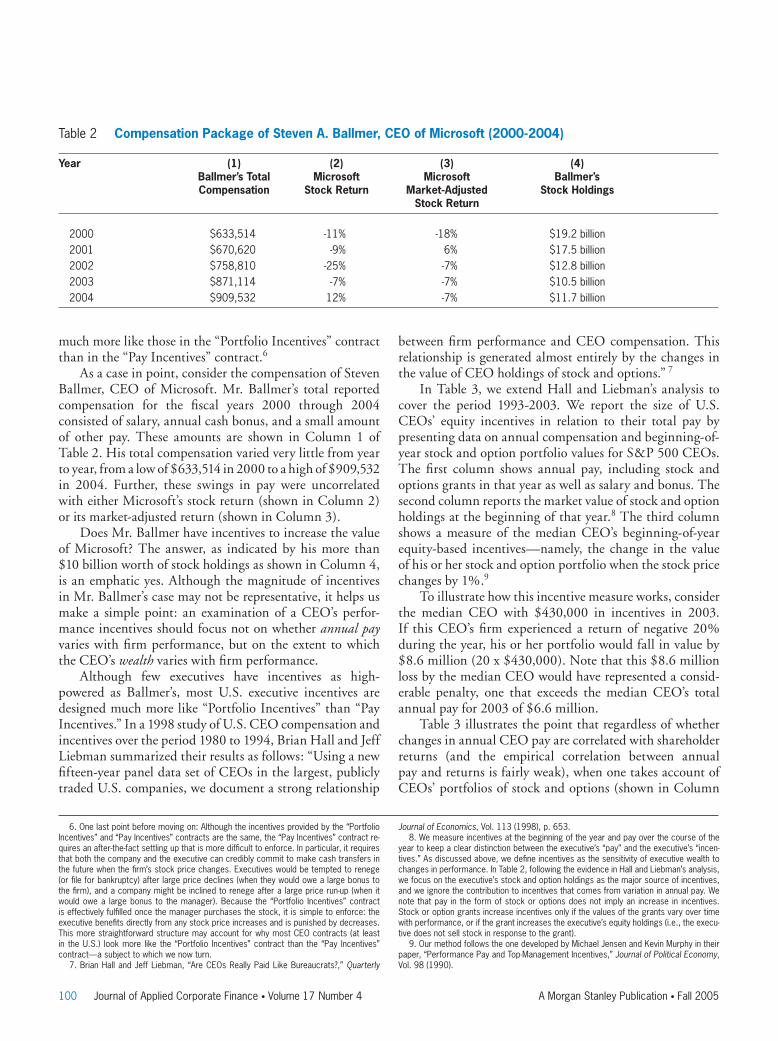
As a case in point, consider the compensation of Steven Ballmer, CEO of Microsoft. Mr. Ballmer’s total reported compensation for the fiscal years 2000 through 2004 consisted of salary, annual cash bonus, and a small amount of other pay. These amounts are shown in Column 1 of Table 2. His total compensation varied very little from year to year, from a low of $633,514 in 2000 to a high of $909,532 in 2004. Further, these swings in pay were uncorrelated with either Microsoft’s stock return (shown in Column 2) or its market-adjusted return (shown in Column 3).
Does Mr. Ballmer have incentives to increase the value of Microsoft? The answer, as indicated by his more than $10 billion worth of stock holdings as shown in Column 4, is an emphatic yes. Although the magnitude of incentives in Mr. Ballmer’s case may not be representative, it helps us make a simple point: an examination of a CEO’s perfor-mance incentives should focus not on whether annual pay varies with firm performance, but on the extent to which the CEO’s wealth varies with firm performance.
Although few executives have incentives as high-powered as Ballmer’s, most U.S. executive incentives are designed much more like “Portfolio Incentives” than “Pay Incentives.” In a 1998 study of U.S. CEO compensation and incentives over the period 1980 to 1994, Brian Hall and Jeff Liebman summarized their results as follows: “Using a new fifteen-year panel data set of CEOs in the largest, publicly traded U.S. companies, we document a strong relationship
between firm performance and CEO compensation. This relationship is generated almost entirely by the changes in the value of CEO holdings of stock and options.” 7
In Table 3, we extend Hall and Liebman’s analysis to cover the period 1993-2003. We report the size of U.S. CEOs’ equity incentives in relation to their total pay by presenting data on annual compensation and beginning-of-year stock and option portfolio values for S&P 500 CEOs. The first column shows annual pay, including stock and options grants in that year as well as salary and bonus. The second column reports the market value of stock and option holdings at the beginning of that year.8 The third column shows a measure of the median CEO’s beginning-of-year equity-based incentives—namely, the change in the value of his or her stock and option portfolio when the stock price changes by 1%.9
To illustrate how this incentive measure works, consider the median CEO with $430,000 in incentives in 2003. If this CEO’s firm experienced a return of negative 20% during the year, his or her portfolio would fall in value by $8.6 million (20 x $430,000). Note that this $8.6 million loss by the median CEO would have represented a consid-erable penalty, one that exceeds the median CEO’s total annual pay for 2003 of $6.6 million.
Table 3 illustrates the point that regardless of whether changes in annual CEO pay are correlated with shareholder returns (and the empirical correlation between annual pay and returns is fairly weak), when one takes account of CEOs’ portfolios of stock and options (shown in Column
6. One last point before moving on: Although the incentives provided by the “Portfolio Incentives” and “Pay Incentives” contracts are the same, the “Pay Incentives” contract re-quires an after-the-fact settling up that is more difficult to enforce. In particular, it requires that both the company and the executive can credibly commit to make cash transfers in the future when the firm’s stock price changes. Executives would be tempted to renege (or file for bankruptcy) after large price declines (when they would owe a large bonus to the firm), and a company might be inclined to renege after a large price run-up (when it would owe a large bonus to the manager). Because the “Portfolio Incentives” contract is effectively fulfilled once the manager purchases the stock, it is simple to enforce: the executive benefits directly from any stock price increases and is punished by decreases. This more straightforward structure may account for why most CEO contracts (at least in the U.S.) look more like the “Portfolio Incentives” contract than the “Pay Incentives” contract—a subject to which we now turn.
7. Brian Hall and Jeff Liebman, “Are CEOs Really Paid Like Bureaucrats?,” Quarterly
Journal of Economics, Vol. 113 (1998), p. 653.8. We measure incentives at the beginning of the year and pay over the course of the
year to keep a clear distinction between the executive’s “pay” and the executive’s “incen-tives.” As discussed above, we define incentives as the sensitivity of executive wealth to changes in performance. In Table 2, following the evidence in Hall and Liebman’s analysis, we focus on the executive’s stock and option holdings as the major source of incentives, and we ignore the contribution to incentives that comes from variation in annual pay. We note that pay in the form of stock or options does not imply an increase in incentives. Stock or option grants increase incentives only if the values of the grants vary over time with performance, or if the grant increases the executive’s equity holdings (i.e., the execu-tive does not sell stock in response to the grant).
9. Our method follows the one developed by Michael Jensen and Kevin Murphy in their paper, “Performance Pay and Top-Management Incentives,” Journal of Political Economy, Vol. 98 (1990).
Table 2 Compensation Package of Steven A. Ballmer, CEO of Microsoft (2000-2004)
Year (1) (2) (3) (4) Ballmer’s Total Microsoft Microsoft Ballmer’s Compensation Stock Return Market-Adjusted Stock Holdings Stock Return
2000 $633,514 -11% -18% $19.2 billion 2001 $670,620 -9% 6% $17.5 billion 2002 $758,810 -25% -7% $12.8 billion 2003 $871,114 -7% -7% $10.5 billion 2004 $909,532 12% -7% $11.7 billion
Journal of Applied Corporate Finance • Volume 17 Number 4 A Morgan Stanley Publication • Fall 2005 101
2), the potential gains to most CEOs from increasing share values are clearly considerable.
Are U.S. CEOs Overpaid? The popular focal point of the criticism about executive pay is the contention that U.S. CEOs are overpaid. The obvious question here is: “Overpaid compared to what?”
The appropriate level of CEO pay can be thought of as consisting of two components: 1) the market wage of the CEO based on skill, reputation, expected productivity, and outside employment opportunities; and 2) a premium for bearing incentive risk. As discussed above, a risk-averse executive will demand greater compensation as the firm requires the executive to bear greater incentive risk, other things equal. For example, a CEO who is required to bear incentives that cause his or her wealth to fluctu-ate by $500,000 per 1% change in stock price will require more total pay than if the CEO’s wealth fluctuated by only $100,000 per 1% change in stock price.
Misconceptions about the appropriateness of U.S. CEO pay levels arise from the failure to consider the extent of equity-based incentives, and the resulting demand for higher total pay. To illustrate this point, consider the fact that U.S. CEOs have higher annual pay than their European
and Japanese counterparts, and that these differences are frequently cited by critics as evidence that U.S. CEOs are overpaid. What most critics fail to consider is that U.S. CEOs’ higher annual pay could conceivably be justified by the larger equity-based incentives and the associated risk borne by U.S. CEOs.10 A recent study involving two of the present writers reported that U.S. CEOs in 2003 were paid about 1.6 times more than their British counterparts, but that U.S. CEOs also held 5.2 times more stock and options. Given the larger incentives held by U.S. CEOs, it is not clear that U.S. CEOs receive excessive annual pay relative to their British counterparts.
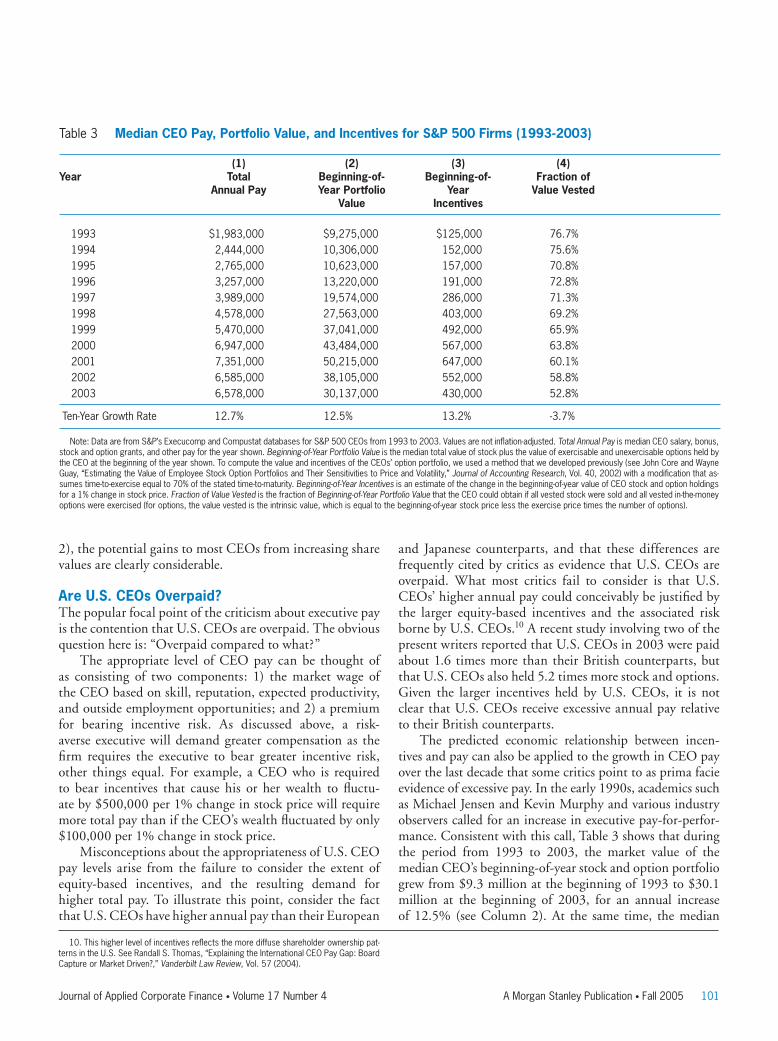
The predicted economic relationship between incen-tives and pay can also be applied to the growth in CEO pay over the last decade that some critics point to as prima facie evidence of excessive pay. In the early 1990s, academics such as Michael Jensen and Kevin Murphy and various industry observers called for an increase in executive pay-for-perfor-mance. Consistent with this call, Table 3 shows that during the period from 1993 to 2003, the market value of the median CEO’s beginning-of-year stock and option portfolio grew from $9.3 million at the beginning of 1993 to $30.1 million at the beginning of 2003, for an annual increase of 12.5% (see Column 2). At the same time, the median
10. This higher level of incentives reflects the more diffuse shareholder ownership pat-terns in the U.S. See Randall S. Thomas, “Explaining the International CEO Pay Gap: Board Capture or Market Driven?,” Vanderbilt Law Review, Vol. 57 (2004).
Table 3 Median CEO Pay, Portfolio Value, and Incentives for S&P 500 Firms (1993-2003)
(1) (2) (3) (4) Year Total Beginning-of- Beginning-of- Fraction of Annual Pay Year Portfolio Year Value Vested Value Incentives
1993 $1,983,000 $9,275,000 $125,000 76.7%1994 2,444,000 10,306,000 152,000 75.6%1995 2,765,000 10,623,000 157,000 70.8%1996 3,257,000 13,220,000 191,000 72.8%1997 3,989,000 19,574,000 286,000 71.3%1998 4,578,000 27,563,000 403,000 69.2%1999 5,470,000 37,041,000 492,000 65.9%2000 6,947,000 43,484,000 567,000 63.8%2001 7,351,000 50,215,000 647,000 60.1%2002 6,585,000 38,105,000 552,000 58.8%2003 6,578,000 30,137,000 430,000 52.8%
Ten-Year Growth Rate 12.7% 12.5% 13.2% -3.7%
Note: Data are from S&P’s Execucomp and Compustat databases for S&P 500 CEOs from 1993 to 2003. Values are not inflation-adjusted. Total Annual Pay is median CEO salary, bonus, stock and option grants, and other pay for the year shown. Beginning-of-Year Portfolio Value is the median total value of stock plus the value of exercisable and unexercisable options held by the CEO at the beginning of the year shown. To compute the value and incentives of the CEOs’ option portfolio, we used a method that we developed previously (see John Core and Wayne Guay, “Estimating the Value of Employee Stock Option Portfolios and Their Sensitivities to Price and Volatility,” Journal of Accounting Research, Vol. 40, 2002) with a modification that as-sumes time-to-exercise equal to 70% of the stated time-to-maturity. Beginning-of-Year Incentives is an estimate of the change in the beginning-of-year value of CEO stock and option holdings for a 1% change in stock price. Fraction of Value Vested is the fraction of Beginning-of-Year Portfolio Value that the CEO could obtain if all vested stock were sold and all vested in-the-money options were exercised (for options, the value vested is the intrinsic value, which is equal to the beginning-of-year stock price less the exercise price times the number of options).
102 Journal of Applied Corporate Finance • Volume 17 Number 4 A Morgan Stanley Publication • Fall 2005
incentives provided by the CEOs’ beginning-of-year stock and option portfolios increased from $125,000 for each 1% increase in the stock price in 1993 to $430,000 in 2003, representing annual growth of 13.2% (see Column 3).
If the efficiency of CEO compensation contracts calls for an increase in the incentive risk borne by CEOs over time, an increase in annual pay will be required to achieve this end. Thus, one cannot identify the growth in pay as a problem without considering the accompanying growth in incentives. A significant growth in pay without a corre-sponding increase in incentive risk borne by executives would lead economists to suspect a problem with either the level of pay or the level of incentives. However, a simulta-neous increase in the level of pay and incentives is at least consistent with efficient contracting.
Table 3 shows that, during the period 1993-2003, high pay growth went hand-in-hand with high growth in incen-tives. As shown in Column 1, the median CEO’s total pay increased from $2 million in 1993 to $6.6 million in 2003, an annual increase of 12.7% over the ten-year period and nearly identical to the 12.5% growth rate in stock and option holdings shown in Column 2.
We also note that, during this time period, the market value of the median S&P 500 company increased from $3.6 billion in 1993 to $9.1 billion in 2003. Empirical evidence suggests that both CEO pay and target incentives increase with the size and complexity of the firm (pay because these variables capture variation in the required market wage, and incentives because these variables capture variation in the difficulty the boards have in monitoring CEOs).
In summary, while we cannot prove that U.S. CEO pay levels or growth in pay are optimal or value-maximizing, our finding that pay, incentives, and firm size have grown at the same rate during the last decade or so is at least consistent with this proposition. That is, the growth in U.S. executive pay during the 1990s may represent a cost-effective response to two major changes: 1) investor demand for U.S. CEOs to bear greater equity risk; and 2) an increase in the size and complexity of U.S. companies, with a resulting increase in the demand for exceptionally capable CEOs. And as we mentioned at the outset of this article, the productiv-ity of the U.S. economy and the stock market performance of U.S. companies over this period provide no grounds for believing that U.S. pay practices are less cost-effective than those of their international competitors.
Should Equity Incentives Be Indexed to Eliminate “Windfalls”?We turn next to the critics’ argument that the design of stock
and option plans should be changed to ensure that executives are not rewarded mainly for favorable market- and sector-wide movements in stock prices. As we argue below, we feel that this criticism reflects a failure to appreciate what we view as a fundamental strength of equity-based incentives.
Critics of non-market-adjusted stock and options argue that they reward good luck rather than good performance, and that the indexing of stock and options to adjust for market performance is necessary to remove the possibility of excess pay due to this market exposure. To explain why this criticism is likely to be misguided, let us go back to the “Portfolio Incentives” plan described above. It is true, as critics claim, that much of the change in the value of stock and option portfolios will be caused by market- and indus-try-wide events beyond management’s control. What most people fail to recognize, however, is the extent to which the “Portfolio Incentives” contract increases the manager’s exposure to firm-specific performance. Moreover, as we will show below, this increase in exposure is effectively accom-plished without changing the manager’s market exposure.
To see this, remember that the CEO in Table 1 above, with the “Portfolio Incentives” plan, has $20 million in total wealth that he or she would prefer to invest in the market portfolio. The CEO’s “Portfolio Incentives” contract instead requires maintaining $10 million of that wealth in firm stock. That is, the contract requires holding $10 million less of the market portfolio and $10 million more of firm stock than the CEO would prefer. Next consider that the company’s stock return Rfirm
can be thought of as having two components: the market return and the firm-specific (or net-of-market) return. In equation form, Rfirm
= Rmarket + (Rfirm – Rmarket).
Although the executive would prefer to hold a portfo-lio that earns the market return ($20 million x Rmarket), the contract requires holding a portfolio weighted toward the firm’s stock return [($10 million x Rfirm) + ($10 million x Rmarket)], which is the same as holding $20 million in the market portfolio and $10 million in a security whose return is Rfirm – Rmarket.
11 The key insight here is that this latter security has the same payoffs as the indexed security that compensation critics have been calling for.
Thus, when one starts by recognizing a CEO’s prefer-ence for holding a diversified portfolio rather than company stock or options, it is easier to see why firms might avoid market-adjusting executive stock and options. This practice is consistent with an optimal contracting perspective that attempts to balance two conflicting demands: shareholders’ interest in giving CEOs incentives to increase value, and CEOs’ preference to hold a significant part of their wealth
11. The idea that non-indexed grants of stock and options do not impose excess market risk on executives is becoming well recognized. See John E. Core, Wayne R. Guay, and David F. Larcker, “Executive Equity Compensation and Incentives: A Survey,” Federal Reserve Bank of New York Economic Policy Review, Vol. 9 (2003); Gerald Garvey
and Todd Milbourn, “Executive Compensation When Executives Can Hedge the Market: Evidence of Relative Performance Evaluation in the Cross Section,” Journal of Finance, Vol. 58 (2003); and Li Jin, “CEO Compensation, Diversification, and Incentives,” Journal of Financial Economics, Vol. 66 (2002).
Journal of Applied Corporate Finance • Volume 17 Number 4 A Morgan Stanley Publication • Fall 2005 103
in well-diversified portfolios. And thus the advantage of equity-based incentives that are not indexed may be their ability to expose CEOs to what proves to be an optimal mix of market risk—their preferred risk exposure—and firm-specific risk, which supplies most of the incentive to increase efficiency and value.
Do U.S. CEOs “Unwind” Their Incentives?The exercise of executive stock options and the sale of stock by CEOs are frequently cited as evidence that CEOs have too much freedom to exploit their informational advantage over investors by “timing” their sales and unwinding their incentives. But given the natural preference to diversify one’s portfolio, decisions to sell stock by executives are not at all surprising. And if CEOs were allowed complete freedom to diversify their portfolios, many if not most would likely avoid accumulating substantial quantities of firm-specific equity. Indeed, from a pure wealth management perspec-tive, one would expect CEOs to sell restricted stock shortly after vesting, and to exercise options (and sell the stock) as options become exercisable and sufficiently in the money to reap a reasonable fraction of the options’ value.12
But the evidence provides little support for the claim that executives behave this way. First of all, the level of CEO equity holdings, which continues to be larger in the U.S. than in any other country, has risen substantially in the last 20 years and shows no sign of declining. In 2003, the median CEO held more than $30 million in stock and options, a dollar amount roughly five times the median annual pay. In fact, roughly 20% of all CEOs with three or more years of tenure held stock and options with value in excess of 15 times annual pay. Moreover, as can be seen in the last column of Table 3, in 2003 the median CEO could have (but presumably chose not to) realized 53% of his or her company-specific wealth by exercising and selling vested stock and options.13 These large equity holdings and their increase in value over time suggest that a powerful force, likely an implicit or explicit contrac-tual agreement, is restraining CEOs from selling their vested stock and options.14
A further point on unwinding incentives is that, in some cases, it is optimal for the firm to allow and even encourage the CEO to sell equity. For example, consider the case in
which the stock price has risen substantially faster than the market over a number of years. As the portfolio of stock and options becomes a greater proportion of the CEO’s overall wealth, incentive risk could increase beyond the optimal level. In addition to the higher risk premiums the CEO will demand, unnecessarily high incentives can also cause the CEO to behave in an overly risk-averse manner, shunning valuable but risky projects. In such cases, it may be optimal to allow the CEO to exercise options and sell stock for portfolio rebalancing purposes.
Further, restricted stock and options are sometimes granted for reasons other than to increase incentives, such as for tax and financial accounting benefits, or to ease cash constraints.15 For example, Michael Dell, founder and former CEO of Dell, Inc., routinely received large stock option grants even though he owned several billion dollars of Dell stock and clearly had sufficient equity incentives. When equity pay is used for reasons other than to increase incentives, CEOs should be allowed to rebalance their portfolios. Consistent with this argument, a recent study suggests that executives with higher levels of stock ownership sell stock to “undo” the new risk imposed by equity grants.16
Conclusion In this article, we address four major concerns about the pay of U.S. CEOs: 1) failure to pay for performance; 2) excessive levels of pay; 3) failure to index options and other equity-based pay, resulting in “windfalls”; and 4) too much unwinding of incentives. Most if not all of these concerns are exaggerated by the popular tendency to focus on the annual income of CEOs (consisting of salary, bonus, and new stock and option grants) while ignoring their existing holdings of company equity.
Taking into account the effect of stock price changes on CEO wealth leads us to a number of interesting findings.
• First, the strength of the pay-for-performance relation-ship is large and has grown significantly in recent years.
• Second, what may appear to be above-normal growth in levels of annual CEO pay may well be necessary to compensate for the increased risk associated with the CEOs’ growing level of equity-based incentives.
• Third, viewed as a combination of market risk and
12. It is true that a CEO may be reluctant to sell large quantities of stock or exercise large quantities of options due to concerns about sending a negative signal to the market about the company’s financial condition. To substantially mitigate this problem, executives can carry out a personal trading program that meets the requirements of SEC Rule 10b5-1. This rule requires the executive to enter into a binding contract that specifies in ad-vance the amount and timing of equity sales. By announcing equity sales well in advance, the executive can reduce or eliminate the signaling effects of these sales.
13. Although there is a declining trend in the percentage of value vested during this time period, executives are holding much more equity now than in 1993. Thus, the dollar value of their vested holdings is far greater today than it was ten years ago, even though the fraction of value vested is lower.
14. Some of these CEOs could be hedging the firm-specific risk in their equity portfo-lios through derivative securities such as caps and collars that are negatively correlated with firm-specific price changes. These instruments can reduce the CEO’s exposure to
the firm’s stock price and the price-based incentives provided by their portfolios. Recent research indicates that some CEOs use these techniques, but the small sample size sug-gests that this behavior is limited; see J. Bettis, J. Bizjak, and M. Lemmon, “Managerial Ownership, Incentive Contracting, and the Use of Zero-Cost Collars and Equity Swaps by Corporate Insiders,” Journal of Financial and Quantitative Analysis, Vol. 36 (2001). Although it is possible that some CEOs engage in this behavior and do not file required SEC disclosures, the fact that secret hedging activities violate SEC disclosure and insider trading rules reduces the likelihood that this behavior is widespread.
15. These points are made in recent research; see B. Hall and K. Murphy, “The Trouble with Stock Options,” Journal of Economic Perspectives, Vol. 49 (2003), and Core, Guay, and Larcker (2003), cited earlier.
16. E. Ofek and D. Yermack, “Taking Stock: Equity-Based Compensation and the Evolu-tion of Managerial Ownership,” Journal of Finance, Vol. 55 (2000).
104 Journal of Applied Corporate Finance • Volume 17 Number 4 A Morgan Stanley Publication • Fall 2005
firm-specific risk, conventional (that is, unindexed) stock and options may provide an optimal solution to two conflicting demands: 1) shareholders’ demand for executive rewards tied to company performance; and 2) executives’ preference to diversify their wealth.
• Fourth, U.S. CEOs show little evidence of widespread “unwinding” of incentives. Further, CEOs can sometimes have too much company-specific wealth and income, in which case it is appropriate to allow and encourage the CEO to exercise options and sell stock for portfolio rebal-ancing purposes.
john core is Associate Professor of Accounting, The Wharton School, University of Pennsylvania.
wayne guay is Associate Professor of Accounting, The Wharton School, University of Pennsylvania.
randall thomas is John S. Beasley II Professor of Law and Busi-ness, Vanderbilt University School of Law.

Journal of Applied Corporate Finance (ISSN 1078-1196 [print], ISSN 1745-6622 [online]) is published quarterly on behalf of Morgan Stanley by Blackwell Publishing, with offi ces at 350 Main Street, Malden, MA 02148, USA, and PO Box 1354, 9600 Garsington Road, Oxford OX4 2XG, UK. Call US: (800) 835-6770, UK: +44 1865 778315; fax US: (781) 388-8232, UK: +44 1865 471775.
Information for Subscribers For new orders, renewals, sample copy re-quests, claims, changes of address, and all other subscription correspon-dence, please contact the Customer Service Department at your nearest Blackwell offi ce (see above) or e-mail [email protected].
Subscription Rates for Volume 17 (four issues) Institutional Premium Rate* The Americas† $330, Rest of World £201; Commercial Company Pre-mium Rate, The Americas $440, Rest of World £268; Individual Rate, The Americas $95, Rest of World £53, Ð80‡; Students**, The Americas $50, Rest of World £28, Ð42.
*Includes print plus premium online access to the current and all available backfi les. Print and online-only rates are also available (see below).
†Customers in Canada should add 7% GST or provide evidence of entitlement to exemption.
‡Customers in the UK should add VAT at 5%; customers in the EU should also add VAT at 5%, or provide a VAT registration number or evidence of entitle-ment to exemption.
**Students must present a copy of their student ID card to receive this rate.
For more information about Blackwell Publishing journals, including online ac-cess information, terms and conditions, and other pricing options, please visit www.blackwellpublishing.com or contact our Customer Service Department, tel: (800) 835-6770 or +44 1865 778315 (UK offi ce).
Back Issues Back issues are available from the publisher at the current single-issue rate.
Mailing Journal of Applied Corporate Finance is mailed Standard Rate. Mail-ing to rest of world by DHL Smart & Global Mail. Canadian mail is sent by Canadian publications mail agreement number 40573520. PostmasterSend all address changes to Journal of Applied Corporate Finance, Blackwell Publishing Inc., Journals Subscription Department, 350 Main St., Malden, MA 02148-5020.
Journal of Applied Corporate Finance is available online through Synergy, Blackwell’s online journal service, which allows you to:• Browse tables of contents and abstracts from over 290 professional,
science, social science, and medical journals• Create your own Personal Homepage from which you can access your
personal subscriptions, set up e-mail table of contents alerts, and run saved searches
• Perform detailed searches across our database of titles and save the search criteria for future use
• Link to and from bibliographic databases such as ISI.Sign up for free today at http://www.blackwell-synergy.com.
Disclaimer The Publisher, Morgan Stanley, its affi liates, and the Editor cannot be held responsible for errors or any consequences arising from the use of information contained in this journal. The views and opinions expressed in this journal do not necessarily represent those of the Publisher, Morgan Stanley, its affi liates, and Editor, neither does the publication of advertisements con-stitute any endorsement by the Publisher, Morgan Stanley, its affi liates, and Editor of the products advertised. No person should purchase or sell any security or asset in reliance on any information in this journal.
Morgan Stanley is a full service fi nancial services company active in the securi-ties, investment management, and credit services businesses. Morgan Stan-ley may have and may seek to have business relationships with any person or company named in this journal.
Copyright © 2005 Morgan Stanley. All rights reserved. No part of this publi-cation may be reproduced, stored, or transmitted in whole or part in any form or by any means without the prior permission in writing from the copyright holder. Authorization to photocopy items for internal or personal use or for the internal or personal use of specifi c clients is granted by the copyright holder for libraries and other users of the Copyright Clearance Center (CCC), 222 Rosewood Drive, Danvers, MA 01923, USA (www.copyright.com), provided the appropriate fee is paid directly to the CCC. This consent does not extend to other kinds of copying, such as copying for general distribution for advertis-ing or promotional purposes, for creating new collective works, or for resale. Institutions with a paid subscription to this journal may make photocopies for teaching purposes and academic course-packs free of charge provided such copies are not resold. For all other permissions inquiries, including requests to republish material in another work, please contact the Journals Rights and Permissions Coordinator, Blackwell Publishing, 9600 Garsington Road, Oxford OX4 2DQ. E-mail: [email protected].