is britain facing a crisis of democracy?
TRANSCRIPT
Is Britain Facing a Crisis of Democracy?
by Catherine Bromley, John Curtice, Ben Seyd
July 2004
�����������������������������
���������������������������
2
ISBN: 1 903903 32 X
First Published July 2004
Copyright © The Constitution Unit
Published by The Constitution Unit School of Public Policy, UCL 29–30 Tavistock Square London WC1H 9QU
Phone: 020 7679 4977 Fax: 020 7679 4978
[email protected] www.ucl.ac.uk/constitution-unit/
This report is sold subject to the condition that is shall not, by way of trade or otherwise, be lent, hired out or otherwise circulated without the publisher’s prior consent in any form of binding or cover other than that in which it is published and without a similar condition including this condition being imposed on the subsequent purchaser.
3
ContentsExecutive Summary 5
Introduction 6
Legitimacy 7
Participation 9
Constitutional change 14
Explanation 16
Conclusion: Is there a crisis of democracy in Britain? 22
Annex 1: Data sources 23
Annex 2: Further reading 24
Annex 3: About the authors 25

4
5
Executive SummaryBritain is widely believed to be suffering a crisis of democracy. This briefing examines whether this perception is justified or not. Our findings—which are based on a four year research project funded by the ESRC—address four key issues: the legitimacy of governments, patterns of participation in politics, the impact of constitutional reform, and the explanation for any crisis.
Legitimacy
There has been a decline in levels of trust in government and confidence in the political system. Thirty years ago, four in ten people in Britain trusted government to put the needs of the nation above those of their political party; today, just one in five do so. But much of this decline set in during the early 1990s, although trust and confidence have fallen further since 1997.
Participation
Turnout has been low in elections held since 1997. This was most noticeably so at the 2001 general election, when the participation rate was the lowest since 1918 (although there was some recovery in the most recent local and European elections). At the same time, levels of non-electoral participation have increased somewhat. Meanwhile, it is not the case that people engage outside the ballot box as an alternative to voting; rather, most people use non-electoral activities as a complement to participating at elections.
One reason why non-electoral participation has not declined is because people generally feel as engaged with the political process as they ever did. Today, people are as likely as previously to believe they possess the skills to participate in politics, to express levels of interest in politics and to believe in the duty to vote. On the other hand when it comes to identifying with a political party, fewer people today feel a sense of attachment than previously.
Constitutional change
The constitutional reforms introduced since 1997 were meant to restore citizens’ trust and confidence in government. But they appear to have largely failed in this task. The reforms are not unpopular, but few people believe they have made much of a difference to the way Britain is governed. Even the most radical of the reforms—the creation of the Scottish Parliament—has had only a small effect on citizen attitudes.
Explanation
Three explanations are commonly offered for the decline in political trust: the incapacity of governments, the decline in social trust and the role of the media, in particular the tabloid press. We find little evidence for any of these accounts. Instead, trust appears to be driven at least in part by public perceptions of political ‘sleaze’.
When it comes to explaining the decline in turnout in 2001, we find that participation rates fell particularly sharply among those who had little prior attachment to the political system. Among this group, people were more likely to perceive little difference between the two main parties in 2001 than in 1997, and thus have less motivation to vote.
6
IntroductionBritain is widely believed to be suffering a crisis of democracy. Levels of turnout at elections have fallen. Cynicism about politics and politicians is thought to be rife. And nowhere are these problems perceived to be more evident than amongst young people who appear to comprise a new generation of the politically disengaged. In short, we no longer participate in politics and no longer lend respect, authority or legitimacy to our political leaders.
This problem is thought to persist despite the introduction in recent years of a substantial programme of constitutional reform, one of whose aims was “to renew the relationship between politics and the people”.1 The use of proportional representation in European and devolved elections would help persuade people that their vote mattered. Freedom of information legislation would help make government more open and accountable. And in perhaps the most radical reform of all, creating a Scottish Parliament and a Welsh Assembly would bring decision making closer to the people. If after all this we now face a crisis of democracy, these claims appear rather hollow.
But is there really a crisis of democracy in Britain today? Do fewer people participate in politics? Do we no longer trust our political leaders or the way we are governed? Are young people particularly disengaged? Why might these changes have occurred and what role has constitutional reform played? These are the questions addressed by this briefing, which summarises the results of a four year research project on ‘Legitimacy, Participation and Constitutional Change’, funded by the Economic and Social Research Council (ESRC) as part of its ‘Democracy and Participation’ research programme.
This briefing falls into four sections:
Legitimacy: Has public trust and confidence in how we are governed declined in recent years?
Participation: Has the public become disengaged from politics?
Constitutional change: Have recent changes to the way we are governed made any difference in the eyes of the public?
Explanation: If Britain does face a crisis of democracy, who or what is responsible?
Our evidence comes from survey work undertaken by the project on the British and Scottish Social Attitudes surveys, particularly in 2000 and 2002. As many of the questions included on these surveys had been asked on previous surveys dating back to the 1980s or sometimes even earlier, they provide us a with a unique record of how political legitimacy and participation have changed in Britain over the last two decades. (Details of the 2000 and 2002 surveys can be found in Annex 1).
1 Report of the Joint Consultative Committee on Constitutional Reform, March 1997.
7
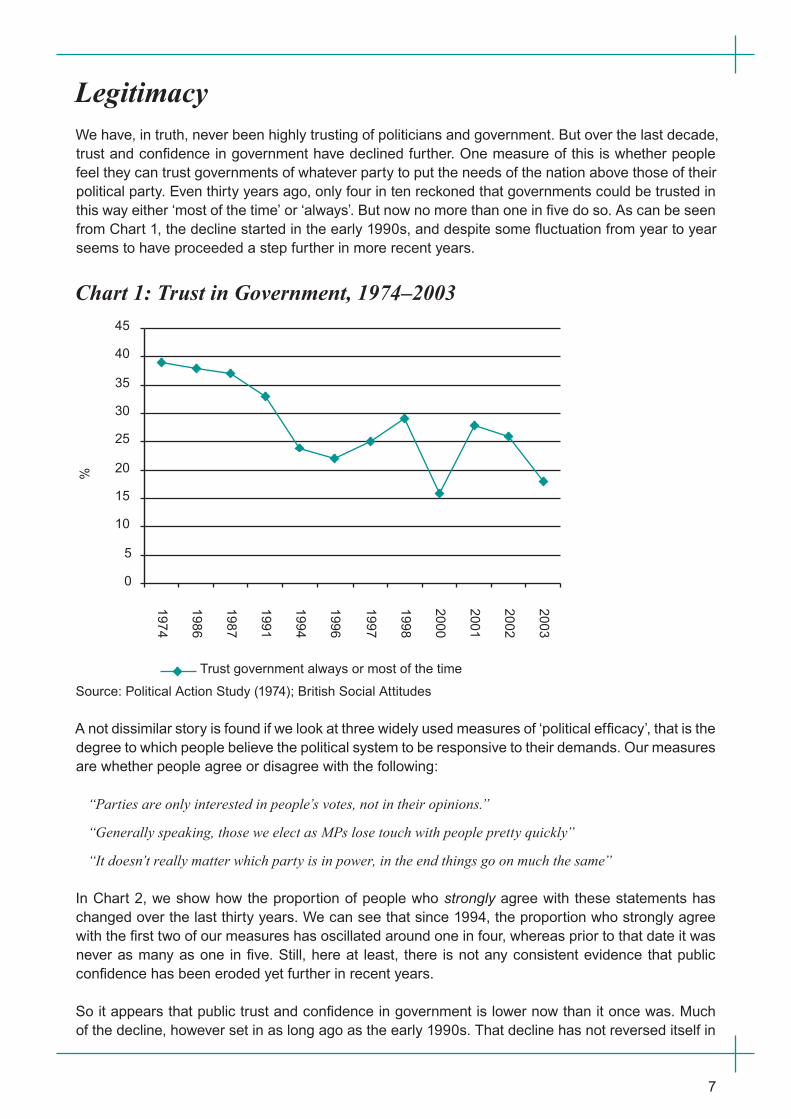
LegitimacyWe have, in truth, never been highly trusting of politicians and government. But over the last decade, trust and confidence in government have declined further. One measure of this is whether people feel they can trust governments of whatever party to put the needs of the nation above those of their political party. Even thirty years ago, only four in ten reckoned that governments could be trusted in this way either ‘most of the time’ or ‘always’. But now no more than one in five do so. As can be seen from Chart 1, the decline started in the early 1990s, and despite some fluctuation from year to year seems to have proceeded a step further in more recent years.
Chart 1: Trust in Government, 1974–2003
�
�
��
��
��
��
��
��
��
��
����
����
����
����
����
����
����
����
����
����
����
����
�
�������������������������������������������
Source: Political Action Study (1974); British Social Attitudes
A not dissimilar story is found if we look at three widely used measures of ‘political efficacy’, that is the degree to which people believe the political system to be responsive to their demands. Our measures are whether people agree or disagree with the following:
“Parties are only interested in people’s votes, not in their opinions.”
“Generally speaking, those we elect as MPs lose touch with people pretty quickly”
“It doesn’t really matter which party is in power, in the end things go on much the same”
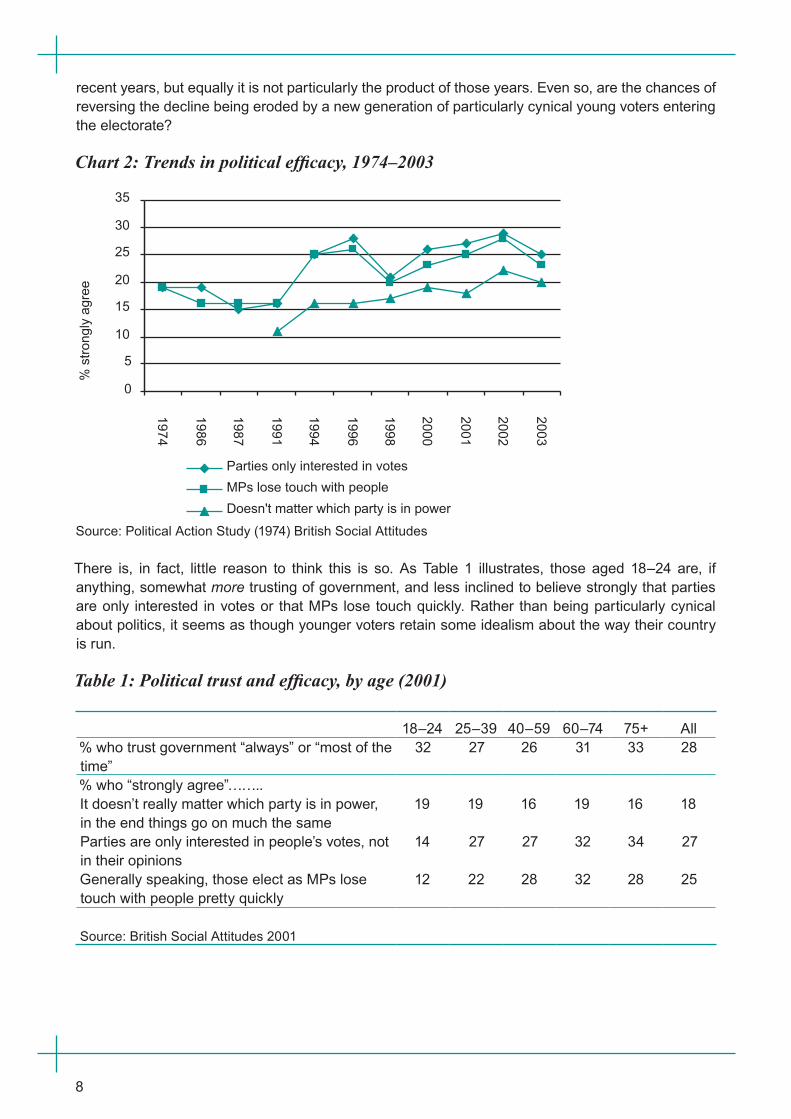
In Chart 2, we show how the proportion of people who strongly agree with these statements has changed over the last thirty years. We can see that since 1994, the proportion who strongly agree with the first two of our measures has oscillated around one in four, whereas prior to that date it was never as many as one in five. Still, here at least, there is not any consistent evidence that public confidence has been eroded yet further in recent years.
So it appears that public trust and confidence in government is lower now than it once was. Much of the decline, however set in as long ago as the early 1990s. That decline has not reversed itself in
8
recent years, but equally it is not particularly the product of those years. Even so, are the chances of reversing the decline being eroded by a new generation of particularly cynical young voters entering the electorate?
Chart 2: Trends in political efficacy, 1974–2003
�
�
��
��
��
��
��
��
����
����
����
����
����
����
����
����
����
����
����
�������
������
���
��������������������������������
��������������������������
��������������������������������������
Source: Political Action Study (1974) British Social Attitudes
There is, in fact, little reason to think this is so. As Table 1 illustrates, those aged 18–24 are, if anything, somewhat more trusting of government, and less inclined to believe strongly that parties are only interested in votes or that MPs lose touch quickly. Rather than being particularly cynical about politics, it seems as though younger voters retain some idealism about the way their country is run.
Table 1: Political trust and efficacy, by age (2001)
18–24 25–39 40–59 60–74 75+ All% who trust government “always” or “most of the time”
32 27 26 31 33 28
% who “strongly agree”……..It doesn’t really matter which party is in power, in the end things go on much the same
19 19 16 19 16 18
Parties are only interested in people’s votes, not in their opinions
14 27 27 32 34 27
Generally speaking, those elect as MPs lose touch with people pretty quickly
12 22 28 32 28 25
Source: British Social Attitudes 2001
9
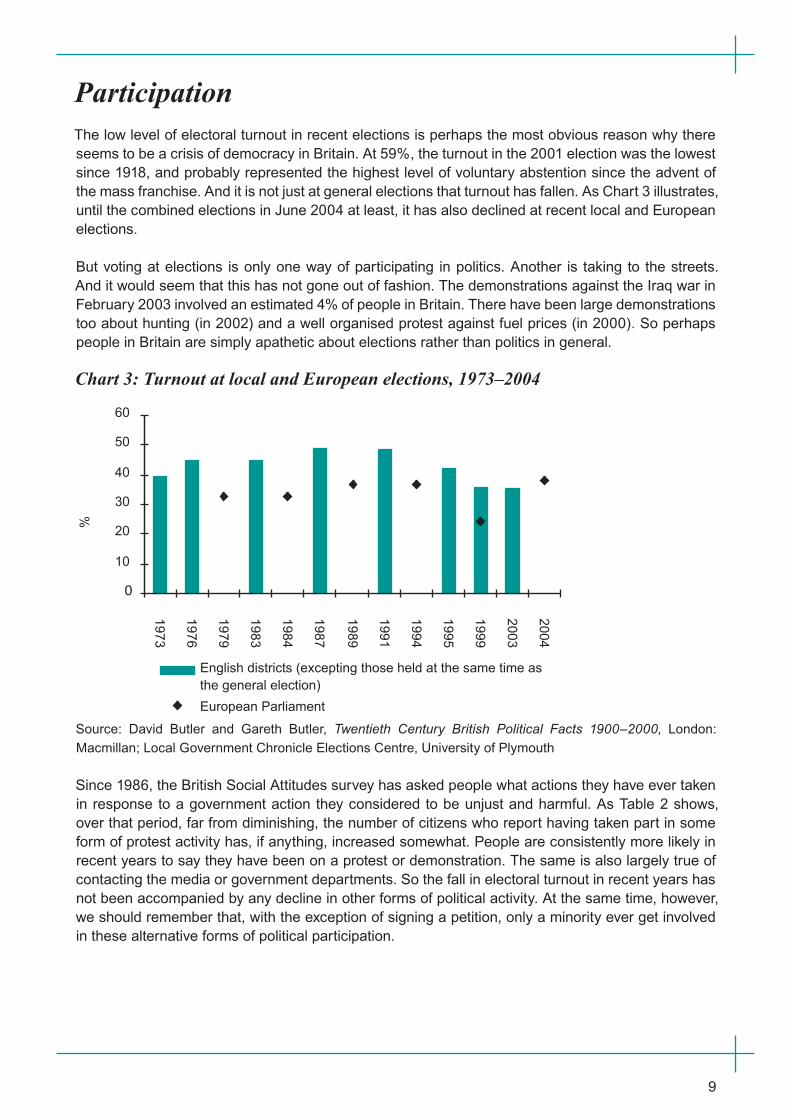
ParticipationThe low level of electoral turnout in recent elections is perhaps the most obvious reason why there seems to be a crisis of democracy in Britain. At 59%, the turnout in the 2001 election was the lowest since 1918, and probably represented the highest level of voluntary abstention since the advent of the mass franchise. And it is not just at general elections that turnout has fallen. As Chart 3 illustrates, until the combined elections in June 2004 at least, it has also declined at recent local and European elections.
But voting at elections is only one way of participating in politics. Another is taking to the streets. And it would seem that this has not gone out of fashion. The demonstrations against the Iraq war in February 2003 involved an estimated 4% of people in Britain. There have been large demonstrations too about hunting (in 2002) and a well organised protest against fuel prices (in 2000). So perhaps people in Britain are simply apathetic about elections rather than politics in general.
Chart 3: Turnout at local and European elections, 1973–2004
�
��
��
��
��
��
��
����
����
����
����
����
����
����
����
����
����
����
����
����
�
��������������������������������������������������������������������������������
�������������������
Source: David Butler and Gareth Butler, Twentieth Century British Political Facts 1900–2000, London: Macmillan; Local Government Chronicle Elections Centre, University of Plymouth
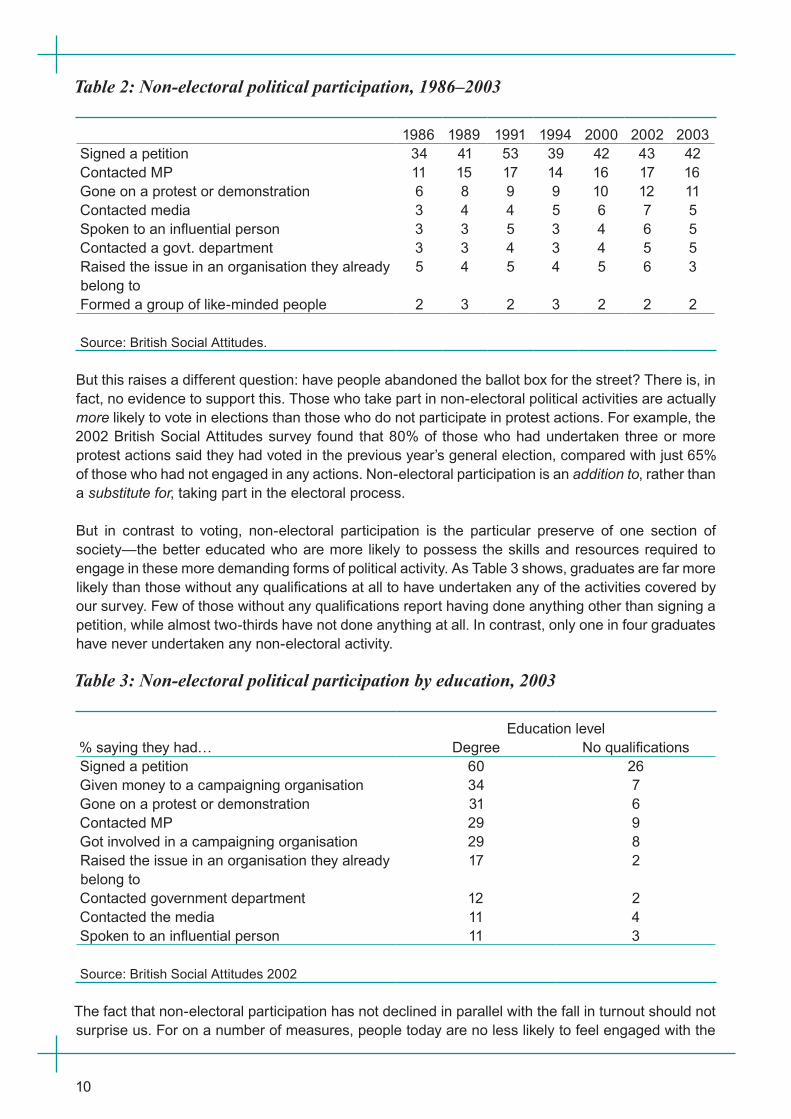
Since 1986, the British Social Attitudes survey has asked people what actions they have ever taken in response to a government action they considered to be unjust and harmful. As Table 2 shows, over that period, far from diminishing, the number of citizens who report having taken part in some form of protest activity has, if anything, increased somewhat. People are consistently more likely in recent years to say they have been on a protest or demonstration. The same is also largely true of contacting the media or government departments. So the fall in electoral turnout in recent years has not been accompanied by any decline in other forms of political activity. At the same time, however, we should remember that, with the exception of signing a petition, only a minority ever get involved in these alternative forms of political participation.
10
Table 2: Non-electoral political participation, 1986–2003
1986 1989 1991 1994 2000 2002 2003Signed a petition 34 41 53 39 42 43 42Contacted MP 11 15 17 14 16 17 16Gone on a protest or demonstration 6 8 9 9 10 12 11Contacted media 3 4 4 5 6 7 5Spoken to an influential person 3 3 5 3 4 6 5Contacted a govt. department 3 3 4 3 4 5 5Raised the issue in an organisation they already belong to
5 4 5 4 5 6 3
Formed a group of like-minded people 2 3 2 3 2 2 2
Source: British Social Attitudes.
But this raises a different question: have people abandoned the ballot box for the street? There is, in fact, no evidence to support this. Those who take part in non-electoral political activities are actually more likely to vote in elections than those who do not participate in protest actions. For example, the 2002 British Social Attitudes survey found that 80% of those who had undertaken three or more protest actions said they had voted in the previous year’s general election, compared with just 65% of those who had not engaged in any actions. Non-electoral participation is an addition to, rather than a substitute for, taking part in the electoral process.
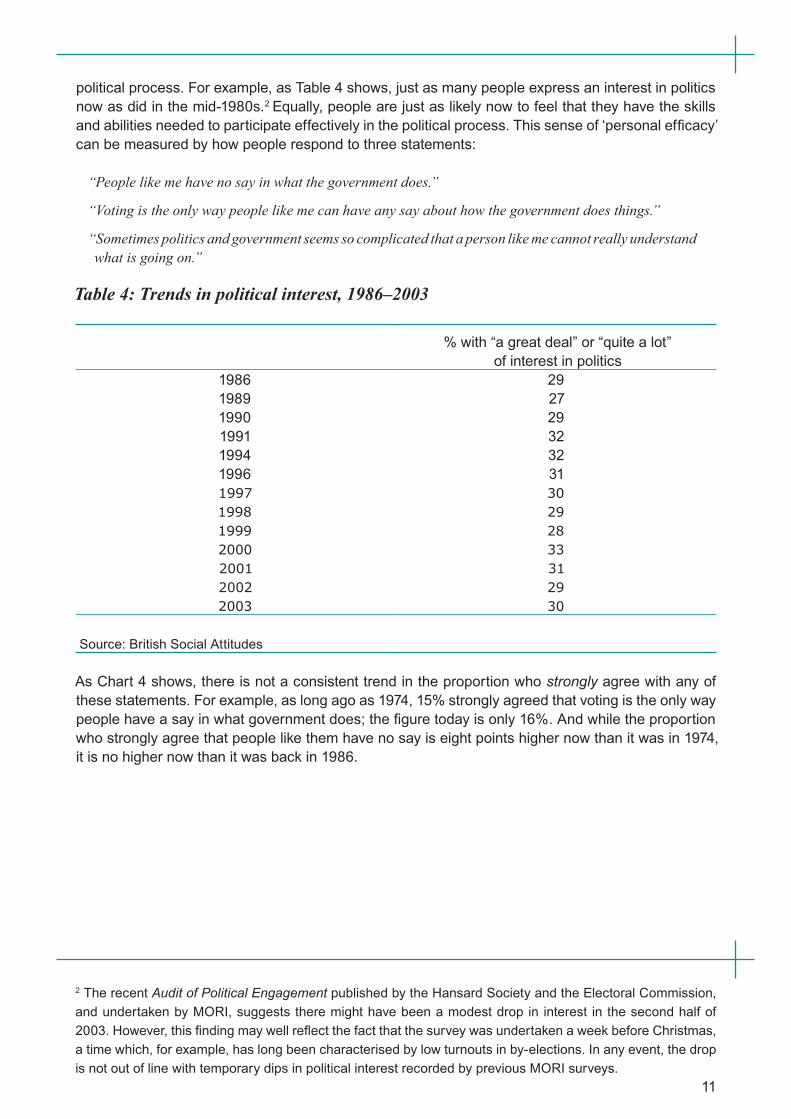
But in contrast to voting, non-electoral participation is the particular preserve of one section of society—the better educated who are more likely to possess the skills and resources required to engage in these more demanding forms of political activity. As Table 3 shows, graduates are far more likely than those without any qualifications at all to have undertaken any of the activities covered by our survey. Few of those without any qualifications report having done anything other than signing a petition, while almost two-thirds have not done anything at all. In contrast, only one in four graduates have never undertaken any non-electoral activity.
Table 3: Non-electoral political participation by education, 2003
Education level% saying they had… Degree No qualificationsSigned a petition 60 26Given money to a campaigning organisation 34 7Gone on a protest or demonstration 31 6Contacted MP 29 9Got involved in a campaigning organisation 29 8Raised the issue in an organisation they already belong to
17 2
Contacted government department 12 2Contacted the media 11 4Spoken to an influential person 11 3
Source: British Social Attitudes 2002
The fact that non-electoral participation has not declined in parallel with the fall in turnout should not surprise us. For on a number of measures, people today are no less likely to feel engaged with the
11
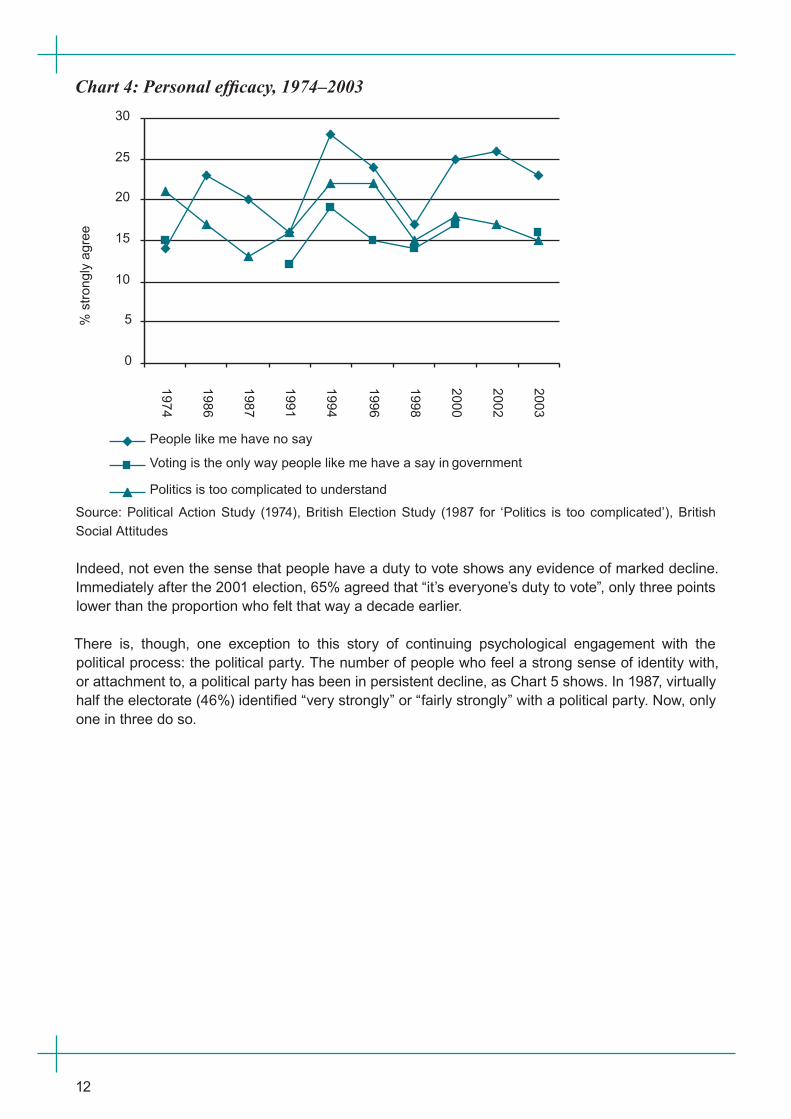
political process. For example, as Table 4 shows, just as many people express an interest in politics now as did in the mid-1980s.2 Equally, people are just as likely now to feel that they have the skills and abilities needed to participate effectively in the political process. This sense of ‘personal efficacy’ can be measured by how people respond to three statements:
“People like me have no say in what the government does.”
“Voting is the only way people like me can have any say about how the government does things.”
“Sometimes politics and government seems so complicated that a person like me cannot really understand what is going on.”
Table 4: Trends in political interest, 1986–2003
% with “a great deal” or “quite a lot” of interest in politics
1986 291989 271990 291991 321994 321996 311997 301998 291999 282000 332001 312002 292003 30
Source: British Social Attitudes
As Chart 4 shows, there is not a consistent trend in the proportion who strongly agree with any of these statements. For example, as long ago as 1974, 15% strongly agreed that voting is the only way people have a say in what government does; the figure today is only 16%. And while the proportion who strongly agree that people like them have no say is eight points higher now than it was in 1974, it is no higher now than it was back in 1986.
2 The recent Audit of Political Engagement published by the Hansard Society and the Electoral Commission, and undertaken by MORI, suggests there might have been a modest drop in interest in the second half of 2003. However, this finding may well reflect the fact that the survey was undertaken a week before Christmas, a time which, for example, has long been characterised by low turnouts in by-elections. In any event, the drop is not out of line with temporary dips in political interest recorded by previous MORI surveys.
12
Chart 4: Personal efficacy, 1974–2003
�
�
��
��
��
��
��
����
����
����
����
����
����
����
����
����
����
�������
������
���
��������������������������
��������������������������������������������������� ����������
�����������������������������������������
Source: Political Action Study (1974), British Election Study (1987 for ‘Politics is too complicated’), British Social Attitudes
Indeed, not even the sense that people have a duty to vote shows any evidence of marked decline. Immediately after the 2001 election, 65% agreed that “it’s everyone’s duty to vote”, only three points lower than the proportion who felt that way a decade earlier.
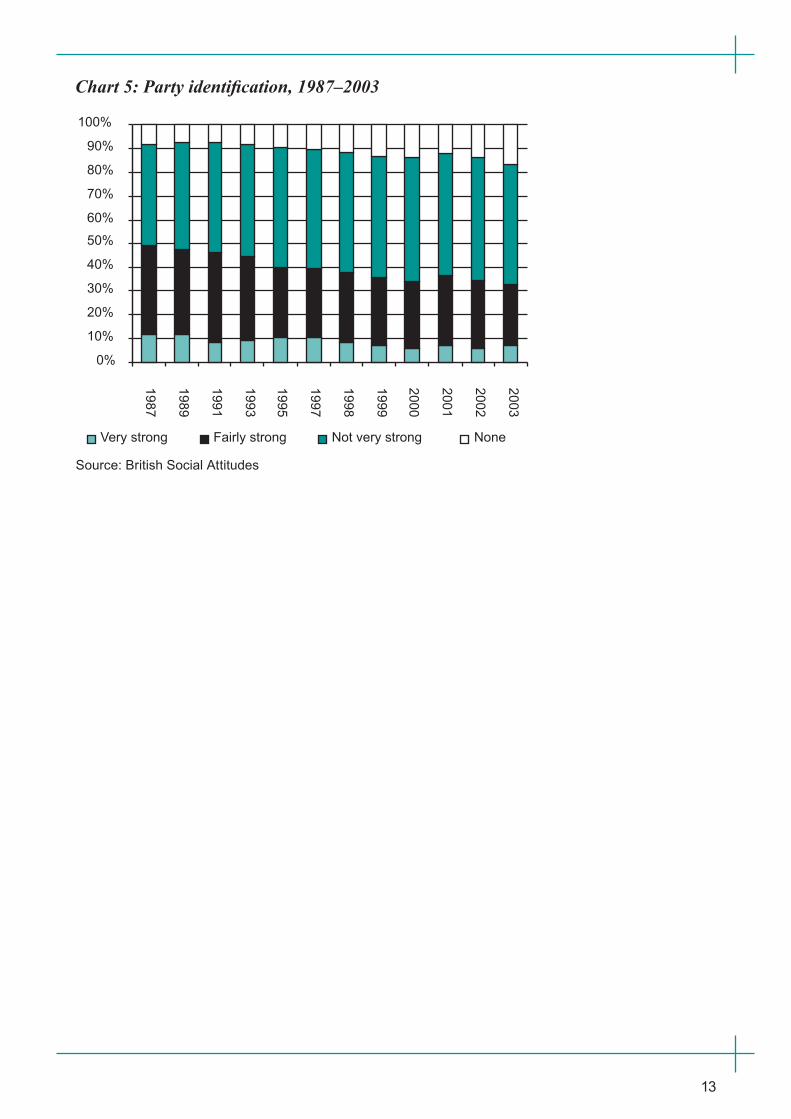
There is, though, one exception to this story of continuing psychological engagement with the political process: the political party. The number of people who feel a strong sense of identity with, or attachment to, a political party has been in persistent decline, as Chart 5 shows. In 1987, virtually half the electorate (46%) identified “very strongly” or “fairly strongly” with a political party. Now, only one in three do so.
13
Chart 5: Party identification, 1987–2003
��
���
���
���
���
���
���
���
���
���
����
����
����
����
����
����
����
����
����
����
����
����
����
����������� ������������� ��������������� ����
Source: British Social Attitudes
14
Constitutional changeConstitutional reform was meant to help restore trust and confidence in government. Yet as well as a fall in electoral participation, we have shown that the proportion who identify with a political party has continued to decline, trust in government has hit a new low, while levels of political efficacy have not returned to the levels enjoyed in the 1980s. What has gone wrong?
One possibility, of course, is that constitutional change has been unpopular with the public. This, however, does not seem to be the case. For example, 44% of Britons support the principle of using proportional representation, while just 15% are opposed. And even in England, only 13% oppose the idea of Scotland having her own parliament.
What is in doubt is whether constitutional reform is thought to have made a difference. On our last reading, as many as 72% thought that reforming the House of Lords had made no difference to the way Britain as a whole is governed, 64% said the same of creating the Scottish Parliament, and 60% the introduction of Freedom of Information legislation.
But perhaps the best test of whether constitutional change has had any impact on levels of trust and efficacy is to examine what has happened in Scotland since the advent of the Scottish Parliament. The creation north of the border of a parliament with significant legislative powers has arguably been the most radical of the various reforms introduced in recent years. In England, only London has enjoyed any kind of elected devolved institution. If constitutional change has had any effect on trust and confidence in government, there should have been more favourable trends in Scotland in recent years than in England.
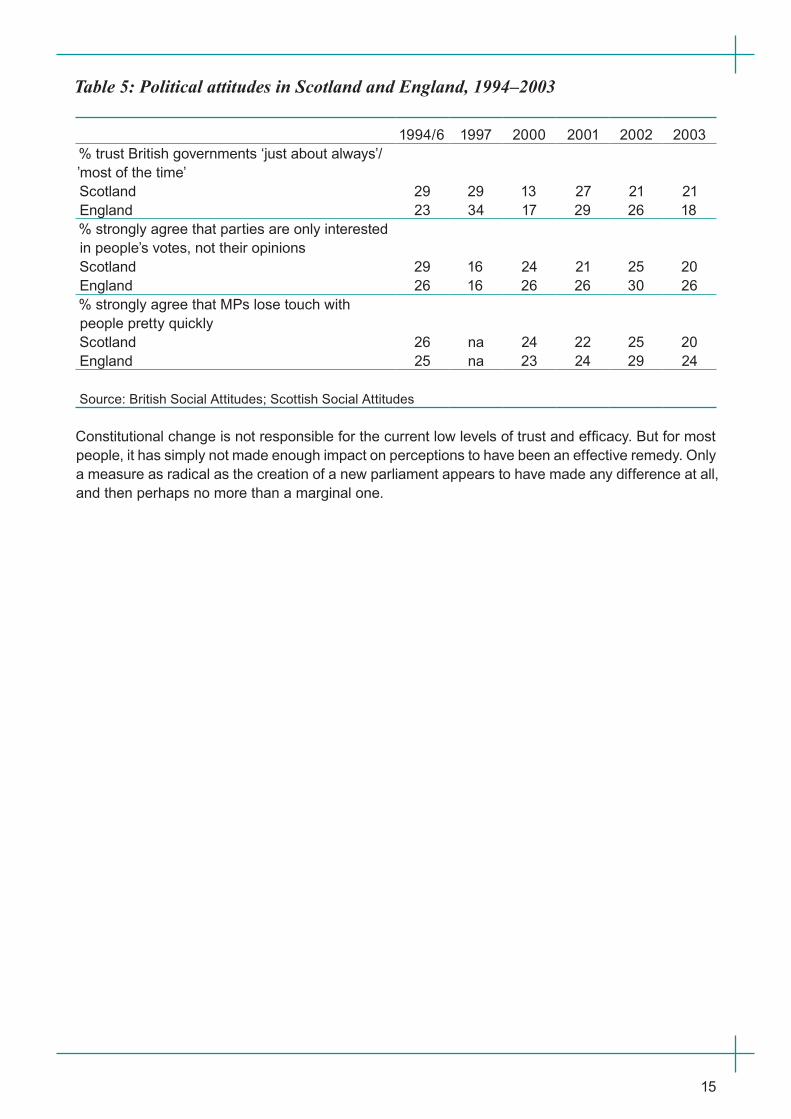
So far as trust in government is concerned, Table 5 suggests there is little evidence that this has happened. Trust in government is lower in Scotland now than it was prior to the advent of devolution, just as it is in England. But when we look at political efficacy, there is a somewhat more positive story to tell. Up to and including 2000, the proportion who strongly disagreed with the propositions put in our surveys was much the same on both sides of the border. But since then, it appears that slightly fewer people in Scotland have fallen into this category than have done so south of the border, or did so in Scotland itself in the mid-1990s.
15
Table 5: Political attitudes in Scotland and England, 1994–2003
1994/6 1997 2000 2001 2002 2003% trust British governments ‘just about always’/’most of the time’Scotland 29 29 13 27 21 21England 23 34 17 29 26 18% strongly agree that parties are only interested in people’s votes, not their opinionsScotland 29 16 24 21 25 20England 26 16 26 26 30 26% strongly agree that MPs lose touch with people pretty quicklyScotland 26 na 24 22 25 20England 25 na 23 24 29 24
Source: British Social Attitudes; Scottish Social Attitudes
Constitutional change is not responsible for the current low levels of trust and efficacy. But for most people, it has simply not made enough impact on perceptions to have been an effective remedy. Only a measure as radical as the creation of a new parliament appears to have made any difference at all, and then perhaps no more than a marginal one.
16
ExplanationSo how can we explain the adverse trends we have identified? Why have trust and confidence in government declined? And why has turnout fallen at election time? In particular are these trends the result of long term social forces that will be difficult to change? Or are they the product of more short-term developments that might more easily be reversed?
Explaining the decline in legitimacy
There are three commonly argued explanations of how long term forces have helped undermine trust and confidence in government.
The ‘relative capacity’ of governments. This argument suggests that as people have become more educated, and as the amount of information that citizens can access has increased, so populations have become more demanding of politicians. Yet at the same time, the argument goes, governments have become less well equipped to meet these demands, not least because their room for manoeuvre is limited by globalisation. The resulting gap between expectations and delivery induces negative attitudes towards political actors and institutions.
The stock of ‘social trust’. It has been argued by a number of commentators, most notably Robert Putnam, that people have become less willing to trust each other, not least because they spend too little time nowadays getting to know each other in local and voluntary groups. And if we are less willing to trust those around us, then this could lead us to becoming less trusting of those that take decisions on our behalf.
The role of the media. Here the blame is placed on the media, and most notably the ‘red-top’ press who have come to feed their readers an ever growing diet of scandal and revelation that have inevitably undermined the public’s trust of those in government.
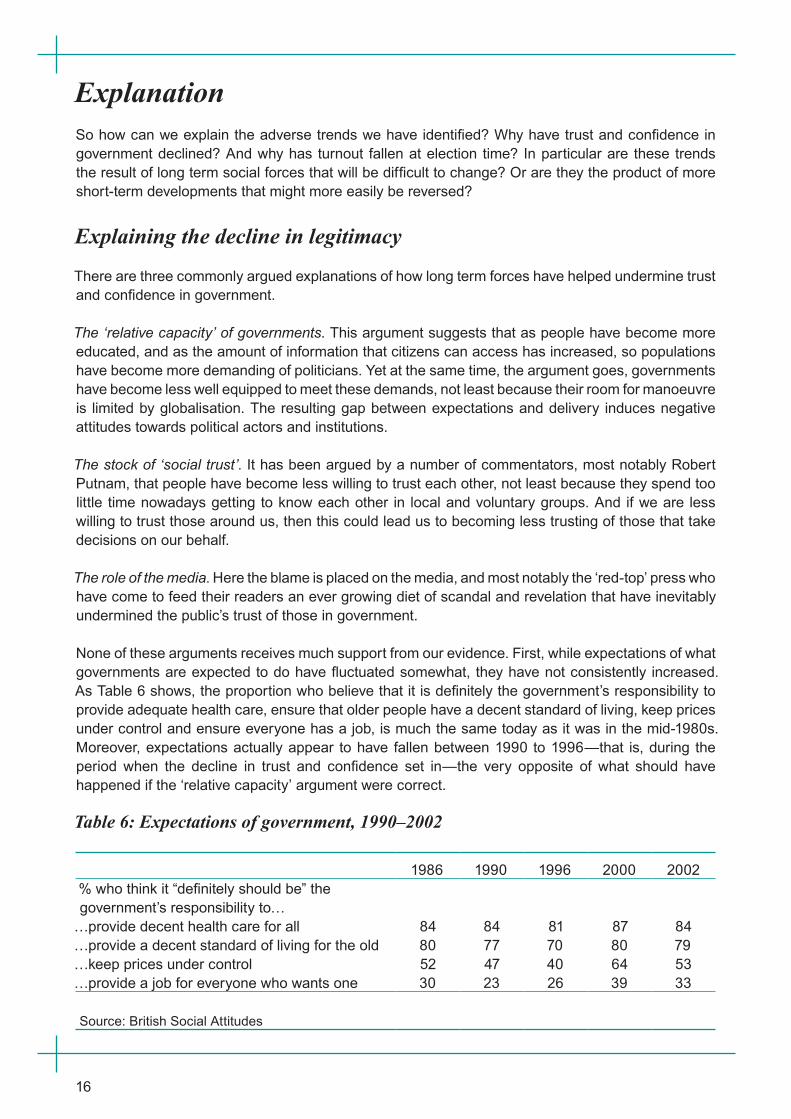
None of these arguments receives much support from our evidence. First, while expectations of what governments are expected to do have fluctuated somewhat, they have not consistently increased. As Table 6 shows, the proportion who believe that it is definitely the government’s responsibility to provide adequate health care, ensure that older people have a decent standard of living, keep prices under control and ensure everyone has a job, is much the same today as it was in the mid-1980s. Moreover, expectations actually appear to have fallen between 1990 to 1996—that is, during the period when the decline in trust and confidence set in—the very opposite of what should have happened if the ‘relative capacity’ argument were correct.
Table 6: Expectations of government, 1990–2002
1986 1990 1996 2000 2002% who think it “definitely should be” the government’s responsibility to…
…provide decent health care for all 84 84 81 87 84…provide a decent standard of living for the old 80 77 70 80 79…keep prices under control 52 47 40 64 53…provide a job for everyone who wants one 30 23 26 39 33
Source: British Social Attitudes
17
True, in recent years, there is a gap between the proportion of people who think that it is the government’s responsibility to achieve something, and the proportion who believe that it has actually been successful in fulfilling its responsibility in recent years. On most of the topics covered in Table 6, only around one in three reckon the government has been successful and this falls to just one in five in respect of giving older people a decent standard of living. But at the same time (and with the living standards of older people again excepted), only a little more than one in three believe governments have actually been unsuccessful as opposed to enjoying a mixture of success and failure. So the gap between expectations and perceived reality is perhaps not so wide as it first seems.
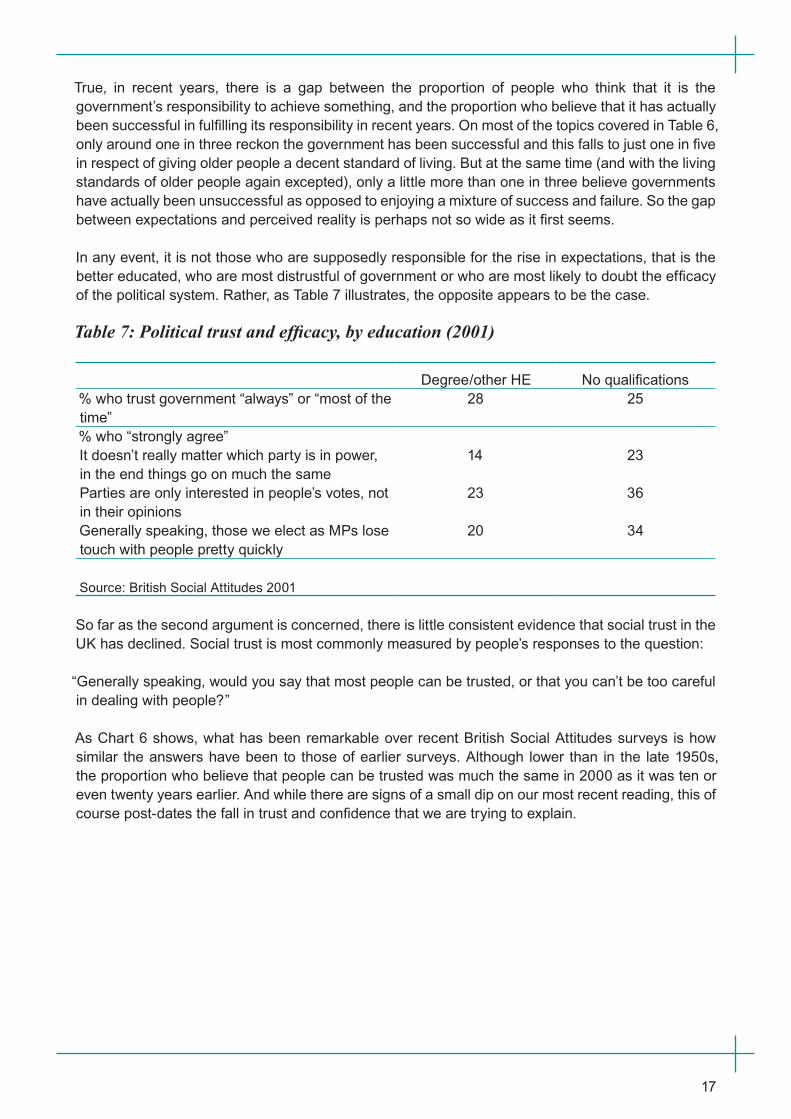
In any event, it is not those who are supposedly responsible for the rise in expectations, that is the better educated, who are most distrustful of government or who are most likely to doubt the efficacy of the political system. Rather, as Table 7 illustrates, the opposite appears to be the case.
Table 7: Political trust and efficacy, by education (2001)
Degree/other HE No qualifications% who trust government “always” or “most of the time”
28 25
% who “strongly agree”It doesn’t really matter which party is in power, in the end things go on much the same
14 23
Parties are only interested in people’s votes, not in their opinions
23 36
Generally speaking, those we elect as MPs lose touch with people pretty quickly
20 34
Source: British Social Attitudes 2001
So far as the second argument is concerned, there is little consistent evidence that social trust in the UK has declined. Social trust is most commonly measured by people’s responses to the question:
“Generally speaking, would you say that most people can be trusted, or that you can’t be too careful in dealing with people?”
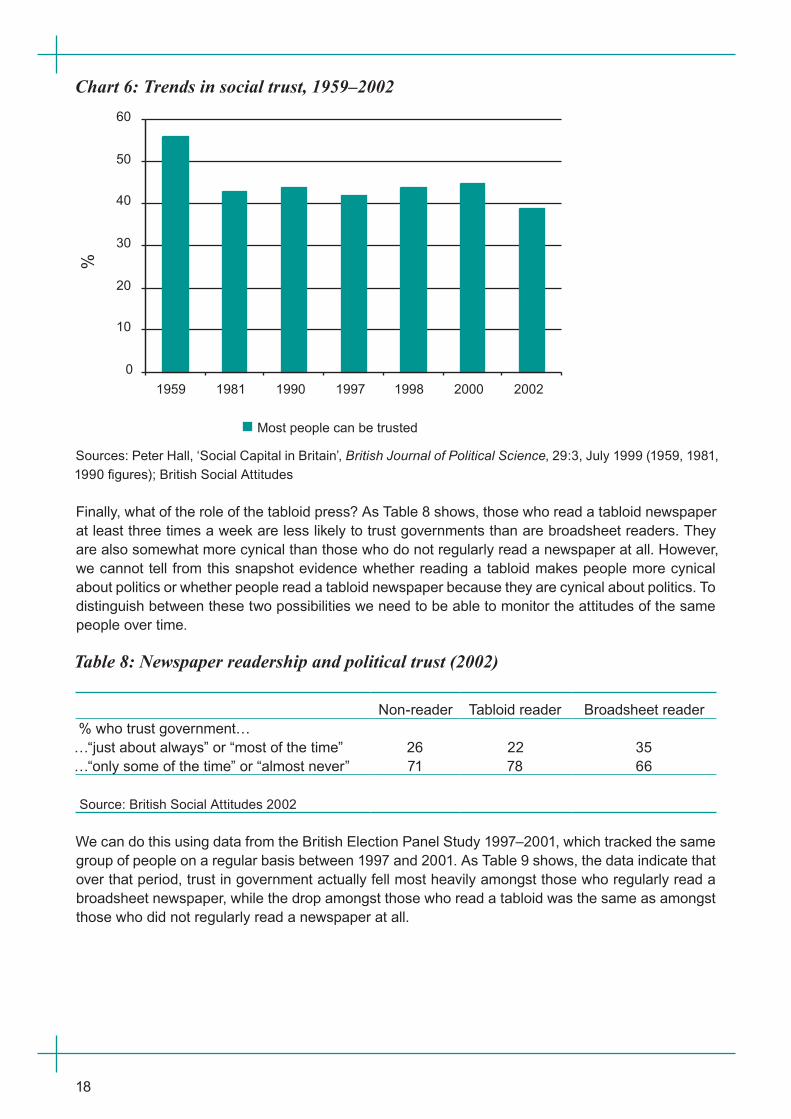
As Chart 6 shows, what has been remarkable over recent British Social Attitudes surveys is how similar the answers have been to those of earlier surveys. Although lower than in the late 1950s, the proportion who believe that people can be trusted was much the same in 2000 as it was ten or even twenty years earlier. And while there are signs of a small dip on our most recent reading, this of course post-dates the fall in trust and confidence that we are trying to explain.
18
Chart 6: Trends in social trust, 1959–2002
�
��
��
��
��
��
��
���� ���� ���� ���� ���� ���� ����
�
��������������������������
Sources: Peter Hall, ‘Social Capital in Britain’, British Journal of Political Science, 29:3, July 1999 (1959, 1981, 1990 figures); British Social Attitudes
Finally, what of the role of the tabloid press? As Table 8 shows, those who read a tabloid newspaper at least three times a week are less likely to trust governments than are broadsheet readers. They are also somewhat more cynical than those who do not regularly read a newspaper at all. However, we cannot tell from this snapshot evidence whether reading a tabloid makes people more cynical about politics or whether people read a tabloid newspaper because they are cynical about politics. To distinguish between these two possibilities we need to be able to monitor the attitudes of the same people over time.
Table 8: Newspaper readership and political trust (2002)
Non-reader Tabloid reader Broadsheet reader% who trust government…
…“just about always” or “most of the time” 26 22 35…“only some of the time” or “almost never” 71 78 66
Source: British Social Attitudes 2002
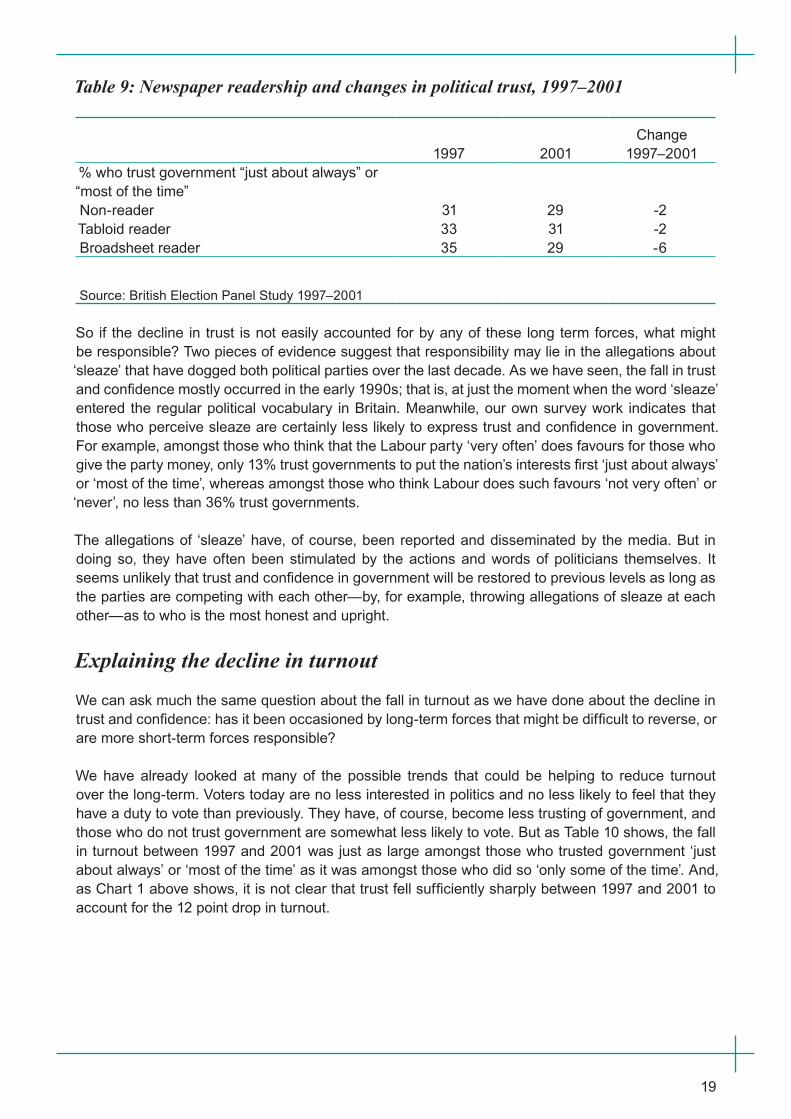
We can do this using data from the British Election Panel Study 1997–2001, which tracked the same group of people on a regular basis between 1997 and 2001. As Table 9 shows, the data indicate that over that period, trust in government actually fell most heavily amongst those who regularly read a broadsheet newspaper, while the drop amongst those who read a tabloid was the same as amongst those who did not regularly read a newspaper at all.
19
Table 9: Newspaper readership and changes in political trust, 1997–2001
1997
2001
Change 1997–2001
% who trust government “just about always” or “most of the time”Non-reader 31 29 -2Tabloid reader 33 31 -2Broadsheet reader 35 29 -6
Source: British Election Panel Study 1997–2001
So if the decline in trust is not easily accounted for by any of these long term forces, what might be responsible? Two pieces of evidence suggest that responsibility may lie in the allegations about ‘sleaze’ that have dogged both political parties over the last decade. As we have seen, the fall in trust and confidence mostly occurred in the early 1990s; that is, at just the moment when the word ‘sleaze’ entered the regular political vocabulary in Britain. Meanwhile, our own survey work indicates that those who perceive sleaze are certainly less likely to express trust and confidence in government. For example, amongst those who think that the Labour party ‘very often’ does favours for those who give the party money, only 13% trust governments to put the nation’s interests first ‘just about always’ or ‘most of the time’, whereas amongst those who think Labour does such favours ‘not very often’ or ‘never’, no less than 36% trust governments.
The allegations of ‘sleaze’ have, of course, been reported and disseminated by the media. But in doing so, they have often been stimulated by the actions and words of politicians themselves. It seems unlikely that trust and confidence in government will be restored to previous levels as long as the parties are competing with each other—by, for example, throwing allegations of sleaze at each other—as to who is the most honest and upright.
Explaining the decline in turnout
We can ask much the same question about the fall in turnout as we have done about the decline in trust and confidence: has it been occasioned by long-term forces that might be difficult to reverse, or are more short-term forces responsible?
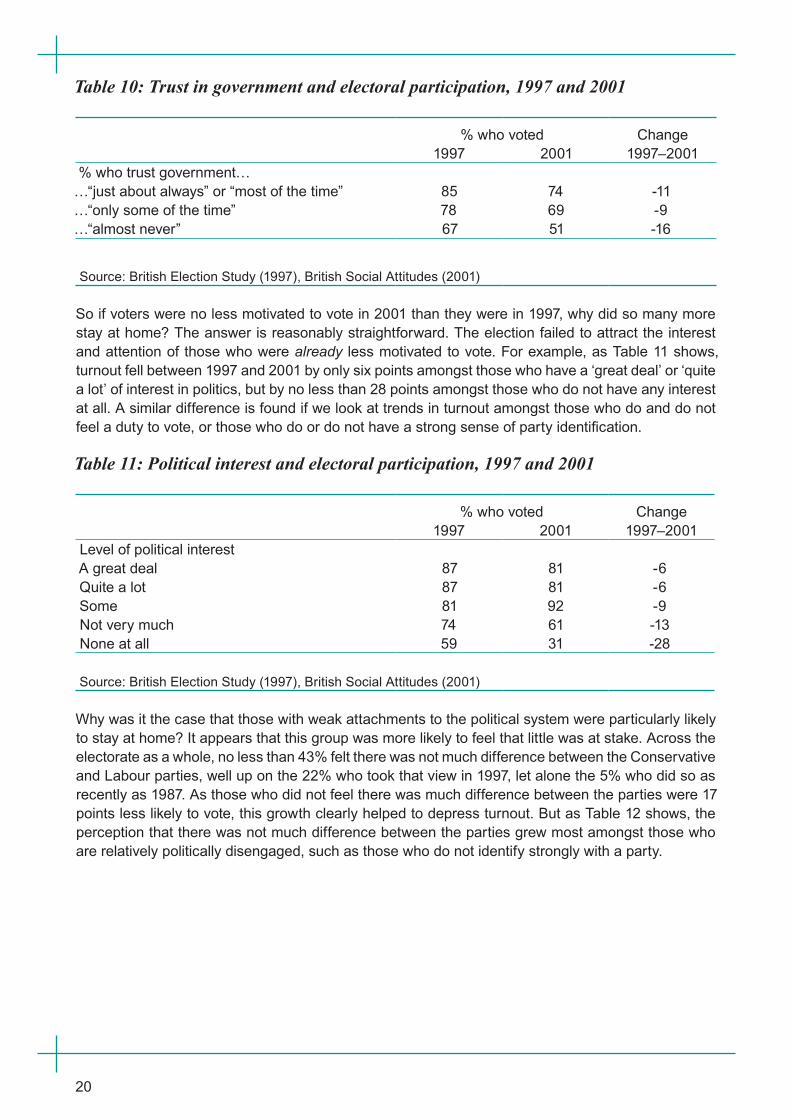
We have already looked at many of the possible trends that could be helping to reduce turnout over the long-term. Voters today are no less interested in politics and no less likely to feel that they have a duty to vote than previously. They have, of course, become less trusting of government, and those who do not trust government are somewhat less likely to vote. But as Table 10 shows, the fall in turnout between 1997 and 2001 was just as large amongst those who trusted government ‘just about always’ or ‘most of the time’ as it was amongst those who did so ‘only some of the time’. And, as Chart 1 above shows, it is not clear that trust fell sufficiently sharply between 1997 and 2001 to account for the 12 point drop in turnout.
20
Table 10: Trust in government and electoral participation, 1997 and 2001
% who voted Change1997 2001 1997–2001
% who trust government……“just about always” or “most of the time” 85 74 -11…“only some of the time” 78 69 -9…“almost never” 67 51 -16
Source: British Election Study (1997), British Social Attitudes (2001)
So if voters were no less motivated to vote in 2001 than they were in 1997, why did so many more stay at home? The answer is reasonably straightforward. The election failed to attract the interest and attention of those who were already less motivated to vote. For example, as Table 11 shows, turnout fell between 1997 and 2001 by only six points amongst those who have a ‘great deal’ or ‘quite a lot’ of interest in politics, but by no less than 28 points amongst those who do not have any interest at all. A similar difference is found if we look at trends in turnout amongst those who do and do not feel a duty to vote, or those who do or do not have a strong sense of party identification.
Table 11: Political interest and electoral participation, 1997 and 2001
% who voted Change1997 2001 1997–2001
Level of political interestA great deal 87 81 -6Quite a lot 87 81 -6Some 81 92 -9Not very much 74 61 -13None at all 59 31 -28
Source: British Election Study (1997), British Social Attitudes (2001)
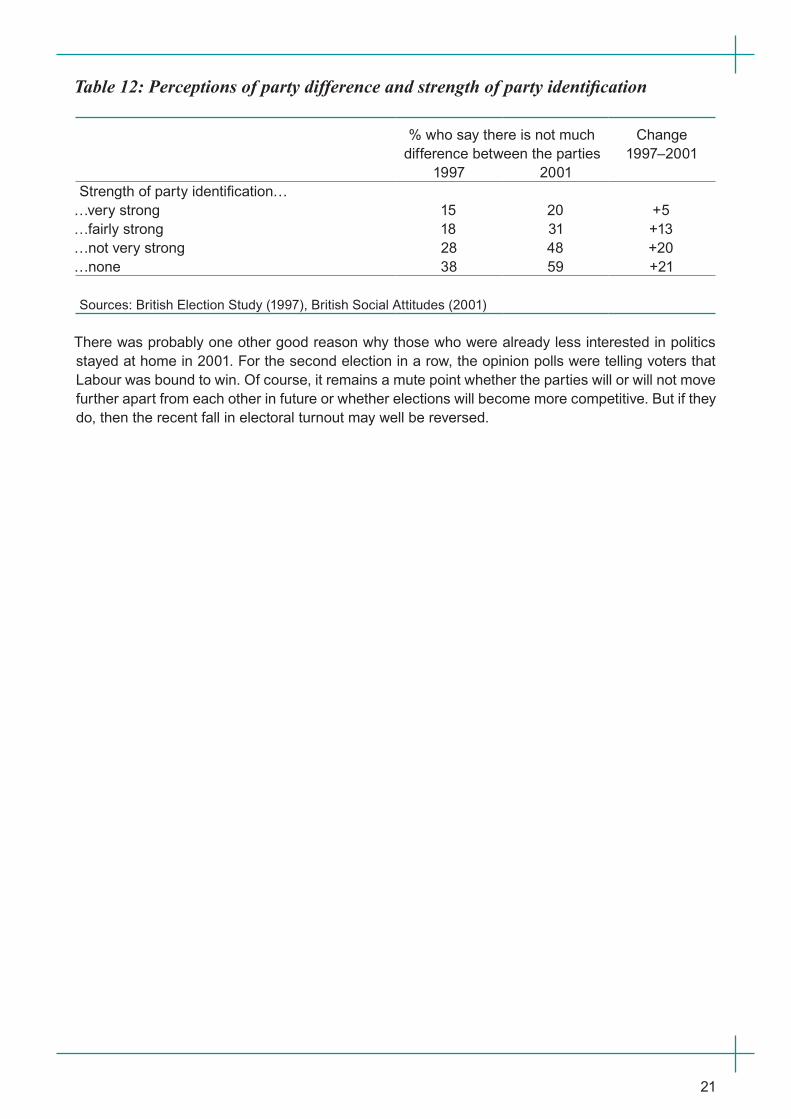
Why was it the case that those with weak attachments to the political system were particularly likely to stay at home? It appears that this group was more likely to feel that little was at stake. Across the electorate as a whole, no less than 43% felt there was not much difference between the Conservative and Labour parties, well up on the 22% who took that view in 1997, let alone the 5% who did so as recently as 1987. As those who did not feel there was much difference between the parties were 17 points less likely to vote, this growth clearly helped to depress turnout. But as Table 12 shows, the perception that there was not much difference between the parties grew most amongst those who are relatively politically disengaged, such as those who do not identify strongly with a party.
21
Table 12: Perceptions of party difference and strength of party identification
% who say there is not much difference between the parties
Change 1997–2001
1997 2001Strength of party identification…
…very strong 15 20 +5…fairly strong 18 31 +13…not very strong 28 48 +20…none 38 59 +21
Sources: British Election Study (1997), British Social Attitudes (2001)
There was probably one other good reason why those who were already less interested in politics stayed at home in 2001. For the second election in a row, the opinion polls were telling voters that Labour was bound to win. Of course, it remains a mute point whether the parties will or will not move further apart from each other in future or whether elections will become more competitive. But if they do, then the recent fall in electoral turnout may well be reversed.
22
Conclusion: Is there a crisis of democracy in Britain? On certain measures, Britain does, indeed, appear to be facing something of a crisis in its political system. Levels of trust in government and confidence in the political system are lower than they were little more than a decade ago. Electoral turnout has fallen sharply, most noticeably at the 2001 general election. Meanwhile, the introduction of new political institutions since 1997, designed in part to restore people’s trust and confidence, appears to have had little impact.
On the other hand, people do not seem more disengaged from the political system. Participation outside the ballot box has increased somewhat over the last fifteen or so years. Levels of political interest have not fallen, and people remain confident in their own ability to engage with the political process and to believe in the importance of voting at elections.
Perhaps the most reassuring evidence from our research is that which suggests the decline in trust and turnout is not due to long-term social forces, but to short-term political ones. The most plausible explanation for the decline in trust is the public reaction to allegations of misconduct and ‘sleaze’ on the part of politicians in the early to mid-1990s. When it comes to the decline in turnout in 2001, it appears as though the lack of clear competition between Labour and the Conservatives played a major role in discouraging people from participating. This lack of stimulus was particularly important for those who already had only weak ties to the political system.
These conclusions suggest that the remedies for any ‘crisis’ largely lie in the hands of politicians themselves. Trust is acquired when words and actions accord with one another. And only a closely fought and clear competition between the parties appears to prompt many citizens to cast their vote. Meanwhile constitutional change should not be regarded as a quick fix. British democracy—and especially its politicians—certainly face a ‘challenge’. But talk of a ‘crisis’ is premature.
23
Annex 1: Data sourcesThe core data for this briefing are drawn from modules of questions included on the 2000 and 2002 British Social Attitudes survey, undertaken by the National Centre for Social Research. In addition, in order to explore the impact of devolution in Scotland, a subset of questions was asked on the 2000 and 2002 Scottish Social Attitudes survey conducted by the same organisation. The British sample provided us with a representative sample of the population aged 18 plus resident in Great Britain, while the Scottish sample provided the same for Scotland.
The 2000 British Social Attitudes survey interviewed 3,436 respondents, representing a response rate of 62% while the 2002 survey interviewed 3,435 respondents, a response rate of 61%. The module of questions for this particular research project was administered to two-thirds of the sample, producing 2,293 respondents in 2000 and 2,287 in 2002. The 2000 Scottish Social Attitudes survey interviewed 1,663 respondents (a 65% response rate) and the 2002 survey interviewed 1,665 respondents (a 61% response rate). The subset of questions for this research project was asked of all these respondents.
24
Annex 2: Further reading1. Publications arising from this research project:
Catherine Bromley, John Curtice and Ben Seyd, ‘Political Engagement, Trust and Constitutional Reform’, in Alison Park et al, eds, British Social Attitudes, The 18th Report: Public Policy, Social Ties, London: Sage (2001)
John Curtice, ‘Devolution and Democracy: New Trust or Old Cynicism?’, in John Curtice et al, eds, New Scotland, New Society? Are Social and Political Ties Fragmenting? Edinburgh: Edinburgh University Press (2001)
Catherine Bromley and John Curtice, ‘Where Have All the Voters Gone?’, in Alison Park et al, eds, British Social Attitudes, The 19th Report, London: Sage (2002)
John Curtice and Ben Seyd, ‘Is There a Crisis of Political Participation?’, in Alison Park et al, eds, British Social Attitudes, The 20th Report: Continuity and Change over Two Decades, London: Sage (2003)
2. Other recent or forthcoming publications dealing with political attitudes and participation.
Patrick Dunleavy, Helen Margetts, Trevor Smith and Stuart Weir, Voices of the People: Popular Attitudes to Democratic Renewal in Britain, London: Politicos (2001)
Electoral Commission/Hansard Society, An Audit of Political Engagement, London: Electoral Commission/Hansard Society (2004)
Charles Pattie, Patrick Seyd and Paul Whiteley, Citizenship in Britain: Values, Participation and Democracy, Cambridge: Cambridge University Press (forthcoming: September 2004)
25
Annex 3: About the authorsCatherine Bromley
Senior Researcher at the Scottish Centre for Social Research which is part of the National Centre for Social Research; Co-Director of the Scottish Social Attitudes survey and the British Social Attitudes survey.
John Curtice
Research Consultant at the Scottish Centre for Social Research; Deputy Director of the Centre for Research into Elections and Social Trends (CREST); Professor of Politics and Director of the Social Statistics Laboratory at Strathclyde University.
Ben Seyd
Senior Research Fellow at The Constitution Unit, School of Public Policy, University College London.
The Constitution Unit
Details of the Unit can be found on the inside back cover.
http://www.ucl.ac.uk/constitution-unit
CREST
The Centre for Research into Elections and Social Trends (CREST) is jointly based at the National Centre for Social Research (formerly SCPR) and the Department of Sociology, University of Oxford. Having evolved from a successful programme of collaboration between the National Centre and researchers at the University of Oxford since 1983, CREST was founded in 1994. The Co-directors of CREST are currently Professor Anthony Heath (University of Oxford) and Alison Park (National Centre for Social Research); the Deputy Director is Professor John Curtice (University of Strathclyde).
CREST’s work relies on the conduct and interpretation of high quality social surveys of the general public, designed to document and explain changing patterns of voting behaviour, trends in social attitudes, and similarities and differences between Britain and other countries. Elections, political participation and political attitudes, the cornerstones of any democracy, are a primary focus of CREST’s attention and analysis. CREST also develops and encourages improved methods of measuring attitudes and behaviour.
http://www.crest.ox.ac.uk/index.htm
Acknowledgement
The research reported in this Briefing was supported by the Economic and Social Research Council (grant number L215252032) under its ‘Democracy and Participation’ programme.

26

27

ISBN: 1 903903 32 X