is 10673 (1983): sampling plans and procedures for inspection … · 2018-11-15 · double sampling...
TRANSCRIPT

Disclosure to Promote the Right To Information
Whereas the Parliament of India has set out to provide a practical regime of right to information for citizens to secure access to information under the control of public authorities, in order to promote transparency and accountability in the working of every public authority, and whereas the attached publication of the Bureau of Indian Standards is of particular interest to the public, particularly disadvantaged communities and those engaged in the pursuit of education and knowledge, the attached public safety standard is made available to promote the timely dissemination of this information in an accurate manner to the public.
इंटरनेट मानक
“!ान $ एक न' भारत का +नम-ण”Satyanarayan Gangaram Pitroda
“Invent a New India Using Knowledge”
“प0रा1 को छोड न' 5 तरफ”Jawaharlal Nehru
“Step Out From the Old to the New”
“जान1 का अ+धकार, जी1 का अ+धकार”Mazdoor Kisan Shakti Sangathan
“The Right to Information, The Right to Live”
“!ान एक ऐसा खजाना > जो कभी च0राया नहB जा सकता है”Bhartṛhari—Nītiśatakam
“Knowledge is such a treasure which cannot be stolen”
“Invent a New India Using Knowledge”
है”ह”ह
IS 10673 (1983): Sampling Plans and Procedures forInspection by Attributes for Electronic Items [LITD 2:Reliability of Electronic and Electrical Components andEquipment]

IS : lo673 - 1983
Indian Standard
SAMPLINGPLANSANDPROCEDURESFOR IN_SPECTION BY ATTRIBUTES FO-R
ELECTRONICITEMS
Reliability of Electronic and Electrical Components and Equipment Sectional Committee, LTDC 3
Chairman
PROF S. SAMPATH Indian Institute of Technology, Kanpur
Members Representing
A~~IDI;;~AL DIRECTOR, .STANDARDS ( S & T ), Railway Board ( Ministry of Railways )
JOINT DIRECTOR, STANDARDS ( S & T )-III, RDSO ( Alternate )
DR K. CHANDRA National Physical Laboratory ( CSIR ), New Delhi SHRI CHARANJIT SIN~H Hindustan Aeronautics Ltd, Hyderabad
SQN-LDR I. M. GANDOTRA ( Alternate ) CONTROLLER, CIL Ministry of Defence ( DGI )
LT-COL V. K. KHANNA (Alternate j DR P. K. DUTTA
SHRI V. NARAYANAN (Alternate) SHRI B. P. GHOSH
SHRI B. C. MU~HERJEE ( Alternate ) SHRI A. P. GUPTA
SHRI I. S. SULAKH (Alternate ) SHRI S. P. KULKARNI
SHRI S. M. KHURSALE (Alternate ) SHRI~H. C. MATHUR
SHRI U. R. G. AOHARYA ( Alternate ) SHRI D. C. MEHTA
SHRI R. V. ISRANI (Alternate ) SHRI S. R. MEHTA
SHRI T. C. GOSALIA ( Alternate ) DR K. B. MISRA
SHRI E. G. NA~ARAJAN SHRI K. R. ANANDAEUMARAN NAIR
SHRI C. RANQANATHAN (Alternate ) SHRI D. V. PETKAR
SHRI A. K. BABAR ( Alternate ) SHR~ V. B. PRADHAN
SHRI N. J. NAIR ( Alternate ) SHRI P. S. K. PRASAD SHRI K. RAMQOPAL
SHRI SIHARAN DE ( Alternate ) SHRI K. S. PRAKASA RAO
SHRI S. S. SONWALKAR ( Alternate ) SRRI R. SOMASUNDARAM
SHRI R. N. SHARMA ( Alternate ) COL J. VARQHESE
SHRI P. K SHUKLA ( Alternate ) SHRI B. VIRESALINOAM
SHRI V. MUTHAIAH ( Alternate) SHRI R. C. JAIN,
Head ( Electronics ) ( Secretary )
Peico Electronics and Electricals Ltd, Bombay
National Test House, Calcutta
Instrumentation Ltd, Kota
The Radio Electronic & Television Manufacturers’ Association, Bombay
Posts and Telegraphs Board, New Delhi
Directorate General of Civil Aviation, New Delhi
Indian Electrical Manufacturers’ Association, Bombay
In personal capacity (Department of Electrical Engineering, Indian Institute of Technology, Kharagpur )
Department of Electromcs, New Delhi Lucas-TVS Ltd, Madras
Bhabha Atomic Research Centre, Trombay, Bombay
All India Radio, New Delhi
Bharat Electronics Ltd, Bangalore ISRO Satellite Centre ( ISAC ), Bangalore
Electronics Corporation of India Ltd, Hyderabad
Directorate of Technical Development and Production ( AIR ), Ministry of Defence
Ministry of Defence ( R & D )
Indian Telephone Industries Ltd, Bangalore
Director General, IS1 (Ex-oficio Member )
( Continued on page 2 )
@ Copyright 1984
INDIAN STANDARDS INSTITUTION
This publication is protected under the Indian Copyright Act ( XIV of 1957) and reproduction in whole or in part by any means except with written permission of the publisher shall be deemed to be an infringement of copyright under the said Act.
*------------ _ _~
IS : 10673 - 1983
( Continued from page 1 )
Study of Statistical Problems of Reliability of Electronic .and Electrical Items Subcommittee, LTDC 3 : 1
Convener
DR P. K. DUTTA
Members
LT-COL V. K. KHANNA MAJ S. P. MURQAI ( Alternate )
SHRX V. NARAYANA SHRI P. S. K. PRASAD SHRI K. RAM~OPAL DR Y. V. SOMAYAJULU
SHRI V. N. SHAP.M.~ (Alternate) COL J. VARGHESE
SHRI P. K. SRURLA ( Alternate )
Representing
Peico Electronics & Electricals Ltd, Bombay
Ministry of Defence ( DGI )
Indian Statistical Institute, Hyderabad Bharat Electronics Ltd, Bangalore ISRO Satellite Centre ( ISAC ) , Bangalore National Physical Laboratory ( CSIR ), New Delhi
Ministry of Defence ( R & D )
IS:10673 - 1983
CONTENTS
0.
1.
2.
3.
4.
5.
6.
7.
8.
9.
10.
11.
FOREWORD . . . . . . . . .
SCOPE . . . . . . . . .
APPLICATION . . . . . . . . .
GENERAL . . . . . . . . .
ACCEPTABLE QUALITY LEVEL ( AQL ) . . . ,.. . . .
SUBMISSION OF PRODUCT . . . *.. . . .
ACCEPTANCE AND REJECTION . . . . . . . . .
DRAWING OF SAMPLES . . . . . . . . .
NORMAL, TIGHTENED AND REDUCED INSPECTION
SAMPLING PLANS . . . . . . . . .
DETERMINATION OF ACCEPTABILITY . . . . . . . . .
SUPPLEMENTARY INFORMATION ,.. .., . . .
TABLES
1
2A
SAMPLE SIZE CODE LETTERS . . . . . . . . .
SINGLE SAMPLING PLANS FOR NORMAL INSPECTION (MASTER TABLE)
11
12
2B SINGLE SAMPLING PLANS FOR TIGHTENED INSPECTION 13
2c
( MASTER TABLE )
SINGLE SAILING ( MASTER TABLE )
DOUBLE SAMPLING ( MASTER TABLE)
DOUBLE SAMPLJNG ( MASTER TABLE )
DOUBLE SAMPLING ( MASTER TABLE )
PLANS FOR REDUCED INSPECTION 14
3A PLANS FOR NORMAL INSPECTION 15
3B PLANS FOR TIGHTENED INSPECTION 16
3c PLANS FOR REDUCED INSPECTION 17
4A 18
4B
4c
20
22
5A 24
5B
MULTIPLE SAMPLING PLANS FOR NORMAL INSPECTIGN ( MASTER TABLE )
MULTIPLE SAMPLING PLANS FOR TIGHTENED INSPECTION ( MASTER TABLE )
MULTIPLE SAMPLING PLANS FOR REDUCED INSPECTION ( MASTER TABLE )
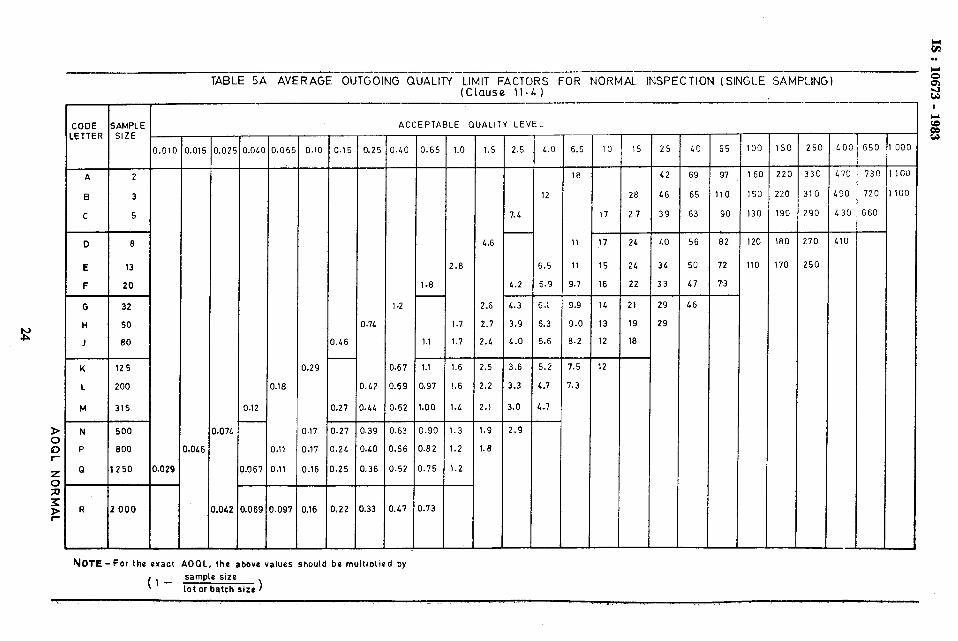
AVERAGE OUTGOING QUALITY LIMIT FACTORS FOR NORMAL INSPECTION ( SINGLE SAMPLING )
AVERAGE OUTGOING QUALITY LIMIT FACTORS FOR TIGI+ TENED INSPECTION ( SINGLE SAMPLING )
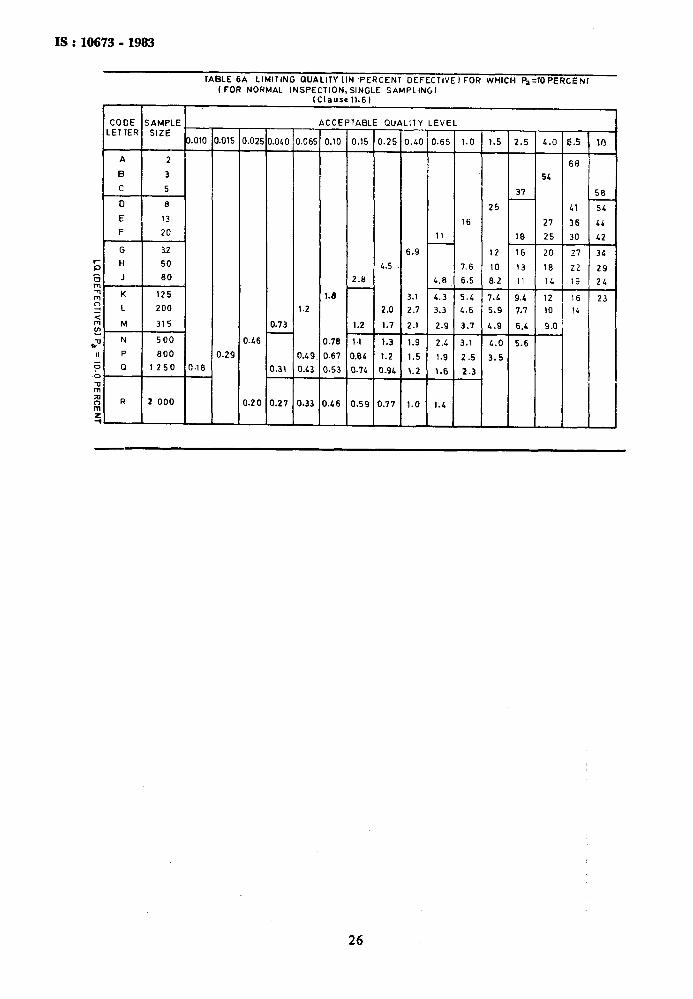
LIMITING QUALITY ( IN PERCENT DEFECTIVE FOR WEIICH P, = 10 PERCENT ( FOR NORMAL INSPECTION, SINGLE SAMPLJNG )
LIMITIN& QUALITY ( IN DEFECTS PER HUNDRED UNITS ) FOR WHICH P, = 10 PERCENT ( FOR NORMAL INSPECIJON, SINGLE SAMPLING )
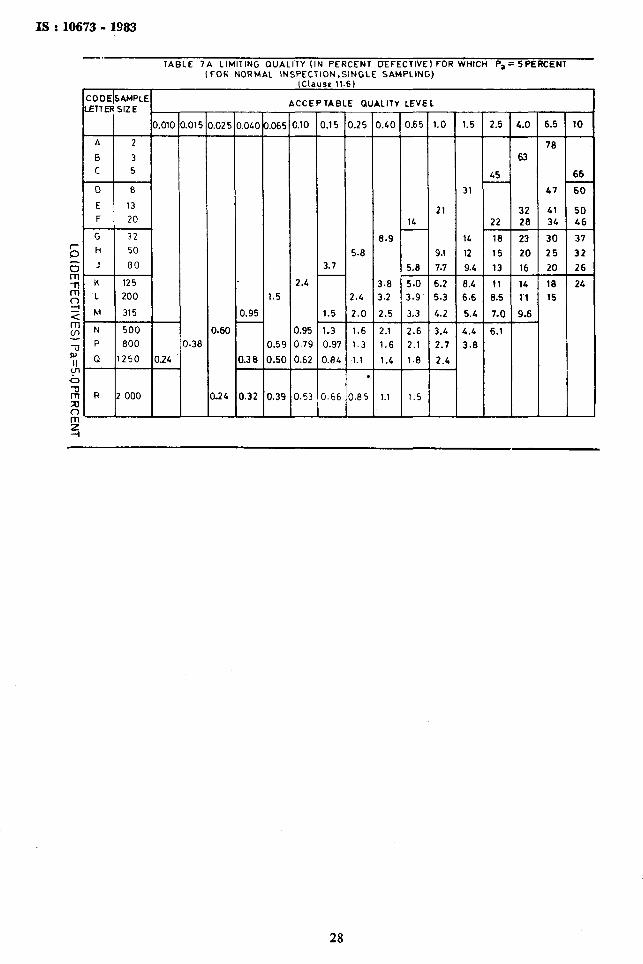
LIMITING QUALITY ( IN PERCENT DEFECTIVE ) FOR WHICH P, = 5 PERCENT ( FOR NORMAL INSPECTION, SINGLE SAMPLING )
25
6A 26
6B 27
7A 28
PAGE
5
5
5
6
6
7
7
8
8
8
9
9
3
IS: f0673 -i983
7B LIMITING QUALITY ( IN DEFECTS PER HUNDRED, UNITS ) FOR WHICH P, = 5 PERCENT ( FOR NORMAL INSPECTION, SINGLE SAMPLING )
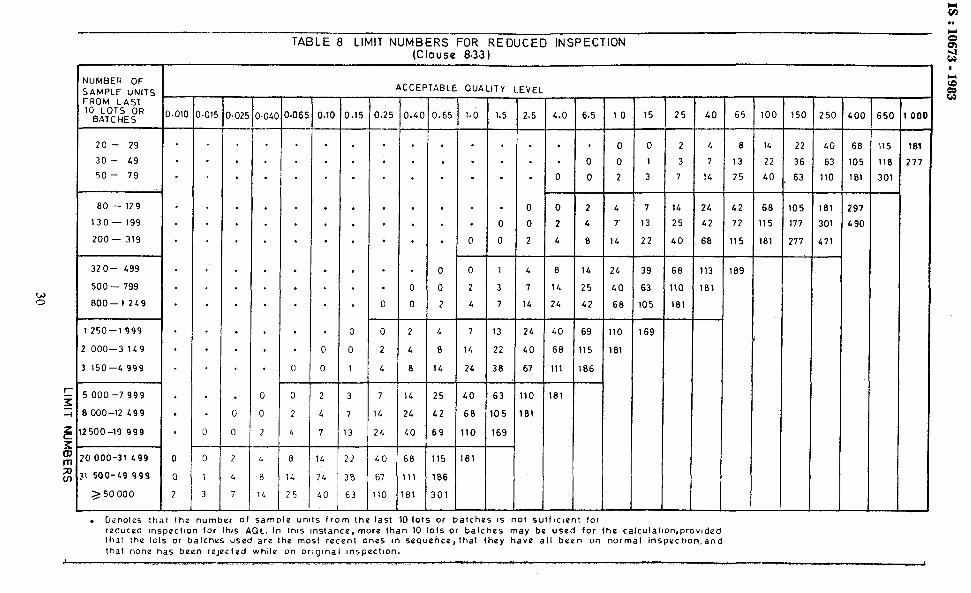
8 LIMIT NUMBERS FOR REDUCED INSPECTION
9 AVERAGE SAMPLE SIZE CURVES FOR DOUBLE AND MULTIPLE SAMPLING ( NORMAL AND TIGHTENED INSPECTION )
SAMPLING PLANS AND OPER.ATING CHARACTERISTIC CURVES ( AND DATA ) FOR :
IOA SAMPLE SIZE CODE LETTER A . . . . . .
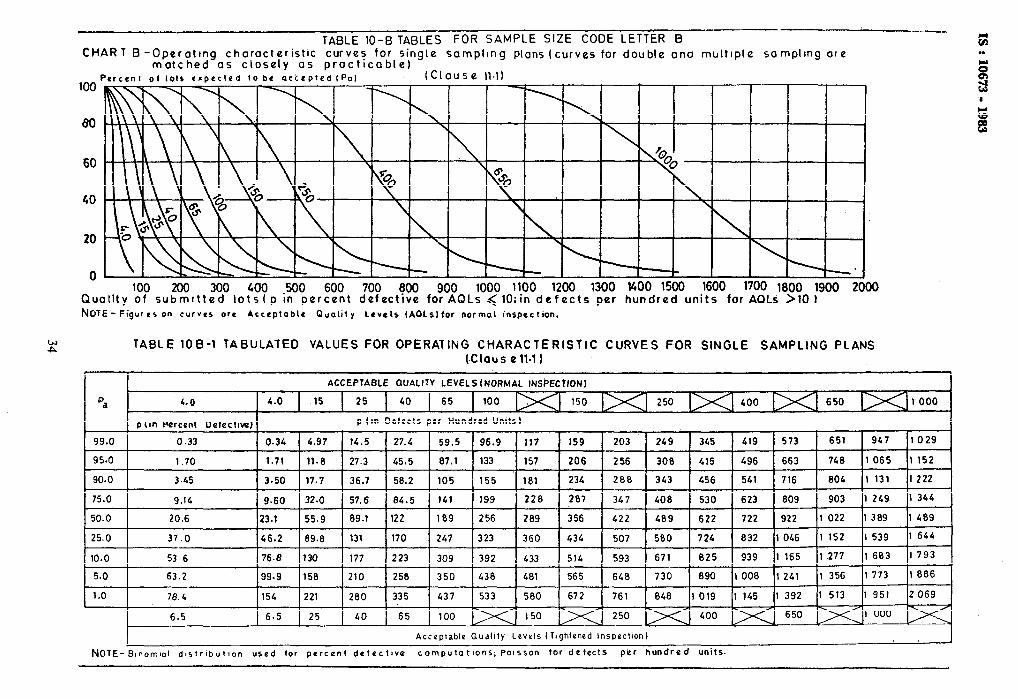
10B SAMPLE SIZE CODE LETTER B . . . . . .
1OC SAMPLE SIZE CODE LETTER C . . . . . .
10D SAMPLE SIZE CODE LETTER D . . . . . .
10E SAMPLE SIZE CODE LETTER E . . . . . .
101: SAMPLE SIZECODE LETTER F . . . . . .
IOG SAMPLE SIZE CODE LETTER G . . . . . .
IOH SAMPLE SIZE CODE LETTER H ,.. . . .
IOJ SAMPLE SIZE CODE LETTER J . . . . . .
10K SAMPLE SIZE CODE LETTER K . . . . . .
IOL SAMPLE SIZE CODE LETTER L . . . . . .
10M SAMPLE SIZE CODE LETTER M . . . . . .
10N SAMPLE SIZE CODE LETTER N . . . . . .
1OP SAMPLE SIZE CODE LETTER P . . . . . .
1OQ SAMPLE SIZE CODE LETTER Q . . . . . .
IOR SAMPLE SIZE CODE LETTER R . . . . . .
10s SAMPLE SIZE CODE LETTER S . . . . . .
APPENDIX A INDEX OF TERMS WITH SPECIAL MEANINGS
. . . 32
. . . 34
. . . 36
. . . 3%
. . . 40
. . . 42
*.. 44
. . . 46
. . . 4%
. . . 50
*.. 52
. . . 54
.I. 56
. . . 58
. . . 60
. . . 62
. . . 64
. . . 65
PAGE
29
30
31
F------ ~__.___... ., . _ _.. ^.___. _._ ” .-..
IS : 10673 - 1983
Indian Standard
SAMPLING PLANS AND PROCEDURES FOR INSPECTION BY ATTRlBUTES FOR
ELECTRONIC ITEMS
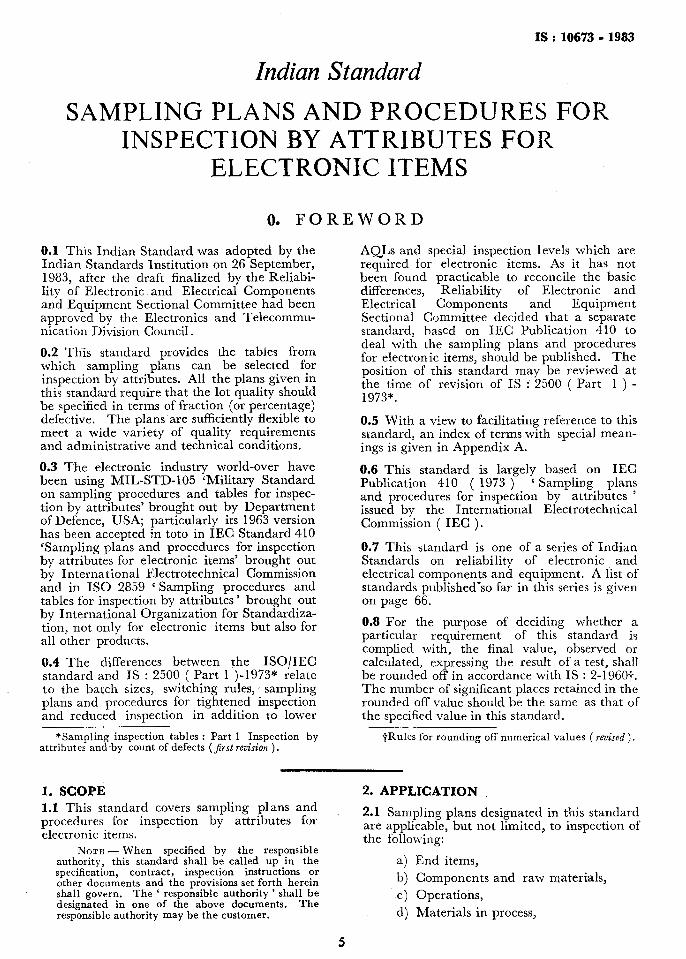
0. FOREWORD
0.1 This Indian Standard was adopted by the Indian Standards Institution on 26 September, 1983, after the draft finalized by the Reliabi- lity of Electronic and Electrical Components and Equipment Sectional Committee had been approved by the Electronics and Telecommu- nication Division Council.
0.2 This standard provides the tables from which sampling plans can be selected for inspection by attributes. All the plans given in this standard require that the lot quality should be specified in terms of fraction (or percentage) defective. The plans are sufficiently flexible to meet a wide variety of quality requirements and administrative and technical conditions.
0.3 The electronic industry world-over have been using MIL-STD-105 ‘Military Standard on sampling procedures and tables for inspec- tion by attributes’ brought out by Department of Defence, USA; particularly its 1963 version has been accepted in toto in IEC Standard 410 ‘Sampling plans and procedures for inspection by attributes for electronic items’ brought out by International Electrotechnical Commission and in IS0 2859 ‘ Sampling procedures and tables for inspection by attributes ’ brought out by International Organization for Standardiza- tion, not only for electronic items but also for all other products.
0.4 The differences between the ISO/IEC standard and IS : 2500 ( Part 1 )-1973” relate to the batch sizes, switching rules,’ sampling plans and procedures for tightened inspection and reduced inspection in addition to lower
*Sampling inspection tables : Part 1 Inspection by attributes and~by count of defects (Jirst revision ).
AQLs and special inspection levels which are required for electronic items. As it has not been found practicable to reconcile the basic differences, Reliability of Electronic and Electrical Components and Equipment Sectional Committee decided that a separate standard, based on IEC Publication 410 to deal with the sampling plans and procedures for electronic items, should be published. The position of this standard may be reviewed at ;t73time of revision of IS : 2500 ( Part 1 ) -
*
0.5 With a view to facilitating reference to this standard, an index of terms with special mean- ings is given in Appendix A.
0.6 This standard is largely based on IEC Publication 410 ( 1973 ) ‘ Sampling plans and procedures for inspection by attributes ’ issued by the International Electrotechnical Commission ( IEC ).
0.7 This standard is one of a series of Indian Standards on reliability of electronic and electrical components and equipment. A list of standards published”so far in this series is given on page 66.
0.8 For the purpose of deciding whether a particular requirement of this standard is complied with, the final value, observed or calculated, expressing the result of a test, shall be rounded off in accordance with IS : 2-19601_. The number of significant places retained in the rounded off value should be the same as that of the specified value in this standard.
TRules for rounding off numerical values ( revised ).
1. SCOPE 2. APPLICATION ,
1.1 This standard covers sampling plans and procedures for inspection by attributes for
~ 2.1 Sampling plans designated in this standard
electronic items. are applicable, but not limited, to inspection of the following:
NOTE - When specified by the responsible authority? this standard shall be called up in the specification, contract, inspection instructions or
a) End items,
other documents and the provisions set forth herein b) Cornponents and raw materials, shall govern. The ‘ responsible authority ’ shall be designated in one of the above documents. The
c) Operations,
responsible authority may be the customer. d) Materials in process,
5
F “”
IS : 10673 - 1983
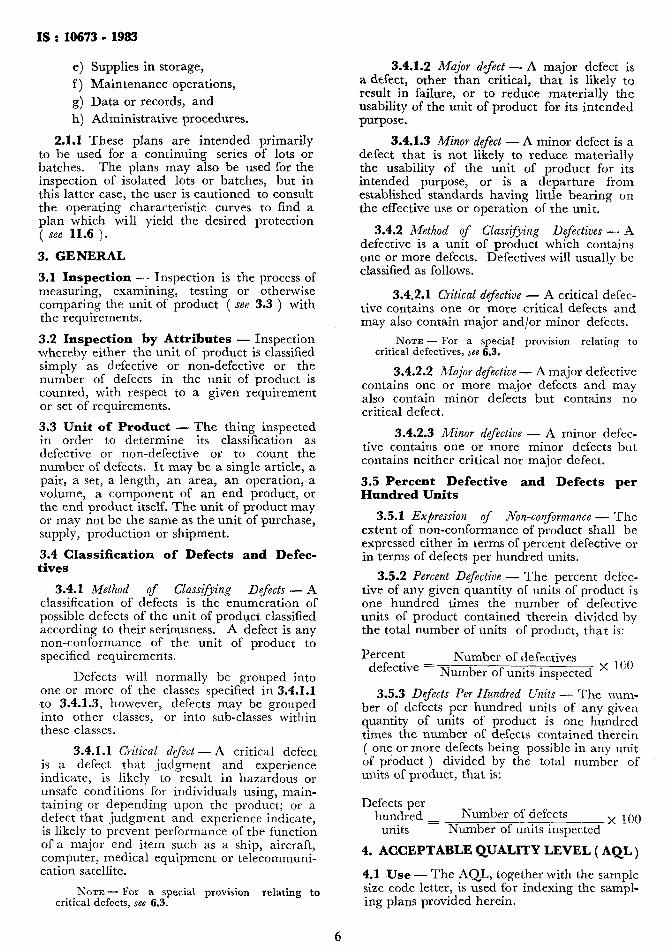
e) Supplies in storage,
f) Maintenance operations,
g) Data or records, and
h) Administrative procedures.
2.1.1 These plans are intended primarily to be used for a continuing series of lots or batches. The plans may also be used for the inspection of isolated lots or batches, but in this latter case, the user is cautioned to consult the operating characteristic curves to find a plan which will yield the desired protection ( see 11.6 ).
3. GENERAL
3.1 Inspection - Inspection is the process of measuring, examining, testing or otherwise comparing the unit of product ( see 3.3 ) with the requirements.
3.2 Inspection by Attributes - Inspection whereby either the unit of product is classified simply as defective or non-defective or the number of defects in the unit of product is counted, with respect to a given requirement or set of requirements.
3.3 Unit of Product - The thing inspected in order to determine its classification as defective or non-defective or to count the number of defects. It may be a single article, a pair, a set, a length, an area, an operation, a volume, a component of an end product, or the end product itself. The unit of product may or may not be the same as the unit of purchase, supply, production or shipment.
3.4 Classification of Defects and Defec- tives
3.4.1 Method of Class$ying Defects - A classification of defects is the enumeration of possible defects of the unit of product classified according to their seriousness. A defect is any non-conformance of the unit of product to specified requirements.
Defects will normally be grouped into one or more of the classes specified in 3.4.1.1 to 3.4.1.3, however, defects ~may be grouped into other classes, or into sub-classes within these classes.
3.4.1.1 Critical d&t - A critical defect is a defect that judgment and experience indicate, is likely to result in hazardous or unsafe conditions for individuals using, main- taining or depending upon the product; or a defect that judgment and experience indicate, is likely to prevent performance of the function of a major end item such as a ship, aircraft, computer, medical equipment or telecommuni- cation satellite.
NOTE - For a special provision relating to critical defects, see 6.3.
3.4.1.2 Major d$ect - A major defect is a defect, other than critical, that is likely to result in failure, or to reduce materially the usability of the unit of product for its intended purpose.
3.4.1.3 Minor defect - A minor defect is a defect that is not likely to reduce materially the usability of the unit of product for its intended purpose, or is a departure from established standards having little bearing on the effective use or operation of the unit.
3.4.2 Method of Classifying Defectives - A defective is a unit of product which contains one or more defects. Defectives will usually be classified as follows.
3.4.2.1 Critical defective - A critical defec- tive contains one or more critical defects and may also contain major and/or minor defects.
NOTE - For a special provision relating to critical defectives, see 6.3.
3.4.2.2 Major defective - A major defective contains one or more major defects and may also contain minor defects but contains no critical defect.
3.4.2.3 Minor defective - A minor defec- tive contains one or more minor defects but contains neither critical nor major defect.
3.5 Percent Defective and Defects per Hundred Units
3.5.1 Expression of .iV’on-conformance - The extent of non-conformance of product shall be expressed either in terms of percent defective or in terms of defects per hundred units.
3.5.2 Percent Defective - The percent defec- tive of any given quantity of units of product is one hundred times the number of defective units of product contained therein divided by the total number of units of product, that is:
Percent Number of defectives defective = Number of units inspected ’ loo
3.5.3 Defects Per Hundred Units - The num- ber of defects per hundred units of any given quantity of units of product is one hundred times the number of defects contained therein ( one, or more defects being possible in any unit of product ) divided by the total number of units of product, that is:
Defects per hundred = Number of defects _x 100
units Number of units inspected
4. ACCEPTABLE QUALITY LEVEL ( AQL)
4.1 Use - The AQL, together with the sample size code letter, is used for indexing the sampl- ing plans provided herein.
6
4.2 Acceptable Quality Level ( AQL ) -The .AQL is the maximum percent defective ( or the maximum number of defects per hundred units ) that, for purposes of sampling inspec- .tions, can be considered satisfactory as a process .average ( see 11.2 ).
4.3 Note on the Meaning -of AQL - When a consumer designates some specific value of AQL for a certain defect or group of defects, he indicates to the supplier that his ( the con- sumer’s ) acceptance sampling plan will accept the great majority of the lots or batches that the supplier submits, provided the process .average level of percent defective ( or defects per hundred units ) in these lots or batches be no greater than the designated value of AQL. Thus, the AQL is a designated value of percent defective ( or defects per hundred units ) that the consumer indicates will be accepted most of the time by the acceptance sampling procedure to be used. The sampling plans provided herein are so arranged that the probability of acceptance at the designated AQL value depends upon the sample size, being generally higher for large samples than for small ones, for a given AQL. The AQL alone does not describe the protection to the consumer for individual lots or batches but more directly relates to what might be expected from a series of lots or batches, provided the steps indicated in this standard are taken. It is necessary to refer to the operating characteristic curve of the plan, to determine what protection the consumer will~have.
4.4 Limitation - The designation of an AQL shall not imply that the supplier has the right to supply knowingly any defective unit of product.
4.5 Specifying AQLs - The AQL to be used will be designated in the contract or by the responsible authority. Different AQLs may be designated for groups of defects considered collectively, or for individual defects. An AQL for a group of defects may be designated in addition to AQLs for individual defects, or sub-groups, within that group. AQL values of 10 or less may be expressed either in percent defective or in defects per hundred units; those over 10 shall be expressed in defects per hundred units only.
,4.6 Preferred AQLs - The values of AQLs given in these tables are known as preferred AQLs. If, for any product, an AQL be design- ated other than a preferred AQL, these tables are not applicable.
5. SUBMISSION OF PRODUCT
5.1 Lot or Batch - The term ‘lot’ or ‘batch’ shall mean ‘ inspection batch ‘, that is, a collec- tion of units of product from which a sample is to
IS:10673 - 1983
be drawn and inspected to determine conform- ance with the acceptability criteria, and may differ from a collection of units designated as a lot or batch for other purposes ( for example, production, shipment, etc ) .
5.2 Formation of Lots or Batches - The product shall be assembled into identifiable lots, sub-lots, batches, or in such other manner as may be prescribed ( see 5.4 ). Each lot or batch shall, as far as is practicable, consist of units of product of a single type, grade, class, size and composition, manufactured under essentially the same conditions and at essen- tially the same time.
5.3 Lot or Batch Size - The lot or batch size is the number of units of product in a lot or batch.
5.4 Presentation of Lots or Batches - The formation of lots or batches, lot or batch size, and the manner in which each lot or batch is to be presented and identified by the supplier shall be designated or approved by the responsi- ble authority. As necessary, the supplier shall provide adequate and suitable storage space for each lot or batch, equipment needed for proper identification and presentation, and personnel for all handling of product required for drawing of samples.
6. ACCEPTPNCE AND REJECTION
6.1 Acceptability /of Lots or Batches - Acceptabilityof& or batch will be deter- mined by the use of a sampling plan or plans associated with the designated AQL or AQLs.
6.2 Defective Units - The right is reserved to reject any unit of product found defective during inspection whether that unit of product forms part of a sample or not, and whether the lot or batch as a whole is accepted or rejected. Rejected units may be repaired or corrected and resubmitted for inspection with the appro- val of, and in the manner specified by, the responsible authority.
6.3 Special Reservation for Critical Defects - The supplier may be required at the discretion of the responsible authority to inspect every unit of the lot or batch for criti- cal defects. The right is reserved to inspect every unit submitted by the supplier for critical defects, and to reject the lot or batch immediately, when a critical defect is found. The right is reserved also to sample, for critical defects, every lot or batch submitted by the supplier and to reject any lot or batch if a sample drawn therefrom is found to contain one or more critical defects.
6.4 Resubmitted Lots or Batches-Lots or batches found unacceptable shall be resub- mitted for reinspection only after all units are re-examined or retested and all defective units .
7
F@----- .~- -.... __. _~
IS : 10673 - 1983
are removed or defects corrected. The respon- sible authority shall determine whether normal or tightened inspection shall be used, and whether reinspection shall include all types or classes of defects or only the particular types or classes of defects which caused initial rejection.
7. DRAWING OF SAMPLES
7.1 Sample - A sample consists of one or more units of product drawn from a lot or batch, the units of the sample being selected at random without regard to their quality. The number of units of product in the sample is the sample size.
7.2 Representative Sampling - When app- ropriate, the number of units in the sample shall be selected in proportion to the size of the sub-lots or sub-batches, or parts of the lot or batch, identified by some rational criterion. When representative sampling is used, the units from each part of the lot or batch shall be selected at random.
7.3 Time of Sampling - Samples may be drawn after all the units comprising the lot or batch have been assembled, or samples may be drawn during assembly of the lot or batch.
7.4 Double or Multiple Sampling - When double or multiple sampling is to be used, each sample shall be selected over the entire lot or batch.
8. NORMAL, TIGHTENED AND REDUCED INSPECTION
8.1 Initiation of Inspection - Normal ins- pection will be used at the start of inspection unless otherwise directed by the responsible authority.
8.2 Continuation of Inspection - Normal, tightened or reduced inspection shall continue unchanged for each class of defects or defectives on successive lots or batches except where the switching procedures given below require a change. The switching procedures shall be applied to each class of defects or defectives independently.
8.3 Switching Procedures
8.3.1 Normal to Tightened - When normal inspection is in effect, tightened inspection shall be instituted when 2 out of 5 consecutive lots or batches have been rejected on original inspection ( that is, ignoring resubmitted lots or batches for this procedure ).
8.3.2 Tightened to Normal - When tightened inspection is in effect, normal inspection shall be instituted when 5 consecutive lots or batches have been considered acceptable on original inspection.
8.3.3 Normal to Reduced - When normal inspection is in effect, reduced inspection shall be instituted provided that all of the following- conditions are satisfied:
Cl 4
8.3.4
The preceding 10 lots or batches ( or more, as indicated by the note under Table 8 ) have been submitted to, normal inspection and none has been rejected on original inspection.
The total number of defectives ( or defects ) in the samples from the pre- ceding 10 lots or batches [or such other number as was used for condi- tion (a) above ] is equal to or less than the applicable number given in Table 8. If double or multiple samp- ling is in use, all samples inspected should be included, not ‘ first ’ samples only.
Production is at a steady rate.
Reduced inspection is considered desirable by the responsible authority.
Reduced to Normal - When reduced inspection is in effect, normal inspection shall be instituted if any of the following occur on original inspection:
a) A lot or batch is rejected,
b) A lot or batch is considered acceptable under the procedures of 10.1.4,
c) Production becomes irregular or dela- yed, and
d) Other conditions warrant that normal inspection shall be instituted.
8.4 Discontinuation of Inspection - In the event that 10 consecutive lots or batches remain on tightened inspection ( or such other number as may be designated by the responsi- ble authority ) , inspection under the provisions of this document should be discontinued pen- ding action to improve the quality of submit- ted material.
9. SAMPLING PLANS
9.1 Sampling Plan - A sampling plan indi- cates the number of units of product from each lot or batch which are to be inspected ( sample size or series of sample sizes ) and the criteria for determining the acceptability of the lot or batch ( acceptance and rejection numbers ).
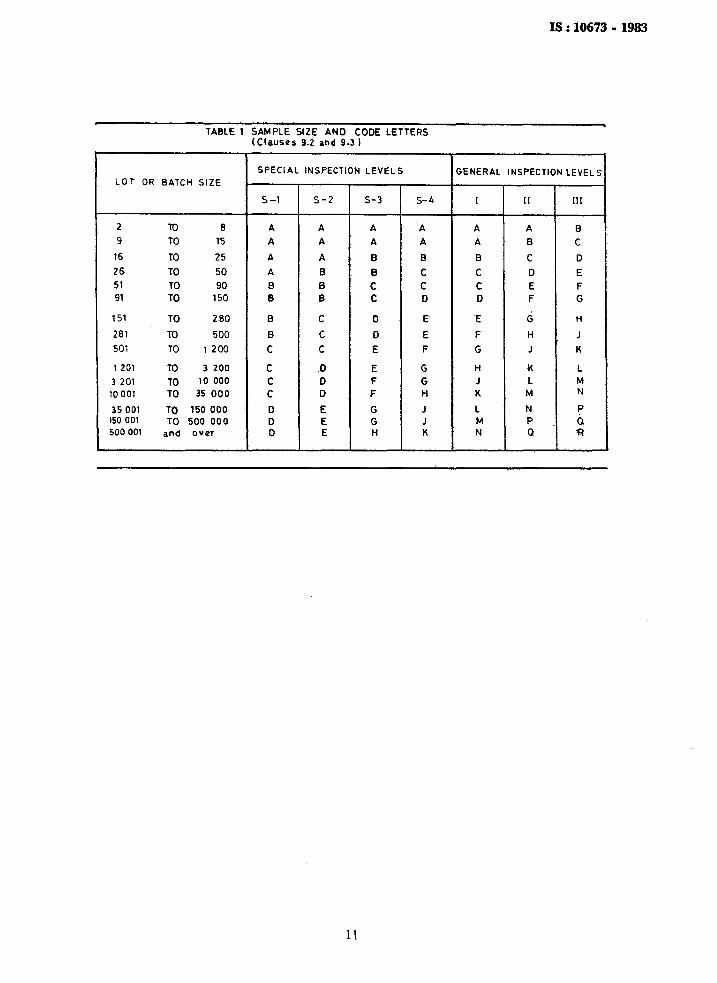
9.2 Inspection Level - The inspection level determines the relationship between the lot or batch size and the sample size. The inspection level to be used for any particular requirement will be prescribed by the responsible authority. Three inspection levels, I, II and III, are given in Table 1 for general use. Unless otherwise specified, Inspection Level II will be used. However, Inspection Level I may be
8
1” -_-..-._
1s : 10673 - 1983
specified when less determination is needed, or Level III may be specified for greater discri- mination. Four additional special levels, S-l, S-2, S-3, and S-4 are given in the same table and may be used where relatively small sample sizes are necessary and large sampling risks may or shall be tolerated.
NOTE - In the designation of inspection levels S-l to S-4, care shall be exercised to avoid AQLs inconsistent with these inspection levels.
9.3 Code Letters - Sample sizes are desig- nated by code letters. Table 1 shall be used to find the applicable code letter for the parti- cular lot or batch size and the prescribed inspection level.
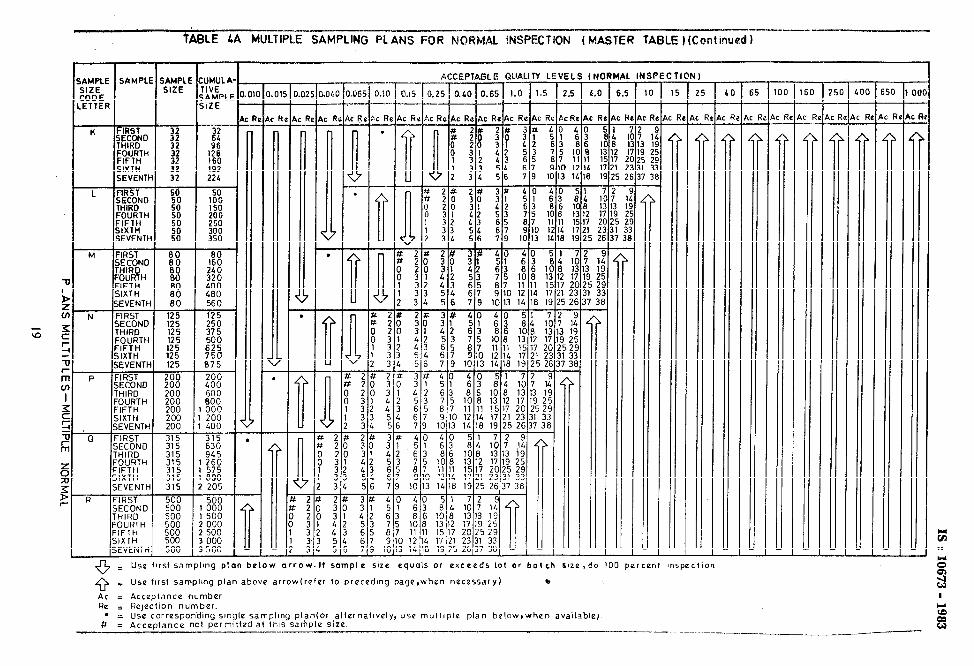
9.4 Obtaining Sampling Plan - The AQL and the code letter shall be used to obtain the sampling plan from Tables 2, 3 or 4. When no sampling plan is available for a given com- bination of AQL and code letter, the tables direct the user to a different letter. The sample size to be used is given by the new code letter, not by the original letter. If this procedure leads to different sample sizes for different classes of defects, the code letter corresponding to the largest sample size derived may be used for all classes of defects when designated or approved by the responsible authority. As an alternative to a single samp- ling plan with an acceptance number of 0, the plan with an acceptance number of 1, with its correspondingly larger sample size for a desig- nated AQL ( where available ), may be used when designated or approved by the respon- sible authority.
9.5 Types of Sampling Plans - Three types of sampling plan? ( single, double and multiple ) are given in Tables 2, 3 and 4, respectively. When several types of plans are available for a given AQL and code letter, any one may be used. A decision as to type of plan, either single, double Dr multiple, when available for a given AQL and code letter, will usually be based upon the comparison between the administrative difficulty and the average sample sizes of the available plans. The ave- rage sample size of multiple plans is less than for double ( except in the case corresponding to single acceptance number 1 ) and both of these are always less than a single sample size. Usually, the administrative difficulty for single sampling and the cost per unit of the sample are less than for double or multiple.
10. DETERMINATION OF ACCEPTABI- LITY
10.1 Percent Defective Inspection - To determine acceptability of a lot or batch under percent defective inspection, the applicable sampling plan shall be used in accordance with 10.1.1, 10.1.2, 10.1.3 and 10.1.4.
10.1.1 Single Sampling Plan - The number of sample units inspected shall be equal to the sample size given by the plan. If the number of defectives found in the sample is equal to or less than the acceptance number, the lot or batch shall be considered acceptable. If the number of defectives is equal to or greater than the rejection number, the lot or batch shall be rejected.
10.1.2 Double Sampling Plan - The number of sample units inspected shall be equal to the first sample size given by the plan. If the number of defectives found in the first sample is equal to or less than the first acceptance number, the lot or batch shall be consid.ered acceptable. If the number of defectives found in the first sample is equal to or greater than the first rejection number, the lot or batch shall be rejected. If the number of defectives found in the first sample is between the first accep- tance and rejection numbers, a second sample of the size given by the plan shall be inspected. The number of defectives found in the first and second samples shall be accumulated. If the cumulative number of defectives is equal to or less than the second acceptance number, the lot or batch shall be considered acceptable. If the cumulative number of defectives is equal to or greater than the second rejection number, the lot or batch shall be rejected.
10.1.3 Multiple Sample Plan - Under multi- ple sampling, the procedure shall be similar to that specified in 10.1.2, except that the number of successive samples required to reach a deci- sion may be more than two.
10.1.4 Special Procedure for Reduced Instec- tion - Under reduced inspection, the sampling procedure may terminate without either accep- tance or rejection criteria having been met. In these circumstances, the lot or batch will be considered acceptable, but normal inspection will be reinstated starting with the next lot or batch [ see 8.3.4 (b) 1.
10.2 Defects per Hundred Units Inspec; tion - To determine the acceptability of a lot or batch under defects per hundred units inspection, the procedure specified for percent defective inspection above shall be used, except that the word ‘ defects ’ shall be substituted for ‘ defectives ‘.
11. SUPPLEMENTARY INFORMATION
11.1 Operating Characteristic ( OC ) Cur- ves - The operating characteristic curves for normal inspection, shown in Table 10, indicate the percentage of lots or batches which may be expected to be accepted under the various sampling plans for a given process quality. The curves shown are for single sampling; curves for double and multiple sampling are matched as closely as practicable. The OC curves
9
IS : 10673 - 1983
shown for AQLs greater than 10 are based on the Poisson distribution and are applicable for defects per hundred units inspection, those for AQLs of 10 or less, and sample sizes of 80 or less are based on the binomial distribution and are applicable for percent defective inspection; those for AQLs of 10 or less and sample sizes larger than 80 are based on the Poisson distribution and are applicable either for defects per hund- red units inspection or for percent defective inspection ( the Poisson distribution being an adequate approximation to the binomial distri- bution under these conditions ).
Tabulated values, corresponding to selec- ted values of probabilities of acceptance ( Pa, in percent ) are given for each of the curves shown and, in addition, for tightened inspec- tion, and for defects per hundred units for AQLs of 10 or less and sample sizes of 80 or less.
11.2 Process Average - The process average is the average percent defective or average number of defects per hundred units ( which- ever is applicable ) of product submitted by the supplier for original inspection. Original inspection is the first inspection of a particular quantity of product as distinguished from the inspection of product which has been resubmit- ted after prior rejection.
NATE - It mav also be useful to calculate the estimated process akeragemwhich is normally defined as EPA = 100 multiplied by the number of defec- tives, or defects, in the samples from the most recent five consecutive batches and divided by the number of units of product in the samples from the same five batches. Resubmitted batches should not be included.
11.3 Average Outgoing Quality ( AOQ ) - The AOQ is the average quality of outgoing product including all accepted lots or batches, plus all rejected lots or batches after the rejec- ted lots or batches have been effectively 100 percent inspected.
11.4 Average Outgoing Quality Limit ( AOQL ) - The AOQL is the maximum of
the AOQS for all possible incoming qualities for a given acceptance sampling plan. AOQL values are given in Table 5A for each of the single sampling plans for normal inspection and in Table 5B for each of the single sampling plans for tightened inspection.
11.5 Average Sample Size Curves - Average sample size curves for double and multiple sampling are in Table 9. These show the average sample sizes which may be expec- ted to occur under the various sampling plans for a given process quality. The curves assume no curtailment of inspection and are approxi- mate to the extent that they are based upon the Poisson distribution, and that the sample sizes for double and multiple sampling are assumed to be O-631 n and 0.25 n respectively, where n is the equivalent single sample size.
11.6 Limiting Quality Protection - The sampling plans and associated procedures given in this standard were designed for use where the units of product are produced in a conti- nuing series of lots or batches over a period of time. However, if the lot or batch is of an isolated nature, it is desirable to limit the selec- tion of sampling plans to those, associated with a designated AQL value, that provide not less than a specified limiting quality protection. Sampling plans for this purpose may be selec- ted by choosing a limiting quality ( LQ) and a consumer’s risk to be associated with it. Tables 6 and 7 give values of LQfor the com- monly used consumer’s risks of 10 percent and 5 percent respectively. If a different value of consumer’s risk is required, the OC curves and their tabulated values may be used.
The concept of LQmay also be useful in specifying the AQL and inspection levels for a series of lots or batches, thus fixing minimum sample size where there is some reason for avoiding (with more than a given consumer’s risk ) more than a limiting proportion of defectives ( or defects ) in any single lot or batch.
10
c---- .-
IS2 10673 - 1983
TABLE 1 SAMPLE SIZE AND CODE LETTERS (Clauses 9.2 and 9.3 I
LOT’ OR BATCH SIZE
2 lO 8
9 TO 15
16 TO 25
26 TO 50
51 TO 90 91 TO 150
151 TO 280
281 TO 500
501 TO 1200
1 201 TO 3 200
3 201 TO 10 000
10 001 TO 35 000
35 001 TO 150 000 150 001 TO 500 000 500 001 and over
SPECIAL lNS.PECTlON LEVELS
s-1
A
A
A
A
0
0
0
0
C
c
C C
.D D 0
s-2 s-3 5-4
A A A
A A A
A 0 0
0 0 C
0 c C B C D
C D E
C D E
C E F
.D E G
0 F 6 D F H
E G J E G J E H K
;ENERAL INSPECTION LEVELS
I
I 1 II
A A
A 0
0 C
C D
-
C E
D F
_E d
F Ii
c J
H K
J L
K M
i
L N M P N Q
111
0
C
0
E
F
G
Ii
J
K
L M N
P
a 4-3
11
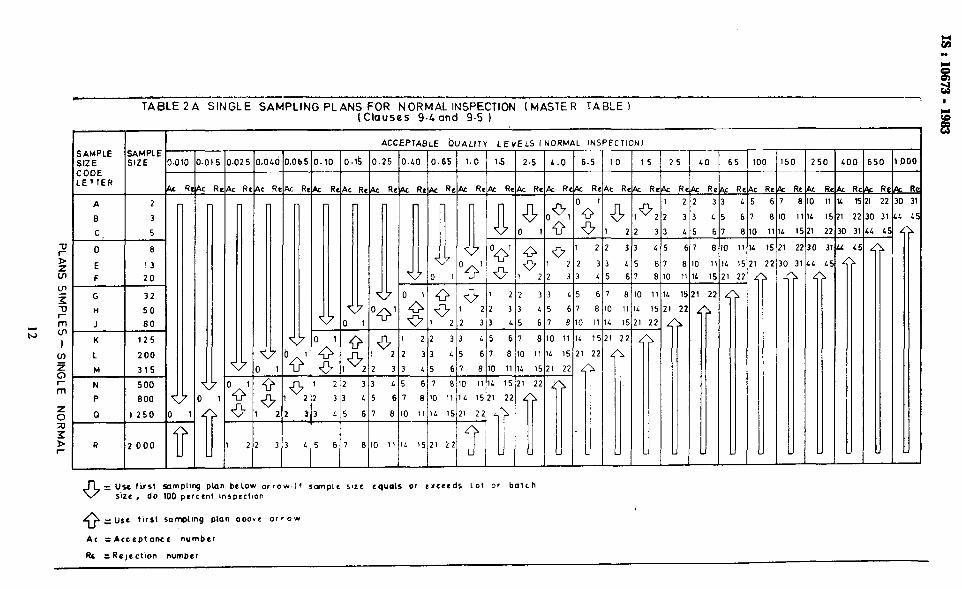
TABLE 2 A SINGLE SAMPLING PLANS FOR NORMAL INSPECTION (MASTER TABLE ) (Clauses 9.L and 9.5 1
ACI -
1.25
I ~P~ABLE QUALITY LE vELSI NORMAL lN5P
O.LO 0.65 1.0 15 2.5 L.0 6.5
2:
CO
- 65 j50
AMPLE ;IZE
-- 1.10 -_
- 25 -
SAMPLE SIZE CODE LETTER
065 -
-
52
13
IL
5
c R - ,c R - v. RI -
j_
'0
c R - ,
& I 2i
0 3'
L c
k Rek ReAz RePc ReAc RcAs ReLIc RI
3 0 1 22 33 15 f
22
01 $01 22 33
33 I.5 67 6
45 67 810 II
I 22 33 L5 67 6 10 11 IL l!
2 33 L5 6 7 6 10 11 1L 15 21 2;
3 ~5 67 8 10 11 1L 15 21 22
5 67 a IO 1114 15 21 22
I 610 1lIc 1521 22
IO 11 1L 15 21
j2
z
L
6
13
20
IL 15 21 22
32
50
80
125
200
315
500
800
1250
4
’ 3
: -- I L
i f
’ 8
V V 000 3 0 11
- --
+ = size , Use first sampl~q plan below orrowlf sanp,e size cqulrlr or exceeds Lot or batch
do 100 percent mspocl~on
Q= Use first sompllng plan above orrow
AC =Acceptance number
Re =Re)ection number
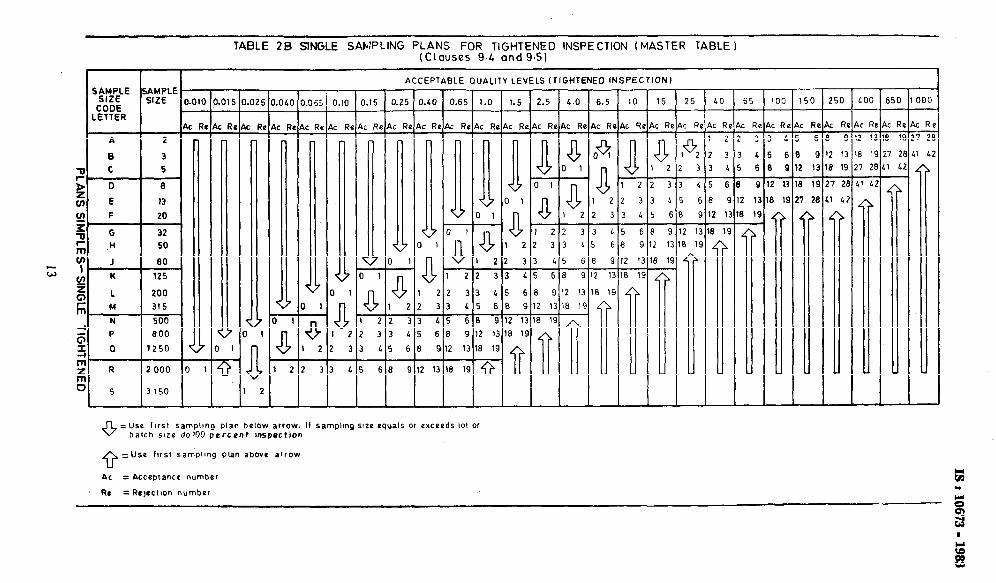
TABLE 2B SlNGLE SAMPLING PLANS FOR TIGHTENED INSPECTION (MASTER TABLE 1 (CLauses 9.4 and 9.51
ACCEPTABLE QUALITY LEVELS ITIGHTENEO INSPECTION1
0.010 0.015 0.025 0.040 0.06fi 0.10 0.15 0.25 0.60 0.65 1.0 1.5 2.5 6.0 6.5 10 15 25 LO 65 100 150 250 LOO 650 1000
AC ReAc RcAc ReAc RrAc RPAC ReAc ReAc ReAc ReAc ReAc ReAc ReAc ReAc RoAc RoAc ReAc ReAc ReAc ReAc ReAc ReAc ReAc RoAc ReAc ReAc R’
A 2
0 3
C 5
0 6
E I3
F 20
G 32
H 50
J 80
K 125
L 200
M 315
N 500
P
I
800
0 1250
22 33 L5 9 12 13 18 19 27 28 II 42
9 12 13 18 19
22 33 65 6 6 9 12 13 18 19
22 33 LS 68 9 12 13 10 19
22 33 LS 68 9 12 13 18 19
9 12 13 18 19
3 3 L 5 6 8 9 12 13 16 19
L 5 60 912 1318 19 &.
a= Use first sampling plan below arrow. If sampltng srze equals or exceeds lot or batch s#ze do100 percent rnspoction
-Use first sampling plan above arrow
Q-
AC = Acceptance number
’ Re = Rejectnon number
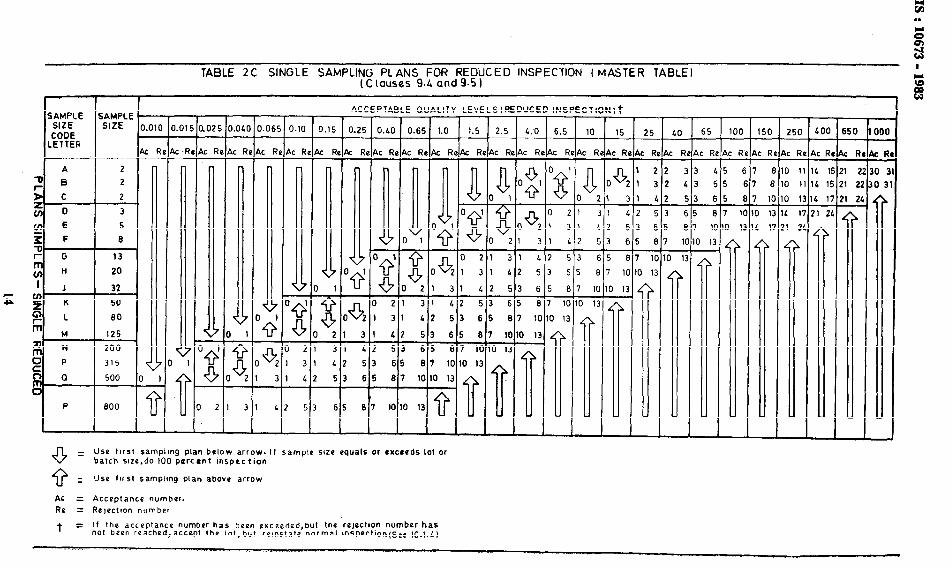
TABLE 2C SINGLE SAMPLING PLANS FOR REDUCED INSPECTION t MASTER TABLE) I
(C louses 9.4 and 9.5 I
I - ACCEPTABLE QUALITY cEVELS~REDUCED INSPECTi’ - -
).OL( ‘.06!
- 0.10 -
ic R -
SAMPLE SIZE
CODE LETTER
P
S AMPLE SIZE
-_
6.5 -_
k I: b -_
i--- I I -_ ! ’ I I i I 1(j 0 1:
jl
-.
-
25 -
: F -
I.010 10 -
c R -
8,
-
LO -
u R
65 -
kc R -
t f , i I - ’ II
I 1:
,
150 -
CR - LC R
0.15 0.25
k Re Ac R
21 3
31 L
12 5
53 6
65 6
0.40 0.65 1.0 1.5 2.5 L.-O I I I I I
c R -
1
1 -
ic R -
1
c Rs -
1
mc R c R -
1 2
1 2;
1 21
PC Ro AC Re Ac RoAc Re AC Re AC R
I 21 31 L2 53 65 E
(
I 1
3 !
: ;
j :
j !
3 i
1 1
3
5
8
1J
20
32
50
00
125
200
315
500
800
1 31 L2 53 65 01 1(
I 42 5 3 6 5 8 7 10 IO 1:
z 53 6 5 8 7 10 10 13
8 7 10 10 13
3 L 5
Use first samplmg plan below arrow. If sample sue equals or exceeds lot or batch slze.do 100 percent inspectlon
Q= Use flrst sampling plan above arrow
AC = Acceptance number.
Ro = Re)octmn number
t = If the acceptance number has been oxceeded,but the reJectIOn number has
not been reached,accept the 101, but remstate normal mspectlon(Sse 10.1.1)
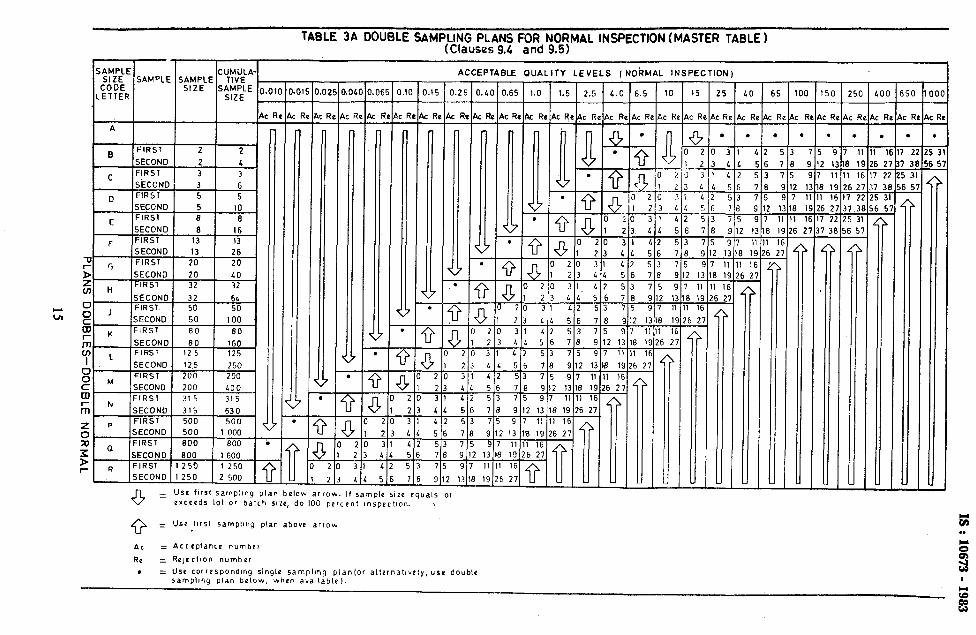
TABLE 38 DOUBLE SAMPLING PLANS FOR NORMAL INSPECTION (MASTER TABLE ) (Clauses 9.4 and 9.5)
ACCEPTABLE QUALITY LEVELS [ NOkUAL INSPECTION) 1 -_ 5.5 --
.cR 1 --
$ -_ nl
I 3 li
1’ t --p-
2’ -
- _ 10
- _
,c F k’ - _
li’ i
./
.- i
,._- _
-- _
, - i
I - _
2 - _
L2
5 f
53 7
7 E L 75
9 1; 1:
9 7 -il
3 II J 1 1’ lf
926 2
1 I 1
-i
5 2 -
- LO -
tc F -
.
-
-
-
-
! 1
7
I 1
i-T
62 -
-
1.06’ 0.65 -
4c RI
65
le AC Rc
.
2 2s 31
8 56 51
I 70
c RI u R -
.
: 2
56
53
78
75
9 1;
97
3 If
I II
9 21
5 T a 2
2
3
L
--r
5
5
7
i
9
T
? 13
-ii I 19
16
5 27
D- -
!J_ 2
L
SECOND 125 250
M FIRST 200 200
SECOND 200 400
N FIRS1 31 5 315
SECOND 315 630
P FIRS.7 500 500 ~
SECOND 500 1 000 0 FIRST 800 800 i
SECOND 800 I 600
R FIRST 1250 1250
SECOND 1250 2 500
J -r
F - $I_
2
z
-
I - U$e flrsl sampling plan below arrow. If sample size equals or exceeds Iol 0’ batch IIZO, do 100 percent ~nspectlon. \
Q= . Use t1rs1 samphng plan above arrow
AC = Acceptance numbtr
. .
Re = Re~ecllon number
. = Use corresponding single samplmg plan(or alternatIvely, use double sampling plan below. when avaIlable).
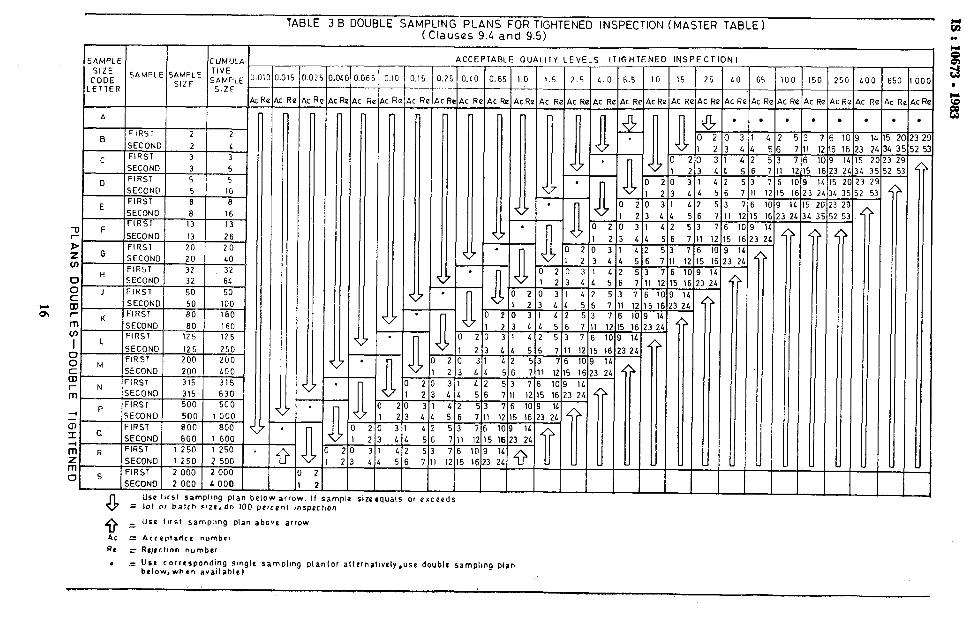
TABLE 3 B DOUBLE SAMPLING PLANS FOR TIGHTENED INSPECTION (MASTER TABLE) ( Clauses 9.4 and 9.5)
t; . .
1 3
I eA te c
d5 I4 1:
52
I’
!4 3
L I’ !O 2
43 IS 5
02 ‘9
55 ,3
9
3 II
- LOI -
,c F -
.
7 3 ; Y-i L ?
77 2 F -
ACCEPTAELE QUALITY LEVELS (TIGHTENED INSPECTION1 - I.?! -
ic R -
- 6.5
-
Acf 1
is- - .
- IO -
,c F -
1 \/ - - - - - I
-i
; 1 -i
,2
15 -
JC R -
a
i-
te I
I c I
2c
2 ?
3 I
4 2
SE
53
7 I’
7 E
2 I
09
62 1
L
-I -
l-
- 65C -
k F -
.
z
43
s-z
25 -
T - 25(
.c R -
.
-ii
, l(
7
32
z
I 3
j-?;
25 -
-
I 1
Ti
5 I 7 32 -
A
-
-
0.15 0.6: -
1.0 / 1.5 1 2.5 ! 1.C 25 10 65 150 1
10 /
5 :
71
7E
12 1
09
62
L I’
L3
k R -
.
v
1 1
i
5 I L-l 32
5-?;
43
PcRe AC ReAcReAc F
5 I 5 : 7 1
7 f 21
62
L
L
0 20 31 ( 23 LL !
20 31 42 !
76 2 1:
09 I 62
4 l!
L 38
D 2.
55
a i- I
tr 3
i-
I
z-
5
F
1 1 ri
5 1
I
!3 2 -
I -
. -
a 2 -1
3
L
L
E
E
7
1
12
-ic
j 16
11
24 -
.
50 . -
a i 2
-3
L
-i;
5
7
i
_j
Ii -
-
a 2
2
3
L
L
5
5
7
7
12
10
16 -
7
0 I
0
3
t
I 1
L
2
i6
83
11
. - .
-
- Use f$rSt samplmg Plan below arrow. If sample s~zoequals or exceeds lo1 or batch .51zo, do 100 percent ,nspoct,on
. = Use co’respondlng sln9le samplmg planlor altornatlveiy,uso double sampling pian brlow,when available)
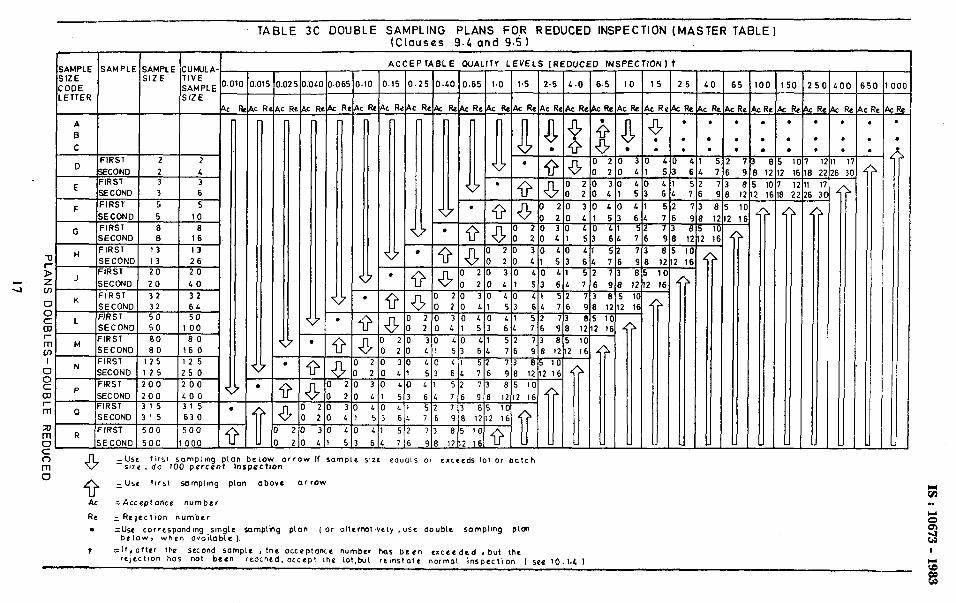
TABLE 3C DOUBLE SAMPLING PLANS F0.R REDUCED INSPECTION (MASTER TABLE] (Clauses 9.4 and 9.51
f I I I I AC -
.15 -
BLE OUALllY LEVELS (REDUC EP T, -
0.25 0.40 0.65 1.0 1.5 2.5 L.0
- -
6.5 I - _
4< d
-: -
I
1 - I
7 - I
7 -
! 7 -
1 !
11 -
1 -
‘ON -
15 25
- - LO 65
cP
:
73
9 f
85
2 :
1
100 -
c .
. *
1 6 3 -
c Rc -
-I- - 25 -
CR .
.
. 7 3 2
-i
5 3 -
A
” -
2 - .
-
D -
s R’ -
150 -
UZR - .
.
.
2 11
-i
3 2 -
4c Ra -
II -
.
LC R
0 . r
I -
1
t
CR4 - .
.
. 1
f
-! 7
L f-4
.
. .
!
7
AC R - .
.
.
T-
6
5-
8 1 i-i 12 1 -
I 1
1
? 14
e I 1
-i
2 II
! t
1:
1( ! If -
4
1 210 LIl 513 6jL 716
1 310 LIO 411 512 713
i
a i 2
?
L
8 z
2
3
L
L
6
z m -
first sompllng ptan below orrow If somplc wze srze , do 100 percent Inspection.
equals or exceeds lot or batch
” 9 =Use 11rst samplmg plan above arKw
AC =Acceptance number
RC I Rejection number
. =Use corrcspondmg smglc sampling plan below, when availabLe ).
( or altcrnolwcLy .usc double sompllng plW
t =It, otter the second sample , the occeptonce number has been exceeded , but the reJectlon has not been reached, accept the iot,but reinstate normot inspection ( see JO.,.& )
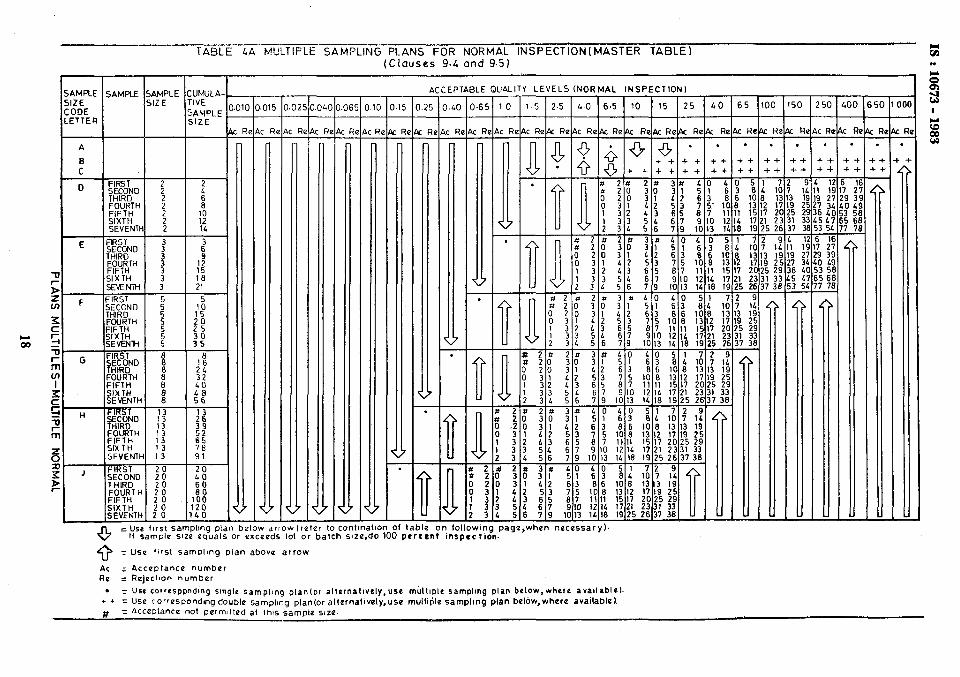
TABLE LA MULTIPLE SAMPLING PLANS FOR NORMAL INSPECTIONiMASTER TABLE) (Clauses 94 and 9.5)
UMULP IVE
)AMPLt ilZE
3LE 01 -
-I- 1.6: -
r R -
~ -
.
fELs (NORMAL INSPECTION)
2.5 &.O 6.5 10 15 25 40
JALITV 1
10 -
kc RI 21 -
n
Pl -
LO -
RI -
- IO -
RG
.
-+ -+
Y! 1;
9 2:
I 2f
-z ‘1
:;
:: -
- i0 -
RI - .
--t -+
-! :1
1 ‘2: 3:
1 3’
-i 1’
:, i Ll i L I 5 -
Go - : Rc - .
- 06’ -
:R -
I.15 -
c Rc
too - : Rc -
.
5’0.041
eAc R
i
D FIRST 2
st%Y 2 2
KUTTH 2 2 SIXTH 2 SEVENTH 2
E FRST 3 SECOND THIRD : FOURTH
-u FIFTH :
6 SIXTH SNENTH :
51 F FIRST 5
D :Fl%P :o”
FOURTH :o” FIFTH SIX1 H :o” SEVENTH 2 0
e= use flrsl sampmg P Y arrow 1, If sample suze ectua sr exceeds lot c Use +~rsi samollng plan abovo arrow
tch slze,ao 1UU percent inspection.
AC = 4cceptance number Re = RejectIon number
. = Use cor’escwdmg smglr sampling p~anlor alternallvely,use mult~plo sampling plan bolow,whrre avallablcl, l + = Use torresDondmg double sampling plantor altornalively,use multiple sampling plan bel6w,where available).
# = AWeDtame nOt oermltted at this sample s!ze.
iABLE LA MULTIPLAN SAMPLIHG~ANS FOR NO~&AL INSPECTION ( MASTER TABLE ) (Ccrnt hued 1 -.--
r :UMUL 1 TIVE 5AMPL 5lZE
2; 96
12 8 16
192 224
--v ::0 320 400 400 560
i25 250 375 500 625 75D 875
200 400 600 600
I 000 zoooo 315 630 945
I ‘5% I 890 ! 205
I N( -
4.0
MA1 -
6.5
CTI -
15 -
c RI -
ACCEPTAGL E WALI TY LEVEL SAMPLE SAMPLE SAMPLt SIZE
I I
SIZE CODE
LETTER
- 160 -
e AC Rz
--_ 0.06! T----
AC R c R, -
LC R -
A
SEVENTH 80
N FIRST
zlk$YD $5”
FOURTH 1;: FIFTH SIXTH ;:5” SEVENTH 125
P FIRST 200
?l%YD 200 200
KFUTRH “2% SIXTH SEVENTH %z
0 FIRST
:I%? D :;: 315
FOURTH 315 FIFTH SIXTH 31: SEVENTH 315
R FIRST 500 SECOND THIRD :“o: %TR; H 500
SIXTH % SEVENTH 500
_ 0 = Use f1rsi sampling plan below orrow.It sample size equals or exceeds lot or botch sfze,do 100 percent Inspeciion
G= Use ttrst samplmg plan above arrow(re+er to precedmg page,when necessary) *
AC = Acceptance number Re = Rejection number. l = Use corresponddlng smgle sampltng planfor allernatlvely, use multlple plan below,when available)
# = Acceptance not permltted al this sari?plo Size
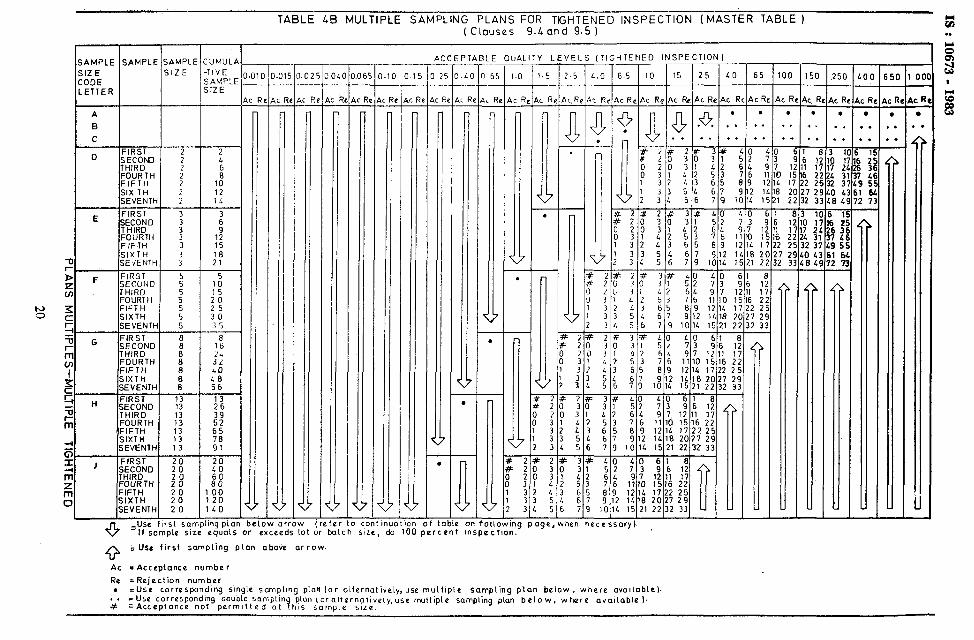
TABLE LB MULTIPLE SAMPLING PLANS FOR TIGHTENED INSPECTION (MASTER TABLE ) ( CLouses 9.L and 9.5 )
T :UMULI
TIVE ;AMPLF jlZE
SAMPLE SAMPLE
SIZE CODE I-l- LETTER
A
B
AhAPt
,IZE
!EL
l .
-_ 250 1 -_
\cR \ -_
.
. .
.*
5, 5 5 5 ! I
(TIGHTENED INSPECTION 1
1 32 L3 65 89 1214 1722 2 3 3 5 4 6 7 ‘312 IL18 2027 2’
: 34 5 6 7 9 1014 1521 2232 3
2# 7# 3# 40 2G 30 31 52 :s 2L 31 12 6’. 9 7 1211 17 31 12 53 7 6 11 10 1516 22
:: :i I?: 8 9 1214 1722 25 9 12 1L 18 2027 29
3 L 5 b 7 9 10,L 1521 22 32 33
7 b 1110 1516 22 8 9 12 14 17 22 25
5 6 9 12 1L 18 2027 29
76 9’ 1014 1521 22 32 33
912 lLl8 2027 29 7 9 10 II. 15 21 22 32 33
CE j 0 1 PA
PT
.I!(
AQLE
,c R, -
I
Y
1.5
.‘ F -
I -
.
-
!
r
7
, 1 I
-
LE\
: 2
i 3 L j b
-- - j5( -
,c R - .
l . . . -
A
c RI -
1.061
IC RI - ic R -
_, c D
FIRST SECOND THIRD
zw six TH SEVENTH
E FIRST
S’H% D
;$F;
SIXTH -0 I-.
SEdENlH
D F FIRST
5 ;;lrx&K
FOURTH P FIFTH
g SIXTH
-I SEVENTH
-ij G FIRST r SECONO m THIRD
Y
FOURTH FIFTH
z.
SIXTH SEVENTH
’ H FIRST
% SECOND
;;I
THIRD FOURTH FIFTH
$.
SIXTH SEVENTH
J FIRST
;;I SECOND THIRD
%
FOURTH FIFTH
0 SIXTH SEVENTH
--T-
:
: 2 7
:
:
3
:
2 L
: 10 12 14
:
1s 15
:f
5 10 15
:sJ 30 35
A
-_
8 16
il 40 LB 56
13 26 39
6552 70 91
-
n -
Size ( dc IUW percent InSpoctlon.
-Use first sampling plan abok arrow. w AC = Acceptance number
Re -Rejection number . tUse corresponding slng!e samplmg plan lor oiternotively, use multiple sampling plan below, where avallablc)~ . . #
-Use corresponding double somplin plan loroltornotivsly,use multiple sampling plan below, whore avafloble I. =Acccptance not permItted at his sample size. 9
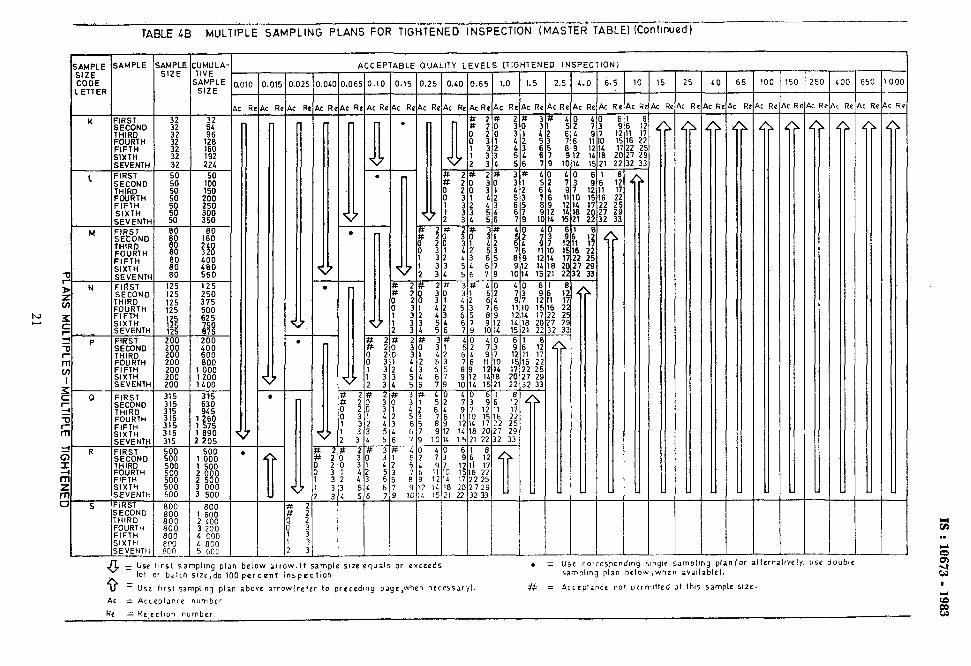
TABLE 4~ MULTIPLE SAMPLING PLANS FOR TIGHTENED ~NspEcTtorJ (MASTER TABLE) (Continued)
SAMPLE SAMPLE SIZE CODE LETTER
AMPLI SIZE
UMULA TIVE tAMPLE SIZE
- 1.010
- I.OlE
ACCEPTABLE QUALITY LEVELS (TIGHTENED - .025
- l.OU
c R c R : RI ic R
K FIRST
Sl%RODND
FFPFUTRHT H SIXTH SEVENTH
L FIRST
:lsND ol
;IFTRHT” SIXTH SEVENW
M FIRST
Sl%zND FOURTH
-0 Kl?
5 N
SEVENTF FIbSI
5
SECOND THIRD
z
WJ H SIXTH
_ SEVENTH s ‘p
?I FIRST
2 :I%%”
v) %%TH
I SIXTH
z 0
SEVENTH
FIRST I- ? :K:?
P FOURTH
m FIFTH SIXTH SEVENTH
$ R FIRST
SHEk?%ND
s
FOURTH FIFTH SIXTH SEVENTH
FIRST
SHE;cRo$J’
K-% H SIXTH SEVENTH
“3:
3:
;: 32
--z-
28
:8 50
Bo
1x0 80
::
125 125 125 125 I 5
1% %r
%8 200 200 200 200
315 315 315 315
:1: 315
500 500 500
:ooo”
:z
32
8; 128 160 192 224
1% 150
as 300 350
Bo 160
$8,
::I
125 250 375
22”:
i1% 200
5008 800
: s:oo 1 LOO
315
“giE
1”55! I 890 ? 205
500 1 000 1 500
1%
: “5%
G - .
.
.
800 800
loooo 800 EOO con -..
800 1 600 2 LOO 3 200 L 000
“5 ?8” 3 c; --
a = Use first samplmg plan below arrow.lf sample stze equals or exceeds
$+ iOf Or batch slze,do 100 perconl inspection.
Use 11rsl sampling plan above arrowlrefcr to prccedlng pagr,when necessary1
AC = Acceptance number
)NI -
6.5 -
- 10
-
CR -
1 I
5 2
:: 23 -
A
-
-
- ,oo -
: R -
A
65 -
c R -
$50
c RI -
A
LC RI -
n
!A c RI -
A
c RI -
4
‘e A c R -
A
c RI -
&t
Y
. = “se correspondmq s,ng’le samprrng plantor alternal~ve~~. “se double sampling plan bclow.when available).
# = Acceptance not r,rrmllted at thls sarhple 51Ze.
Rc = Re~ectlon number
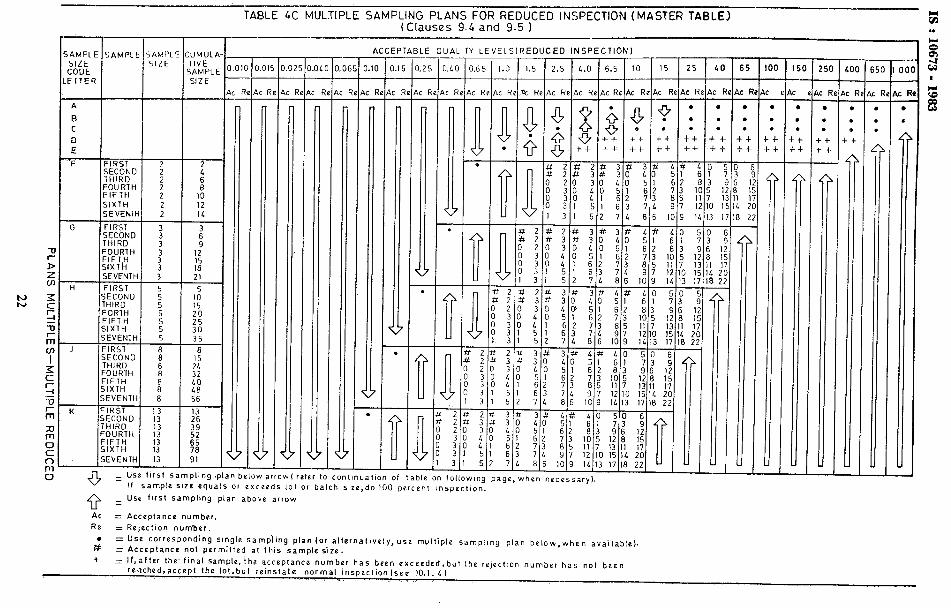
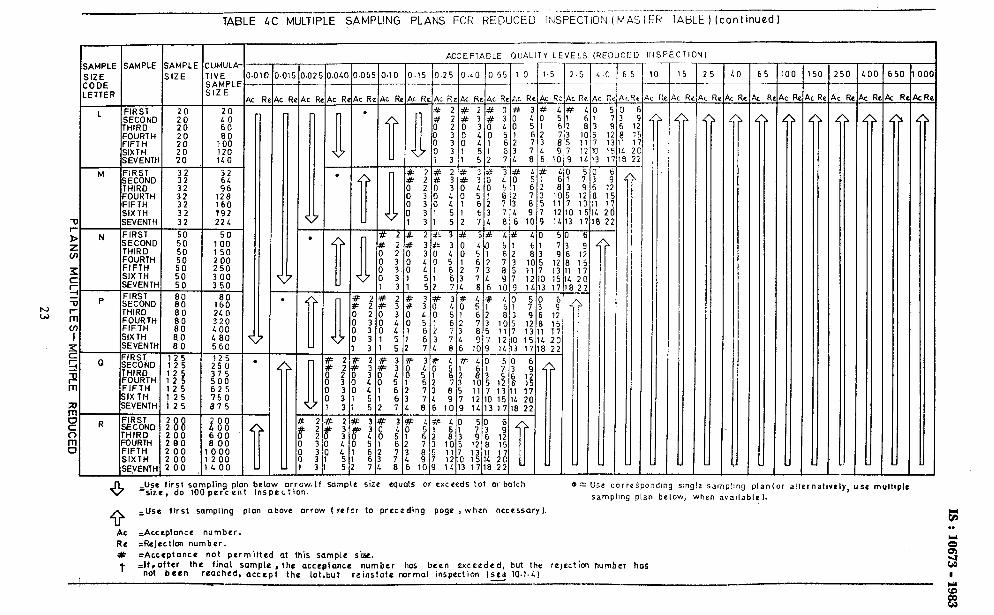
TABLE LC MULTIPLE SAMPLING PLANS FOR REDUCED INSPECTiON (MASTER TABLE ) (continued)
T I ACCEPTABLE GUALITY L
z-!rqzj0251dllO~F~
EV ELS (REDUCED lllSPECTlON1 ISAMPLE ISAMPLE lSAMPLl UMULA- -
IVE O.Ol( AMPLE IZE
AC R
t
20
ko” 80
100 120 1LO
22L
50 100 150
;5”0” 3 00 3 50
80 lb0 2L 0 320 LOO L 80 560
8
125 . 250 375 500 625 750 875
200
K B 00
/80” 1.00 V
- - - - 4.0 15 25 LO 50 250
- - -
,c R w R CR 4c R’ c Rc CR
r--J - - - - -
n 0 n. A I 1
I ; 1 1 3 1 / , I 1:
i : ! 21 82
~
55
CR -
1 1 1
;: -
- 65 -
c f -
4
- 100 -
k R -
A
2.5
” R
e
1’ 1
I t -
1 3 1 5 1 -
1 1 1
i’2 -
-5
I’
-
- -00 -
c RI -
c1
- 550 -
CR -
0
L -L - - _-
@= Use COrrespondlng siW,le samF!:nCJ pian(Or alternatIVely, “se “,UltlptC sampling plan below, when ava!lable I.
- 001 -
c R’ -
A
-
5 0.
‘e A AC R< .
sampling plan below ar,row.If sample six equals or exceeds Lot or batch lOOpercent inspectton.
Use first sampling plan above arrow I refer to preceding pogo t when necessary).
AC ,Acccpfonce number. Rt =Rejcction number. x rAcceptanco not permitted at this sample s’k + $fo;af;‘,‘e,the final sample, the acceptance number has been exceeded, but the rcJ@ction number has
/ reached, accept the lot,but reinstate normal mspectian (sta 10.1.4)
z . .
t: . .
-._ TABLE 5A AVERAGE OUTGOING QUALITY LIMIT FACTORS FOR NORMAL%SPECTlON (SINGLE SAMPLING)
(Clause Il.& )
1 SAMPLE SIZE
cc )DE LE’ TTER
I ACCEPTABLE QUALITY LEVEL
1.60
- I.65 1.0
-
1.5 IS0
220 220
190
-
250
330 310
290
650 000
- LO6
-
0.1:
-
1.25 6.5 600
Et- :90
630
-
.06!
- 0.10 2.5 6.0 10 1s 2s 60 65 1oc
-
16(
1sc
130
I.010 I.01 5 I.02
730
720
560
100
100
l@
11
11
9.7
9.9
9.0
3.2
7.5
1. 3
L2
L6
39
63
65
63
-
56
50
47
97
110
90
A
B
C
28
27
12
6.5
6.9
7.6 17
e
13
20
180
170
270 LIO
250
--
D
E
F
6.6
!.6
?.7
'.L
-
I.5
1.2
:.1
r
.B
17
1s
16
2L
2L
22
LO
3L
33
82
72
73
120
110 !.8
1.7
1.7
-
1.6
1.6
I.L
1
1
1
i
L
4.2 .a
G 32
H 50
J 80
4.3 6.1
3.9 6.3
6.0 5.6
14
13
12
21
19
18
29
29
16 1.2
1.67
I.69
1.62
-
I.63
.S6
I.52
.7L
.L2
.LL
.&6 1.1 I
;
L
12 5
200
315
I.29
I.27
1.17 I.27 .39
I.17 .2L 40
1.16 .2s .36
I.1
.97
00
90
.82
.7s
3.6 5.2
3.3 1.7
3.0 :.7
12
.18
.ll
.ll
-
097
I.12
500
800
i250
.071
,012
.3
I.2
I.2
2.9
,OLS
I.029 .06:
IO00 1.16 I.22 .33 .L7 .73 7 .061
NOTE-For the exact AOQL, the above values should be multiolwd by
(I- sample size
lot or batch siee )
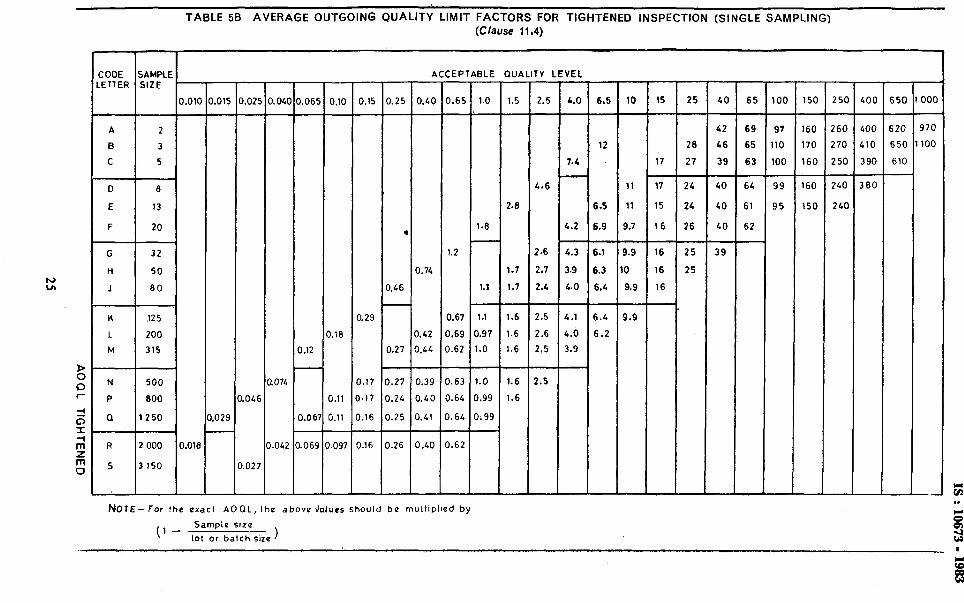
TABLE 58 AVERAGE OUTGOING QUALITY LIMIT FACTORS FOR TIGHTENED INSPECTION (SINGLE SAMPLING) (Clause 11.4)
CODE SAMPLE ACCEPTABLE QUALITY LEVEL LETTER SIZE
0.010 0.015 0.025 0.040 0.065 0.10 0.15 0.25 0.40 0.65 1.0 1.5 2.5 4.0 6r5 10 15 25 40 65 100 150 250 400 650 lO(
A 2 42 69 9’1 160 260 400 620 97
B 3 12 28 46 65 110 170 270 410 650 110
C 5 7.4 ;7 27 39 63 100 160 250 390 610
D 8 4.6 11 17 24 40 64 99 160 240 360
E 13 2.8 6.5 11 15 24 40 6i 95 150 240
F 20 1.8 4.2 6.9 9.7 16 26 40 62 *
G 32 1.2 2.6 4.3 6.1 9.9 16 25 39
H 50 0.74 1.7 2.7 3.9 6.3 10 16 25
J 80 0.46 1.1 1.7 2.4 i.0 6.4 9.9 16
’ H 125 0.29 0.67 1.1 1.6 2.5 4.1 6.4 9.9
L 200 0.16 0.42 0.69 0.97 1.6 2.6 4.b 6.2
M 315 0.12 0.27 0.44 0.62 1.0 1.6 2.5 3.9
N 500 0.074 0.17 0.27 0.39 0.63 1.0 1.6 2.5
P 800 0.046 0.11 0.17 0.24 0.40 0.64 0.99 1.6
0 1250 0,029 0.067 0.11 0.16 0.25 0.41 0.64 0199
R 2 000 0.018 0.042 0.069 0.097 0.16 0.26 0.40 0.62
S 3 150 0.027
NOTE- For the exact AOQL, the above Mues should be multipIled by
(1 - Sample St20
lot or batch size 1
I.46
J.20
I.73 -
a.27
1.2
1.49
I.13 -
J.33
.70
.67
.53 -
Pl
(
i
IS:10673 -1983
TABLE 6~ LIMITING QUALITY IIN PERCENT DEFECTIVEIFDR WHICH SZTOPERCENT
(FOR NORMAL INSPECTION,SINGLE SAMPLING)
'ABI -
1.15 -
OU -
1.25 -
LIlY EVE - -
0.60 I.65 - -
- 1.0 -
11 -
L.6 -
1.3
3.3
2.9
TT
1.9
1.6 -
1.4
-
1.5 2.5 L.0 8.5 10
60
51
37 56
25 41 51
27 36 I(
16 25 30 c2
12 16 20 27 3L
10 13 16 22 29
6.2 I1 1L 19 24
1
16
6.9
7.6
6.5
i-T
L.6
3.1
2.7
2.1
z-
1.5
I.2 -
3.7
TT
2.5
2.3 -
-
I.4 9.4 12 16 23
5.9 7.7 10 1: i---H L.9 6.1 9.0
L.0 5.6
3.5
I _LLLL
26
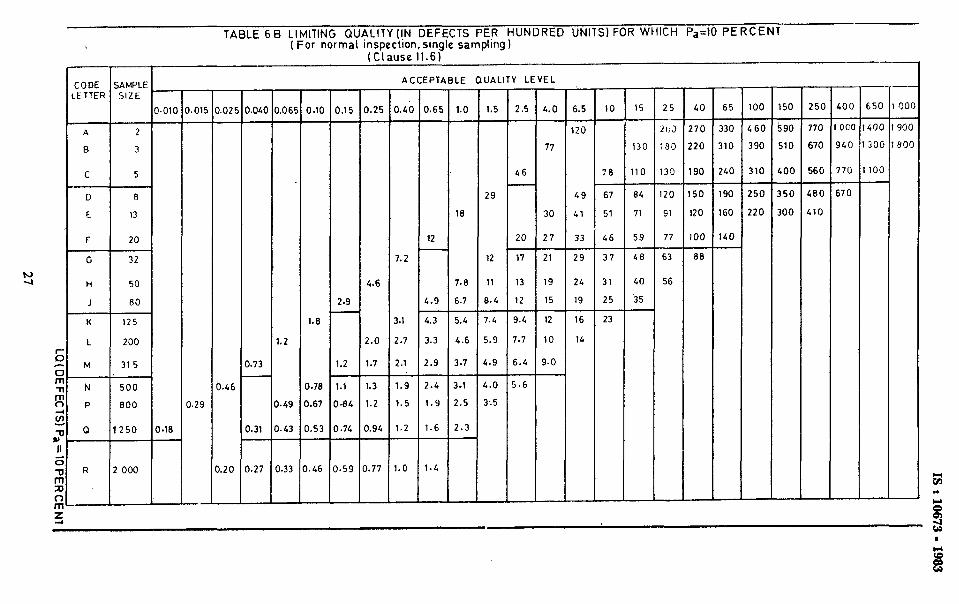
TABLE 68 LIMITING QUALITY (IN DEFECTS PER HUNDRED IJNITS) FOR WHICH P>=lO PERCENT ( For normal inspection,single sampling1 _ --
_.... -. -
(Clause 11.61
ACCEPTABLE QUALITY LEVEL :I CODE SAMPLE .ETTER SIZE
A 2
0 3
C 5
0 8
E 13
F 20
c 32
H 50
J 80
K 125
L 200
M 315
k 500
P 800
0 1250
R 2 000
-
250 - 770
670
560 -
480
410
-
650
-
6.5 - 120
49
41
33
-
I50 - 590
510
$00 -
B50
300
-
1.25 1.5 -
29
12
11
8.4 - 7.4
5.9
4.9 - 4.0
3.5
25 -_ lid
; so
65 .OlC I.015 ,025 ).04( 1.06: I.15 2.5 4.0
46
20 27
17 21
13 19
12 15
9.4 12
7.7 10
6.4 9.0
5.6
460
390
000 4do
340 SOG
770 100
900
800
78
250 j70 67
51
46
56
I90
160
140
L.9
;.3
3.3
!.9
7.8
6.7 - 5.4
4.6
!.4
1.9
3.7 -
3.1
2.5
1.6 2.3
29
24
19
37
31
25
ee
6.6
1.0
I.7 -
.3
.2
1194
2.9
16
1L
-
23
-
1.e
I.78
j.67
j.53
1.2
1.1
I.84
I.74
1.9
I.5
1.2
I.46
j.29
--
j.31
j.27 j.33 1.46 I.59
-
.77
IS :10673 - 1983
-. TABLE 7A LtMITING QUALITY (IN PERCENT UEFECTIVE) FOR WHICH P.=SPERCENT
IfOh: NORMAL INSPECTION,SINGLE SAMPLING) (Clause 11.6)
A 2
B 3
C 5
D 6
E 13
F 20
G 32
H 50
J 00
K 125
L 200
M 315
N 500
P 800
Q 1250
R 2 000
ACCEPTABLE QUALITY LEVEL
66
60
50 46
;
32
26
26
,065
41 34
30
25
20
7
15
14
12
9.4
iT
5.6
5.4
I.95
1.79
t.62
5.2
5.3
6.2
1.6
1.3
1.1 -
.
2.1
1.6
1.4
2.6
2.1
1.8
6.1
1 ).3e
I.24
I.32 1.39
28
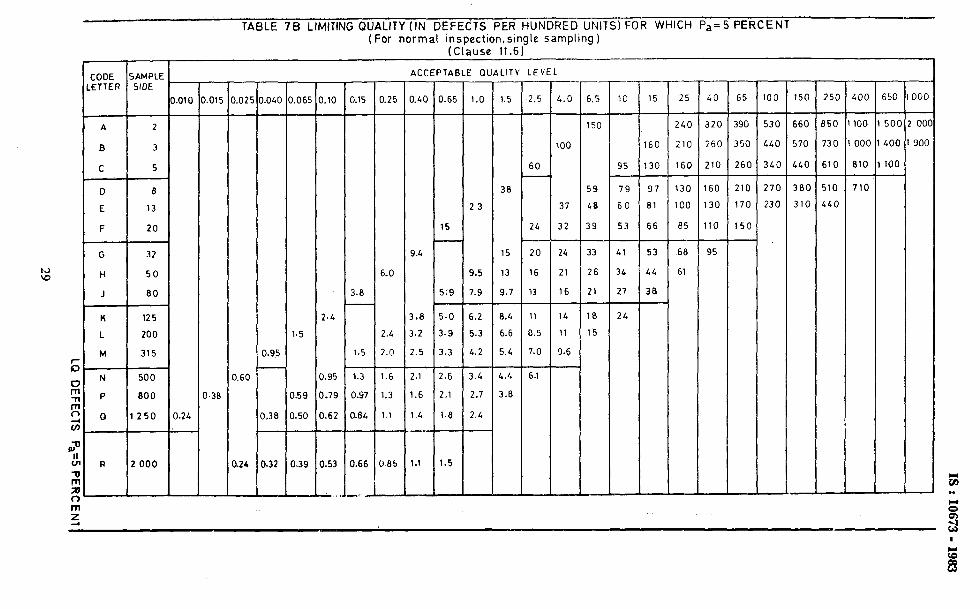
TABLE 78 LIMITING QUALITY (IN DEFECTS PER HUNDRED UNITS) FOR WHICH Pa=5 PERCENT (For normal inspection,single sampling)
(Clause 11.6)
ACCEPTABLE QUALITY LEVEL CODE SAMPLE ETTER SIDE
A 2
B 3
C 5
D 8
E 13
F 20
G 32
H 50
J a0
K 125
L 200
M 315
N 500
P a00
0 1250
R 2 000
I
-
40
-
32c
26(
21c -
160
130
110 -
95
-
65
-
390
350
26C -
210
170
15c -
-
100
-
530
440
340 -
270
230
-
250
-
850
730
610 -
510
440
-
.OlO -
I.24
-
-
-
1.02:
-
-
.04c -
1.95 -
I.60
.38
-
X24 1.32
-
-
.06E -
I.5
I.5 9
b.50
-
I.39
-
- -
I.15 I.25
- -
LO
3.8 -
1.5 - 1.3
0.97
).a6 -
2.L
2.0 - 1.6
1.3
I.1
-
1.66 1.85
- -
3.40 J.65 - -
15 -
9.4
3.8
3.2
2.5
- 2.1
1.6
1.4
-
5.9 -
j.0
I.9
3.3 - !.6
!.l
I.8 --
1.0 -
23
9.5
7.9 -
6.2
5.3
4.2
3.4
2.7
2.4
-
- -
1.5 2.5 - -
60 -
15
13
9.7 -
a.4
6.6
5.4
- 1.4
3.8
24 -
20
16
13 -
11
8.5
7.0
6.1
-
6.5 -
150
59
40
39 -
33
26
21 -
10
15
-
15
-
160
130 -
97
ai
66 -
53
44
38 -
-
25
-
!40
210
160 -
130
100
a5 -
68
61
-
150
-
660
570
440 -
300
310
-
400
-
100
000
810 -
710
-
.015
-
I.38
.95
.79
8.62
-
95 -
79
60
53 -
Ll
34
27 -
24
32
24
21
16 -
14
11
9.6 -
/
TABLE 8 LIMIT NUMBERS FOR REDUCED INSPECTION (Clause 8.3.3)
NUMBER OF ACCEPTABLE QUALITY LEVEL
SAMPLE UNITS FROM LAST 10 LOTS OR
BATCHES
- - -
l.OlC I.01 ).02! I*OL( 1.06: 0.10 I.15 I ( 1.25 L4 I.65 1.0 1.5 2.5 4.0 6.5 - - -- -
zo- 29
30 - 49
SO- 79
. . . . . . . . . . . 0
. . . . . . . . 0 0
BO- 129 . . . . . . . . . 0 2
130- 199 . . . . . . . 2 4
200- 319 . . . . . . . 4 8
320- 499
500 - 799
800-l 249
. . . . . 0 0 4 8 14
1250-l 999
2 000-3 lL9
3 150-4999
. . . . . . 0 0 2 J 14 25
. . . . 0 0 2 4 I4 24 42 - - - - -
. . . . 0 0 2 4 7 13 24 40 69
5 000-J 999
8 000-12 499
2500-19 999
. . 0 0 2 4 8 14 22 10 68 115
0 1 4 8 I4 24 30 57 111 86 - -
, . 0 0 i 4 !5 40 63 10 181
. 0 0 2 1 4 ‘4 ;2 68 05 81
0 0 2 4 ; !I ;0 i9 110 169 -_ -
0 0 4 8 I4 2 LO 18 15 81
0 I 8 I4 24 0 I 67 I1 06
2 3 I4 25 40 i3 1 10 31 01
- - - _I-
. Denotes that the number of sample umts from the la51 10 lots or batches IS not sufflclent for
!O 000-31 499
I1 500-49 999
2 50 000
65 650
8 13
25
22
36
63
68
105
181
181
277
14
25
40
42
72
115
I05
177
217
181
301
471
297
490
24 39 68
40 63 110
68 105 181
113
181
189
110
161
169
reduced InspectIon for fhls AQL. In lhts Instance, more than 10 lots or batches may be used for the calculation,provided Ihat the lots or batches used are the most recent ones an sequehce,that they have all been on normal inspectlon.and that none has been rejected while on original Inspection.
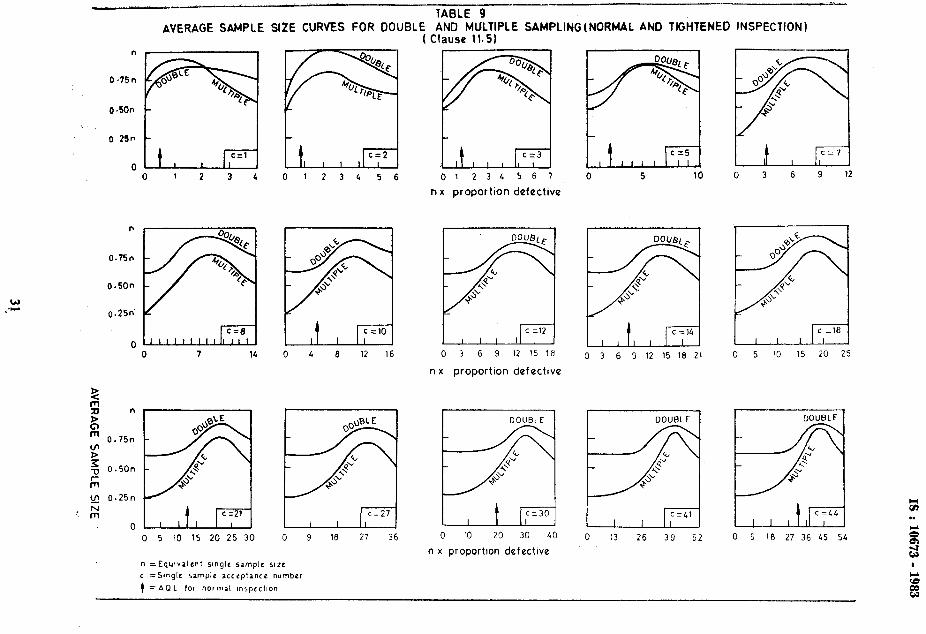
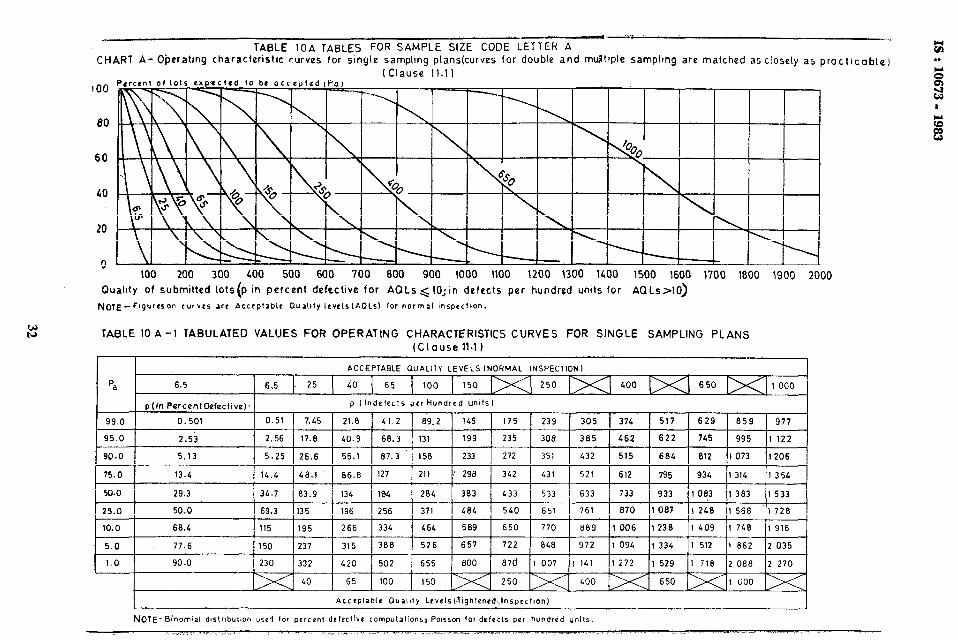
TABLE t0A TABLES -@OR SAMPLE SIZE CODE LETTEk A -r Li
t: CHART A- Oberating characteristic curves for single sampling plans(curves for double and mtitlple sampltng are matched as closely a; practicable) l *
80
60
LO
20
0
(Clause Il.1 1
100 200 300 LOO 500 600 700 800 900 1000 I\00 1200 1300 MOO 1500 1600 1700 1800 1900 2000
Quality of submitted lots(p In percent defectwe for AQLs,(l0;1n defects per hundred units for AQLs>lO)
f+Jo~~-F~lgureson curves arc Acccplablr Qualify IrvclslAOLsl for normal 1nspcclr0n.
TABLE 10 A -1 TABULATED VALUES FOR OPERATING CHARACTERISTICS CURVES FOR SINGLE SAMPLING PLANS
(Clause 11.1)
ACCEPTABLE QUALITY LEVELS INORMAL INSPECTION1
Pa
o(ln PorcontDefocllvo)~ p (Indefects prrtlundred Unlls)
99.0 0.501 0.51 7.45 21.8 41.2 69.2 145 175 239 305 374 517 629 059 977
95.0 2.5; 2.56 17.6 40.9 66.3 131 199 235 306 365 462 622 745 995 1 122
90.0 5.13 5.25 26.6 55.1 87.3 158 233 272 351 432 515 664 812 1073 1206
75.0 13.4 14.4 46.1 66.6 127 211 [ 298 342 431 521 612 795 934 1 314 1354
, 50.0 I 29.3 ( 34.7 , 63.9 , 134 , 184 204 [ 363 , 433 ( 533 , 633 , 733 , 933 ,I063 ,l 363 ,I533 ,
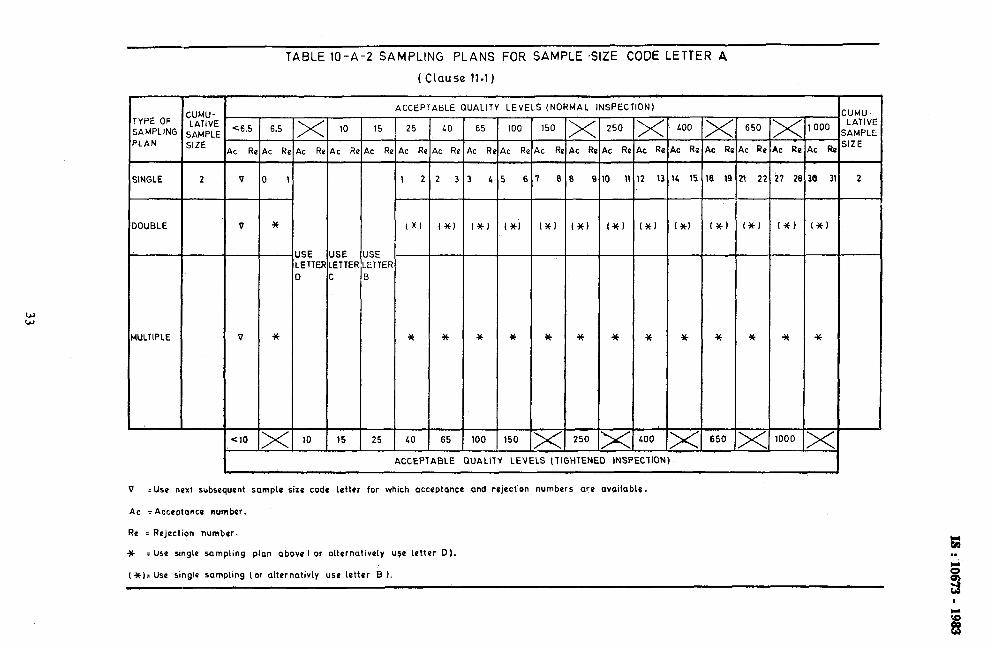
TABLE 10-A-2 SAMPLING PLANS FOR SAMPLE -SIZE CODE LETTER A
( Clause 11.1)
CUMU- LATIVE
SAMPLE SIZE
ACCEPTABLE QUALITY LEVELS (NORMAL INSPECTION) AlMU- LATIVE
;AMPLE jlZE
2
LO <6.5 6.5 10 15 25 65 100 150 X 250 x LOO g LC Rc
650 x 4c RI
000
ic RI ic Rc K Rs 4c R ic RI 4c RN mc R LC Rc
2 2 3 1 L 6 I 8 I 1 2 l?
t*t I *t (*J I *i (*I IX) I*) I*)
*
LO
w * *
150
*
x
* * w
d
600 65 100 250
ACCEPTABLE QUALIlY LEVELS lTlGHTENED INSPECllON)
,c Rc
SE ETTEF
,c R< \c R rc RI \c R k RI LC Rt
V ) ’ IL 15 8 14 ‘1 2; i? 2; e 3
V * oc) 1*J
*
OCJ (*I I*1
ISE ETTEF
ISE ETTEf I
V *
57
* *
15 25 650
V =Uso next subsequent sample size code lettrr for Which acceptance and rejection numbers are available.
AC = Acceptance number.
Re = Rejection number.
Jc - Use smglo sampling plan above I or alternatively u$e letter Dl.
I *J: Use single samplmg (or alternativly use letter 8 1.
“M . .
-- TABLE IO-8 TABLES FOR SAMPLE SIZE CODE LETTER 8
CHART B-Operattng chorocteristlc curves for single sampling plans (curves for double ona multlple somplmg ore matched OS closely OS practicable)
80
60
20
0 100 200 300 uy0 500 600 700 800 900 1000 1100 1200 1300 UOO 1500 1600 1700 1800 1900 2000
Quality of submItted lotsIp in percent defective for AQLs <lO;in defects per hundred units for AQLs >I0 1
NOTE - Figures on curves ore Acceptoblc Quolil y Levels (AOLsl tar normal inspection.
TABLE 108-l TABULATED VALUES FC)R OPERATING CHARACTERISTIC CURVES FOR StNGLE SAMPLING PLANS (Claus e 11.1 1
t 1
ACCEPTABLE CHJALITV LEVELSINORMAL INSk’ECtlON)
Pa 4.0 4.0 15 25 40 65 150 250 400 650 1’ 000
p (In Percent Oefeclwz) p (In Defects per Hundred UnttsI
99.0 0.33 0.34 4.97 14.5 27.4 59.5 96.9 117 159 203 249 345 419 573 651 947 1029
95.0 1.70 1.71 11.8 27.3 45.5 07.1 133 157 206 256 308 415 496 663 748 1065 1 152
1 90.0 3.45 3.50 17.7 36.7 58.2 105 ’ 155 181 234 208 343 496 541 716 a04 1 131 1 222
75.0 9.14 9.60 32.0 57.6 04.5 141 199 228 207 347 408 530 623 809 903 1 249 1 344
50.0 20.6 23.1 55.9 89.1 122 189 256 209 356 422 489 622 722 922 I 022 1389 1 409
25.0 37.0 46.2 69.0 131 170 247 323 360 434 507 580 724 832 1 046 1 152 1 539 1 644
10.0 53 6 76.8 130 177 223 309 392 433 514 593 671 825 939 1 165 1 ,277 1 683 1 793
5.0 I 63.2 199.9 t 158 1 210 1 258 1 350 1 430 1 481 i 565 I 648 I 730- I 690 11 008 11 241 11 356 1 1713 1 806
1.0 78.4 154 221 200 335 437 533 580 672 761 040 1 019 1 145 1 392 1 513 1 951 2 069
6.5 6.5 25 40 65 100 150 250 400 1 000
I Accentable Qualltv Levels (Tiohtoned Insoection~ I
NOTE- B~nomtol dlstributlon used lor percent defective computations; Potsson for detects ptr hundred units.
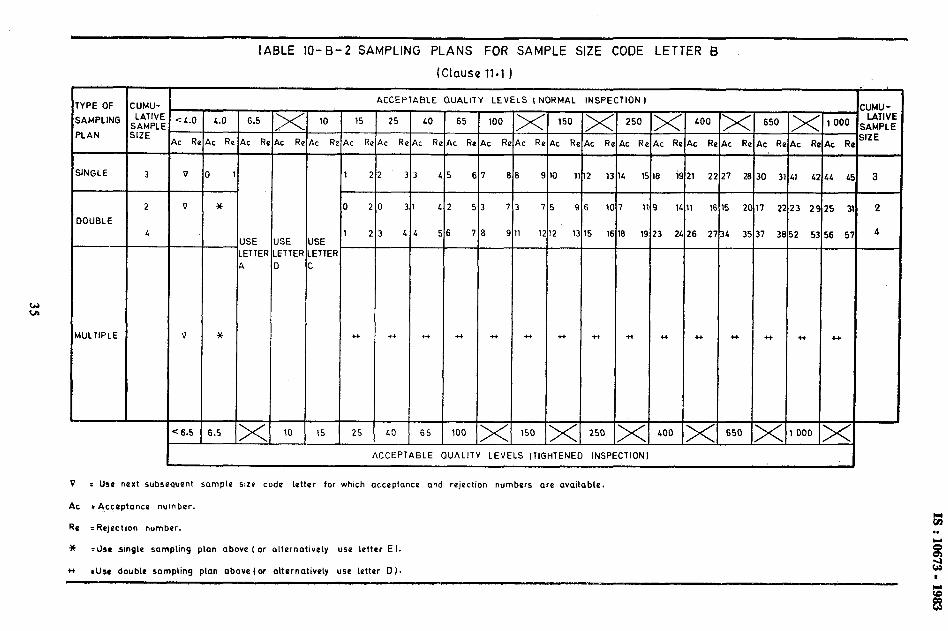
IABLE IO-B-2 SAMPLING PLANS FOR SAMPLE SIZE CODE LETTER 6
(Clause 11.1 )
ACCEPTABLE CiLIALiT’, LEVELS I NORMAL INSPECTION I YPE OF
,AMPLING
‘LAN
:uf.w- LATIVE SAMPLE ili!E
CUMU- LATlVl
SAMPLE SIZE
6.5
\c R \c R ,c R,
65 100 650
c R ,c Rc ,c R ic R ic R LC RI 4c R kc R
*
L ISE L ETTEF P
*
: 6.5 5.5 >(
Re /:
fOUBLE
-_
IULTIPLE
I
I d
++ i-+ ++
65
-
t*
- 100 -
I
-
cc
! 1
-
.I+
I.0 >< 150 >< 250 - - -
ACCEPTABLE QUALITY LEVELS (TIGHTENED INSPECTION1
!6 2
5 21
16 5’ SE ETTEF
ISE ETTEf
* +b * cc
25 -
650 10 1 15
V : Use next subsequent sample we codk letter for which acceptance and rejection numbers ore available.
AC z Acceptance number.
Re = Rejectton number.
* r&e single sampling plon obove I or olternotively use letter El.
4 :Use double sampling pian above lor alternatively use letter D).
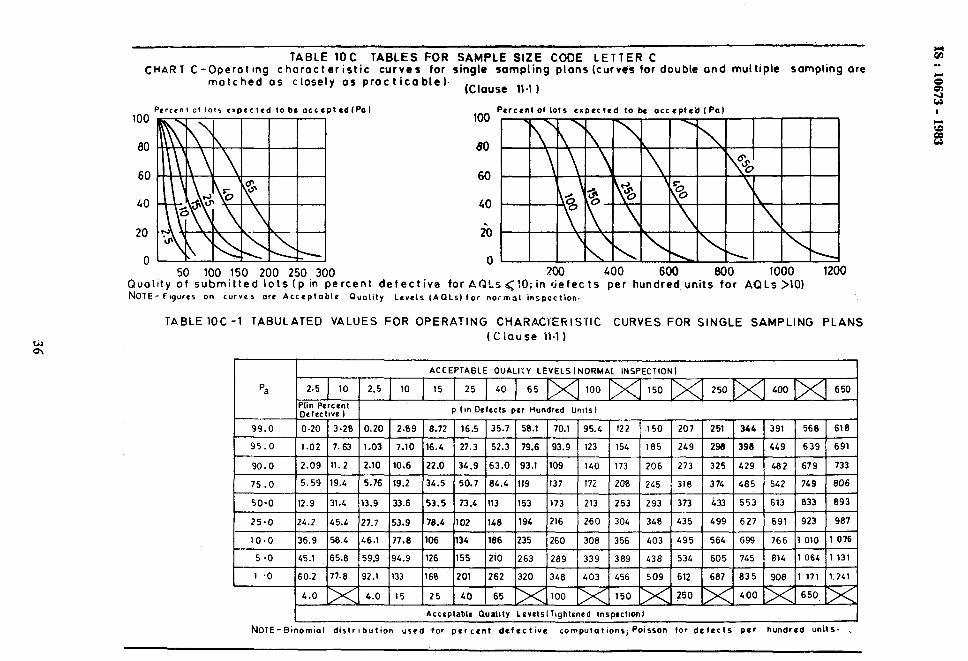
TABLE TOC TABLES FOR SAMPLE SIZE CODE LETTER C CHART C-Operotmg chorocteristic curves for single sampling plans (curves for double and multiple SCImpling ore
matched OS closely OS procticablcl. (Clause 11.1 I
Pertrn! 01 10,s e~pcctekl to be acceptcd(Pol
60
loo
80
60
40
i0
0 50 100 150 200 250 300
Quolity of submitted lots (p in percent defective for NOTE-Figures on curves ore Acceptable
AOLs<lO; in defects per hundred units for AQLs >I01 Quality Lcvcls (AQLs) tar nok’m31 inspection.
Percent of lot5 cxDccled occcptea (Pal
TABLE 1OC -1 TABULATED VALUES FOR OPERATING CHARACTERISTIC CURVES FOR SINGLE SAMPLING PLANS
(Ciause 51.1)
I I ACCEPTABLE OUALIYY LEVELS INORMAL INSPECTION1 I
na
J
2.5 10 2.5 10 15 25 40 65 100 150 250 400 650
Plin Percent na,ort,v* I p IWI Defects per Hundred Units1 , - _ _. . . _ , ,
99.0 IO.20 13.28 IO.20 1 2.89 18.72 1 16.5 135.7 150.1 I 70.1 195.4 1 122 150 1 207 1 251 1 344 1 391 1 568 1 618
50.0 12.9 31.4 13.9 33.6 53.5 73.4 113 153 173 213 253 293 373 iu 553 613 033 893
25.0 24.2 45.4 27.7 53.9 78.4 102 148 194 216 260 304 346 435 499 627 691 923 987
10.0 36.9 50.4 46.1 77.6 106 134 186 235 260 308 356 403 495 564 G99 766 1010 1 076
5 *o 145.1 165.8 159.9 194.9 1126 1155 12iO 1263 1289 I 339 I389 I 438 I 534 I 605 I 745 I 814 I1 064 11 131 I I L I I
1 .o 60.2 77.8 92.1 133 160 201 262 320 348 403 L56 509 612 687 835 908 1 171 1.241
4.0 4.0 15 25 40 65 100 150 ?50 400 650.
1 Acceptable Quality LcvelslT~ghtened lnspccllonl I NOTE-Binomlol distribution used tar percent defective computationsjPoisson for detects per hundred u&s. _
t: . .
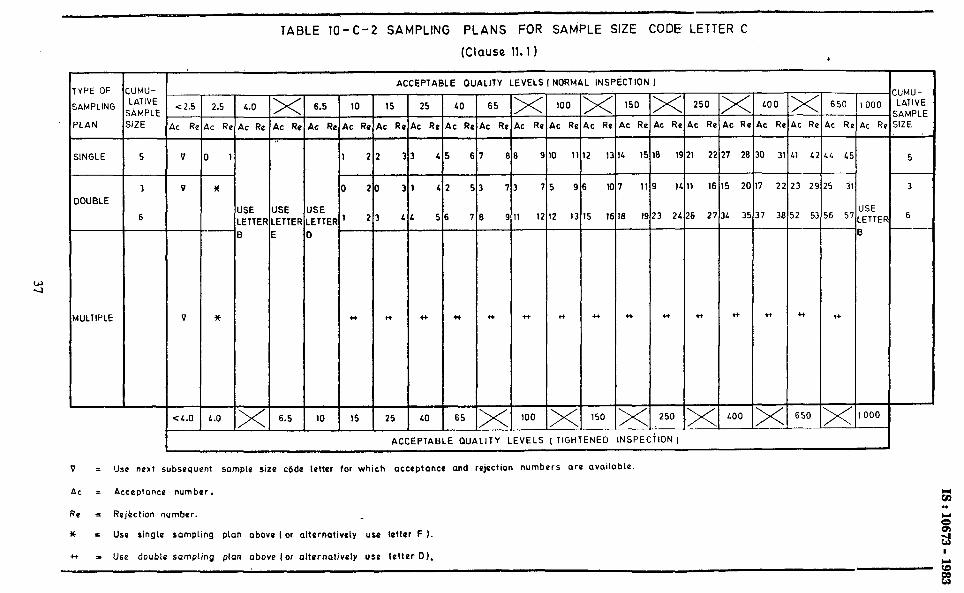
TABLE 10-t-2 SAMPLING PLANS FOR SAMPLE SIZE CODE LETTER C
(Clause 11.1 I
ACCEPTA8LE QUALITY LEVELS I NORMAL INSPECTION I UMU- .ATIVE AMPLE IZE
UMU- LATIVE AMPLE IZE
TYPE OF
SAMPLING
PLAN
SINGLE
DOUBLE
MULTIPLE
150
kc Rc
3 l!
250 LOO 650 ,000
,c A, 4c R,
<2:5 2.5 L.0 >( ic Rr
-l-
! L
3 II
15
21
,
x X 6.5 10 15 25 >( ,c Rc
100
\c RI
>( ,c Re
LO 65
tc Ro AC Rc
67 I
53 ’
78 !
++ ++
65 x
4c RI ic RI k Rm it Ra c R ic Rc kc Re
, 1
ISE ETTEI I
I
L L
-e
L.0 X
k Rc 4c RI \c Rc ,c RI LC Rr
32
I1
:2
.
,
i3
\
,
! 1
3 I’
17
5 11
.
I
!
1;
+t
! 1: L 1’ 1 2 I 26 0 3 1 L 4 L! 5 v
1
6 1
1 11
6 2
4-t
5 2C
L 3:
H
I 2
7 31
*
3 2’
2 5. --
H
3
6 --
V
JSE ETTEI I
SE ETTEF
jSE ETTEF
b
V H CI ++ H
CL.0 -
100 150 X 250 X LOO 650 -
6.5 10 15 25
ACCEPTABLE QUALITY LEVELS ( TIGHTENED INSPECTION )
V L use next subsequent sample size code letter for which acceptance and rejection numbers are available.
AC = Acceptance number.
Re = dejhction number.
* = Use singie sampling plan above I or alternatively use letter F 3.
* = Use double sampling plan above (or alternatively use letter D).
tl . . 0’ 3 I
r
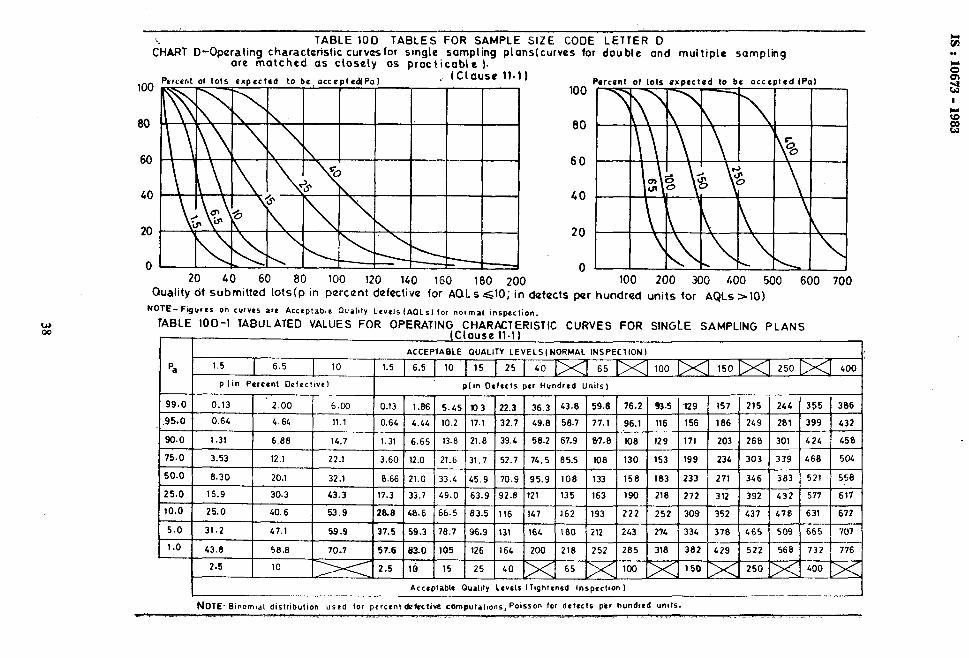
i* TABLE 1OD TABLES FOR SAMPLE SIZE COOE LETTER 0 CHART D-Oparating characteristic curvesfar single sampling plans(curvas for double and multiple sampling
are matched as closely OS practicable ).
100
80
60
40
20
0
Percent of lots expected to bo,occcptodlPo) . (Clause 11.1
20 40 60 80 100 120 140 160 180 200 ^
80
60
100 200 300 400 500 600 700 Uuallty 01 submitted lots(p In percent dafectivo for AQLs ~10; in dafocts per hundred units for AQl_s >I01
NOTE- Figures oh curves a~ Accrplablr Quality Levels IAOLs) for normal inspection.
TABLE 100-l TABULATED VALUES FOR OPERATING CHARACTERISTIC CURVES FOR SINGLE SAMF’LING PLANS
r I (Clause 11.1)
Acceptable Qualdy Levels llqhfrned lnspoct~on I
NOTE-Banomlal distribution used for percent detective computpt~ons, Poisson for defects pkr hundred umt~. w- -. - .” I .~_. . . ._.... _.i . . ..i .^ .- .
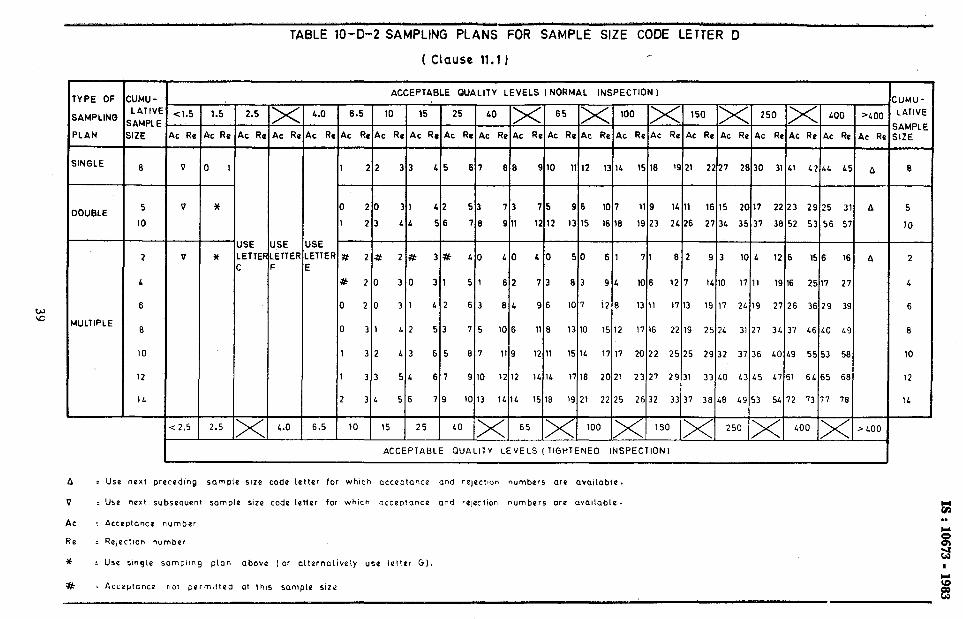
TABLE 10-D-2 SAMPLING PLANS FOR SAMPLE SIZE CODE LETTER D
( Clause 11.1 I
YPE OF
iAMPLING
‘LAN
JNGLE
IOUBLE
IULTIPLE
:ut4J - LATIVI
iAMPLE ilix
5
IO
2
L
6
< 1.5 1.5 2.5
LC RI
: 2.5
tc Rc LC R
SE ETTE
x AC RI
ISE ETTEF
ACCEPTABLE QUALITY LEVELS I NORMAL INSPECTION I
L.0 6.5 10 15 25 LO >< 65 >( 100 >( 150 >( 250 >( LOO ‘~00
,c Rc AC Re AC Re AC Re AC Rc AC Re AC Re AC Re AC Re AC Re AC Rc AC Re AC Re AC Re AC Ro AC Re Ac R
1 22 33 L5 67 66 9 10 11 12 13 1L 15 16 19 21 2227 2830 31 Lt L2 LL L5 a
0 20 31 42 53 73 75 96 10 7 11 9 14 11 16 15 20 17 22 23 29 25 31 A
1 23 LL 56 70 9 11 12 12 I3 15 16 16 19 23 2126 27 3L 35 37 38 52 53 56 57
SE ETTER # 2 #
I I # 20
0 20
0 3 1
1 32
1 33
2 3L
2# 3# LO LO LO 50 61 71 62 93 IO L 12 6 156 16 A
30 31 51 62 73 83 9L 10 6 12 7 IL 10 17 11 19 16 2517 27
31 L2 63 6L 96 10 7 i2 6 13 11 17 13 19 17 2L 19 27 26 36 29 39
75 10 6 11 6 13 10 15 12 17 16 22 19 25 2L 31 27 3L 37 L6 40 I.9 42 53
L3 65
5L 67
56 79
67 11 9 12 11 15 11 17 17 20 22 25 25 29 32 37 36 LO L9 55 53 56
9 10 12 12 1L 1L 1716 2021 23 27 29 31 33 LO L3 L5 L7 61 6L 65 66
1013 lL11 15 18 19 21 22 25 26 32 33 37 36 48 L9 53 5L 12 73 77 76
6.5 10 15 25 1 LO x/ 65 >< 100 >( 150 >( 250 >( LOO >( >LOO
ACCEPTABLE QUALITY LEVELS (TIGHTENED INSPECTKJNI
A : Use next precodlng sample size code Letter for which acceptance and rejectIon numbers are ovaltable.
Q z Use next subsequent sample SIZO code letter for which acceptance and rejectIon numbers ore wallable.
AC : Acceptance number
Re z RejectIon number
Y : Use sm9Le sampling plan above (or alternatively use letter 6).
# = Acceptance not permitted at this sample size.
:UMU-
LATIVE
iAMPLE ilZE
5
10
2
L
6
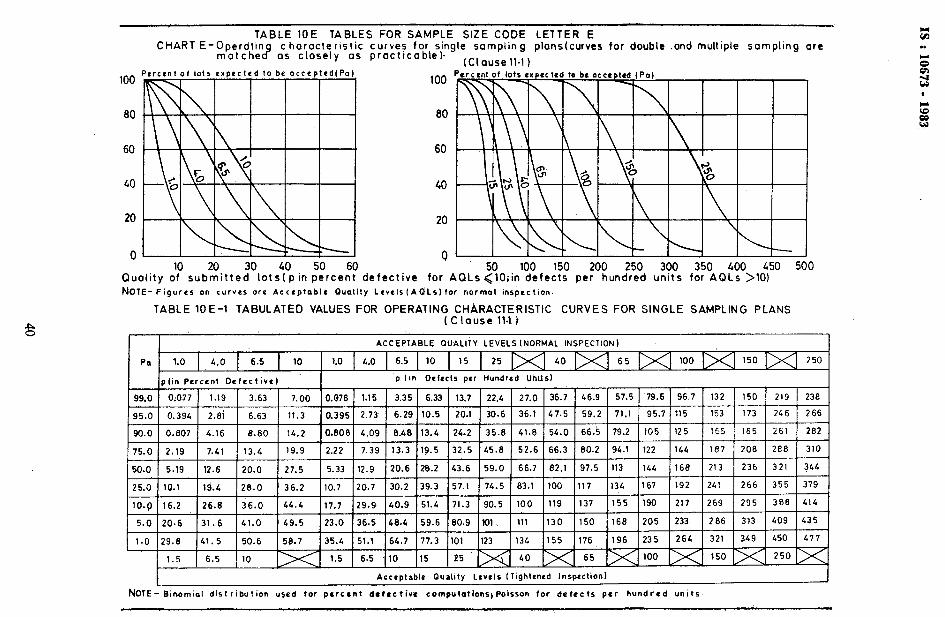
TABLE 10E TABLES FOR SAMPLE SIZE CODE LETTER E CHART E-\pae,r!;z
c? c horocteristic curves for single sampling plons(curves for double .ond multiple sompling ore
OS closely ‘OS procttcobte). (Cl ouse 11.1 1
100
80 80
60
GO
20
0
60
250 300 350 600 450 500 Quolity dp sub~itted)“lots~op in :k)rcer? defective for AQLs $O;in’%fe% pef’iundred units for AQLs >lO) NOTE-Figures on curves ore Acceptable Duality LevclslA~Ls)for normal inspection.
TABLE lOE-1 TABULATED VALUES FOR OPERATING CHhRACTERlSTlC CURVES FOR SINGLE SAMPLING PLANS [C louse 11.1 1
25.0 10.1 14.4 28.0 -36.2 10.7 20.7 30.2 39.3 57.1 74.5 83.1 100 117 134 167 192 ZL! 266 355 379
10.9 16.2 26.8 36.0 44.4 17.7 29.9 40.9 51.4 71.3 90.5 100 119 137 155 190 217 269 295 388 414
5.0 20.6 31. 6 41.0 49.5 23.0 36.5 48.4 59.6 80.9 IO1 111 130 150 168 205 233 286 313 409 435
1.0 29.8 41.5 50.6 58.7 35.4 51.1 64.7 77.3 101 123 134 155 176 196 235 264 321 349 450 L77
~ 1.5 6.5 10 1.5 6.5 10 15 25 40 65 100 150 250
Acceptable Quality Levels Ilightened Inspection)
NOTE- Binomial dislribution used for percent defective computations,Poisson for defects per hundred units
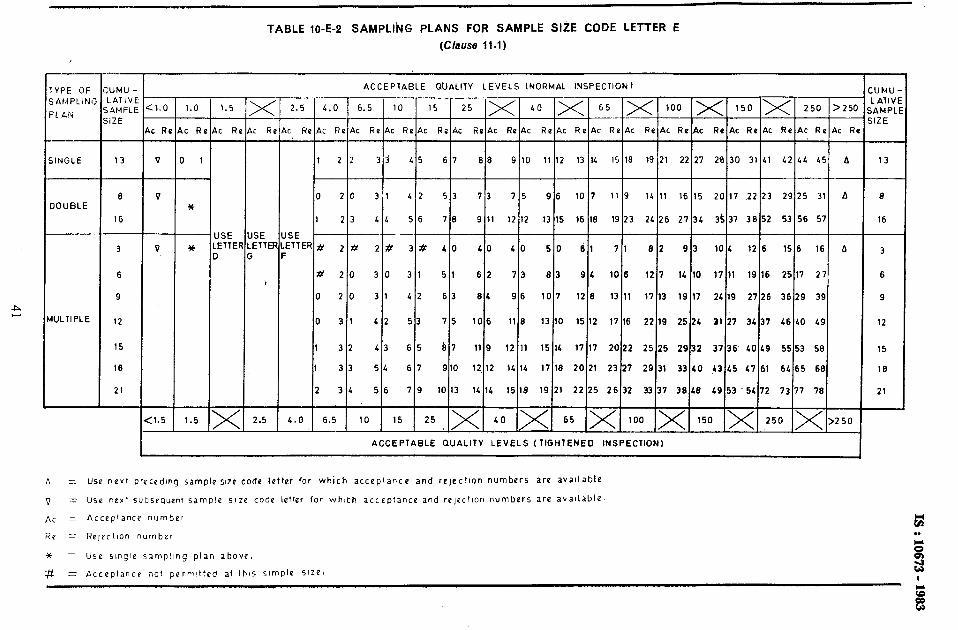
TABLE 10-E-2 SAMPLlkG PLANS FOR SAMPLE SIZE CODE LETTER E
(Clause llil)
YPE 0F I I CUMU- ACCEPTABLE ~IUALITY LEVELS (NORMAL INSPECTION) ICI,""-
13 v 01 1 2 2 67 66 9 10 11 12 13 14 I5 16 19 21 22 21 20 30 31 41 42 41 L5 A 13
8 V 0 20 31 42 53 73 75 96 10 I 11 9 14 11 16 15 20 17 22 23 29 25 31 A 8 IOUELE *
It 1 23 44 56 78 9 11 12 12 13 15 16 18 19 23 24 26 2134 3!i 37 38 52 53 56 57 16
USE USE USE
3 V * LE'TERLE"mLET'ER# 27~ 2# 3# LO 10 40 so 11 71 82 93 10 4 12 6 156 16 A D G F
3
6 # 20 30 31 51 62 73 83 94 10 6 12 7 1.4 10 17 11 19 16 25 17 27 6
9 0 20 31 42 63 84 96 10 7 12 0 13 11 17 13 19 17 2119 2726 36 29 39 9
IULTIPLE 12 0 31 42 53 75 106 11 8 13 10 1512 17 16 2219 25 24 31 27 34 37 46 LO 49 12
15 1 32 I.3 65 87 11 9 12 11 15 lC 17 17 2022 25 25 2932 37 36' 1OL9 5553 56 15
16 1 33 5.4 67 910 12,12 14 14 17 18 20 21 23 21 29 31 33 40 43 15 47 61 64 65 69 16
21 2 3b 56 79 10 13 14 14 15 18 19 21 22 25 26 32 33 37 38 48 49 53 ‘54 72 73 77 78 21
\/ \/ \/ \/ \/ \, \/ <1.5 1 1.5 1-1 2.5 1 L.0 1 6.5 1 10 1 15 1 25 1fi1 LO 151 65 [A] 100 IA1 150 1x1 250 IA]>250
ACCEPTABLE OUALITY LEVELS (TIGHTENED INSPECTION)
b = use nevl preceding sample sute code Ieftei for which acceptance and rejectIon numbers are avaIlable
Q Z Use rexl subsequent sample Size code letter for whlth acceptance and re~ectlon numbers are avaIlable
AC = Acceptance number
Ro = Ro~ectlon number
Y =I Use single sampling plan above.
# = Acceptance not permItted at ih15 SlmPle size-
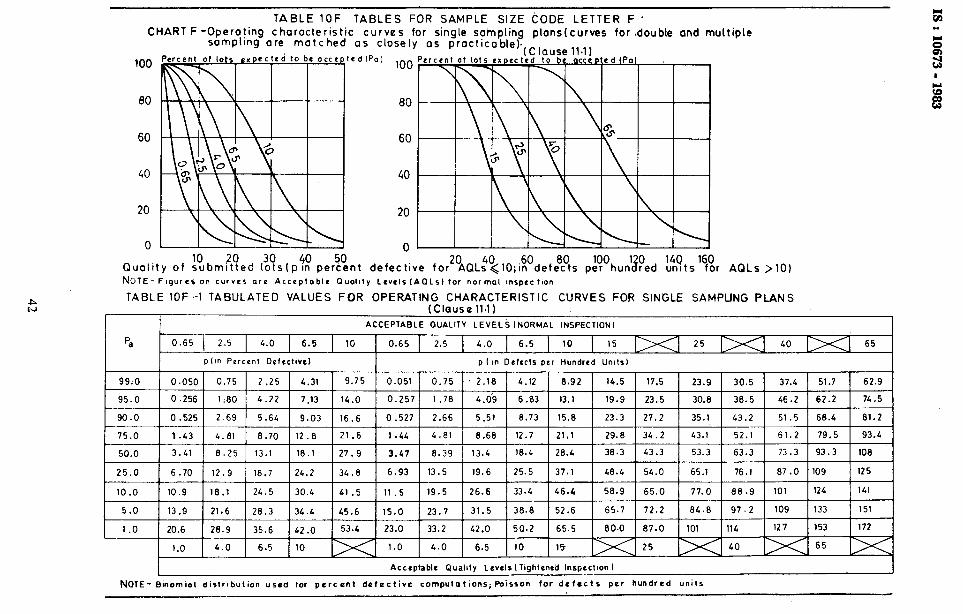
TABLE IOF TABLES FOR SAMPLE SIZE k0DE LETTER F . CHARi F -Opera!ing characteristic curves far single sainpling plans(curves far .dauble and multiple
sampling are matched as closely as practicable).,.,n,,CP)l_l,
80
60
40
80
60
20
40
20
0 0
Quality of ~f?rbmi:(led l?!5Ip% per?$nt defective for280L?&10;i!0defe%s pAt?‘hunl ?ed II %?ts’%r AQLs >lO) NOTE- Figures on curves ore Accrptoblc Puallty Levels IAQLsk for normal lnspectlon
TABLE 1OF -1 TABULATED VALUES FOR OPERATING CHARACTERISTIC CURVES FOR SINGLE SAMPLING PLANS (Clause 11.1)
ACCEPTABLE OUALITY LEVELS (NORMAL INSPECTION1
pa 0.65 2.5 L.0 6.5 10 0.65 2.5 4.0 6.5 10 15 25 40 65
P [In Percent oefrctlvcl p I I” Defects per Hundred Unltsl
99.0 0.050 0.75 2.25 4.31 9.75 0.051 0.75 2.18 4.12 0.92 14.5 17.5 23.9 30.5 37.4 51.7 62.9
95.0 0.256 1.80 4.22 7.13 14.0 0.257 1.70 4.05 6.03 13.1 19.9 23.5 30.8 38.5 46.2 62.2 74.5
90.0 0.525 2.69 5.64 9.03 16.6 0.527 2.66 5.51 8.73 15.8 23.3 27.2 35.1 43.2 51.5 68.4 81.2
75.0 1.43 4.61 8.70 12 .a 21.6 1.44 4.61 8.68 12.7 21.1 29.8 34.2 43.1 52.1 61.2 79.5 93.4
50.0 3.41 6.25 13.1 18.1 27.9 3.47 8.39 13.4 18.4 20.4 38.3 43.3 53.3 63.3 73.3 93.3 108
25.0 6.70 12.9 16.7 24.2 34.6 6.93 13.5 19.6 25.5 37.1 40.4 54.0 65.1 76.1 07.0 109 125
10.0 10.9 18.1 24.5 30.4 41.5 11.5 19.5 26.6 33.4 46.4 58.9 65.0 77.0 80.9 101 124 141
5.0 13.9 21.6 28.3 34.4 45.6 15.0 23.7 31.5 38.8 52.6 65.7 72.2 84.8 97.2 109 133 151
1.0 20.6 28.9 35.6 42.0 53.4 23.0 33.2 42.0 50.2 65.5 80.0 67.0 101 114 127 153 172
1.0 4.0 6.5 10 1.0 4.0 6.5 10 15 25 40 65
Acceptable Qualily Levrls~lighlcnrY Inspection)
NOTE- Blnomiol distrlbulion used for percent defective computations; Poisson for defects per hundred units
,
s
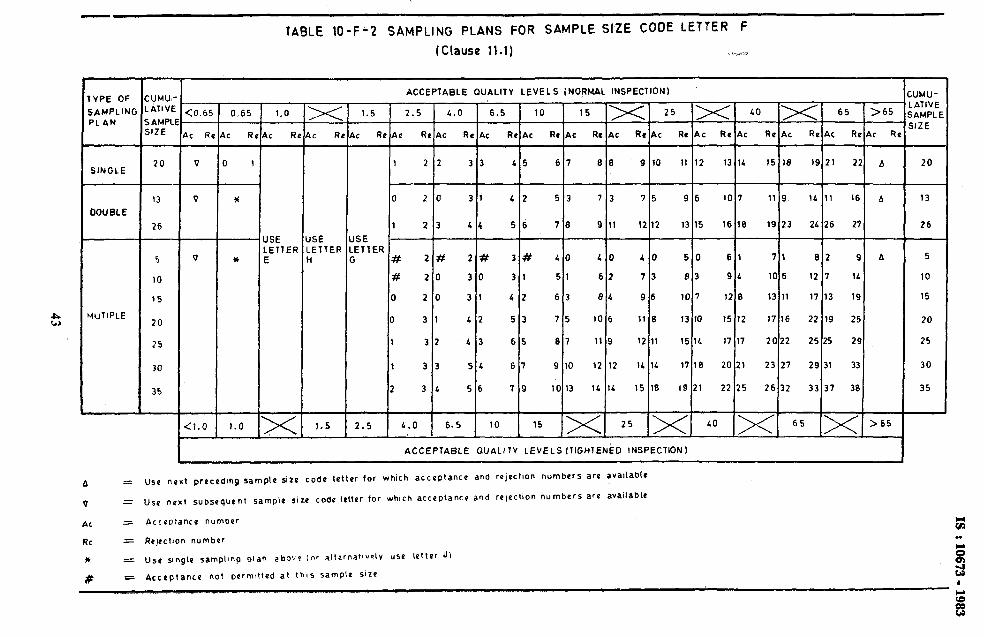
TABLE IO-F’2 SAMPLING PLANS FOR SAMPLE StZE COOE t.ETTER f
(Clause 11.1) . I .m.-,
lVPE OF
;AMPLlNC PL 4N
:UMUI~ AllVf
iAMP ilZ&
ACCEPlABLE QUALITY LEVELS (NORMAL INSPECTION)
>65
AC R
UMU- .ATIVE IAMPL E ilZE
b 20
A 13
26
A 5
10
15
20
25
30
35
22 c R<
CO.65 0,65 1.0
Lc R, \c R<
1.5 10 15 )< 25 ,>< CO >< 65
AC Rc AC Re AC Re AC Ro AC Re AC Re
6 9 to 11 12 13 IL 15 18 19 21 2:
2.5 L.0 6.5
c R1 PC Re AC I RejAc Rc bc R4 ,Ac Re
20 0 1 22 33 4
I I 5 6
SINGLE
13
26
5
10
15
20
25
30
35
JSE .ETlER z
Cl.0 1 1.0 I>(
2 5
6 7
‘3 7 Q 2 0 3 i L
I 23 44 5
w 2# 2# 3
# 20 30 3
1 20 31 4
I 3 1 L 2 5
32 13 6
I 33 54 6
3 L 56 1
L.0 6.5 10
DOUBLE
8 9
# L
1 r
z 6
3 7
a
0 I
1 6
3 8
5 10
7 11
4 96 10 7 12 8 13 11 17 13 19
6 11 8 13 10 15 12 17 16 22 19 25
9 12 11 15 11 17 17 2022 25 25 25
: glto 12]12 )&I14 ,?/M 20121 l31;; 29111 3)/
SE SE ETTER ETTER
JullPLE
3 10 13 1L 14 15 16 IS 21 22 25 26 32 33 37 38
15 >< 25 >< ‘0 x 65 >< >6,5 1.5 2.5
ACCEPTABLE QUALITY LEVELS I71GHlENkD INSPECTION1 L
Use next preceding sample size code letter for which acceptance and ra~ect~orr numbers are avallabtc
Use “ert subsequent sample size code (Otter for which acceptance and ra)ecfion numbers are available
AcceDtance n~mDPr
Ra]octlon number
Usa slngle sampllnp elan abpbo ior alternat’ve[V use letter II)
Acceptance not oermltted at this sample Size
A ZZ
v =
AC =
Rc =
* =
# 5
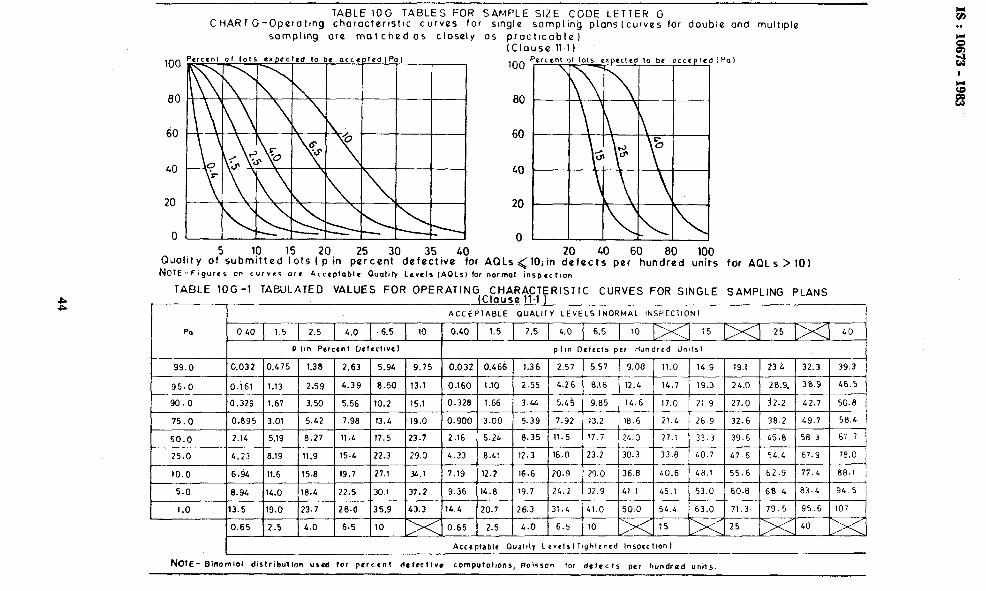
80
60
LO
20
0
TABLE IOG TABLES FOR SAMPLE SIZE CODE LETTER G CHART G-Operottng chorocteristlc curves for sfngle sampling plans(curves fdr double and multlple
somplmg are matchedos closely OS proctlcable)
(Clause 11 II
80
60
40
20
0 20 40 80 100
Quollty of’subrr%ted’?ots (‘iin p~?cen?0defe3z?tive4!or AQLs<IO;in defects per?undred units fdr AQLs > 10)
NOTE-Fogurrr on curves are Acceptable Cluol~ty Levels lAOLsl tar normal inspection
TABLE lOG-1 TABULATED VALUES FOR OPERATING CHARACTERISTIC CURVES FOR SINGLE SAMPLING PLANS (Clolise 11.1 )
ACCEPTABLE OUALIIY LEVELS (NORMAL INSPECTIONI
- PO 040 1.5 2.5 4.0 6.5 10 0.40 1.5 2.5 4.0 6.5 10 15 25 40 --
P Iln Percent Uelrctlvr~ I p(ln Oefecls bcr Hundred Units)
99.0
95.0
90. 0
0.032 0.475 1.3 8 2.63 5.94 9.75 0.032 0.466 1.36 2.57 5.57 9.08 11.0 14.9 19.1 23 i 32.3 39.3
0.161 1.13 2.59 4.39 8.40 13.1 0.160 1.10 2.55 4.26 6.16 12.4 14.7 19.3 24.0 28.9. 38.9 46.5
- 0.329 1.67 3.50 5.56 10.2 15.1 0.328 1.66 3 44 5.45 9.85 14.6 17.0 21 9 27.0 j2.2 42.7 50.8 -
NOTE- Binomial distribullon uSed for percent detective computations, Jolson k-w drtcc Is per hundred unils.
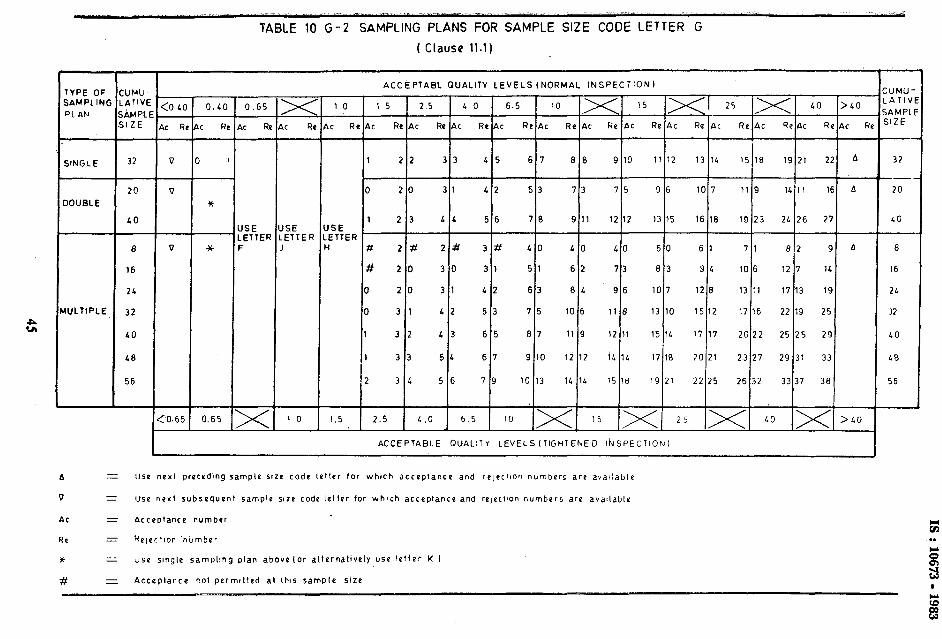
-. ,.-_ ;. L . . - .., . , ,.x, ._ _ ,__ -“.l.. _..“.“. .i-. ; -_ _
TABLE 10 G-2 SAMPLING PLANS FOR SAMPLE SIZE CODE LETTER G
i ^ .I
( Clause 11.1)
TYPE OF CUM’J’
yy” :;;b’,‘, <o 10 0.
SIZE AC Re AC
SINGLE 32 V 0
20 V DOUBLE )t
LO
8 V *
16
21
WLTIPLE 32
LO
48
56
0.65
AC R
USE USE LETTEF LETTER F J
P ><
x AC RI
10
ACCEPTABL QUALITV LEVELS (NORMAL INSPECTION)
1 23 LL 56 78 9 11 12 12 13 15 i6 18 19 23 2L 26 27 ISE ETTER i # 2# 2# 3# LO LO 10 50 61 7 1 82 9 b
# 20 30 31 51 62 i3 83 9G 10 6 127 11
0 20 31 12 63 BL 96 10 7 12 0 13 11 17 13 19
0 3 1 4 2 53 75 10 6 11 8 13 10 15 12 17 16 22 19 25
1 32 13 65 87 11 9 12 11 15 1L 17 17 20 22 25 25 29
: ‘, : “, ,” : 1,’ :; :: :: 1: :; ,‘,’ 1 :: :: 1; :: 1:: 1,’
1.5 2.5 L .o 6.5 10 15 >< 25 >< 10 >< >&O
ACCEPTABLE QUALITY LEVELSfTIGHTENED I~SPECTIONI
d = Use next preceding sample size code letter for which acceprance and rejection numbers are avatlable
V 1 Use no%1 subsequent sample SIZE code letter for which acceptance and re)ect!on numbers are avaIlable
AC = Acceptance number
Ro = Rejectton .number
+ = Use single sampbng plan abovelor alternatively use letter K 1
# = Acceptance not permttted al this sample size
b
:UMU- LATIV ;AMPLI SIZE
32
--.
20
LO -I
8
16
21.
3?
LO
L8
56
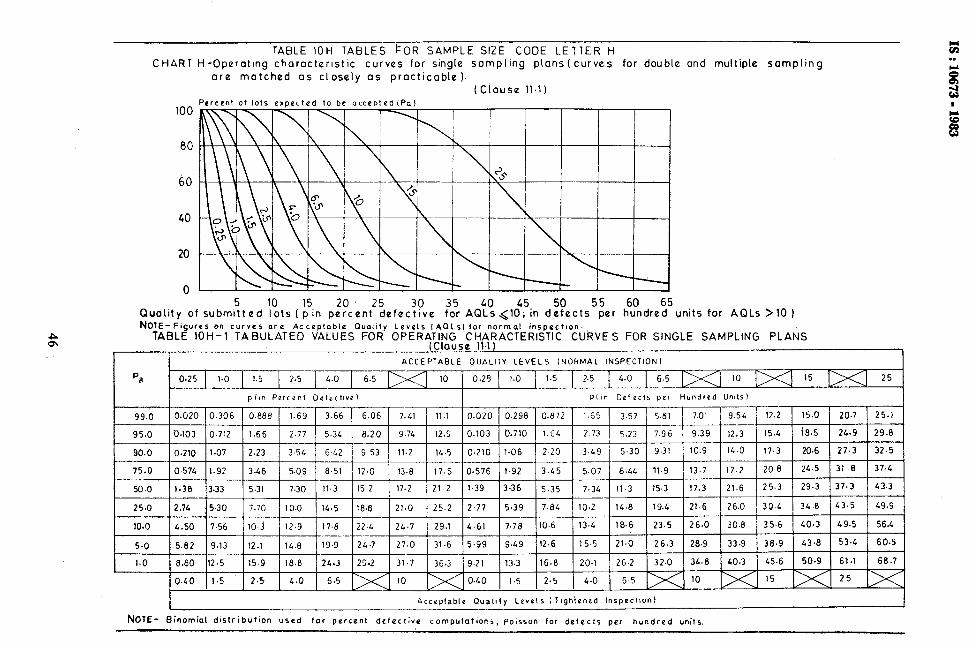
TABLE 1OH TABLES kOR SAMPLE SIZE CODE LETTER l-i CHART H-Operot~ng characterlstlc curves for single sampling plans(curves for double and multiple sampltng
are matched OS closely as practicable).
(Ciouse 11.1)
60
40
20
0
Quolity of subml:ted :!~ts ( b5in piFc,nt’“,efec:?ve ?,“r AQ?~<l$in d?ects5zer t%dre6d5units for AQLs >lO ) N~l~-F~g~res on curves are Acceptable Quality Levels IAoLs) for normal inspectIon.
TABLE lOH-1 TABULATED VALUES FOR OPERATING CHARACTERISTIC CURVES FOR SINGLE SAMPLING PLANS (Clause 11.1)
ACCEPTABLE OUALITV LEVELS (NORMAL INSPECTION)
'a 0.25 1.0 1.5 2.5 4.0 6.5 10 0.29 I.0 1.5 7.5 4.0 6.5 IO 15
plln Percont Dofrctlvel Plan Defects per Hundred Un~tsl
25
99.0 0.020 0.306 0.888 1.69 3.66 6.06 7.41 ’ 11.1 0.020 0.298 0.672 1.65 3.57 ’ 5.81 7.01 9.54 12.2 15.0 20.7 25.1
95.0 0.103 0.712 1.66 2.77 5.34 8.20 9.74 12.9 0.103 0.710 1.64 2.73 5.23 7.9 6 9.39 12.3 15.4 ie.5 24.9 29.8
’ 90.0 0.210 1.07 2.23 3.5P 6.42 3 53 11.2 14.5 d.210 1.06 2.20 3.49 6.30 9.31 10.9 14.0 17.3 20.6 27.3 32.5
75.0 0.574 1.92 3.46 5.09 8.51 12.0 13.8 17.5 0.576 1.92 3.45 5.07 8.44 11.9 13.7 17.2 20.8 24.5 31 .e 37.4
50.0 1.38 3.33 5.31 7.30 11.3 15.2 17.2 21.2 1.39 3.36 5.35 7.34 Il.3 15.3 17.3 21.6 25.3 29.3 37.3 43.3
25.0 2.74 5.30 7.70 10.0 14.5 18.8 21.0 25.2 2.77 5.39 7.84 10.2 14.8 19.4 21.6 26.0 304 34 .B 43.5 49.9
10.0 L.50 7.56 1O.J 12.9 17.8 22.4 24.7 29.1 4.61 7.78 10.6 13.4 18.6 23.5 26.0 30.8 35.6 40.3 49.5 56.4
I Acceptable Qual~ly Levels ; Tlghiened Inspection)
NOTE- Binomial distribution used for percent dcfcctive computottorj, Poisson for defects @er hundred units.
E . .
s w I
5; 8
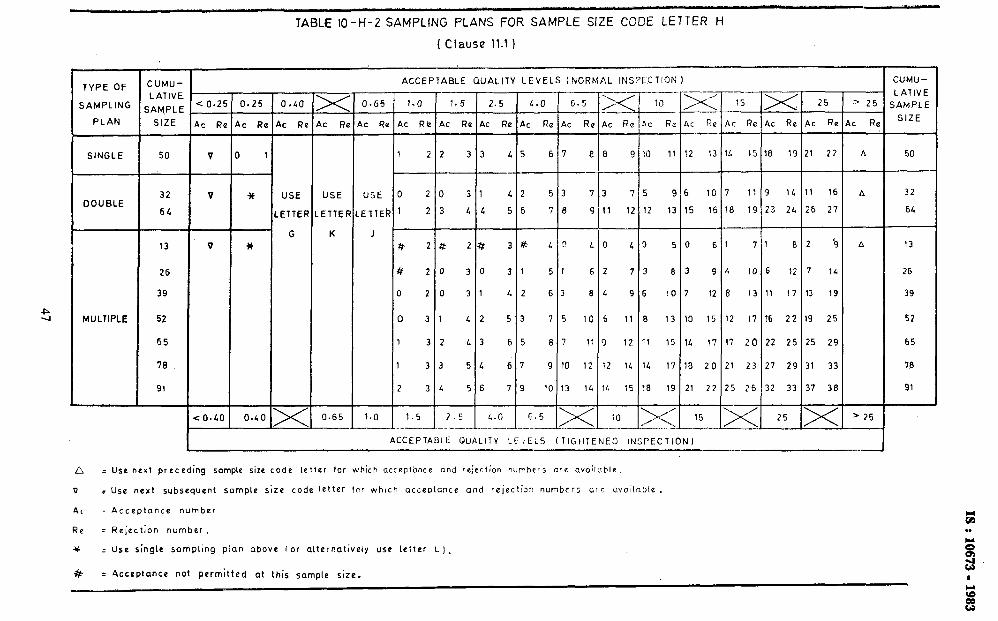
TABLE 10-H-2 SAMPLING PLANS FOR SAMPLE SIZE CODE LETTER H
1 Clause 11.1 )
L INSPfCTlON I
< O.LO I ‘*O I ACCEPTABLE QUALITY LC~LLS (TIGHTENED INSPECTION)
n ; Use next preceding sample size code letter for which occepihnce and rejection numbers are available.
0 z Use next subsequent sample size code letter for which acceotance and rejection numberi arc uvailnble.
4c - Acceptance number
Re = Rejectyon number.
Y = Use single sampling plan above for alternatively use letter L).
k : 4cceptance not permitted at this sample size.
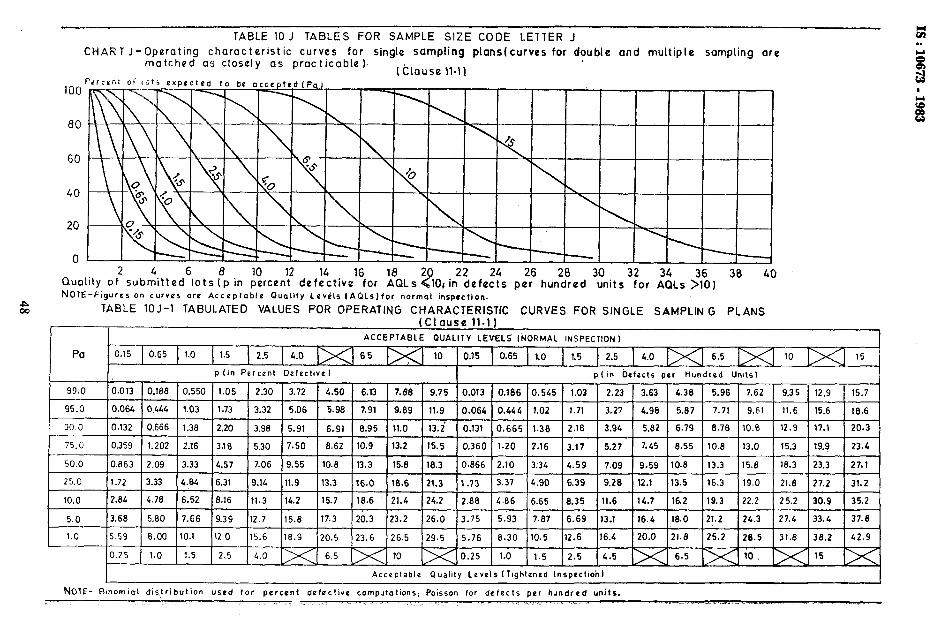
TABLE IO J TABLES FOR SAMPLE SIZE CODE LETTER J
CHART J-Operating characteristic curves for single sampling plans(curves for double ond multiple sompling ore matched os closely OS proc ticable ).
I elouse Il.‘)
20
0 Quality of2 subiitted’tots Fp in $rcen’t* defktivelbfor ‘naoLs 20 24 26 28 in’2defects htindred 30 <lOi 32 34 36
NOTE-F' per
units for AQLs 30 40 >10)
$
ngurrs on curves ore Acceptable Quality Levo'k IA0Ls)fc.r hormal inspection.
TABLE ‘OJ-1 TABULATED VALUES FOR OPERATING CHARACTERISTIC CURVES FOR SINGLE SAMPLING PLANS
95.0
90.0
75.0
50.0
25.0
10.0
5.0
1.0
0.064 0.444 1.03 1.73 3.32 5.06 5.98 7.91 9.89 11.9 0.064 0.444 1.02 1.71 3.27 4.98 7.71 5.87 9.61 11.6 15.6 18.6
0.132 0.666 1.38 2.20 3.98 5.91 6.91 8.95 11.0 13.i 0.131 0.665 1.38 2.18 3.94 5.82 6.79 8.78 10.6 12.9 17.1 20.3
0.359 1.202 2.16 3.1 6 5.30 7.50 8.62 10.9 13.2 15.5 0.360 1.20 2.16 3.17 5.27 7.45 8.55 10.8 13.0 15.3 19.9 23.4
0.863 2.09 3.33 4.57 7.06 9.55 10.8 13.3 15.8 18.3 0.866 2.10 3.34 4.59 7.09 9.59 10.8 13.3 15.8 18.3 23.3 27.1
1.72 3.33 4.04 6.31 9.16 11.9 13.3 16.0 18.6 21.3 1.73 3.37 4.90 6.39 9.28 12.1 13.5 16.3 19.0 21.8 27.2 31.2
2.84 4.78 6.52 8.16 11.3 14.2 15.7 18.6 21.4 24.2 2.88 4.86 6.65 0.35 11.6 14.7 162 19.3 22.2 25.2 30.9 35.2
3.68 5.80 7.66 9.39 12.7 15.8 17.3 20.3 23.2 26.0 3.75 5.93 7.87 6.69 13.1 16.4 18.0 21.2 24.3 27.4 33.4 37.8
5.59 6.00 10.1 12 0 15.6 18.9 20.5 23.6 26.5 29.5 5.76 8.30 10.5 12.6 16.4 20.0 21.8 25.2 20.5 31.8 38.2 42.9
0.25 1.0 1.5 2.5 4.0 6.5 10 0.25 1.0 1.5 2.5 4.5 6.5 10 15
Acceptable Quality Levels ~Tlghtonod Inspectiok)
NOTE- Blnomiol dis!ribution used tar percent defective computotlons; Poisson for defects per hundred units.
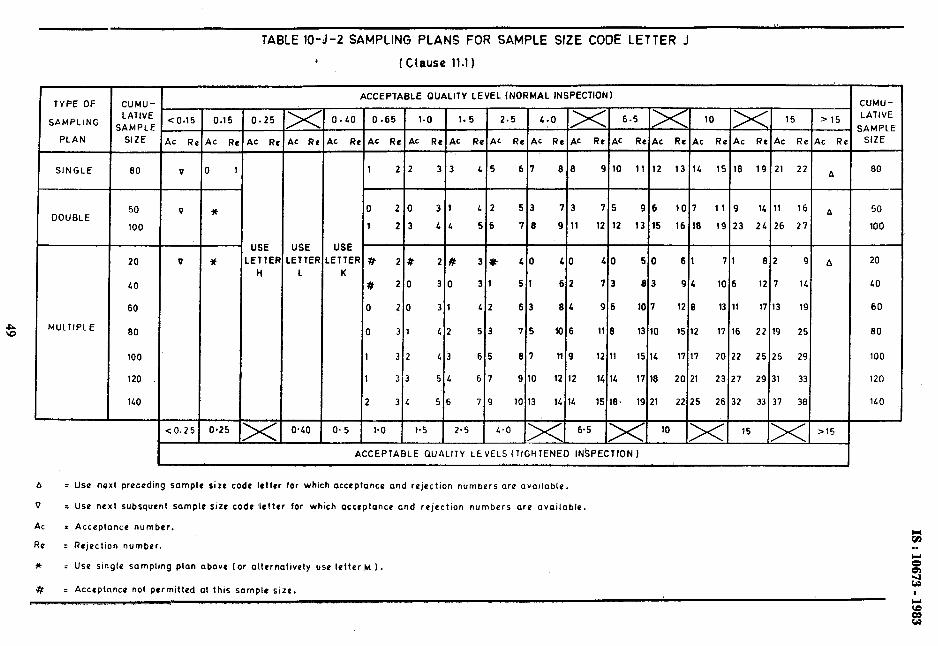
A I Use next preceding sample size code letter for whrch acceptance and rejection numbers are avarlabte.
V = Use next subsquent sample size code ,Ietter for which acceptance and rejection numbers are available.
AC = Acceptance number.
TVPE OF
SAMPLING
PLAN
SINGLE 60
DOUBLE 50
100
MULTIPLE
CUMU- LATIVE
SAMPLE SIZE
20
40
60
60
100
120
140
TABLE 10-J-2 SAMPLING PLANS FOR SAMPLE SIZE CODE LETTER J
, ( Clause 11.1)
CO.15 0.15 0.25
4c R 4c R1 4C RI
V
V
V x
co.25
25 4~ RI
I 1
*
USE ETTEI
H
USE .ETTEF
L
0.40
ACCEPTABLE QUALITY LEVEL (NORMAL INSPECTION)
ETTER #
K
#
0
2* 2#
20 30
20 31
3 1 42
32 43
33 54
34 56
3* CO 40 40
3 1 51 62 73
42 63 84 96
53 75 t0 6 11 8
65
6 7
81
9 10
10 13
11 9
12 12
I4 T4
12 11
14 14
15 18\ I 9 I
50
a3
10 7
13 10
15 14
17 16
19121
61 71 62
94 10 6 12 7
12 6 13 11 17 13
15 12 17 16 22 19
17 17 20 22 25 25
20 21 23 21 29 31
22 25 26 32 33 37
9 A
14
19
25
29
33
30
ACCEPTABLE QUALITY LEVELS (TIGHTENED INSPECTfON 1
Re = Rejection number.
* 5 Use single sampling plan above lor alternatively use letter M 1.
k 5 Acceptance not permitted at this sample size.
cuku- LATIVE
SAMPLE SIZE
60
50
100
20
40
60
60
100
120
140
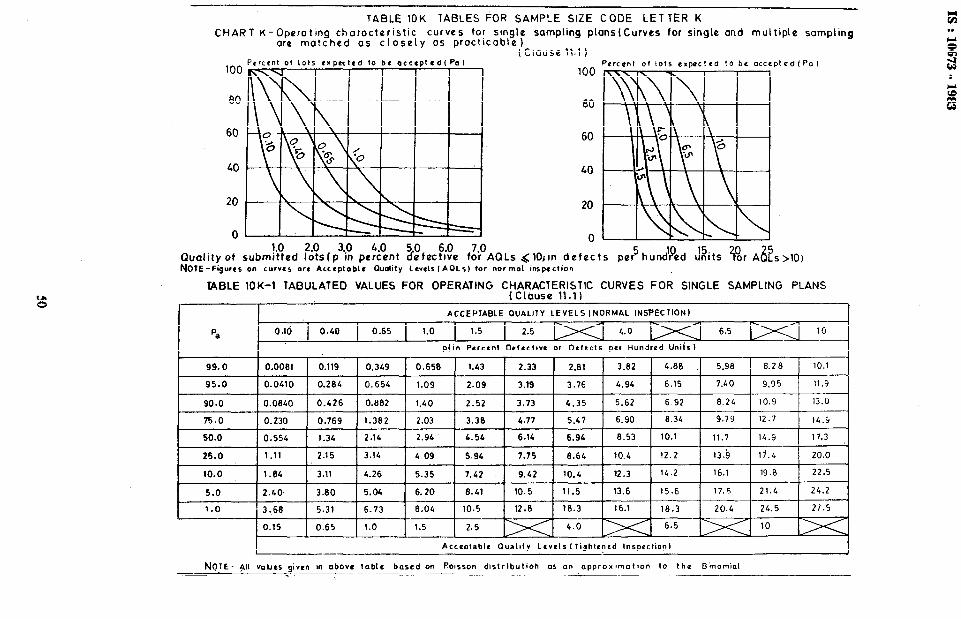
TABLE 10K TABLES FOR SAMPLE SIZE CODE LETTER K
CHART K-Operoting chorocieristrc curves for srngle sampling plansfCurves for single and multiple sampling are matched as closely OS procticabte)
(Clause 11.1 )
100
60
20
t: . .
Percent of lots expected to be acccPlQdlPo1
I
f
0
Quality of submii!ed t2&fp3i”n pe%nt %fecfi;?e f&‘AOLs <IO;in defects NOTE-Figures on curves are Arceploblc ouality LrvclsIAQLs) ior norma?iinspection
perShund ed ‘P u rts ‘2’ 2fo,r A&10)
TABLE lOK-I TABULATED VALUES FOR OPERATING CHARACTERISTIC CURVES FOR SINGLE SAMPLING PLANS f Clause 11.1)
Pa O.ld 0.40 0.65
ACCEPTABLE OVALIlY LEVELS [NORMAL INSPECTIONI
1.0 1.5 2.5 4.0 6.5 10
p(in Percent Dcftcl~ve or Dcfecls per Hundred Uniis)
99.0 0.0081 0.119 0.349 0.658 1.43 2.33 2.81 3.82 4.88 5.96 6.28 10.1
95.0 0.0410 0.284 0.654 1.09 2.09 3.19 3.76 4.94 6.15 7.40 9.95 11.9
90.0 0.0840 0.426 O.tl82 1.40 2.52 3.73 4.35 5.62 6 92 8.24 10.9 13.0
75.0
50.0
25.0
10.0
5.0
1.0
0.230
0.554
1.11
1.84
2.40.
3.68
0.15
0.769 1.382 2.03 3.38 4.77 5.47 6.90 8.34 9.79 12.7 14.5
1.34 2.14 2.94 4.54 6.14 6.94 8.53 10.1 11.7 14.9 17.3
2.15 3.14 4 09 5.94 7.15 8.64 10.4 12.2 13.6 li.4 20.0
3.11 4.26 5.35 7.42 9.42 10.4 12.3 14.2 16.1 19.0 22.5
3.80 5.04 6. 20 8.41 10.5 11.5 13.6 15.6 17.5 21.4 24.2
5.31 6.73 8.04 10.5 12.8 18.3 16.1 18.3 20.4 24.5 27.5
0.65 1.0 1.5 2.5 4.0 6.5 10
Accrplsblr Oual~ty Ltvrls I Tightr(rrd lnspectionl
NOTE- All va’ucs qivrn nn above table based ori Poisson distrlbutioh as on approxlmotvon to the Dinomiol
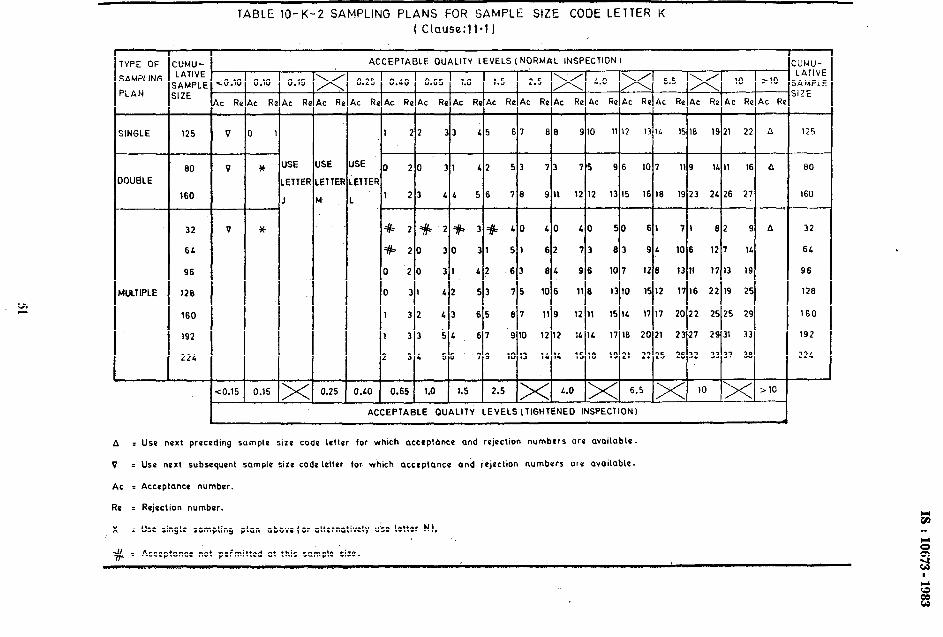
YPE OF
;AMPLING
‘LAN
SNGLE
--
OUBLE
IULTIPLE
A z
v =
AC =
Re E
* i
#=
TABLE 10-K-2 SAMPLING PLANS FOR SAMPLE SIZE CODE LETTER K ( Clause:1 1‘11
ACCE.PTABLE QUALITY LEVELS (NORMAL INSPECTlON I UMU- LATIVE AMPLE IZE
125
90
160
32
62
96
120
160
192
222
-z
t
rO.lC -
c RI
0.10 -
c R
0.15 -
LC I x - k u
V
-
V
-
* ISE
ETTE
V *
:0.15
ISE
ETTE
1
0.25 3.LO
0.25
>c R
SE
ETTEI
ACCEPTABLE OUALITY LEVELS (TIGHTENED INSPECTION)
27 1L I I
L
Use next preceding sumple stze code Letter for which acceptance and rejection numbers ore available.
Use next subsequent sample size codeletter for which acceptanci and rejection numbers are avaitable.
Acceptance nbmber.
Rejection number.
Use single sampling plan above (or alternatively u& letter N).
:UMU- LATIVE SAMPLE ;IZE
125
80
160
32
64
96
126
160
192
226
Acceptance not peimitted at this sample size.
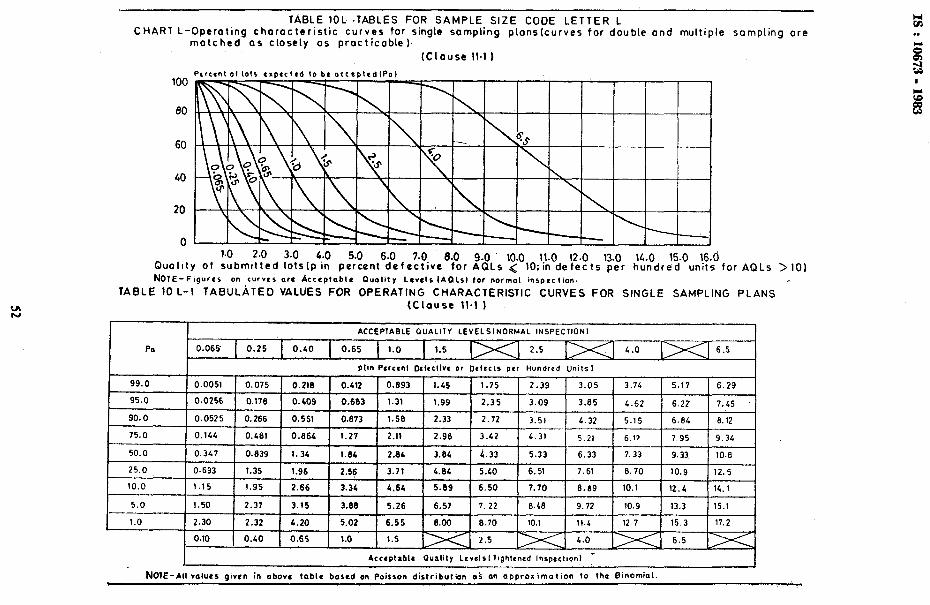
TABLE 1OL .TABLES FOR SAMPLE SIZE CODE LETTER L CHART L-Opcroting chorocteristic curves for single sampling plons(curves for double and multiple sompling ore
matched OS closely OS procticoble).
100
80
60
40
20
0
1.0 2.0 3.0 G.0 5.0 6.0 7.0 8.0 9.0 10.0 11.0 12.0 13.0 15.0 15.0 16.b Quality ot submitted tots(p in percent defective for AQLs ( 10;in defects per hundred units for AQLs >lO) NOTE-Flgurrr on curves arc Acceptable Quality Lcvcls IAOLsl tor normal inspection.
TABLE 10 L-l TABULATED VALUES FOR OPERATING CHARACTERISTIC CURVES FOR SINGLE SAMPLING PLANS (Clause 11.1 1
NOTE-AIIV~~UCS givrn in obovc toblr boscd on Poisson distribution a’s an approximation to the 6inomiol. 1
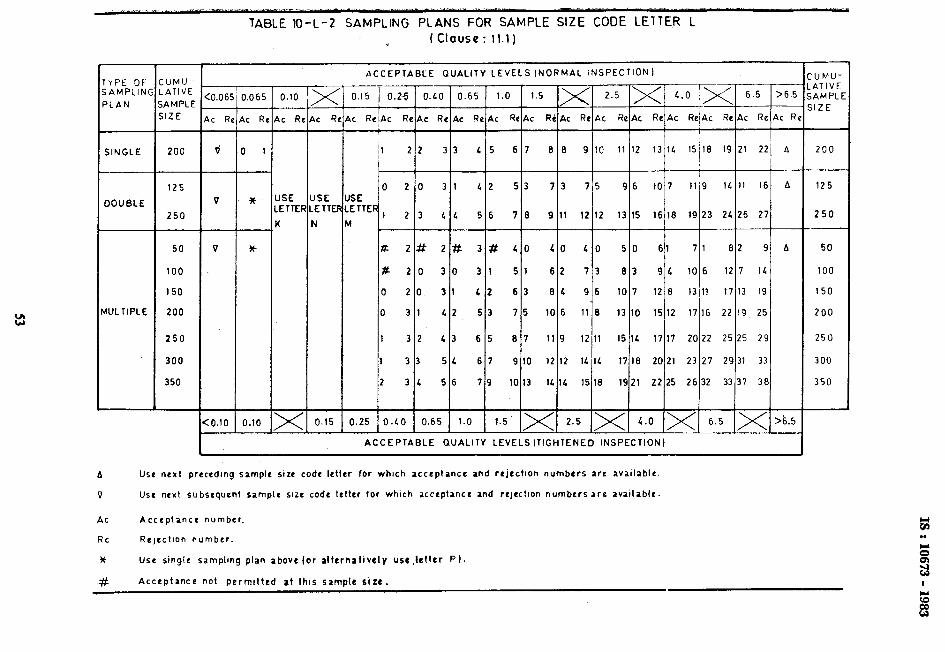
TYPE 3F SAMPLlNl
PLAN
SINGLE
_-
DOUBLE
WLTIPLE
;UMU- .ATIVE ;AMPLE ;I2 E
200
125
250
50
100
150
200
250
300
350
TABLE 10-L-2 SAMPLING PLANS FOR SAMPLE SIZE CODE LETTER L ( Clause : 11.1)
:O.O 6!
\c R
V *
L -1 :o.ro 1 0.10 x 0.15
1.065 0.10
,c RI tc RI
1 1
* ISE ETTEI
x c R
‘SE ETTEl
4
ACCEPTABLE QUALITY LEVELS tNORMAL iNSPECTjON
0.1 5 0.2-5 0.60 0.65 1.0 1.5 2.5 >( L.0 >< 6.5 >6.5
c Rc AC Re Ac Re AC Re AC Re AC Ri AC Re AC Re AC Re AC Re At Re AC Re AC R
/l 22 33 L5 67 8113 9110 11 112 l&L 15/18 19121 221 A
0 20 31 12 53 73 75 96 10 7 11 9 1L 11 16 A
S’TER 1 2 3 4 L 5 6 7 0 9 11 12 12 13 15 16 18 19 23 24 26 27
# 2# 2## 3# LO CO CO 50 61 71 82 9 A
# 20 30 31 51 62 73 83 92 106 12 7 11
0 20 31 42 63 8L 96 10 7 12 8 13 11 17 13 19
0 31 42 53 75 10 6 11 8 13 10 15 12 17 16 22 19 25
1 32 43 65 07 11 9 12 11 15 1L 17 17 20 22 25 25 29
1 33 5L 67 9 10 12 12 11 1c 17 18 20 21 23 27 29 31 33
2 34 56 79 10 13 1L 1C 15 18 1921 22 25 26 32 33 37 30
0.25 0.60 0.65 1.0 1.5 >( 2.5 >( 4.0 >( 6.5 >( >6.5 -
ACCEPTABLE QUALITY LEVELS (TIGHTENED INSPECTION)
A Use next preceding sample srze code letter for whrch acceptance and rejection numbers are avarlablc.
V Use next subsequent sample srze code letter for whrch acceptance and rejectron numbersare available.
AC Acceptance number.
Rc Rejectron number.
* Use single samplmg plan above (or alternatively usc.tcttcr Pt.
# Acceptance not permitted at this sample size.
:UMU- ATIVE
;AMPL jlZE
200
125
250
50
100
150
200
250
300
350
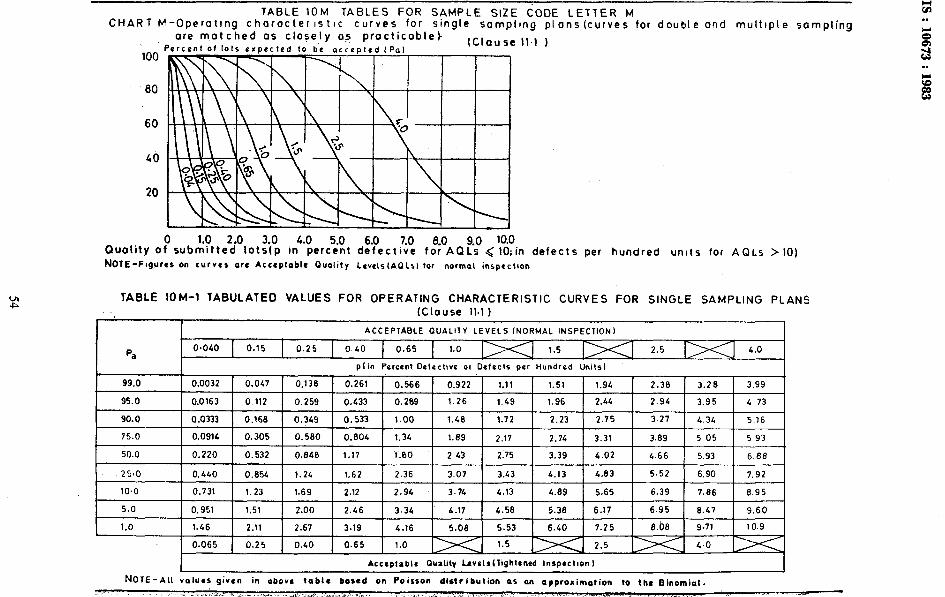
CH TABLE 10M TABLES FOR SAMPLE SIZE CODE t .ETTER M
ART M-Operattng character is trc curves for single samplrng pla n s (curve s for double and multrple sempling
60
are matched as closely as practicable) Percent ot lots exbected lo be accepted IPal
lClau se
!j 0 10.0 Quality o~subrk~tte~Olot$r in4$erc%t de6.pecti% f?‘AQ<s <iO;in defects per hundred unrts for AQLs >lO)
NOTE-Frgurrs on curves ore Acceptoblc Quality Leveks~AQLsl tar normal inspectton
TABLE 10M-l TABULATED VALUES FOR OPERATING CHARACTERISTIC CURVES FOR SINGLE SAMPLING PLANS
(Clause II.1 )
ACCEPTABLE QUALITY LEVELS lNORMAL INSPECTION)
pa 0.040 0.15 0.25
99.0 0.0032 0.047 0.138
95.0 0.0163 0.112 0.259
90.0 0 -0333 0.168 0.349
75.0 0.0914 0.305 0.580
50.0 0.220 0.532 0.848
0,40 0.65 1.0 1.5
ptin Percenl Detective or Defecls per Hundred Units)
0.261 0.566 0.922 1.11 1.51 1.94
0.433 0.269 1.26 1.49 1.96 2.44
0.533 1.00 1.48 1.12 2.23 2.75
0.804 1.34 1.89 2.17 2.74 3.31
1.17 1.60 2 43 2.75 3.39 4.02
2.5 4.0
2.30 3.28 3.99
2.94 3.95 4 73
3.27 4.34 5.16
3.89 5 05 5 93
4.66 5.93 6.88
25.0 0.440 0.854 1.24 1.62 2.36 3.07 3.43 4.13 4.83 5.52 6.90 7.92
10.0 1 0.731 1 1.23 1 1.69 1 2.12 1 2.94 -i 3.74 1 4.13 1 4.89 I 5.65 1 6.39 I 7.86 1 8.95
5.0 0.951 l.Sl 2.00 2.46 3.34 4.17 4.58 5.38 6.17 6.95 0.47 9.60
1.0 1.46 2.11 2.67 3.19 4.16 5.08 5.53 6.40 7.25 8.b8 9.71 10.9
0.065 0.25 0.40 0.65 1.0 1.5 2.5 4.0 r
I Acceptable Ouality hveIs(Tightcned Inrpect~on)
NOTE-AU values given in above table bored on Poisson dlstilbution OS an approximation to the Binomial.
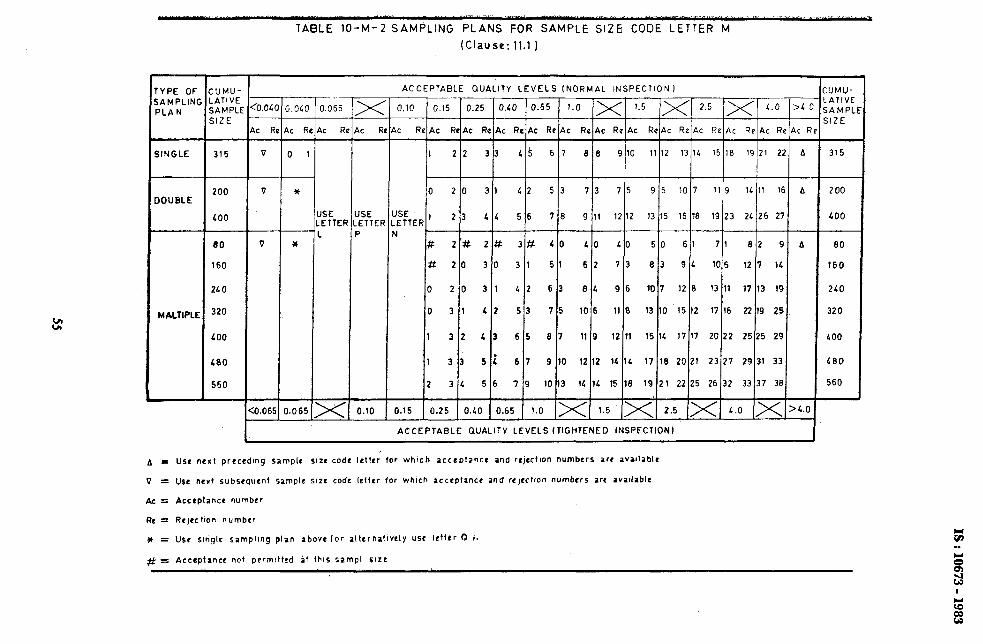
TABLE 10-M-2 SAMPLING PLANS FOR SAMPLE SIZE CODE LETTER M
(Clause: 11.1 )
‘YPE OF ;AMPLINl ‘LAN
SINGLE
IOUBLE
MALTIPLE
-
:UMU. .ATIVE jAMPL kilZE
j15
200
400
80
160
240
320
LOO
180
560
- FO.OL
K R
25 2c RI e, I t:
ISE ETTEF
JSE .ETTEA I D
I- 0.0651 0.065 x 0.10
j.OLC 0.065
ACCEPTABLE QUALITY LEVELS (NORMAL INSPECTION I
1 32 43 65 87 11 9 12 11 15 14 17 17 20 22 25 25 29
1 33 5i 67 9 10 12 12 14 11 17 18 20 21 23 27 29 31 33
2 31 56 79 10 13 14 14 15 18 19 21 22 25 26 32 33 37 38
0.15 0.25 0.40 0.65 1.0 >< 1.5 >< 2.5, >< L.0 >( :
ACCEPTABLE QUALITY LEVELS ~TIGHTENEO INSPECTIONt
'4.0
h = Use next prtcedlng sample SIZC code letter for which acceptz+‘1ce and rejectIon numbers are avvtable
V = Use neri subsequent sample SIZI code letter for which acceptance and rcjrct#on numbers are avadablc
Ac = Acceptance number
Rc = Rejcctmn number
W = USC slnglc sampling plan above (or altcrnatlvety use letter 0 is
SL- Acceptance not permItted at this sampl size
‘UMU- ATIVE
;AMPL SIZE
200
LOO
80
160
210
320
LOO
480
560
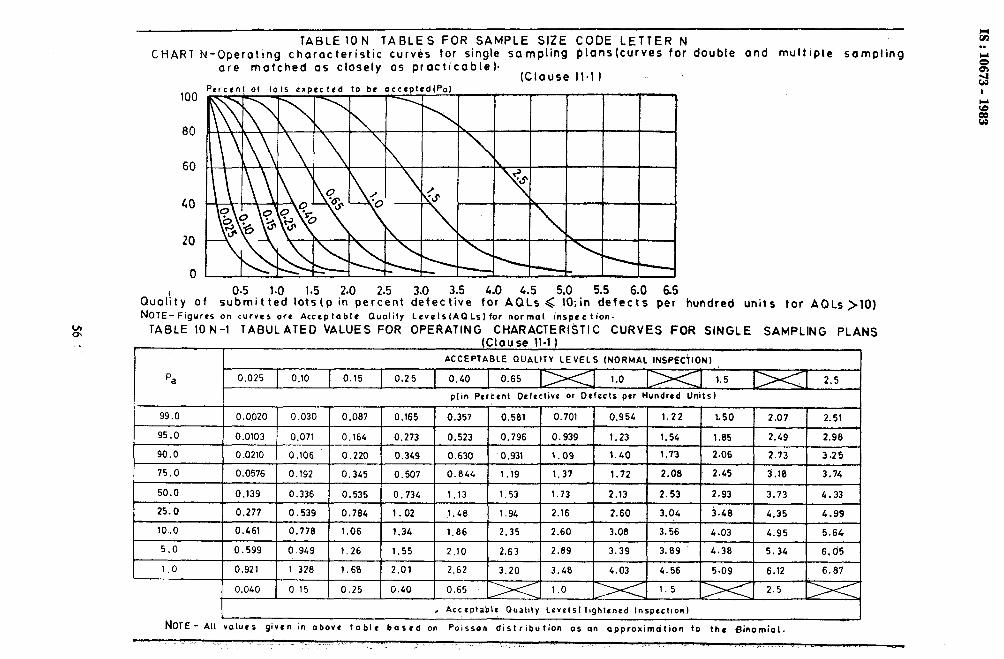
if-
TABLE ION TABLES FOR SAMPLE SIZE CODE LETTER N CHART N-Operotihg characteristic curvis for single sampling plans(curves for double and multiple sampling
60
20
0
3.5 4.0 4.5 5.0 5.5 6.0 6.5 Quol’ity of suodLit:$ loik?(p i’n’pertzol d3;Ptective for AQLs < l&in defects per hundred rinits tor AQLs>lO) NOTE-Figures on curves ore Acceptable Quality LevelslAQLs)for normal inspection.
TABLE lON-1 TABULATED VALUES FOR OPERATlkG CHARACTERISTIC CURVES FOR SINGLE SAMPLING PLANS (Clause 11.1 1
I 99.0 1 0.0020 1 0.030 1 0.087 1 0.165 1 0.357 1 0.581 1 0.701 1 0.954 1 1.22 I 1.50 1 2.07 r 2.51 1
95.0 0.0103 0.071 0.164 0.273 0.523 0.796 0.939 1.23 1.54 1.85 2.49 2.96
90.0 0.0210 0.106 0.220 0.349 0.630 0.931 1.09 1.40 1.73 2.06 2.73 3.25
75.0 0.0576 0.192 0.345 0.507 0.044 1.19 1.37 1.72 2.00 2.45 3.10 3.74
50.0 0.139 0.336 0.535 0.734 1.13 1.53 1.73 2.13 2.53 2.93 3.73 4.33
25.0 0.277 0.539 0.784 1 .02 1.40 1.94 2.16 2.60 3.04 j.40 4.35 4.99
lO..O 0.46i 0.770 1.06 1.34 1.86 2.35 2.60 3.06 3.56 4.03 4.95 5.64
5.0 0.599 0.949 1.26 1.55 2.10 2.63 2.89 3.39 3.69 4.30 5.34 6. d5
1.0 1 0.921 I 1 328 I 1.68 I 2.01 I 2.62 I 3.20 I 3.40 I 4.03 I 4.56 I 5.09 I 6.12 I 6.67 L I I I I I I I I I I I
0.040 0 15 0.25 0.40 0.65 1.0 1.5 2.5
t: . .
. Acceptable Quality Lovelsll~ghtened Insprct~on)
NOTE- All volurs givrn in above table based on I
Poisson distribution as an approximdtion to the Binomial.
c ‘_ I _ . .: ’ . _. 1. .- .I -- - I __I. _. ._ . ^ _ ._
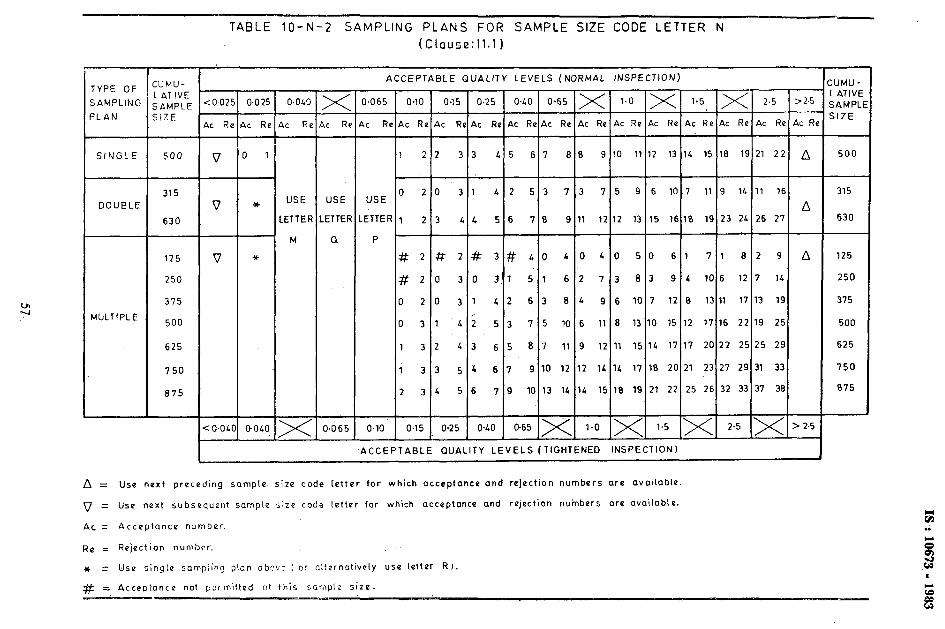
lYPE OF
;AMPLING
‘LAN
SINGLE
DOUBLE
YULTIPLE
:lJtAu- LATIVE SAMPLE SIZE
500
315
630
A
125
250
375
500
625
750
a75
TABLE 10-N-2 SAMPLING PLANS FOR SAMPLE SIZE CODE LETTER N (CLouse:ll.1 I
ACCEPTABLE QUALtTY LEVELS (NORMAL INSPECTION)
c 0.02: 0.025
K Rc ,c Re
V
V
V
*
*
USE USE USE
.ETTER ETTEF ETTEF
M 0 P
><
><
c Rc
I.065 0.10
3.065
rc Rc
0.10
AC Rc
1 2
0 2
1 2
# 2
# 2
0 2
0 3
1 3
i 3
2 3
0.15
I I I
1.5 >( 2.5 >( > 2.5
ACCEPTABLE QUALITY LEVELS (TIGHTENED INSPECTION)
n = Use next preceding sampto size code letter for which acceptance and rejection numbers are available.
V = Use next subsequent sample size coda Letter for which acceptance and rejection nuinbers are available.
AC = Acceptance number.
Re = Rejection number.
* = Use single sampling p!an ch~vz ( or aLternatively use totter RI.
# r Acceoiance not permitted at this sample size.
:UMU - L ATIVf SAMPL SIZE
500
315
630
125
250
375
500
625
750
075
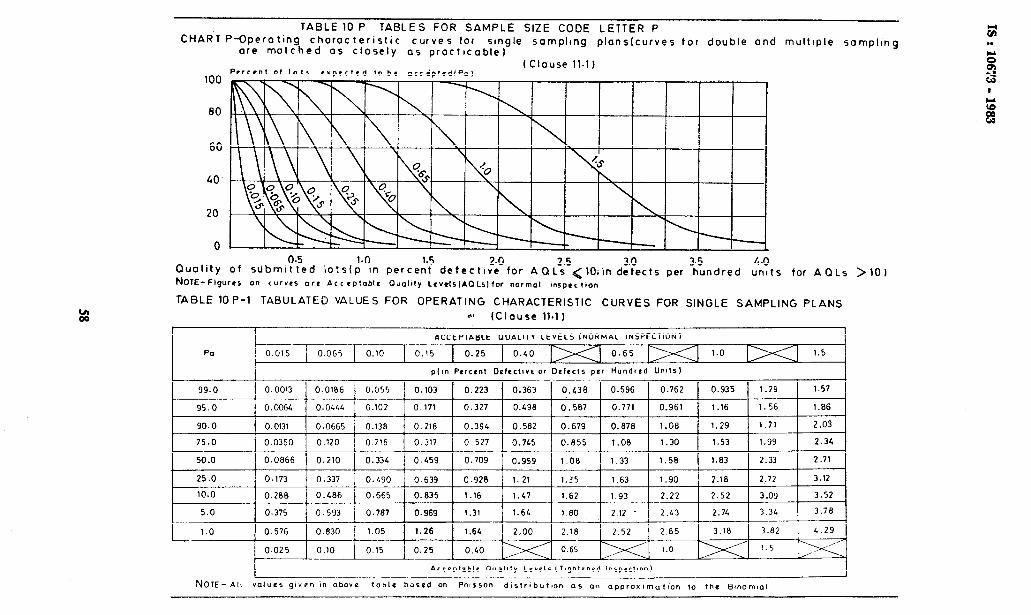
WI W
TABLE 10 P TABLES FOR SAMPLE SIZE CODE LETTER P CHART P-Dperoting chorocteristic curves for single sompllng plons(curves for double ond multlple sompllng
ore matched OS closely OS proctlcoblel
100
80
60
LO‘
20
0
Quality
to bc (Clause 11.1)
0.5 1.0 1.5 2.0 2.5 3.0 3.5 L-0 of slibmltted iots(p in percent detective for AQLs <lO;in defects per hundred units for AQLs >ldJ
NOTE- Figures on curves ore ACC rptonlc uual~ty L~vuIs(AOLS~IO~ normal inspcc (eon
TABLE lop-1 TABULATED VALUES FOR OPERATING CHARACTERISTIC CURVES FOR SINGLE SAMPLING PLANS
b* (Clause 11.1)
90.0 0.0131 0.0665 0.138 0.218 0.394 0.582 0.679 0.010 1.08 1.29 1.11 1 2.03
75.0 I 0.0360 I 0.120 I 0.216 I 0.317 I 0.527 I 0.705 I 0.855 I 1.08 1.30 1.53 1.99 2.34
NOTE- AII values given in above table bilsed on Poisson distributton os on oppro.x~motion to the Btnomlal
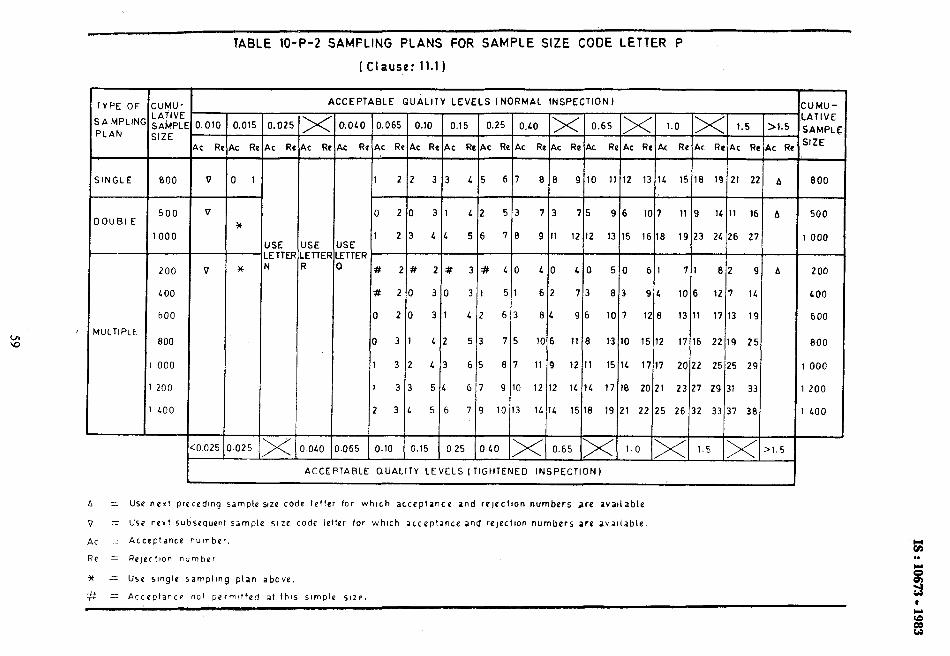
lYPE OF
SA MPLIN PLAN
SINGLE 000 V 0 1
DOUBLE
--
MULTIPLE
CUMU- LATIVE SAiYlPL SIZE
500
1000
200
LOO
600
800
000
200
100
TABLE 10-P-2 SAMFLING PLANS FOR SAMPLE SIZE CODE LETTER P
( Clause: 11.1)
0.010 0.015
ic R k RI AC R AC R
V
v
3(
*
JSE JSE .ETTEI .ETTEI I ?
ACCEPTABLE QUALITY LEVELS INORMAL INSPECTION J
I I
CO.025 0.025 >< O.OLO 0.065 0.10 0.15 0 25 0.40 >< 0.65 >(
ACCEPTABLE QUALITY LEVELS i TIGHTENED INSPECTION)
12 13 1L 15 16 19 21 2;
6
15
0 611 711 ‘312 S
3 9c 10 6 12 7 11
7 12 a 13 11 17 13 1s
IO 15 12 17 16 22 19 25
IL 17 17 20 22 25 25 29
I0 20 21 23 27 29 31 33
!l 22 25 26 32 33 37 36
1.0 >< 1.5
4c R
A = USP nexl preceding sample size code letter for which acceptance and rejection numbers are avaIlable
0 = Use next subsequent sample size code letter for which acceptance and rejectIon numbers are avatlable
AC = Acceptance number.
Re = Rejection number
* = Use single sampling plan above,
$k = Acceptance not permItted at this simple size.
Bl.5
CUMU- LATIVE
SAMPL
SIZE
-
800
500
1 000
200
LOO
600
800
1 000
1200
1 LOO
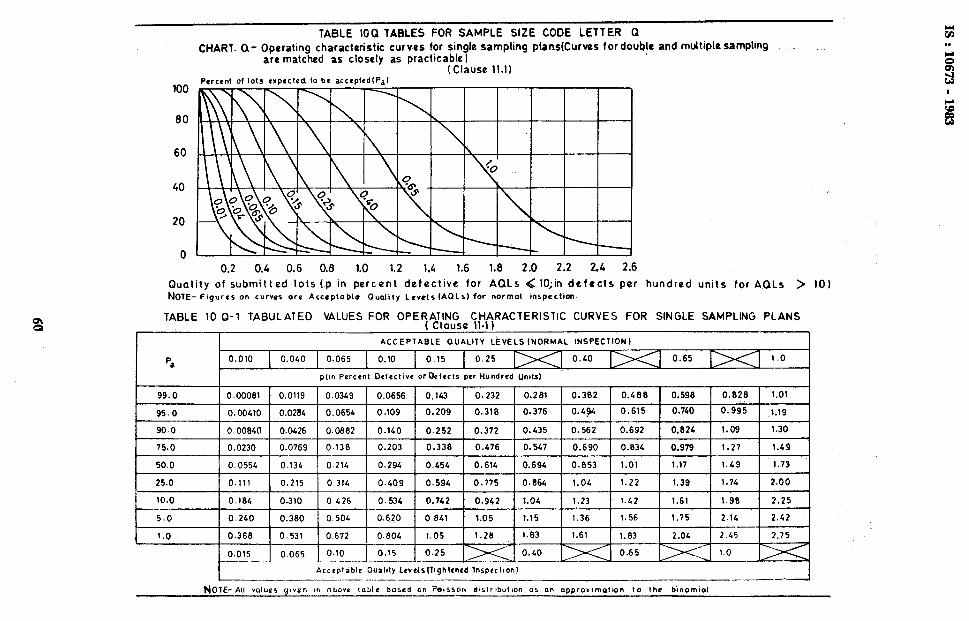
c
TABLE IOQTABLES FOR SAMPLE SIZE CODE LETTER 0 CHART. Q- Operating characteristic curves for single sampling ptans(Curves for double and muitipfesampting
are matched as closely as practicable) (Clause 11.1)
Percent of lots rxoected. to be acctotedlh) 100
80
60
40
20
0 0.2 0.4 0.6 0.8 1.0 1.2 1.4 1.6 1.8 2.0 2.2 24 2.6
Quotity of submitted lots (p in percent defective for AQLs < IQin defects per hundred units for AOLs > 10) NOTE- Figures on curves ore Acceptable Quality Levels IAOLsl for normal inspection.
TABLE 10 Q-l TABULATED VALUES FOR OPERATING CHARACTERISTIC CURVES FOR SINGLE SAMPLING PLANS f Clause 11.1 1
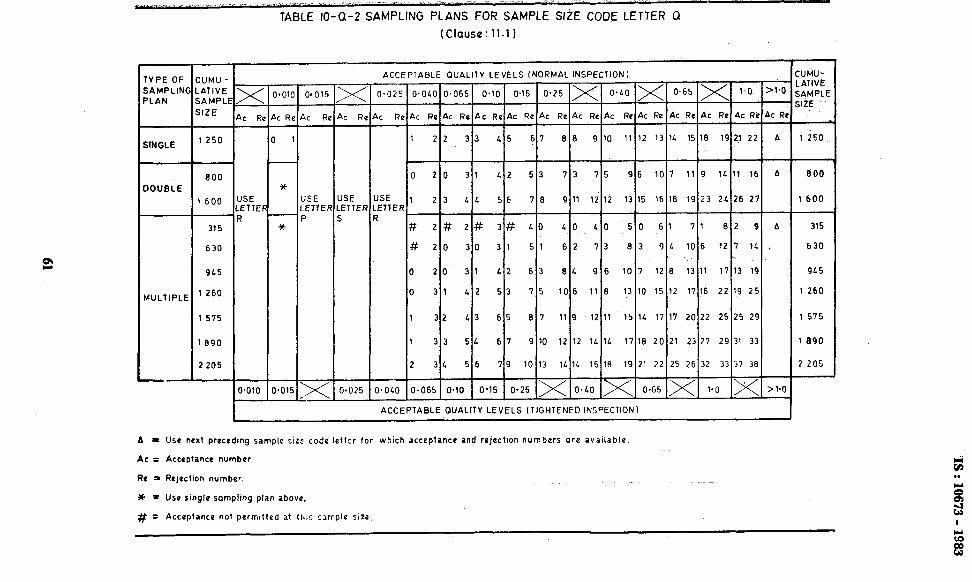
(Clause: 11.1)
ACCEPTABLI lYPE OF 3AMPLINl ‘LAN
UMU- AWE ,AMPLl ,IZE
1 250
800
I 600
315
630
9L5
1 260
1 575
I 890
2 205
QUALITY LEVELS (NORMAL INSPE ‘TION I
O.LO >( 0.65 >( 1.0
0 50 61 71 82 9
3 8 3 9L 106 12 1 1L : v
6 10 7 12 8 13 11 17 13 19 1
0 13 10 15 12 17 16 22 19 25
11 15 1L 17 17 20 22 25 25 29
1L 17 18 20 21 23 27 29 31 33
18 19 21 22 25 26 32 33 37 38
xi 0.65 /xi 1.0 /x
ACCEPTABLI QUALITY LEVELS (TIGHTENED INS ‘ECTION 1
:utdLJ-
ATIVE #AMPLt ;IZE
1250
600
315
630
9L5
1260
AC Rc c Rr
JSE ETTEF
IINGLE
ISE ETPE
JSE ETTEI !
> 1.0 so15 x 0.025
A = Use next procedmg sample size code letter for which acceptance and rejectron numbers are available.
AC = Acceptance number
Re 1 Rejectron number.
* = Use single sampling plan above.
#= Acceptance not permrtted at thrs simple size.
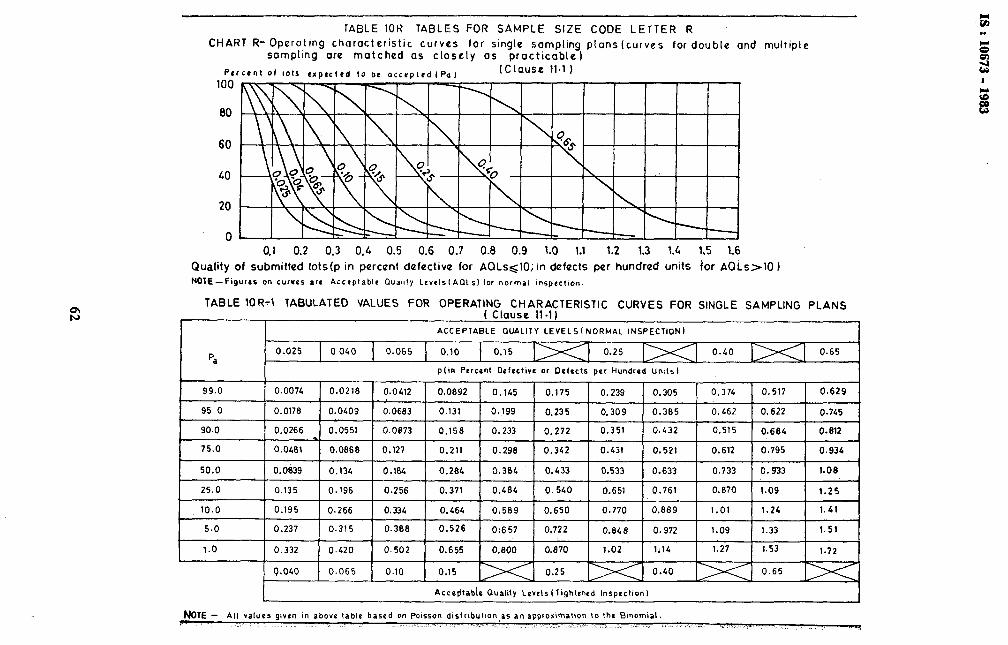
TABLE IOH TABLES FOR SAMPLE SIZE CODE LETTER R
CHART R- Operoling characteristic curves for single somplrng planslcurves for double and multiple sampling are matched as closely OS procticablel
Percent Of 101s expected 10 be occoolrd 1 Pal (Clause 11.1 1 100
60
20
0 0.1 0.2 0.3 0.4 0.5 0.6 0.7 0.8 0.9 1.0 1.1 1.2 1.3 1.4 1.5 1.6
Quality of submitted lots(p in percent defective for AQLsslO; In defects per hundred units iOr AQLs>lO )
NOTE-Figures on curws are Acccplablr oual~ty LevelslAOLs) for normal inspection.
TABLE lOR-1 TABULATED VALUES FOR OPERATING CHARACTERISTIC CURVES FOR SINGLE SAMPLING PLANS
I ( Clause 11.1)
ACCEPTABLE OlJALllY LEVELStNORMAL INSPECTIONI 1
I pa 0.025 0 040 0.065 0.10 0.15 0.25 0.40 0.65
I- I piia Percent Defective or Defects per Hundred Units1 I
99.0 0.0074 0.0218 0.0412 0.0892 0.145 0.175 0.239 0.305 0.374 0.517 0.629
95.0 0.0178 0.0409 0.0683 0.131 0.!99 0.235 0.309 0.305 0.462 0.622 0.745
90.0 0.0266 0.0551 0.0873 0.158 0.233 0.272 0.351 0.432 0.515 0.684 0.812
75.0 0.0401 0.0868 0.127 0.211 0.298 0.342 0.431 0.521 0.612 0.795 0.934
NOTE - All values gfivtn I” above table based on Poisson dlstrlbutkon as an approx~matwn to thr Binoniial.
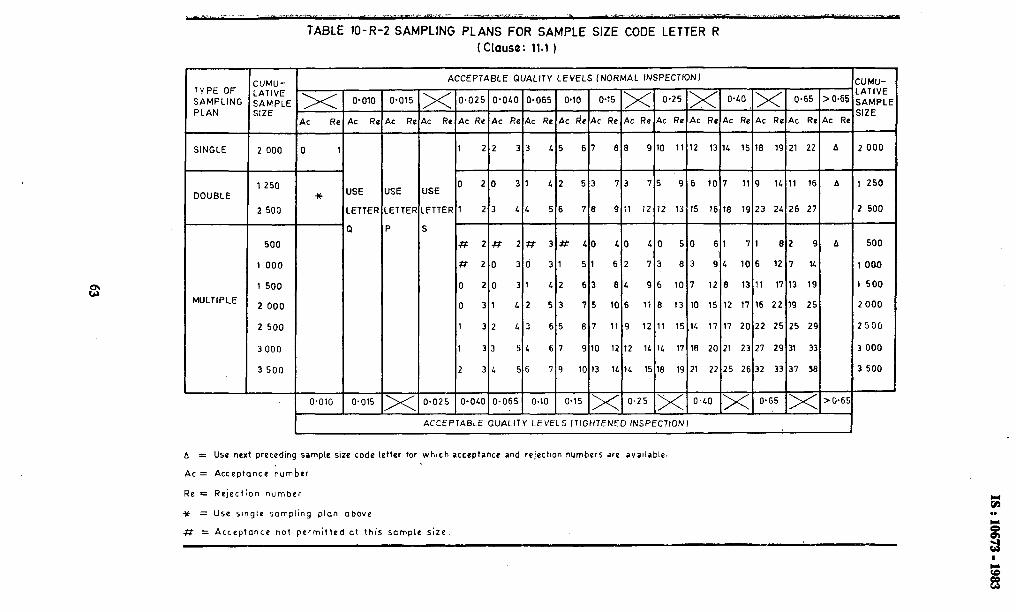
TYPE OF SAMPLING PLAN
SINGLE 2 000 1
DOUBLE
MULTIPLE
CUMU- LATIVE ‘AMPLE SIZE
1 250
2 500
500
1 000
1 500
2 000
2 500
3 000
3 500
TABLE IO-R-2 SAMPLING PLANS FOR SAMPLE SIZE CODE LETTER R 1 Clause: 11.1 )
*
0.010
‘SE
ETTEF
I
0*015
SE
ETTE
x
ACCEPTABLE QUALITY LEVELS (NORMAL INSPEClION)
0 20 31 L2 63 8L 96 10
0 31 L2 53 75 109 11 8 13
1 32 L3 65 01 11 9 12 11 15
1 33 51 67 9 10 12 12 1L 1L 17
2 31 56 79 10 13 1c 1L 15 18 1s
I.025 O*OCO O-065 0.10 0.15 >( 0.25 ><
ACCEPTABLE QUALITY LEVELS (TIGHTENED INSPECTION)
A = Use next precedmg sample size code letter for which acceptance and rejectton numbers we avaIlable. .
AC = Acceptance number
Re = Rejection number
)c = Use slnqle sampling plan above
$T = Acceptance not permitted at this sample size
:uuu- _ATIVE SAMPLI SIZE
2 000
L
I 250
2 500
500
1000
1 500
2 000
2500
3 000
3 500
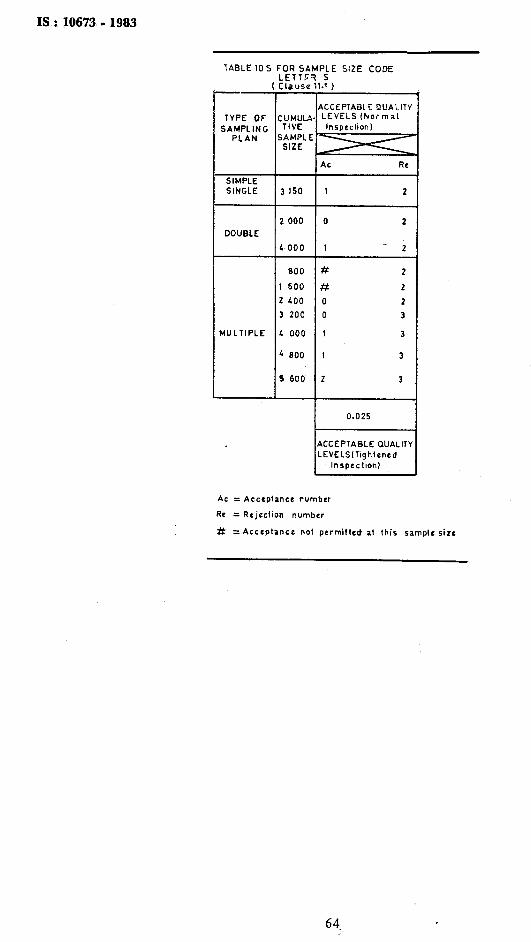
IS.: 10673 - 1983
TABLE 10 5
TYPE OF
SAMPLING PLAN
SIMPLE
SINGLE
DOUBLE
HULTIPLE
:UMUu TIVE
jAMPLl SIZE
3 150
2 000
4 000
800
I 600
2 LOO
3 200
4 000
4 a00
5 600
PLE SIZE CODE
:,
KCEPTABL E QUAI.ITY LEVELS Ilvormal
lnspcctwl)
AC Re
1 2
0 2
I A 2
# 2
# 2
0 2
0 3
I 3
1 3
2 3
0.025
LCCEPTABLE QUALITY
.EVELSITightcnrd
Inspection)
AC = Acceptance number
Rc = Rejeciion number
# ~Acccptancc not permitted at this sample size
64
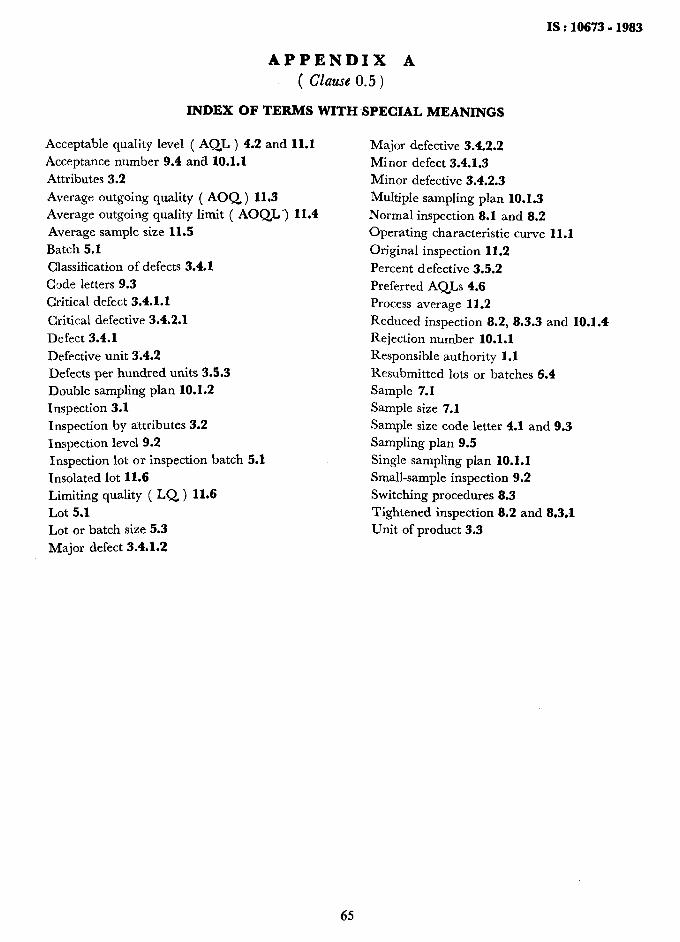
IS : 10673 - 1983
APPENDIX A ( czause 0.5 )
INDEX OF TERMS WITH SPECIAL MEANINGS
Acceptable quality level ( AQL ) 4-2 and 11.1 Acceptance number 9.4 and 10.1.1
Attributes 3.2
Average outgoing quality ( AOQ) 11.3 Average outgoing quality limit ( AOQL~) Il.4
Average sample size 11.5
Batch 5.1 Classification of defects 3.4.1
Code letters 9.3 Critical defect 3.4.1.1
Critical defective 3.4.2.1
Defect 3.4.1
Defective unit 3.4.2 Defects per hundred units 3.5.3
Double sampling plan 10.1.2
Inspection 3.1 Inspection by attributes 3.2
Inspection level 9.2 Inspection lot or inspection batch 5.1
Insolated lot II.6 Limiting quality ( LQ ) Il.6
Lot 5.1 Lot or batch size 5.3
Major defect 3.4.1.2
Major defective 3.4.2.2 Minor defect 3.4.1.3
Minor defective 3.4.2.3
Muhiple sampling plan 10.1.3
Normal inspection 8.1 and 8.2 Operating characteristic curve 11.1
Original inspection 11.2
Percent Ed efective 3.5.2
Preferred AQLs 4.6 Process average 11.2
Reduced inspection 8.2, 8.3.3 and 10.1.4
Rejection number 10.1.1 Responsible authority 1.1
Resubmitted lots or batches 6.4 Sample 7.1 Sample size 7.1
Sample size code letter 4.1 and 9.3 Sampling plan 9.5
Single sampling plan 10.1.1 Small-sample inspection 9.2 Switching procedures 8.3
Tightened inspection 8.2 and 8.3.3 Unit of product 3.3
65
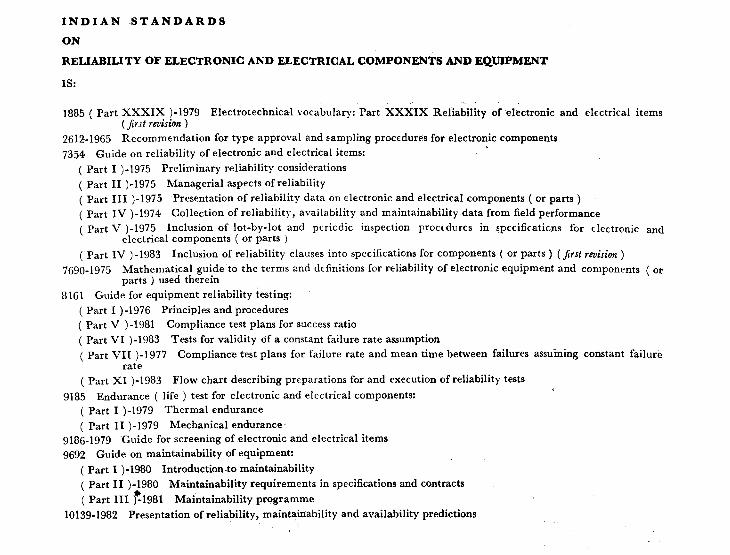
INDIAN STANDARDS
ON
RELIABILITY OF ELECTRONIC AND ELECTRICAL COMPONENTS AND EQUIPMENT
IS:
1885 ( Part XXXIX )-1979 Electrotechnical vocabulary: Part XXXIX Reliability of electronic and electrical items (Jirst revision )
2612-1965 Recommendation for type approval and sampling procedures for electronic components
7354 Guide on reliability of electronic and electrical items:
( Part I )-1975 Preliminary reliability considerations
( Part II )-1975 Managerial aspects of reliability
( Part III )-1975 Presentation of reliability data on electronic and electrical components ( or parts ) ( part IV )-1974 Collection of reliability, availability and maintainability data from field performance
( Part V )-1975 Inclusion of lot-by-lot and periodic inspection procrdcres in specifications for electronic and electrical components ( or parts )
( part IV ) -1983 Inclusion of reliability clauses into specifications for components ( or parts ) (Jirst y&ion )
7690-1975 Mathematical guide to the terms and definitions for reliability of electronic equipment and components ( or parts ) used therein
8161 Guide for equipment reliability testing:
( Part I )-1976 Principles and procedures
( Part V )-1981 Compliance test plans for success ratio
( Part VI )-1983 Tests for validity of a constant failure rate assumption
( Part VII )-1977 Compliance test plans for failure rate and mean time between failures assuming constant failure rate
( Part XI )-1983 Flow chart describing preparations for and execution of reliability tests
9185 Endurance ( life ) test for electronic and electrical components:
( Part I )-I979 Thermal endurance
( Part II )-1979 Mechanical endurance 9186-1979 Guide for screening of electronic and electrical items
9692 Guide on maintainability of equipment:
( Part I )-1980 Introduction~to maintainability
( Part II )-1980 Maintainability requirements in specifications and contracts
( Part III )*-I981 Maintainability programme
10139-1982 Presentation of reliability, maintainability and availability predictions