bioenergy ir roberto vazquez.pdf · sustainable farming of bioenergy crops . ligno-cellulosics ....
TRANSCRIPT

Bioenergy Roberto Vazquez
5th International Conference on Energy –Sustainable Energy Policies and Technologies
•Bioenergy Summary Layout
- Primary energy/liquid fuels
- Biomass potential
- Bioenergy platforms
- Integrated biorefinery
- Summary

•Bioenergy
- Primary energy/liquid fuels
- Biomass potential
- Bioenergy platforms
- Integrated biorefinery
- Summary
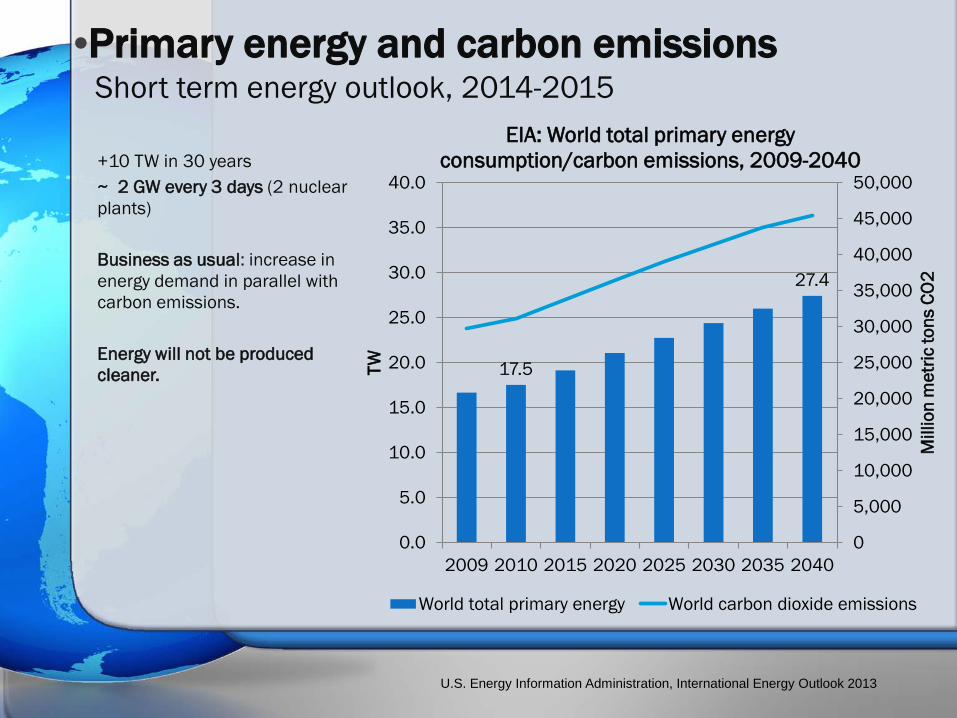
•Primary energy and carbon emissions Short term energy outlook, 2014-2015
U.S. Energy Information Administration, International Energy Outlook 2013
+10 TW in 30 years ~ 2 GW every 3 days (2 nuclear plants) Business as usual: increase in energy demand in parallel with carbon emissions. Energy will not be produced cleaner.
17.5
27.4
0
5,000
10,000
15,000
20,000
25,000
30,000
35,000
40,000
45,000
50,000
0.0
5.0
10.0
15.0
20.0
25.0
30.0
35.0
40.0
2009 2010 2015 2020 2025 2030 2035 2040
Mill
ion
met
ric to
ns C
O2
TW
EIA: World total primary energy consumption/carbon emissions, 2009-2040
World total primary energy World carbon dioxide emissions

•Bioenergy Summary Layout
- Primary energy/liquid fuels
- Biomass potential
- Bioenergy platforms
- Integrated biorefinery
- Summary
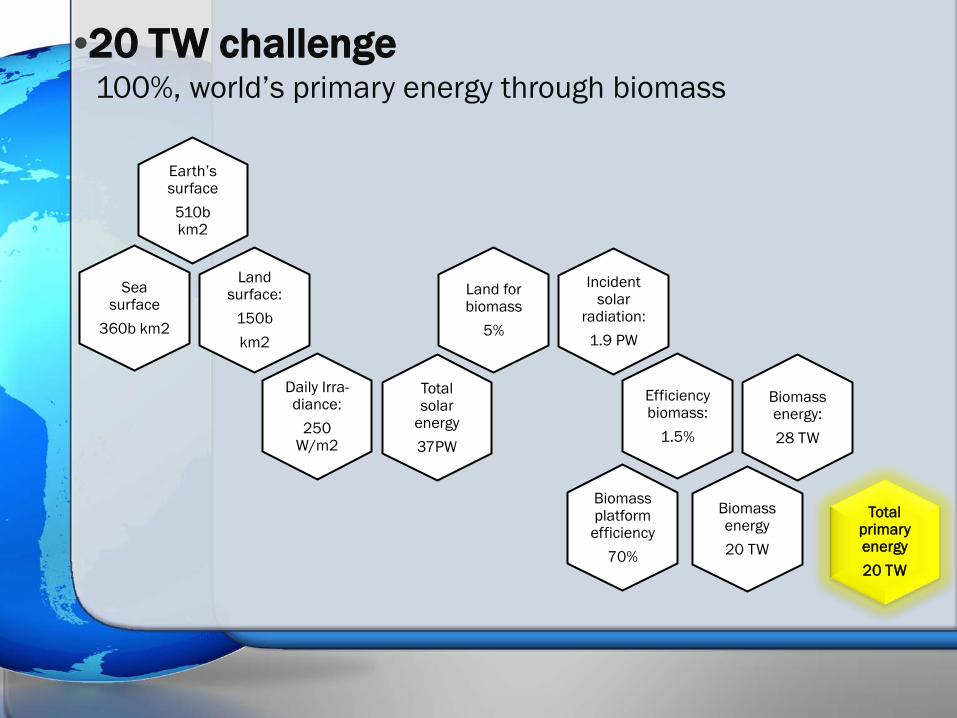
•20 TW challenge 100%, world’s primary energy through biomass
Land surface:
150b km2
Sea surface
360b km2
Earth’s surface 510b km2
Daily Irra-diance:
250 W/m2
Total solar
energy 37PW
Land for biomass
5%
Incident solar
radiation: 1.9 PW
Efficiency biomass:
1.5%
Biomass energy: 28 TW
Biomass platform efficiency
70%
Biomass energy 20 TW
Total primary energy 20 TW

Incident Radiation •54,000 GJ
ha-1 yr-1
Incident PAR •14,000 GJ
ha-1 yr-1
Intercepted PAR •10,000 GJ
ha-1 yr-1
Dry biomass production •884 GJ ha-1
yr-1
E (MJ m-2): incident radiation PARt (MJ m-2): accumulated incident photosynthetically active radiation (St from emergence to harvest) PARi (MJ m-2): intercepted PAR Y: total maximum dry aboveground biomass production εi Interception efficiency εc Conversion efficiency of PAR k: Energy per unit biomass
•Radiation interception/conversion Efficiencies of radiation interception and conversion (Miscanthus)
Y= 𝑆𝑡𝑘∙𝜖𝑖∙𝜖𝑐�
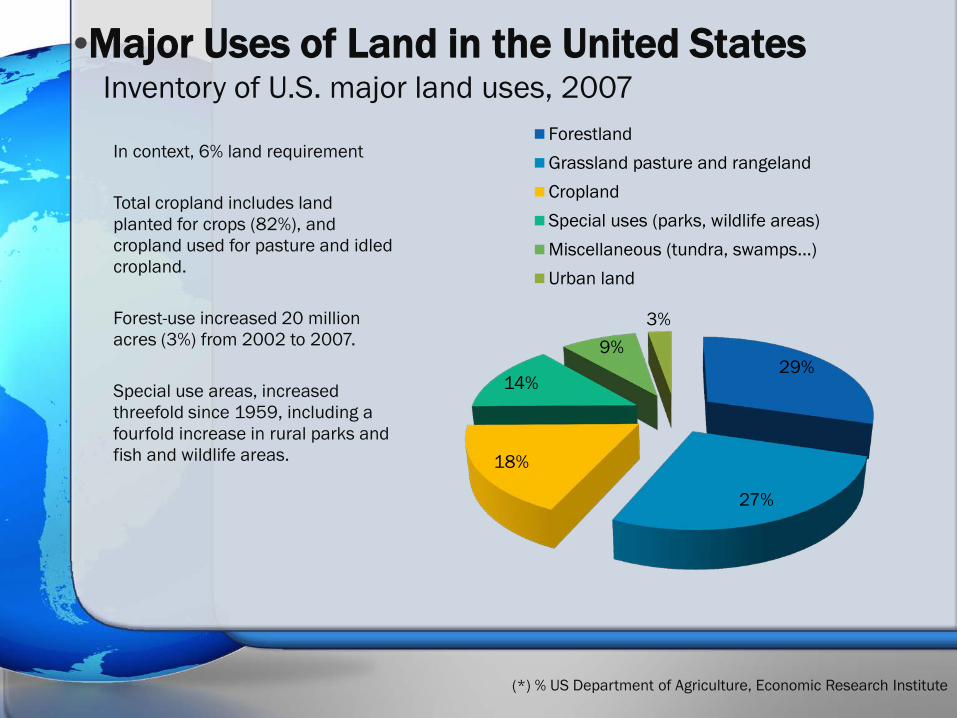
In context, 6% land requirement Total cropland includes land planted for crops (82%), and cropland used for pasture and idled cropland. Forest-use increased 20 million acres (3%) from 2002 to 2007. Special use areas, increased threefold since 1959, including a fourfold increase in rural parks and fish and wildlife areas.
•Major Uses of Land in the United States Inventory of U.S. major land uses, 2007
29%
27%
18%
14%
9% 3%
ForestlandGrassland pasture and rangelandCroplandSpecial uses (parks, wildlife areas)Miscellaneous (tundra, swamps...)Urban land
(*) % US Department of Agriculture, Economic Research Institute

•Deforestation Correlation biofuel production deforestation
0
10,000
20,000
30,000
40,000
50,000
Prod
uctio
n bi
ofue
ls '0
00 to
ns
1990 Methanol+Biodiesel Production (tons)
2014 Methanol+Biodiesel Production (tons)
0
10
20
30
40
50
60
70
80
1990 2000 2010
% F
ores
t Lan
d
Argentina
Brazil
Indonesia
0
10
20
30
40
50
60
70
1990 2000 2010
% F
ores
t Lan
d
EuropeanUnionUnitedStates
(*) % Forest land, World Bank, Biofuel production Platts
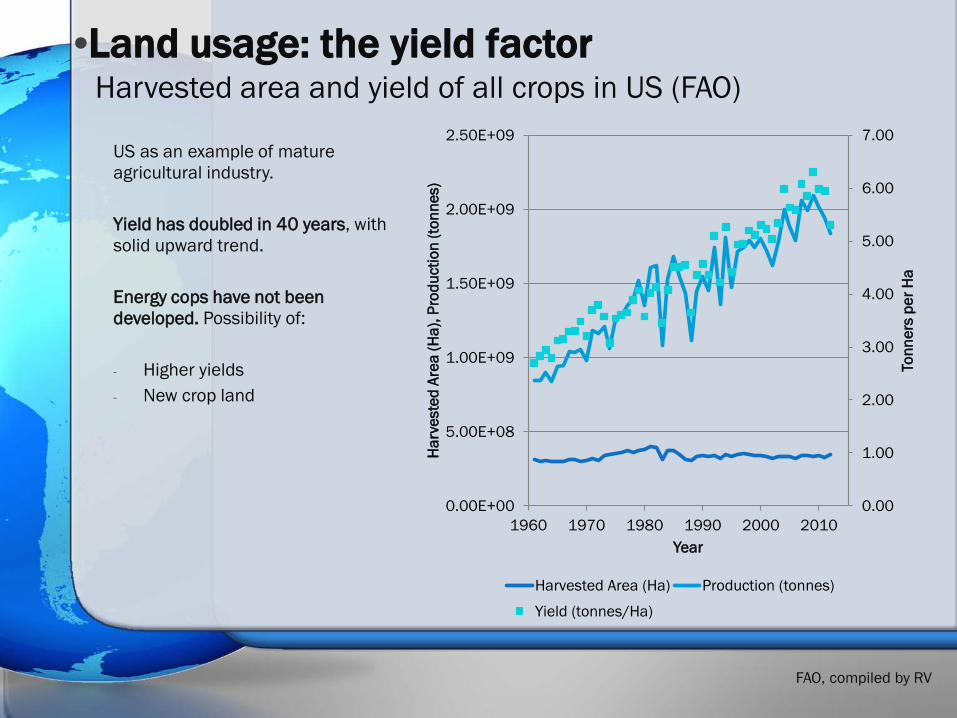
US as an example of mature agricultural industry. Yield has doubled in 40 years, with solid upward trend. Energy cops have not been developed. Possibility of: - Higher yields - New crop land
•Land usage: the yield factor Harvested area and yield of all crops in US (FAO)
0.00
1.00
2.00
3.00
4.00
5.00
6.00
7.00
0.00E+00
5.00E+08
1.00E+09
1.50E+09
2.00E+09
2.50E+09
1960 1970 1980 1990 2000 2010
Tonn
ers
per H
a
Har
vest
ed A
rea
(Ha)
, Pro
duct
ion
(tonn
es)
Year
Harvested Area (Ha) Production (tonnes)
Yield (tonnes/Ha)
FAO, compiled by RV
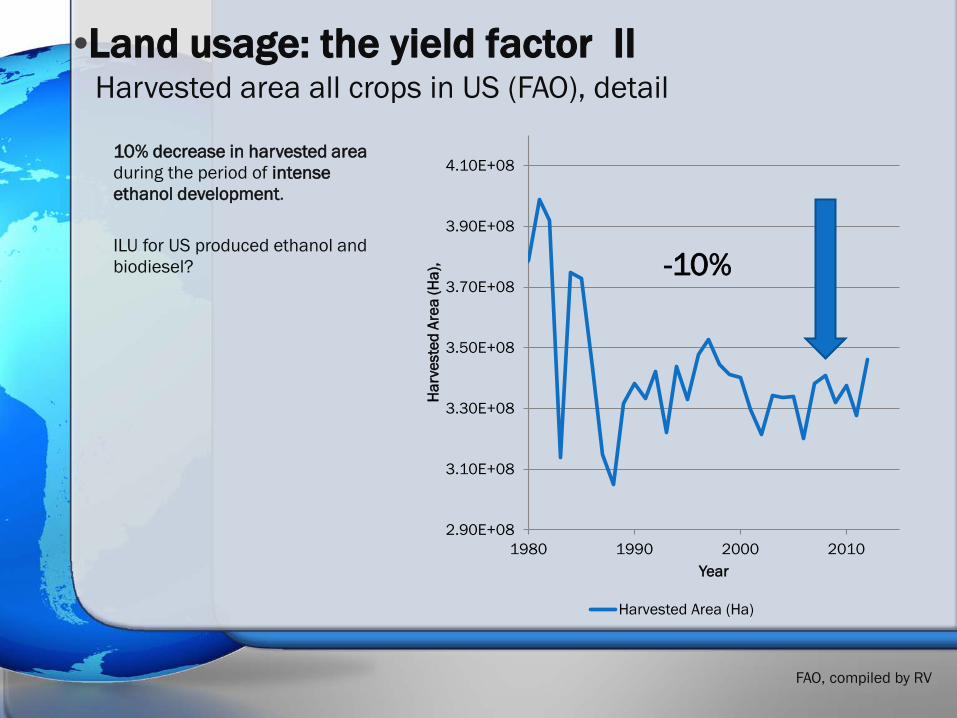
10% decrease in harvested area during the period of intense ethanol development. ILU for US produced ethanol and biodiesel?
•Land usage: the yield factor II Harvested area all crops in US (FAO), detail
2.90E+08
3.10E+08
3.30E+08
3.50E+08
3.70E+08
3.90E+08
4.10E+08
1980 1990 2000 2010
Har
vest
ed A
rea
(Ha)
,
Year
Harvested Area (Ha)
-10%
FAO, compiled by RV

KEY ASPECTS
The question is not “if” but “how much” we can produce in a sustainable way
From 1960 to 2010, agricultural production has increased threefold and per capita provision
of calories increased by 1/3 (FAOSTAT, 2013), in parallel with biofuel production
Current agriculture is well able to feed the world and will be able to feed 9B people in 2050
Challenge is not average supply of calories but distribution. This is a political issue.
Meat and milk production is in competition for land. Calorie production from crops is much more efficient. Dietary change?
Reduction of waste (more than 30% currently)
•Sustainability Sustainable Farming of Bioenergy Crops
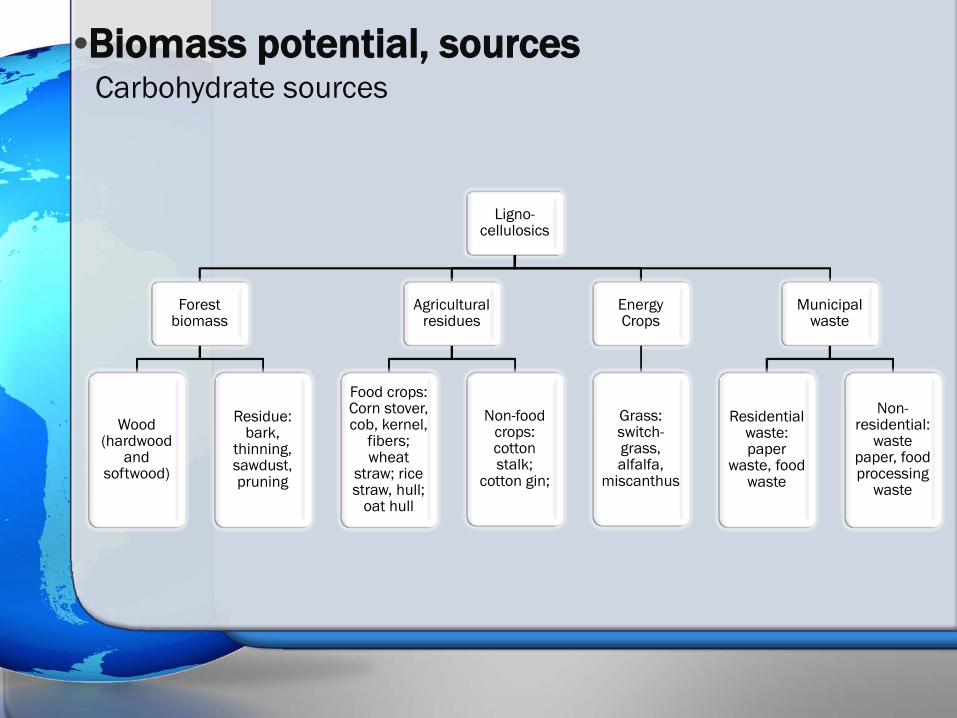
Ligno-cellulosics
Forest biomass
Wood (hardwood
and softwood)
Residue: bark,
thinning, sawdust, pruning
Agricultural residues
Food crops: Corn stover, cob, kernel,
fibers; wheat
straw; rice straw, hull;
oat hull
Non-food crops: cotton stalk;
cotton gin;
Energy Crops
Grass: switch-grass, alfalfa,
miscanthus
Municipal waste
Residential waste: paper
waste, food waste
Non-residential:
waste paper, food processing
waste
•Biomass potential, sources Carbohydrate sources
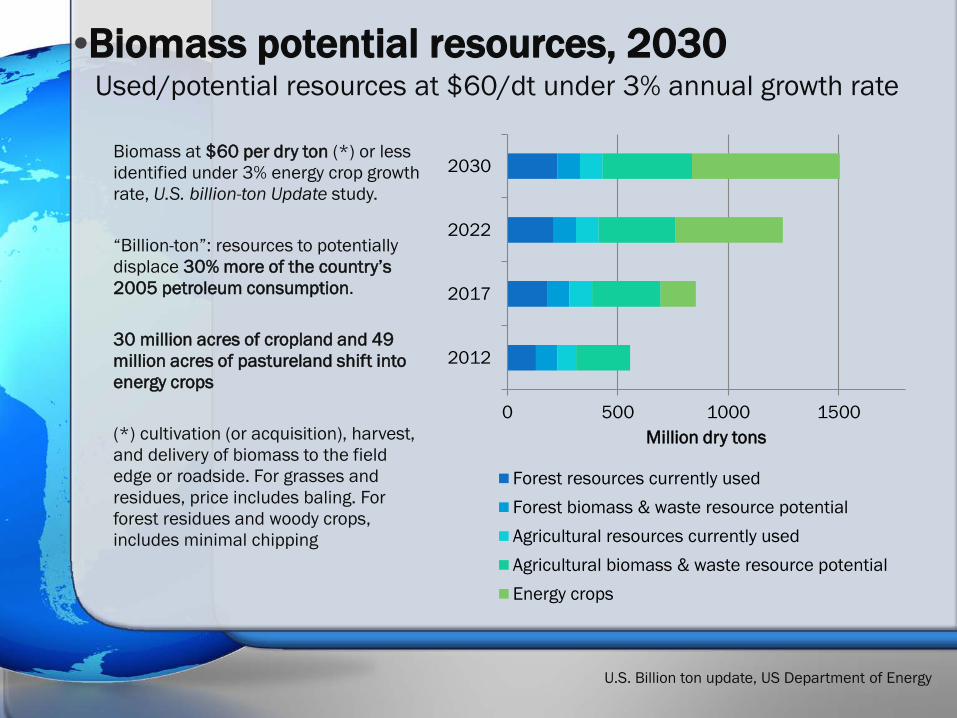
Biomass at $60 per dry ton (*) or less identified under 3% energy crop growth rate, U.S. billion-ton Update study. “Billion-ton”: resources to potentially displace 30% more of the country’s 2005 petroleum consumption. 30 million acres of cropland and 49 million acres of pastureland shift into energy crops (*) cultivation (or acquisition), harvest, and delivery of biomass to the field edge or roadside. For grasses and residues, price includes baling. For forest residues and woody crops, includes minimal chipping
•Biomass potential resources, 2030 Used/potential resources at $60/dt under 3% annual growth rate
0 500 1000 1500
2012
2017
2022
2030
Million dry tons
Forest resources currently usedForest biomass & waste resource potentialAgricultural resources currently usedAgricultural biomass & waste resource potentialEnergy crops
U.S. Billion ton update, US Department of Energy

Scalability and sensitivity of energy crops. Up to 400M dt by 2030 in baseline assumptions. Extreme sensitivity to price for energy crops. Tenfold increase from $40 ton to $60 ton.
•Biomass potential resources, 2030 (II) Available Forest, Agricultural and Energy crops (Baseline assumptions)
050
100150200250300350400450
2012 2017 2022 2027
Mill
ion
dry
tons
Forestresidues &wood residues(< $40 dt)Forestresidues &wood residues(< $50 dt)Forestresidues &wood residues(< $60 dt)
050
100150200250300350400450
2012 2017 2022 2027
Mill
ion
dry
tons
Agriculturalresidues andwastes (< $40dt)Agriculturalresidues andwastes (< $50dt)Agriculturalresidues andwastes (< $60dt)
050
100150200250300350400450
2012 2017 2022 2027
Mill
ion
dry
tons
Energy crops(< $40)Energy crops(< $50)Energy crops(< $60)
U.S. Billion ton update, US Department of Energy

•Biomass: feedstock selection
Chemical composition Price of
biomass (farm gate)
Energy content/ density
Yield, land require-ments
Logistic costs
Water
Fertilizer Pesticides herbicides
GHG emissions
Soil Erosion
Energy balance
Biodiversity, landscape
impact
Social impact (labour)
Feedstock Selection
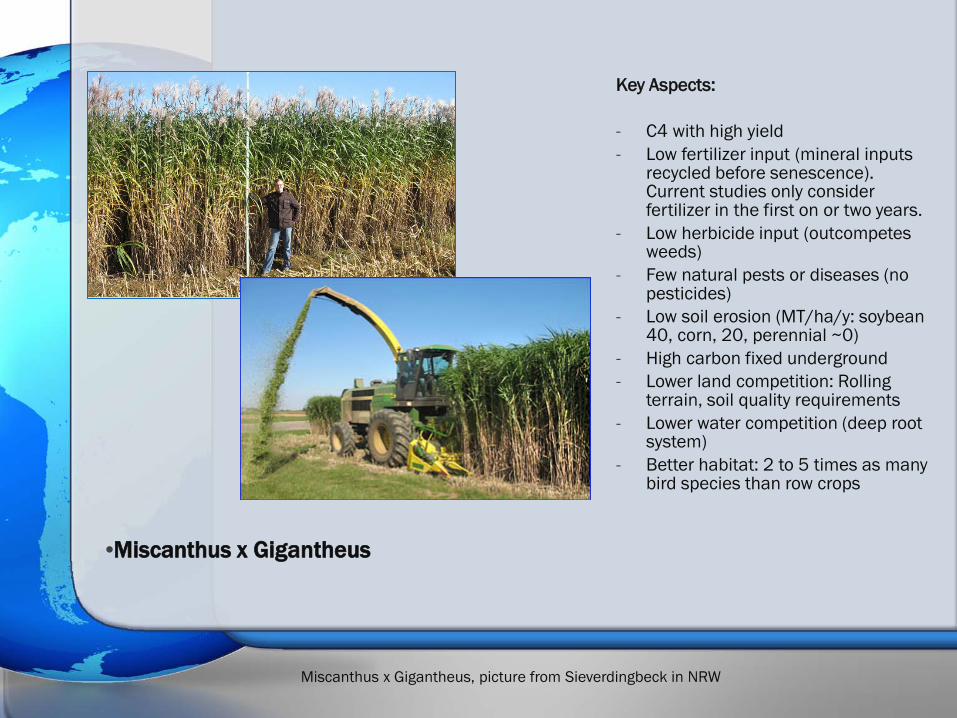
•Miscanthus x Gigantheus
Miscanthus x Gigantheus, picture from Sieverdingbeck in NRW
Key Aspects:
- C4 with high yield - Low fertilizer input (mineral inputs
recycled before senescence). Current studies only consider fertilizer in the first on or two years.
- Low herbicide input (outcompetes weeds)
- Few natural pests or diseases (no pesticides)
- Low soil erosion (MT/ha/y: soybean 40, corn, 20, perennial ~0)
- High carbon fixed underground - Lower land competition: Rolling
terrain, soil quality requirements - Lower water competition (deep root
system) - Better habitat: 2 to 5 times as many
bird species than row crops

•Bioenergy
- Primary energy/liquid fuels
- Biomass potential
- Bioenergy platforms
- Integrated biorefinery
- Summary
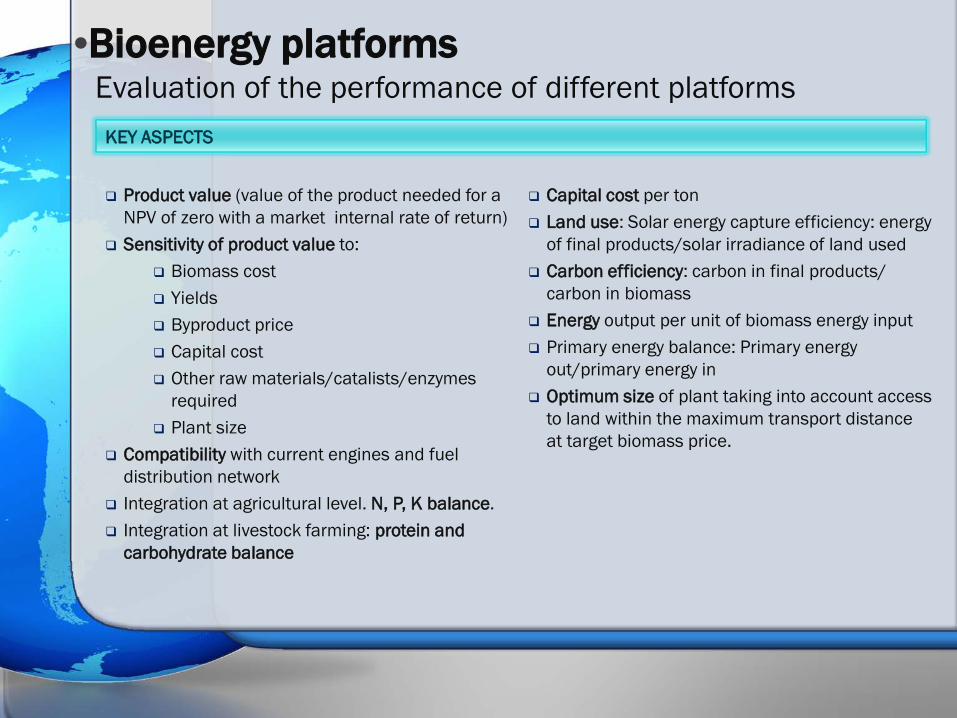
KEY ASPECTS
Product value (value of the product needed for a
NPV of zero with a market internal rate of return) Sensitivity of product value to:
Biomass cost Yields Byproduct price Capital cost Other raw materials/catalists/enzymes
required Plant size
Compatibility with current engines and fuel distribution network
Integration at agricultural level. N, P, K balance. Integration at livestock farming: protein and
carbohydrate balance
•Bioenergy platforms Evaluation of the performance of different platforms
Capital cost per ton Land use: Solar energy capture efficiency: energy
of final products/solar irradiance of land used Carbon efficiency: carbon in final products/
carbon in biomass Energy output per unit of biomass energy input Primary energy balance: Primary energy
out/primary energy in Optimum size of plant taking into account access
to land within the maximum transport distance at target biomass price.

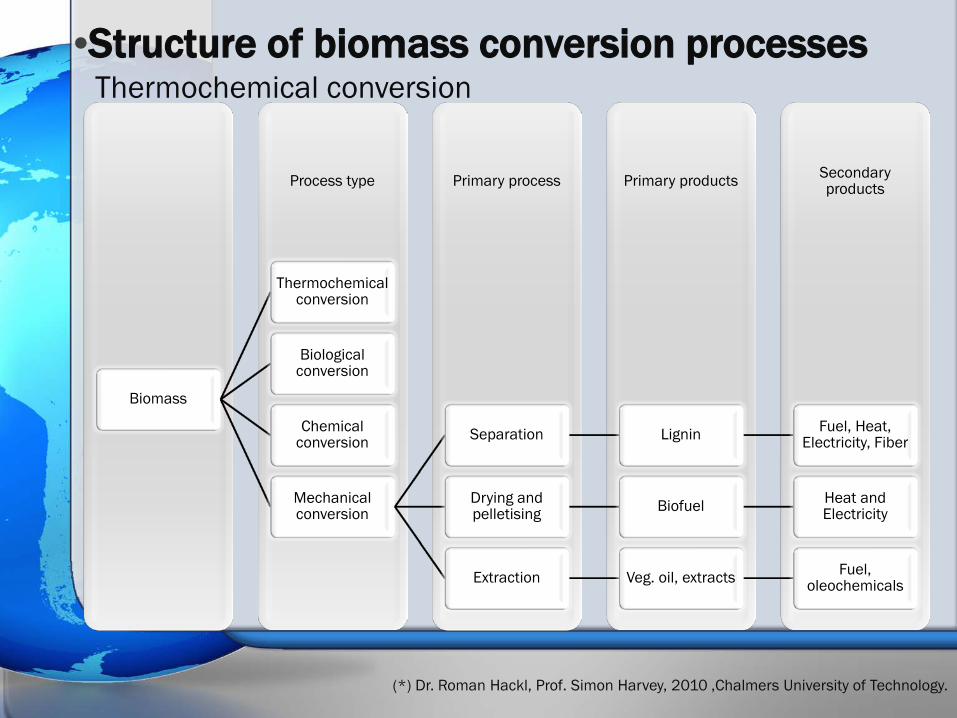
Secondary products Primary products Primary process Process type
Biomass
Thermochemi-cal conversion
Gasification Product gas Syngas, SNG-
FT, fuels, MeOH, olefiins
Pyrolysis Pyrolysis oil Fuel, biochemicals
Torrefaction Torrefied biomass Biofuel
Combustion Steam/heat Heat and electricity
Biological conversion
Chemical conversion
Mechanical conversion
•Structure of biomass conversion processes
(*) Dr. Roman Hackl, Prof. Simon Harvey, 2010 ,Chalmers University of Technology.
Thermochemical conversion

•Pyrolysis Combined biomass fast pyrolysis and H2 upgrading process diagram
(*)NREL, Techno-Economic Analysis of Biomass Fast Pyrolysis, M. Wright, J.A. Satrio, R. Brown, D. Daugaard, D. Hu

•Pyrolysis Key aspects - biomass pyrolysis
• Catalyst
•H-ZSM-5 & Ni-ZSM-5 •Sulfuric/
polyphosphoric acid •NaOH •Fe2(SO4)3 •ZnCl2
• Reactor type
•Entrained-flow •Conical spouted-bed •Bubbling Fluid bed
• Temp./Heating rate
•673 K + •10-200 °C/s
• Residence time
•Gas flow •Design
High complexity:
Multiscale nature of biomass feedstocks (1E1 to 1E-10 m) Multiphase nature of pyrolysis
Challenges (*):
Development of experimental techniques Anhydrosugars, pyrans and furans formation pathways from cellulose Product breakdown within intermediate liquid Solvation effect on intermediate liquid chemistry Catalysts (natural, primary and secondary) Char formation mechanism Heat transfer models Aerosols and their effect on bio oil production Particle shrinkage
(*) Energy & Environmental Science , Mettler, Matthew S.; Vlachos, Dionisios G.; Dauenhauer, Paul J.

•Structure of biomass conversion processes
(*) Dr. Roman Hackl, Prof. Simon Harvey, 2010 ,Chalmers University of Technology.
Biological conversion
Secondary products Primary products Primary process Process type
Biomass
Thermochemical conversion
Biological conversion
Anaerobic digestion Biogas Methane,
methanol, olefins
Fermentation Ethanol Fuel, ethylene,
ETBE, ethylamines
Enzymatic hydrolysis
Fermentable sugars
Ethanol, Fuel, ethylene,
ethylamines Chemical
conversion
Mechanical conversion
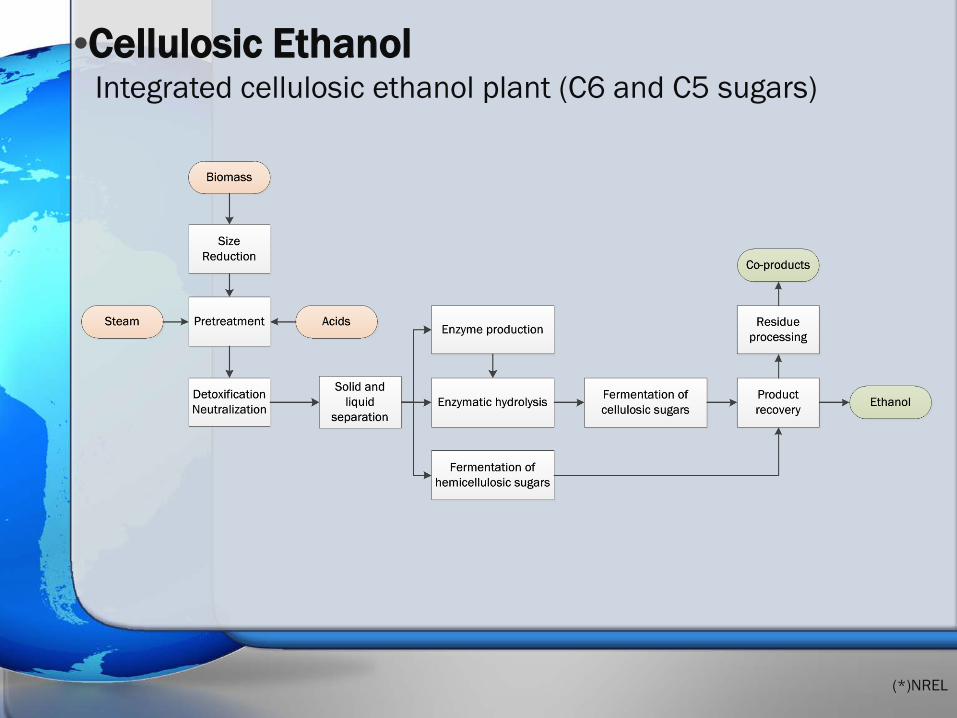
•Cellulosic Ethanol Integrated cellulosic ethanol plant (C6 and C5 sugars)
(*)NREL

•Lignocellulosic ethanol Commercial Facilities (2014)-Selection US
Company Location Products Status Raw Material
Pretreat-ment Tech. Lignin use
Abengoa Bioenergia
Hogoton, KS, USA (demo in Spain)
75,000 TPA EtOH, 22MW
(October 17, 2014?)
Corn stover, wheat straw, switchgrass, milo stubble (sorghum stalks)
Acid-catalyzed steam explosion, enzymatic hydrolysis
Co-product, recovered after distillation
POET-DSM Advanced Biofuels
Emmersburg, IA, USA
75,000 TPA EtOH
(September 2014?) Corn stover
Pretreat-ment, enzymatic hydrolysis
Biogas production
DuPont
Nevada, IA (demo in Vonore, Tennessee)
90,000 TPA EtOH End of 2014 Corn stover
Steam explosion/ enzymatic hydrolysis (cellulase, hemicellu-lase and beta-glucosidase)
Solid biofuel

•Lignocellulosic ethanol Commercial Facilities (2014)- EU/Brazil
Company Location Products Status Raw Material
Pretreat-ment Tech. Lignin use
Beta Renewables
Crescentino, Italy
40,000 TPA EtOH, 13 MW
Operational, October 2013
Arundo donax, straw
Steam explosion/ enzymatic hydrolysis
Solid biofuel
IOGEN- RAIZEN
Costa Pinto, Brazil (demo in Canada)
30,000 TPA EtOH Q4, 2014 Sugarcane
straw
Modified steam explosion, enzymatic hydrolysis
Steam and electricity generation
Grand Bio (Beta Renewables)
Alagoas, Brazil
65,000 TPA EtOH
Final commissioning June 2014
Sugar Cane Straw
Steam explosion/ enzymatic hydrolysis
Solid biofuel

Land required in a 20km radius for a 200,000 MT per year ethanol production Corn, 400 gal/acre; stover 8 dt/acre, 50% removal, 100 gal/dt; Energy crop, 35 dt/ha, 100 gal/dt
•Enzymatic hydrolysis - Efficiencies
54%
Corn
27%
Corn+stover
15%
Energy crop
3.0 MT/ha
3.0 MT/ha
10.5 MT/ha
0.0 MT/ha 4.0 MT/ha 8.0 MT/ha 12.0 MT/ha
Corn
Corn+stover
Energy crop
Ethanol production per ha
Starch Cellulosic waste Cellulosic
Production per ha:
Corn: current use Adding corn stover cellulosic
conversion, 50% removal Corn farm land converted to
energy crop
E35 possible with no additional land

Dose-efficiency – cost Biomass saccharification rates (glucanase, xylanases, beta-gulosidase) Reduced product inhibition Performance at high biomass solid loadings Operating conditions: sequential hydrolysis and fermentation (SHF), hybrid (HSF) and
simultaneous (SSF) pH and temperature range Pretreatment flexibility Substrate flexibility Nutrients
•Enzymatic hydrolysis - Challenges
0%
20%
40%
60%
80%
100%
PHP APB whPCS SEB AFEX CS WS
ACCELLERASE® TRIO™ (DuPont)
% glucan conversion% xylan conversion

•Structure of biomass conversion processes
(*) Dr. Roman Hackl, Prof. Simon Harvey, 2010 ,Chalmers University of Technology.
Thermochemical conversion
Secondary products Primary products Primary process Process type
Biomass
Thermochemical conversion
Biological conversion
Chemical conversion
Acid hydrolysis Cellulose,
hemicellulose, lignin
Fermentable sugars, methanol
Supercritical conversion
Cellulose, hemicellulose,
lignin Fermentable
sugars, ethanol
Solvent extraction Cellulose,
hemicellulose, lignin
Ethanol, extractives
Mechanical conversion

Wet whole cell conversion pathway Biocrude: composition and energy density closer petroleum crude than bio-oil from pyrolysis Biocrude: 44.5% afdw, 78.7% carbon, 10.1% hydrogen, 4.4% nitrogen, and 5.5% oxygen, 39 MJ/kg Biochar: >20% dw, 8 and 10 MJ kg–1
Aqueous coproducts: 18.4% afdw aqueous co-products (ACPs), C, N, P
•Hydrothermal liquefaction Pathways, yields
Liquefaction
Gas
Aqueous Insoluble Biochar
Aqueous Soluble Aqueous co-product
Decane insoluble
Dry Biochar
Evaporate solvent Biocrude
Decane soluble Evaporate solvent Biocrude
(*) Griffin, W. Roberts, Marie-Odile P. Fortier, Belinda S.M. Sturm, Susan M. Stagg-Williams (2013), Energy & Fuels.
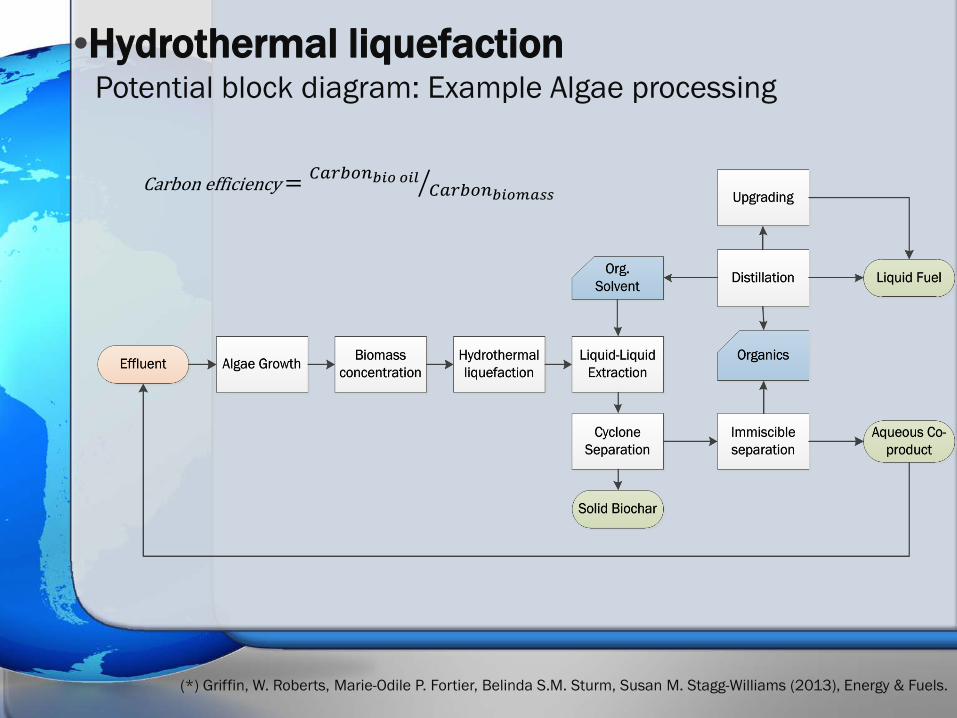
•Hydrothermal liquefaction Potential block diagram: Example Algae processing
(*) Griffin, W. Roberts, Marie-Odile P. Fortier, Belinda S.M. Sturm, Susan M. Stagg-Williams (2013), Energy & Fuels.
Carbon efficiency = 𝐶𝐶𝐶𝐶𝐶𝐶𝑏𝑖𝑏 𝑏𝑖𝑜𝐶𝐶𝐶𝐶𝐶𝐶𝑏𝑖𝑏𝑏𝑏𝑏𝑏�

•Algal – Derived biofuels Microalgal biomass to biofuel processing pathways
(*) Adapted from Second-Generation Biofuel from High-Efficiency Algal-Derived Biocrude, Rhykka Connelly, Univ. Texas
•Structure of biomass conversion processes
(*) Dr. Roman Hackl, Prof. Simon Harvey, 2010 ,Chalmers University of Technology.
Thermochemical conversion
Secondary products Primary products Primary process Process type
Biomass
Thermochemical conversion
Biological conversion
Chemical conversion
Mechanical conversion
Separation Lignin Fuel, Heat, Electricity, Fiber
Drying and pelletising Biofuel Heat and
Electricity
Extraction Veg. oil, extracts Fuel, oleochemicals

•Bioenergy
- Primary energy/liquid fuels
- Biomass potential
- Bioenergy platforms
- Integrated biorefinery
- Summary

• Process, agricultural and livestock farming integration •Integrated biorefinery
•Bioenergy
- Primary energy/liquid fuels
- Biomass potential
- Bioenergy platforms
- Integrated biorefinery
- Summary

Develop energy crops and associated agronomic practices Develop models to integrate agricultural and livestock farming within the biomass-
biorefinery operation Biochemical pathway:
Design new pretreatments to depolymerize efficiently cellulose and hemicellulose
Improve enzymatic hydrolysis yields/costs Develop new enzymatic pathways to yield produce hydrophobic compounds
with better compatibility (other than ethanol) Thermochemical pathway:
Develop catalyst and reactor design to improve bio crude quantity and quality Integration of the bio crude upgrade into naphtha/diesel process to optimize
costs
•Summary of challenges

Bioenergy Roberto Vazquez
5th International Conference on Energy –Sustainable Energy Policies and Technologies
Thank you

•20 MM bbl per day challenge 100% US liquid fuel demand through biomass
Land surface: 9.2E6 km2
Daily Irra-diance:
250 W/m2
Total solar
energy 2.3E3 TW
Land for biomass
6%
Incident solar
radiation: 1.4E2 TW
Efficiency biomass:
1.5%
Biomass energy: 2.1 TW
Biomass platform efficiency
70%
Biomass energy 1.4 TW
Total liquid fuel
US 1.4 TW

•Liquid fuel demand: dependency Short term energy outlook, US 2014-2015
-0.30
-0.15
0.00
0.15
0.30
0.45
0.60
0.75
2012 2013 2014 201516.5
17.0
17.5
18.0
18.5
19.0
19.5
20.0
U.S. Liquid Fuels Consumption million barrels per day (MMbbl/d)
Motor gasoline (right axis)Jet fuel (right axis)Distillate fuel (right axis)Other fuels (right axis)
annual change (MMbbl/d)
Source: Short-Term Energy Outlook, August 2014.
Liquid fuel demand has been relatively stable and will remain stable in the near future in OECD countries. Decreases in Japan and Europe. Non-OECD consumption is projected to grow by 1.3 million bbl/d in 2014 and 1.2 million bbl/d in 2015, accounting for nearly all forecast global consumption. China is the leading contributor to projected global consumption.

•Forecasted increase in liquid fuel production Short term energy outlook, 2014-2015
Source: Short-Term Energy Outlook, August 2014.
Forecasted increases of production in biomass based fuel are minimal, even in leading countries. Biodiesel is not competitive (yet) and difficult to scale Ethanol has reached blend wall (E10) and E85 development is slow. Cellulosic ethanol has not met short term expectations. -0.2
0.0
0.2
0.4
0.6
0.8
1.0
1.2
1.4
2012 2013 2014 20156
7
8
9
10
11
12
13
14
U.S. Crude Oil and Liquid Fuels Production million barrels per day (MMbbl/d)
Crude oil (right axis)Natural gas plant liquids (right axis)Fuel ethanol (right axis)Biodiesel (right axis)
annual change (MMbbl/d)

• Synthesis, Stomata, Enzymes • Water Use Efficiency (WUE): ratio of carbon dioxide intake to water lost through transpiration • Photorespiration: Under high light and high heat, the enzyme (RUBISCO) that grabs carbon dioxide for photosynthesis may grab oxygen instead, causing respiration
•Photosynthetic pathways: C4 and CAM Types of photosynthesis: arid adaptation
C3 Plants C4 Plants CAM Plants
Synthesis CO2 incorporated in to 3-carbon compound
CO2 incorporated in to 4-carbon compound
CO2 is stored in the form of an acid before photosynthesis
Stomata Open during the day
Open during the day (less) Open at night
Enzymes
RUBISCO photosynthesis and uptake of CO2
Carboxylase for CO2 uptake (quicker)
Acid releases CO2 for RUBISCO
Adaptation
More efficient than C4 and CAM plants under cool and moist conditions
Faster photosynthesis at high temperature, avoiding photorespiration. Better water efficiency
Very good water efficiency. May CAM-idle