iof crm & the donor journey - top ten tips for driving fundraising with data
TRANSCRIPT

1
Top ten tips for driving fundraising with your data
(aka) how I learned to love data

2
Who we are
Steve ThomasManaging Director, Purple Visionwww.purple-vision.com@stevethomas393 @purple_vision
Dawn VarleyDirector of Marketing and Fundraising, League Against Cruel Sportswww.league.org.uk @nfpdawnv

3
Contents
What• Strategy• Silos• People
How• DP• Segmentation• Tools• Integrate
So• Analyse• Journeys• Evangelism

4
1. Know what you’ve got
• What data?• Who decides collection/coding?• Who knows it?• Org retains info?
Data must be driven by strategy

The classic donor pyramid
5
Fundraising 101.
But *completely useless* if you don’t know what the data says…

6IoF National Convention 2013
2. Avoid keeping data in silos
7

Data map
Donations RG
CMS
Donor databaseEvents |Trust & Statutory | Stakeholders | Members
Data import
layer
API
MediaPolitical contacts
Online Advocacy
Campaign emailsPetitions
MPs
Off-line capture
Data house
Bulk Email
Donations SG
Retail
Complaints
Operations
HRSurvey
Volun-teers
Fin-ance
Text donation
Social mediamonitor and broadcast
Website

9
3. Remember data is all about people
• Gifts don’t give themselves• The best fundraising is relational, not
transactional (Fundraising 101…)• To grow your fundraising you have to know
your data• And there are other people too…

10
Data is about people, process and technology(in that order)

11
4. Keep it clean, and respectful
You’ve got data, but is it healthy? Data cleansing is important – budget for it and do it. It can save you money, add value, and keep supporters happy.
You can’t talk about data with the dreaded Data Protection subject coming up…
Data protection is just about respect for your supporters. How would you like to be treated?
The key to success is…
12

5. Recognise diversity in data
One size doesn’t fit all

14
What is Segmentation?
Classification of the population into subgroups that are:
• Distinguishable• Identifiable• Manageable• Fit for purpose

15
Why segment?
• Make targeting more appropriate to audience• Avoid scattergun communications• Protect against unsubscribes and lapsing• Makes internal expectations realistic
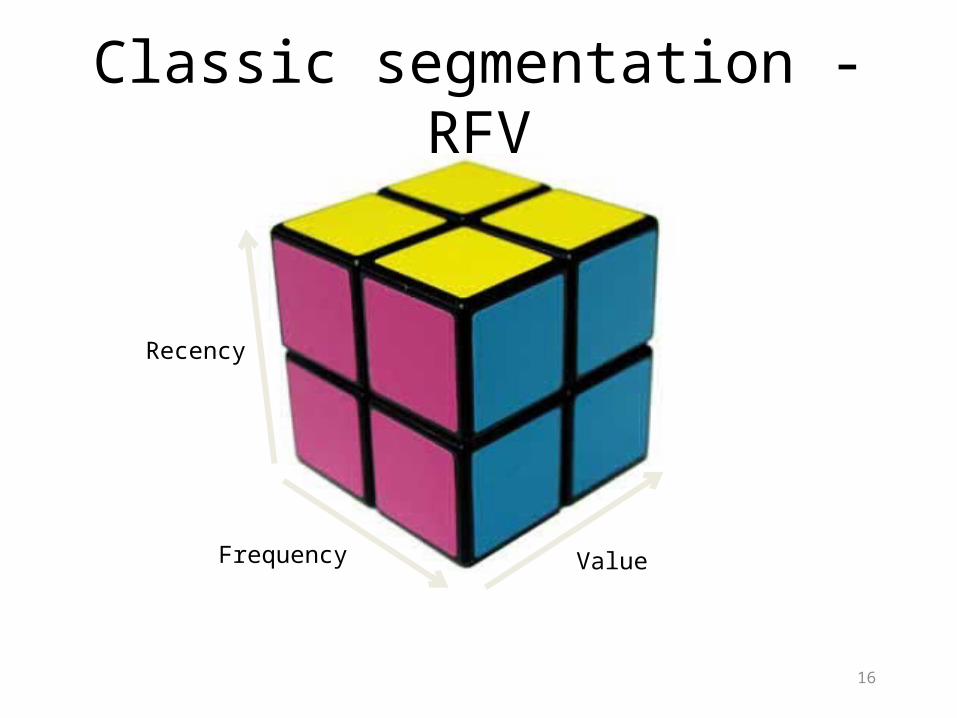
Classic segmentation - RFV
Frequency
Recency
Value
16

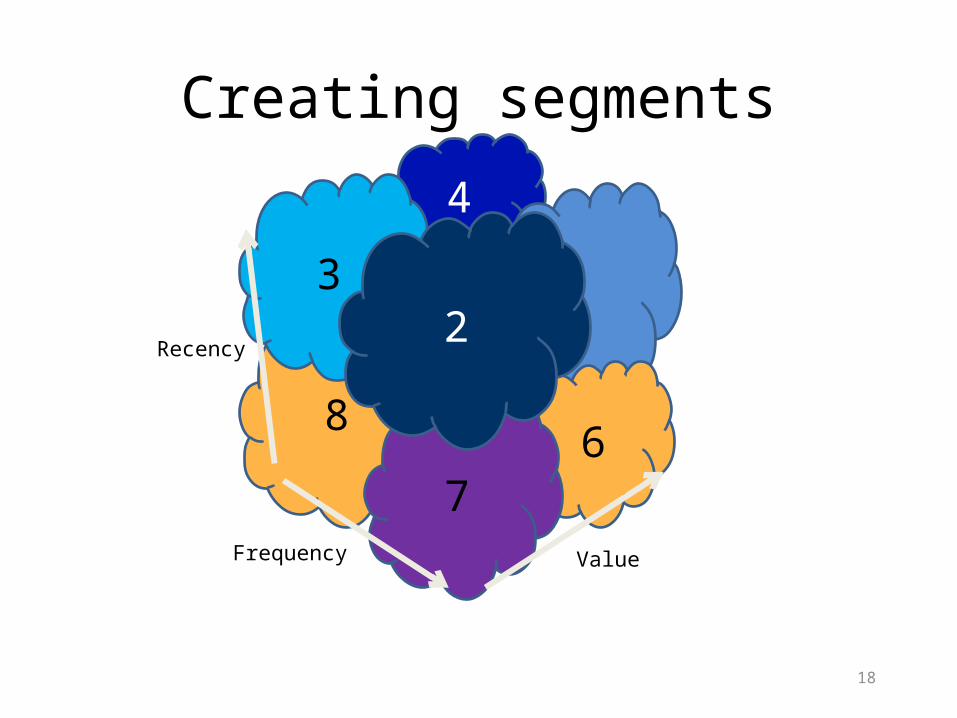
Creating segments
Frequency
Recency
Value
17
9
Creating segments
8
4
13
67
2
Frequency
Recency
Value
18

Bases for Segmentation
• Types of information to collect to enable better segmentation:• Comms preferences• Format/media type• Event attendance• Frequency of contact• Purchases
• Supporter category• Reason for support• How old are they?• How loyal are they?• Where in life cycle?• Where do we want to
take them?
19
Choose data relevant to your strategy
20
6. How to manage data
You now understand the data, and know how to make the most of it. But what systems help you do that?• Data lives in systems, eg CRM, CMS, Excel etc• Know your systems (‘System Architecture’)• Build to future proof, and this is driven by…
Fundraising/Organisational strategy (101!)If I had a £1…

21

7. Integrate
23
7. Integrate
24
Email & social media integration
• Add-ins – eg. Outlook• CRM integration “bridges”• Benefits
• Track friends and followers• Major donors• Advocates and viral “buzz”• Measure level of influence

IoF National Convention 2013 25

26
27
Systems integration

Data map
Donations RG
CMS
Donor databaseEvents |Trust & Statutory | Stakeholders | Members
Data import
layer
API
MediaPolitical contacts
Online Advocacy
Campaign emailsPetitions
MPs
Off-line capture
Data house
Bulk Email
Donations SG
Retail
Complaints
Operations
HR
Survey
Volun-teers
Fin-ance
Text donation
Social mediamonitor and broadcast
Website

Website
Donor DatabaseEvents |Trust &
Statutory | Stakeholders | Members
Data Import
Layer
API
Media Directory
Political contacts
Online AdvocacyCampaign emails
PetitionsMPs
Off-line capture
Data house
Bulk EmailBulk emailSegmentationNewsletter Design
Fin-ance
CMS Forms, HR, Volunteers
News, Forums
Online Fundraising
Supporter Portals, Donor Journeys
Events & P2PE-commerce
Data Warehouse
API Data Tools
Complaints
Volun-teers HRRetail
Operations
Social monitor and Broadcast
Text donation
29
Data Analytics & Reporting
Data warehouse

30
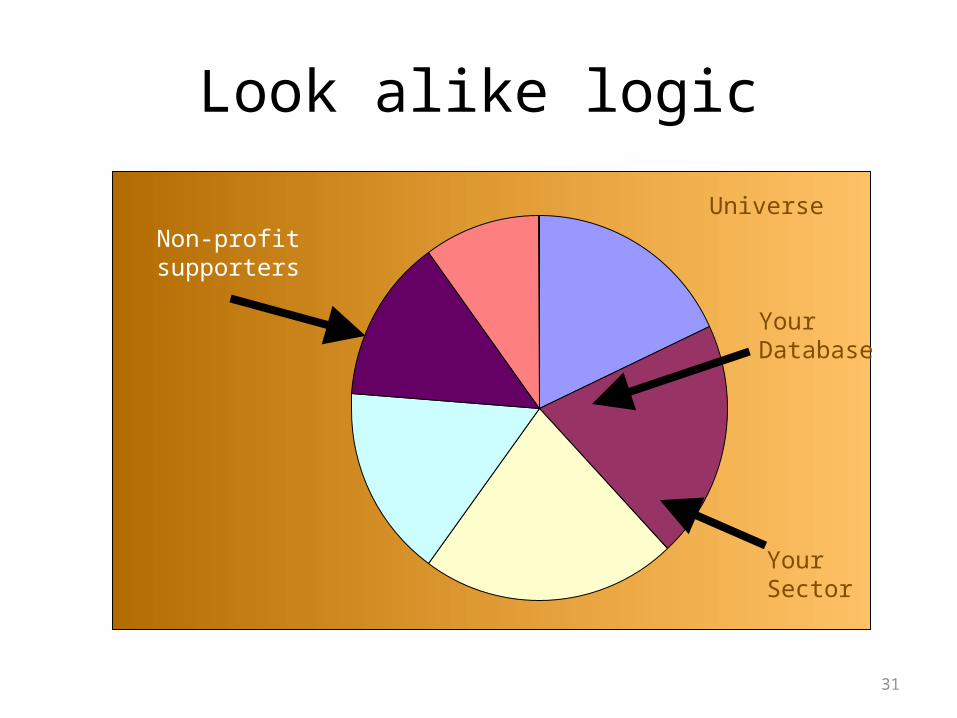
8. So – what does this mean?
So, you have your data, you know what it means, and you have it in the right place…Now you need to make the data work for you by:• Profiling your data• Learning from your data• Using it to inform your strategy eg looky-like
acquistion, targeted messages, correct channels
31
Look alike logic
Universe
Your Database
Your Sector
Non-profit supporters

32
Profile variables
• Income• Housing Tenure• Spending Power• Education• Occupation• Social Grade
• Age• Children• Household Size• Property Type• Urbanicity• Retail Accessibility

33
Profile Model – closeness of fitSegment 4 (71<Tenure) AND (54<Age) AND (60<Urbanicity<=65)
Segment 16 (85<Tenure) AND (54<Age) AND (65<Urbanicity<=83)
Segment 7 (71<Tenure<=85) AND (54<Age) AND (65<Urbanicity<=83)
Segment 10 (71<Tenure) AND (Age<=54) AND (72<Property) AND (60<Urbanicity<=83)
Segment 8 (40<Tenure<=71) AND (56<Age) AND (62<Urbanicity<=83)
Segment 3 (71<Tenure) AND (Age<=54) AND (Property<=72) AND (60<Urbanicity<=83)
Segment 15 (32<Tenure<=71) AND (45<Spend) AND (Age<=56) AND (60<Urbanicity<=88)
Segment 9 (40<Tenure<=71) AND (Education<=46) AND (56<Age) AND (83<Urbanicity)
Segment 11 (71<Tenure) AND (63<Age) AND (83<Urbanicity)
Segment 20 (11<Income) AND (Tenure<=40) AND (56<Age) AND (Children<=50)
Segment 18 (71<Tenure) AND (82<Spend) AND (Urbanicity<=60)
Segment 14 (32<Tenure<=71) AND (Spend<=45) AND (Age<=56) AND (60<Urbanicity<=88)
Segment 19 (40<Tenure<=71) AND (46<Education) AND (56<Age) AND (83<Urbanicity)
Segment 6 (40<Tenure<=71) AND (56<Age) AND (Urbanicity<=62)
Segment 22 (Tenure<=32) AND (25<Spend) AND (Age<=56) AND (60<Urbanicity<=88)
Segment 17 (Tenure<=40) AND (Education<=29) AND (56<Age) AND (50<Children)
Segment 5 (Income<=11) AND (Tenure<=40) AND (56<Age) AND (Children<=50)
Segment 2 (71<Tenure) AND (Age<=63) AND (83<Urbanicity)
Segment 0 (Tenure<=71) AND (Age<=56) AND (Urbanicity<=60) AND (Retail<=43)
Segment 1 (71<Tenure) AND (Spend<=82) AND (Urbanicity<=60)
Segment 24 (Tenure<=40) AND (29<Education) AND (56<Age) AND (50<Children)
Segment 13 (Tenure<=32) AND (Spend<=25) AND (Age<=56) AND (60<Urbanicity<=88)
Segment 23 (Tenure<=71) AND (38<Age<=56) AND (88<Urbanicity)
Segment 12 (Tenure<=71) AND (Education<=36) AND (Age<=38) AND (88<Urbanicity<=90)
Segment 28 (Tenure<=71) AND (36<Education) AND (Age<=38) AND (88<Urbanicity<=90)
Segment 27 (Tenure<=71) AND (38<Spend) AND (Age<=56) AND (Urbanicity<=60) AND (43<Retail)
Segment 26 (Tenure<=71) AND (39<Occupation) AND (Age<=38) AND (90<Urbanicity)
Segment 21 (Tenure<=71) AND (Spend<=38) AND (Age<=56) AND (Urbanicity<=60) AND (43<Retail)
Segment 25 (Tenure<=71) AND (Occupation<=39) AND (Age<=38) AND (90<Urbanicity)

Profile Model – closeness of fitAssembli Model Customers Base Penetration Z-Score Index
Counts % Counts % % 0 100 200
Segments
Segment 4 1582 11.7 10311 3.0 15.3 9 396 ██████████ >200
Segment 16 1206 8.9 10017 2.9 12.0 7 311 ██████████ >200
Segment 7 980 7.2 10008 2.9 9.8 6 253 ██████████ >200
Segment 10 958 7.1 10183 2.9 9.4 6 243 ██████████ >200
Segment 8 1418 10.5 16860 4.8 8.4 6 217 ██████████ >200
Segment 3 950 7.0 15953 4.6 6.0 3 154 █████ Segment 15 661 4.9 12749 3.7 5.2 2 134 ███ Segment 9 540 4.0 10787 3.1 5.0 2 129 ███ Segment 11 534 4.0 10760 3.1 5.0 2 128 ███ Segment 20 565 4.2 14191 4.1 4.0 0 103 Segment 18 377 2.8 10391 3.0 3.6 0 94 █ Segment 14 497 3.7 15365 4.4 3.2 -1 84 ██ Segment 19 385 2.8 12085 3.5 3.2 -1 82 ██ Segment 6 404 3.0 13376 3.8 3.0 -2 78 ██ Segment 22 267 2.0 10391 3.0 2.6 -2 66 ███ Segment 17 232 1.7 10003 2.9 2.3 -3 60 ████ Segment 5 228 1.7 10115 2.9 2.3 -3 58 ████ Segment 2 352 2.6 17560 5.0 2.0 -5 52 █████ Segment 0 215 1.6 12063 3.5 1.8 -5 46 █████ Segment 1 158 1.2 10053 2.9 1.6 -5 41 ██████ Segment 24 159 1.2 10856 3.1 1.5 -6 38 ██████ Segment 13 152 1.1 10429 3.0 1.5 -6 38 ██████ Segment 23 253 1.9 17591 5.0 1.4 -8 37 ██████ Segment 12 120 0.9 10061 2.9 1.2 -7 31 ███████ Segment 28 82 0.6 10053 2.9 0.8 -10 21 ████████ Segment 27 74 0.5 10014 2.9 0.7 -11 19 ████████ Segment 26 74 0.5 10316 3.0 0.7 -11 19 ████████ Segment 21 48 0.4 12971 3.7 0.4 -19 10 █████████ Segment 25 47 0.3 13458 3.9 0.3 -21 9 █████████ - - - 0 0
Total 13518 348,970 3.87
34
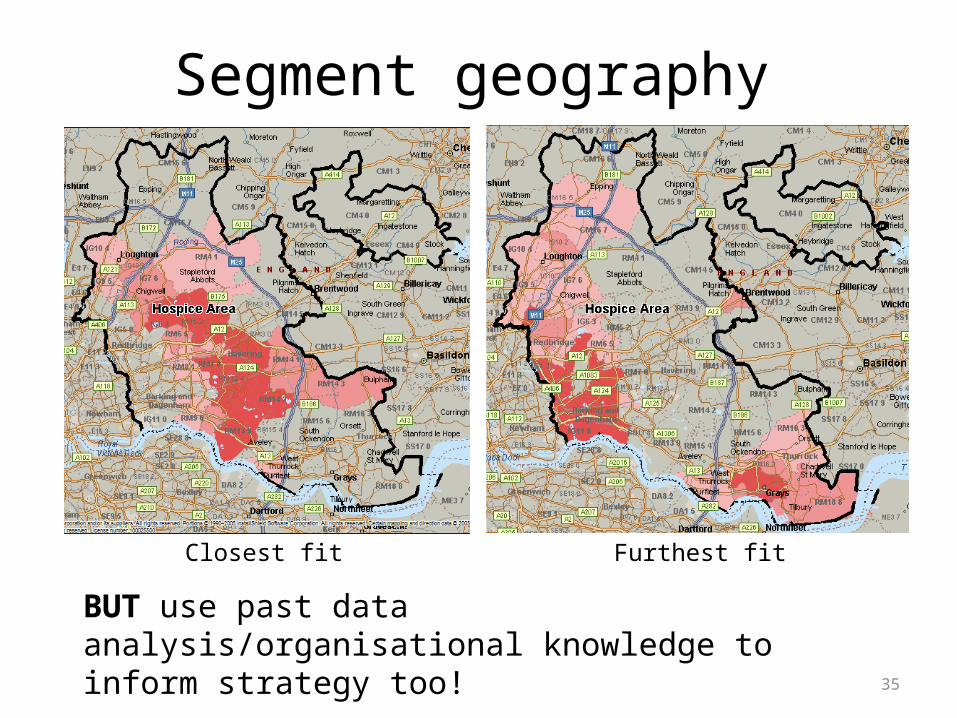
Segment geography
Furthest fit
35
Closest fit
BUT use past data analysis/organisational knowledge to inform strategy too!

36
9. So – Supporter Journeys
First Gift
Became committed
giver
Joined membership
Became committed
giver
Volunteered
Volunteered
Legacy Pledge

37
First engagement = purchase

38
First engagement = committed gift

39
Loyalty ladders
Segment 1
Segment 2Segment 3
Segment 4Segment 5
Segment 6
Segment 7
66714183
2295
2525
53112790
7119
9457
Segment 0
ZerosPotentials
first biters
activists
keen but stuck
7 on sabbatical
7 on holiday
super close

40
Segment shifting
7 0.12 0.47 1.10 1.85 3.25 9.20 11.08 88.74
6 79.48 4.62
5 0.01 87.23 7.16 4.62
4 96.75 3.57 2.27
3 0.27 0.18 0.89 92.88
2 0.42 2.22 93.74 3.97
1 0.01 97.12 4.25 1.24
0 99.18 0.01 0.05
0 1 2 3 4 5 6 7
Probabilities of being present in each segment next month depending on presence this month

41
Insight – snakes and ladders
Segment 1
Segment 2
Segment 3
Segment 4
Segment 5Segment 6
Segment 7
66492213
3111
39763301
35118845
7250
Segment 0
Zeros
Potentialsfirst biters
activists
keen but stuck
7 on sabbatical
7 on holiday
super close

42
10. Be a data evangelistNow you know the power of data, and how it can transform your fundraising.
You have been initiated into the club, and you must be a data …- advocate- believer- defender

43
Recap…
What• Strategy• Silos• People
How• DP• Segmentation• Tools• Integrate
So• Analyse• Journeys• Evangelism

44
Top Ten Tips
1. Get to know your data. What do you have, what do you need?
2. Avoid data silos. What brings it together?3. Data is people. Do what you can to build
relationships, internal and external4. Keep relationships clean & respectful. How
you apply data protection & cleansing is key.5. Know when and how to segment

45
Top Ten Tips
6. Be aware how your data is managed7. Discover how to bring it all together8. So learn from your data – report, analyse,
question – and use it to inform decisions9. So apply data insights to growing your
supporters’ relationships (and their giving)10. So now live it! Go back to the office and be a
data evangelist.

46
ResourcesInstitute of Fundraising Groups:• Insight SIG http://insightsig.org/• Technology SIG http://www.ioftech.org.uk/
LinkedIn for networking and Groups, inc• Purple Patch• UK Fundraising• Institute of Fundraising….and more!
Events• Purple Vision Breakfast Briefings• IoF Insight & IoF Tech conferences

47
Questions?
[email protected]@league.org.uk
Find us on LinkedIn
Follow us on twitter @nfpdawnv @stevethomas393