investor discussion pack - westpac · 3 investor discussion pack – full year 2002 a...
TRANSCRIPT

Investor Discussion Pack
November/December 2002

2 Investor Discussion Pack – Full Year 2002
Index
Summary of 2002 earnings and acquisitions/divestments 3Points of differentiation 10
Strategy 12Customer base 13Low risk – stressed loans, provisioning and capital generation 14Sustainability, staff, customers, community 17
What the market is saying 20Wealth management position and acquisitions 22Wealth management integration 25Housing market 28Offshore exposures 32Tax rate 34Significant items 35Growth outlook 39SME portfolio growth 42
Outlook 45Supplementary information 51
Composition of portfolio 52Credit risk 59Analysis of margins 62Capital 66Earnings reconciliation 68

3 Investor Discussion Pack – Full Year 2002
A transformational year
• Earnings momentum maintained- Record reported earnings of $2,192m up 15%- Underlying cash earnings (before significant items) up 9% - Ongoing cash earnings up 12%- Dividend of 70 cents per share fully franked up 13%- Return on equity maintained above 20%
• Business repositioned for growth- Sold AGC- Acquired Rothschild Australia Asset Management - Acquired BT Financial Group- Acquired Hastings Funds Management
• Quality of earnings significantly improved- Exited higher risk finance company and acquired lower risk wealth management business
further diversifying income streams- Brought significant items to account:
Ú Removed embedded valueÚ Ceased capitalising expenditure for outsourcing of operations Ú High yield debt portfolio written down to fair valueÚ Adopted international accounting standard for superannuation asset
- Improved asset quality, with net impaired assets declining 32%

4 Investor Discussion Pack – Full Year 2002
Reconciliation of ongoing earnings
2%
6%
98
(51)
100
(48)
Add goodwill
Less distributions on other equity instruments
9%1,9012,063Underlying cash earnings
12%1,7491,957Ongoing cash earnings
(106)
2,011
(181)
2,192
2002 % Change2001$m
(30%)(152)Less AGC profit after tax
Large(49)Less individually significant items1
8%1,854Underlying NPAT
15%1,903Reported NPAT
1Individually significant items in 2001 includes embedded value uplift

5 Investor Discussion Pack – Full Year 2002
1,901
129320 28 38 2,063
1,600
1,650
1,700
1,750
1,800
1,850
1,900
1,950
2,000
2,050
2,100
Sep-01 Operatingincome
Expenses Bad & DDs Tax Other Sep-02
$m
Underlying cash earnings up 9%
Sound revenue growth offset by loss of 4 months of AGC
earnings
Expenses 1% lower over the year
Increase due principally to a small number of high
profile defaults
Lower corporate tax rate and offshore losses reduced tax charge
Cash return on ordinary equity 21%

6 Investor Discussion Pack – Full Year 2002
Dividends
• Dividends up 13%
• 5 year CAGR 12% p.a.
• Pay-out ratio on underlying cash earnings increased from 59% to 61%
• Fully franked dividend yield 5.1% approx
• $400m returned to shareholders via buy-back
3943
47
54
62
70
0
10
20
30
40
50
60
70
80
1997 1998 1999 2000 2001 2002
Cents per share

7 Investor Discussion Pack – Full Year 2002
Business unit performance
-100 0 100 200 300 400
Aust other wealth
NZ Funds Mgt
NZ life
Aust Life
Pacific Bank
NZ Retail
Instit. Bank
Aust Funds Mgt
Business Products
Consumer Distr.
Bus. & Reg. Banking
Consumer Products
20012002
8
12
13
15
69
56
63
(50)
(2)
(2)
(20)
(93)
-100 -50 0 50 100
* Ongoing businesses (excludes group items)
Net Profit Contribution to growth
$m $m

8 Investor Discussion Pack – Full Year 2002
Low growth/higher risk business
Rated funds & distribution
Infrastructure expertise
Platform and product capability, funds scale
AGC divestment
Rothschild acquisition
Hastings acquisition
BT Financial Group acquisition
Core strategic rationaleCorporate activity
Rebalanced business mix
• Near-term strategic agenda complete
• Integration and transition of BT and Rothschild creating some near term earnings dilution
• Rebalancing business mix has improved growth path while retaining a ROE above 20%
(0.3%)(1.1%)(2.6%)Earnings impact1,8471,8271,807Post buyback shares1,8721,8521,832Number of shares pre buy-back
(14)(14)(14)Funding of buyback264(8)Total654Hastings7(11)(18)BT
13106RAAMAcquisitions
(56)(51)(68)Net AGC earnings foregone1
(44) (61) (90)Net cash earnings
2003 20052004
1. Includes AGC earnings forgone, earnings on cash proceeds received and earnings on business portfolio re-acquired
Cumulative earnings impact of recent transactions

9 Investor Discussion Pack – Full Year 2002
r-g
Economic profit• Value =
Improving growth trajectory
• Growth rates a critical value determinate
• Underlying profit from the AGC auto and consumer businesses had declined in the two years prior to 2002
• Industry consensus estimates wealth management businesses to grow in the order of 10% - 12%.
Sustainable Growth%
Return on Equity less Cost of equity
The return/growth indifference curve
NPV1
NPV2
Typical P/E1
Growth rate
18-2210%-12%Growth in wealth management businesses
12-14<0%Growth rate in AGC consumer & auto businesses
Strategy based on premise that value is a function of return and growth
1. Typical PEs from comparable companies
Points of differentiation
November/December 2002

11 Investor Discussion Pack – Full Year 2002
Points of differentiation
• Strategy- Focused on core markets of Australia, New Zealand and near Pacific- Customer centric organisational structure- Balanced wealth management position
• Customer franchise- # 1 or # 2 market share in major customer segments in Australia and New Zealand- Customer based skewed to higher value segments
• Low risk - De-risked income streams- Further improvement in asset quality, and sound provisioning coverage- Strong surplus capital generation capacity
• Leader in sustainability- Highly committed workforce- Number 1 Dow Jones Sustainability Index- Number 1 Sydney Morning Herald / The Age Good Reputation Index

12 Investor Discussion Pack – Full Year 2002
A straightforward strategy – well executed
Customer focus
Product innovation
Process /cost efficiency
• Broadening customer relationships
• Wealth management integration
• Driving operational efficiency
• Embedding a high performance culture
• Building strong corporate reputation

13 Investor Discussion Pack – Full Year 2002
Customer base skewed to higher value demographics
Sources1. Reported customer numbers 2. KPMG FIPS NZ 2002, AC Nielson, Greenwich3. Greenwich Associates4. Corporate transactional business – Greenwich Associates5. Greenwich large corporate banking survey (9/01)6. Retail funds under management ASSIRT Sept 20027. Melville Jessup Weaver, Investment Survey, March 2002
2514Corporate
New ZealandAustralia
Wealth management
Business
Consumer
5746
2223
1221
Australian value quintiles1
10
15
20
25
30
First Second Third Fourth Fifth
%
Population distribution
Distribution of Westpac'sAustralian customer base
1Source: Roy Morgan Research : Ranking of Australians by education, income and occupation
Increasing value
Position in core markets
Customer numbersAustralia 6.0mNew Zealand 1.3mOther 0.2mTotal 7.5m

14 Investor Discussion Pack – Full Year 2002
Low risk - stressed loans remain near historic lows
Exposure by credit grade - stressed loans*% of total commitments
0.00%
0.50%
1.00%
1.50%
2.00%
2.50%
3.00%
Sep96
Sep97
Sep98
Sep99
Sep00
Sep01
Sep02
AGC stressed loans
Impaired
90 days past due well secured
Watchlist & substandard
* Includes retail stressed loans
• Net impaired assets down $223m on September 2001
- $95m from 2 large write-offs
- $51m from sale of AGC
• Signs that corporate downgrades and defaults are easing
• Business banking credit quality remains strong
• Quality of mortgage book outstanding
• Expected increase in stressed unsecured consumer loans remains within planned tolerances

15 Investor Discussion Pack – Full Year 2002
Specific provisions / impaired assets (%)
%
20
25
30
35
40
45
50
55
60
FY98 FY99 FY00 FY01 1H02 FY02
WBC ANZ CBA NAB
General provisions / non-housing performing loans (%)
Low risk – sound provisioning cover
1.0
1.2
1.4
1.6
1.8
2.0
2.2
2.4
FY98 FY99 FY00 FY01 1H02 FY02
WBC ANZ CBA NAB

16 Investor Discussion Pack – Full Year 2002
Surplus capital generation continues to be a strength
4.8%
5.8%
2.8%
12.3%
20.1%
% of avg ordinary equity
Delivers 3-4 bps increase in Tier 1 ratio per month489Growth in surplus capital
To fund 8% growth in risk weighted assets (597)Reinvested for growth
DRP participation 23%
Payout ratio 61.3%
Strong cash returns
Comments
289
(1,266)
2,063
10,269
$ million
Clawback through Dividend Reinvestment Plan (DRP)
Dividends paid
Cash earnings
Average ordinary equity

17 Investor Discussion Pack – Full Year 2002
Enhanced sustainability - staff
7%
1%
7%
3%
8%
8%
8%
8%
3%
5%
7%
25%
0% 10% 20% 30%
N/A
87
77
74
73
72
67
65
65
64
62
61
59
30
0 20 40 60 80
Employee Engagement
Working RelationshipsCompetitive Position & Customer Experience
Work Processes/Systems
Leadership
Employee Commitment
Training, Learning & Development
Communication
Organisational Change
Performance
Pay
Morale Index
Community Involvement
Percent above / below Global Financial Services Norm 2002
2002 vs 2001 percent increase over year
Staff perspectives survey 2002
1%
7%
9%
3%
3%
8%
2%
7%
15%
17%
3.4%
0% 10% 20% 30%
N/A
N/A
Westpac Overall 2002 Category Summary
% Favourable Response

18 Investor Discussion Pack – Full Year 2002
Enhanced sustainability - customers
0
5
10
15
20
Mar-99 Sep-02
%
Per
cen
t in
Seg
men
t
Economic Profit
Value Shift
Low HighCustomer Value Segments
-ve +ve
0
5
10
15
WBC ANZ CBA NAB
%
Middle Markets Small Business Markets
Business customer satisfaction-very satisfied customers2
2 Source Greenwich Associates
*average of other major banks
50
55
60
65
70
Sep-00 Dec-00 Mar-01 Jun-01 Sep-01 Dec-01 Mar-02 Jun-02
Westpac Peer average*
% of personal MFI customers very or fairly satisified1
1 Source Roy Morgan Research June 2002

19 Investor Discussion Pack – Full Year 2002
Enhanced sustainability - governance and reputation
Number 1 Sydney Morning Herald / The Age Good Reputation Index 2002
Number 1 bank globally in Dow Jones Sustainability Index 2002/03
First social impact report produced

What the market is saying
November/December 2002

21 Investor Discussion Pack – Full Year 2002
What the market is saying
• What is Westpac’s wealth management strategy and how is value going to be created?
• What are the risks in the wealth management integration?
• What are the risks in the housing cycle?
• What are the significant items?
• Overseas exposures - what is Westpac’s position?
• Why was the 2002 tax rate so low?
• What are the business drivers behind the 2003 outlook?
• SME business, when do we expect a pick-up and what is the quality of new lending?

22 Investor Discussion Pack – Full Year 2002
Wealth management - operating across the value chain
Customers Distribution & Advice
BundlingPlatform
ProductManufacture
InvestmentManagement Back Office
Outsourced partners for funds admin
Centralised servicing centre for wrap
Core Australian equites style
External mangers for International equities, hedge funds, property and fixed interest
Broad product range
Proven servicing capability
Leading wrap and corporate super platforms
700 Westpac planners & advisers
1,000 premier planners
Over 15,000 EFAs
7.5 Million Westpac customers
Access to non-Westpac customers though EFA networks
• Wealth management position now complete with strong capability across the value chain
• Open architecture model provides significant benefits:
- Ensures each element of the chain remains efficient by competing in the market
- Provides optionality in business model, resources can be redirected to elements of the chain generating the greatest value
• Focused on the ‘new’ and growing elements of wealth management without excess baggage of lower growth life insurance business

23 Investor Discussion Pack – Full Year 2002
• Price $900m - net asset value $128m
• EPS positive end 2004
• Retail funds outflow assumed to continue into 2003, turning around by end 2004 - base case
• Price represents 81% of assessed value with all revenue benefits and 25% of cost synergies retained
Wealth management - BT acquisition and value acquired
34%Portfolio services–Wrap & Corp Super
Total
Total
100%
20%
5%
41%
Margin lending and wholesale funds
New Zealand
Retail product and distribution
76% of value attributed to
portfolio services and retail
distribution
Components of value – as at 29 Aug 2002

24 Investor Discussion Pack – Full Year 2002
Wealth management - BT synergies higher than expected
Implementation costs ($m)
43 45 4259 55
81
21
36 6
1110
0
20
40
60
80
100
120Increased revenue contributionCost savings
51
70
FY 2003 FY 2004 FY 2005
Valu
ation
A
ssum
ptio
ns
4648
Pro
gram
T
arget
Valu
ation
A
ssum
ptio
ns
Pro
gram
T
arget
Valu
ation
A
ssum
ptio
ns
Pro
gram
T
arget
65
102
Synergies identified ($m)
• Following nine week design phase, consolidated synergies are now estimated at $102m pa in FY05 with implementation costs of ~$142m
142Total
5Future expense
70Fair Value Adjustment to BT
67Charged in Westpac

25 Investor Discussion Pack – Full Year 2002
Wealth management – controlling integration risks
è Key management team appointed
è Organisational structure confirmed
è Operating model confirmed
è Office location confirmed
è Rapidly implementing integration program
People/ systems
è Review of cost and revenue synergies completed
è Accountability for delivery in placeDelivery on synergies
è BT investment management team not acquired
è Putnam appointed for international equities
è Transfer of BT funds to the rated investment management team
Retail funds outflows
è Dedicated integration team in place
è Internal distribution network is quarantined from integrationDiversion
Mitigating strategies/actions

26 Investor Discussion Pack – Full Year 2002
Q3 ‘02 Q4 ‘02 Q1 ‘03 Q2 ‘03
Management team confirmed
Investment team confirmed
Putnam selected
BT Wrap rollout
Corporate Super rollout
Call centre consolidation
Brand approved
1st Co-Locations
Single customer view
Wealth management – key milestones
56789
101112
Sep 02 Oct 02 Dec 02 Dec 03 Dec 04 Dec-05
$bn
Net retail FUM against model*
Acquisition modelActual
• Funds flow tracking expectations
• Expect funds net outflow until Dec 03, tracking the market in 04 before rising in 05
• Should funds outflow exceed expectations by $1bn this impacts valuation by $40m
* Indicative stock of funds under management assuming 0% investment returns

27 Investor Discussion Pack – Full Year 2002
Wealth management – combined funds under management
Other includes FX, currency, and asset allocation
8.64.41.62.6International equities
3.31.00.12.2Other
11.23.13.05.1Australian equities
2.61.00.61.0International fixed interest
4.00.81.61.6Property
22.8
3.8
6.5
WBC $bn
7.91.92.2Australian fixed interest
47.114.79.6Total FUM
9.52.50.5Cash and liquid assets
Total $bnBT $bn
Rothschild $bnAsset class

28 Investor Discussion Pack – Full Year 2002
Housing market - state of play
• Growth in system housing lending has been strong, increasing over 19% for year to September 2002
• Market growth supported by:
- Increase in investment loans
- Government subsidy for first home owners
- Regearing of the housing sector as Australia has shifted to a lower inflationary environment
• Led to significant house price increases of circa 40% over last two years
• Despite these factors, affordability is not stretched and household debt has not significantly increased as a proportion of household wealth
• System housing volumes expected to ease in the year ahead
0%
5%10%
15%20%
25%
30%35%
40%45%
50%
Sep-71 Sep-75 Sep-79 Sep-83 Sep-87 Sep-91 Sep-95 Sep-99 Sep-03
Repayment burden - % of average w eekly earningsAverage repayment burden post Dec'91
Average repayment burden pre Jun'86
Affordability – repayments as a proportion of average weekly earnings
Household financial liabilities vs assets
15%
20%
25%
30%
35%
40%
45%
50%
1988/89 1990/91 1992/93 1994/95 1996/97 1998/99 2000/01 2002/03
8%
10%
12%
14%
16%
18%
20%
ratio of liabilities to financial assets (lhs)
ratio to liabilities to financial & dwellingassets (rhs)

29 Investor Discussion Pack – Full Year 2002
Composition of housing portfolio
47 51
1923
5
3
0
10
20
30
40
50
60
70
80
2001 2002
$bn
Equity accessloans
Investmenthousing
Owner occupied
Westpac mortgage portfolio
• Housing lending grew 15% (16% including securitised loans)
• Securitised $2.1bn in March 2002
• Portfolio biased to upgrading borrowers not new home owners
• Investment property loans grew more rapidly (19%) over the year, but only represent 29% of portfolio
• Pipeline of applications and approvals points to continuing growth, at least until the first half of the new financial year
• Key statistics
- Average maturity 3.7 yrs
- Average initial loan to value ratio 61%
1.0
1.5
2.0
2.5
3.0
3.5
Oct-01 Dec-01 Feb-02 Apr-02 Jun-02 Aug-02 Oct-02
$bn
Applications Approvals Drawdowns
Westpac monthly volume of housing lending

30 Investor Discussion Pack – Full Year 2002
1.04
0.640.38
0.150.230.250.26
0.0
0.5
1.0
1.5
1996 1997 1998 1999 2000 2001 2002
Housing portfolio quality
• 100% mortgage insurance where Loan to value (LVR) ratio > 80%
• Insurance required for loans > $1.3M and LVR > 70%
• Overall delinquencies continue to decline to record lows
• Over 70% of borrowers paying in excess of scheduled repayments
• Long run losses less than 3 basis points
• More rigorous criteria for potential property hot spots, i.e. CBD apartments
20%
Mortgage portfolio $78bn at 30 Sept 2002
Proportion of portfolio with initial LVR > 80%
80%Westpac Lenders
Mortgage Insurance (Capital base $31m)
A+ insurer
65%
Sub underwritten
20%
AA insurer
AAAinsurer
90 day delinquencies%
Retained35%

31 Investor Discussion Pack – Full Year 2002
Stress testing mortgage portfolio
• Detailed stress testing completed to determine expected losses under more severe economic conditions. Tested separately and jointly for:
- up to a 4 percentage point increase in cash rates;
- 20 per cent decline in housing prices; and
- a 200 basis point increase in the unemployment rate
• Behaviour of the investment portfolio closely tracks that of the owner occupied portfolio
Interest rate % pa 6.5% 8.5% 10.5%
Individual effect $m 0.0 2.2 5.2
Price fall % 0% 10% 20%
Individual effect $m 0.0 6.8 20.3
Unemployment rate 6.3% 7.3% 8.3%
Individual effect $m 0.0 1.6 3.3
Total effect $m 1 0.0 15.5 64.3
Total w rite-offs $m2 6.7 22.2 71.0
Total w rite-offs bps2 0.9 3.1 10.1
1. Individual effects do not sum to the total effect because the impact of each of the individual effects is multiplicative in the model
2. Total write-offs on residential mortgage products should all factors coincide
Maximum additional
expected loss if all economic
factors coincided

32 Investor Discussion Pack – Full Year 2002
Offshore exposures
• Offshore exposures primarily supporting customer relationships in Australia and New Zealand
• Total portfolio 5.5% of committed exposures
• Proportion of total portfolio that is sub investment grade, 0.5%
• Investment grade securities portfolio (value included in committed exposures)
- Face value $1,224m
- Fair value $1,122m
- Shortfall $ 102m
• Portfolio of high yield securities also held US$146m (not included in table opposite)
Offshore committed exposures $bn
206
61
29
26
5
85
Asia
236
13
60
0
3
160
Japan
2,8348031,786AAA to AA-
11,9865,5695,975
639273277BB+ to B+
41591250<B+
4,9612,3342,619A+ to A-
3,1372,0681,043BBB+ to BBB-
TotalEuropeUS

33 Investor Discussion Pack – Full Year 2002
Offshore exposures - investment securities
• Yield adjustments not previously realised given “hold to maturity” intention.
• Move to fair value reflects changed intention to actively manage exposure
• $149m charge is a yield adjustment (reflecting credit spreads) not an expected credit loss
400
600
800
1000
1200
1400
Dec-
98M
ar-9
9Ju
n-99
Sep-
99De
c-99
Mar
-00
Jun-
00Se
p-00
Dec-
00M
ar-0
1Ju
n-01
Sep-
01De
c-01
Mar
-02
Jun-
02Se
p-02
Basis Points
0
5
10
Dec-
98M
ar-9
9Ju
n-99
Sep-
99De
c-99
Mar
-00
Jun-
00Se
p-00
Dec-
00M
ar-0
1Ju
n-01
Sep-
01De
c-01
Mar
-02
Jun-
02
%
S&P sub investment grade credit spread indexMoody’s sub investment grade default rates
History
• Portfolio acquired in 1997 to 1998
• Proposition was that a widely diversified portfolio of BBB and BB rated securities would perform in a predictable manner and generate reliable income to consume US and UK tax losses
• Rise in credit spreads and default rates in 1998 led to decision in 1999 to freeze the portfolio at $US800m and commence a run-down to the current level of $US255m (fair value $US146m)

34 Investor Discussion Pack – Full Year 2002
27%Effective tax rate (%) (including gross up)
139Fully taxable equivalent gross up
44Other non-deductible items(47)Other non-assessable items
(13)Other items-Sale of AGC
(23)Prior period adjustments18Adjustment for overseas tax rates
571Total income tax expense attributable to operating profit
710Total income tax expense (including gross up)
24Tax losses & timing differences now tax effected(127)Rebatable & exempt dividends
(49)Life insurance and funds management impacts
Add (or deduct) permanent diff expressed on a tax effect basis
INCOME TAX EXPENSE
29%Effective tax rate (%) (excluding life company accounting)
744Prima facie income tax on operating profit before income tax (excluding gross up) based on the company tax rate of 30%
2,481Operating profit before income tax (excluding gross up)
2,620Operating profit before income tax (including gross up)(139)
Ongoing Business$ million
Tax reconciliation on ongoing business
Principally offshore losses not tax effected
Increase in rebatabledividends from
structured transactions
Predominately tax recoveries on policy holder investment earnings ($33m)
Includes revaluations and other non
assessable items

35 Investor Discussion Pack – Full Year 2002
Summary of significant items
è
è
è
è
è
è
Adoption of International Accounting Standard - $160m post tax write-downSuperannuation prepayment
Previously capitalised expenses written off -$95m post taxOutsourcing transition expense
Improving risk management
Change portfolio to mark to market $149m post taxHigh yield investment securities
Written off embedded value ($109m post tax) and recognise goodwill on acquisitionsEmbedded value and goodwill
Integration expenses of $60m post taxIntegration expenses (RAAM/BT)
More conservative treatments
Acquisition and divestment
$754m after tax profitAGC sale
• Recognition of significant items driven by
- Major repositioning of the company
- Strong ongoing earnings
- Improving transparency of earnings and better alignment to analyst conventions
- Adoption of International Accounting Standards due 2005

36 Investor Discussion Pack – Full Year 2002
Significant items - wealth management financial impact
• Move to accrual accounting for wealth management business• Consequences
- Eliminates embedded value in Westpac Financial Services Group (WFSG)- Recreates deferred acquisition costs- Moves RAAM from Life Company to WFSG at 30 September creating goodwill asset of
$330 m- BT goodwill estimate From purchase price $772
Transaction Costs $30Integration Expenses $49
$851
Accounting rules require three approaches: Before tax $m
30
2
9
19
RAAM
142Total
5Uncertain future expenses – expense as incurred
70Expense incurred in target entity – fair value adjustment (increase in goodwill)
67Expenses incurred in acquiring entity – charge when known
BT

37 Investor Discussion Pack – Full Year 2002
Significant items - superannuation prepayment
• Superannuation fund surplus brought to account in 1991 and treated as a prepayment of superannuation expense. Decided to adopt International Accounting Standard (IAS19) given redundancy of current standard (UK standard SSAP24) and Australia's move to IAS in 2005
• Surplus utilised to meet payments to both defined benefit and defined contribution sections of the fund
• Access closed to defined benefit plans in the late 1990’s. Current membership:
- Defined benefit 11,434 - Defined contribution 13,176
• Superannuation expense in 2001 - $20m, in 2002 -$75m. Estimated expense of $92m in 2003
Differences in accounting policies
1,88
7
1,21
4
673
1,84
7
1,32
8
519
0
500
1,000
1,500
2,000
Value of Assets Value ofLiabilities
Value of Surplus
SSAP 24
IAS 19
Staff Super Fund Value at 1 October 2001 $m
Variations within 10 percent corridor amortised over life of membership
Variations amortised over average life of membership
Changes in value recognised
Actuarially assessed using long-term bond rate (lower rate)
Actuarially assessed using discount rate equivalent to projected funds earningsValue of liabilities
Market Value assessed each yearActuarially assessed on a three year cycleValue of assets
IAS 19SSAP 24

38 Investor Discussion Pack – Full Year 2002
Matched with underlying products in wealth business$86Deferred Acquisition Costs1
Includes debt issue costs, mortgage broker costs etc.$162Other deferred expenditure
Software development costs capitalised and amortisedover three years, but no greater than five. In line with likely IAS standard. None currently over 3 years
$232Software
PolicyBalance at 30.09.2002Nature $m
Significant items - outsourcing transition expenses
• Reviewed all categories of deferred expenditure and decided to change the policy to write-down $136m ($95m after tax) covering all outsourcing transition expenses relating to technology and telecommunications, the mortgage processing centre and other outsourced operations
• Decision improves clarity of contract costs in future operating expenses. If change had not been implemented, previously deferred expenses would otherwise have been charged-off as follows:
- 2003 $37
- 2004 $37
- 2005 $24
• Other categories of deferred expenditure in the accounts are:
1 Relates to Funds Management, excludes life business

39 Investor Discussion Pack – Full Year 2002
Assumptions underlying growth outlook
• Credit growth in the 8% to 10% range
• At least maintain market share momentum across core products
• Expense to income trending lower against re-based costs
• No material change in strong asset quality
• Net retail funds inflow to stabilise vs. market in 2004
• Return to more ‘normal’ financial markets performance
Australian credit growth
-8
-4
0
4
8
12
16
20
24
Jan-90 Jan-92 Jan-94 Jan-96 Jan-98 Jan-00 Jan-02
% ann
personal housing business
forecast

40 Investor Discussion Pack – Full Year 2002
0.0
1.0
2.0
3.0
4.0
5.0
May-02 Jun-02 Sep-02 Sep-03 Sep-04
Actual re-acquisitionof business book
Initial planned rate ofre-acquisition
• Between Jan 02 and May 02 Westpac re-acquired $1.1bn of AGC business receivables
• Sold $4.1bn to AGC May 02
• $2.2bn re-acquired by end Sept 02
• No capital implications due to business finance indemnity
Forecast
Based on the current run-rate we expect over $4.0bn of the book will be re-acquired by Sept 03, ahead of our planned schedule
Growth outlook - re-acquisition of AGC business portfolio

41 Investor Discussion Pack – Full Year 2002
Growth outlook – expense analysis
• Efficiency momentum expected to be maintained in 2003
• Higher cost to income base of 53.6% following AGC sale and wealth management acquisitions, including BT
• Banking cost to income ratio1 50% (down from 52% in 2001)
• Given reduction in cost base in 2002, headline cost growth expected to be marginally higher in 2003 at around 4%
• Increase driven by:
- Higher NZ dollar- Restructuring expenses associated with
NZ performance improvement program- Increase in superannuation expenses- Variable compensation in institutional
banking returning to normal
• Offsetting cost increases is the pipeline ofinitiatives already in place
92
5
4
832002
127119112Outsourcing
777777Organisational simplification
857662Other programs
289
2005
272
2004
251Annual savings
2003Initiative $m
Cost to income ratio
30
35
40
45
50
55
60
1H99
2H99
1H00
2H00
1H01
2H01
1H02
2H02
2002
FY*
AGC Impact
%
Pipeline of efficiency initiatives
* 2002FY represents the full year ratio adjusted for BT and Hastings acquisitions.
1. The Banking cost to income ratio includes Westpac’s Australian Business and Consumer banking, Institutional banking and New Zealand and Pacific Island banking operations.

42 Investor Discussion Pack – Full Year 2002
Small and medium enterprise (SME) portfolio growth
• Small and medium businesses are in excellent shape, with strong cash reserves and modest gearing
• In 2003, expected pick-up in business lending driven by capacity constraints from solid consumer demand
• Business intention surveys expect increased investment in 2002/03, a portion of which is expected to be funded from borrowings
• Credit to businesses has shown recent improvement with growth expected to rise from 4% to between 6% to 8% in 2003
• Westpac well positioned in sector having improved its position as the preferred business bank
19
12
19
1314
16 16
13
02468
101214161820
NAB WBC CBA ANZ
1999 2001
Small business bank chosen if switching tomorrow
Source: Greenwich Associates
Capital expenditure and forward estimates
-60
-40
-20
0
20
40
60
1999/00 2000/01 2001/02 2002/03
% %
mining manufacturing other ex trans transport
3rd est for 2002/03
%

43 Investor Discussion Pack – Full Year 2002
• Total portfolio exposure $33bn*
• In growing the portfolio, Westpac has maintained its credit standards, with the overall quality of the book improving
• Most growth expected from existing customers.
• Business acquired from other financial institutions subject to rigorous review and higher approval authorities
• No signs of any systemic credit problems
Business banking* portfolio quality
Impaired assets to total committed exposure%
1.91
1.28
0.63
1.471.53
0.0
0.5
1.0
1.5
2.0
2.5
1998 1999 2000 2001 2002
90 day delinquencies
2.07
0.270.37
1.80
1.01
0.51
0.71
0.0
0.5
1.0
1.5
2.0
2.5
1996 1997 1998 1999 2000 2001 2002
* Australian Business Banking portfolio
%

44 Investor Discussion Pack – Full Year 2002
Financial markets earnings
0
50
100
150
200
250
300
350
400
450
500
1997 1998 1999 2000 2001 2002
$m
Institutional banking performance
• Disappointing performance from institutional banking with profit falling 25%
• Results impacted by:
- Write down and charges against investment securities portfolio
- Bad debts associated with a small number of high profile defaults
- Poor financial markets trading
• Trading performance consistent with expected volatility
• Detailed performance enhancement program now commenced
• Expect financial markets earnings to return to more ‘normal’ levels in 2003

Outlook
November/December 2002
46 Investor Discussion Pack – Full Year 2002
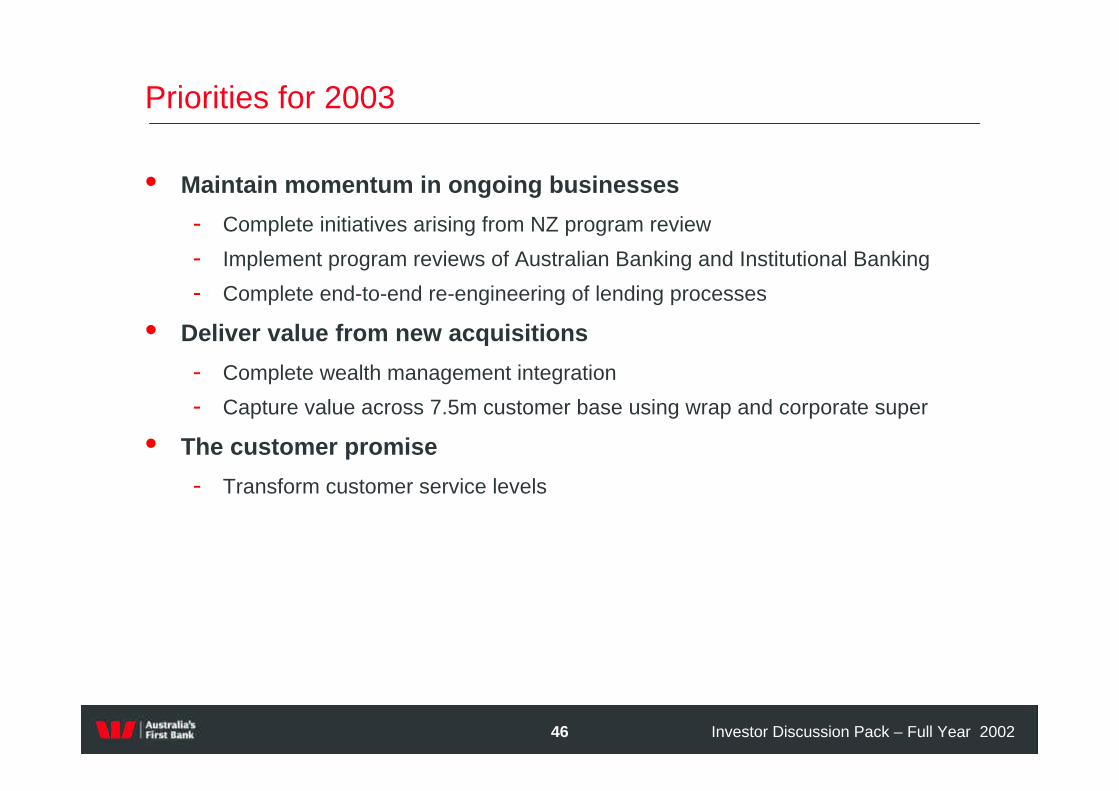
Priorities for 2003
• Maintain momentum in ongoing businesses
- Complete initiatives arising from NZ program review
- Implement program reviews of Australian Banking and Institutional Banking
- Complete end-to-end re-engineering of lending processes
• Deliver value from new acquisitions
- Complete wealth management integration
- Capture value across 7.5m customer base using wrap and corporate super
• The customer promise
- Transform customer service levels

47 Investor Discussion Pack – Full Year 2002
Economic environment
• Australian economy in good shape
• GDP growth in 3.0% to 3.5% range
• Housing to slow; business investment and exports up
• Unemployment falling into the 6% to 6.5% range
• Underlying inflation back in 2% - 3% range
• Rise in official rates not expected near term
2.9%2.2%2.8%CPI
6.5%
3.3%
2002/03f
Unemployment rate
GDP
2003/04f2001/02
6.4%6.7%
3.8%3.8%
Key economic indicators
-4
-2
0
2
4
6
8
Dec-86 Jun-89 Dec-91 Jun-94 Dec-96 Jun-99 Dec-01
% ann
-4
-2
0
2
4
6
8% ann
GDP Private final demand

48 Investor Discussion Pack – Full Year 2002
Where are the risks?
Risk Probability of occurrence
• Australian economy stalls Low
• Irrational competition Low
• New entrants Low
• Re-regulation Medium / low
• Acquisition risk Very low
• New wave of corporate collapses Low

49 Investor Discussion Pack – Full Year 2002
Regulatory issues
• Credit card reform
- Reforms released by Reserve Bank of Australia 27 Aug 02
- Affects interchange fees, ends restrictions on cost recovery by merchants and removes restrictions on new entrants
- Interchange reforms apply from October 03
- Assuming average reduction of 40 bps in interchange fees from 2004
• EFTPOS reform
- RBA currently reviewing submissions
- Westpac expected to be a net beneficiary
• Expected earnings impact
- Full year impact approximately $30-40m p.a (post tax) from 2004

50 Investor Discussion Pack – Full Year 2002
• Core businesses continuing to deliver
• Transformed the business underpinning medium term growth trajectory
• Lower risk and higher quality earnings
2003Earnings Expectations
7% – 9%Cash EPS expectations
(2%)Dilution of recent transactions
9%-11%Core business EPS growth
Summary and earnings expectations

Supplementary Information
November/December 2002

52 Investor Discussion Pack – Full Year 2002
* % of Total Exposure - 30 September 2002
19% 18% 19% 20%
14% 12% 9%
14%13% 13% 13%
17% 18% 19% 17%
9%
1%1.3%1.5%1.2%
0%
20%
40%
60%
80%
1H 01 FY 01 1H 02 FY 02AAA to AA- A+ to A- BBB+ to BBB- BB+ to B+ <B+
Composition of portfolio - % of total committed facilities
• Other consumer includes credit cards, personal lending and margin lending
• Mortgages represent 36% of total commitments and 55% of funded lending
• 70% business / corporate portfolio exceeding investment grade
66% 63% 61% 60%
30% 32% 34% 36%
4%5%5%4%
0%
20%
40%
60%
80%
100%
1H 01 FY 01 1H 02 FY 02
Business / Institutional Consumer Mortgages Other Consumer
Portfolio by customer segment*
Corporate/Business portfolio*

53 Investor Discussion Pack – Full Year 2002
% Group Total Committed Exposure
Industry exposure – 1996 to 2002
0 1 2 3 4 5 6 7
2002
1996
PropertySubstantial non-bank financiers
GovernmentDurable products manufacturing
Other agriculture & servicesRetailing
Electricity, gas & waterGrain, sheep & poultry
Business technical servicesHotels & restaurants
Petroleum refining & chemicalsForestry, printing & paper products
Non residential constructionMetal mining & services
WholesalingInsurance
Hospitals & health servicesTransport, equipment & services
Transport & storageRecreation services
Food manufactureTelecommunications
Motor vehicle tradeResidential construction
Other manufacturing

54 Investor Discussion Pack – Full Year 2002
1. As at 30 September 2002
2. Includes mortgages for housing, investment property loans, equity access loans and margin lending.
3. Credit cards and personal loans.
Total exposure by booking office1
Remaining offshore sub investment grade exposures
represents 0.5% of TCE.
7,41900009376,482Unsecured consumer3
217,3902362065,5705,97434,025171,380
80,187000012,35267,835Secured consumer2
2,2561361912505181,324<B+
37,26060292732776,08030,542BB+ to B+
27,2930262,0681,0434,77219,385BBB+ to BBB-
20,643352,3342,6192,70412,978A+ to A-
42,331160858031,7866,66332,833AAA to AA-
GroupJapanAsia ex JapanEuropeAmericasNZ /
PacificAustralia

55 Investor Discussion Pack – Full Year 2002
* Exposure $m - September 2002.0 200 400 600 800 1,000
A
BBB+
A
A-
A
A
A
A
AA-
AAA
Top 10 exposures to corporations and NBFIs
S&P rating or equivalent
Single name exposure concentrations
0.0%
0.5%
1.0%
1.5%
2.0%
2.5%
3.0%
3.5%
1998 2000 2002
Top 10 exposures as a % of total committed exposure

56 Investor Discussion Pack – Full Year 2002
Telco and energy exposures
157
1,359
0200400600800
1,0001,2001,4001,600
1,516
AAA to BBB+
BBB to BBB-
BB+ to BB-
>BB-
$m
9%6%
65%
20%
Australia (100%Investment grade)
Asia (100%Investment grade)
Europe (54%Investment Grade)
Nth America (0%Investment grade)
34080
1,060
1,980
0500
1,0001,5002,0002,5003,0003,5004,000
3,460
AAA to BBB+
BBB to BBB-
BB+ to BB
BB-
>BB-
$m
73%
4%
23% Australia (91%Investment grade)
Asia (53%Investment grade)
Nth America (83%Investment grade)
Global energy portfolio
Telco exposure
4.09.65.5ANZ2.010.92.7NAB0.73.51.5WBC
Total non investment grade
EnergyTelco$bnExposure to telco and energy sectors*
*Source: Merrill Lynch

57 Investor Discussion Pack – Full Year 2002
Institutional banking portfolio quality
Impaired assets to total WIB committed exposure
%
0.14
0.530.63
0.290.37
0.25
0.34
0.00.10.20.30.40.50.60.7
1996 1997 1998 1999 2000 2001 2002
• Increase in impaired assets since 2000 due to small number of high profile defaults
• Decline in impaired assets in 2002 related to write-down in two major impaired assets of $95m
Probability of default
0.13
0.250.29
0.15
0.29
0.19
0.21
0.00.10.10.20.20.30.30.4
1996 1997 1998 1999 2000 2001 2002
%

58 Investor Discussion Pack – Full Year 2002
Consumer unsecured portfolio
• Strong growth in portfolio led to increase in bad debts
• Planned pick-up in delinquencies in line with credit scoring adjustments
• Modest increase in bad debts in 2002
90 day delinquencies
1.07
1.98
0.96 1.140.9
0.630.82
0.0
0.5
1.0
1.5
2.0
2.5
1996 1997 1998 1999 2000 2001 2002
Including AGC Excluding AGC
Bad debt charge as a per cent of outstandings
207
250270
290
231
186
100
150
200
250
300
2000 2001 2002Including AGC Excluding AGC
Basis point
%

59 Investor Discussion Pack – Full Year 2002
Impaired assets – reconciliation of balance
696
902
461
12151427
0
200
400
600
800
1,000
1,200
1,400
GrossImpairedSept 2001
NewImpaired
AGC Sale Written off Other GrossImpairedSept 2002
‘Other’ includes loans returning to performing, and security realised

60 Investor Discussion Pack – Full Year 2002
0
5
10
15
20
25
30
35
40
45
50
1995 1996 1997 1998 1999 2000 2001 2002
bps
Bad debts within long-run averages
Total bad & doubtful debt charge to average loans and acceptances
Expected long-run average 25-35 bps

61 Investor Discussion Pack – Full Year 2002
Total provisions to total impaired assets
%
62
88
137
183 188
233249
177
211
0
50
100
150
200
250
300
1994 1995 1996 1997 1998 1999 2000 2001 2002
%
General provision to non-housing performing loans & acceptances
2.52.4
2.22.0
1.8 1.8 1.7
0
1
2
3
1996 1997 1998 1999 2000 2001 2002
Provisioning coverage

62 Investor Discussion Pack – Full Year 2002
Analysis of margin dynamics
* Full year impact of 2002 items
Note: Bill acceptances equal average increase in interest bearing assets
2.80153,1244,2853.11Group
0.6523,8251541.03Other overseas
3.2626,3728613.28New Zealand
2.75118,7663,2703.08Australia reported
-9,338--Bill acceptances
2.99109,4283,2703.08Australia (excl bills)
MarginAverage Balance $m
Net Interest Income $mMargin
2002
3.032.993.053.11Normalised margin
2001
2.802.702.903.11Reported margin
0.05
0.18
2002
0.09
0.20
H2 2002
-
0.15
H1 2002
-
-
2001
0.16Impact of AGC sale
0.20Impact of bill acceptance funding
2003*

63 Investor Discussion Pack – Full Year 2002
0
200,000
400,000
600,000
800,000
1,000,000
1,200,000
1,400,000
1,600,000
Sep
-00
Dec-00
Mar-01
Jun
-01
Sep
-01
Dec-01
Mar-02
Jun
-02
Sep
-02
Australia New Zealand
On-line Banking
0
20,000
40,000
60,000
80,000
100,000
120,000
Sep
-00
Dec-00
Mar-01
Jun
-01
Sep
-01
Dec-01
Mar-02
Jun
-02
Sep
-02On-line Broking - Australia
1,680,000*# 1 in online usage 119,000*
* 30 September 2002
Online growth

64 Investor Discussion Pack – Full Year 2002
Executive compensation
• Retained and reshaped long-term incentives
- All long-term incentives hurdled and eligibility reduced
- Hurdles tightened (no vesting at <50th percentile)
- Moving from 100% options to - 50% performance options, 50% performance share rights
• Cost of equity based compensation in 2002 $48m (pre tax)
• Will expense options when Australian accounting standard in place (expensed in US GAAP in 2002)

65 Investor Discussion Pack – Full Year 2002
Wealth management business
Large282(11)1Other – one-off items (Australia)
61%3353Total life insurance
11%97108Total funds management
91%(12)(23)Other – business as usual (Australia)
89%917Life insurance and risk (New Zealand)
50%2436Life insurance and risk (Australia)
(13%)146127Total wealth management
17%118138Total before one-off items
14%92105Funds management (Australia)
(40%)53Funds management (New Zealand)
% Change20012002NPAT $ million
1 2002 write-down of Hartleys ($16m) and sale of properties Investa $5m2 2001 sale property trust $28m

66 Investor Discussion Pack – Full Year 2002
5.8
6.4 6.5
5.3
5.86.0
4.8
5.7 5.7*
6.16.3
4.9
6.86.7
3.5
4.5
5.5
6.5
7.5
TOE / RAA Tier 1 ratio ACE Ratio
1H01 2H01 1H02 2H02 After BT
%
Capital levels comfortable
* Prior to change in APRA deductions

67 Investor Discussion Pack – Full Year 2002
1,434Closing balance
37Net new provisions
1,397Sub total
(95)Write-off of two major impaired assets
(165)Sold with AGC
1,657Opening balance
Reconciliation of provisioning
Reconciliation of provisioning
Provisioning Balance Movements from 31 March 2002

68 Investor Discussion Pack – Full Year 2002
Full year earnings reconciliation
1 Includes 8 months of AGC profit
$mReported
results
Individually significant
items
Underlying Business
AGC1Ongoing business
Reported results
Accounting change
Underlying Business
AGCOngoing business
Interest income(incl.gross up) 9,359 - 9,359 713 8,646 10,407 - 10,407 1,105 9,302 Interest expense (5,074) - (5,074) (397) (4,677) (6,207) - (6,207) (615) (5,592)Net interest income (incl. gross up) 4,285 - 4,285 316 3,969 4,200 - 4,200 490 3,710 Total non-interest income 2,978 460 2,518 49 2,469 2,537 63 2,474 59 2,415 Net operating income(incl. gross up) 7,263 460 6,803 365 6,438 6,737 63 6,674 549 6,125 Operating expenses - - Salaries and other staff expenses (1,829) (221) (1,608) (39) (1,569) (1,744) - (1,744) (59) (1,685) Equipment and occupancy (589) - (589) (18) (571) (648) - (648) (33) (615) Other expenses (1,477) (222) (1,255) (37) (1,218) (1,080) - (1,080) (51) (1,029)Total operating expenses (excl amortisation of goodwill)
(3,895) (443) (3,452) (94) (3,358) (3,472) - (3,472) (143) (3,329)
Core earnings 0 271 -271 3,265 3,265 406 2,859 Amortisation of goodwill (100) - (100) - (100) (98) - (98) - (98)Operating profit before bad & doubtful debts (incl gross up)
3,268 17 3,251 271 2,980 3,167 63 3,104 406 2,698
Bad and doubtful debts (461) - (461) (101) (360) (433) - (433) (158) (275)Profit from ordinary activities before income tax (incl. gross up)
2,807 17 2790 170 2620 2,734 63 2,671 248 2,423
Fully tax equivalent gross up (139) (139) - (139) (149) - (149) - (149)Profit before income tax 2,668 17 2,651 170 2,481 2,585 63 2,522 248 2,274 Income tax expense (471) 164 (635) (64) (571) (677) (14) (663) (96) (567)Net profit attributable to outside equity interests
(5) - (5) - (5) (5) - (5) - (5)
Net profit attributable to equity holders
2,192 181 2,011 106 1,905 1,903 49 1,854 152 1,702
Net profit attributable to equity 2,192 181 2,011 106 1,905 1,903 49 1,854 152 1,702 Goodwill 100 - 100 - 100 98 - 98 - 98 Distributions on other equity instruments
(48) - (48) - (48) (51) - (51) - (51)
Cash earnings 2,244 181 2,063 106 1,957 1,950 49 1,901 152 1,749
Cash earnings (cents) per ordinary share
123.8 113.9 108.0 108.3 105.6 97.1
twelve months to: twelve months to:30 Sept. 2002 30 Sept. 2001

69 Investor Discussion Pack – Full Year 2002
Half-on-half earnings reconciliation
$mReported
results
Individually significant
items
Underlying business
AGCOngoing
businessReported
resultsAccounting
changeUnderlying
businessAGC
Ongoing business
Interest income (incl. gross up) 4,688 - 4,688 178 4,510 4,671 - 4,671 535 4,136Interest expense (2,563) - (2,563) (105) (2,458) (2,511) - (2,511) (292) (2,219)Net interest income (incl. gross up) 2,125 - 2,125 73 2,052 2,160 - 2,160 243 1,917Total non-interest income 1,616 400 1,216 12 1,204 1,362 60 1,302 37 1,265Net operating income (incl. gross up) 3,741 400 3,341 85 3,256 3,522 60 3,462 280 3,182Operating expenses
Salaries and other staff expenses (1,006) (221) (785) (10) (775) (823) - (823) (29) (794)Equipment and occupancy expenses (298) - (298) (5) (293) (291) - (291) (13) (278)Other expenses (852) (222) (630) (10) (620) (625) - (625) (27) (598)
Operating expenses (excl goodw ill) (2,156) (443) (1,713) (25) (1,688) (1,739) - (1,739) (69) (1,670)Amortisation of goodw ill (51) - (51) - (51) (49) - (49) 0 (49)Operating profit before bad debts 1,534 (43) 1,577 60 1,517 1,734 60 1,674 211 1,463Bad and doubtful debts (190) - (190) (31) (159) (271) - (271) (70) (201)
Profit from ordinary activities before income tax (incl. gross up)
1,344 (43) 1,387 29 1,358 1,463 60 1,403 141 1,262
Fully tax equivalent gross up (72) - (72) - (72) (67) 0 (67) - (67)Profit before income tax 1,272 (43) 1,315 29 1,286 1,396 60 1,336 141 1,195Income tax expense (95) 178 (273) (16) (257) (376) (14) (362) (48) (314)Net profit attributable to outside equity (3) - (3) - (3) (2) - (2) - (2)Net profit 1,174 135 1,039 13 1,026 1,018 46 972 93 879Net profit attributable to equity holders 1,174 135 1,039 13 1,026 1,018 46 972 93 879Goodw ill 51 - 51 - 51 49 - 49 - 49Distributions on other equity (23) - (23) - (23) (25) - (25) - (25)Cash earnings 1,202 1,067 13 1,054 1,042 996 93 903Cash earnings (cents) per share 66 59 58 58 55 50
31 March 200230 Sept. 2002

70 Investor Discussion Pack – Full Year 2002
Disclaimer
The material contained in this presentation is intended to be general background information on Westpac Banking Corporation and its activities as at 12 November 2002.
The information is supplied in summary form and is therefore not necessarily complete. Also, it is not intended that it be relied upon as advice to investors or potential investors, who should consider seeking independent professional advice depending upon their specific investment objectives, financial situation or particular needs.