investment strategy quarterly
TRANSCRIPT
V O L U M E 1 0 / / I S S U E 1 / / J A N U A R Y 2 0 1 8
Investment Strategy Quarterly is intended to communicate current economic and capital market information along with the informed perspectives of our investment professionals. You may contact your financial advisor to discuss the content of this publication in the context of your own unique circumstances. Published 1/2/2018. Material prepared by Raymond James as a resource for its financial advisors.
PAGE 2 INVESTMENT STRATEGY COMMITTEE MEETING RECAP
PAGE 29 ECONOMIC SNAPSHOT
PAGE 30 STRATEGIC ASSET ALLOCATION MODELS
PAGE 31 TACTICAL ASSET ALLOCATION OUTLOOK
PAGE 32 ALTERNATIVE INVESTMENTS SNAPSHOT
PAGE 33 SECTOR SNAPSHOT
2018 Themes PAGE 6 Economic Outlook PAGE 8 U.S. Equity Outlook PAGE 12
International Outlook PAGE 16 Fixed Income Outlook PAGE 20
Energy Outlook PAGE 23 Asset Allocation Outlook PAGE 26
2
INVESTMENT STRATEGY QUARTERLY
U.S. ECONOMY – Scott J. Brown, Ph.D., Chief Economist, Equity Research
The majority of the committee is neutral (3.0%) to
somewhat positive (3.1-3.4%) on real U.S. GDP growth
over the next 6-12 months. The majority also expect
inflation to trend higher.
• “The tax bill is not expected to add much to GDP growth over the next ten years, but late additions to the final bill should add a little to growth in 2018.”
• “A tight job market and slow labor force growth will be binding constraints for economic growth, but we could see rising wages lead to a more efficient use of labor over time.”
• “The leadership transition at the Fed should be smooth, but the monetary policy outlook is more clouded beyond the middle of the year, just as the risks of a policy error start to mount; personnel changes are expected to lead to a lighter regulatory outlook.”
• “The pace of interest rate increases is going to be gradual and data dependent. Base case, we may get two rate increas-es for 2018; it could be more, it could be less, depending on what the data tell us.”
U.S. EQUITY
94% of the committee is neutral to bullish on U.S. equities
over the next six to twelve months.
• “The bigger story last year was the limited amount of down-side, and 2017 is right up there with 1995 as the year with the lowest drawdown. We’ve gone about 400 calendar days now without a 3% dip in the S&P 500 on a closing basis. That’s an all-time record so we are literally in unprecedented territory.”
• “Next year is going to be more volatile, and we’re going to see more downside than this year. That’s about the only guarantee I can give.”
– Andrew Adams, CFA, CMT, Senior Research Asso-ciate, Equity Research
• “Our bullish tone remains intact, given the normal pullbacks that are likely to develop at some point. The general markets remain strong with firm pillars of support in place.”
• “If you look at the pillars of support, and if you back that up with technical support, you can’t come up with any case where this market is going to roll over any time soon.”
– Michael Gibbs, Managing Director, Equity Portfolio & Technical Strategy
INTERNATIONAL EQUITY – Chris Bailey, European Strategist, Raymond James Euro Equities*
Roughly 90% of the committee is bullish to some degree
on non-U.S. developed market equities while around 80%
are bullish on emerging market equities.
• “When I look at 2018, it’s actually all about reform and change: tax reform, labor market reform, and economic change.”
• “Brexit will occur, but it’s going to happen over a longer peri-od. It is going to be a bit better than some of the still general pessimism about the UK economy out there at the moment.”
• “France’s Macron has exceeded expectations thus far. Be it tax changes, progress on labor market changes, or even getting the bakers to bake their bread seven days a week and not six, there’s lots of decent progress there.”
• “The ECB is going to remain loose. They are where the Fed was three or four years ago. In 2018, they will do slightly less quantitative easing, but it’s not going away.”
• “Number one on my list of bigger geopolitical concerns would be a world trade blow up, emanating from a strong dollar, leading to China and the States falling out. Then it would be something silly from North Korea. I think China has got them under its thumb, but obviously North Korea is a rogue state and it’s hard to do that. Number three would be the Middle East. I’m not so concerned about that versus the former two.”
U.S. FIXED INCOME
Relative to current rates, the majority of the committee
don’t see interest rates (10-year Treasury yield) rising
significantly higher over the next year.
• “The curve is telling you something. It’s telling you investors are not scared. Financial conditions, more broadly mea-sured—forget just global interest rates—are as loose as
INVESTMENT STRATEGY COMMITTEE RECAP – MEETING HELD ON DECEMBER 6, 2017
Major macro factors affecting the economy and financial markets over the next six to twelve months include tax reform, U.S. earnings growth, economic growth, Federal Reserve policy, and geopolitical uncertainty.
3
JANUARY 2018
they’ve been since 2008. This is not a tight market. And that absolutely has major effects on risk asset allocation. Central banks have modified corporate behavior and they’ve modified investor behavior. And to suggest otherwise, I think, is wrong.”
• “The high yield markets are not a hedged equity risk, they are an equity risk at this point. When I look at our portfo-lios, we typically have a very high negative correlation to risk assets. With credit spreads where they are, I don’t think a “balanced model” using high yield or other yield vehicles in credit is going to hedge against a drawdown in equities.”
– James Camp, CFA, Managing Director of Fixed Income, Eagle Asset Management*
• “In 2017, we had very little volatility in the bond market. The 10-year Treasury had a low yield of 2.05% and a high yield of 2.62% (57 basis points). That is the lowest volatility in the 10-year since 1965 when the yield fluctuated from a low of 4.17% to a high of 4.67% (50 basis points).”
• “Global interest rate disparity continues to be a tailwind for bond prices. The German 10-year bund is currently at 0.415%, the Japanese 10-year is currently at 0.039% and the Swiss 10-year is currently at -0.187%. These are three of
*An affiliate of Raymond James & Associates, Inc. and Raymond James Financial Services, Inc.
many examples that could be used. This should continue to push money to U.S. debt benefiting Treasury bonds.”
– Nick Goetze, Managing Director, Fixed Income Services
ENERGY AND OIL – Pavel Molchanov, Senior Vice Presi-dent, Energy Analyst, Equity Research
Looking to 2018 and longer term, we project that oil prices
will average in the $60s. Though still far from the $100+ highs
seen in the first half of this decade oil in the $60s should
support a sustainable level of industry wide investment.
• “Our main near-term geopolitical concern would be Vene-zuela. If Venezuela were to have a full-scale governmental and societal collapse, that’s 1.5% of global oil supply that would be at immediate risk. And a lot of those barrels go directly to U.S. refineries. A second concern is Libya. Due to the continued militant activity, there is a meaningful chance that oil shipments may be disrupted.”
• “In the last 12 months, Saudi Arabia has actively collabo-rated as part of the OPEC oil production restraint coalition, notably working with its traditional adversary Russia. They have managed to work together on a common economic agenda which is raising oil prices, and they have largely succeeded in doing so.”
Each quarter, the committee members complete a detailed survey sharing their views on the investment environment, and their responses are the basis for a discussion of key themes and investment implications.
INVESTMENT STRATEGY COMMITTEE MEMBERS
Andrew Adams, CFA, CMT, Senior Research Associate, Equity Research
Chris Bailey European Strategist, Raymond James Euro Equities*
Jennifer Bottalico, CFP®, CAIA®, Managing Director, Head of Product Solutions & Services (Alex. Brown)
Scott J. Brown, Ph.D. Chief Economist, Equity Research
Robert Burns, CFA, AIF® Vice President, Asset Management Services
James Camp, CFA Managing Director of Fixed Income, Eagle Asset Management*
Doug Drabik Senior Strategist, Fixed Income
J. Michael Gibbs Managing Director of Equity Portfolio & Technical Strategy
Nick Goetze Managing Director, Fixed Income Services
Peter Greenberger, CFA, CFP® Director, Mutual Fund & 529 Plan Product Management
Nicholas Lacy, CFA Chief Portfolio Strategist, Asset Management Services
Pavel Molchanov Senior Vice President, Energy Analyst, Equity Research
Kevin Pate, CAIA Vice President, Asset Management Services
Paul Puryear Director, Real Estate Research
Ted Ruddock Head of High Net Worth, Fixed Income Services
Jeffrey Saut Chief Investment Strategist, Equity Research
Scott Stolz, CFP® Senior Vice President, PCG Investment Products
Jennifer Suden, CFA, CAIA Director of Alternative Investments Research
Tom Thornton, CFA, CIPM Vice President, Asset Management Services
Anne B. Platt, AWMA®, AIF® – Committee Chair Vice President, Investment Strategy & Product Positioning, Wealth, Retirement & Portfolio Solutions
Kristin Byrnes – Committee Vice-Chair Senior Manager, Wealth, Retirement & Portfolio Solutions
4
INVESTMENT STRATEGY QUARTERLY
HOUSING – Paul Puryear, Director of Real Estate Research, Equity Research
The consumer wants to buy houses but there is an
inventory shortage. We’re at a 35-year low in for sale,
existing, and new home inventory.
• “We need more houses. Tax reform isn’t going to affect the big picture for housing. We don’t need any more apartments, but we do need single family homes. We have inflation in building real estate.”
• “The consumer is having trouble because his income isn’t growing as fast as the cost to build his house.”
• “Demand is always stronger as you go down in price and as you move down price point, the percentage of renters is going up. We just can’t get owner-occupied housing to lower income, middle income America.”
All expressions of opinion reflect the judgment of Raymond James & Associates, Inc., and are subject to change. There is no assurance any of the trends mentioned will continue or that any of the forecasts mentioned will occur. Economic and market conditions are subject to change. Investing involves risk including the possible loss of capital. International investing involves additional risks such as currency fluctuations, differing financial accounting standards, and possible political and economic instability. These risks are greater in emerging markets. Small and mid-cap securities generally involve greater risks. Past performance may not be indicative of future results. Asset allocation and diversification do not guarantee a profit nor protect against loss. Companies engaged in business related to a specific sector are subject to fierce competition and their products and services may be subject to rapid obsolescence. Changes in tax laws or regulations may occur at any time and could substantially impact your situation. You should discuss any tax or legal matters with the appropriate professional.
INVESTMENT STRATEGY COMMITTEE MEETING RECAP (CONT.)
ALTERNATIVE INVESTMENTS – Jennifer Suden, CFA, CAIA, Director of Alternative Investments Research, PCG Investment Products
The industry is at a record level in terms of assets.
Alternative investments are now at $3.2 trillion after an
additional $50 billion in alternative allocations last quarter.
• “What we saw industry wide last quarter was an outflow from long/short equity strategies, with the reason being the reduction of equity market exposure. I think what you’re beginning to see is investors getting a little bit skittish. And on the other side, we saw large inflows to global macro and managed futures strategies. Again, supporting this trend of expected increases in market volatility.”
• “Within Raymond James, we have seen strong flows to our newly launched activist strategy. Activist strategies gener-ally are idiosyncratic, with the fund managers maintaining highly concentrated positions in order to effectuate change at the particular company. Activist strategies can be hos-tile in nature, and those tend to be the type you see in the headlines, but this particular manager employs a friendly activist methodology to enhance shareholder value.”
0%
10%
20%
30%
40%
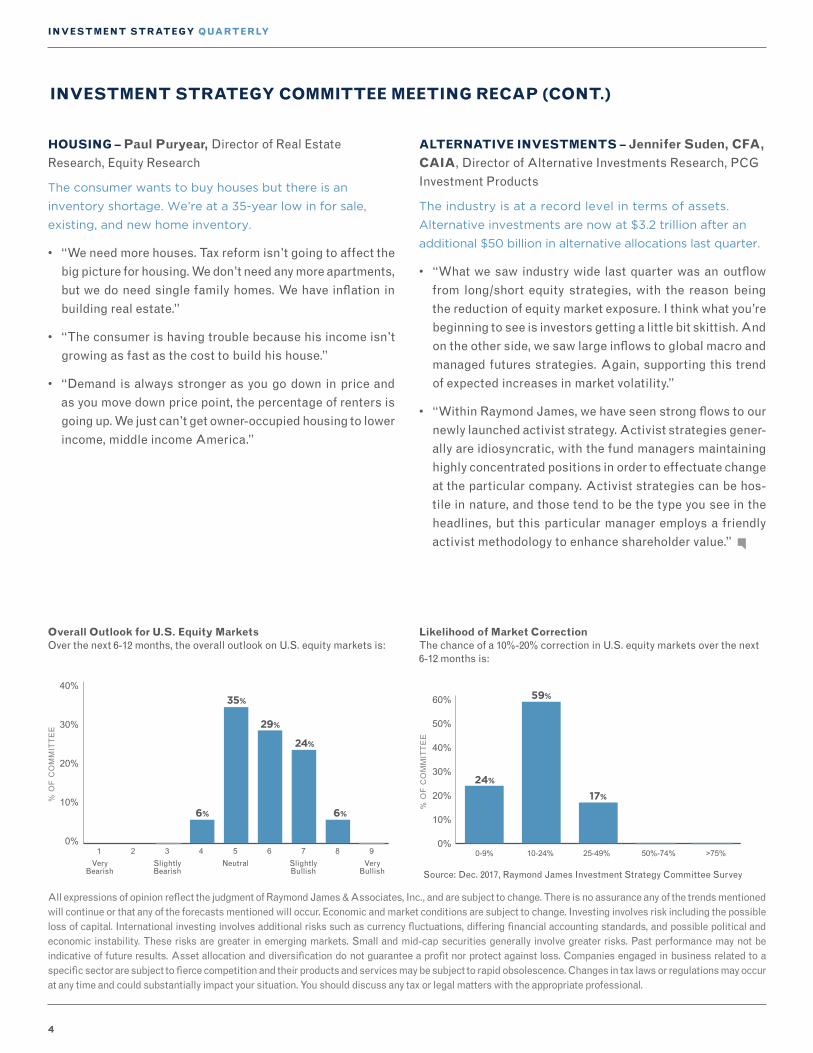
6%
VeryBearish
Neutral
1 2 3 4 5 6 7 8 9SlightlyBearish
SlightlyBullish
VeryBullish
35%
6%
24%
29%
% O
F C
OM
MIT
TEE
Source: Dec. 2017, Raymond James Investment Strategy Committee Survey
Overall Outlook for U.S. Equity MarketsOver the next 6-12 months, the overall outlook on U.S. equity markets is:
0-9% >75%10-24% 25-49% 50%-74%0%
10%
20%
30%
40%
50%
60%
24%
59%
17%
% O
F C
OM
MIT
TEE
Likelihood of Market CorrectionThe chance of a 10%-20% correction in U.S. equity markets over the next 6-12 months is:
5
JANUARY 2018
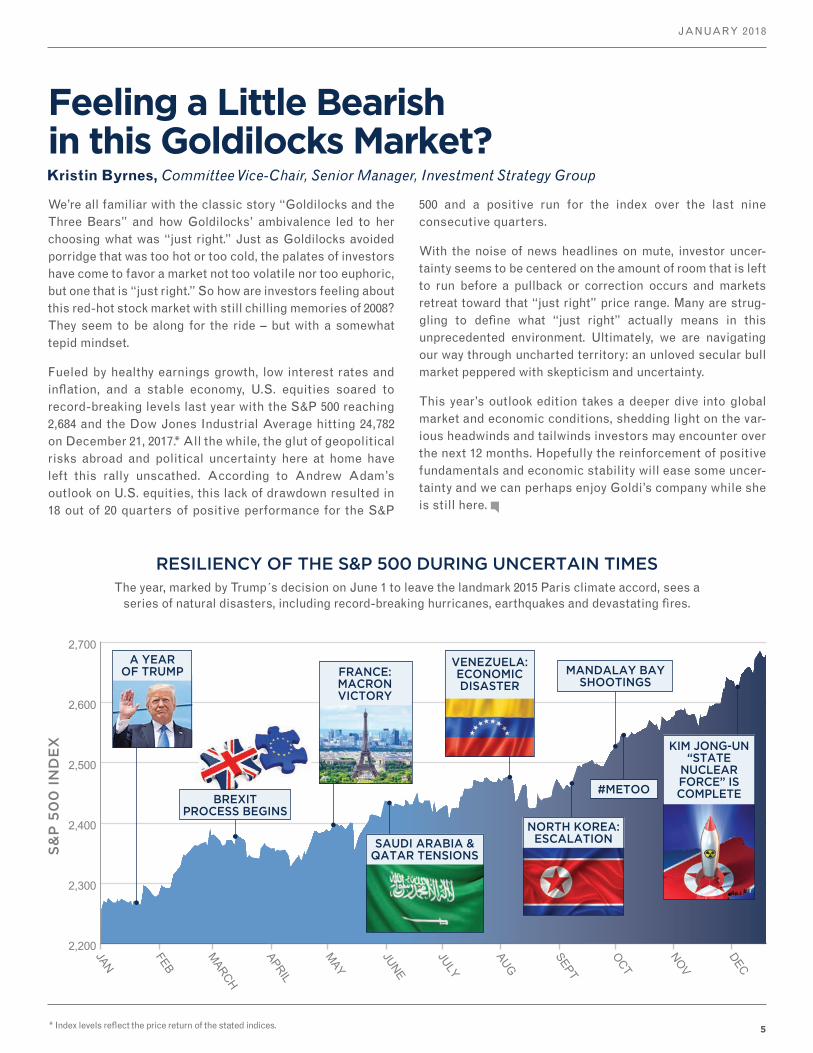
Feeling a Little Bearish in this Goldilocks Market?
We’re all familiar with the classic story “Goldilocks and the Three Bears” and how Goldilocks’ ambivalence led to her choosing what was “just right.” Just as Goldilocks avoided porridge that was too hot or too cold, the palates of investors have come to favor a market not too volatile nor too euphoric, but one that is “just right.” So how are investors feeling about this red-hot stock market with still chilling memories of 2008? They seem to be along for the ride – but with a somewhat tepid mindset.
Fueled by healthy earnings growth, low interest rates and inflation, and a stable economy, U.S. equities soared to record-breaking levels last year with the S&P 500 reaching 2,684 and the Dow Jones Industrial Average hitting 24,782 on December 21, 2017.* All the while, the glut of geopolitical risks abroad and political uncertainty here at home have left this rally unscathed. According to Andrew Adam’s outlook on U.S. equities, this lack of drawdown resulted in 18 out of 20 quarters of positive performance for the S&P
Kristin Byrnes, Committee Vice-Chair, Senior Manager, Investment Strategy Group
500 and a positive run for the index over the last nine consecutive quarters.
With the noise of news headlines on mute, investor uncer-tainty seems to be centered on the amount of room that is left to run before a pullback or correction occurs and markets retreat toward that “just right” price range. Many are strug-gling to define what “just right” actually means in this unprecedented environment. Ultimately, we are navigating our way through uncharted territory: an unloved secular bull market peppered with skepticism and uncertainty.
This year’s outlook edition takes a deeper dive into global market and economic conditions, shedding light on the var-ious headwinds and tailwinds investors may encounter over the next 12 months. Hopefully the reinforcement of positive fundamentals and economic stability will ease some uncer-tainty and we can perhaps enjoy Goldi’s company while she is still here.
RESILIENCY OF THE S&P 500 DURING UNCERTAIN TIMESThe year, marked by Trump´s decision on June 1 to leave the landmark 2015 Paris climate accord, sees a
series of natural disasters, including record-breaking hurricanes, earthquakes and devastating fires.
2,200
2,300
2,400
2,500
2,600
2,700
JAN
S&
P 5
00
IN
DE
X
FEB
MARCH
APRIL
MAY
JUNE
JULY
AUG
SEPT
OCT
NOV
DEC
BREXIT PROCESS BEGINS
A YEAR OF TRUMP MANDALAY BAY
SHOOTINGSFRANCE: MACRON VICTORY
VENEZUELA: ECONOMIC DISASTER
SAUDI ARABIA & QATAR TENSIONS
NORTH KOREA: ESCALATION
#METOO
KIM JONG-UN “STATE
NUCLEAR FORCE” IS COMPLETE
* Index levels reflect the price return of the stated indices.

6
INVESTMENT STRATEGY QUARTERLY
2018 Themes to Watch The following key themes are likely to occupy headlines and client conversations in the coming year.
Change always matters in financial markets, and the simple question for international inves-tors in 2018 is, “How much faith do you have in countries and companies outside the U.S.?” The good news is that valuations are generally lower and, in many cases, corporate earnings levels are growing more quickly than in the U.S. The missing ingredient is a belief that Brexit compromises between the UK and the European Union can be reached, and reform initia-tives to boost economies in Asia and Europe have credibility, political drive and support.
The signs heading into 2018 on this front are positive, building on progress made in 2017. Such progress includes the well-received National People’s Congress in China as well as Macron’s election victory and actions thus far in France. Still, much work needs to be done. If further progress is made, a likely impact would be a stronger British pound, euro and Japanese yen relative to the U.S. dollar, enhancing the potential diversification ben-efits for U.S. investors.
INTERNATIONAL INVESTING
It’s hard not to conclude that the key geopolitical relationship is between the United States and China (“G2”). The latter continues to spread its wings. This is best shown by its expansive “Belt and Road” initiative, which aims to link Europe and China in a giant economic region, as well as a continuation of its large trade surplus with the United States. The ‘free versus fair trade’ debate continues to rumble on, but, given the proclivity of both Chinese and Japanese investors to buy Treasury bonds, pushing too hard may have more significant consequences. A plausible compromise may be found via a lower dollar, which would take the competitive edge off of the surplus countries and reduce the need to aggressively renegotiate other trade deals (such as NAFTA), potentially benefiting global economic and market confidence. With Europe looking inward and the Middle East/Russia more focused on keeping oil prices firm, North Korea becomes the remaining significant geopolitical issue for 2018. Considerable Chinese economic influence on the ‘Hermit Kingdom’ adds another dimension to G2 interactions.
The investment industry is constantly evolving as technological advancements create potentially faster, cheaper and more accessible methods to participate in the global financial markets. The near instantaneous transmission of information has created new trading patterns. Packaged products for individual investors have proliferated in a market that was previously dominated by institutions that traded far fewer investments. Hand-written stock orders have been replaced with high-frequency trading programs, and intricate retirement income solutions have largely supplanted individual bonds. These advancements have infused additional complexity into today’s markets. The modern investor is faced with more choices and information than ever before. Fortunately, finan-cial planning applications have been developed to navigate this intricate investing environment and enhance professional advisement, enabling investors to more easily work toward their long-term financial objectives.
THE MODERN INVESTOR
GEOPOLITICS
7
JANUARY 2018
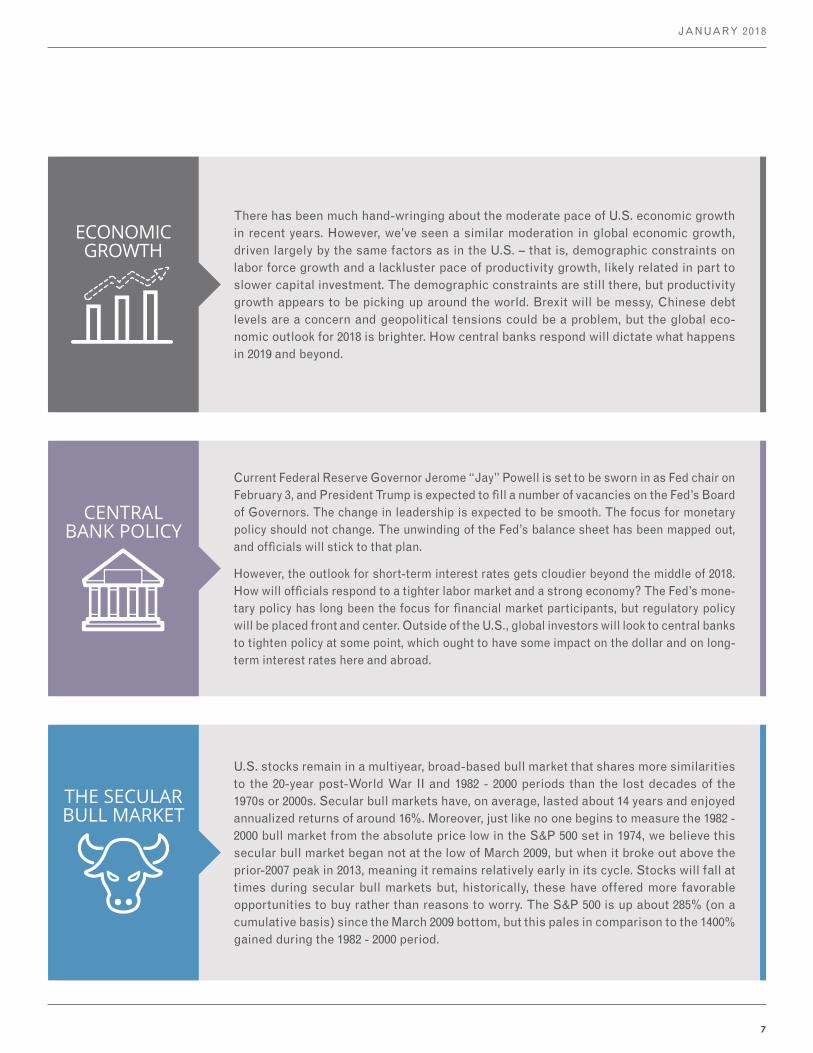
There has been much hand-wringing about the moderate pace of U.S. economic growth in recent years. However, we’ve seen a similar moderation in global economic growth, driven largely by the same factors as in the U.S. – that is, demographic constraints on labor force growth and a lackluster pace of productivity growth, likely related in part to slower capital investment. The demographic constraints are still there, but productivity growth appears to be picking up around the world. Brexit will be messy, Chinese debt levels are a concern and geopolitical tensions could be a problem, but the global eco-nomic outlook for 2018 is brighter. How central banks respond will dictate what happens in 2019 and beyond.
ECONOMIC GROWTH
Current Federal Reserve Governor Jerome “Jay” Powell is set to be sworn in as Fed chair on February 3, and President Trump is expected to fill a number of vacancies on the Fed’s Board of Governors. The change in leadership is expected to be smooth. The focus for monetary policy should not change. The unwinding of the Fed’s balance sheet has been mapped out, and officials will stick to that plan.
However, the outlook for short-term interest rates gets cloudier beyond the middle of 2018. How will officials respond to a tighter labor market and a strong economy? The Fed’s mone-tary policy has long been the focus for financial market participants, but regulatory policy will be placed front and center. Outside of the U.S., global investors will look to central banks to tighten policy at some point, which ought to have some impact on the dollar and on long-term interest rates here and abroad.
CENTRAL BANK POLICY
THE SECULAR BULL MARKET
U.S. stocks remain in a multiyear, broad-based bull market that shares more similarities to the 20-year post-World War II and 1982 - 2000 periods than the lost decades of the 1970s or 2000s. Secular bull markets have, on average, lasted about 14 years and enjoyed annualized returns of around 16%. Moreover, just like no one begins to measure the 1982 - 2000 bull market from the absolute price low in the S&P 500 set in 1974, we believe this secular bull market began not at the low of March 2009, but when it broke out above the prior-2007 peak in 2013, meaning it remains relatively early in its cycle. Stocks will fall at times during secular bull markets but, historically, these have offered more favorable opportunities to buy rather than reasons to worry. The S&P 500 is up about 285% (on a cumulative basis) since the March 2009 bottom, but this pales in comparison to the 1400% gained during the 1982 - 2000 period.
8
INVESTMENT STRATEGY QUARTERLY
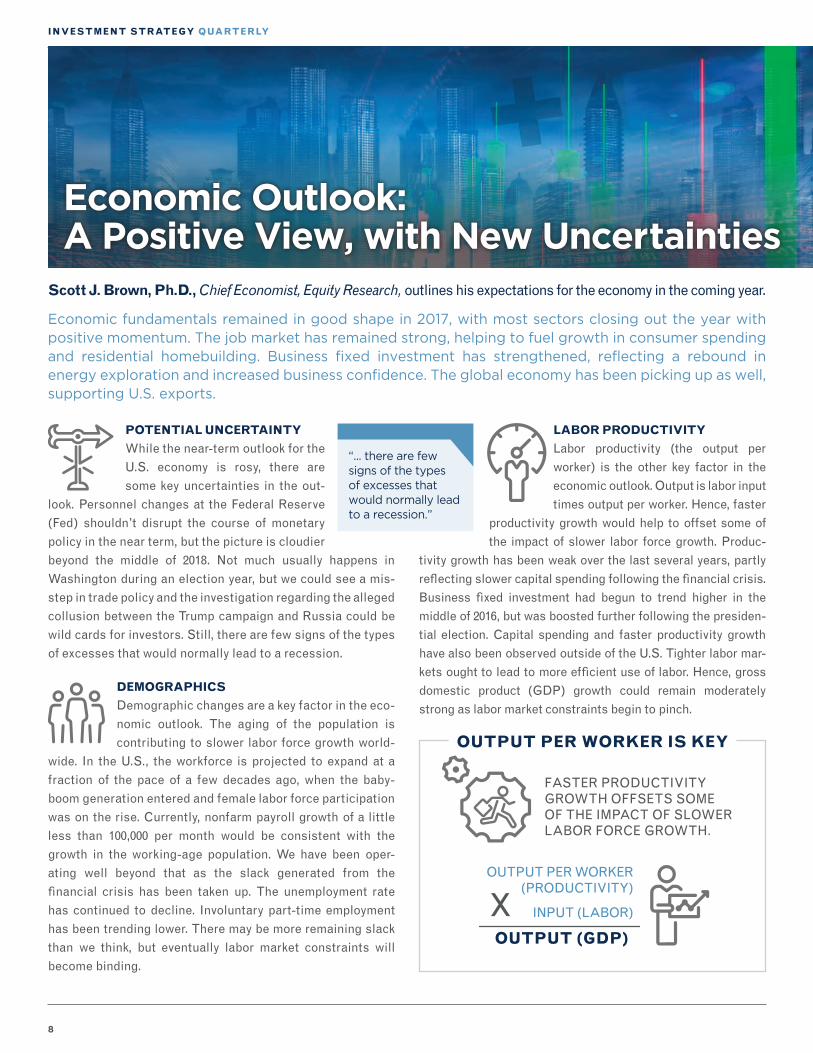
POTENTIAL UNCERTAINTY
While the near-term outlook for the U.S. economy is rosy, there are some key uncertainties in the out-
look. Personnel changes at the Federal Reserve (Fed) shouldn’t disrupt the course of monetary policy in the near term, but the picture is cloudier beyond the middle of 2018. Not much usually happens in Washington during an election year, but we could see a mis-step in trade policy and the investigation regarding the alleged collusion between the Trump campaign and Russia could be wild cards for investors. Still, there are few signs of the types of excesses that would normally lead to a recession.
DEMOGRAPHICS
Demographic changes are a key factor in the eco-nomic outlook. The aging of the population is contributing to slower labor force growth world-
wide. In the U.S., the workforce is projected to expand at a fraction of the pace of a few decades ago, when the baby-boom generation entered and female labor force participation was on the rise. Currently, nonfarm payroll growth of a little less than 100,000 per month would be consistent with the growth in the working-age population. We have been oper-ating well beyond that as the slack generated from the financial crisis has been taken up. The unemployment rate has continued to decline. Involuntary part-time employment has been trending lower. There may be more remaining slack than we think, but eventually labor market constraints will become binding.
LABOR PRODUCTIVITY
Labor productivity (the output per worker) is the other key factor in the economic outlook. Output is labor input times output per worker. Hence, faster
productivity growth would help to offset some of the impact of slower labor force growth. Produc-
tivity growth has been weak over the last several years, partly reflecting slower capital spending following the financial crisis. Business fixed investment had begun to trend higher in the middle of 2016, but was boosted further following the presiden-tial election. Capital spending and faster productivity growth have also been observed outside of the U.S. Tighter labor mar-kets ought to lead to more efficient use of labor. Hence, gross domestic product (GDP) growth could remain moderately strong as labor market constraints begin to pinch.
Scott J. Brown, Ph.D., Chief Economist, Equity Research, outlines his expectations for the economy in the coming year.
Economic fundamentals remained in good shape in 2017, with most sectors closing out the year with positive momentum. The job market has remained strong, helping to fuel growth in consumer spending and residential homebuilding. Business fixed investment has strengthened, reflecting a rebound in energy exploration and increased business confidence. The global economy has been picking up as well, supporting U.S. exports.
Economic Outlook:A Positive View, with New Uncertainties
OUTPUT PER WORKER IS KEY
OUTPUT (GDP)
INPUT (LABOR)
OUTPUT PER WORKER (PRODUCTIVITY)
X
FASTER PRODUCTIVITY GROWTH OFFSETS SOME OF THE IMPACT OF SLOWER LABOR FORCE GROWTH.
“... there are few signs of the types of excesses that would normally lead to a recession.”

9
JANUARY 2018
CONSUMER SPENDING
Consumer spending accounts for nearly 70% of GDP. Job and wage growth have been supportive, but average inflation-adjusted wage growth has
been lackluster. That largely reflects an increase in gasoline prices over the last year. In addition, higher rents and health-care costs have restrained household budgets. Motor vehicle sales, fueled by replacement needs and easy credit, were a steady contributor to the recovery from the financial crisis. The pace began to soften in 2017, interrupted by massive inventory clearance in the fall. Thus, vehicle sales appear unlikely to add much to growth in 2018, and may subtract a little. As electric vehicles take a larger share of the vehicle market, consumers may delay purchases.
HOUSING
Following the collapse of the housing bubble, no one should have expected a rapid recovery. It would take a long time to work out the excesses.
Monthly figures on construction and home sales are choppy, but the underlying trends continued to improve in 2017. Still, con-straints continued at the low end of the market. Elevated building costs and a scarcity of skilled labor remained supply constraints, while higher home prices hurt affordability. Demographic changes and high levels of student debt should continue to limit the pace of household formation.
BUSINESS FIXED INVESTMENT
Business fixed investment picked up in 2017. Energy exploration, which is capital intensive, collapsed in 2015, subtracting from business
fixed investment and overall GDP growth. The Fed’s measure of oil and gas well drilling fell 75% from late 2014 to mid-2016. Mining structures, which include capital expenditures in energy exploration, accounted for 36% of the growth in business fixed
investment in the first three quarters of 2017. Hurricanes dis-rupted activity to some extent in September and October, but the pace of improvement is likely to slow at some point in 2018. Outside of energy, capital investment has been supported by improved business sentiment. Some of the improvement over the last year may have been in anticipation of lower corporate tax rates or reduced regulation. Firms have generally been flush with cash and borrowing costs have been low in recent years, but firms have been somewhat reluctant to spend on capital equipment.
MONETARY POLICY
Monetary policymakers will likely face a challenging environment in 2018. Economic growth is good, but the Fed may have to con-
tend with the risk of higher inflation as labor market constraints become binding. Personnel changes should not be disruptive to the near-term policy track. Short-term interest rate increases should remain gradual and data-de-pendent. However, the outlook is more uncertain beyond the middle of next year. Financial market participants have tradi-tionally focused on monetary policy, but changes in the regulation of the financial system will likely overshadow what happens to short-term rates.
Jerome “Jay” Powell, the incoming Fed chair, is a lawyer, not an economist, but that shouldn’t be a problem. He has significant experience in the financial sector and regulatory policy. He will be able to rely on the Fed’s staff for advice. However, monetary policy is a group effort, and President Trump is expected to fill a number of vacant slots on the Fed’s Board of Governors. In addition, New York Fed President William Dudley has indicated that he will leave by the middle of the year, a consideration since the New York Fed president is a permanent voting member of the Federal Open Market Committee.
Economic Outlook:A Positive View, with New Uncertainties
10
INVESTMENT STRATEGY QUARTERLY
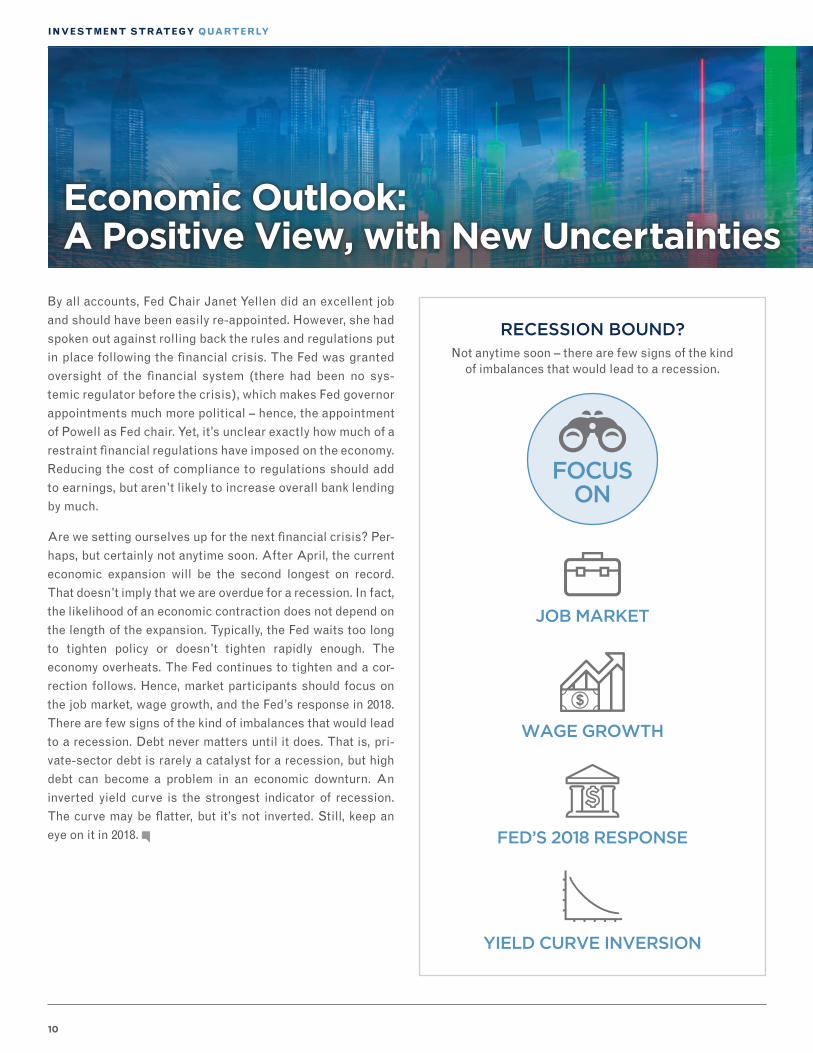
By all accounts, Fed Chair Janet Yellen did an excellent job and should have been easily re-appointed. However, she had spoken out against rolling back the rules and regulations put in place following the financial crisis. The Fed was granted oversight of the financial system (there had been no sys-temic regulator before the crisis), which makes Fed governor appointments much more political – hence, the appointment of Powell as Fed chair. Yet, it’s unclear exactly how much of a restraint financial regulations have imposed on the economy. Reducing the cost of compliance to regulations should add to earnings, but aren’t likely to increase overall bank lending by much.
Are we setting ourselves up for the next financial crisis? Per-haps, but certainly not anytime soon. After April, the current economic expansion will be the second longest on record. That doesn’t imply that we are overdue for a recession. In fact, the likelihood of an economic contraction does not depend on the length of the expansion. Typically, the Fed waits too long to tighten policy or doesn’t tighten rapidly enough. The economy overheats. The Fed continues to tighten and a cor-rection follows. Hence, market participants should focus on the job market, wage growth, and the Fed’s response in 2018. There are few signs of the kind of imbalances that would lead to a recession. Debt never matters until it does. That is, pri-vate-sector debt is rarely a catalyst for a recession, but high debt can become a problem in an economic downturn. An inverted yield curve is the strongest indicator of recession. The curve may be flatter, but it’s not inverted. Still, keep an eye on it in 2018.
Economic Outlook:A Positive View, with New Uncertainties
RECESSION BOUND?Not anytime soon – there are few signs of the kind
of imbalances that would lead to a recession.
FOCUS ON
WAGE GROWTH
JOB MARKET
FED’S 2018 RESPONSE
YIELD CURVE INVERSION

11
JANUARY 2018
KEY TAKEAWAYS:
• Key uncertainties in the economic outlook include the monetary policy impact of personnel changes at the Federal Reserve, a misstep in trade policy, and the outcome of the investigation regarding the alleged collusion between the Trump campaign and Russia.
• With regards to the Fed, financial market participants have traditionally focused on monetary policy, but changes in the regulation of the financial system may overshadow what happens to short-term rates.
• Market participants should focus on the job market, wage growth, and the Fed’s monetary policy response in 2018. There are few signs of the kind of imbalances that would lead to a recession.
Economic Outlook:A Positive View, with New Uncertainties
FED DELAYS TIGHTENING ECONOMY OVERHEATS FED CONTINUES TIGHTENING & CORRECTION ENSUES
ECONOMIC CONTRACTIONThe likelihood of an economic contraction doesn’t depend on the length of the expansion. Typically:
12
INVESTMENT STRATEGY QUARTERLY
A REVIEW OF 2017
First and foremost, the secular bull market is clearly alive
and well. The S&P 500 has risen in 18 out of the last 20
quarters, including nine straight since late 2015. And
while 2017 was a very good year in terms of total return in
the U.S. stock market, the bigger story was the complete
lack of downside, with some measures of volatility hitting
their lowest levels in history. In early November, the S&P
500 set a new record by going 371 consecutive calendar
days without a 3% dip from a previous high, a streak that
has reached 412 days at the time of this writing on 12/21.
What’s more, the index only had seven sessions where it
gained or lost more than 1% on a closing basis and never
once did it gain or lose more than 2% (as of 12/21/17). The
biggest driver of last year’s performance was growth in
corporate earnings, supporting our view that we’ve
entered an “earnings-driven” stage of the secular bull
market rather than one chiefly dependent on low interest
rates and stimulus from the Federal Reserve. At the same
time, the U.S. and global economies showed clear
improvement in 2017, making it difficult to bet against
world equity markets. The good news is that these under-
lying trends remain largely in place as we head into 2018,
though we do believe it may be tougher going forward to
maintain the same pace of growth considering both earn-
ings and economic data will now have higher bars to clear
after the improvement shown last year.
The somewhat arbitrary change of the calendar shouldn’t alter the underlying forward-looking expectations for the stock market – or provide much new insight into future winners and losers. Yet, the arrival of another year does provide a fine excuse to pause and reflect on current conditions and examine the themes that investors should monitor as they gaze ahead. Since it’s difficult to look forward without knowing the direction you’ve come, let’s turn our attention to the past before proceeding to what may be ahead.
U.S. Equity Outlook: Staying Calm in the Face of the Bull
Andrew Adams, CFA, CMT, Senior Research Associate, Equity Research, shares themes for 2018 as investors may find some disruption amid the continued bull market.
LOOKING BACK: 2017 EQUITY RECORD-BREAKERS
S&P 500
S&P 500 HAS RISEN IN
18 OUT OF THE LAST20 QUARTERS
THE DOW
THE DOW CLOSED AT
NEW HIGHS AS OF 12/21/1770
ALL THE WAY UP
THE DOW
THE DOW HAD
86 RECORD HIGHS SINCE THE PRESIDENTIAL ELECTION.
TAX REFORM?
While we do expect earnings and the economy to maintain
their strength into 2018, the much-discussed tax reform bill
continues to be a huge wild card with respect to how much
better earnings and the economy can get. It’s likely that the
current 2018 consensus analyst estimate for S&P 500 bottom-
13
JANUARY 2018
U.S. Equity Outlook: Staying Calm in the Face of the Bull
up operating earnings per share of $145
does not fully reflect possible tax reform,
because analysts have only recently learned
what the specifics of the new tax laws will
be. We could now see earnings estimates
jump as analysts revise their models for the
changes. However, it’s unclear how much
anticipated tax reform has already been
priced into the market, which increases the
uncertainty of what the eventual impact will be on individual
stock prices. The combination of uncertainty regarding the mar-
ket’s reaction to a completed tax bill and the fact that it’s been a
while since the major averages experi-
enced much downside at all have us
treading with some caution as we head
into 2018. We don’t advise adopting a “set
it and forget it” approach or throwing all
caution to the wind, but neither do we see
signs at this point that lead us to believe a
significant correction or recession is
imminent. We stand firm in our belief that
this remains a secular bull market and any early year weak-
ness would offer the first real buying opportunity since right
before the 2016 U.S. presidential election.
GOING FORWARD
If we’re correct that U.S. stocks remain in a secular bull
market and that the global economy is in a growth phase,
what has worked up to this point should remain the focus for
most investors. We still prefer the more cyclical areas of the
market over the more defensive, and continue to warn against
overexposure to interest rate-sensitive sectors. Technology
was the clear market leader in 2017, and it’s tough to imagine
a scenario where the secular bull market continues and tech-
nology companies don’t at least keep pace with the S&P 500,
given their proven ability to grow earnings. Financials should
stand to benefit, too, with an environment characterized by a
growing economy, less regulation, and possibly higher
interest rates. Sectors we favor include Industrials, Mate-
rials, Consumer Discretionary, and Energy, and we remain
interested in Health Care – despite some possible volatility if
Washington turns its gaze back to reforming the Affordable
Care Act. Large companies outperformed small and mid-cap
companies in 2017, but we think there’s a good chance we see
smaller stocks do better in 2018 considering they should
benefit from an environment of lower taxes and a growing
economy. The weakening U.S. dollar also helped large,
“The combination of uncertainty regarding the market’s reaction to a completed tax bill and the fact that it’s been a while since the major averages experienced much downside at all have us treading with some caution as we head into 2018.”
S&P 500 ONLY HAD
7SESSIONS GAINING OR LOSING MORE THAN
AT CLOSE1%
S&P 500NEVER GAINED OR LOST MORE THAN 2% AS OF
12/21/17
AS OF DECEMBER, S&P 500 HAD GONE
412CONSECUTIVE CALENDAR DAYS WITHOUT A
DIP FROM A PREVIOUS HIGH3%
1% 2% 3%
“We stand firm in our belief that this remains a secular bull market and any early year weakness would offer the first real buying opportunity since right before the 2016 U.S. presidential election.”
14
INVESTMENT STRATEGY QUARTERLY
multinational companies in 2017, but if the dollar remains
more stable or even rises in value, smaller, more domestic-
focused businesses could see the rewards. We also continue
to recommend looking abroad, as we have truly seen a global
economic recovery over the last couple of years that has
helped boost world markets, not just U.S. stocks. Emerging
economies continue to perform well on both an absolute
basis and relative to the S&P 500, and we remain optimistic
on them as long as the favorable trend endures.
OVERALL
To conclude, 2018 may have its work cut out for it to further the
calm, consistent price appreciation of 2017’s stock market. We
anticipate having to deal with more downside and disruptions
along the way this year, and investors will likely have to con-
tend with more tightening by the Federal Reserve, potential
geopolitical black swans and the smaller margin for error
inherent to high valuations. However, the secular bull market
is not yet showing signs it’s in trouble, and the global economy
appears to still be improving. The keys to market success in
2018 will be to stay flexible and not panic when we do eventu-
ally see some volatility. And, when in doubt, always remember
it is a bull market, you know ...
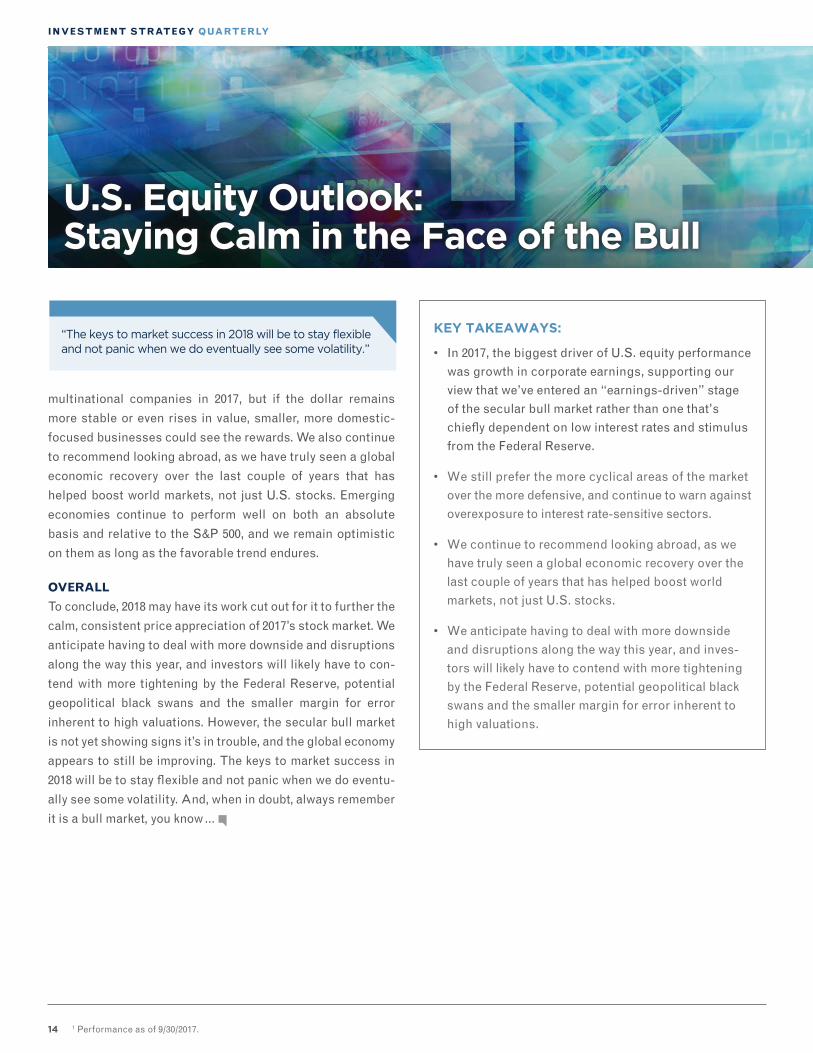
KEY TAKEAWAYS:
• In 2017, the biggest driver of U.S. equity performance was growth in corporate earnings, supporting our view that we’ve entered an “earnings-driven” stage of the secular bull market rather than one that’s chiefly dependent on low interest rates and stimulus from the Federal Reserve.
• We still prefer the more cyclical areas of the market over the more defensive, and continue to warn against overexposure to interest rate-sensitive sectors.
• We continue to recommend looking abroad, as we have truly seen a global economic recovery over the last couple of years that has helped boost world markets, not just U.S. stocks.
• We anticipate having to deal with more downside and disruptions along the way this year, and inves-tors will likely have to contend with more tightening by the Federal Reserve, potential geopolitical black swans and the smaller margin for error inherent to high valuations.
1 Performance as of 9/30/2017.
U.S. Equity Outlook: Staying Calm in the Face of the Bull
“The keys to market success in 2018 will be to stay flexible and not panic when we do eventually see some volatility.”
15
JANUARY 2018
Having largely rebounded from the impact of last year’s hurri-canes, earnings are expected to rebound to double-digit year-over-year growth as we enter the New Year.
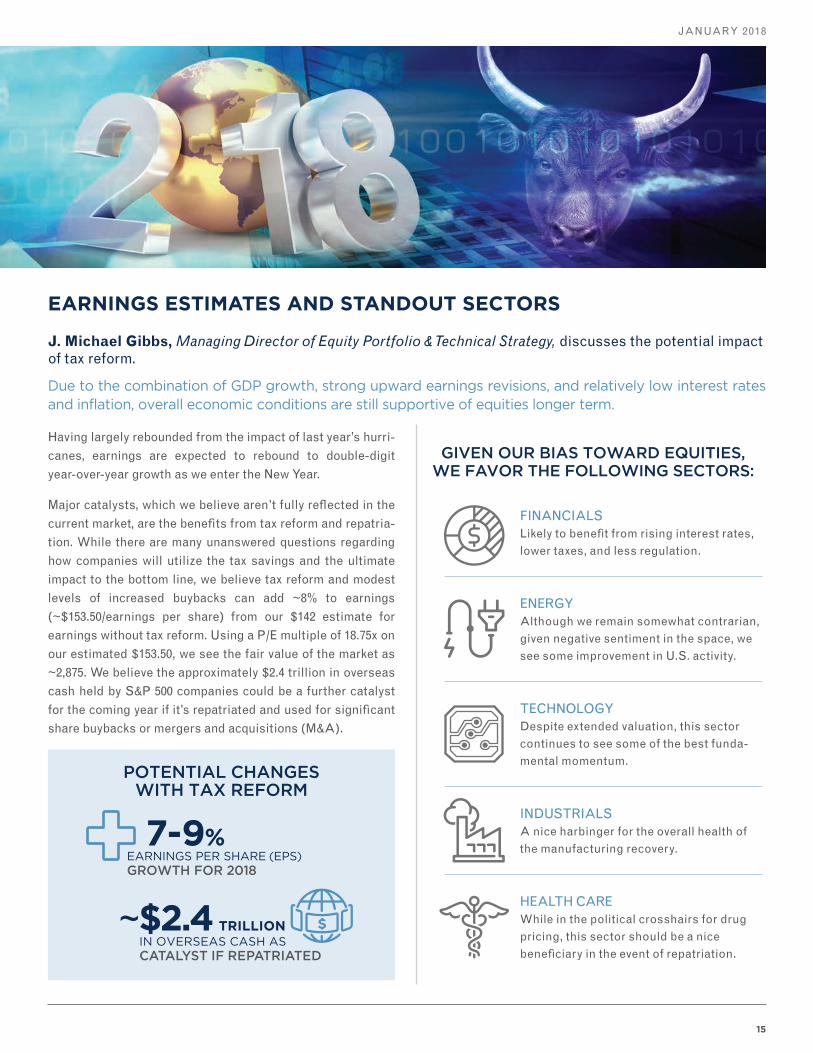
Major catalysts, which we believe aren’t fully reflected in the current market, are the benefits from tax reform and repatria-tion. While there are many unanswered questions regarding how companies will utilize the tax savings and the ultimate impact to the bottom line, we believe tax reform and modest levels of increased buybacks can add ~8% to earnings (~$153.50/earnings per share) from our $142 estimate for earnings without tax reform. Using a P/E multiple of 18.75x on our estimated $153.50, we see the fair value of the market as ~2,875. We believe the approximately $2.4 trillion in overseas cash held by S&P 500 companies could be a further catalyst for the coming year if it’s repatriated and used for significant share buybacks or mergers and acquisitions (M&A).
EARNINGS ESTIMATES AND STANDOUT SECTORS
J. Michael Gibbs, Managing Director of Equity Portfolio & Technical Strategy, discusses the potential impact of tax reform.
Due to the combination of GDP growth, strong upward earnings revisions, and relatively low interest rates and inflation, overall economic conditions are still supportive of equities longer term.
U.S. Equity Outlook: Staying Calm in the Face of the Bull
POTENTIAL CHANGES WITH TAX REFORM
GIVEN OUR BIAS TOWARD EQUITIES, WE FAVOR THE FOLLOWING SECTORS:
FINANCIALS Likely to benefit from rising interest rates, lower taxes, and less regulation.
ENERGY Although we remain somewhat contrarian, given negative sentiment in the space, we see some improvement in U.S. activity.
TECHNOLOGY Despite extended valuation, this sector continues to see some of the best funda-mental momentum.
INDUSTRIALS A nice harbinger for the overall health of the manufacturing recovery.
HEALTH CARE While in the political crosshairs for drug pricing, this sector should be a nice beneficiary in the event of repatriation.
7-9%EARNINGS PER SHARE (EPS) GROWTH FOR 2018
~$2.4 TRILLIONIN OVERSEAS CASH AS CATALYST IF REPATRIATED
16
INVESTMENT STRATEGY QUARTERLY
A GLOBAL VIEW ON EQUITY
In terms of economic growth and corporate earnings, the U.S. has little to worry about going into 2018. However, financial markets often work on the basis of untapped potential and/or momentum. Many other parts of the world – including both developed markets in Europe and emerging markets collectively – are offering lower valuations, stronger corporate earnings growth momentum, and a contin-uation of stimulative central bank actions.
The big question for all international markets is not solely whether they can live up to this opportunity ... but also if they can build international investor confidence in their change and reform regimes.
EUROPEAN REFORM
In recent years, the euro zone has been the least successful in inspiring global investors. Headwinds included low economic growth, overt economic challenges in the highly indebted southern European states, and fading faith that incumbent politicians had any credible answers. At least 2017 saw some form of stabilization aided by the lagged impact of very loose policy by the European Central Bank (ECB).
A year ago, the big fear was the raft of upcoming elections that could have ush-ered in a range of more populist politicians,
putting the continuation of the current form of the euro zone at risk. However, political reality was best captured by the victory of the tele-genic and youthful Emmanuel Macron in France on the promise of reform. Suddenly, there was some hope for change in labour market flexi-
bility, the tax burden backdrop, and even the encouragement of entrepreneurial effort and zeal in an influential European country such as France. Aided by a parliamentary majority, so far so good for President Macron.
The other major supportive element for change within Europe is German Chancellor Angela Merkel. Mrs. Merkel’s own political re-election in late September did not go according to plan, and, at the time of writing, she is still in deep discus-sions over how to put together a workable new coalition to govern Europe’s largest and most influential country. Having led Germany for more than a decade, it’s highly likely she is entering her final few years of top political office, which nat-urally should lead to thoughts regarding her political legacy. This is potentially good news for the cohesion of the euro zone given Germany’s historic reluctance to allow more fiscal
spending in order to stabilize and reduce economic imbalances across the region. The combination of a slightly more eco-nomically-cuddly Germany with a reform-minded France could be an attrac-tive mix for global investors.
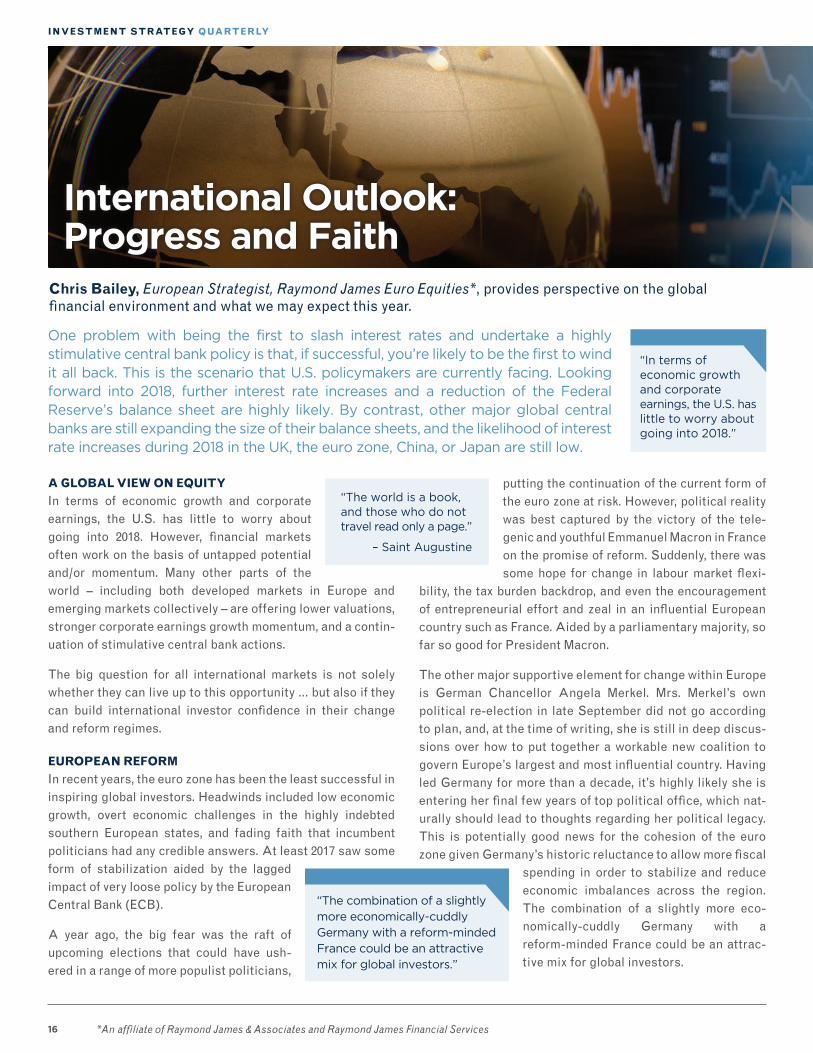
One problem with being the first to slash interest rates and undertake a highly stimulative central bank policy is that, if successful, you’re likely to be the first to wind it all back. This is the scenario that U.S. policymakers are currently facing. Looking forward into 2018, further interest rate increases and a reduction of the Federal Reserve’s balance sheet are highly likely. By contrast, other major global central banks are still expanding the size of their balance sheets, and the likelihood of interest rate increases during 2018 in the UK, the euro zone, China, or Japan are still low.
*An affiliate of Raymond James & Associates and Raymond James Financial Services
Chris Bailey, European Strategist, Raymond James Euro Equities*, provides perspective on the global financial environment and what we may expect this year.
International Outlook: Progress and Faith
“The combination of a slightly more economically-cuddly Germany with a reform-minded France could be an attractive mix for global investors.”
“The world is a book, and those who do not travel read only a page.”
– Saint Augustine
“In terms of economic growth and corporate earnings, the U.S. has little to worry about going into 2018.”
17
JANUARY 2018
International Outlook: Progress and Faith
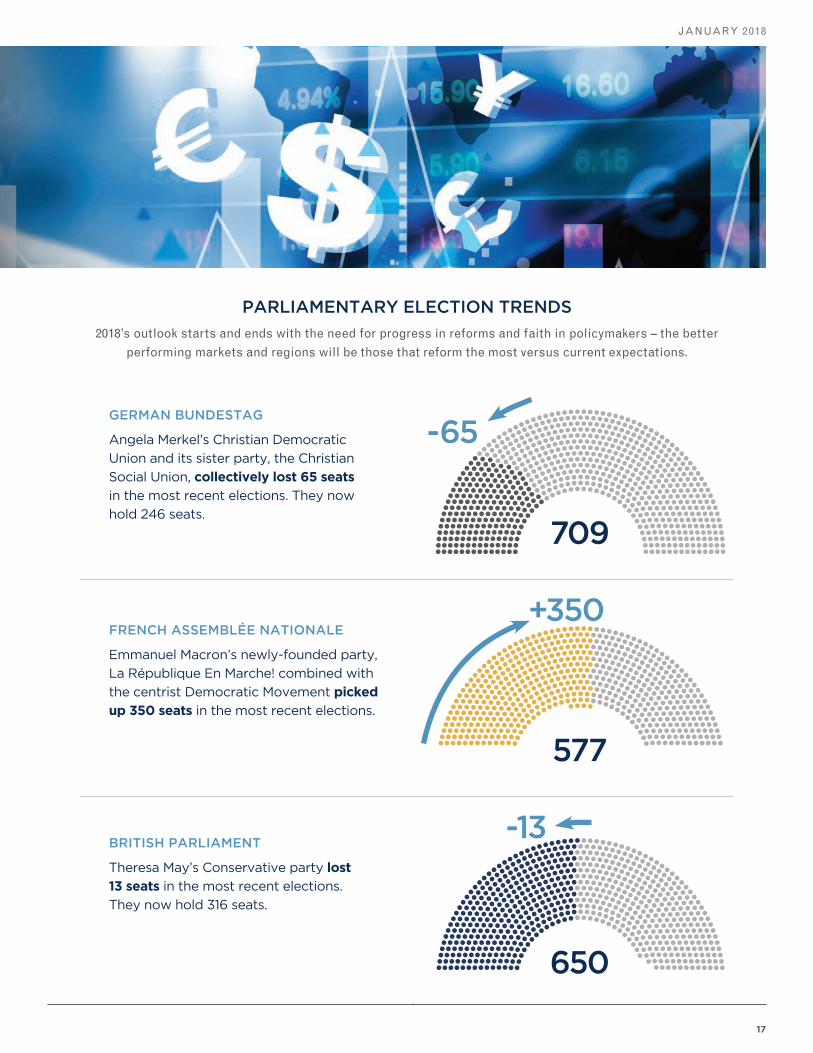
PARLIAMENTARY ELECTION TRENDS
2018’s outlook starts and ends with the need for progress in reforms and faith in policymakers – the better performing markets and regions will be those that reform the most versus current expectations.
709
-65GERMAN BUNDESTAG
Angela Merkel’s Christian Democratic
Union and its sister party, the Christian
Social Union, collectively lost 65 seats
in the most recent elections. They now
hold 246 seats.
-13
650
BRITISH PARLIAMENT
Theresa May’s Conservative party lost
13 seats in the most recent elections.
They now hold 316 seats.
577
+350FRENCH ASSEMBLÉE NATIONALE
Emmanuel Macron’s newly-founded party,
La République En Marche! combined with
the centrist Democratic Movement picked
up 350 seats in the most recent elections.

18
INVESTMENT STRATEGY QUARTERLY
BREXIT
While challenges remain in the euro zone, the UK’s deci-sion to leave the geographically broader European Union (following the referendum in June 2016) remains the most high profile pan-European story. ‘Brexit’ continues to look like the economic equivalent of shooting yourself in the foot. It has raised confidence-sapping questions on future economic growth rates, future trade legislation, and labour mobility, particularly for the UK economy. Global fund man-ager allocation surveys regularly show perceptions towards UK investments as being the most pessimistic versus recent history across a range of multi-asset classes. 2017 also saw domestic political instability instilled within the UK due to the very narrow election victory by the incumbent Conservative party.
However, the mood music around Brexit has improved recently. Both the UK government and the European Union have acknowledged the need to have a longer transitional period than the initial two-year period which was conceived in the immediate aftermath of the Brexit vote. On balance, this progress should continue throughout 2018 and, with it, additional support for the pan-European markets.
CURRENCY
This sort of backdrop suggests further appreciation of the British pound and the euro to levels closer to fair value pur-chasing power parity levels. As seen in 2017, a lower dollar historically supports Asian and emerging market invest-ments. A lower dollar also tends to support commodity prices, which helps other important global economies including Russia, Brazil and a number of Middle Eastern nations.
International Outlook: Progress and Faith
“... the potential for a lower U.S. dollar not only increases the attraction of international diversification by U.S. investors, but also may take the edge off the ‘fair versus free’ trade debate.”
“The Congress unanimously agrees that, the Xi Jinping Thought on Socialism with Chinese Characteris-tics for a New Era, in addition to Marxism- Leninism [and] Mao Zedong Thought … shall constitute the guides to action of the Party in the Party Constitution.”
- Resolution on Amendment to the Constitution of the Communist Party of China, 19th National Congress
ASIAN POLITICAL TRENDS
Japanese Prime Minister Shinzo Abe’s ruling coalition retained its two-thirds supermajority
following a recent snap election, which will enable him to reform the Japanese Constitution for the
first time since its introduction in 1947.
19
JANUARY 2018
ASIA
Both leading economic powers in Asia, China and Japan, saw important polit-ical developments over the last 12 months. For China, the twin accomplishments of the launch of its ‘Belt and Road’ initiative (aimed to create a dynamic economic zone stretching from China to Europe) and a National People’s Congress (which embraces continued market reform) laid out a very positive agenda stretching throughout the rest of the decade. Some pressures are building in property and bond markets, but inves-tors should be encouraged by the legislative support, a burgeoning Chinese consumer, and service sector opportuni-ties. And, this spills out into the broader Asian geographies.
Meanwhile in Japan, economic momentum has improved, and the slow business of trying to introduce more dynamism to the local economy has been boosted by the re-election of Prime Minister Abe. Any signs of deeper reform will no doubt encourage global capital to return to a country that has so materially underperformed for much of the last three decades.
PUTTING IT ALL TOGETHER
The critical thought as we move into 2018 is that the better performing markets and regions from a global stock market perspective will be those that reform the most versus current expectations – with the whole ‘Brexit debate’ and its impact upon domestic political stability being the dynamic reform element for the UK. The scope of such reforms across Europe and Asia still seems reasonable. In addition, the potential for a lower U.S. dollar not only increases the attraction of international diversification by U.S. investors, but also may take the edge off the ‘fair versus free’ trade debate. No huge surprises in global trade legislation helps all countries, allowing broader international tensions such as North Korea and the fight against terrorism to be more cohesively dis-cussed and actioned.
KEY TAKEAWAYS:
• Outside of the U.S., other major global central banks are still expanding the size of their balance sheets and the likelihood of interest rate increases during 2018 in the UK, the euro zone, China, or Japan are still low.
• Both developed markets in Europe and emerging markets collectively are offering lower valuations and stronger corporate earnings growth momentum relative to the U.S., as well as a continuation of stim-ulative central bank actions.
• The critical thought as we move into 2018 is that the better performing markets and regions from a global stock market perspective will be those that reform the most versus current expectations.
• In short, the outlook for international markets in 2018 starts and ends with the need for progress in reforms and faith in policymakers. Cheaper valuations alone are not enough.
In short, the outlook for international markets in 2018 starts and ends with the need for progress in reforms and faith in policymakers. Cheaper valuations alone are not enough.
International Outlook: Progress and Faith
“Both leading economic powers in Asia, China and Japan, saw important political developments over the last 12 months.”
20
INVESTMENT STRATEGY QUARTERLY
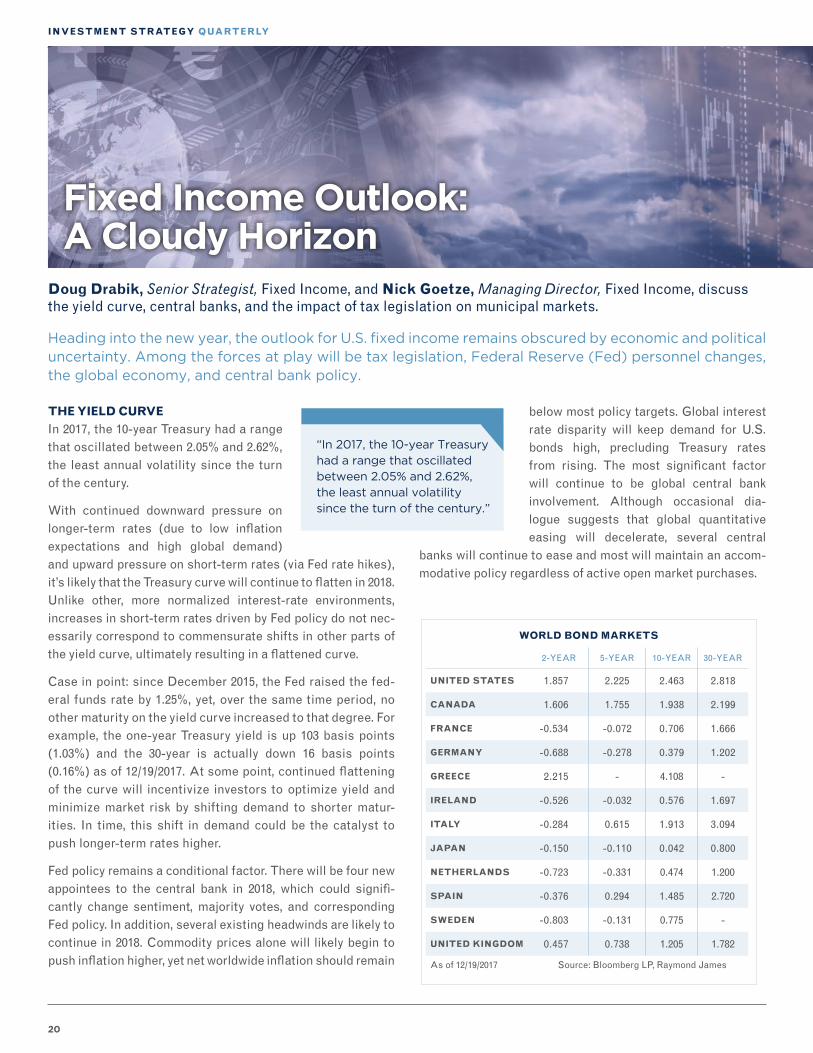
THE YIELD CURVE
In 2017, the 10-year Treasury had a range that oscillated between 2.05% and 2.62%, the least annual volatility since the turn of the century.
With continued downward pressure on longer-term rates (due to low inflation expectations and high global demand) and upward pressure on short-term rates (via Fed rate hikes), it’s likely that the Treasury curve will continue to flatten in 2018. Unlike other, more normalized interest-rate environments, increases in short-term rates driven by Fed policy do not nec-essarily correspond to commensurate shifts in other parts of the yield curve, ultimately resulting in a flattened curve.
Case in point: since December 2015, the Fed raised the fed-eral funds rate by 1.25%, yet, over the same time period, no other maturity on the yield curve increased to that degree. For example, the one-year Treasury yield is up 103 basis points (1.03%) and the 30-year is actually down 16 basis points (0.16%) as of 12/19/2017. At some point, continued flattening of the curve will incentivize investors to optimize yield and minimize market risk by shifting demand to shorter matur-ities. In time, this shift in demand could be the catalyst to push longer-term rates higher.
Fed policy remains a conditional factor. There will be four new appointees to the central bank in 2018, which could signifi-cantly change sentiment, majority votes, and corresponding Fed policy. In addition, several existing headwinds are likely to continue in 2018. Commodity prices alone will likely begin to push inflation higher, yet net worldwide inflation should remain
Fixed Income Outlook: A Cloudy Horizon
below most policy targets. Global interest rate disparity will keep demand for U.S. bonds high, precluding Treasury rates from rising. The most significant factor will continue to be global central bank involvement. Although occasional dia-logue suggests that global quantitative easing will decelerate, several central
banks will continue to ease and most will maintain an accom-modative policy regardless of active open market purchases.
Heading into the new year, the outlook for U.S. fixed income remains obscured by economic and political uncertainty. Among the forces at play will be tax legislation, Federal Reserve (Fed) personnel changes, the global economy, and central bank policy.
Doug Drabik, Senior Strategist, Fixed Income, and Nick Goetze, Managing Director, Fixed Income, discuss the yield curve, central banks, and the impact of tax legislation on municipal markets.
2-YEAR 5-YEAR 10-YEAR 30-YEAR
UNITED STATES 1.857 2.225 2.463 2.818
CANADA 1.606 1.755 1.938 2.199
FRANCE -0.534 -0.072 0.706 1.666
GERMANY -0.688 -0.278 0.379 1.202
GREECE 2.215 - 4.108 -
IRELAND -0.526 -0.032 0.576 1.697
ITALY -0.284 0.615 1.913 3.094
JAPAN -0.150 -0.110 0.042 0.800
NETHERLANDS -0.723 -0.331 0.474 1.200
SPAIN -0.376 0.294 1.485 2.720
SWEDEN -0.803 -0.131 0.775 -
UNITED KINGDOM 0.457 0.738 1.205 1.782
As of 12/19/2017 Source: Bloomberg LP, Raymond James
WORLD BOND MARKETS
“In 2017, the 10-year Treasury had a range that oscillated between 2.05% and 2.62%, the least annual volatility since the turn of the century.”
21
JANUARY 2018
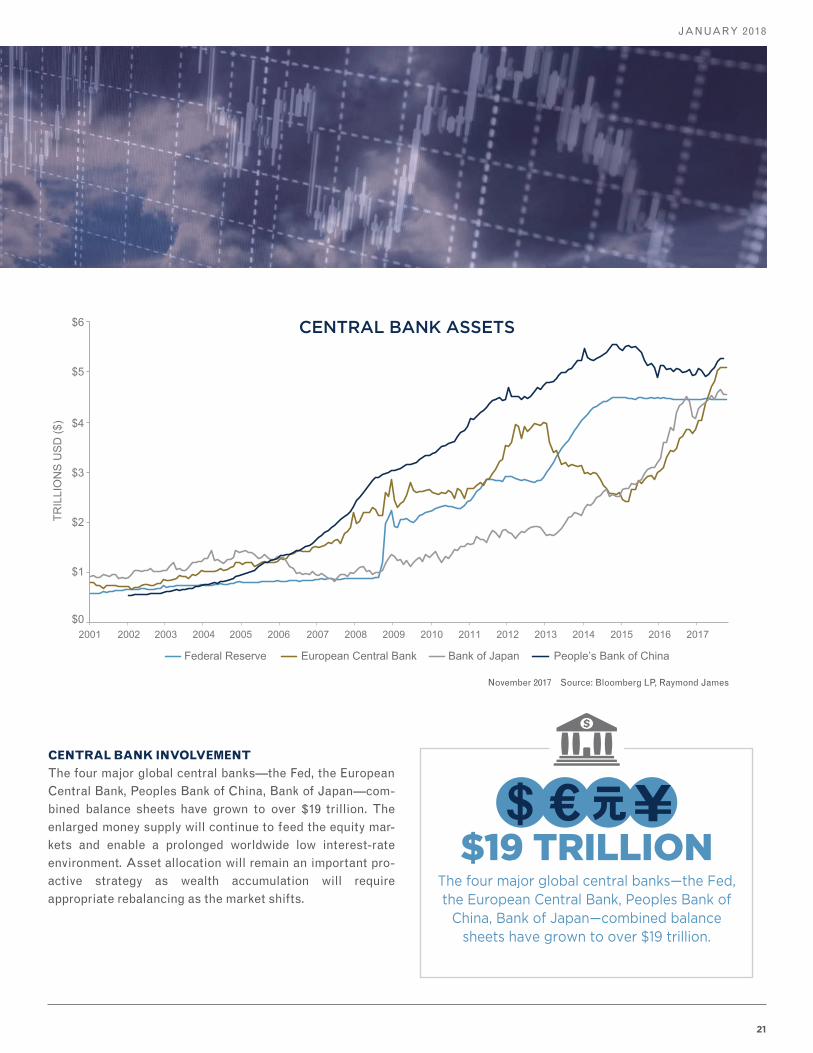
CENTRAL BANK INVOLVEMENT
The four major global central banks—the Fed, the European Central Bank, Peoples Bank of China, Bank of Japan—com-bined balance sheets have grown to over $19 trillion. The enlarged money supply will continue to feed the equity mar-kets and enable a prolonged worldwide low interest-rate environment. Asset allocation will remain an important pro-active strategy as wealth accumulation will require appropriate rebalancing as the market shifts.
$1
$0
$2
$3
$4
$5
$6
2001 2002 2003 2004 2005 2006 2007 2008 2009 2010 2011 2012 2013 2014 2015 2016 2017
Federal Reserve
TRIL
LIO
NS
US
D ($
)
European Central Bank Bank of Japan People’s Bank of China
The four major global central banks—the Fed, the European Central Bank, Peoples Bank of
China, Bank of Japan—combined balance sheets have grown to over $19 trillion.
$19 TRILLION
CENTRAL BANK ASSETS
November 2017 Source: Bloomberg LP, Raymond James
22
INVESTMENT STRATEGY QUARTERLY
KEY TAKEAWAYS:
• Anticipate a continued lack of pressure on interme-diate- to long-term rates in 2018 and upward pressure on short-term rates via Fed rate hikes. It’s likely that the Treasury curve will continue to flatten.
• Global interest rate disparity will keep demand for U.S. bonds high, precluding Treasury rates from rising. The most significant factor will continue to be global central bank involvement.
• Asset allocation will remain an important proactive strategy, as wealth accumulation will require appro-priate rebalancing as the market shifts.
• Reaching for yield beyond reason, in credit or dura-tion, is not recommended as rewards will likely not outweigh the risks.
ADMINISTRATION EFFECTS
The Trump administration will continue to hit roadblocks con-cerning policy changes that were expected to increase spending, decrease revenue, increase the budget deficit, heighten risks for inflation, and potentially push interest rates higher. Tax law changes could certainly impact how 2018 unfolds.
The recent passage of the tax legislation has brought clarity on the impact to the municipal market. While the ability for munici-palities to issue Public Activity Bonds remained, advanced refunding was eliminated. Advanced refunding over the past sev-eral years has represented over 20% of the municipal new issue market. Losing this supply will likely create at least a temporary disruption resulting in lower municipal yields
PORTFOLIO CONSTRUCTION
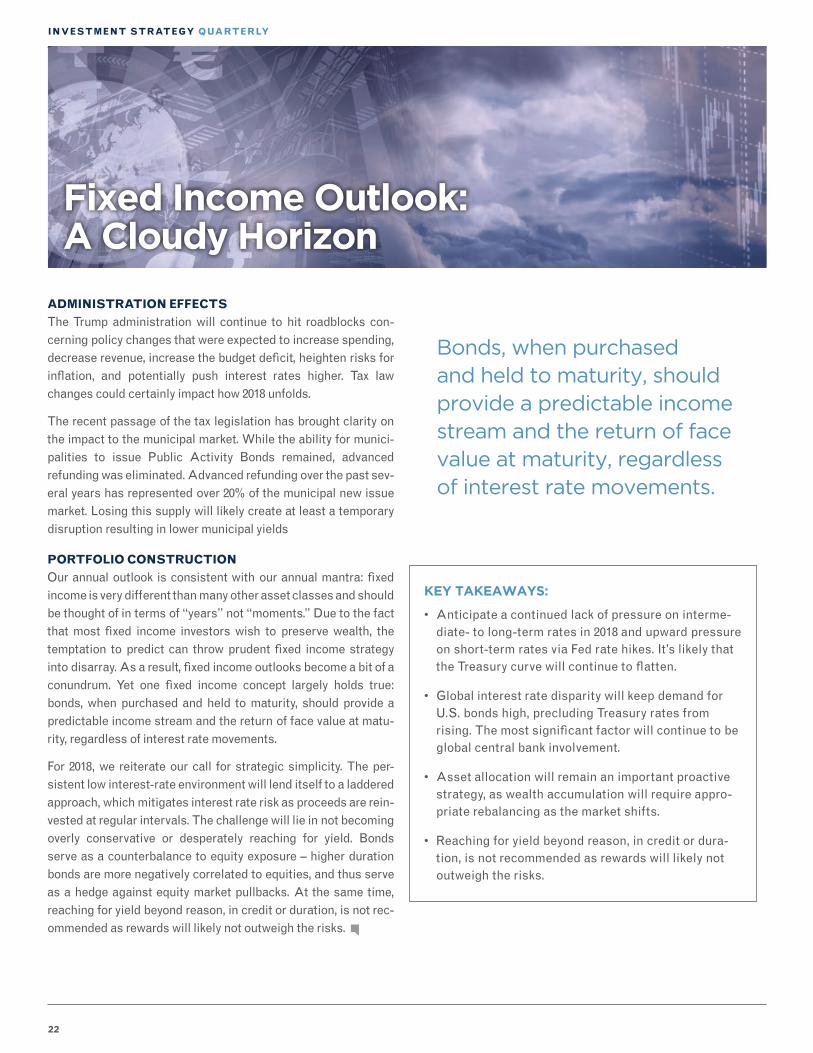
Our annual outlook is consistent with our annual mantra: fixed income is very different than many other asset classes and should be thought of in terms of “years” not “moments.” Due to the fact that most fixed income investors wish to preserve wealth, the temptation to predict can throw prudent fixed income strategy into disarray. As a result, fixed income outlooks become a bit of a conundrum. Yet one fixed income concept largely holds true: bonds, when purchased and held to maturity, should provide a predictable income stream and the return of face value at matu-rity, regardless of interest rate movements.
For 2018, we reiterate our call for strategic simplicity. The per-sistent low interest-rate environment will lend itself to a laddered approach, which mitigates interest rate risk as proceeds are rein-vested at regular intervals. The challenge will lie in not becoming overly conservative or desperately reaching for yield. Bonds serve as a counterbalance to equity exposure – higher duration bonds are more negatively correlated to equities, and thus serve as a hedge against equity market pullbacks. At the same time, reaching for yield beyond reason, in credit or duration, is not rec-ommended as rewards will likely not outweigh the risks.
Fixed Income Outlook: A Cloudy Horizon
Bonds, when purchased and held to maturity, should provide a predictable income stream and the return of face value at maturity, regardless of interest rate movements.
23
JANUARY 2018
Energy Outlook: Consolidation of Oil Recovery, While Renewables Gain More Power
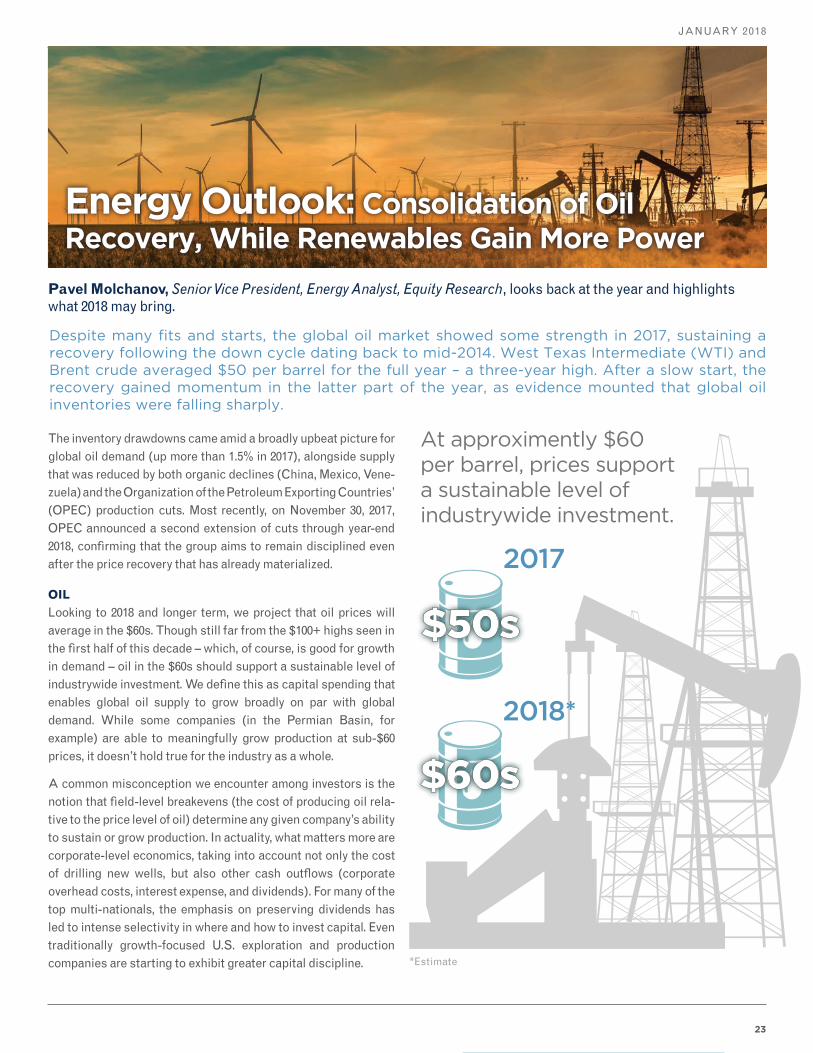
Despite many fits and starts, the global oil market showed some strength in 2017, sustaining a recovery following the down cycle dating back to mid-2014. West Texas Intermediate (WTI) and Brent crude averaged $50 per barrel for the full year – a three-year high. After a slow start, the recovery gained momentum in the latter part of the year, as evidence mounted that global oil inventories were falling sharply.
The inventory drawdowns came amid a broadly upbeat picture for global oil demand (up more than 1.5% in 2017), alongside supply that was reduced by both organic declines (China, Mexico, Vene-zuela) and the Organization of the Petroleum Exporting Countries’ (OPEC) production cuts. Most recently, on November 30, 2017, OPEC announced a second extension of cuts through year-end 2018, confirming that the group aims to remain disciplined even after the price recovery that has already materialized.
OIL
Looking to 2018 and longer term, we project that oil prices will average in the $60s. Though still far from the $100+ highs seen in the first half of this decade – which, of course, is good for growth in demand – oil in the $60s should support a sustainable level of industrywide investment. We define this as capital spending that enables global oil supply to grow broadly on par with global demand. While some companies (in the Permian Basin, for example) are able to meaningfully grow production at sub-$60 prices, it doesn’t hold true for the industry as a whole.
A common misconception we encounter among investors is the notion that field-level breakevens (the cost of producing oil rela-tive to the price level of oil) determine any given company’s ability to sustain or grow production. In actuality, what matters more are corporate-level economics, taking into account not only the cost of drilling new wells, but also other cash outflows (corporate overhead costs, interest expense, and dividends). For many of the top multi-nationals, the emphasis on preserving dividends has led to intense selectivity in where and how to invest capital. Even traditionally growth-focused U.S. exploration and production companies are starting to exhibit greater capital discipline.
Pavel Molchanov, Senior Vice President, Energy Analyst, Equity Research, looks back at the year and highlights what 2018 may bring.
2017
2018*
*Estimate
At approximently $60 per barrel, prices support a sustainable level of industrywide investment.

24
INVESTMENT STRATEGY QUARTERLY
Energy Outlook: Consolidation of Oil Recovery, While Renewables Gain More Power
The ramp-up in wind & solar has been
eating into gas’s market share gains in the power
sector. In fact, gas actually lost share in 2017.
Liquefied natural gas (LNG) exports are still not at truly
needle-moving levels.
Uplift in oil-centric drilling activity in areas such as the Eagle Ford Shale is resulting in a
large increase in supply of associated gas.
NATURAL GAS
In contrast to our positive view on the global oil market, we are less enthused about North American natural gas, hence our fore-cast that Henry Hub (the pricing point for natural gas futures contracts) will average under $3.00/Mcf in 2018, a decline from 2017 levels. Many of the structural trends remain bearish:
• The ramp-up in wind and solar has been eating into gas’s market share gains in the power sector. In fact, gas actually lost share in 2017.
WIND & SOLAR NATURAL GAS OIL DRILLING
• Liquefied natural gas (LNG) exports are still not at truly nee-dle-moving levels.
• Uplift in oil-centric drilling activity in areas such as the Eagle Ford Shale is resulting in a large increase in supply of associ-ated gas.
Meanwhile, the European gas market is in even rougher shape, with demand languishing near 20-year lows. Asian gas demand has been growing, but not as much as the industry would have hoped, hence the mixed fundamentals in the global LNG market.

25
JANUARY 2018
KEY TAKEAWAYS:
• Looking to 2018, and longer term, we project that oil prices will average in the $60s. Though still far from the $100+ highs seen in the first half of this decade – which, of course, is good for growth in demand – oil in the $60s should support a sustainable level of industrywide investment.
• We are less enthused about North American natural gas as many of the structural trends remain bearish.
• A major long-term theme that transcends the day-to-day choppiness in commodity prices is the mainstreaming of renewables – more specifically, wind and solar – in the global electricity mix.
• We project that wind will comprise at least 15% of the U.S. electricity mix by 2030, up from 7% in 2017.
WIND WILL COMPRISE AT LEAST
OF THE U.S. ELECTRICITY
MIX BY 2030
15%
RENEWABLES: WIND AND SOLAR
A major long-term theme that transcends the day-to-day chop-piness in commodity prices is the mainstreaming of renewables – more specifically, wind and solar – in the global electricity mix. This trend is irrelevant for oil since oil is not a common feedstock for power generation, but still helps explain the diffi-cult market conditions for gas and especially coal, whose long-term outlook continues to deteriorate. Last November, 19 countries announced a full coal phase-out by 2030. Addition-ally, the largest U.S. electric utility is predicting that wind will become the lowest-cost source of U.S. electricity by 2020, without taking into account policy incentives. This marks a dra-matic shift from just ten years ago.
As a result, we project that wind will comprise at least 15% of the U.S. electricity mix by 2030, up from 7% in 2017. China should reach at least 10% by then as well. Currently, there are only a handful of countries (mainly in Europe) where wind exceeds 10% of the mix. While solar’s current market share metrics are even lower than those of wind, its rapid pace of cost reduction makes us optimistic about its growth potential as well, notwithstanding the regulatory changes that periodically cause dislocation in the solar value chain.
26
INVESTMENT STRATEGY QUARTERLY
A GLOBAL VIEW
Unconventional monetary policy initiatives by central banks around the world are finally yielding economic and market improvements, similar to those experienced by the U.S. over the last several years. Inflation remains muted in Europe and Japan while stable (albeit, low) inflation in the U.S. and other areas provide a positive global backdrop for accelerating eco-nomic growth and further asset appreciation. In particular, European and Japanese equities should benefit from con-tinued quantitative easing and asset purchase programs from the European Central Bank and the Bank of Japan.
Meanwhile, the Federal Reserve (Fed) and the Bank of England (BOE) are tightening policy by raising short-term interest rates. The Fed has begun gradually unwinding its balance sheet (by not fully reinvesting the proceeds of matured secu-rities). However, this activity is intended to “normalize” policy and should have minimal impact on the overall economy.
While both banks are raising rates, they are doing so for very different reasons. The BOE has to contend with the fallout of Brexit and its impact on the British economy, making its moti-vations for policy fundamentally different than those of the Fed. That being said, the BOE and the Fed will face similar headwinds as a result of tighter monetary policy, unlike their Japanese and European counterparts who maintain more accommodative agendas.
U.S. EQUITY
Strong earnings growth in the U.S., as well as the prospect of regulatory reform and tax policy, drove equity valuations to 15-year highs in 2017. Unlike an asset bubble, current price levels are supported by positive earnings growth, a healthy economy, and a low inflation and interest-rate environment.
As long as these tailwinds remain in place, U.S. equities should have more room to run.
While large-cap stocks may provide some upside due to higher quality metrics, any substantial changes to regulation and/or tax legislation would be a tailwind for smaller compa-nies, since they stand to benefit the most from positive policy changes. In the meantime, opportunities abroad are more encouraging as international equities exhibit stronger funda-mentals and positive investor sentiment.
Publicly-traded real estate is facing headwinds as the likeli-hood of rising interest rates strengthens. More defensive areas of the market, particularly managed-volatility strate-gies or low-beta equities, may offer additional protection from interest-rate risk in this environment.
INTERNATIONAL EQUITY
While earnings growth rates in Europe and other areas of the world are exceeding that of the U.S., not all markets have enjoyed the strong equity performance that the U.S. has (in local currency terms). While valuations appear elevated in the U.S., other regions (such as Europe and Asia) remain “rea-sonably” priced relative to historic averages.
The improvement in fundamentals, earnings, and economic activity overseas justifies an increased allocation to interna-tional equities, particularly those of developed markets. While
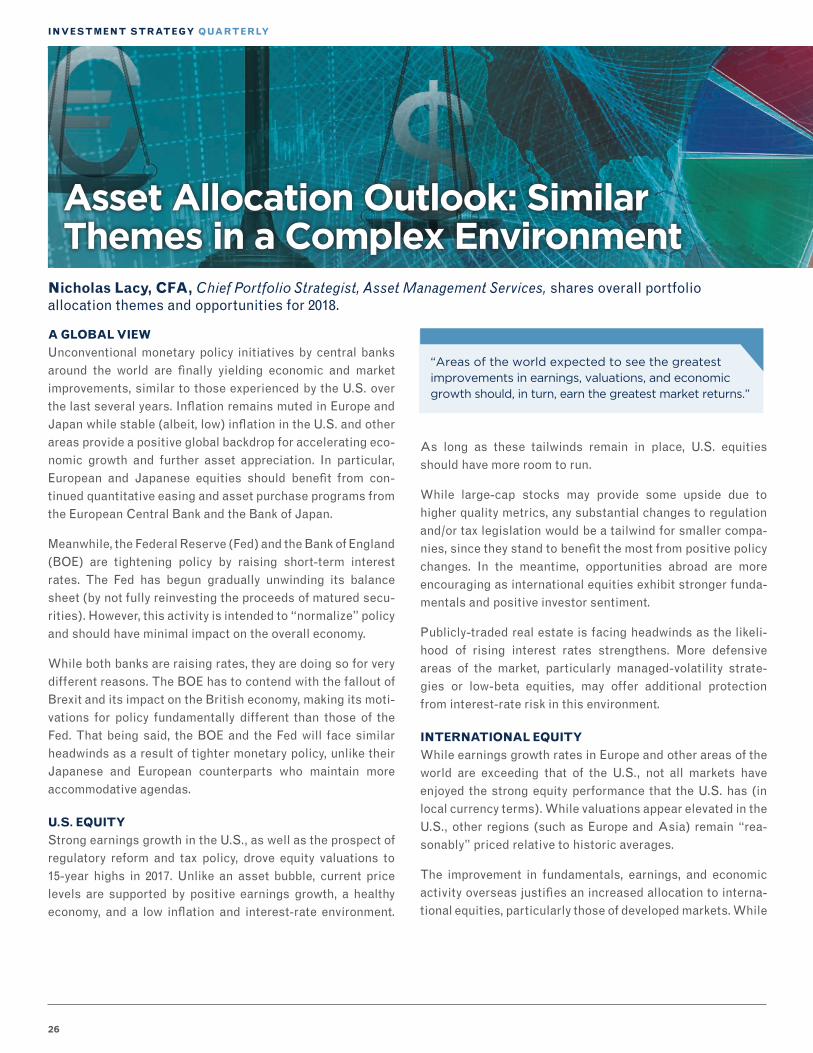
Nicholas Lacy, CFA, Chief Portfolio Strategist, Asset Management Services, shares overall portfolio allocation themes and opportunities for 2018.
Asset Allocation Outlook: Similar Themes in a Complex Environment
“Areas of the world expected to see the greatest improvements in earnings, valuations, and economic growth should, in turn, earn the greatest market returns.”
27
JANUARY 2018
0.0%
0.5%
1.0%
1.5%
2.0%
2.5%
3.0%
3.5%
2009 2010 2011 2012 2013 2014 2015 2016 2017
YIE
LD S
PR
EA
D (%
)
YIELD SPREAD
LONG-TERM AVG SPREAD
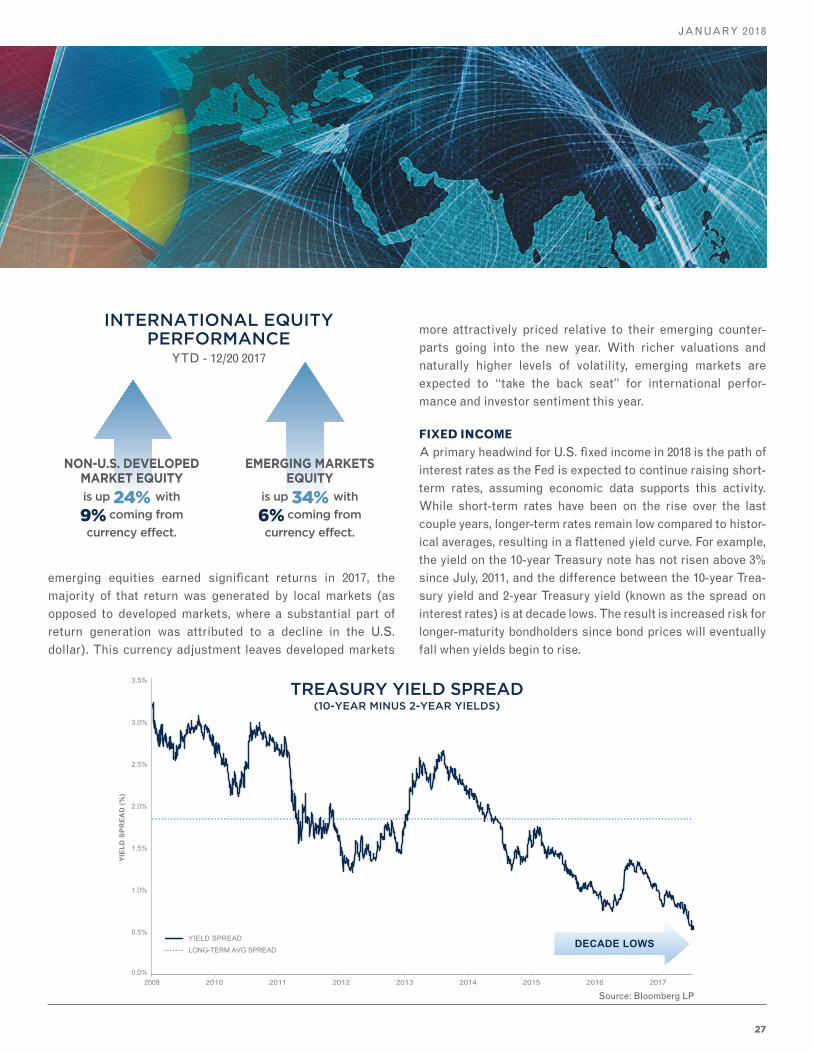
emerging equities earned significant returns in 2017, the majority of that return was generated by local markets (as opposed to developed markets, where a substantial part of return generation was attributed to a decline in the U.S. dollar). This currency adjustment leaves developed markets
TREASURY YIELD SPREAD(10-YEAR MINUS 2-YEAR YIELDS)
more attractively priced relative to their emerging counter-parts going into the new year. With richer valuations and naturally higher levels of volatility, emerging markets are expected to “take the back seat” for international perfor-mance and investor sentiment this year.
FIXED INCOME
A primary headwind for U.S. fixed income in 2018 is the path of interest rates as the Fed is expected to continue raising short-term rates, assuming economic data supports this activity. While short-term rates have been on the rise over the last couple years, longer-term rates remain low compared to histor-ical averages, resulting in a flattened yield curve. For example, the yield on the 10-year Treasury note has not risen above 3% since July, 2011, and the difference between the 10-year Trea-sury yield and 2-year Treasury yield (known as the spread on interest rates) is at decade lows. The result is increased risk for longer-maturity bondholders since bond prices will eventually fall when yields begin to rise.
Source: Bloomberg LP
INTERNATIONAL EQUITY PERFORMANCE
YTD - 12/20 2017
NON-U.S. DEVELOPED MARKET EQUITYis up 24% with
9% coming from
currency effect.
EMERGING MARKETS EQUITY
is up 34% with
6% coming from
currency effect.
28
INVESTMENT STRATEGY QUARTERLY
Asset Allocation Outlook: Similar Themes in a Complex Environment
KEY TAKEAWAYS:
• Areas of the world expected to see the greatest improvements in earnings, valuations, and economic growth should, in turn, earn the greatest market returns.
• While valuations appear elevated in the U.S., other regions (such as Europe and Asia) remain reasonably priced. Carrying over from last year, we maintain a favorable view on non-U.S. developed markets, moving to a full overweight from an overweight position.
• Small- and mid-cap stocks appear the least attractive as we head into 2018, while large caps may provide some upside due to higher quality metrics relative to small and mid caps.
• While intermediate-term, high-quality fixed income in a diversified portfolio is still strongly recommended for its negative correlation to equities, also owning some shorter-term or floating maturity bonds may help offset some of the potential price depreciation when lon-ger-term rates do begin to rise.
Credit-oriented bonds (such as U.S. corporates and high-yield bonds) substantially appreciated in value over the last two years as investors struggled to find yield in an extended period of low interest rates. The result was a significant compression in yields, with the spread between Treasury bonds and corpo-rate/high yield bonds tightening to pre-financial crisis ranges. The positioning of these markets presents significant risk to investors going forward as they are not being compensated for assuming additional credit risk with these holdings.
We maintain the long-term view that intermediate-term, high quality fixed income is the superior hedge to equity market risk, and strategic allocations to these core positions should remain intact. To further insulate a diversified portfolio from a rise in interest rates, investors may consider an allocation to short-term or floating-maturity bonds, which could help offset some of the potential loss incurred by longer-term holdings if rates begin to rise.
DIVERSIFICATION
The global financial markets are more complex now than ever before, presenting both opportunities and risks for investors. Working with your financial advisor to accurately gauge your risk tolerance in order to construct a diversified portfolio and financial plan is essential to achieving your long-term finan-cial goals.
29
JANUARY 2018
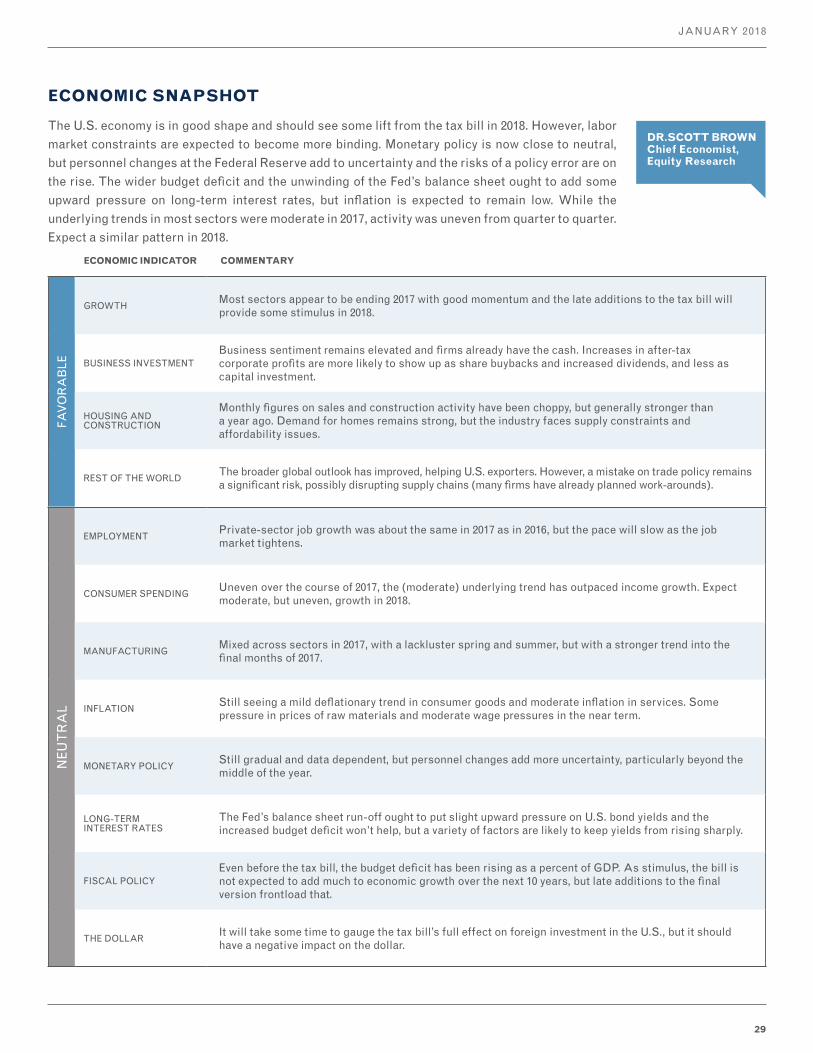
ECONOMIC SNAPSHOT
The U.S. economy is in good shape and should see some lift from the tax bill in 2018. However, labor market constraints are expected to become more binding. Monetary policy is now close to neutral, but personnel changes at the Federal Reserve add to uncertainty and the risks of a policy error are on the rise. The wider budget deficit and the unwinding of the Fed’s balance sheet ought to add some upward pressure on long-term interest rates, but inflation is expected to remain low. While the underlying trends in most sectors were moderate in 2017, activity was uneven from quarter to quarter. Expect a similar pattern in 2018.
DR.SCOTT BROWN Chief Economist, Equity Research
FAV
OR
AB
LE
GROWTHMost sectors appear to be ending 2017 with good momentum and the late additions to the tax bill will provide some stimulus in 2018.
BUSINESS INVESTMENTBusiness sentiment remains elevated and firms already have the cash. Increases in after-tax corporate profits are more likely to show up as share buybacks and increased dividends, and less as capital investment.
HOUSING AND CONSTRUCTION
Monthly figures on sales and construction activity have been choppy, but generally stronger than a year ago. Demand for homes remains strong, but the industry faces supply constraints and affordability issues.
REST OF THE WORLDThe broader global outlook has improved, helping U.S. exporters. However, a mistake on trade policy remains a significant risk, possibly disrupting supply chains (many firms have already planned work-arounds).
NEU
TR
AL
EMPLOYMENTPrivate-sector job growth was about the same in 2017 as in 2016, but the pace will slow as the job market tightens.
CONSUMER SPENDINGUneven over the course of 2017, the (moderate) underlying trend has outpaced income growth. Expect moderate, but uneven, growth in 2018.
MANUFACTURINGMixed across sectors in 2017, with a lackluster spring and summer, but with a stronger trend into the final months of 2017.
INFLATIONStill seeing a mild deflationary trend in consumer goods and moderate inflation in services. Some pressure in prices of raw materials and moderate wage pressures in the near term.
MONETARY POLICYStill gradual and data dependent, but personnel changes add more uncertainty, particularly beyond the middle of the year.
LONG-TERM INTEREST RATES
The Fed’s balance sheet run-off ought to put slight upward pressure on U.S. bond yields and the increased budget deficit won’t help, but a variety of factors are likely to keep yields from rising sharply.
FISCAL POLICYEven before the tax bill, the budget deficit has been rising as a percent of GDP. As stimulus, the bill is not expected to add much to economic growth over the next 10 years, but late additions to the final version frontload that.
THE DOLLARIt will take some time to gauge the tax bill’s full effect on foreign investment in the U.S., but it should have a negative impact on the dollar.
ECONOMIC INDICATOR COMMENTARY
30
INVESTMENT STRATEGY QUARTERLY
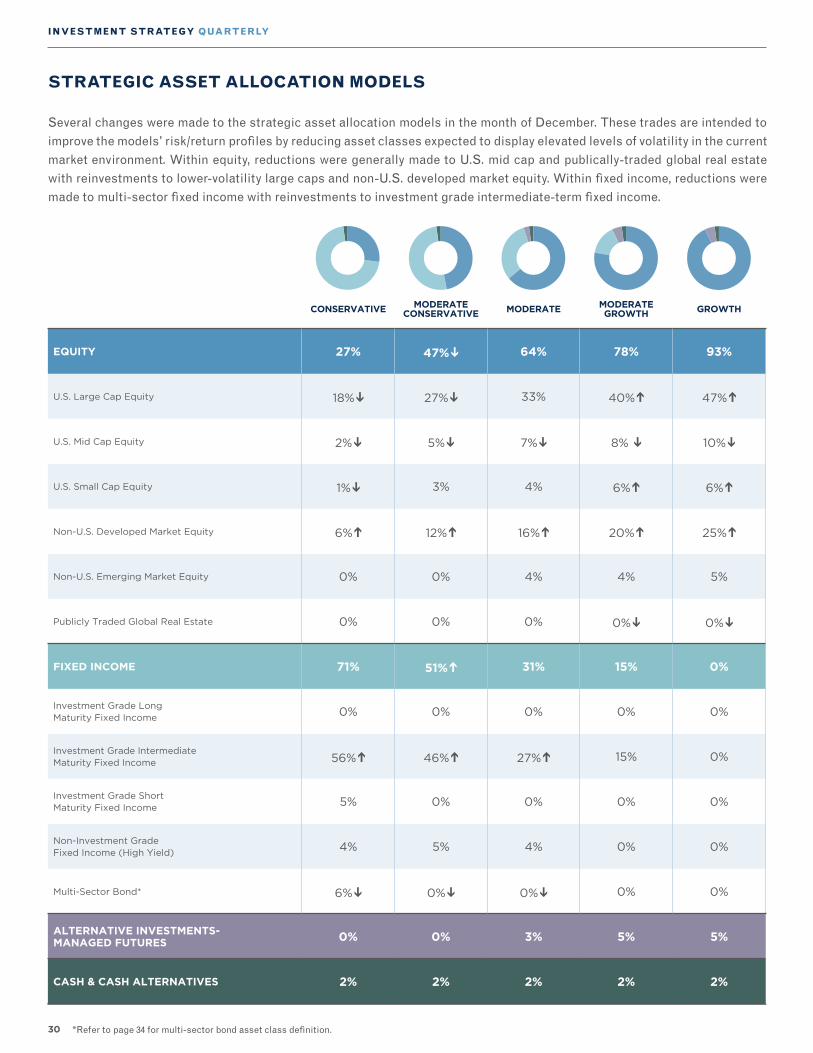
*Refer to page 34 for multi-sector bond asset class definition.
STRATEGIC ASSET ALLOCATION MODELS
CONSERVATIVE MODERATE CONSERVATIVE MODERATE MODERATE
GROWTH GROWTH
EQUITY 27% 47%Ô 64% 78% 93%
U.S. Large Cap Equity 18%Ô 27%Ô 33% 40%Õ 47%Õ
U.S. Mid Cap Equity 2%Ô 5%Ô 7%Ô 8% Ô 10%Ô
U.S. Small Cap Equity 1%Ô 3% 4% 6%Õ 6%Õ
Non-U.S. Developed Market Equity 6%Õ 12%Õ 16%Õ 20%Õ 25%Õ
Non-U.S. Emerging Market Equity 0% 0% 4% 4% 5%
Publicly Traded Global Real Estate 0% 0% 0% 0%Ô 0%Ô
FIXED INCOME 71% 51%Õ 31% 15% 0%
Investment Grade Long Maturity Fixed Income
0% 0% 0% 0% 0%
Investment Grade Intermediate Maturity Fixed Income 56%Õ 46%Õ 27%Õ 15% 0%
Investment Grade Short Maturity Fixed Income
5% 0% 0% 0% 0%
Non-Investment Grade Fixed Income (High Yield)
4% 5% 4% 0% 0%
Multi-Sector Bond* 6%Ô 0%Ô 0%Ô 0% 0%
ALTERNATIVE INVESTMENTS- MANAGED FUTURES 0% 0% 3% 5% 5%
CASH & CASH ALTERNATIVES 2% 2% 2% 2% 2%
Several changes were made to the strategic asset allocation models in the month of December. These trades are intended to improve the models' risk/return profiles by reducing asset classes expected to display elevated levels of volatility in the current market environment. Within equity, reductions were generally made to U.S. mid cap and publically-traded global real estate with reinvestments to lower-volatility large caps and non-U.S. developed market equity. Within fixed income, reductions were made to multi-sector fixed income with reinvestments to investment grade intermediate-term fixed income.
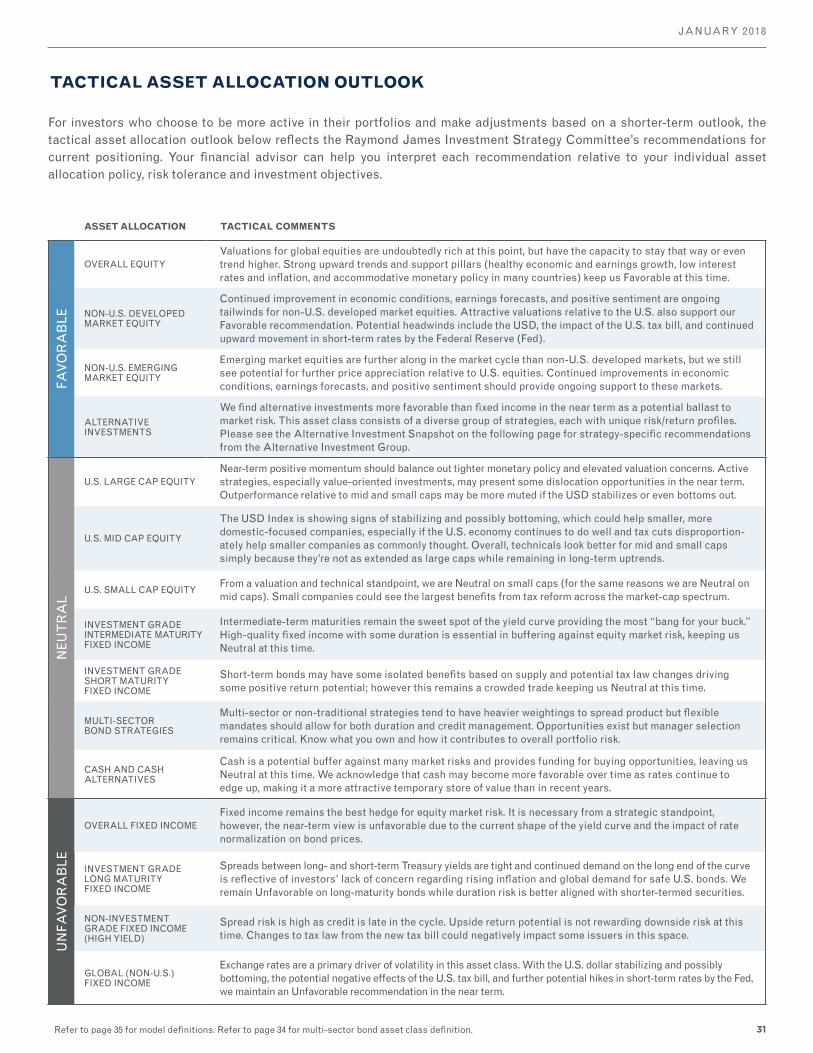
31
JANUARY 2018
Refer to page 35 for model definitions. Refer to page 34 for multi-sector bond asset class definition.
For investors who choose to be more active in their portfolios and make adjustments based on a shorter-term outlook, the tactical asset allocation outlook below reflects the Raymond James Investment Strategy Committee’s recommendations for current positioning. Your financial advisor can help you interpret each recommendation relative to your individual asset allocation policy, risk tolerance and investment objectives.
TACTICAL ASSET ALLOCATION OUTLOOK
ASSET ALLOCATION TACTICAL COMMENTS
FAV
OR
AB
LE
OVERALL EQUITYValuations for global equities are undoubtedly rich at this point, but have the capacity to stay that way or even trend higher. Strong upward trends and support pillars (healthy economic and earnings growth, low interest rates and inflation, and accommodative monetary policy in many countries) keep us Favorable at this time.
NON-U.S. DEVELOPED MARKET EQUITY
Continued improvement in economic conditions, earnings forecasts, and positive sentiment are ongoing tailwinds for non-U.S. developed market equities. Attractive valuations relative to the U.S. also support our Favorable recommendation. Potential headwinds include the USD, the impact of the U.S. tax bill, and continued upward movement in short-term rates by the Federal Reserve (Fed).
NON-U.S. EMERGING MARKET EQUITY
Emerging market equities are further along in the market cycle than non-U.S. developed markets, but we still see potential for further price appreciation relative to U.S. equities. Continued improvements in economic conditions, earnings forecasts, and positive sentiment should provide ongoing support to these markets.
ALTERNATIVE INVESTMENTS
We find alternative investments more favorable than fixed income in the near term as a potential ballast to market risk. This asset class consists of a diverse group of strategies, each with unique risk/return profiles. Please see the Alternative Investment Snapshot on the following page for strategy-specific recommendations from the Alternative Investment Group.
NEU
TR
AL
U.S. LARGE CAP EQUITYNear-term positive momentum should balance out tighter monetary policy and elevated valuation concerns. Active strategies, especially value-oriented investments, may present some dislocation opportunities in the near term. Outperformance relative to mid and small caps may be more muted if the USD stabilizes or even bottoms out.
U.S. MID CAP EQUITY
The USD Index is showing signs of stabilizing and possibly bottoming, which could help smaller, more domestic-focused companies, especially if the U.S. economy continues to do well and tax cuts disproportion-ately help smaller companies as commonly thought. Overall, technicals look better for mid and small caps simply because they’re not as extended as large caps while remaining in long-term uptrends.
U.S. SMALL CAP EQUITYFrom a valuation and technical standpoint, we are Neutral on small caps (for the same reasons we are Neutral on mid caps). Small companies could see the largest benefits from tax reform across the market-cap spectrum.
INVESTMENT GRADE INTERMEDIATE MATURITY FIXED INCOME
Intermediate-term maturities remain the sweet spot of the yield curve providing the most “bang for your buck.” High-quality fixed income with some duration is essential in buffering against equity market risk, keeping us Neutral at this time.
INVESTMENT GRADE SHORT MATURITY FIXED INCOME
Short-term bonds may have some isolated benefits based on supply and potential tax law changes driving some positive return potential; however this remains a crowded trade keeping us Neutral at this time.
MULTI-SECTOR BOND STRATEGIES
Multi-sector or non-traditional strategies tend to have heavier weightings to spread product but flexible mandates should allow for both duration and credit management. Opportunities exist but manager selection remains critical. Know what you own and how it contributes to overall portfolio risk.
CASH AND CASH ALTERNATIVES
Cash is a potential buffer against many market risks and provides funding for buying opportunities, leaving us Neutral at this time. We acknowledge that cash may become more favorable over time as rates continue to edge up, making it a more attractive temporary store of value than in recent years.
UN
FAV
OR
AB
LE
OVERALL FIXED INCOMEFixed income remains the best hedge for equity market risk. It is necessary from a strategic standpoint, however, the near-term view is unfavorable due to the current shape of the yield curve and the impact of rate normalization on bond prices.
INVESTMENT GRADE LONG MATURITY FIXED INCOME
Spreads between long- and short-term Treasury yields are tight and continued demand on the long end of the curve is reflective of investors’ lack of concern regarding rising inflation and global demand for safe U.S. bonds. We remain Unfavorable on long-maturity bonds while duration risk is better aligned with shorter-termed securities.
NON-INVESTMENT GRADE FIXED INCOME (HIGH YIELD)
Spread risk is high as credit is late in the cycle. Upside return potential is not rewarding downside risk at this time. Changes to tax law from the new tax bill could negatively impact some issuers in this space.
GLOBAL (NON-U.S.) FIXED INCOME
Exchange rates are a primary driver of volatility in this asset class. With the U.S. dollar stabilizing and possibly bottoming, the potential negative effects of the U.S. tax bill, and further potential hikes in short-term rates by the Fed, we maintain an Unfavorable recommendation in the near term.

32
INVESTMENT STRATEGY QUARTERLY
ALTERNATIVE INVESTMENTS
EQUITY LONG/SHORT
Equity long/short strategies are poised to benefit from continued and elevated dispersion across sectors, industries, and geographies. This increased dispersion, combined with stocks reacting to fundamentals, creates a favorable environment for equity long/short managers to add value on both the long and short sides of the portfolio. Funds within this strategy are generally going to be long-biased, so they should also continue to benefit from equity market strength, albeit to a more limited degree.
MULTI-MANAGER/MULTI-STRATEGY
Multi-manager/multi-strategy funds generally seek to generate their returns with a low beta and correlation to the traditional markets, and attempt to do so with a targeted volatility that is notably below that of the equity markets. This strategy can be beneficial for those seeking uncorrelated performance relative to the equity markets.
MANAGED FUTURES
The ability to go both long and short the various asset classes (fixed income, commodities, currency, and equities) allows the strategy to benefit even in times of financial distress. Additionally, increasing rates can be advantageous for this strategy due to a higher rate earned on its large cash allocation and the ability for the fund to profit from the trend.
EVENT DRIVEN
Event-driven managers have the ability to benefit from elevated corporate activity as potentially less regulation and lower taxes lead to more business-friendly policies. There has also been a trend of increasing proactive M&A deals to create technological disruptions. It is expected that companies will continue to seek M&A opportunities to achieve growth and search for synergies. Defaults remain low with limited new opportunities, but activism continues to achieve record high volumes in capital deployed. The multi-strategy event-driven funds are able to allocate across the various sub-strategies of M&A, distressed, and special situations, and provides an attractive entry point to the strategy as the funds can shift allocations based on the market environment.
EQUITY MARKET NEUTRAL
As intra-stock correlations have decreased, managers have the potential to benefit from both the long and short exposure within the portfolio. For an investor who is bearish on equities, this could be a suitable option given its lack of dependence on market movements. However, if equity markets continue on an upward trend, equity market neutral managers are likely to underperform strategies with a long bias.
GLOBAL MACROThe ability to go both long and short across the various asset classes (fixed income, commodities, currency, and equities) allows the strategy to benefit even in times of financial distress and/or rising rates.
ALTERNATIVE INVESTMENTS SNAPSHOTJENNIFER SUDEN Director of Alternative Investments Research
This report is intended to highlight the dynamics underlying major categories of the alternatives market, with the goal of providing a timely assessment based on current economic and capital market environments. Our goal is to look for trends that can be sustainable for several quarters; yet given the dynamic nature of financial markets, our opinion could change as market conditions dictate.
Investors should only invest in hedge funds, managed futures, distressed credit or other similar strategies if they do not require a liquid investment and can bearthe risk of substantial losses. There can be no assurance that any investment will meet its performance objectives or that substantial losses will be avoided.
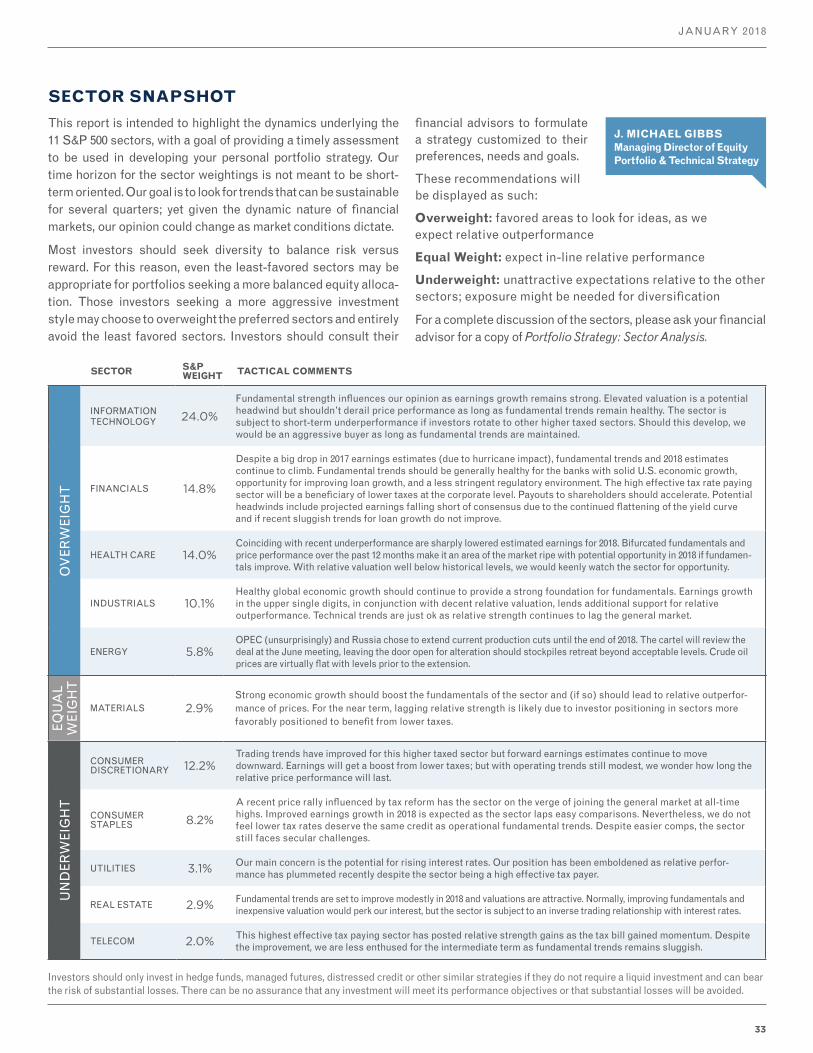
33
JANUARY 2018
SECTOR SNAPSHOT
This report is intended to highlight the dynamics underlying the 11 S&P 500 sectors, with a goal of providing a timely assessment to be used in developing your personal portfolio strategy. Our time horizon for the sector weightings is not meant to be short-term oriented. Our goal is to look for trends that can be sustainable for several quarters; yet given the dynamic nature of financial markets, our opinion could change as market conditions dictate.
Most investors should seek diversity to balance risk versus reward. For this reason, even the least-favored sectors may be appropriate for portfolios seeking a more balanced equity alloca-tion. Those investors seeking a more aggressive investment style may choose to overweight the preferred sectors and entirely avoid the least favored sectors. Investors should consult their
financial advisors to formulate a strategy customized to their preferences, needs and goals.
These recommendations will be displayed as such:
Overweight: favored areas to look for ideas, as we expect relative outperformance
Equal Weight: expect in-line relative performance
Underweight: unattractive expectations relative to the other sectors; exposure might be needed for diversification
For a complete discussion of the sectors, please ask your financial advisor for a copy of Portfolio Strategy: Sector Analysis.
J. MICHAEL GIBBS Managing Director of Equity Portfolio & Technical Strategy
OV
ERW
EIG
HT
INFORMATION TECHNOLOGY 24.0%
Fundamental strength influences our opinion as earnings growth remains strong. Elevated valuation is a potential headwind but shouldn’t derail price performance as long as fundamental trends remain healthy. The sector is subject to short-term underperformance if investors rotate to other higher taxed sectors. Should this develop, we would be an aggressive buyer as long as fundamental trends are maintained.
FINANCIALS 14.8%
Despite a big drop in 2017 earnings estimates (due to hurricane impact), fundamental trends and 2018 estimates continue to climb. Fundamental trends should be generally healthy for the banks with solid U.S. economic growth, opportunity for improving loan growth, and a less stringent regulatory environment. The high effective tax rate paying sector will be a beneficiary of lower taxes at the corporate level. Payouts to shareholders should accelerate. Potential headwinds include projected earnings falling short of consensus due to the continued flattening of the yield curve and if recent sluggish trends for loan growth do not improve.
HEALTH CARE 14.0%Coinciding with recent underperformance are sharply lowered estimated earnings for 2018. Bifurcated fundamentals and price performance over the past 12 months make it an area of the market ripe with potential opportunity in 2018 if fundamen-tals improve. With relative valuation well below historical levels, we would keenly watch the sector for opportunity.
INDUSTRIALS 10.1%Healthy global economic growth should continue to provide a strong foundation for fundamentals. Earnings growth in the upper single digits, in conjunction with decent relative valuation, lends additional support for relative outperformance. Technical trends are just ok as relative strength continues to lag the general market.
ENERGY 5.8%OPEC (unsurprisingly) and Russia chose to extend current production cuts until the end of 2018. The cartel will review the deal at the June meeting, leaving the door open for alteration should stockpiles retreat beyond acceptable levels. Crude oil prices are virtually flat with levels prior to the extension.
EQU
AL
WEI
GH
T
MATERIALS 2.9%Strong economic growth should boost the fundamentals of the sector and (if so) should lead to relative outperfor-mance of prices. For the near term, lagging relative strength is likely due to investor positioning in sectors more favorably positioned to benefit from lower taxes.
UN
DER
WEI
GH
T
CONSUMER DISCRETIONARY 12.2%
Trading trends have improved for this higher taxed sector but forward earnings estimates continue to move downward. Earnings will get a boost from lower taxes; but with operating trends still modest, we wonder how long the relative price performance will last.
CONSUMER STAPLES 8.2%
A recent price rally influenced by tax reform has the sector on the verge of joining the general market at all-time highs. Improved earnings growth in 2018 is expected as the sector laps easy comparisons. Nevertheless, we do not feel lower tax rates deserve the same credit as operational fundamental trends. Despite easier comps, the sector still faces secular challenges.
UTILITIES 3.1%Our main concern is the potential for rising interest rates. Our position has been emboldened as relative perfor-mance has plummeted recently despite the sector being a high effective tax payer.
REAL ESTATE 2.9%Fundamental trends are set to improve modestly in 2018 and valuations are attractive. Normally, improving fundamentals and inexpensive valuation would perk our interest, but the sector is subject to an inverse trading relationship with interest rates.
TELECOM 2.0%This highest effective tax paying sector has posted relative strength gains as the tax bill gained momentum. Despite the improvement, we are less enthused for the intermediate term as fundamental trends remains sluggish.
SECTOR S&P WEIGHT TACTICAL COMMENTS
Investors should only invest in hedge funds, managed futures, distressed credit or other similar strategies if they do not require a liquid investment and can bear the risk of substantial losses. There can be no assurance that any investment will meet its performance objectives or that substantial losses will be avoided.
34
INVESTMENT STRATEGY QUARTERLY
ASSET CLASS DEFINITIONS
U.S. Large Cap EquityRussell 1000 Index: Based on a combination of their market cap and current index membership, this index consists of approximately 1,000 of the largest securities from the Russell 3000. Representing approximately 92% of the Russell 3000, the index is created to provide a full and unbiased indicator of the large cap segment.
U.S. Mid Cap EquityRussell Midcap Index: A subset of the Russell 1000 index, the Russell Midcap index measures the performance of the mid-cap segment of the U.S. equity universe. Based on a combination of their market cap and current index membership, includes approximately 800 of the smallest securities which represents approximately 27% of the total market capitalization of the Russell 1000 companies. The index is created to provide a full and unbiased indicator of the mid-cap segment.
U.S. Small Cap EquityRussell 2000 Index: The Russell 2000 Index measures the performance of the small-cap segment of the U.S. equity universe. The Russell 2000 is a subset of the Russell 3000 Index representing approximately 10% of the total market capitalization of that index. It includes approximately 2000 of the smallest securities based on a combination of their market cap and current index membership.
The Russell 2000 Index is constructed to provide a comprehensive and unbiased small-cap barometer and is completely reconstituted annually to ensure larger stocks do not distort the performance and characteristics of the true small-cap opportunity set.
Non U.S. Developed Market EquityMSCI EAFE: This index is a free float-adjusted market capitalization index that measures the performance of developed market equities, excluding the U.S. and Canada. It consists of the following 22 developed market country indices: Australia, Austria, Belgium, Denmark, Finland, France, Germany, Greece, Hong Kong, Ireland, Israel, Italy, Japan, the Netherlands, New Zealand, Norway, Portugal, Singapore, Spain, Sweden, Switzerland and the United Kingdom.
Non U.S. Emerging Market EquityMSCI Emerging Markets Index: A free float-adjusted market capitalization index that is designed to measure equity market performance of emerging markets. As of December 31, 2010, the MSCI Emerging Markets Index consists of the following 21 emerging market country indices: Brazil, Chile, China, Colombia, Czech Republic, Egypt, Hungary, India, Indonesia, Korea, Malaysia, Mexico, Morocco, Peru, Philippines, Poland, Russia, South Africa, Taiwan, Thailand and Turkey.
Real EstateFTSE NAREIT Equity: The index is designed to represent a comprehensive performance of publicly traded REITs which covers the commercial real estate space across the US economy, offering exposure to all investment and property sectors. It is not free float adjusted, and constituents are not required to meet minimum size and liquidity criteria.
CommoditiesBloomberg Commodity Index (BCOM): Formerly known as the Dow Jones-UBS Commodity Index, the index is made up of 22 exchange-traded futures on physical commodities. The index currently represents 20 commodities, weighted to account for economic significance and market liquidity with weighting restrictions on individual commodities and commodity groups to promote diversification. Performance combines the returns of the fully collateralized BCOM Index with the returns on cash collateral (invested in 3 month U.S. Treasury Bills).
Investment Grade Long Maturity Fixed IncomeBarclays Long US Government/Credit: The long component of the Barclays Capital Government/Credit Index with securities in the maturity range from 10 years or more.
Investment Grade Intermediate Maturity Fixed IncomeBarclays US Aggregate Bond Index: This index is a broad fixed income index that includes all issues in the Government/Credit Index and mortgage-backed debt securities. Maturities range from 1 to 30 years with an average maturity of nearly 5 years.
Investment Grade Short Maturity Fixed IncomeBarclays Govt/Credit 1-3 Year: The component of the Barclays Capital Government/Credit Index with securities in the maturity range from 1 up to (but not including) 3 years.
Non-Investment Grade Fixed Income (High Yield)Barclays US Corporate High Yield Index: Covers the universe of fixed rate, non-investment grade debt which includes corporate (Industrial, Utility, and Finance both U.S. and non-U.S. corporations) and non-corporate sectors. The index also includes Eurobonds and debt issues from countries designated as emerging markets (sovereign rating of Baa1/BBB+/BBB+ and below using the middle of Moody’s, S&P, and Fitch) are excluded, but Canadian and global bonds (SEC registered) of issuers in non-EMG countries are included. Original issue zeroes, step-up coupon structures, 144-As and pay-in-kind bonds (PIKs, as of October 1, 2009) are also included. Must publicly issued, dollar-denominated and non-convertible, fixed rate (may carry a coupon that steps up or changes according to a predetermined schedule, and be rated high-yield (Ba1 or BB+ or lower) by at least two of the following: Moody’s. S&P, Fitch. Also, must have an outstanding par value of at least $150 million and regardless of call features have at least one year to final maturity.
Global (Non-U.S.) Fixed IncomeBarclays Global Aggregate Bond Index: The index is designed to be a broad based measure of the global investment-grade, fixed rate, fixed income corporate markets outside of the U.S. The major components of this index are the Pan-European Aggregate, and the Asian-Pacific Aggregate Indices. The index also includes Eurodollar and Euro-Yen corporate bonds, Canadian government, agency and corporate securities.
Multi-Sector BondThe index for the multi-sector bond asset class is composed of one-third the Barclays Aggregate US Bond Index, a broad fixed income index that includes all issues in the Government/Credit Index and mortgage-backed debt securities; maturities range from 1 to 30 years with an average maturity of nearly 5 years, one-third the Barclays US Corporate High Yield Index which covers the universe of fixed rate, non-investment grade debt and includes corporate (Industrial, Utility, and Finance both U.S. and non-U.S. corporations) and non-corporate sectors and one-third the J.P. Morgan EMBI Global Diversified Index, an unmanaged index of debt instruments of 50 emerging countries.
The Multi-Sector Bond category also includes nontraditional bond funds. Nontraditional bond funds pursue strategies divergent in one or more ways from conventional practice in the broader bond-fund universe. These funds have more flexibility to invest tactically across a wide swath of individual sectors, including high-yield and foreign debt, and typically with very large allocations. These funds typically have broad freedom to manage interest-rate sensitivity, but attempt to tactically manage those exposures in order to minimize volatility. Funds within this category often will use credit default swaps and other fixed income derivatives to a significant level within their portfolios.
Alternatives InvestmentHFRI Fund of Funds Index: The index only contains fund of funds, which invest with multiple managers through funds or managed accounts. It is an equal-weighted index, which includes over 650 domestic and offshore funds that have at least $50 million under management or have been actively trading for at least 12 months. All funds report assets in US Dollar, and Net of All Fees returns which are on a monthly basis.
Cash & Cash AlternativesCitigroup 3 Month US Treasury Bill: A market value-weighted index of public obligations of the U.S. Treasury with maturities of 3 months.
KEY TERMSLong/Short EquityLong/short equity managers typically take both long and short positions in equity markets. The ability to vary market exposure may provide a long/short manager with the opportunity to express either a bullish or bearish view, and to potentially mitigate risk during difficult times.
Global MacroHedge funds employing a global macro approach take positions in financial derivatives and other securities on the basis of movements in global financial markets. The strategies are typically based on forecasts and analyses of interest rate trends, movements in the general flow of funds, political changes, government policies, inter-government relations, and other broad systemic factors.
Multi-StrategyEngage in a broad range of investment strategies, including but not limited to long/short equity, global macro, merger arbitrage, statistical arbitrage, structured credit, and event-driven strategies. The funds have the ability to dynamically shift capital among the various sub-strategies, seeking the greatest perceived risk/reward opportunities at any given time.

35
JANUARY 2018
Event-DrivenEvent-driven managers typically focus on company-specific events. Examples of such events include mergers, acquisitions, bankruptcies, reorganizations, spin-offs and other events that could be considered to offer “catalyst driven” investment opportunities. These managers will primarily trade equities and bonds.
Market NeutralA hedge fund strategy that seeks to exploit differences in stock prices by being long and short in stocks within the same sector, industry, market capitalization, country, etc. This strategy creates a hedge against market factors.
Managed FuturesManaged futures strategies trade in a variety of global markets, attempting to identify and profit from rising or falling trends that develop in these markets. Markets that are traded often include financials (interest rates, stock indices and currencies), as well as commodities (energy, metals and agriculturals).
INDEX DEFINITIONSBarclays U.S. Aggregate Bond IndexA broad-based benchmark that measures the investment grade, U.S. dollar-denominated, fixed-rate taxable bond market, including Treasuries, government-related and corporate securities, MBS (agency fixed-rate and hybrid ARM passthroughs), ABS, and CMBS. Securities must be rated investment-grade or higher using the middle rating of Moody’s, S&P and Fitch. When a rating from only two agencies is available, the lower is used. Information on this index is available at [email protected].
DISCLOSUREAll expressions of opinion reflect the judgment of Raymond James & Associates, Inc. and are subject to change. Past performance may not be indicative of future results. There is no assurance any of the trends mentioned will continue or forecasts will occur. The performance mentioned does not include fees and charges which would reduce an investor’s return. Dividends are not guaranteed and will fluctuate. Investing involves risk including the possible loss of capital. Asset allocation and diversification do not guarantee a profit nor protect against loss. Investing in certain sectors may involve additional risks and may not be appropriate for all investors.
International investing involves special risks, including currency fluctuations, different financial accounting standards, and possible political and economic volatility. Investing in emerging and frontier markets can be riskier than investing in well-established foreign markets.
Investing in small- and mid-cap stocks generally involves greater risks, and therefore, may not be appropriate for every investor.
There is an inverse relationship between interest rate movements and fixed income prices. Generally, when interest rates rise, fixed income prices fall and when interest rates fall, fixed income prices rise.
U.S. government bonds and Treasury bills are guaranteed by the U.S. government and, if held to maturity, offer a fixed rate of return and guaranteed principal value. U.S. government bonds are issued and guaranteed as to the timely payment of principal and interest by the federal government. Treasury bills are certificates reflecting short-term obligations of the U.S. government.
While interest on municipal bonds is generally exempt from federal income tax, they may be subject to the federal alternative minimum tax, or state or local taxes. In addition, certain municipal bonds (such as Build America Bonds) are issued without a federal tax exemption, which subjects the related interest income to federal income tax. Municipal bonds may be subject to capital gains taxes if sold or redeemed at a profit.
If bonds are sold prior to maturity, the proceeds may be more or less than original cost. A credit rating of a security is not a recommendation to buy, sell or hold securities and may be subject to review, revisions, suspension, reduction or withdrawal at any time by the assigning rating agency.
The yield curve is a graphic depiction of the relationship between the yield on bonds of the same credit quality but different maturities.
Commodities and currencies are generally considered speculative because of the significant potential for investment loss. They are volatile investments and should only form a small part of a diversified portfolio. Markets for precious metals and other commodities are likely to be volatile and there may be sharp price fluctuations even during periods when prices overall are rising.
Investing in REITs can be subject to declines in the value of real estate. Economic conditions, property taxes, tax laws and interest rates all present potential risks to real estate investments.
High-yield bonds are not suitable for all investors. The risk of default may increase due to changes in the issuer’s credit quality. Price changes may occur due to changes in interest rates and the liquidity of the bond. When appropriate, these bonds should only comprise a modest portion of your portfolio.
Beta compares volatility of a security with an index. Alpha is a measure of performance on a risk-adjusted basis.
The process of rebalancing may result in tax consequences.
Alternative investments involve specific risks that may be greater than those associated with traditional investments and may be offered only to clients who meet specific suitability requirements, including minimum net worth tests. Investors should consider the special risks with alternative investments including limited liquidity, tax considerations, incentive fee structures, potentially speculative investment strategies, and different regulatory and reporting requirements. Investors should only invest in hedge funds, managed futures, distressed credit or other similar strategies if they do not require a liquid investment and can bear the risk of substantial losses. There can be no assurance that any investment will meet its performance objectives or that substantial losses will be avoided.
The companies engaged in business related to a specific sector are subject to fierce competition and their products and services may be subject to rapid obsolescence.
The performance mentioned does not include fees and charges which would reduce an investor’s returns. The indexes are unmanaged and an investment cannot be made directly into them. The Dow Jones Industrial Average is an unmanaged index of 30 widely held securities. The NASDAQ Composite Index is an unmanaged index of all stocks traded on the NASDAQ over-the-counter market. The S&P 500 is an unmanaged index of 500 widely held securities. The Shanghai Composite Index tracks the daily price performance of all A-shares and B-shares listed on the Shanghai Stock Exchange.
MODEL DEFINITIONSConservative Portfolio: may be appropriate for investors with long-term income distribution needs who are sensitive to short-term losses yet want to achieve some capital appreciation. The equity portion of this portfolio generates capital appreciation, which is appropriate for investors who are sensitive to the effects of market fluctuation but need to sustain purchasing power. This portfolio, which has a higher weighting in bonds than in stocks, seeks to keep investors ahead of the effects of inflation with an eye toward maintaining principal stability.
Moderate Conservative Portfolio: may be appropriate for investors with intermediate-term time horizons who are sensitive to short-term losses yet want to participate in the long-term growth of the financial markets. The portfolio, which has an equal weighting in stocks and bonds, seeks to keep investors well ahead of the effects of inflation with an eye toward maintaining principal stability. The portfolio has return and short-term loss characteristics that may deliver returns lower than that of the broader market with lower levels of risk and volatility.
Moderate Portfolio: may be appropriate for investors with intermediate-term time horizons who are sensitive to short-term losses yet want to participate in the long-term growth of the financial markets. This portfolio, which has a higher weighting in stocks, seeks to keep investors well ahead of the effects of inflation with an eye toward maintaining principal stability. The portfolio has return and short-term loss characteristics that may deliver returns lower than that of the broader equity market with lower levels of risk and volatility.
Moderate Growth Portfolio: may be appropriate for investors with long-term time horizons who are not sensitive to short-term losses and want to participate in the long-term growth of the financial markets. This portfolio, which has a higher weighting in stocks seeks to keep investors well ahead of the effects of inflation with principal stability as a secondary consideration. The portfolio has return and short-term loss characteristics that may deliver returns slightly lower than that of the broader equity market with slightly lower levels of risk and volatility.
Growth Portfolio: may be appropriate for investors with long-term time horizons who are not sensitive to short-term losses and want to participate in the long-term growth of the financial markets. This portfolio, which has 100% in stocks, seeks to keep investors well ahead of the effects of inflation with little regard for maintaining principal stability. The portfolio has return and short-term loss characteristics that may deliver returns comparable to those of the broader equity market with similar levels of risk and volatility.

INTERNATIONAL HEADQUARTERS: THE RAYMOND JAMES FINANCIAL CENTER
880 CARILLON PARKWAY // ST. PETERSBURG, FL 33716 // 800.248.8863
RAYMONDJAMES.COM
Investment products are: not deposits, not FDIC/NCUA insured, not insured by any government agency, not bank guaranteed, subject to risk and may lose value. © 2018 Raymond James Financial Services, Inc., member FINRA/SIPC © 2018 Raymond James & Associates, Inc., member New York Stock Exchange/SIPC. 17-BDMKT-2754 JW/BS/CW 01/18