investment responses to trade liberalization:...
TRANSCRIPT
Investment Responses to Trade
Liberalization: Evidence from U.S. Industries
and Establishments∗
Justin R. Pierce†
Board of Governors of the Federal Reserve System
Peter K. Schott‡
Yale School of Management & NBER
First Draft: October 2017
This Draft: November 2017
Abstract
This paper examines the e�ect of a change in U.S. trade policy on the domestic
investment of U.S. manufacturers. Using a di�erence-in-di�erences identi�cation
strategy, we �nd that industries more exposed to reductions in import tari� un-
certainty exhibit relative declines in investment after the change in trade policy.
Within industries, we �nd that this relationship is concentrated among estab-
lishments with low initial levels of labor productivity, capital intensity and skill
intensity. Plants with high initial levels of skill intensity, by contrast, exhibit
relative increases in investment with exposure. We also �nd evidence that estab-
lishments' investment activity is smoother following the policy change. Keywords:
Investment; Trade Policy; Manufacturing; China; Normal Trade Relations; MFN
∗Any opinions and conclusions expressed herein are those of the authors and do not necessarilyrepresent the views of the U.S. Census Bureau, the Board of Governors or its research sta�. Allresults have been reviewed to ensure that no con�dential information has been disclosed. We thankDave Donaldson, Gordon Hanson, Colin Hottman, Stephen Redding and seminar audiences at theNBER and Georgetown for suggestions and Travis Adams and Emily Wisniewski for helpful researchassistance.†20th & C Streets NW, Washington, DC 20551, tel: (202) 452-2980, email: [email protected].‡165 Whitney Avenue, New Haven, CT 06511, tel: (203) 436-4260, email: [email protected].
1 Introduction
The U.S. manufacturing sector has undergone profound changes since the turn of the
century, when a shift in U.S. trade policy increased import competition from China.
While a range of studies link this trade liberalization to employment loss and establish-
ment exit, less is known about the extent to which survivors adapt by investing in new
production processes or product upgrades.1 Greater understanding of such reactions is
particularly relevant in the current policy environment, where the 2016 U.S. Presiden-
tial election and the U.K.'s vote to exit the European Union have created considerable
uncertainty among producers in some of the world's largest markets.
In this paper, we examine how the domestic investment and capital stocks of U.S.
manufacturing establishments respond to the October, 2000 U.S. granting of Perma-
nent Normal Trade Relations to China (PNTR), a trade liberalization that removed
the threat of substantial U.S. import tari� increases on Chinese goods. By eliminating
this cost uncertainty, PNTR provided U.S. producers with greater incentives to invest
in �nding Chinese suppliers, moving production from the United States to China, or
otherwise increasing their competitiveness in the face of rising Chinese import compe-
tition. We use industry- and establishment-level data on domestic investment by U.S.
manufacturers to examine the latter channel.2
Our empirical analysis takes place in three steps. First, we examine the rela-
tionship between exposure to PNTR and both investment and capital stocks at the
industry-level. Second, we use con�dential U.S. Census Bureau microdata to exam-
ine how individual establishments adjust investment in response to PNTR, with a
particular focus on heterogeneous responses along a broad range of establishment-level
attributes. The industry analysis serves as an important benchmark for our subsequent
analysis of establishments because the expected impact of trade liberalization at the
establishment-level is ambiguous: some plants may shrink or exit, lowering investment,
while others may alter their production processes in ways that increase investment.3
1Consider, for example, this anecdote from a recent article in the Wall Street Journal (Michaels(2017)), quoted in Fort, Pierce, and Schott (2017): �When Drew Greenblatt bought Marlin SteelWire Products LLC, a small Baltimore maker of wire baskets for bagel shops, he knew nothing aboutrobotics. That was 1998, and workers made products manually using 1950s equipment....Pushed nearinsolvency by Chinese competition in 2001, he started investing in automation. Since then, Marlinhas spent $5.5 million on modern equipment. Its revenue, sta� and wages have surged and it nowexports to China and Mexico.�
2In prior research (Pierce and Schott (2016)), we show that goods more exposed to PNTR exhibitsubstantial relative increases in U.S. imports from China as well as the number of U.S. �rms thatimport from China, the number of Chinese �rms that export to the United States, and the numberof U.S.-Chinese �rm pairs engaged in a trading relationship. One interpretation of these outcomesis that they re�ect investment in trading relationships that was unleashed by the elimination of costuncertainty.
3Pierce and Schott (2012) show that industries with greater exposure to PNTR exhibit relativelyhigher job destruction due to plant and �rm exit and relatively lower job creation due to suppressedplant and �rm entry.
1
Finally, motivated by models of investment under uncertainty, we investigate the tim-
ing, frequency, and lumpiness of establishments' investment before and after the change
in trade policy.
We employ a generalized di�erences-in-di�erences (DID) identi�cation strategy that
estimates how investment and capital stocks change after the granting of PNTR for in-
dustries and establishments with varying levels of exposure. The baseline speci�cation
includes controls for other factors that may a�ect investment in manufacturing during
our sample period, including changes in Chinese trade policy that occur as part of
China's accession to the WTO (e.g. liberalization of export licensing), the phasing out
of the global Multi-Fiber Arrangement governing quotas on developing-country textile
and clothing exports, and changes in the relationship between investment and industry
characteristics � such as capital and skill intensity � that may be correlated spuriously
with the trade liberalization.
At the industry-level, we �nd that greater exposure to PNTR is associated with a
relative decline in investment, and that the timing of the decline corresponds closely
to PNTR's implementation. We �nd little evidence of such a response with respect to
the capital stock, however, an outcome that may be due to the relatively slow response
of capital stocks to changes in investment �ows.
Our establishment-level analysis focuses on the investment activity of continuing
plants observed in the quinquennial U.S. Census of Manufactures (CM). We �nd
that plant-level responses to PNTR vary according to their pre-PNTR characteris-
tics. Speci�cally, while PNTR is associated with a relative decline in investment for
the average plant, establishments with higher initial levels of labor productivity and
capital intensity exhibit little to no relative decline, and plants with the highest levels
of initial skill intensity exhibit a positive relationship between exposure to the trade
liberalization and relative investment. The relatively high investment associated with
skill- and capital intensive plants is consistent with U.S. comparative advantage.
To assess the potential e�ects of PNTR's reduction of uncertainty on the frequency
and smoothness of plants' investment, we use data from the Annual Survey of Man-
ufactures (ASM) to compute the average, standard deviation and share of years with
positive investment across years leading up to and after the change in policy. Here,
too, accounting for heterogeneity in establishment responses is important. In speci�ca-
tions that control for plants' initial characteristics, we �nd that, for the average plant,
larger reductions in tari� rate uncertainty are associated with relative reductions in the
standard deviation of investment, though these reductions are not present for plants
with initially high levels of productivity.
Our �ndings make three contributions to the literature. First, they provide a
broader view of the impact of trade liberalization on �rms. While negative relation-
ships between import competition and employment are well-known, especially for the
period we are considering (Autor, Dorn, and Hanson (2013); Pierce and Schott (2016)),
our �nding that higher exposure to PNTR is associated with lower industry-level in-
2
vestment helps explain the reduction in overall manufacturing investment and the
�attening of the capital stock that has been noted elsewhere (Kurz and Morin (2016)).
Furthermore, to the extent that depressed investment has dynamic e�ects on employ-
ment, our �ndings provide insight into the potential persistence of weak employment
and earnings growth in the years following a liberalization.
Second, our results highlight the potential heterogeneity of responses to trade lib-
eralization across plants within similarly exposed industries, and identi�es the charac-
teristics of establishments � including low labor productivity and high labor intensity �
that are associated with relatively greater declines in investment in the face of increased
import competition. These results relate to the large literature studying the impact of
competition on innovation and investment (e.g., Aghion, Bloom, Blundell, Gri�th, and
Howitt (2005)). In this respect our research is most closely related to Gutierrez and
Philippon (2017)), which uses publicly available data from Compustat to show that
increased exposure to PNTR induces relative increases in investment among �leader�
�rms, de�ned as �rms with high market to book value. Compared to that paper,
our contribution is twofold. First, we consider the full population of manufacturing
establishments, as opposed to the publicly traded �rms present in Compustat. Sec-
ond, we examine a wider range of �rm attributes � such as capital and skill intensity
and productivity � that capture other dimensions of �leadership,� i.e., consistency with
U.S. comparative advantage. Furthermore, our �ndings also add additional context
to recent research �nding evidence in favor of trade-induced technical change (Bloom,
Draca, and Reenen (2016)) and a negative relationship between import competition
and innovation (Autor, Dorn, Hanson, Pisano, and Shu (2016)) among �rms in the UK
and United States, respectively, facing import competition from China.
Finally, we contribute to the relatively small number of empirical studies associated
with the large theoretical literature on investment under uncertainty (Pindyck (1993);
Rob and Vettas (2003)). Finding plausibly exogenous shocks to uncertainty is an im-
portant challenge in in these studies and several papers, including Guiso and Parigi
(1999), Schwartz and Zozaya-Gorostiza (2003), and Bloom, Bond, and Van Reenen
(2007), have estimated such shocks using surveys, cost data for speci�c information
technology investments, or detailed information from �rms' annual reports. Here,
PNTR provides a large and plausibly exogenous shock to establishments' cost uncer-
tainty, and we identify e�ects on investment that are consistent with Bloom, Bond,
and Van Reenen (2007).4
The paper proceeds as follows: Section 2 describes the data, Section 3 describes
our empirical strategy and presents industry-level results. Section 4 presents the
establishment-level analysis and and Section 5 concludes.
4For other studies on uncertainty in trade, see Handley (2014) and Handley and Limao (2017).
3
2 Data
2.1 Establishment- and Industry-Level Investment Data
Establishment-level investment and capital stock data are drawn from the U.S. Census
Bureau's con�dential Census of Manufactures (CM) and Annual Survey of Manufac-
tures (ASM). In both cases, the Census Bureau asks manufacturing establishments to
break down their capital expenditures into two categories � structures and equipment �
as well as to report their total capital expenditures. The CM collects this information,
as well as data on other establishment attributes, including employment, shipments
and value added, on every U.S. manufacturing establishment (i.e., plant) quinquenni-
ally in years ending in two and seven. In all of our analyses using the CM, we follow
standard practice in excluding all administrative records, i.e., observations for which
most of the key variables of interest are imputed.
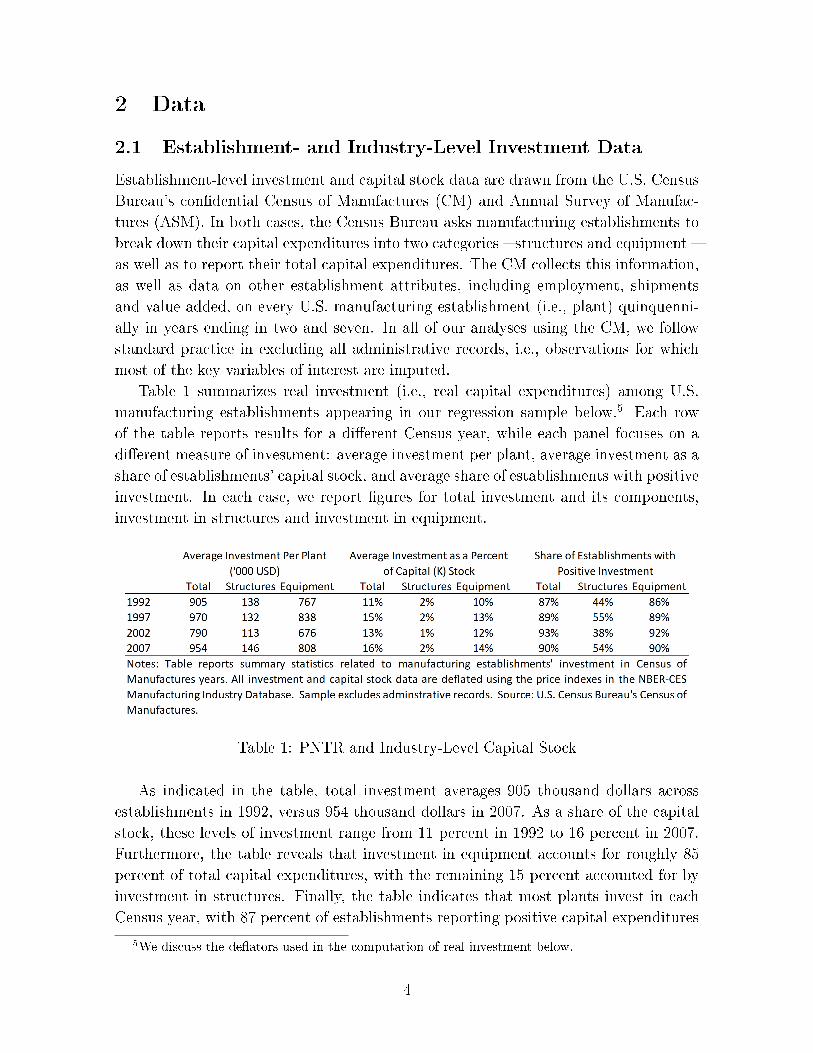
Table 1 summarizes real investment (i.e., real capital expenditures) among U.S.
manufacturing establishments appearing in our regression sample below.5 Each row
of the table reports results for a di�erent Census year, while each panel focuses on a
di�erent measure of investment: average investment per plant, average investment as a
share of establishments' capital stock, and average share of establishments with positive
investment. In each case, we report �gures for total investment and its components,
investment in structures and investment in equipment.
Table 1: PNTR and Industry-Level Capital Stock
As indicated in the table, total investment averages 905 thousand dollars across
establishments in 1992, versus 954 thousand dollars in 2007. As a share of the capital
stock, these levels of investment range from 11 percent in 1992 to 16 percent in 2007.
Furthermore, the table reveals that investment in equipment accounts for roughly 85
percent of total capital expenditures, with the remaining 15 percent accounted for by
investment in structures. Finally, the table indicates that most plants invest in each
Census year, with 87 percent of establishments reporting positive capital expenditures
5We discuss the de�ators used in the computation of real investment below.
4
in 1992 and 90 percent reporting investment in 2007. Investments in equipment are
much more common than investment in structures, with the latter occurring at 44
percent of establishments in 1992 and 54 percent of establishments in 2007.
For the portion of our analysis where we investigate attributes of investment that
must be estimated across time � e.g., the standard deviation of investment or average
investment per year � we require higher-frequency data than is available in the CM. We
therefore augment the CM data with annual data from the ASM. However, because the
ASM collects information from only a subset of plants, we must restrict our analysis
to the establishments that are surveyed in every year across our 1992 to 2007 sample
period.6 While this sample is restricted, these long-lived plants typically account for a
disproportionately large share of activity in the manufacturing sector.
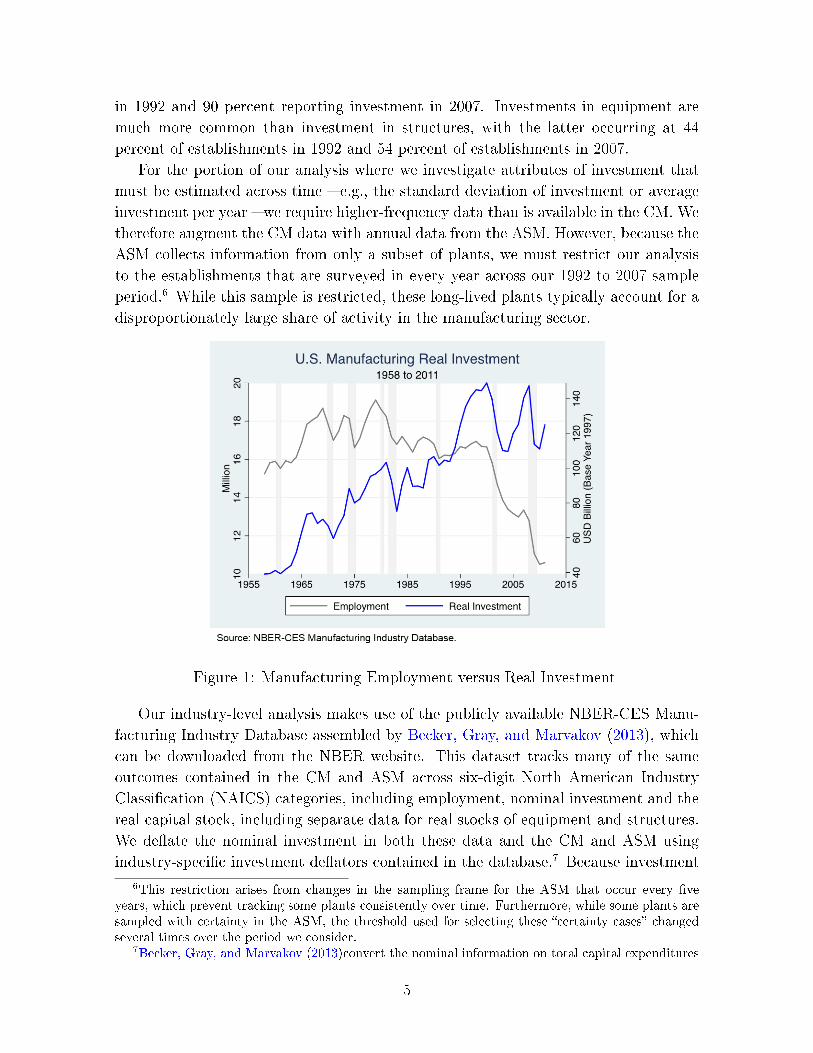
Figure 1: Manufacturing Employment versus Real Investment
Our industry-level analysis makes use of the publicly available NBER-CES Manu-
facturing Industry Database assembled by Becker, Gray, and Marvakov (2013), which
can be downloaded from the NBER website. This dataset tracks many of the same
outcomes contained in the CM and ASM across six-digit North American Industry
Classi�cation (NAICS) categories, including employment, nominal investment and the
real capital stock, including separate data for real stocks of equipment and structures.
We de�ate the nominal investment in both these data and the CM and ASM using
industry-speci�c investment de�ators contained in the database.7 Because investment
6This restriction arises from changes in the sampling frame for the ASM that occur every �veyears, which prevent tracking some plants consistently over time. Furthermore, while some plants aresampled with certainty in the ASM, the threshold used for selecting these �certainty cases� changedseveral times over the period we consider.
7Becker, Gray, and Marvakov (2013)convert the nominal information on total capital expenditures
5
is not broken out by equipment versus structures in the NBER-CES database, we
construct this breakdown ourselves using publicly available versions of the Census of
Manufactures (CM) and Annual Survey of Manufactures (ASM) available on the Cen-
sus Bureau's website.8
Figure 1 shows that total real investment by U.S. manufacturing �rms in equipment
and structures rises faster than trend in the late 1990s before falling substantially in
the early 2000s. Indeed, the decline in manufacturing investment from 1999 to 2003
is roughly equal to the decline experienced during the much-deeper Great Recession.
As a result, the manufacturing real capital stock fell from 2003 to 2004, the �rst time
it had registered a decline since the data have been tracked (Kurz and Morin (2016)).
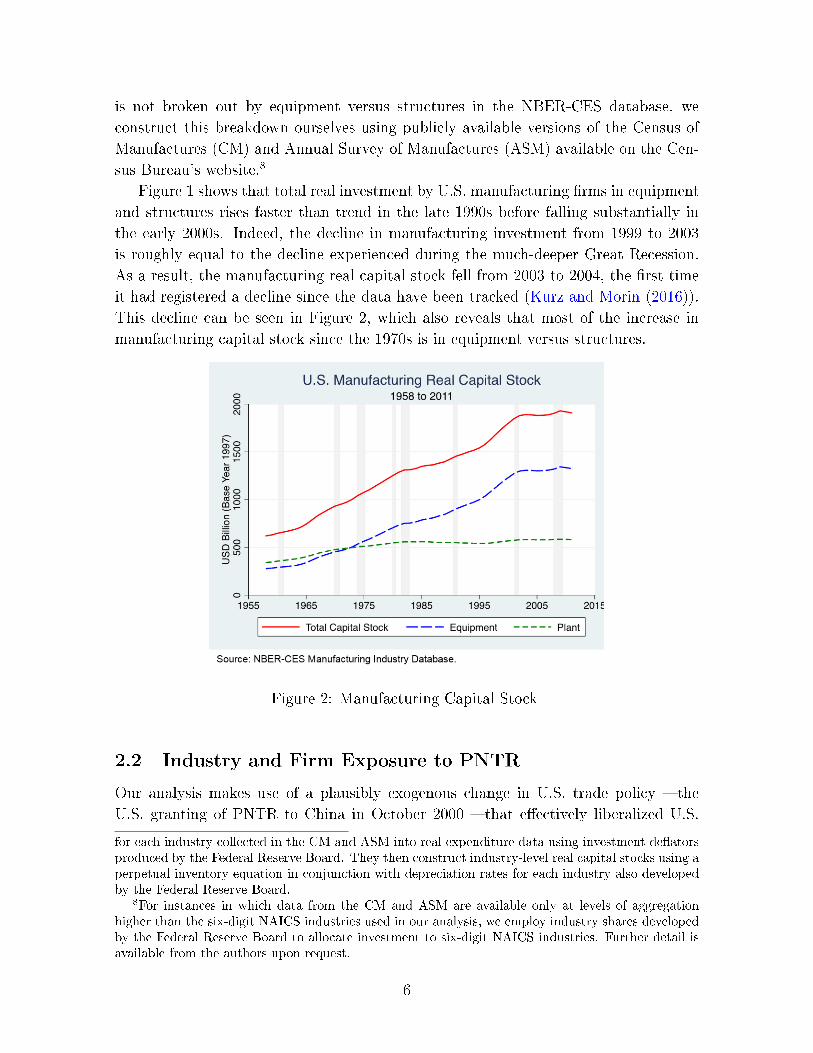
This decline can be seen in Figure 2, which also reveals that most of the increase in
manufacturing capital stock since the 1970s is in equipment versus structures.
Figure 2: Manufacturing Capital Stock
2.2 Industry and Firm Exposure to PNTR
Our analysis makes use of a plausibly exogenous change in U.S. trade policy � the
U.S. granting of PNTR to China in October 2000 � that e�ectively liberalized U.S.
for each industry collected in the CM and ASM into real expenditure data using investment de�atorsproduced by the Federal Reserve Board. They then construct industry-level real capital stocks using aperpetual inventory equation in conjunction with depreciation rates for each industry also developedby the Federal Reserve Board.
8For instances in which data from the CM and ASM are available only at levels of aggregationhigher than the six-digit NAICS industries used in our analysis, we employ industry shares developedby the Federal Reserve Board to allocate investment to six-digit NAICS industries. Further detail isavailable from the authors upon request.
6
imports from China. This impact can be understood by considering the two sets of
tari� rates that comprise the U.S. tari� schedule. The �rst set of tari�s, known as
NTR tari�s, are generally low and are applied to goods imported from other members
of the World Trade Organization (WTO). The second, known as non-NTR tari�s,
were set by the Smoot-Hawley Tari� Act of 1930 and are often substantially higher
than the corresponding NTR rates. Imports from non-market economies such as China
generally are subject to the higher non-NTR rates, but U.S. law allows the President to
grant these countries access to NTR rates on a year-by-year basis, with the President's
decision subject to potential overruling by Congress.
U.S. Presidents granted China such a waiver every year starting in 1980, but Con-
gressional votes over annual renewal became politically contentious and less certain of
passage following the Chinese government's crackdown on Tiananmen Square protests
in 1989 and other �ashpoints in U.S.-China relations during the 1990s such as China's
transfer of missile technology to Pakistan in 1993 and the Taiwan Straits Missile Crisis
in 1996. Uncertainty over China's access to NTR tari� rates ended with Congress
passing a bill granting PNTR status to China in October, 2000, which formally took
e�ect upon China's entry into the WTO in December 2001.
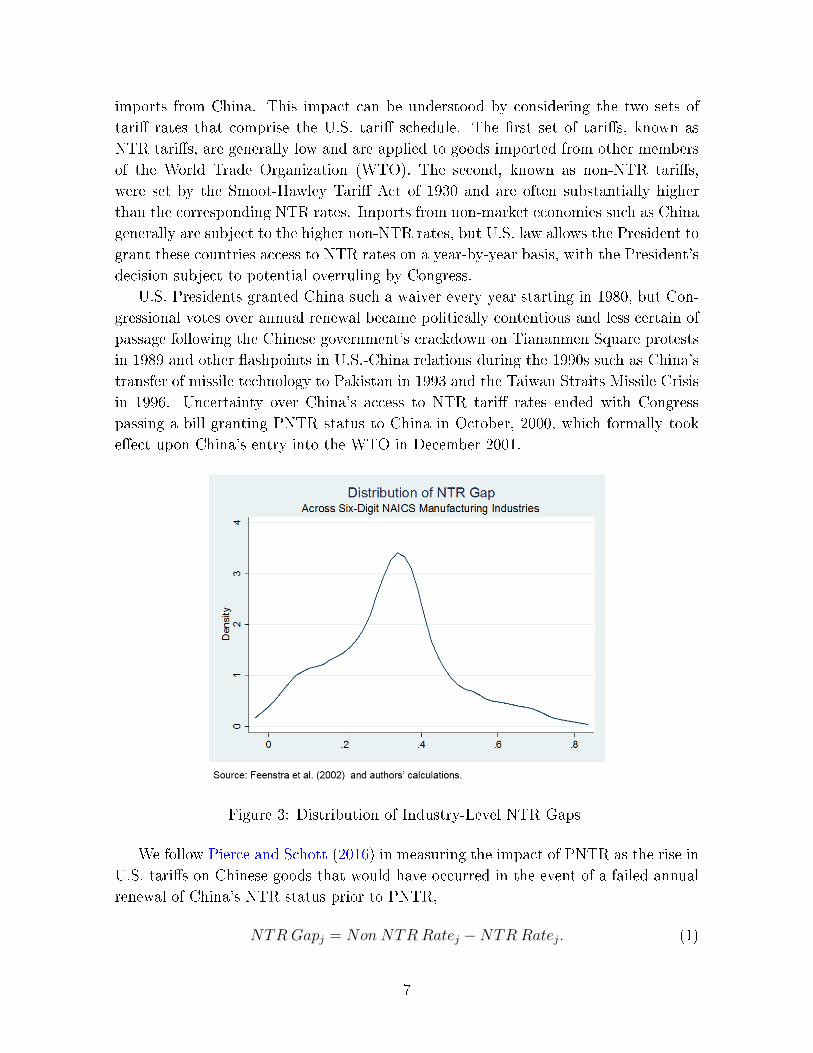
Figure 3: Distribution of Industry-Level NTR Gaps
We follow Pierce and Schott (2016) in measuring the impact of PNTR as the rise in
U.S. tari�s on Chinese goods that would have occurred in the event of a failed annual
renewal of China's NTR status prior to PNTR,
NTR Gapj = Non NTR Ratej −NTR Ratej. (1)
7
We refer to this di�erence as the NTR gap, and compute it for each SIC industry
j using ad valorem equivalent tari� rates provided by Feenstra, Romalis, and Schott
(2002) for 1999, the year before passage of PNTR. As indicated in Figure 3, which
reports the distribution of NTR gaps across six-digit NAICS industries, NTR gaps
vary widely, with a mean and standard deviation of 30 and 14 percentage points, with
an interquartile range of 0.21 to 0.40. Analysis of the underlying NTR and non-NTR
rates in Pierce and Schott (2016) reveals that seventy-nine percent of the variation
in the NTR gap across industries is due to variation in non-NTR rates, set 70 years
prior to passage of PNTR. This feature of non-NTR rates e�ectively rules out reverse
causality that would arise if non-NTR rates were set to protect industries with declining
employment or surging imports. Furthermore, to the extent that NTR rates were set
to protect industries with declining employment prior to PNTR, these higher NTR
rates would result in lower NTR gaps, biasing our results away from �nding an e�ect
of PNTR.
2.3 Other Policy Variables
Our empirical analysis includes controls for a wide range of additional factors that
may a�ect U.S. manufacturing investment. First, we allow for the possibility that the
relationship between certain industry-level characteristics and investment may have
changed around the time of PNTR's passage. For example, a decline in the competi-
tiveness of labor intensive industries in the United States or the decline of unions may
have disproportionately a�ected certain industries. We control for these explanations
by including interactions of a post-PNTR indicator with initial values of industry capi-
tal and skill intensity and the industry-level share of union membership in 1990 (Hirsch
and Macpherson (2003)).
We also control for changes in Chinese domestic and trade policies related to its
accession to the WTO. These changes include reductions in export licensing require-
ments, production subsidies and import tari� rates. Our controls draw on data from
work on export licensing requirements by Bai, Krishna, and Ma (2015), on production
subsidies from Khandelwal, Schott, and Wei (2013), and on Chinese import tari� rates
from Brandt, Van Biesebroeck, Wang, and Zhang (2017). To account for the fact that
reductions in barriers to foreign investment in China also declined at this time, we
control for the share of industry inputs requiring relationship-speci�city from Nunn
(2007).
Finally, we control for other policy and macroeconomic shifts occurring in the U.S.
around 2000. The �rst of these changes is the bursting of the 1990s tech bubble, which
we control for with the interaction of the post-PNTR indicator with an indicator for
whether the industry is engaged in the production of advanced technology products, as
de�ned by the International Trade Commission. In addition, we control for the elimina-
tion of quotas associated with the phasing out of the global Multi-Fiber Arrangement
8
(Khandelwal, Schott, and Wei (2013)).
3 PNTR and Industry-Level Investment
As indicated in the large literature on the impact of competition on innovation and
investment (e.g., Aghion, Bloom, Blundell, Gri�th, and Howitt (2005)), the relation-
ship between PNTR and investment is theoretically ambiguous. Some establishments
might step up investment in their U.S. operations in an e�ort to increase competitive-
ness vis a vis rising imports, while others might choose to exit the market, or cease
domestic production in favor of production abroad. In this section we set the stage
for our establishment-level analysis below by examining the aggregate impact of these
decisions on investment at the industry level.
Our baseline di�erence-in-di�erences (DID) speci�cation examines whether indus-
tries with higher NTR gaps (�rst di�erence) experience di�erential changes in invest-
ment after the change in U.S. trade policy (second di�erence) versus before,
yjt = θPost PNTRt × NTRGapj + (2)
βXjt + γPost PNTRt×Xj +
δj + δt + εjt.
The sample period for the industry analysis is 1990 to 2007. The dependent variable,
yjt, represents an outcome in industry j, for example log investment. The �rst term
on the right hand side is the DID term of interest, an interaction of the NTR gap
and an indicator for the post-PNTR period, i.e., years from 2001 forward. The second
term on the right-hand side of equation 2 captures the impact of time-varying industry
characteristics, such as exposure to MFA quota reductions and the NTR tari� rate.
The third term on the right hand side is an interaction of the post-PNTR dummy
variable and time-invariant industry characteristics, such as initial industry capital
and skill intensity, the degree to which industries encompass high-technology products
and the extent of initial union membership in the industry. These interactions allow
for the possibility that the relationship between employment and these characteristics
changes in the post-PNTR period in ways that might spuriously be related to the trade
liberalization. δj, δt and α represent industry and year �xed e�ects and the constant.
An attractive feature of this DID identi�cation strategy is its ability to isolate the
role of the change in U.S. trade policy. While industries with high and low NTR
gaps are not identical, comparing outcomes within industries over time isolates the
di�erential impact of China's change in NTR status.
The �rst three columns of Table 2 report results for our main variable of interest,
9
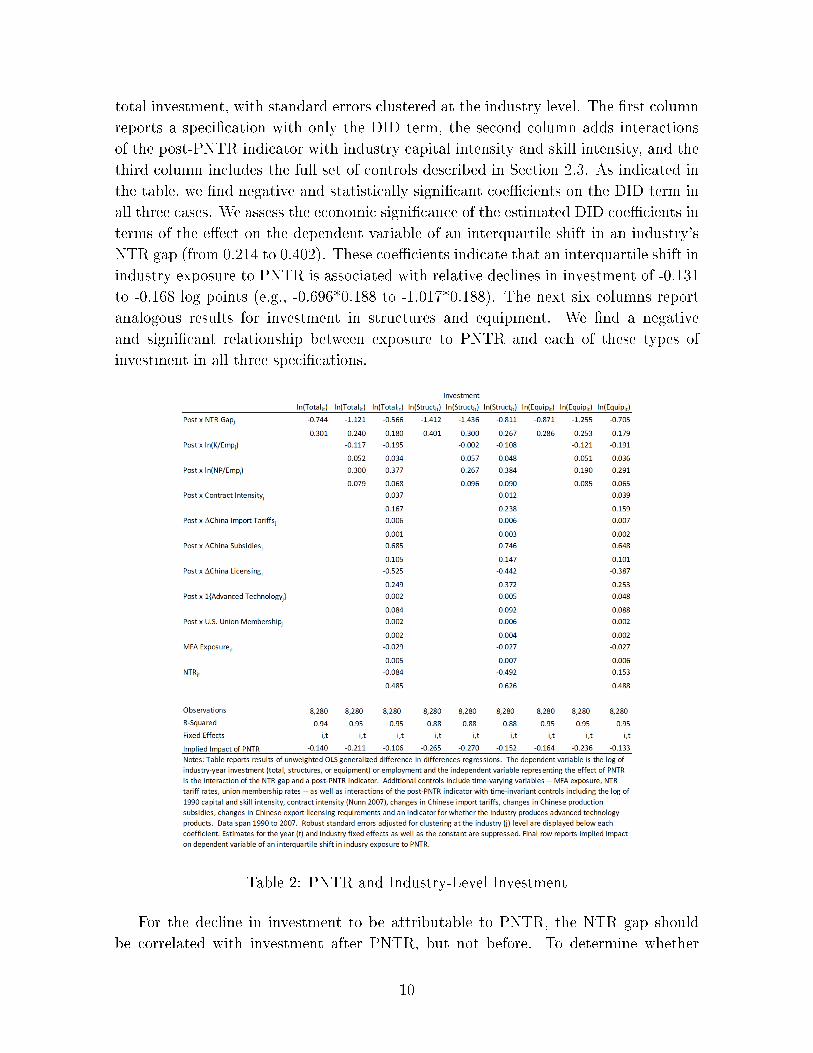
total investment, with standard errors clustered at the industry level. The �rst column
reports a speci�cation with only the DID term, the second column adds interactions
of the post-PNTR indicator with industry capital intensity and skill intensity, and the
third column includes the full set of controls described in Section 2.3. As indicated in
the table, we �nd negative and statistically signi�cant coe�cients on the DID term in
all three cases. We assess the economic signi�cance of the estimated DID coe�cients in
terms of the e�ect on the dependent variable of an interquartile shift in an industry's
NTR gap (from 0.214 to 0.402). These coe�cients indicate that an interquartile shift in
industry exposure to PNTR is associated with relative declines in investment of -0.131
to -0.168 log points (e.g., -0.696*0.188 to -1.017*0.188). The next six columns report
analogous results for investment in structures and equipment. We �nd a negative
and signi�cant relationship between exposure to PNTR and each of these types of
investment in all three speci�cations.
Table 2: PNTR and Industry-Level Investment
For the decline in investment to be attributable to PNTR, the NTR gap should
be correlated with investment after PNTR, but not before. To determine whether
10
there is a relationship between these variables in the years before 2001, we replace the
PostPNTR indicator used in equation 2 with interactions of the NTR Gap and the
full set of year dummies,
yjt =2007∑
y=1991
(θy1{y = t} ×NTR Gapj) + (3)
2007∑y=1991
(λy1{y = t} ×Xj) +
βXjt + δj + δt + α + εit.
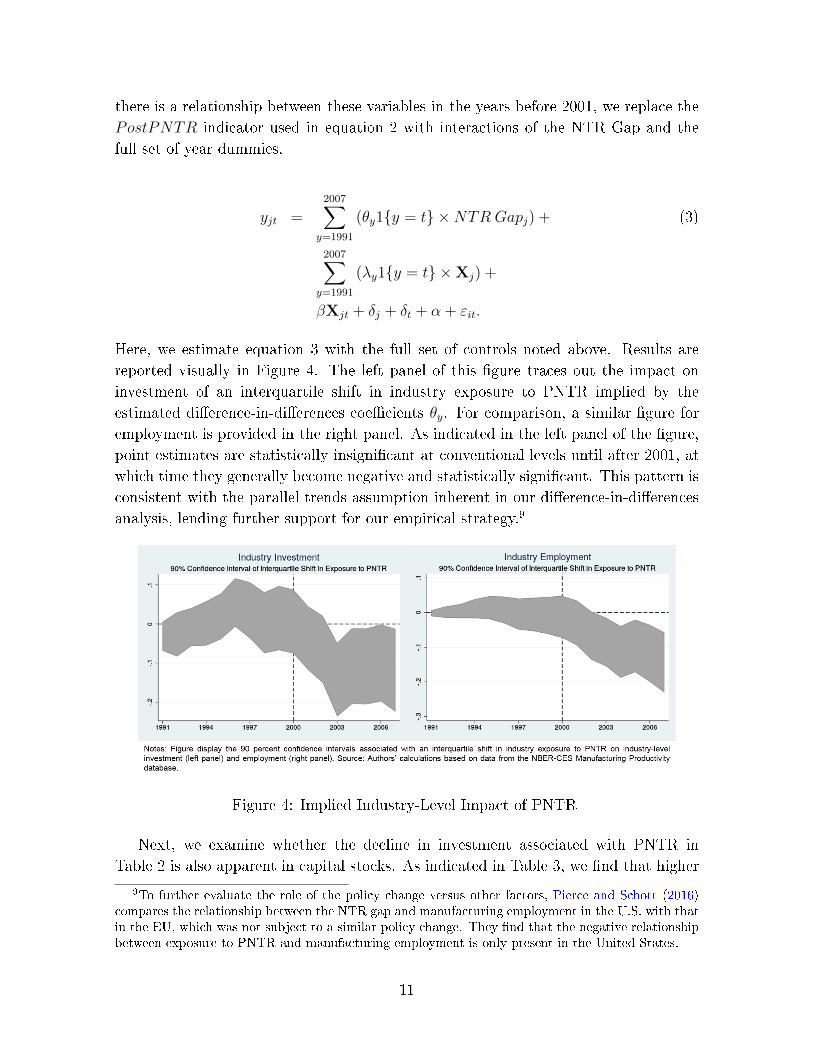
Here, we estimate equation 3 with the full set of controls noted above. Results are
reported visually in Figure 4. The left panel of this �gure traces out the impact on
investment of an interquartile shift in industry exposure to PNTR implied by the
estimated di�erence-in-di�erences coe�cients θy. For comparison, a similar �gure for
employment is provided in the right panel. As indicated in the left panel of the �gure,
point estimates are statistically insigni�cant at conventional levels until after 2001, at
which time they generally become negative and statistically signi�cant. This pattern is
consistent with the parallel trends assumption inherent in our di�erence-in-di�erences
analysis, lending further support for our empirical strategy.9
Figure 4: Implied Industry-Level Impact of PNTR
Next, we examine whether the decline in investment associated with PNTR in
Table 2 is also apparent in capital stocks. As indicated in Table 3, we �nd that higher
9To further evaluate the role of the policy change versus other factors, Pierce and Schott (2016)compares the relationship between the NTR gap and manufacturing employment in the U.S. with thatin the EU, which was not subject to a similar policy change. They �nd that the negative relationshipbetween exposure to PNTR and manufacturing employment is only present in the United States.
11
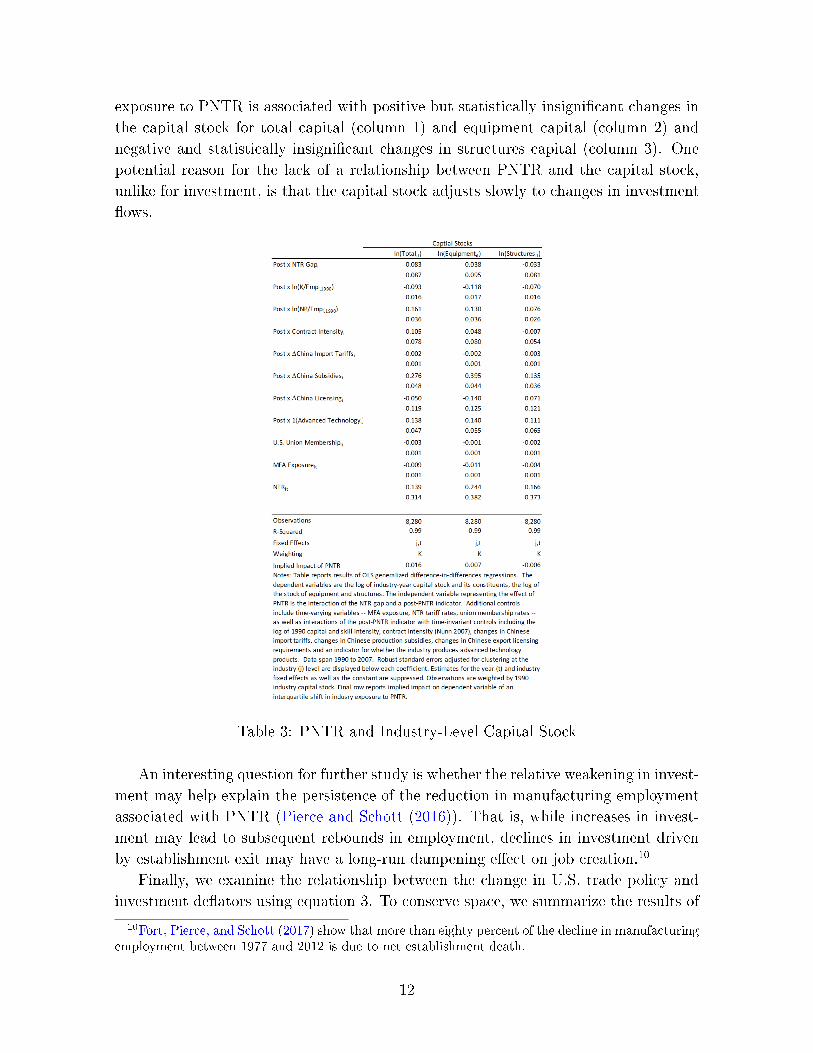
exposure to PNTR is associated with positive but statistically insigni�cant changes in
the capital stock for total capital (column 1) and equipment capital (column 2) and
negative and statistically insigni�cant changes in structures capital (column 3). One
potential reason for the lack of a relationship between PNTR and the capital stock,
unlike for investment, is that the capital stock adjusts slowly to changes in investment
�ows.
Table 3: PNTR and Industry-Level Capital Stock
An interesting question for further study is whether the relative weakening in invest-
ment may help explain the persistence of the reduction in manufacturing employment
associated with PNTR (Pierce and Schott (2016)). That is, while increases in invest-
ment may lead to subsequent rebounds in employment, declines in investment driven
by establishment exit may have a long-run dampening e�ect on job creation.10
Finally, we examine the relationship between the change in U.S. trade policy and
investment de�ators using equation 3. To conserve space, we summarize the results of
10Fort, Pierce, and Schott (2017) show that more than eighty percent of the decline in manufacturingemployment between 1977 and 2012 is due to net establishment death.
12
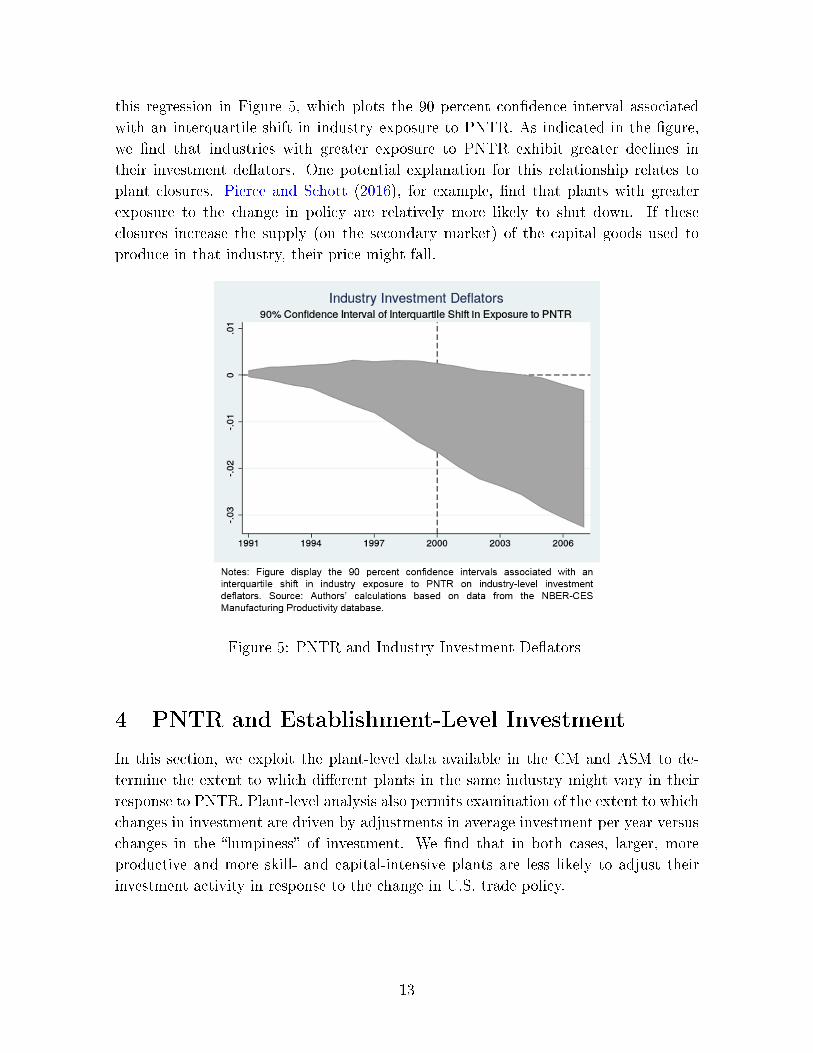
this regression in Figure 5, which plots the 90 percent con�dence interval associated
with an interquartile shift in industry exposure to PNTR. As indicated in the �gure,
we �nd that industries with greater exposure to PNTR exhibit greater declines in
their investment de�ators. One potential explanation for this relationship relates to
plant closures. Pierce and Schott (2016), for example, �nd that plants with greater
exposure to the change in policy are relatively more likely to shut down. If these
closures increase the supply (on the secondary market) of the capital goods used to
produce in that industry, their price might fall.
Figure 5: PNTR and Industry Investment De�ators
4 PNTR and Establishment-Level Investment
In this section, we exploit the plant-level data available in the CM and ASM to de-
termine the extent to which di�erent plants in the same industry might vary in their
response to PNTR. Plant-level analysis also permits examination of the extent to which
changes in investment are driven by adjustments in average investment per year versus
changes in the �lumpiness� of investment. We �nd that in both cases, larger, more
productive and more skill- and capital-intensive plants are less likely to adjust their
investment activity in response to the change in U.S. trade policy.
13
4.1 Baseline Plant-level Estimates
We begin by examining the average investment responses of plants to PNTR without
including terms that might account for within-industry heterogeneity. We use data
from the CM, which covers the population of manufacturing establishments and is
available every �ve years. Our sample is composed of observations from the 1992,
1997, 2002 and 2007 CMs and this baseline speci�cation is as follows,
ypt = θPost PNTRt × NTRGapj + (4)
γPost PNTRt×Xj + βXjt +
+δp + δt + α + εpt.
where p indexes establishments, j indexes industries and t indexes years. The depen-
dent variable is one of three real investment shares � total investment (i.e., total capital
expenditures), investment in equipment, or investment in structures, where each is di-
vided by the establishment's capital stock � or the log value of the capital stock. The
�rst term on the right-hand side is the DID term representing the e�ect of PNTR,
and it consists of the interaction of a Post PNTRt indicator and the time-invariant
NTRGapj. The next two terms represent the additional control variables used in
Equation2. The remaining terms represent plant and year �xed e�ects. Note that
this speci�cation yields within-plant estimates of the relationship between exposure to
PNTR and capital expenditures, but does not account for changes in investment driven
by establishment entry and exit.
The �rst two columns of Table 4 report the results of estimating equation 4, �rst
with only the DID term of interest and the �xed e�ects required for its identi�ca-
tion (column 1), and then with the full set of covariates (column 2). We �nd that
while the relationship between exposure to PNTR and total investment is negative,
as in the industry-level estimates discussed above, it is not statistically signi�cant at
conventional levels. The next six columns indicate similar negative but statistically in-
signi�cant relationships for the two broad categories of investment shares � equipment
and structures � as well as for the log real book value of capital. The overall message
of Table 4 is that the relationship between exposure to PNTR and investment within
continuing plants is negative but not precisely estimated.
We note that establishment-level results in Table 4 di�er from the industry-level
estimates in Table 2 for two reasons. First, the samples are di�erent.11 Second, the
11The samples are di�erent in three ways. First, inclusion of plant �xed e�ects in the establishment-level analysis means that identi�cation is restricted to within-establishment variation, thereby exclud-ing the impact of establishment exit, which is substantial during this period (Fort, Pierce, and Schott(2017); Pierce and Schott (2012)). Second, these �xed e�ects also exclude plants that are not presentin both the pre- and post-PNTR periods. Finally, the establishment-level regressions are restricted toCensus years � 1992, 1997, 2002 and 2007 � while the industry-level sample includes data for every
14
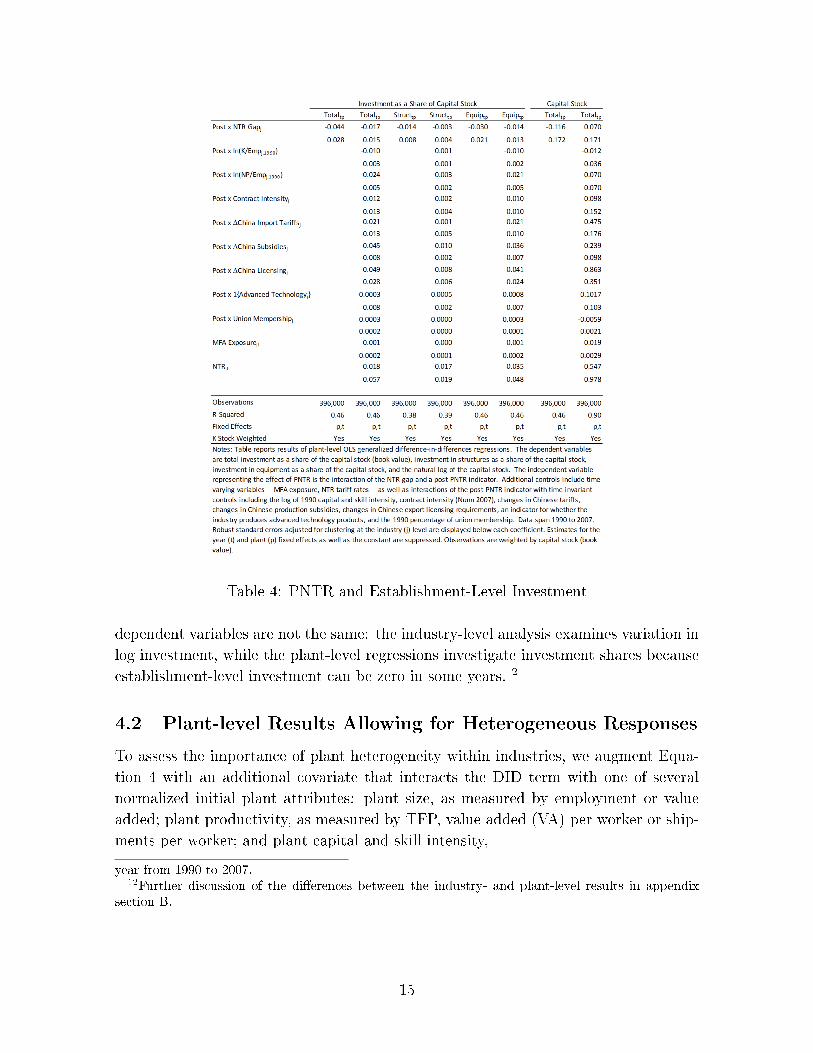
Table 4: PNTR and Establishment-Level Investment
dependent variables are not the same: the industry-level analysis examines variation in
log investment, while the plant-level regressions investigate investment shares because
establishment-level investment can be zero in some years.12
4.2 Plant-level Results Allowing for Heterogeneous Responses
To assess the importance of plant heterogeneity within industries, we augment Equa-
tion 4 with an additional covariate that interacts the DID term with one of several
normalized initial plant attributes: plant size, as measured by employment or value
added; plant productivity, as measured by TFP, value added (VA) per worker or ship-
ments per worker; and plant capital and skill intensity,
year from 1990 to 2007.12Further discussion of the di�erences between the industry- and plant-level results in appendix
section B.
15
ypt = θ1Post PNTRt × NTRGapj+ (5)
θ2Post PNTRt × NTRGapj × EstabCharp+
ϕ1Post PNTRt × EstabCharp + βXjt + γPost PNTRt×Xj+
δp + δt + α + εpt
These terms, which we refer to as �plant heterogeneity terms� and which we include
one-at-a-time in separate regressions, appear as the triple interaction in the second line
of equation 5. The normalization divides the 1992 plant attribute by the average of that
attribute across all plants in the same industry in 1992, therefore explicitly accounting
for heterogeneity within industries, rather than di�erences across industries.13 The
third term in equation 5 represents the interaction of the plant heterogeneity term
with the Post PNTRt indicator required to identify the triple interaction. We do not
simultaneously include all plant heterogeneity terms in a single regression given their
high correlation.14
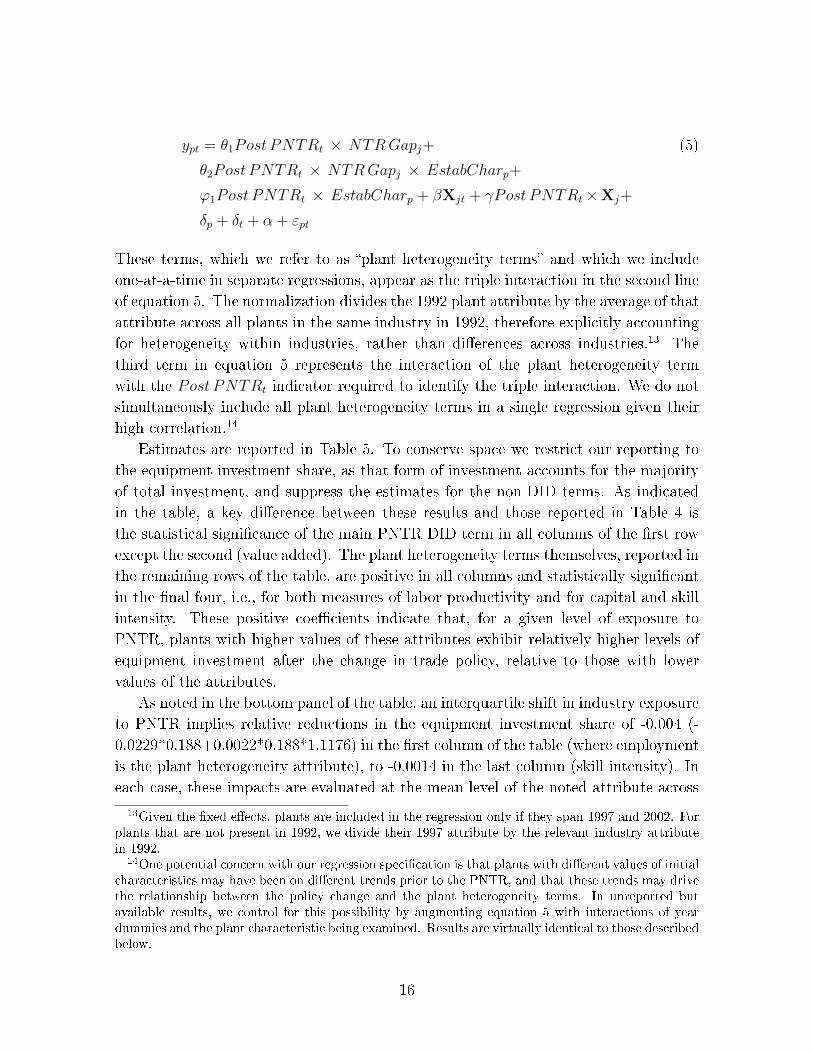
Estimates are reported in Table 5. To conserve space we restrict our reporting to
the equipment investment share, as that form of investment accounts for the majority
of total investment, and suppress the estimates for the non-DID terms. As indicated
in the table, a key di�erence between these results and those reported in Table 4 is
the statistical signi�cance of the main PNTR DID term in all columns of the �rst row
except the second (value added). The plant heterogeneity terms themselves, reported in
the remaining rows of the table, are positive in all columns and statistically signi�cant
in the �nal four, i.e., for both measures of labor productivity and for capital and skill
intensity. These positive coe�cients indicate that, for a given level of exposure to
PNTR, plants with higher values of these attributes exhibit relatively higher levels of
equipment investment after the change in trade policy, relative to those with lower
values of the attributes.
As noted in the bottom panel of the table, an interquartile shift in industry exposure
to PNTR implies relative reductions in the equipment investment share of -0.004 (-
0.0229*0.188+0.0022*0.188*1.1176) in the �rst column of the table (where employment
is the plant heterogeneity attribute), to -0.0014 in the last column (skill intensity). In
each case, these impacts are evaluated at the mean level of the noted attribute across
13Given the �xed e�ects, plants are included in the regression only if they span 1997 and 2002. Forplants that are not present in 1992, we divide their 1997 attribute by the relevant industry attributein 1992.
14One potential concern with our regression speci�cation is that plants with di�erent values of initialcharacteristics may have been on di�erent trends prior to the PNTR, and that these trends may drivethe relationship between the policy change and the plant heterogeneity terms. In unreported butavailable results, we control for this possibility by augmenting equation 5 with interactions of yeardummies and the plant characteristic being examined. Results are virtually identical to those describedbelow.
16
plants in 1992. These changes represent -1.1 to -3.2 percent of the mean equipment
investment share in 1997, the prior year closest to the change in trade policy.
Table 5: PNTR and Heterogeneity in Establishment-Level Equipment Investment
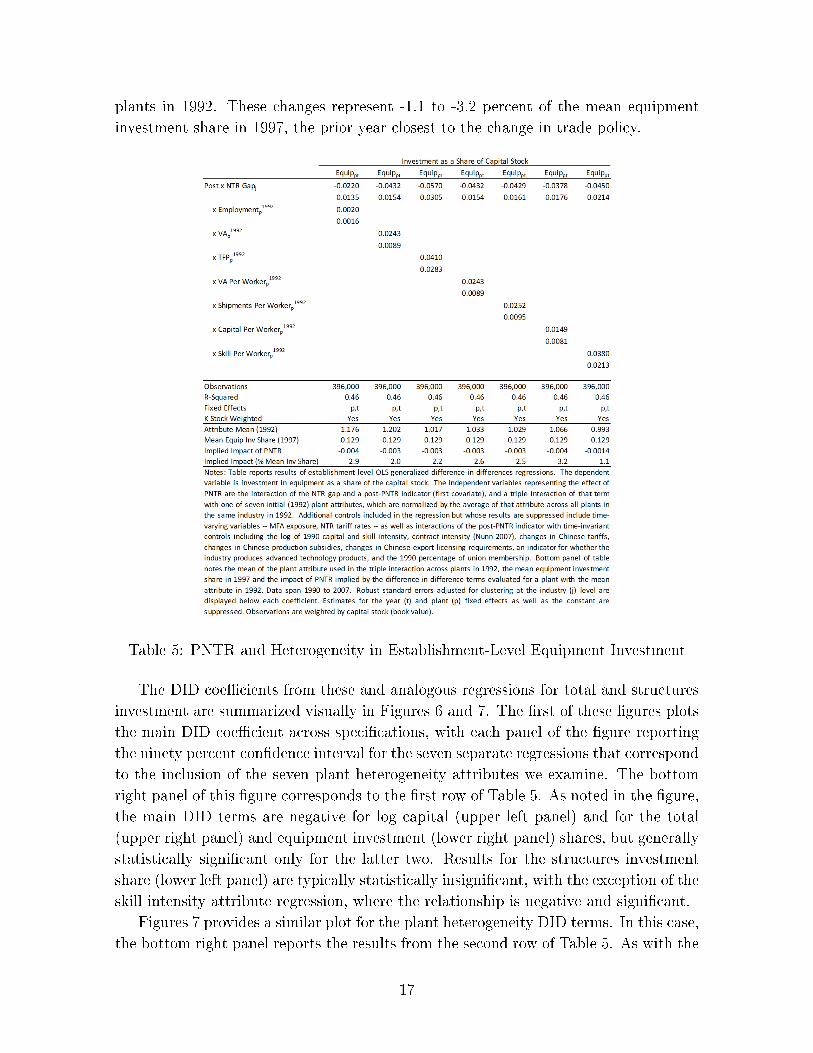
The DID coe�cients from these and analogous regressions for total and structures
investment are summarized visually in Figures 6 and 7. The �rst of these �gures plots
the main DID coe�cient across speci�cations, with each panel of the �gure reporting
the ninety percent con�dence interval for the seven separate regressions that correspond
to the inclusion of the seven plant heterogeneity attributes we examine. The bottom
right panel of this �gure corresponds to the �rst row of Table 5. As noted in the �gure,
the main DID terms are negative for log capital (upper left panel) and for the total
(upper right panel) and equipment investment (lower right panel) shares, but generally
statistically signi�cant only for the latter two. Results for the structures investment
share (lower left panel) are typically statistically insigni�cant, with the exception of the
skill intensity attribute regression, where the relationship is negative and signi�cant.
Figures 7 provides a similar plot for the plant heterogeneity DID terms. In this case,
the bottom right panel reports the results from the second row of Table 5. As with the
17
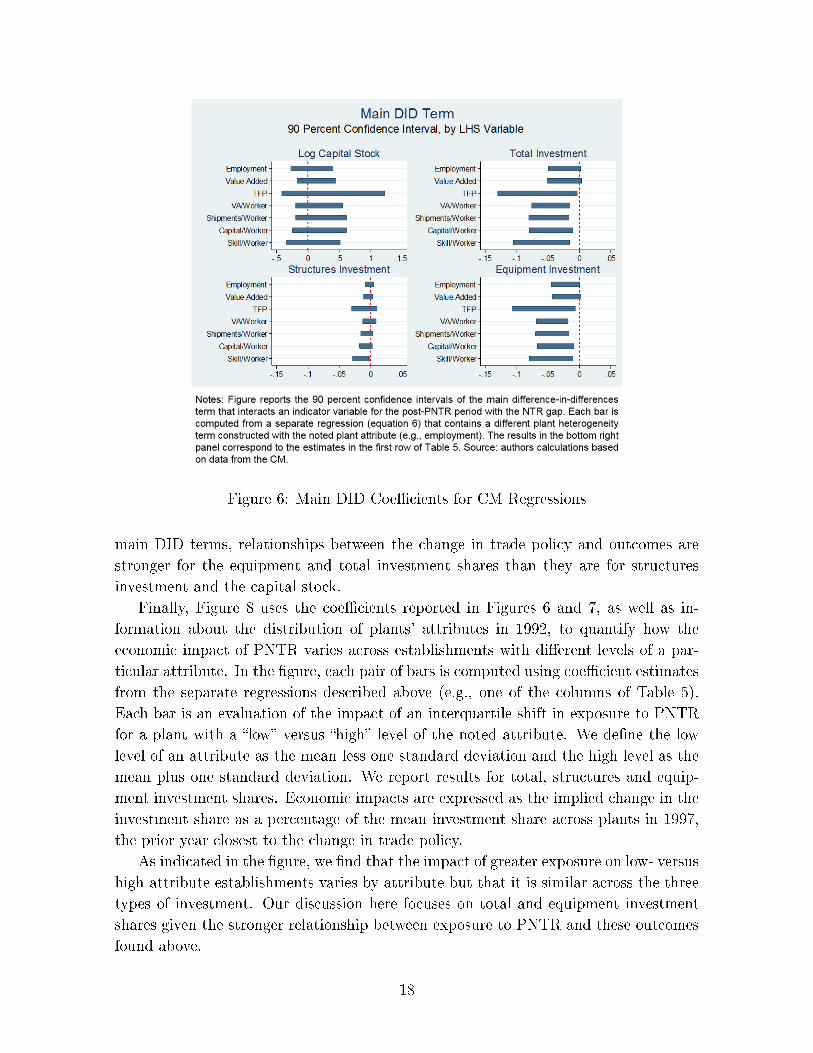
Figure 6: Main DID Coe�cients for CM Regressions
main DID terms, relationships between the change in trade policy and outcomes are
stronger for the equipment and total investment shares than they are for structures
investment and the capital stock.
Finally, Figure 8 uses the coe�cients reported in Figures 6 and 7, as well as in-
formation about the distribution of plants' attributes in 1992, to quantify how the
economic impact of PNTR varies across establishments with di�erent levels of a par-
ticular attribute. In the �gure, each pair of bars is computed using coe�cient estimates
from the separate regressions described above (e.g., one of the columns of Table 5).
Each bar is an evaluation of the impact of an interquartile shift in exposure to PNTR
for a plant with a �low� versus �high� level of the noted attribute. We de�ne the low
level of an attribute as the mean less one standard deviation and the high level as the
mean plus one standard deviation. We report results for total, structures and equip-
ment investment shares. Economic impacts are expressed as the implied change in the
investment share as a percentage of the mean investment share across plants in 1997,
the prior year closest to the change in trade policy.
As indicated in the �gure, we �nd that the impact of greater exposure on low- versus
high-attribute establishments varies by attribute but that it is similar across the three
types of investment. Our discussion here focuses on total and equipment investment
shares given the stronger relationship between exposure to PNTR and these outcomes
found above.
18
Figure 7: Plant Heterogeneity DID Coe�cients for CM Regressions
Overall, we �nd that plants with high values of the attributes we examine experience
smaller relative reductions in equipment investment following PNTR. This di�erence is
most noticeable for labor productivity, capital intensity, and skill intensity. For plant
size and TFP, the di�erences between low- and high-attribute plants are relatively
small. A second notable feature of Figure 8 is that plants with the highest skill intensity
actually experience a relative increase equipment investment after the change in trade
policy versus before.
Combined, the results in this section suggest that the average continuing establish-
ment reduces equipment (and total) investment in response to PNTR relative to the
period before the change in trade policy. However, for the subset of plants with rela-
tively high skill intensity, greater exposure to the change in trade policy is associated
with relatively higher equipment (and total) investment. This increased investment
could represent trade-induced technological change of the type discussed in Bloom,
Draca, and Reenen (2016). Alternatively, it could re�ect capital expenditures used to
upgrade product quality (Schott (2003, 2004)) or switch production (Bernard, Jensen,
and Schott (2006); Bernard, Jensen, Redding, and Schott (2011); Khandelwal (2010))
towards goods more in line with U.S. comparative advantage.
Our results in this section are consistent with those reported in Gutierrez and
Philippon (2017), who �nd that while investment in property, plant and equipment is
relatively lower for publicly traded �rms after PNTR versus before, the relative decline
19
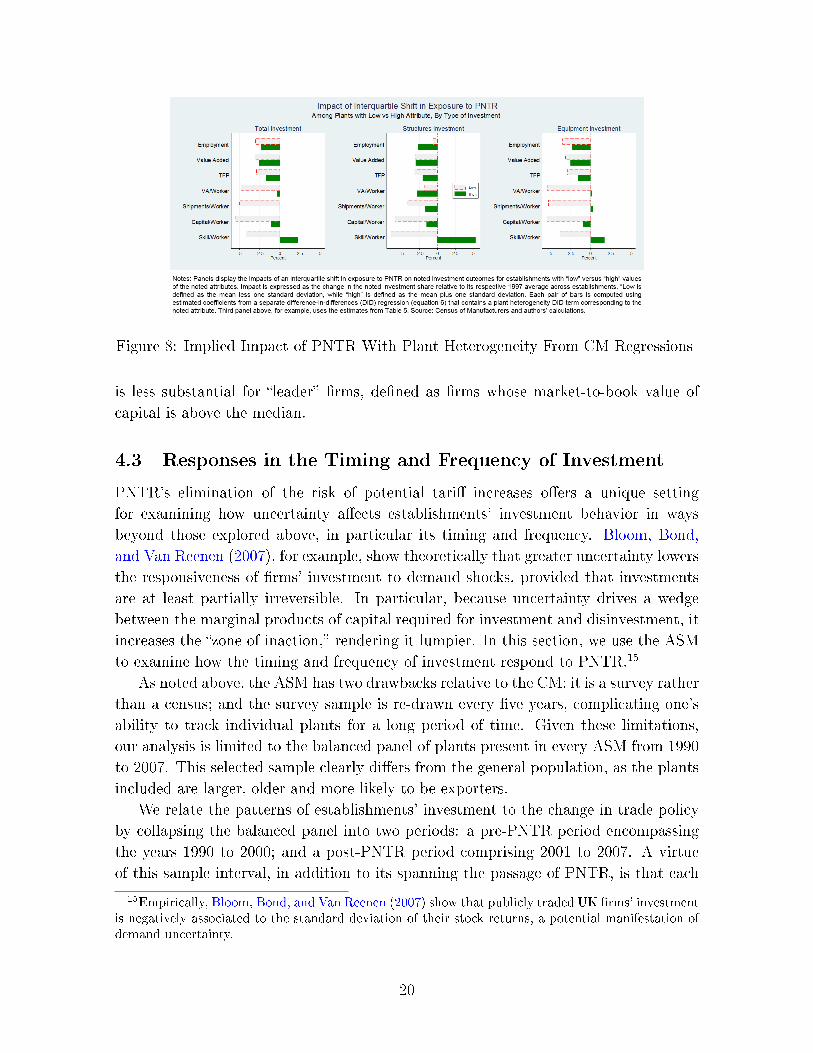
Figure 8: Implied Impact of PNTR With Plant Heterogeneity From CM Regressions
is less substantial for �leader� �rms, de�ned as �rms whose market-to-book value of
capital is above the median.
4.3 Responses in the Timing and Frequency of Investment
PNTR's elimination of the risk of potential tari� increases o�ers a unique setting
for examining how uncertainty a�ects establishments' investment behavior in ways
beyond those explored above, in particular its timing and frequency. Bloom, Bond,
and Van Reenen (2007), for example, show theoretically that greater uncertainty lowers
the responsiveness of �rms' investment to demand shocks, provided that investments
are at least partially irreversible. In particular, because uncertainty drives a wedge
between the marginal products of capital required for investment and disinvestment, it
increases the �zone of inaction,� rendering it lumpier. In this section, we use the ASM
to examine how the timing and frequency of investment respond to PNTR.15
As noted above, the ASM has two drawbacks relative to the CM: it is a survey rather
than a census; and the survey sample is re-drawn every �ve years, complicating one's
ability to track individual plants for a long period of time. Given these limitations,
our analysis is limited to the balanced panel of plants present in every ASM from 1990
to 2007. This selected sample clearly di�ers from the general population, as the plants
included are larger, older and more likely to be exporters.
We relate the patterns of establishments' investment to the change in trade policy
by collapsing the balanced panel into two periods: a pre-PNTR period encompassing
the years 1990 to 2000; and a post-PNTR period comprising 2001 to 2007. A virtue
of this sample interval, in addition to its spanning the passage of PNTR, is that each
15Empirically, Bloom, Bond, and Van Reenen (2007) show that publicly traded UK �rms' investmentis negatively associated to the standard deviation of their stock returns, a potential manifestation ofdemand uncertainty.
20
sub-period roughly coincides with a full business cycle, beginning around the time of
a recession peak and continuing through the start of the next recession.
For each period, we calculate three plant-level measures of investment activity. The
�rst measure is the average size of establishments' investments, de�ned as the sum of
plant p's investment for period c, divided by the number of years in the period. This
measure provides a useful comparison to our results above. The second measure is the
standard deviation of the level of investment, within plants, across the years in each
period. This measure captures changes in the lumpiness of plants' investment behavior.
The third measure is the share of years in each period with positive investment, a
measure that captures the frequency with which establishments invest. In practice, as
noted in Table 1, a high share of establishments invest each year, though the share
is lower for structures investment. With these measures, we estimate the following
equation:
ln(ypc) = θPost PNTRc × NTRGapj+ (6)
βXjc + γPost PNTRc×Xj+
δp + δc + α + εpc,
where p indexes establishments and j indexes industries, as before, and c indexes
the two time periods. The dependent variable ln(ypc) is the log of one of the three
measures of investment behavior for plant p in period c noted above, and the DID
term and control variables are identical to those in Equation 2, with the exception that
in equation 6, time-varying control variables are averaged over each period.
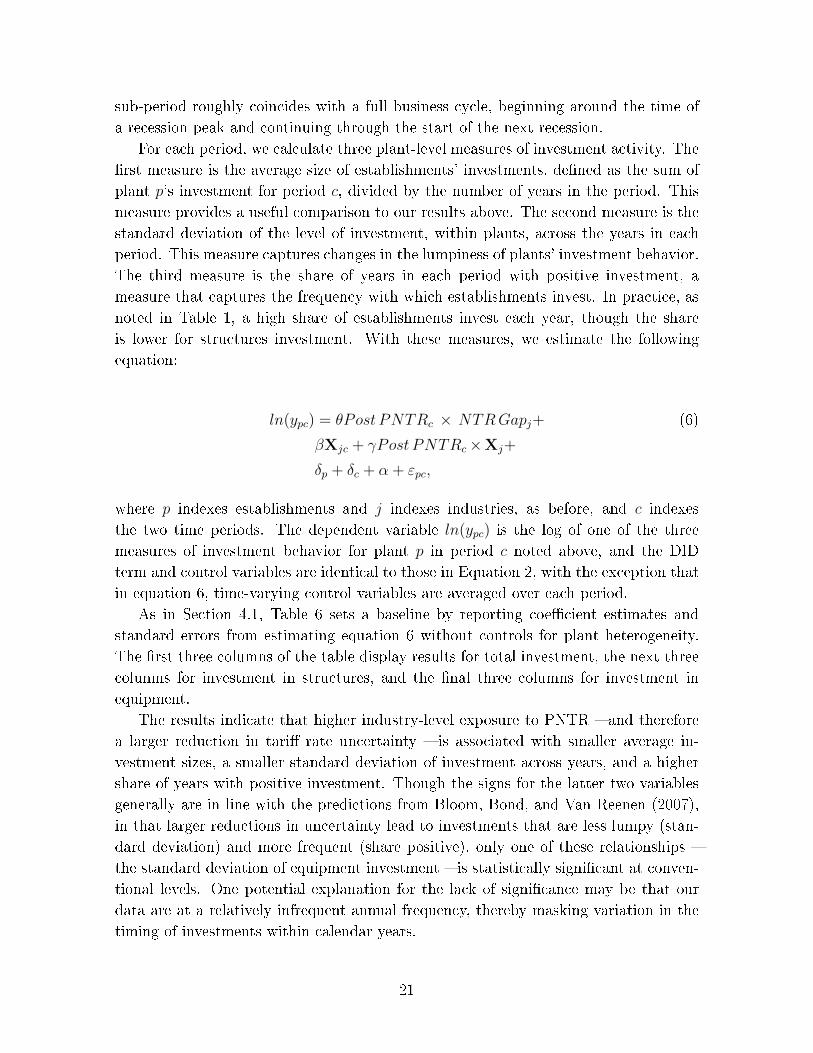
As in Section 4.1, Table 6 sets a baseline by reporting coe�cient estimates and
standard errors from estimating equation 6 without controls for plant heterogeneity.
The �rst three columns of the table display results for total investment, the next three
columns for investment in structures, and the �nal three columns for investment in
equipment.
The results indicate that higher industry-level exposure to PNTR � and therefore
a larger reduction in tari� rate uncertainty � is associated with smaller average in-
vestment sizes, a smaller standard deviation of investment across years, and a higher
share of years with positive investment. Though the signs for the latter two variables
generally are in line with the predictions from Bloom, Bond, and Van Reenen (2007),
in that larger reductions in uncertainty lead to investments that are less lumpy (stan-
dard deviation) and more frequent (share positive), only one of these relationships �
the standard deviation of equipment investment � is statistically signi�cant at conven-
tional levels. One potential explanation for the lack of signi�cance may be that our
data are at a relatively infrequent annual frequency, thereby masking variation in the
timing of investments within calendar years.
21
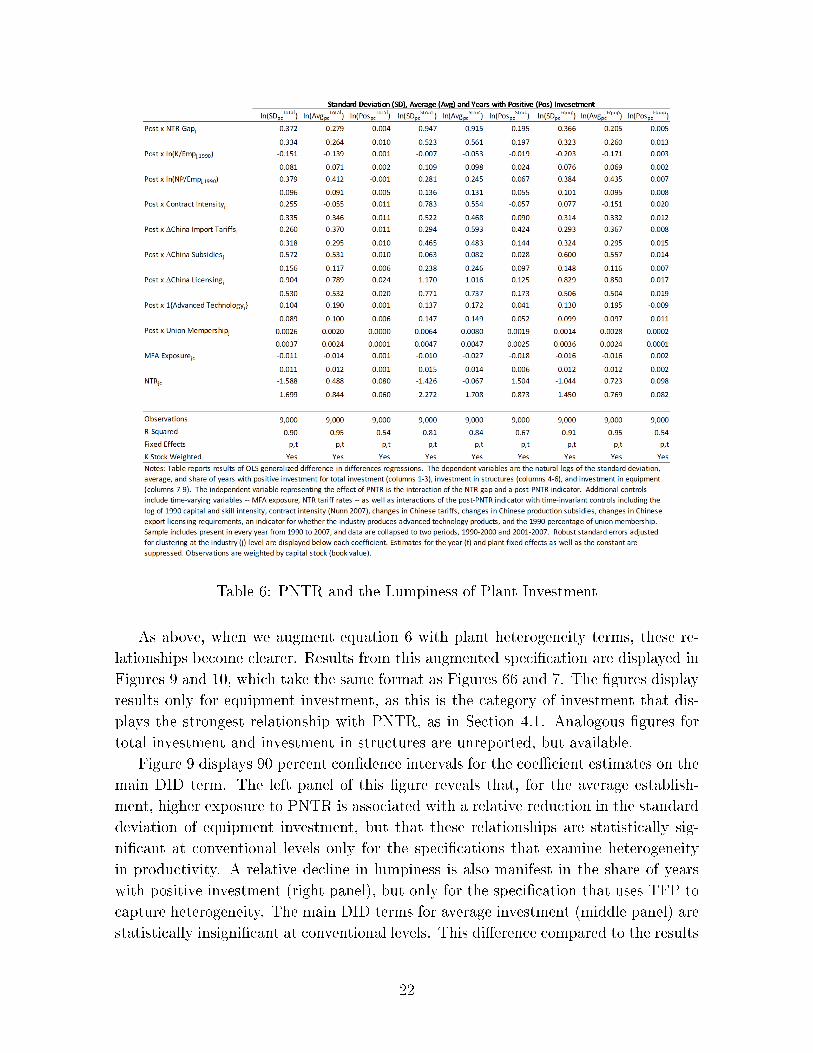
Table 6: PNTR and the Lumpiness of Plant Investment
As above, when we augment equation 6 with plant heterogeneity terms, these re-
lationships become clearer. Results from this augmented speci�cation are displayed in
Figures 9 and 10, which take the same format as Figures 66 and 7. The �gures display
results only for equipment investment, as this is the category of investment that dis-
plays the strongest relationship with PNTR, as in Section 4.1. Analogous �gures for
total investment and investment in structures are unreported, but available.
Figure 9 displays 90 percent con�dence intervals for the coe�cient estimates on the
main DID term. The left panel of this �gure reveals that, for the average establish-
ment, higher exposure to PNTR is associated with a relative reduction in the standard
deviation of equipment investment, but that these relationships are statistically sig-
ni�cant at conventional levels only for the speci�cations that examine heterogeneity
in productivity. A relative decline in lumpiness is also manifest in the share of years
with positive investment (right panel), but only for the speci�cation that uses TFP to
capture heterogeneity. The main DID terms for average investment (middle panel) are
statistically insigni�cant at conventional levels. This di�erence compared to the results
22
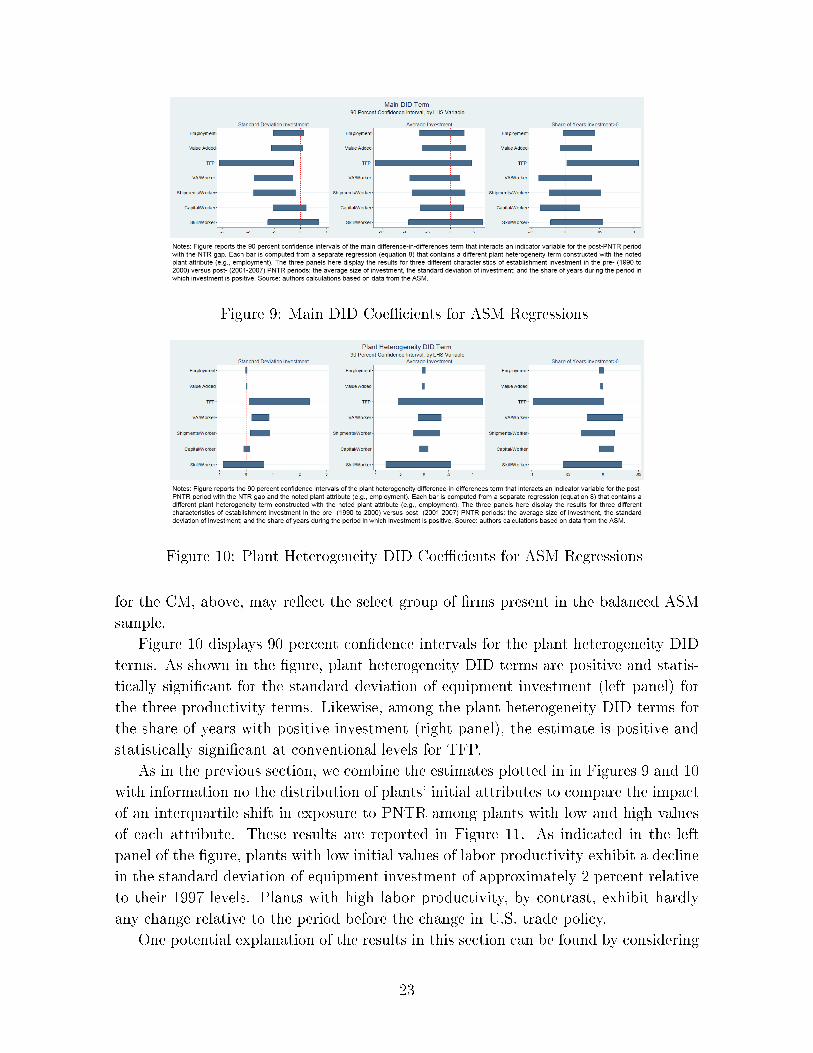
Figure 9: Main DID Coe�cients for ASM Regressions
Figure 10: Plant Heterogeneity DID Coe�cients for ASM Regressions
for the CM, above, may re�ect the select group of �rms present in the balanced ASM
sample.
Figure 10 displays 90 percent con�dence intervals for the plant heterogeneity DID
terms. As shown in the �gure, plant heterogeneity DID terms are positive and statis-
tically signi�cant for the standard deviation of equipment investment (left panel) for
the three productivity terms. Likewise, among the plant heterogeneity DID terms for
the share of years with positive investment (right panel), the estimate is positive and
statistically signi�cant at conventional levels for TFP.
As in the previous section, we combine the estimates plotted in in Figures 9 and 10
with information no the distribution of plants' initial attributes to compare the impact
of an interquartile shift in exposure to PNTR among plants with low and high values
of each attribute. These results are reported in Figure 11. As indicated in the left
panel of the �gure, plants with low initial values of labor productivity exhibit a decline
in the standard deviation of equipment investment of approximately 2 percent relative
to their 1997 levels. Plants with high labor productivity, by contrast, exhibit hardly
any change relative to the period before the change in U.S. trade policy.
One potential explanation of the results in this section can be found by considering
23
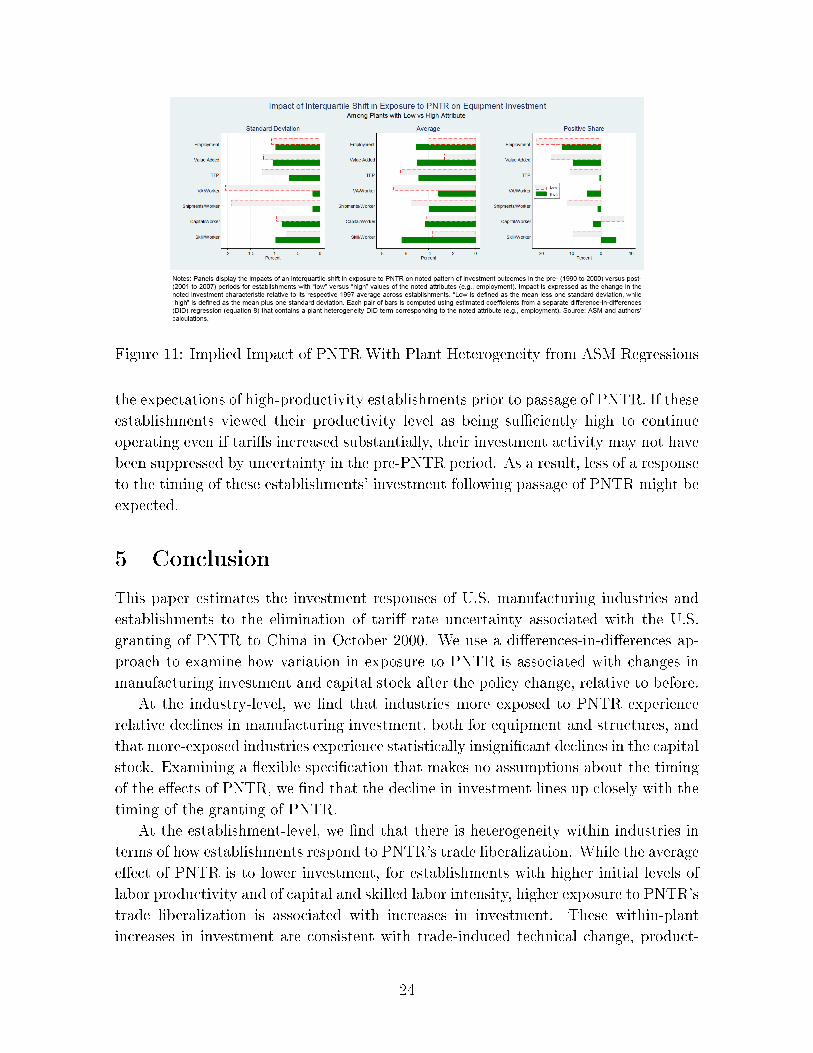
Figure 11: Implied Impact of PNTR With Plant Heterogeneity from ASM Regressions
the expectations of high-productivity establishments prior to passage of PNTR. If these
establishments viewed their productivity level as being su�ciently high to continue
operating even if tari�s increased substantially, their investment activity may not have
been suppressed by uncertainty in the pre-PNTR period. As a result, less of a response
to the timing of these establishments' investment following passage of PNTR might be
expected.
5 Conclusion
This paper estimates the investment responses of U.S. manufacturing industries and
establishments to the elimination of tari� rate uncertainty associated with the U.S.
granting of PNTR to China in October 2000. We use a di�erences-in-di�erences ap-
proach to examine how variation in exposure to PNTR is associated with changes in
manufacturing investment and capital stock after the policy change, relative to before.
At the industry-level, we �nd that industries more exposed to PNTR experience
relative declines in manufacturing investment, both for equipment and structures, and
that more-exposed industries experience statistically insigni�cant declines in the capital
stock. Examining a �exible speci�cation that makes no assumptions about the timing
of the e�ects of PNTR, we �nd that the decline in investment lines up closely with the
timing of the granting of PNTR.
At the establishment-level, we �nd that there is heterogeneity within industries in
terms of how establishments respond to PNTR's trade liberalization. While the average
e�ect of PNTR is to lower investment, for establishments with higher initial levels of
labor productivity and of capital and skilled labor intensity, higher exposure to PNTR's
trade liberalization is associated with increases in investment. These within-plant
increases in investment are consistent with trade-induced technical change, product-
24
upgrading, or other activities that di�erentiate U.S. production from import-competing
products.
Examining the timing, frequency, and lumpiness of establishments' investment be-
havior, we �nd that larger reductions in uncertainty associated with PNTR are as-
sociated declines in the lumpiness of investment, though there is less of a change in
behavior for establishments with high initial productivity levels.
In sum, the �ndings in this paper provide new information on the e�ect of trade lib-
eralization on investment, while highlighting the heterogeneous responses of individual
plants.
25
References
Aghion, P., N. Bloom, R. Blundell, R. Griffith, and P. Howitt (2005):
�Competition and Innovation: An Inverted-U Relationship,� The Quarterly Journal
of Economics, 120(2), 701�728.
Autor, D., D. Dorn, G. H. Hanson, G. Pisano, and P. Shu (2016): �Foreign
Competition and Domestic Innovation: Evidence from U.S. Patents,� Working Paper
22879, National Bureau of Economic Research.
Autor, D. H., D. Dorn, and G. H. Hanson (2013): �The China Syndrome: Lo-
cal Labor Market E�ects of Import Competition in the United States,� American
Economic Review, 103(6), 2121�68.
Bai, X., K. Krishna, and H. Ma (2015): �How You Export Matters: Export Mode,
Learning and Productivity in China,� Working Paper 21164, National Bureau of
Economic Research.
Becker, R., W. Gray, and J. Marvakov (2013): �NBER-CES Manufacturing
Industry Database: Technical Notes,� Working Paper 5809, National Bureau of Eco-
nomic Research.
Bernard, A. B., J. B. Jensen, S. Redding, and P. Schott (2011): �Multi-
Product Firms and Trade Liberalization,� Quarterly Journal of Economics, 126(3),
1271�1318.
Bernard, A. B., J. B. Jensen, and P. K. Schott (2006): �Survival of the Best Fit:
Exposure to Low-Wage Countries and the (Uneven) Growth of US Manufacturing
Plants,� Journal of International Economics.
Bloom, N., S. Bond, and J. Van Reenen (2007): �Uncertainty and Investment
Dynamics,� The Review of Economic Studies, 74(2), 391�415.
Bloom, N., M. Draca, and J. V. Reenen (2016): �Trade Induced Technical
Change: The Impact of Chinese Imports on Innovation, Di�usion, and Productivity,�
Review of Economic Studies, 83, 87�117.
Brandt, L., J. Van Biesebroeck, L. Wang, and Y. Zhang (2017): �WTO
Accession and Performance of Chinese Manufacturing Firms,� American Economic
Review, 107(9), 2784�2820.
Feenstra, R. C., J. Romalis, and P. K. Schott (2002): �US Imports, Exports,
and Tari� Data, 1989-2001,� Working Paper 9387, National Bureau of Economic
Research.
26
Fort, T. C., J. R. Pierce, and P. K. Schott (2017): �New Perspectives on the
Decline of US Manufacturing Employment,� .
Guiso, L., and G. Parigi (1999): �Investment and Demand Uncertainty,� The Quar-
terly Journal of Economics, 114(1), 185�227.
Gutierrez, G., and T. Philippon (2017): �Declining Competition and Investment
in the U.S.,� Working Paper 23583, National Bureau of Economic Research.
Handley, K. (2014): �Exporting Under Trade Policy Uncertainty: Theory and Evi-
dence,� Journal of International Economics, 94(1), 50�66.
Handley, K., and N. Limao (2017): �Policy Uncertainty, Trade, and Welfare: The-
ory and Evidence for China and the United States,� American Economic Review,
107(9), 2731�83.
Hirsch, B. T., and D. A. Macpherson (2003): �Union Membership and Coverage
Database from the Current Population Survey: Note,� Industrial and Labor Relations
Review, 56, 349�54.
Khandelwal, A. (2010): �The Long and Short (of) Quality Ladders,� Review of
Economic Studies, 77, 1450�1476.
Khandelwal, A. K., P. K. Schott, and S.-J. Wei (2013): �Trade Liberalization
and Embedded Institutional Reform: Evidence from Chinese Exporters,� American
Economic Review, 103(6), 2169�95.
Kurz, C. J., and N. J. Morin (2016): �Annual Data on Investment and Capital
Stocks,� Feds notes, Board of Governors of the Federal Reserve System (US).
Michaels, D. (2017): �Foreign Robots Invade American Factory Floors,� Wall Street
Journal.
Nunn, N. (2007): �Relationship-Speci�city, Incomplete Contracts, and the Pattern of
Trade,� The Quarterly Journal of Economics, 122(2), 569�600.
Pierce, J. R., and P. K. Schott (2012): �The Surprisingly Swift Decline of U.S.
Manufacturing Employment,� Working Paper 18655, National Bureau of Economic
Research.
(2016): �The Surprisingly Swift Decline of U.S. Manufacturing Employment,�
American Economic Review, 106(7), 1632�1662.
Pindyck, R. S. (1993): �Investments of uncertain cost,� Journal of �nancial Eco-
nomics, 34(1), 53�76.
27
Rob, R., and N. Vettas (2003): �Foreign direct investment and exports with growing
demand,� The Review of Economic Studies, 70(3), 629�648.
Schott, P. K. (2003): �One Size Fits All? Heckscher-Ohlin Specialization in Global
Production,� American Economic Review, 93(3), 686�708.
(2004): �Across-Product versus Within-Product Specialization in International
Trade,� The Quarterly Journal of Economics, 119(2), 647�678.
Schwartz, E. S., and C. Zozaya-Gorostiza (2003): �Investment Under Uncer-
tainty in Information Technology: Acquisition and Development Projects,� Manage-
ment Science, 49(1), 57�70.
28
Online Appendix
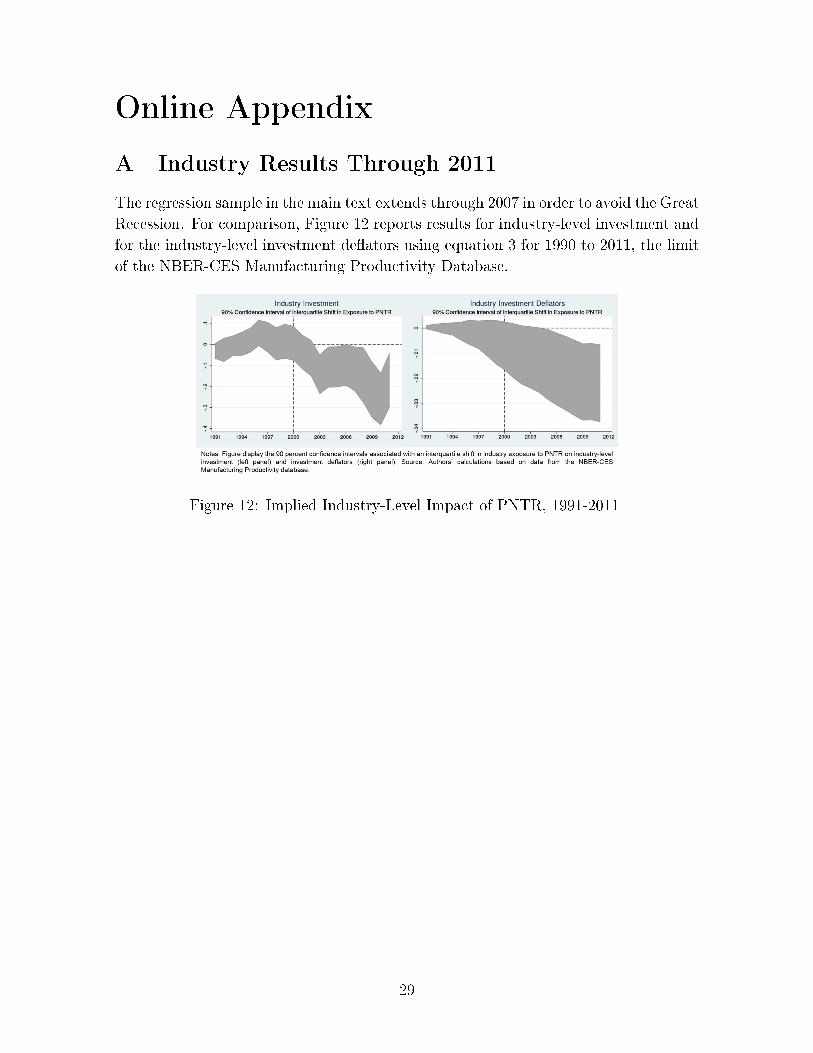
A Industry Results Through 2011
The regression sample in the main text extends through 2007 in order to avoid the Great
Recession. For comparison, Figure 12 reports results for industry-level investment and
for the industry-level investment de�ators using equation 3 for 1990 to 2011, the limit
of the NBER-CES Manufacturing Productivity Database.
Figure 12: Implied Industry-Level Impact of PNTR, 1991-2011
29
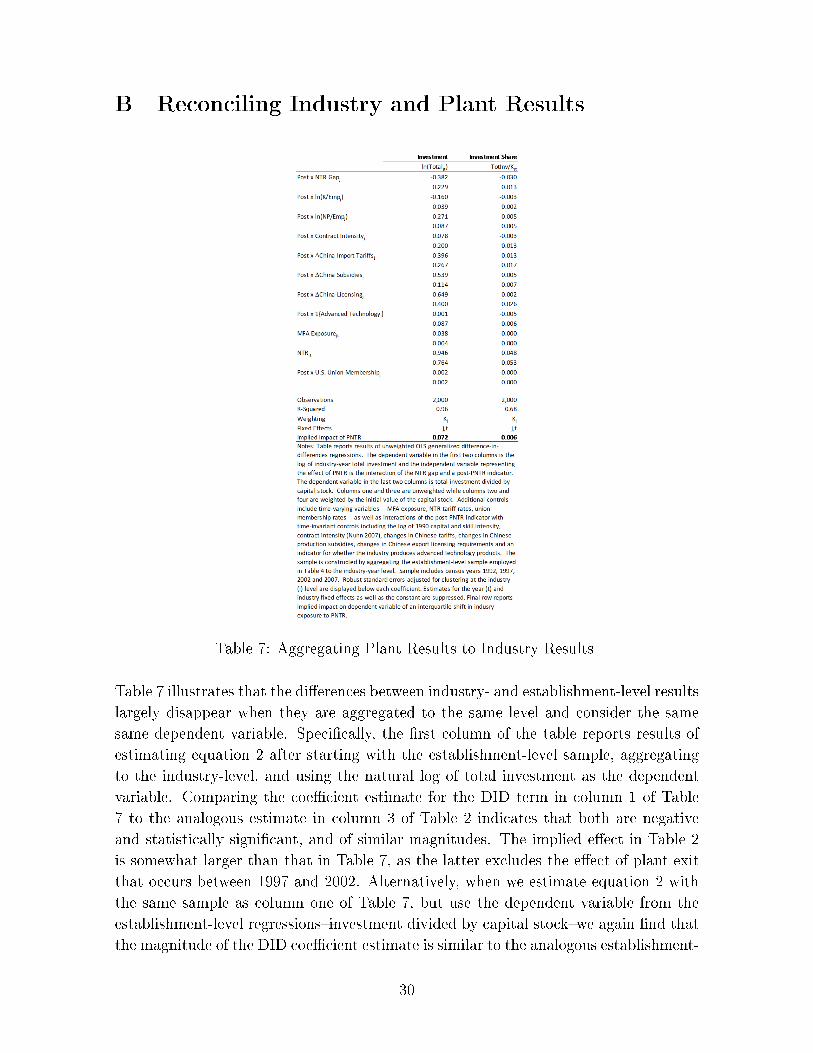
B Reconciling Industry and Plant Results
Table 7: Aggregating Plant Results to Industry Results
Table 7 illustrates that the di�erences between industry- and establishment-level results
largely disappear when they are aggregated to the same level and consider the same
same dependent variable. Speci�cally, the �rst column of the table reports results of
estimating equation 2 after starting with the establishment-level sample, aggregating
to the industry-level, and using the natural log of total investment as the dependent
variable. Comparing the coe�cient estimate for the DID term in column 1 of Table
7 to the analogous estimate in column 3 of Table 2 indicates that both are negative
and statistically signi�cant, and of similar magnitudes. The implied e�ect in Table 2
is somewhat larger than that in Table 7, as the latter excludes the e�ect of plant exit
that occurs between 1997 and 2002. Alternatively, when we estimate equation 2 with
the same sample as column one of Table 7, but use the dependent variable from the
establishment-level regressions�investment divided by capital stock�we again �nd that
the magnitude of the DID coe�cient estimate is similar to the analogous establishment-
30

level results from column 2 of Table 4. The coe�cient in this industry-level analysis
is statistically signi�cant, likely because it captures changes in investment associated
with net plant exit, which the establishment-level regressions do not.
31