investment decision criteria - texas tech...
TRANSCRIPT

Investment Decision Criteria
Chapter 11
Copyright © 2011 Pearson Prentice Hall. All rights reserved.
Decision Criteria

Chapter 11 Contents
• Learning Objectives
• Principles Used in This Chapter
1. An Overview of Capital Budgeting
2. Net Present Value
Copyright © 2011 Pearson Prentice Hall. All rights reserved.11-2
2. Net Present Value
3. Other Investment Criteria
4. A Glance at Actual Capital Budgeting Practices
Learning Objectives
1. Understand how to identify the sources and types of profitable investment opportunities.
2. Evaluate investment opportunities using net present value and describe why net present value provides the best measure for evaluating investments.
Copyright © 2011 Pearson Prentice Hall. All rights reserved.11-3
3. Use the profitability index, internal rate of return, and payback criteria to evaluate investment opportunities.
4. Understand current business practice with respect to the use of capital budgeting criteria.
Principles Used in This Chapter
• Principle 3: Cash Flows Are the Source of Value.
– We value an investment opportunities by evaluating its expected cash flows.
• Principle 1: Money Has a Time Value.
– While evaluating investment opportunities, we discount all cash flows back to the present.
• Principle 2: There is a Risk-Reward Tradeoff.
Copyright © 2011 Pearson Prentice Hall. All rights reserved.11-4
• Principle 2: There is a Risk-Reward Tradeoff.
– While evaluating investment opportunities, we factor risk into the analysis by increasing the discount rate while calculating the present value of cash flows.
• Principle 4: Market Prices Reflect Information.
– The risk adjusted discount rate used to calculate the present values of project’s cash flows depends upon the market prices that reflect information.

Three Lessons from Disney
• Background
– Disney’s decision to invest $17.5 million to build Disneyland park in California is an example of capital budgeting decision.
– Subsequently, Disney opened theme parks in Orlando, Tokyo, Paris and most recently invested $3.5 billion to build a theme park in Hong Kong.
Copyright © 2011 Pearson Prentice Hall. All rights reserved.11-5
• Today parks and resorts account for over 30% of Disney’s Revenue.
• Disney Lessons1. Capital budgeting decisions are critical to a firm’s success.
2. Very large investments are frequently the result of many smaller investment decisions that define a business strategy.
3. Successful investment choices lead to the development of managerial expertise and capabilities that influence the firm’s choice of future investments.

The Typical Capital Budgeting Process
• Phase I: The firm’s management identifies promising investment opportunities.
• Phase II: The value creating potential of various opportunities are thoroughly evaluated.
– So the goal is to identify promising opportunities and select those that will create the most value for the firm’s common stockholders.
Copyright © 2011 Pearson Prentice Hall. All rights reserved.11-6
common stockholders.
What Are the Sources of Good Investment Projects?
• It is not easy to find profitable investment opportunities in competitive markets.
• Good investments are most likely to be found in markets that are less competitive where barriers to new entrants are sufficiently high to keep out would-be competitors.

Types of Capital Investment Projects
1) Revenue enhancing Investments (for example, entering a new market)
2) Cost-reduction investments (for example, installing a more efficient equipment)
3) Mandatory investments that are a result of government mandate (for example, installing mandatory safety
Copyright © 2011 Pearson Prentice Hall. All rights reserved.11-7
mandate (for example, installing mandatory safety features in a car)
Which of the following factors is least important to capital budgeting decisions?
1. The time value of money
2. The risk-return tradeoff
3. Net income based on accrual accounting principles
4. Cash flows directly resulting from the decision
Copyright © 2011 Pearson Prentice Hall. All rights reserved.11-8
1 2 3 4
25% 25%25%25%
the decision
10
Finance Tools to Assess Capital Investment Projects
• Before an investments is made, the firm will like to evaluate whether it will create value.
• To determine the desirability of investment proposals, we can use several analytical tools such as:
– Net Present Value (NPV),
– Equivalent Annual Cost (EAC),
– the Profitability Index (PI),
– the Internal Rate of Return (IRR),
Copyright © 2011 Pearson Prentice Hall. All rights reserved.11-9
– the Internal Rate of Return (IRR),
– the Modified Internal Rate of Return (MIRR),
– the payback period,
– and discounted payback period.
Net Present Value
• The net present value (NPV) is the difference between the present value of cash inflows and the cash outflows. NPV estimates the amount of wealth that the project creates.
• Decision Criteria: Investment projects should be accepted if the NPV of project is positive and
Copyright © 2011 Pearson Prentice Hall. All rights reserved.11-10
accepted if the NPV of project is positive and should be rejected if the NPV is negative.

Rationale for the NPV Method
NPV = PV of inflows – Cost
= Net gain in wealth
• If projects are independent, accept if the project NPV > 0.
• If projects are mutually exclusive, accept projects
Copyright © 2011 Pearson Prentice Hall. All rights reserved.11-11
• If projects are mutually exclusive, accept projects with the highest positive NPV, those that add the most value.
• In this example, accept S if mutually exclusive (NPVS > NPVL), and accept both if independent.

Calculating an Investment’s NPV - Logic
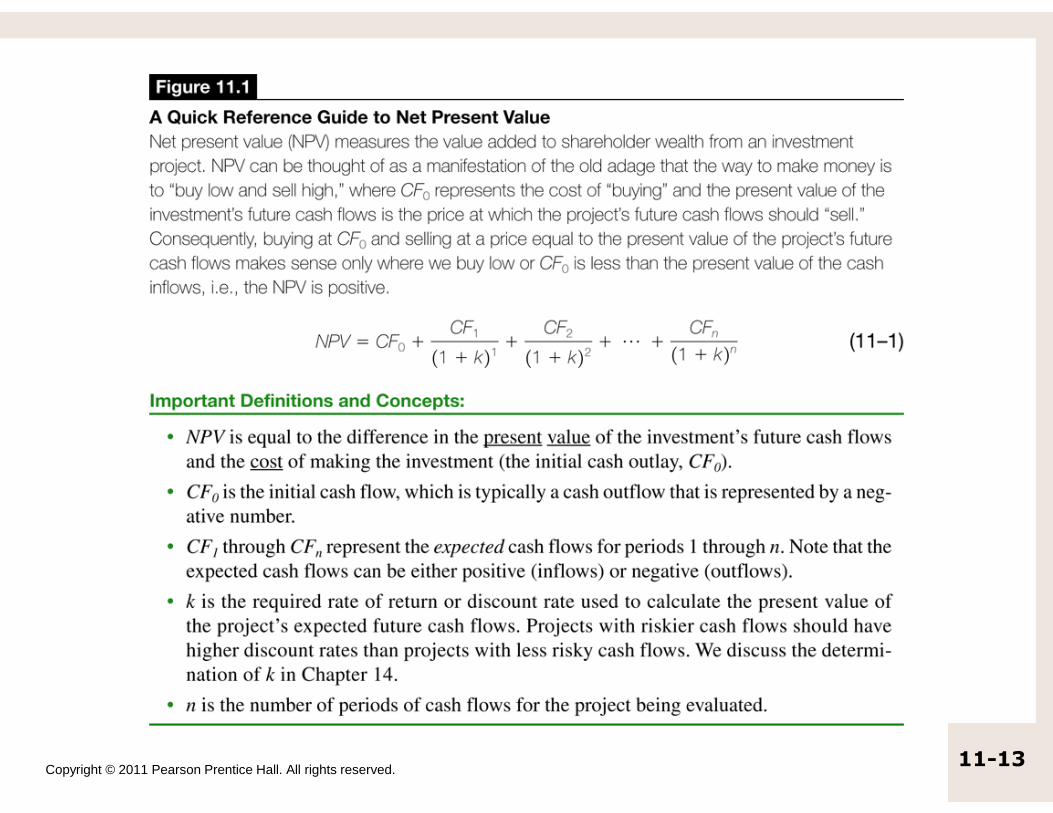
• The NPV of an investment proposal can be defined as follows:
• NPV = PV Future Cash flows minus initial investment
Copyright © 2011 Pearson Prentice Hall. All rights reserved.11-12
Copyright © 2011 Pearson Prentice Hall. All rights reserved.11-13

Independent Versus Mutually Exclusive Investment Projects
• An independent investment project is one that stands alone and can be undertaken without influencing the acceptance or rejection of any other project.
• A mutually exclusive project prevents another project from being accepted.
• Evaluating an Independent Investment Opportunity
Copyright © 2011 Pearson Prentice Hall. All rights reserved.11-14
• Evaluating an Independent Investment Opportunity
– It will require two steps:
1. Calculate NPV;
2. Accept the project if NPV is positive and reject if it is negative.
Example 11-1Calculating the NPV for Project Long
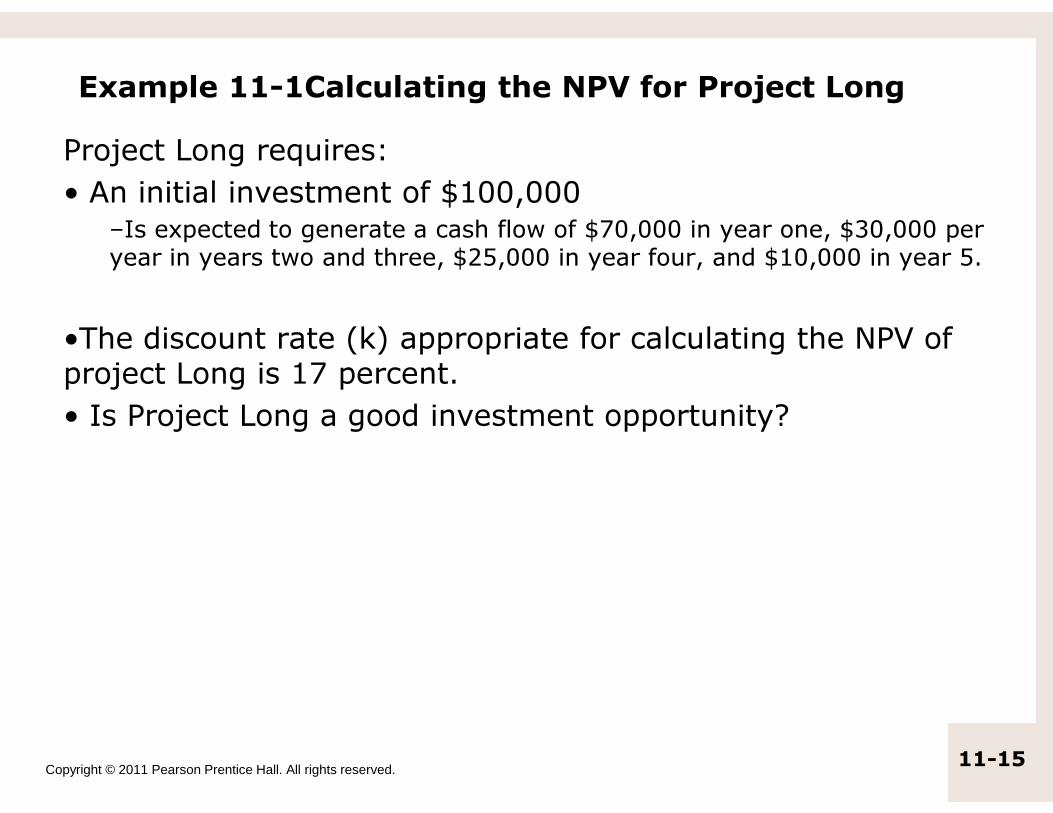
Project Long requires:
• An initial investment of $100,000–Is expected to generate a cash flow of $70,000 in year one, $30,000 per year in years two and three, $25,000 in year four, and $10,000 in year 5.
•The discount rate (k) appropriate for calculating the NPV of project Long is 17 percent.
• Is Project Long a good investment opportunity?
Copyright © 2011 Pearson Prentice Hall. All rights reserved.11-15
• Is Project Long a good investment opportunity?

Checkpoint 11.1
Copyright © 2011 Pearson Prentice Hall. All rights reserved.11-16

Solution Logic
Copyright © 2011 Pearson Prentice Hall. All rights reserved.11-17
Step 3 cont.

Checkpoint 11.1
Copyright © 2011 Pearson Prentice Hall. All rights reserved.11-18
Example 11-2
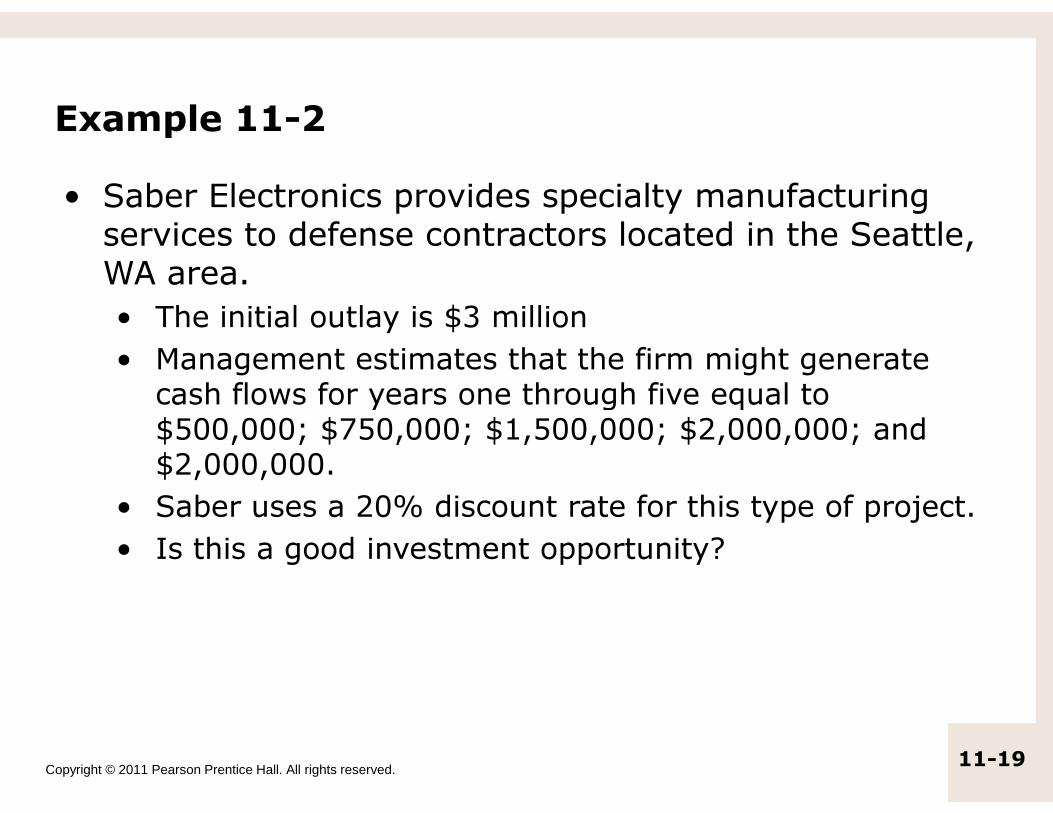
• Saber Electronics provides specialty manufacturing services to defense contractors located in the Seattle, WA area.
• The initial outlay is $3 million
• Management estimates that the firm might generate cash flows for years one through five equal to
Copyright © 2011 Pearson Prentice Hall. All rights reserved.11-19
cash flows for years one through five equal to $500,000; $750,000; $1,500,000; $2,000,000; and $2,000,000.
• Saber uses a 20% discount rate for this type of project.
• Is this a good investment opportunity?
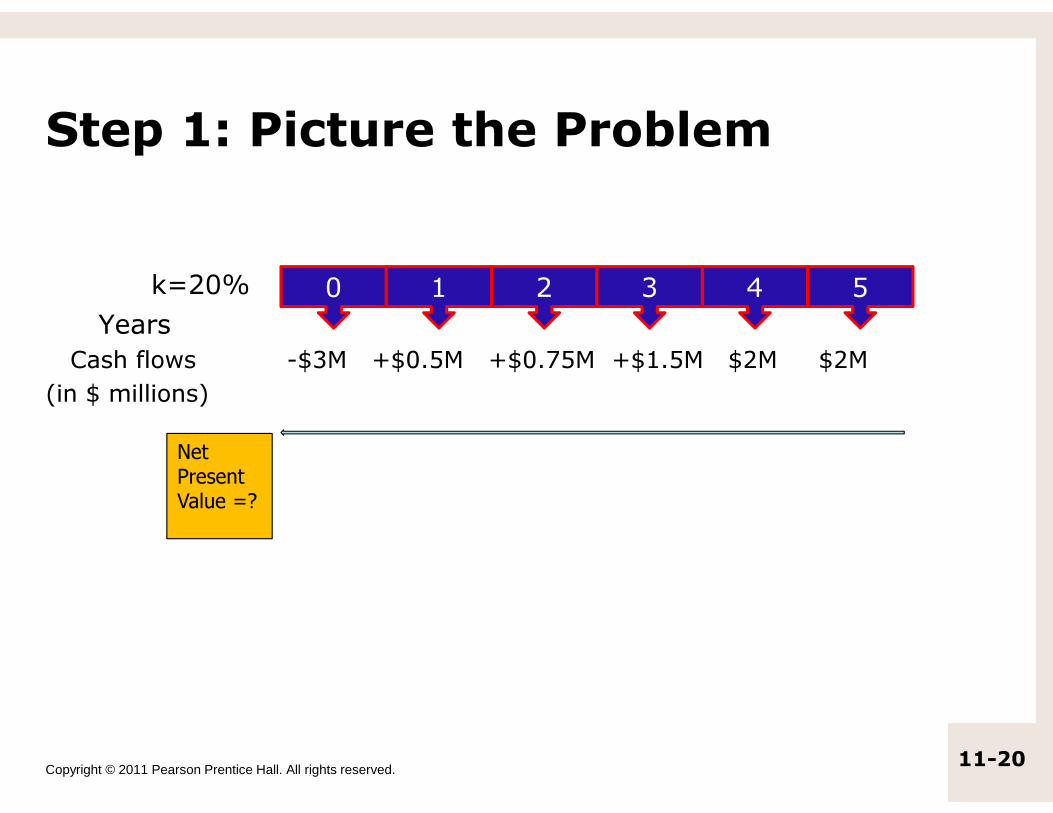
Step 1: Picture the Problem
k=20%
Years
Cash flows -$3M +$0.5M +$0.75M +$1.5M $2M $2M
(in $ millions)
0 1 2 43 5
Copyright © 2011 Pearson Prentice Hall. All rights reserved.11-20
Net
Present
Value =?
Step 2: Decide on a Solution Strategy
• We need to analyze if this is a good investment opportunity. We can do that by computing the Net Present Value (NPV), which requires computing the present value of all cash flows.
• We can compute the NPV by using a mathematical formula, a financial calculator or a
Copyright © 2011 Pearson Prentice Hall. All rights reserved.11-21
mathematical formula, a financial calculator or a spreadsheet.

Step 3: Solve
• Using Mathematical Formula
Copyright © 2011 Pearson Prentice Hall. All rights reserved.11-22

Step 3: Solve (cont.)
• NPV = -$3m + $.5m/(1.2) + $.75m/(1.2)2 + $1.5m/(1.2)3 + $2m/(1.2)4 + $2m/(1.2)5
• NPV = -$3,000,000 + $416,666.67 + $520,833.30 + $868,055.60 + $964,506 + $803,755.10
Copyright © 2011 Pearson Prentice Hall. All rights reserved.11-23
$803,755.10
• NPV = $573,817
PV of Cash in = 416.666.67 + … + 803,755.10
= $3,573,817
Minus Initial Investment of $3,000,000
Equals NPV = $573,817 which means you earn more than 20% return.

Step 4: Analyze
• The project requires an initial investment of $3,000,000 and generates futures cash flows that have a present value of $3,573,817.
• Consequently, the project cash flows are $573,817 more than the required investment.
• Since the NPV is positive, the project is an
Copyright © 2011 Pearson Prentice Hall. All rights reserved.11-24
• Since the NPV is positive, the project is an acceptable project.
• A positive NPV indicates the project earns more than the discount rate (cost of capital)of 20%

ABC Service can purchase a new assembler for $15,052 that will provide an annual net cash flow of $6,000 per year for five years. Calculate the NPV of the assembler if the required rate of return is 12%. (Round your answer to the nearest $1.)
1. $1,056
2. $4,568
3. $7,621
Copyright © 2011 Pearson Prentice Hall. All rights reserved.11-251
100%
3. $7,621
4. $6,577
Evaluating Mutually Exclusive Investment Opportunities
• There are times when a firm must choose the best project or set of projects from the set of positive NPV investment opportunities.
• These are considered mutually exclusive opportunities as the firm cannot undertake all positive NPV projects.
Copyright © 2011 Pearson Prentice Hall. All rights reserved.11-26
positive NPV projects.
• Following are two situations where firm is faced with mutually exclusive projects:
1.Substitutes – Where firm is trying to pick between alternatives that perform the same function.
2.Firm Constraints – Firm may face constraints such as limited managerial time or financial capital that may limit its ability to invest in all the positive NPV opportunities.
Method: Choosing Between Mutually Exclusive Investments
1. If mutually exclusive investments have equal lives, calculate the NPVs and choose the one with the higher NPV.
2. If mutually exclusive investments do not have equal lives, you must calculate the Equivalent
Copyright © 2011 Pearson Prentice Hall. All rights reserved.11-27
equal lives, you must calculate the Equivalent Annual Cost (EAC), the cost per year.
3. Select the one that has a lower EAC.
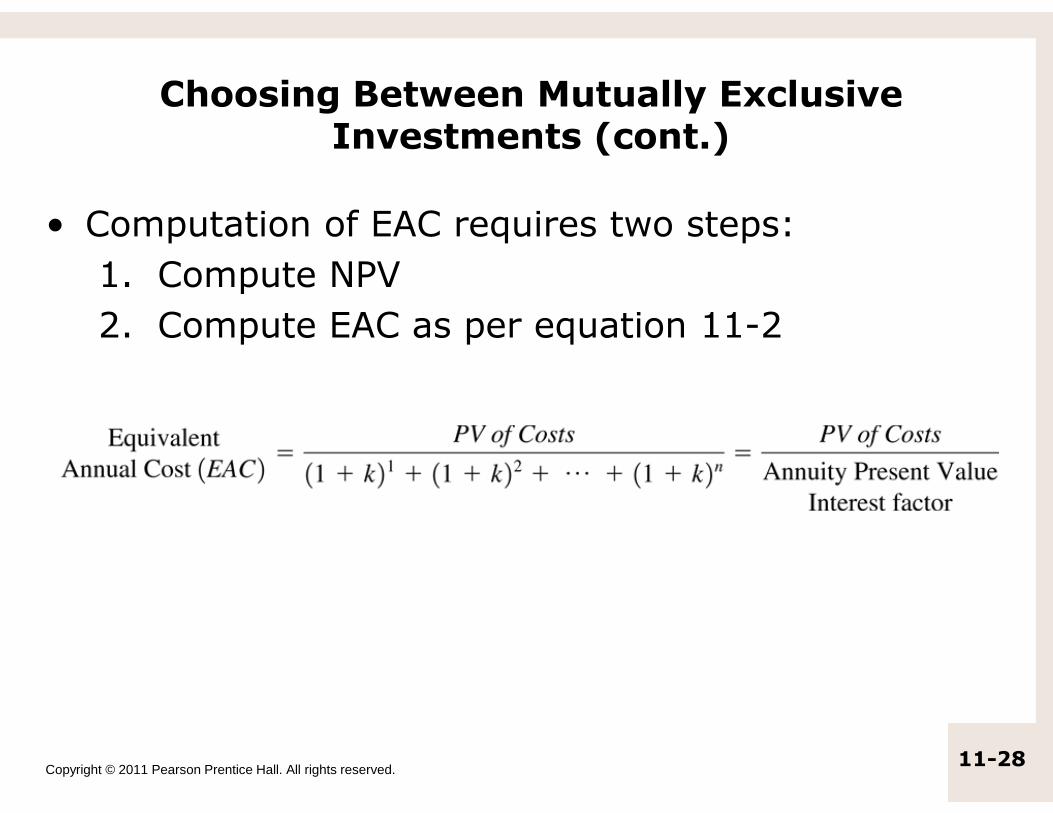
Choosing Between Mutually Exclusive Investments (cont.)
• Computation of EAC requires two steps:
1. Compute NPV
2. Compute EAC as per equation 11-2
Copyright © 2011 Pearson Prentice Hall. All rights reserved.11-28

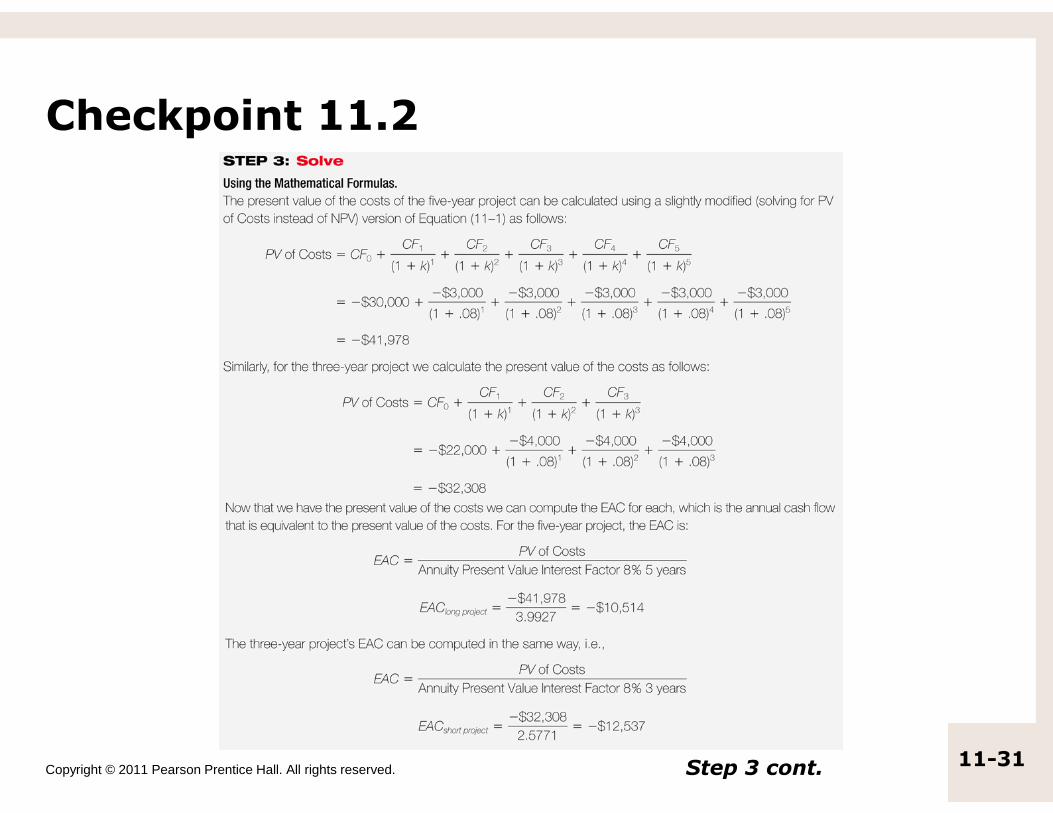
Example 11.2: Calculating the Equivalent Annual Cost (EAC)
Suppose your bottling plant is in need of a new bottle capper. You are considering two different capping machines that will perform equall y well, but have different expected lives .
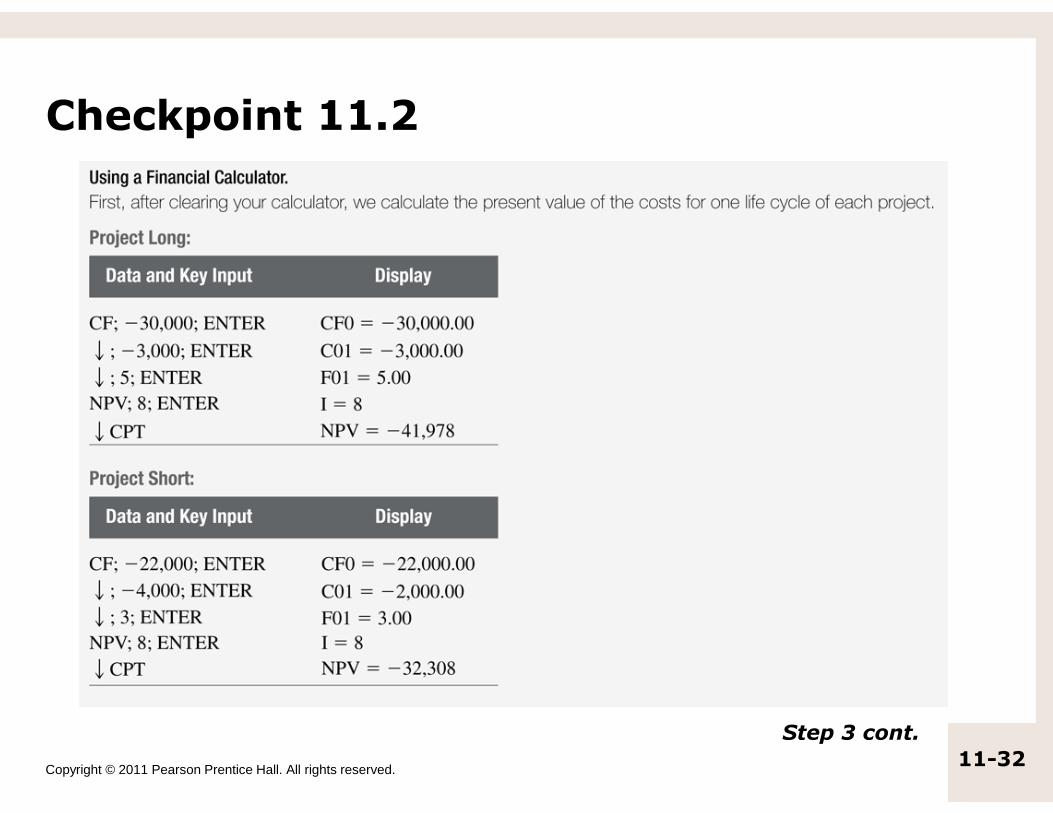
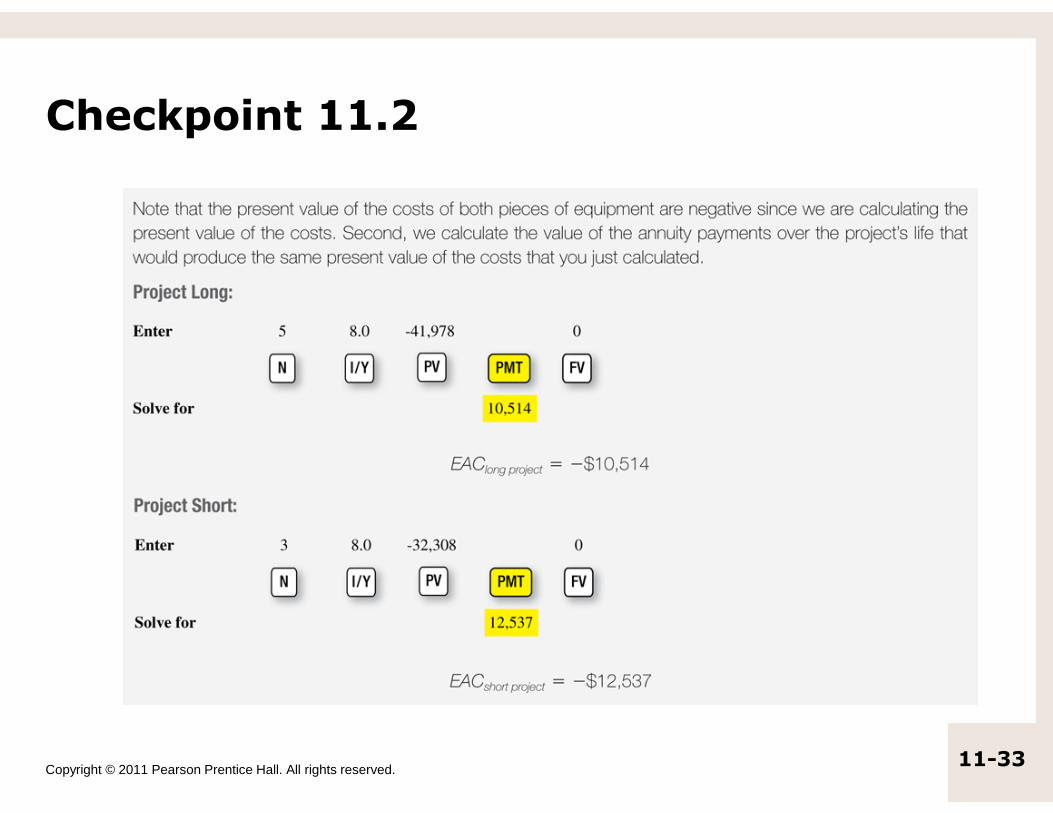
•The more expensive one costs $30,000 to buy, requires the payment of $3,000 per year for maintenance and operation expenses, and will last for 5 years.
• The cheaper model costs only $22,000, requires operating and maintenance costs of $4,000 per year, and lasts for only 3 years.
Copyright © 2011 Pearson Prentice Hall. All rights reserved.11-29
• Regardless of which machine you select, you intend to replace it at the end of its life with an identical machine with identical costs and operating performance characteristics.
• Because there is not a market for used cappers, there will be no salvage value associated with either machine.
• Assume that the discount rate on both of these machines is 8 percent.

Checkpoint 11.2
Copyright © 2011 Pearson Prentice Hall. All rights reserved.11-30
Checkpoint 11.2
Copyright © 2011 Pearson Prentice Hall. All rights reserved.11-31Step 3 cont.
Checkpoint 11.2
Copyright © 2011 Pearson Prentice Hall. All rights reserved.11-32
Step 3 cont.
Checkpoint 11.2
Copyright © 2011 Pearson Prentice Hall. All rights reserved.11-33
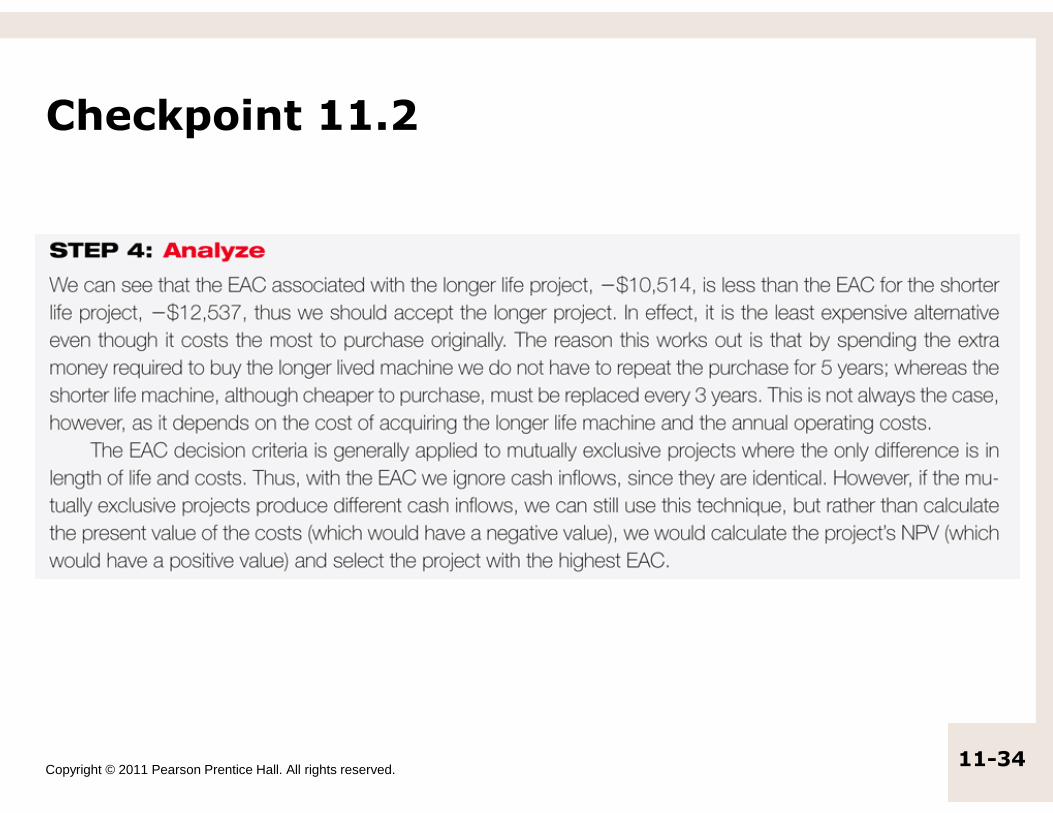
Checkpoint 11.2
Copyright © 2011 Pearson Prentice Hall. All rights reserved.11-34

Practice the EAC Method
• What is EAC for a machine that costs $50,000
• requires payment of $6,000 per year for maintenance and operation expense,
• and lasts for 6 years?
• Assume that the discount rate is 9% and there will be no salvage value associated with the
Copyright © 2011 Pearson Prentice Hall. All rights reserved.11-35
will be no salvage value associated with the machine.
• In addition, you intend to replace this machine at the end of its life with an identical machine with identical costs.

Step 1: Picture the Problem
k=9%
Years
Cash flows -$50 -$6 -$6 -$6 -$6 -$6 $6
(in $, thousands)
0 1 2 43 5 6
Copyright © 2011 Pearson Prentice Hall. All rights reserved.11-36
EAC =?

Step 2: Solve Using Mathematical Formula
It requires 2 steps:
– Computation of NPV
• Here the cash inflows are equal so we can use the annuity equation to determine the PV of cash inflows.
NPV = -$50,000 + PV of $6,000 each year
= -$50,000 + -$6,000 (PV of Annuity Factor)
= -$50,000 + -$6,000 {[1-(1/(1.09)6] ÷ (.06)}
Copyright © 2011 Pearson Prentice Hall. All rights reserved.11-37
= -$50,000 + -$6,000 {[1-(1/(1.09)6] ÷ (.06)}
= -$50,000 + -$6,000 {4.4859) = -$76,915
Computation of EAC• EAC = NPV ÷ Annuity Factor
= -$76,915 ÷ 4.4859
= -$17,145.95
Simpler approach would be PV = -76,915; I/Y = 9%, N=6, FV=0
Now solve for PMT = ??

11.3 Other Investment Criteria
Copyright © 2011 Pearson Prentice Hall. All rights reserved.
Criteria

Profitability Index
• The profitability index (PI) is a cost-benefit ratio equal to the present value of an investment’s future cash flows divided by its initial cost:
Copyright © 2011 Pearson Prentice Hall. All rights reserved.11-39
• Decision Criteria:
– If PI is greater than one, it indicates that the investment should be accepted. The NPV will be positive.
– If PI is less than one, the project should be rejected. If PI is less than one, the NPV will be negative.

Checkpoint 11.3
Example: Calculating the Profitability IndexProject Long is expected to provide five years of cash inflows and to require an initial investment of $100,000. The discount rate that is appropriate for calculating the PI of Project Long is 17 percent. Is Project Long a good investment opportunity?
Copyright © 2011 Pearson Prentice Hall. All rights reserved.11-40
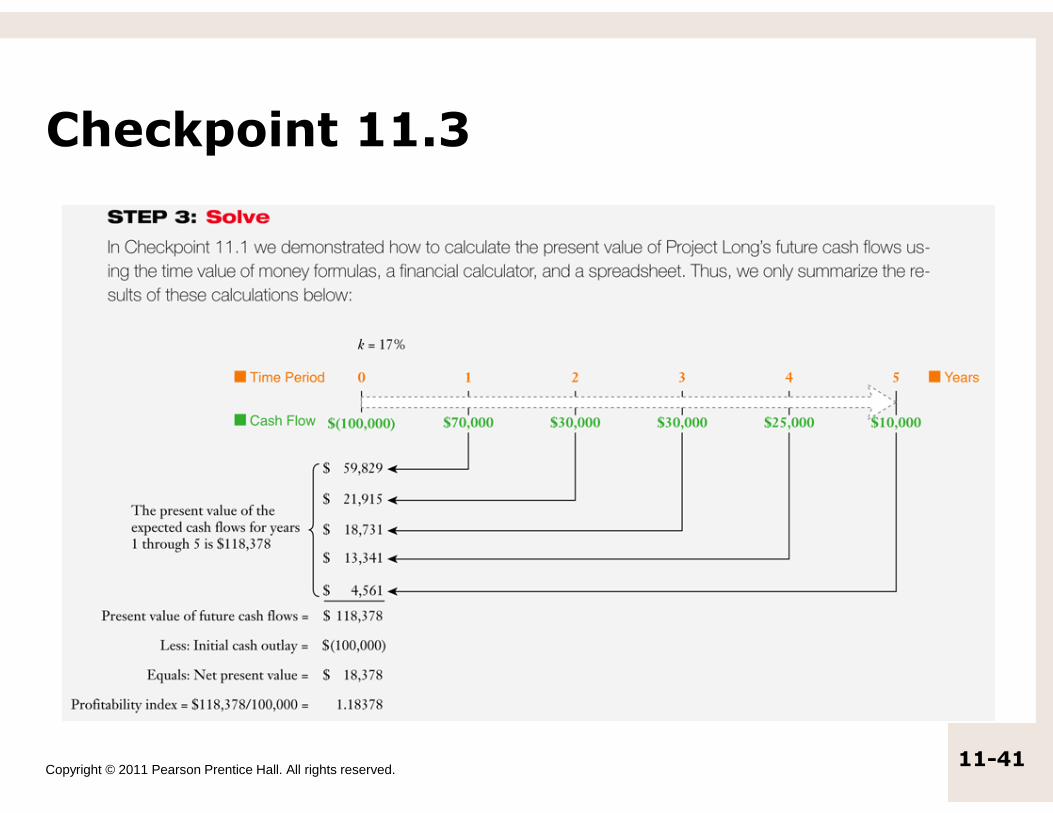
Checkpoint 11.3
Copyright © 2011 Pearson Prentice Hall. All rights reserved.11-41

Checkpoint 11.3: Check Yourself
• PNG Pharmaceuticals is considering an investment in a new automated materials handling system that is expected to reduce its drug manufacturing costs by eliminating much of the waste currently involved in its specialty drug division.
Copyright © 2011 Pearson Prentice Hall. All rights reserved.11-42
• The new system will require an initial investment of $50,000 and is expected to provide cash savings over the next six-year period as shown on next slide.

Step 3: Solve (cont.)
• Step 1: Computing PV of Cash Inflows
Year Expected Cash flow
Present Value at 10% discount rate
1 $15,000 $13,636.36
Copyright © 2011 Pearson Prentice Hall. All rights reserved.11-43
1 $15,000 $13,636.36
2 $8,000 $6,611.57
3 $10,000 $7,513.14
4 $12,000 $8,196.16
5 $14,000 $8,692.90
6 $16,000 $9,031.58
NPV of Expected Cash flows, Years 1-6
$53,681.72
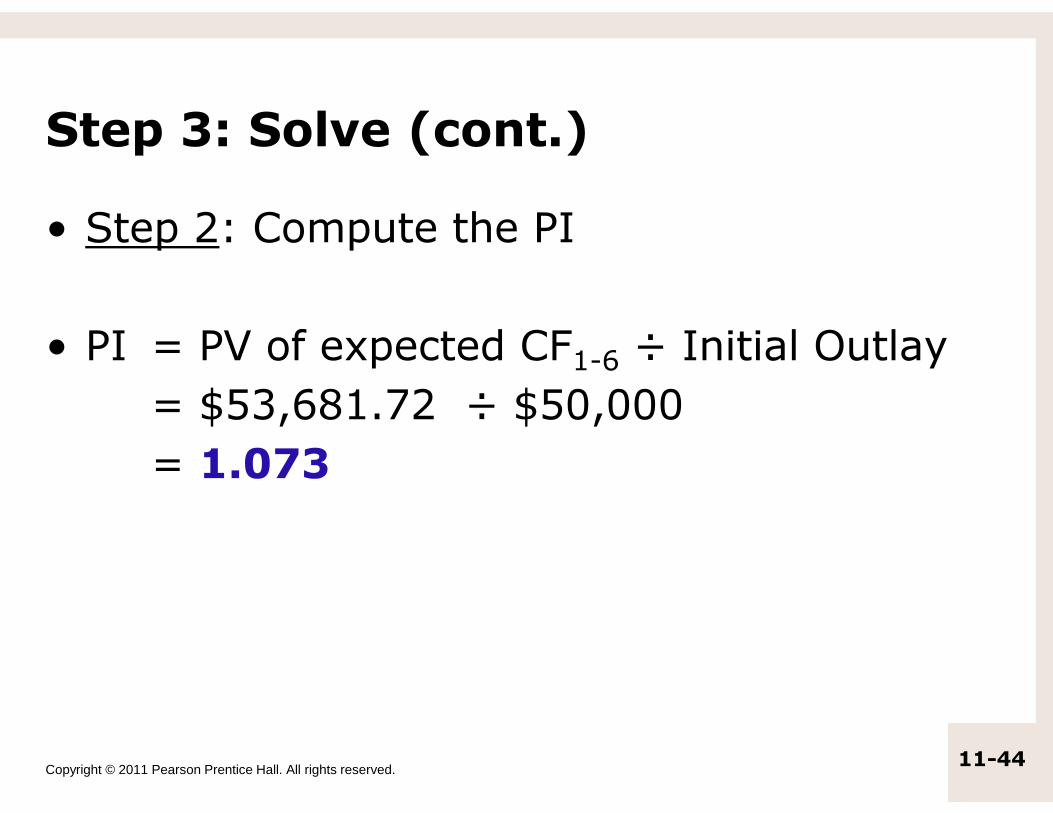
Step 3: Solve (cont.)
• Step 2: Compute the PI
• PI = PV of expected CF1-6 ÷ Initial Outlay
= $53,681.72 ÷ $50,000
Copyright © 2011 Pearson Prentice Hall. All rights reserved.11-44
= $53,681.72 ÷ $50,000
= 1.073
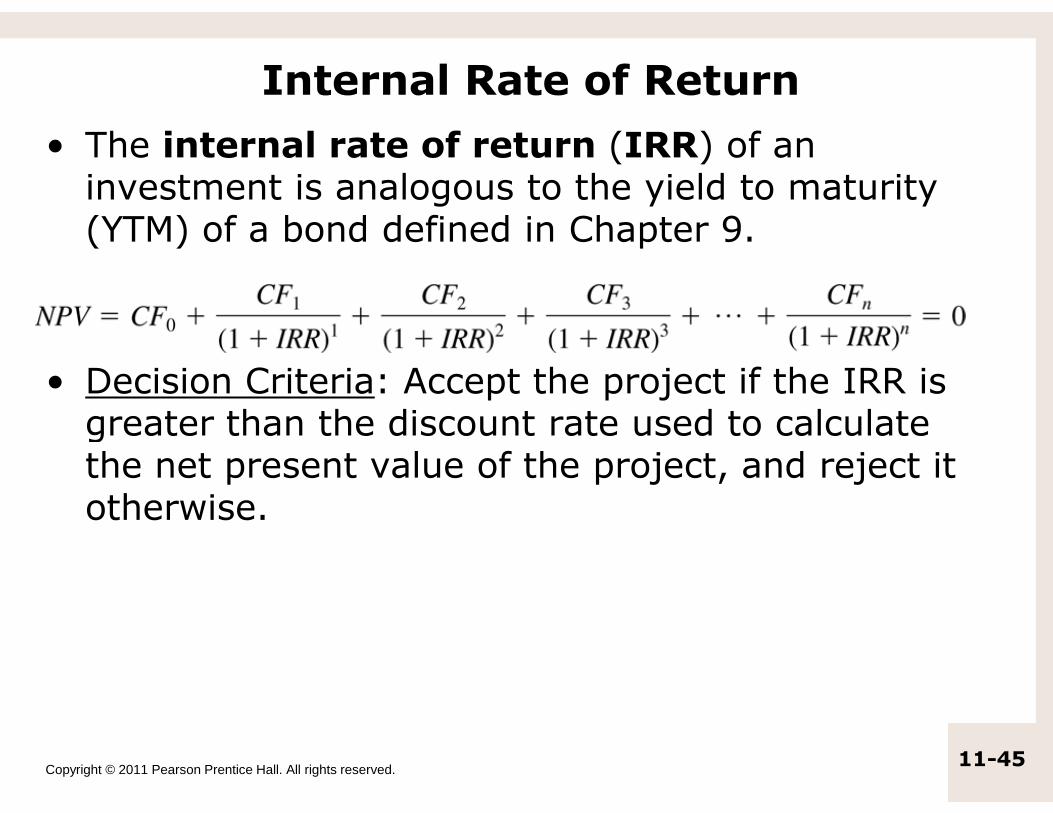
Internal Rate of Return
• The internal rate of return (IRR) of an investment is analogous to the yield to maturity (YTM) of a bond defined in Chapter 9.
• Decision Criteria: Accept the project if the IRR is greater than the discount rate used to calculate
Copyright © 2011 Pearson Prentice Hall. All rights reserved.11-45
greater than the discount rate used to calculate the net present value of the project, and reject it otherwise.
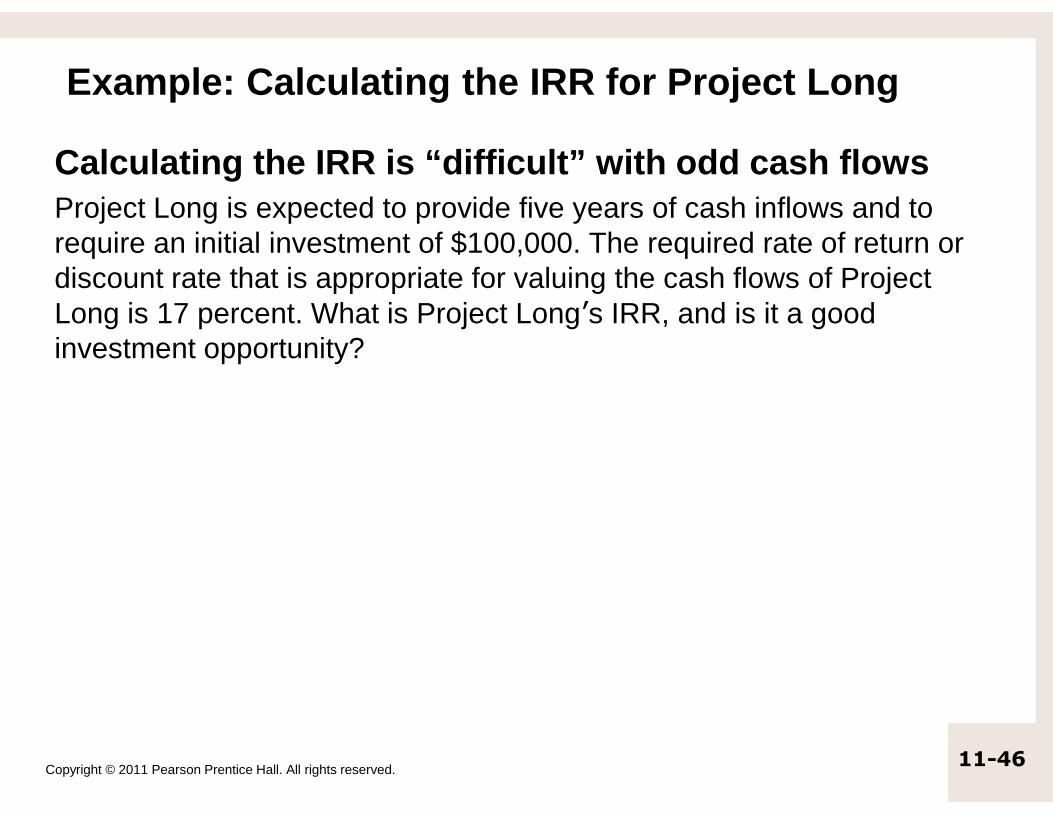
Example: Calculating the IRR for Project Long
Calculating the IRR is “difficult” with odd cash flow s Project Long is expected to provide five years of cash inflows and to require an initial investment of $100,000. The required rate of return or discount rate that is appropriate for valuing the cash flows of Project Long is 17 percent. What is Project Long’s IRR, and is it a good investment opportunity?
Copyright © 2011 Pearson Prentice Hall. All rights reserved.11-46

IRR with irregular cash flows
Copyright © 2011 Pearson Prentice Hall. All rights reserved.11-47
Step 3 cont.

Checkpoint 11.4
Copyright © 2011 Pearson Prentice Hall. All rights reserved.11-48Step 3 cont.

Checkpoint 11.4
Copyright © 2011 Pearson Prentice Hall. All rights reserved.11-49
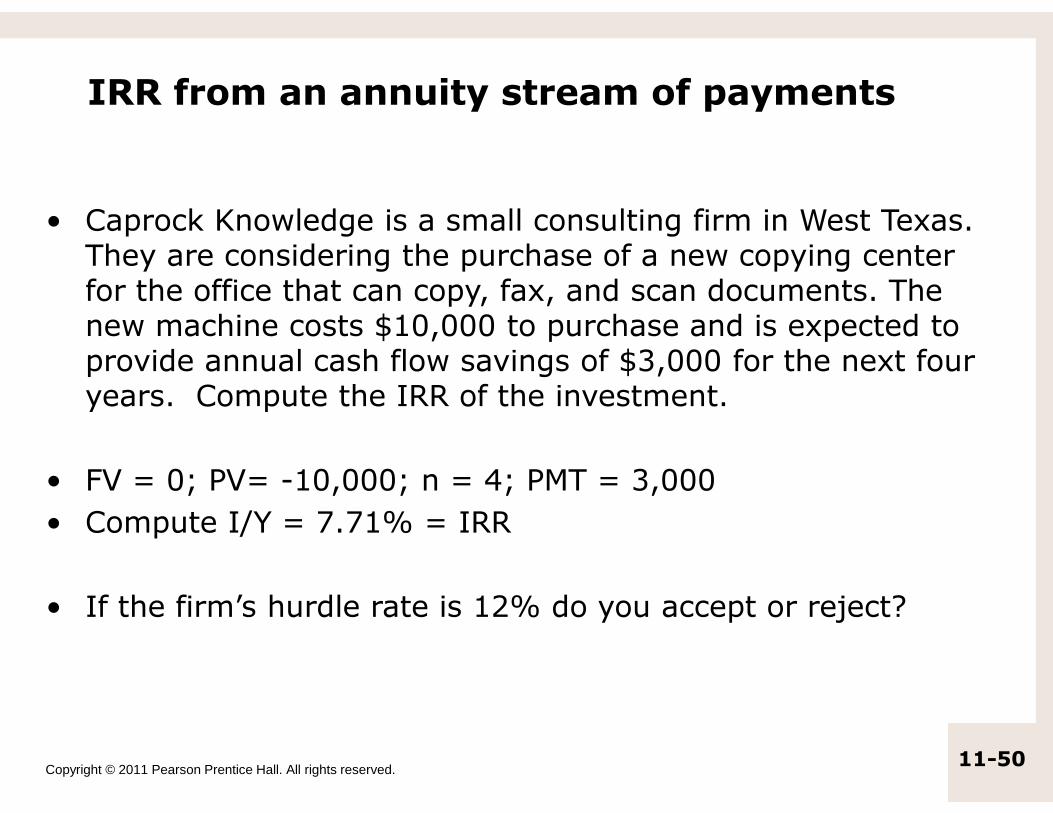
IRR from an annuity stream of payments
• Caprock Knowledge is a small consulting firm in West Texas. They are considering the purchase of a new copying center for the office that can copy, fax, and scan documents. The new machine costs $10,000 to purchase and is expected to provide annual cash flow savings of $3,000 for the next four years. Compute the IRR of the investment.
Copyright © 2011 Pearson Prentice Hall. All rights reserved.11-50
years. Compute the IRR of the investment.
• FV = 0; PV= -10,000; n = 4; PMT = 3,000
• Compute I/Y = 7.71% = IRR
• If the firm’s hurdle rate is 12% do you accept or reject?

Complications with IRR: Multiple Rates of Return
• Although any project can have only one NPV, a single project can, under certain circumstances, have more than one IRR.
Copyright © 2011 Pearson Prentice Hall. All rights reserved.11-51
• Checkpoint 11.5 illustrates a case of multiple IRRs.

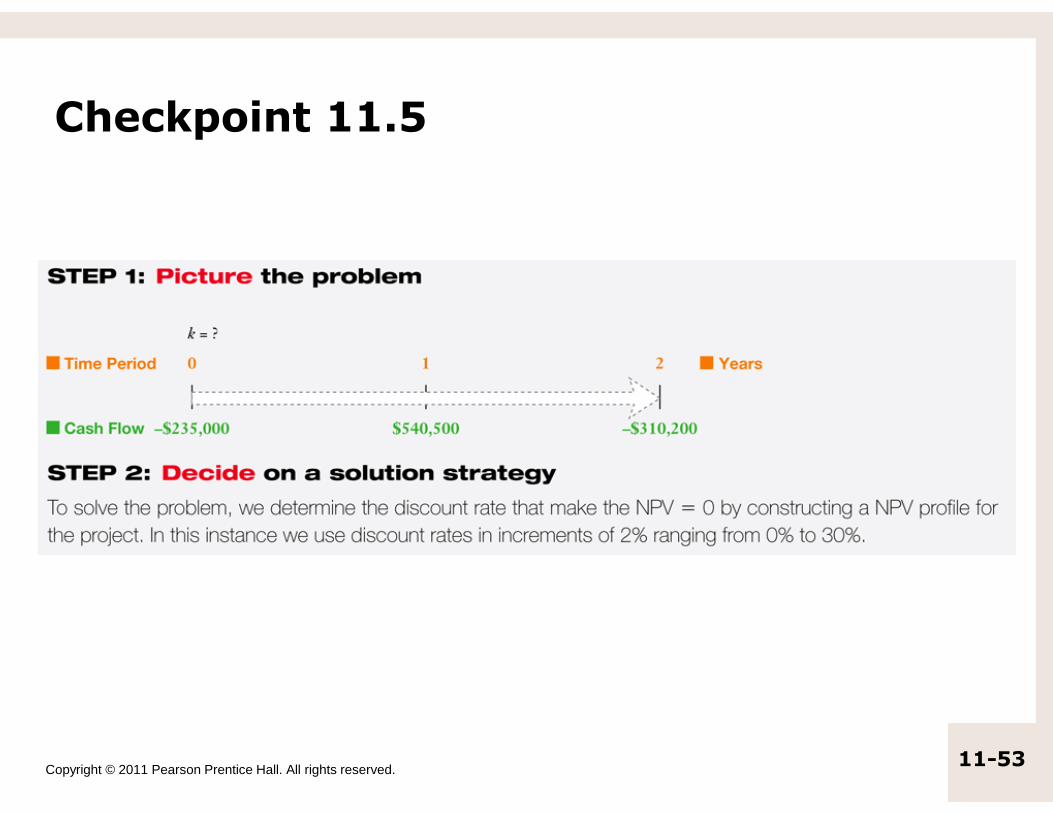
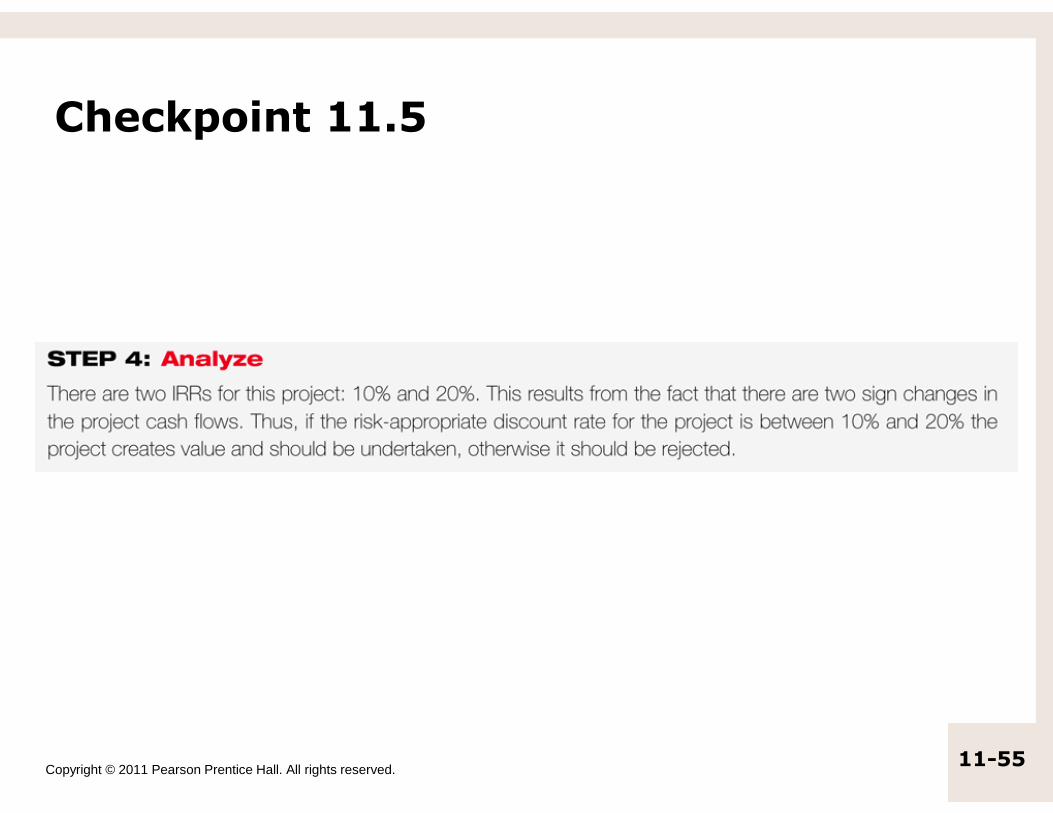
Checkpoint 11.5
The Problem of Multiple IRRs for ProjectsDescartes’ Rule of Signs tells us that there can be as many IRRs for an investment project as there are changes in the sign of the cash flows over its n-year life. To illustrate the problem, consider a project that has three cash flows: a $235,000 outlay in year 0, a $540,500 inflow in year 1, and a $310,200 outflow at the end of year 2. Calculate the IRR for the investment.
Copyright © 2011 Pearson Prentice Hall. All rights reserved.11-52
Calculate the IRR for the investment.
Checkpoint 11.5
Copyright © 2011 Pearson Prentice Hall. All rights reserved.11-53

Checkpoint 11.5
Copyright © 2011 Pearson Prentice Hall. All rights reserved.11-54
Checkpoint 11.5
Copyright © 2011 Pearson Prentice Hall. All rights reserved.11-55
Reinvestment Rate Assumptions
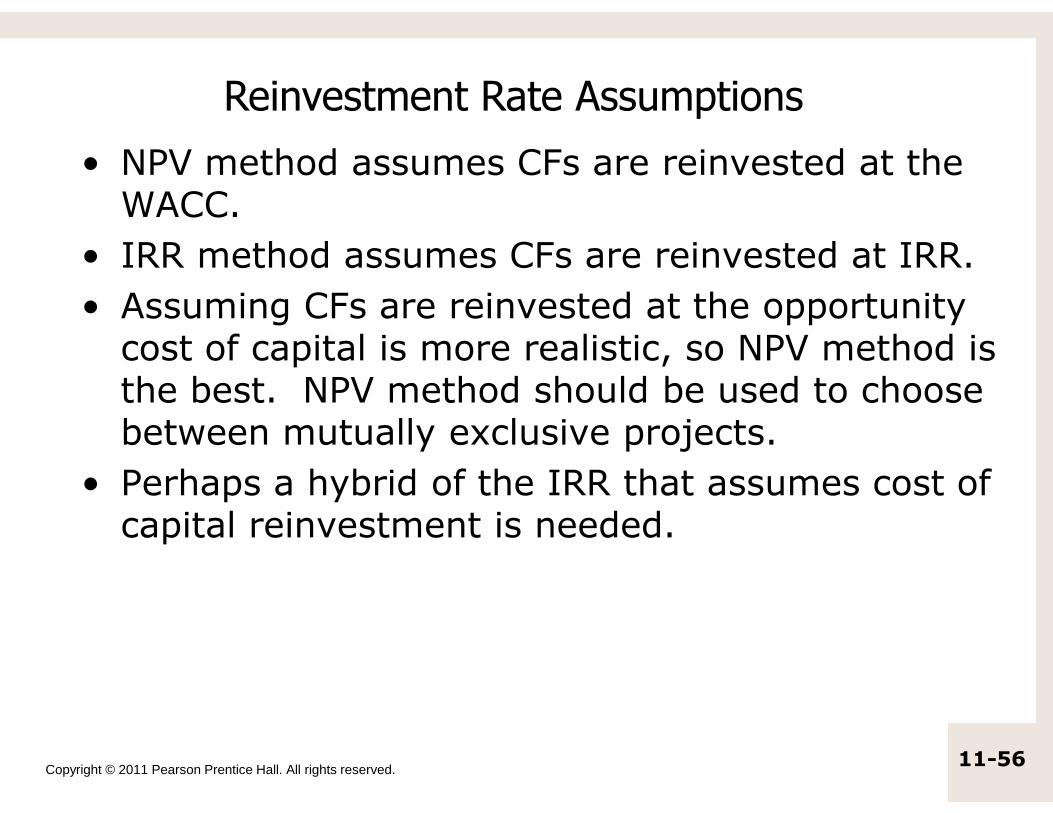
• NPV method assumes CFs are reinvested at the WACC.
• IRR method assumes CFs are reinvested at IRR.
• Assuming CFs are reinvested at the opportunity cost of capital is more realistic, so NPV method is the best. NPV method should be used to choose
Copyright © 2011 Pearson Prentice Hall. All rights reserved.11-56
the best. NPV method should be used to choose between mutually exclusive projects.
• Perhaps a hybrid of the IRR that assumes cost of capital reinvestment is needed.

NPV Profiles: Using the IRR with Mutually Exclusive Investments
• Problem that is faced: When comparing two mutually exclusive projects, IRR and NPV may not lead to the same conclusion.
• For example, we may be selecting between 2 projects and both IRR and NPV values may
Copyright © 2011 Pearson Prentice Hall. All rights reserved.11-57
projects and both IRR and NPV values may suggest that the projects are financially feasible.
• However, the ranking of two projects may not be the same using NPV and IRR.

Copyright © 2011 Pearson Prentice Hall. All rights reserved.11-58
Figure 11.2 cont.

Copyright © 2011 Pearson Prentice Hall. All rights reserved.11-59
Figure 11.2 cont.
Modified Internal Rate of Return
• Modified Internal Rate of Return (MIRR) deals with the problem of multiple IRRs.
Copyright © 2011 Pearson Prentice Hall. All rights reserved.11-60
• This is done by rearranging the cash flows so that there is only one change of sign of the cash flows over the life of the project.

Since managers prefer the IRR to the NPV method, is there a better IRR measure?
• Yes, MIRR is the discount rate that causes the PV of a project’s terminal value (TV) to equal the PV of costs. TV is found by compounding inflows at WACC.
Copyright © 2011 Pearson Prentice Hall. All rights reserved.11-61
• MIRR assumes cash flows are reinvested at the WACC.
11-61
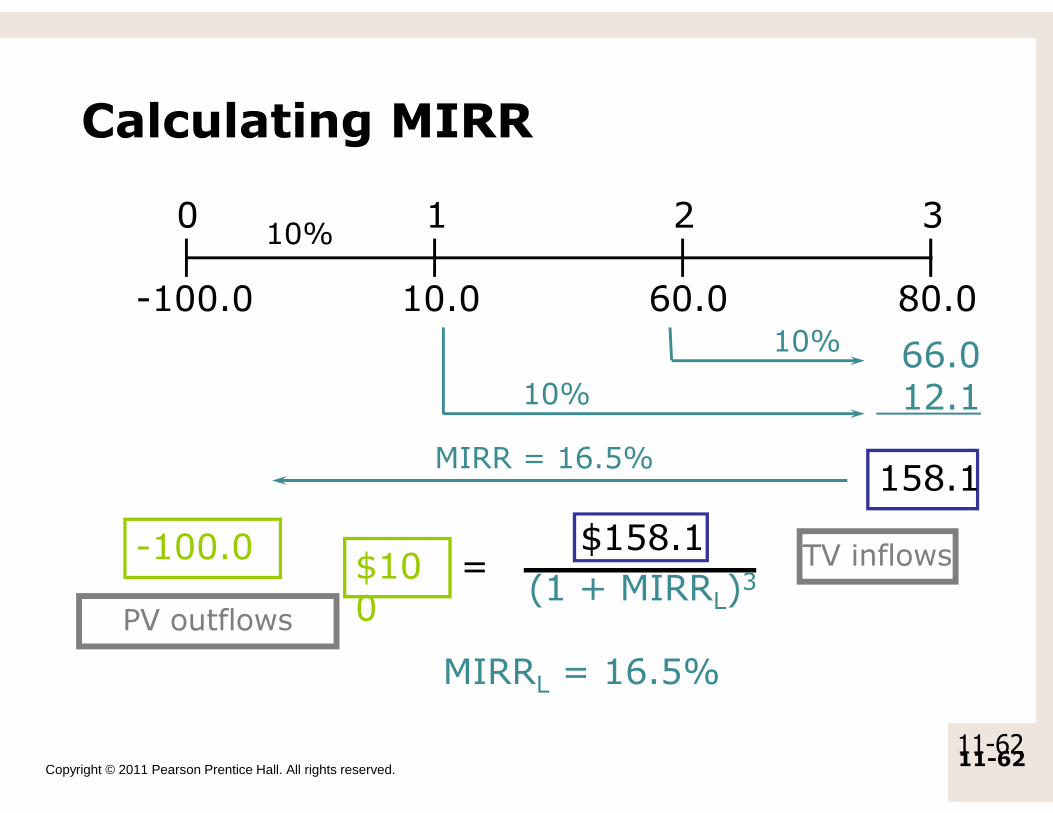
Calculating MIRR
66.012.1
10%
10%
-100.0
010%
321
10.0 60.0 80.0
Copyright © 2011 Pearson Prentice Hall. All rights reserved.11-6211-62
12.110%
PV outflows
-100.0$100
MIRR = 16.5%158.1
TV inflows
MIRRL = 16.5%
$158.1
(1 + MIRRL)3=

Why use MIRR versus IRR?
• MIRR assumes reinvestment at the opportunity cost = WACC. MIRR also avoids the multiple IRR problem.
• Managers like rate of return comparisons,
Copyright © 2011 Pearson Prentice Hall. All rights reserved.11-63
• Managers like rate of return comparisons, and MIRR is better for this than IRR.
11-63
Payback Period
• The Payback period for an investment opportunity is the number of years needed to recover initial cash outlay required to make the investment.
• Decision Criteria: Accept the project if the payback period is less than a pre-specified
Copyright © 2011 Pearson Prentice Hall. All rights reserved.11-64
payback period is less than a pre-specified number of years.

Calculating Payback
CFt
0 1 2 3
Project L’s Payback Calculation
80-100 6010
Copyright © 2011 Pearson Prentice Hall. All rights reserved.11-65
Payback(L) = 2 + 30/80 = 2.375 years
PaybackS = 1.600 years
11-65
CFt
Cumulative -30-100 50-90
80-100 6010
Limitations of Payback Period
1. It ignores the time value of money
2. The payback period ignores cash flows that are generated by the project beyond the end of the payback period.
Copyright © 2011 Pearson Prentice Hall. All rights reserved.11-66
the end of the payback period.
3. There is no clear-cut way to define the cutoff criterion for the payback period that is tied to the value creation potential of the investment.

Copyright © 2011 Pearson Prentice Hall. All rights reserved.11-67
Discounted Payback Period
• Discounted payback period is similar to payback period except it uses discounted cash flows to calculate the discounted period. The discount rate is the same as the one used for calculating the NPV.
Copyright © 2011 Pearson Prentice Hall. All rights reserved.11-68
• Decision Criteria: Accept the project if its discounted payback period is less than the pre-specified number of years.

Copyright © 2011 Pearson Prentice Hall. All rights reserved.11-69
Attractiveness of Payback Methods
1. Payback and discounted payback are more intuitive and relatively easier to understand compared to NPV or IRR.
2. Payback period can be seen as a crude indicator of risk as payback favors initial year cash flows, which, in general, are less risky than more distant cash flows.
Copyright © 2011 Pearson Prentice Hall. All rights reserved.11-70
3. Discounted payback is used as a supplemental analytical tool in cases where obsolescence is a risk and the emphasis is on getting the money back before the market disappears or the product becomes obsolete.
4. Payback method is useful when capital is being rationed and managers would like to know how long a project will tie up capital.
Copyright © 2011 Pearson Prentice Hall. All rights reserved.11-71

11.4 A Glance at Actual Capital Budgeting Practices
Copyright © 2011 Pearson Prentice Hall. All rights reserved.
Practices

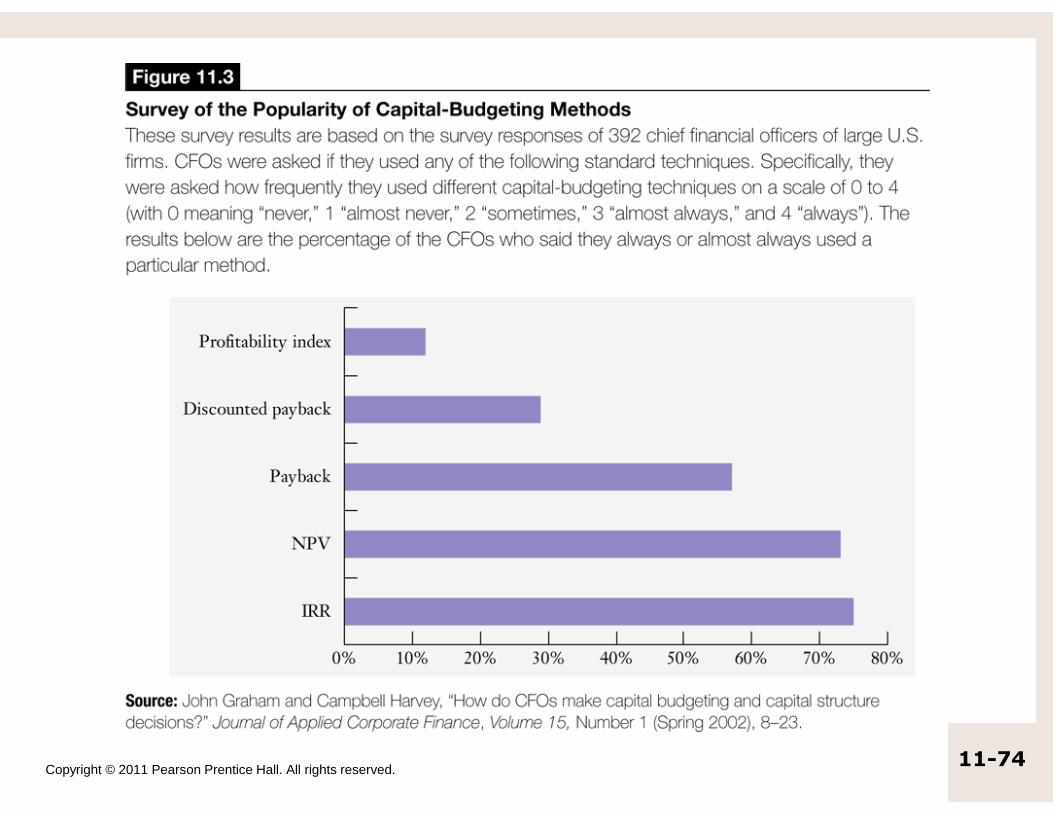
A Glance at Actual Capital Budgeting Practices
• Figure 11-3 shows the results of a survey of CFOs of large US firms, showing the popularity of the payback, discounted payback, NPV, PI, and IRR methods for evaluating capital investment
Copyright © 2011 Pearson Prentice Hall. All rights reserved.11-73
evaluating capital investment opportunities.
• The results show that NPV and IRR methods are the most popular although many firms use Payback method too.
Copyright © 2011 Pearson Prentice Hall. All rights reserved.11-74