investment and portfolio
TRANSCRIPT

[Type text] [Type text] [Type text]
Un i v e r s i t y o f T e c h n o l o g y , S y d n e y ( U T S )
08 Fall
16332
Inves tment and Port fo l io
Individual Assignment
Student Name: Ami Doshi
Student No.: 1082 0049
Investment and Portfolio
-2-
CONTENTS 1. Introduction 3
2. A-REIT (Bunnings Warehouse Property Trust) 4
3. Bunnings Warehouse Property Trust Performance between 2006 – 2010 5
4. Bunnings Warehouse Property Trust Investment Strategy 8
a. How the Strategy was executed and funded? 8
b. Level of Success 9
c. Factors that influenced Success 9
d. Impact on overall investment returns 9
5. Outlook for Bunnings Warehouse Property Trust 10
6. A-REIT Investing Overseas (Astro Japan Property Group) 11
7. Astro Japan Property Group Performance between 2006 – 2010 12
8. Astro Japan Property Group Investment Strategy 14
a. How the Strategy was executed and funded? 14
b. Level of Success 15
c. Factors that influenced Success 15
d. Impact on overall investment returns 15
9. Outlook for Astro Japan Property Group 16
10. Benchmark Index of Financial Performance for the A-REIT sector 17
11. Macroeconomic & Microeconomic Impacts 18
12. A-REIT Outlook 19
13. References 20
Investment and Portfolio
-3-
INTRODUCTION Australian Real Estate Investment Trusts (A-REIT) are companies, which are traded on the
Australian Securities Exchange (ASX) by investors which allows them to buy an interest in a
professionally managed portfolio of commercial real estate1. A-REITs usually own portfolios of
large number of properties, which, because of their size and value cannot be managed by an
average private investor. Thus, these investments are divided into units of smaller value, which
can be easily purchased and managed by private investors who are known as unit-holders.2
Investors can diversify their portfolio by purchasing interests of multiple companies across a
diversity of geographic regions, lease lengths and tenant types and thus, gain exposure to both
the value of real estate that trust owns and the regular rental income generated from the
properties. A-REIT investments may include the following types of real estate:
• Office buildings
• Industrial estates
• Retail shopping centres
• Hotels and pubs and
• International (USA, Asia, Japan and Europe)
• Multi sector (diversified)3
Returns from A-REITs are in the form of income and capital return, which is distributed on quarter
or half-yearly basis.
A-REITs are traded as unit security or stapled security. A stapled security is comprised of two
parts (unit of the trust and share of the company), which are inseparable. Stapled security is
influenced by both parts and thus must be treated as one unit at all times.
1 ASX A-REITs - ASX-listed Australian Real Estate Investment Trusts Fact Sheet 2 http://en.wikipedia.org/wiki/Australian_real_estate_investment_trust 3 ASX A-REITs - ASX-listed Australian Real Estate Investment Trusts Fact Sheet
Investment and Portfolio
-4-
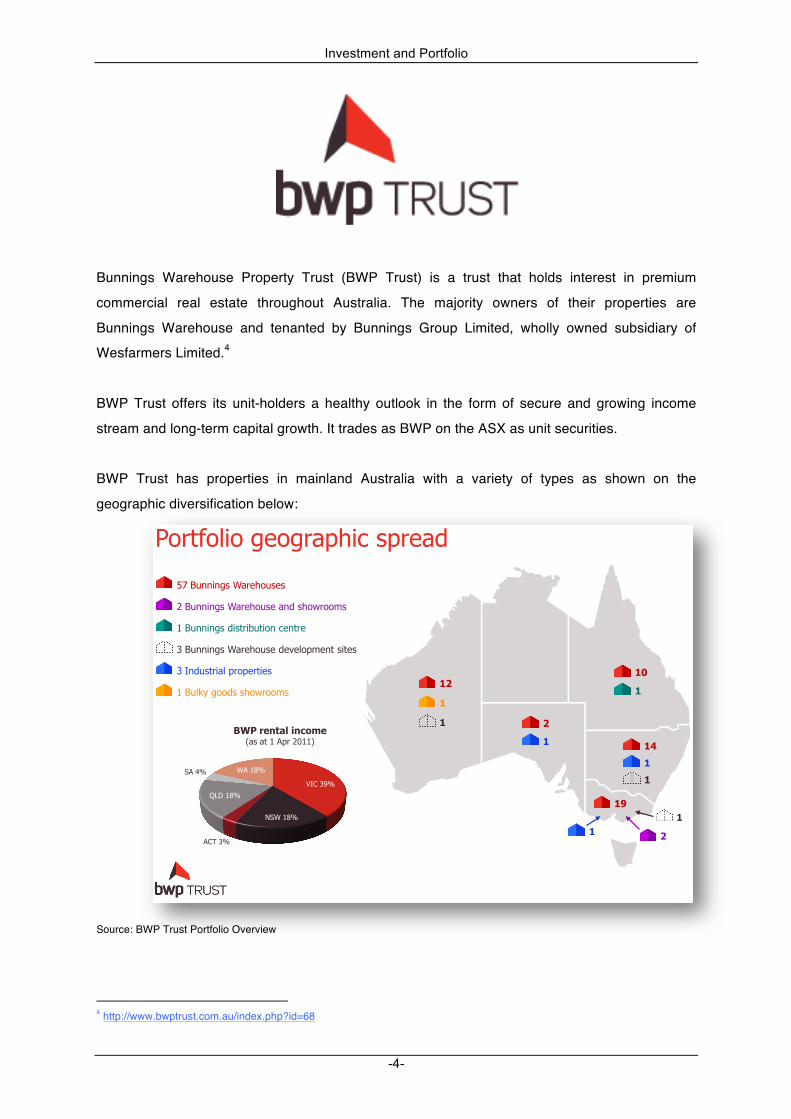
Bunnings Warehouse Property Trust (BWP Trust) is a trust that holds interest in premium
commercial real estate throughout Australia. The majority owners of their properties are
Bunnings Warehouse and tenanted by Bunnings Group Limited, wholly owned subsidiary of
Wesfarmers Limited.4
BWP Trust offers its unit-holders a healthy outlook in the form of secure and growing income
stream and long-term capital growth. It trades as BWP on the ASX as unit securities.
BWP Trust has properties in mainland Australia with a variety of types as shown on the
geographic diversification below:
Source: BWP Trust Portfolio Overview
4 http://www.bwptrust.com.au/index.php?id=68
!"#$%"&'"()*")#+,-'.(/,#*+0
123(456
789(:;6
<3=(46
>?@(:;6
8<(A6 9<(:;6
!"#$%&'()*$+',-.&B+/(+$(:(<,#(CD::E
/
001
0
/
0
02
0
FG(HIJJ'J)/(9+#*-"I/*/
C(HIJJ'J)/(9+#*-"I/*(+J0(/-"K#""L/
:(HIJJ'J)/(0'/$#'MI$'"J(.*J$#*
4(HIJJ'J)/(9+#*-"I/*(0*N*&",L*J$(/'$*/
4(2J0I/$#'+&(,#",*#$'*/
:(HI&OP()""0/(/-"K#""L/0/
0
0
0
03
0
Investment and Portfolio
-5-
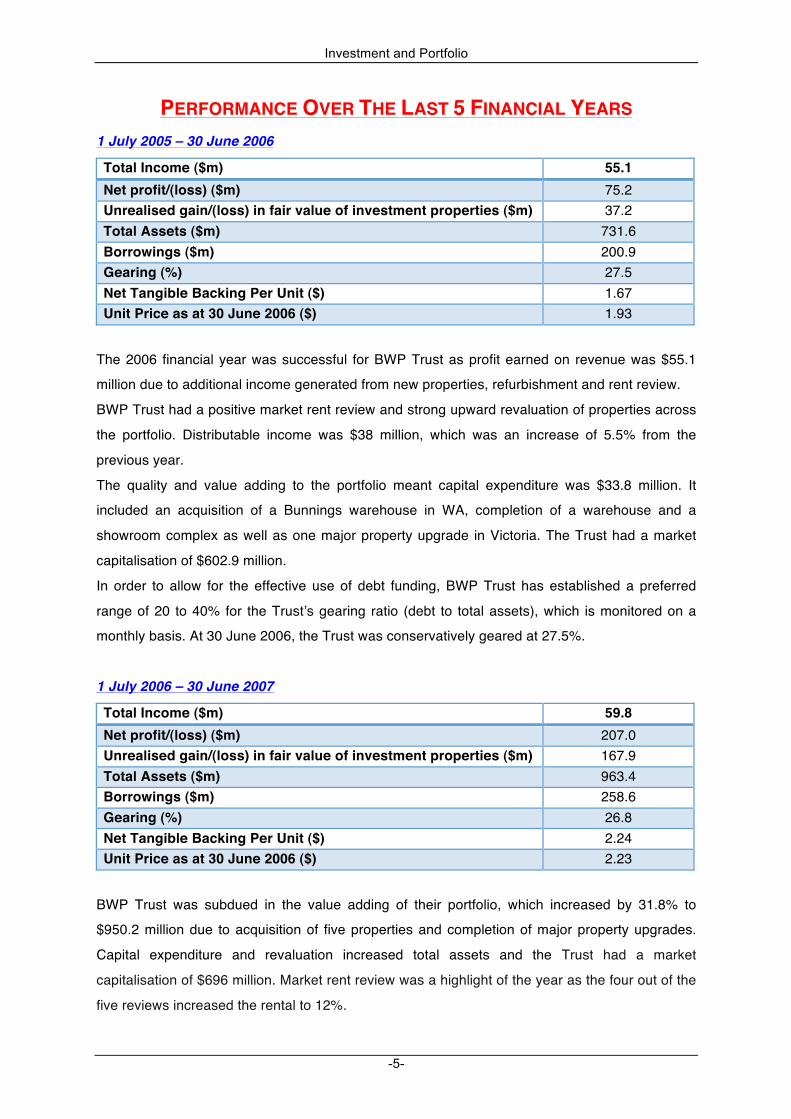
PERFORMANCE OVER THE LAST 5 FINANCIAL YEARS 1 July 2005 – 30 June 2006
Total Income ($m) 55.1 Net profit/(loss) ($m) 75.2 Unrealised gain/(loss) in fair value of investment properties ($m) 37.2 Total Assets ($m) 731.6 Borrowings ($m) 200.9 Gearing (%) 27.5 Net Tangible Backing Per Unit ($) 1.67 Unit Price as at 30 June 2006 ($) 1.93
The 2006 financial year was successful for BWP Trust as profit earned on revenue was $55.1
million due to additional income generated from new properties, refurbishment and rent review.
BWP Trust had a positive market rent review and strong upward revaluation of properties across
the portfolio. Distributable income was $38 million, which was an increase of 5.5% from the
previous year.
The quality and value adding to the portfolio meant capital expenditure was $33.8 million. It
included an acquisition of a Bunnings warehouse in WA, completion of a warehouse and a
showroom complex as well as one major property upgrade in Victoria. The Trust had a market
capitalisation of $602.9 million.
In order to allow for the effective use of debt funding, BWP Trust has established a preferred
range of 20 to 40% for the Trustʼs gearing ratio (debt to total assets), which is monitored on a
monthly basis. At 30 June 2006, the Trust was conservatively geared at 27.5%.
1 July 2006 – 30 June 2007
Total Income ($m) 59.8 Net profit/(loss) ($m) 207.0 Unrealised gain/(loss) in fair value of investment properties ($m) 167.9 Total Assets ($m) 963.4 Borrowings ($m) 258.6 Gearing (%) 26.8 Net Tangible Backing Per Unit ($) 2.24 Unit Price as at 30 June 2006 ($) 2.23
BWP Trust was subdued in the value adding of their portfolio, which increased by 31.8% to
$950.2 million due to acquisition of five properties and completion of major property upgrades.
Capital expenditure and revaluation increased total assets and the Trust had a market
capitalisation of $696 million. Market rent review was a highlight of the year as the four out of the
five reviews increased the rental to 12%.
Investment and Portfolio
-6-
BWP Trust has $280 million debt facilities with three main Australian Banks and the board
continues to consider the best option for funding existing debt and future acquisitions.
At 30 June 2007, the Trustʼs low gearing of 26.8%, provides substantial capacity to debt fund
acquisitions and developments as opportunities arise.
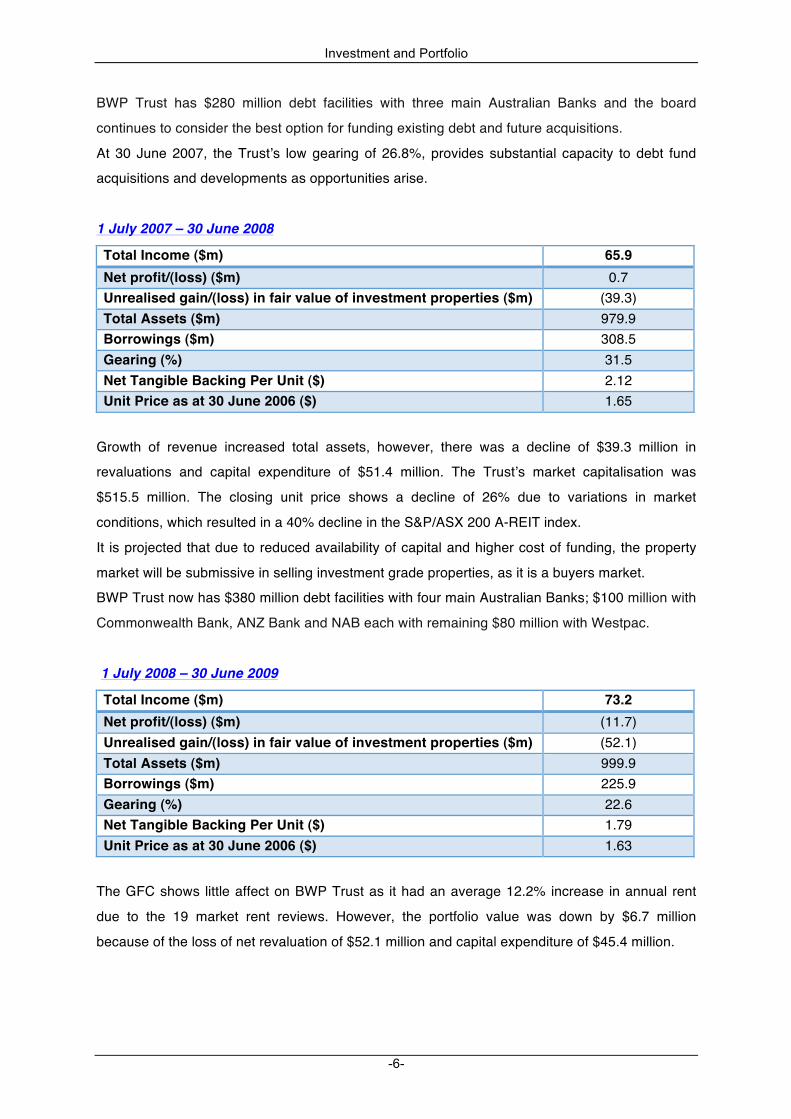
1 July 2007 – 30 June 2008
Total Income ($m) 65.9 Net profit/(loss) ($m) 0.7 Unrealised gain/(loss) in fair value of investment properties ($m) (39.3) Total Assets ($m) 979.9 Borrowings ($m) 308.5 Gearing (%) 31.5 Net Tangible Backing Per Unit ($) 2.12 Unit Price as at 30 June 2006 ($) 1.65
Growth of revenue increased total assets, however, there was a decline of $39.3 million in
revaluations and capital expenditure of $51.4 million. The Trustʼs market capitalisation was
$515.5 million. The closing unit price shows a decline of 26% due to variations in market
conditions, which resulted in a 40% decline in the S&P/ASX 200 A-REIT index.
It is projected that due to reduced availability of capital and higher cost of funding, the property
market will be submissive in selling investment grade properties, as it is a buyers market.
BWP Trust now has $380 million debt facilities with four main Australian Banks; $100 million with
Commonwealth Bank, ANZ Bank and NAB each with remaining $80 million with Westpac.
1 July 2008 – 30 June 2009
Total Income ($m) 73.2 Net profit/(loss) ($m) (11.7) Unrealised gain/(loss) in fair value of investment properties ($m) (52.1) Total Assets ($m) 999.9 Borrowings ($m) 225.9 Gearing (%) 22.6 Net Tangible Backing Per Unit ($) 1.79 Unit Price as at 30 June 2006 ($) 1.63
The GFC shows little affect on BWP Trust as it had an average 12.2% increase in annual rent
due to the 19 market rent reviews. However, the portfolio value was down by $6.7 million
because of the loss of net revaluation of $52.1 million and capital expenditure of $45.4 million.
Investment and Portfolio
-7-
BWP Trustʼs financial position was enhanced through the $150 million capital raising and two
banks agreeing to extend the existing banking facilities to $180 million, which has been used to
reduce the Trustʼs debt.
The real strength of a Trust is measured by comparing it performance relative to the market.
BWP Trust was the only A-REIT to make a positive total return of 5.2% during the year as
opposed to the negative 42.3% of the sector.
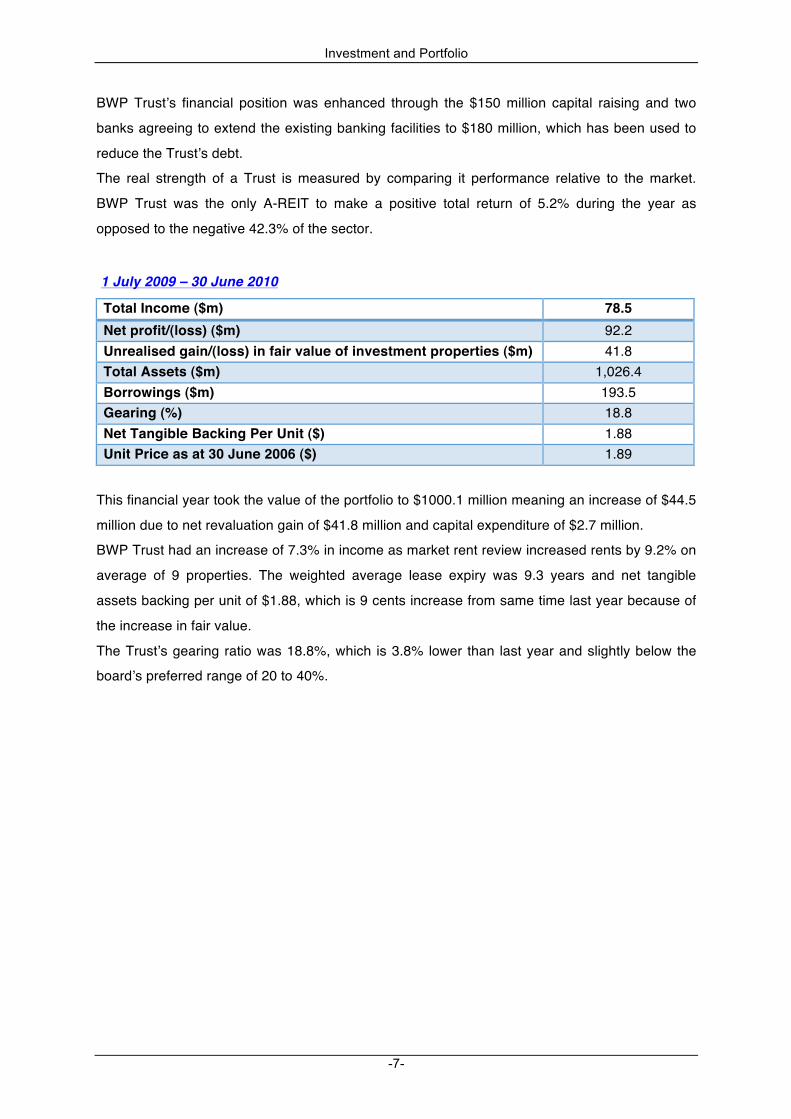
1 July 2009 – 30 June 2010
Total Income ($m) 78.5 Net profit/(loss) ($m) 92.2 Unrealised gain/(loss) in fair value of investment properties ($m) 41.8 Total Assets ($m) 1,026.4 Borrowings ($m) 193.5 Gearing (%) 18.8 Net Tangible Backing Per Unit ($) 1.88 Unit Price as at 30 June 2006 ($) 1.89
This financial year took the value of the portfolio to $1000.1 million meaning an increase of $44.5
million due to net revaluation gain of $41.8 million and capital expenditure of $2.7 million.
BWP Trust had an increase of 7.3% in income as market rent review increased rents by 9.2% on
average of 9 properties. The weighted average lease expiry was 9.3 years and net tangible
assets backing per unit of $1.88, which is 9 cents increase from same time last year because of
the increase in fair value.
The Trustʼs gearing ratio was 18.8%, which is 3.8% lower than last year and slightly below the
boardʼs preferred range of 20 to 40%.
Investment and Portfolio
-8-
BWP TRUST INVESTMENT STRATEGY
BWP Trustʼs core purpose is to provide premium commercial real-estate investment properties
so that its unit-holders can enjoy a secure and growing income stream and long-term capital
growth. Their objective is to distribute all net income each financial year, add quality properties to
the portfolio and protect unit-holdersʼ interests.
BWP Trust has innovated strategies to meet their core purpose and objectives.
Strategies5
1. Drive better returns from existing assets through focused and pro-active asset management
2. Generate growth by acquiring quality commercial properties that meet the Trust's investment
criteria
3. Deliver efficiency, sustainability and value through effective management of the Trust and its
capital
4. Acquiring properties with long-term leases to substantial tenants, ensuring that the properties
are well located and the portfolio is geographically diversified, and adding value
5. Maintaining a prudent interest rate hedging position
a. How the Strategy was executed and funded?6
The strategy was executed using the following investment criteria:
• Ample land area (average 3 hectares), significant catchment area, offers geographic diversity
• Visible and accessible from a major road, highway or freeway
• Ready vehicle access and ample on-site parking
• Financially substantial tenant in an economically, socially and environmentally sustainable
business
• Includes sustainability measures or prospects
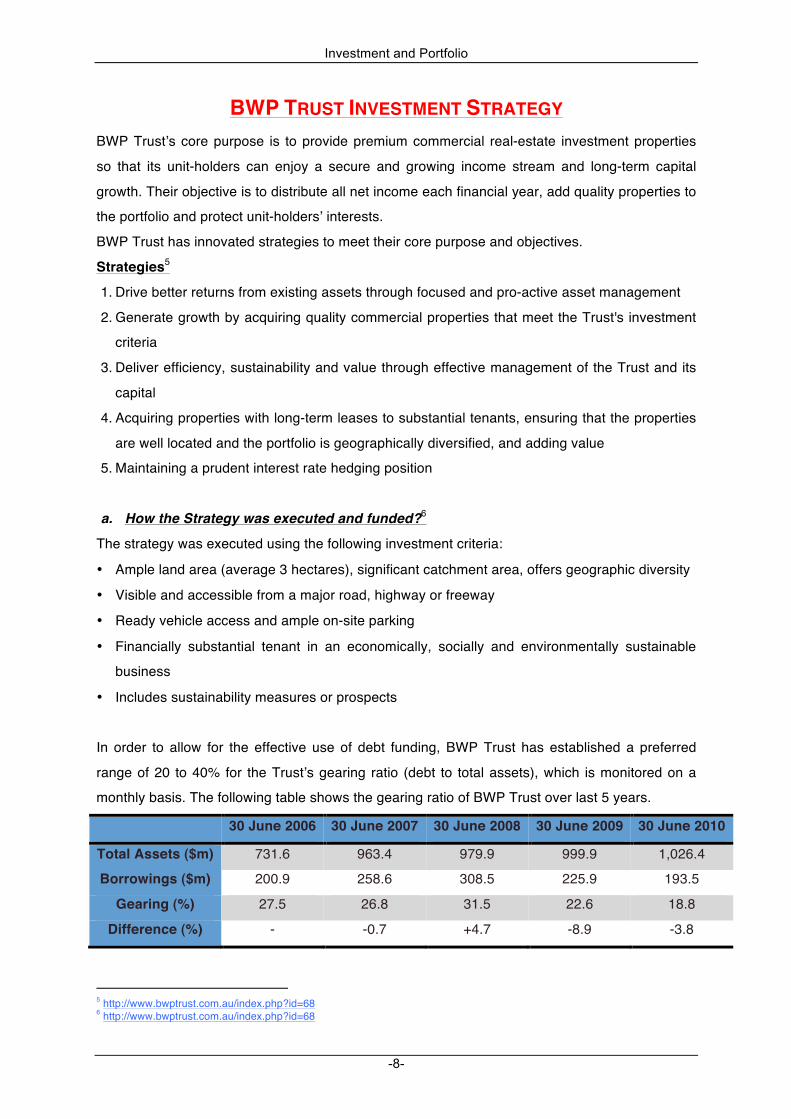
In order to allow for the effective use of debt funding, BWP Trust has established a preferred
range of 20 to 40% for the Trustʼs gearing ratio (debt to total assets), which is monitored on a
monthly basis. The following table shows the gearing ratio of BWP Trust over last 5 years.
30 June 2006 30 June 2007 30 June 2008 30 June 2009 30 June 2010
Total Assets ($m) 731.6 963.4 979.9 999.9 1,026.4
Borrowings ($m) 200.9 258.6 308.5 225.9 193.5
Gearing (%) 27.5 26.8 31.5 22.6 18.8
Difference (%) - -0.7 +4.7 -8.9 -3.8
5 http://www.bwptrust.com.au/index.php?id=68 6 http://www.bwptrust.com.au/index.php?id=68
Investment and Portfolio
-9-
The table depicts how the Trust has efficiently borrowed against its assets to fund its strategy.
The Trust has a policy of hedging the majority of its borrowings against interest rate movements
to ensure stability of distributions. The decrease in gearing between 2006 and 2007 was due to
capital expenditure and revaluation, which increased the value of the assets. Hedging also
played a major part as 82% of the interest bearing debt was hedged at average rate of 5.99%.
However, in 2008 gearing escalated because the $150 million capital raising which increased
hedging rate to 6.21%.
Over the next two years, the Trust managed to bring down its gearing to 18.8% which was mainly
due to the improvement in Trustʼs portfolio of properties through acquisitions, refurbishment and
development. This meant that as asset levels were increasing, the gearing ratio was decreasing.
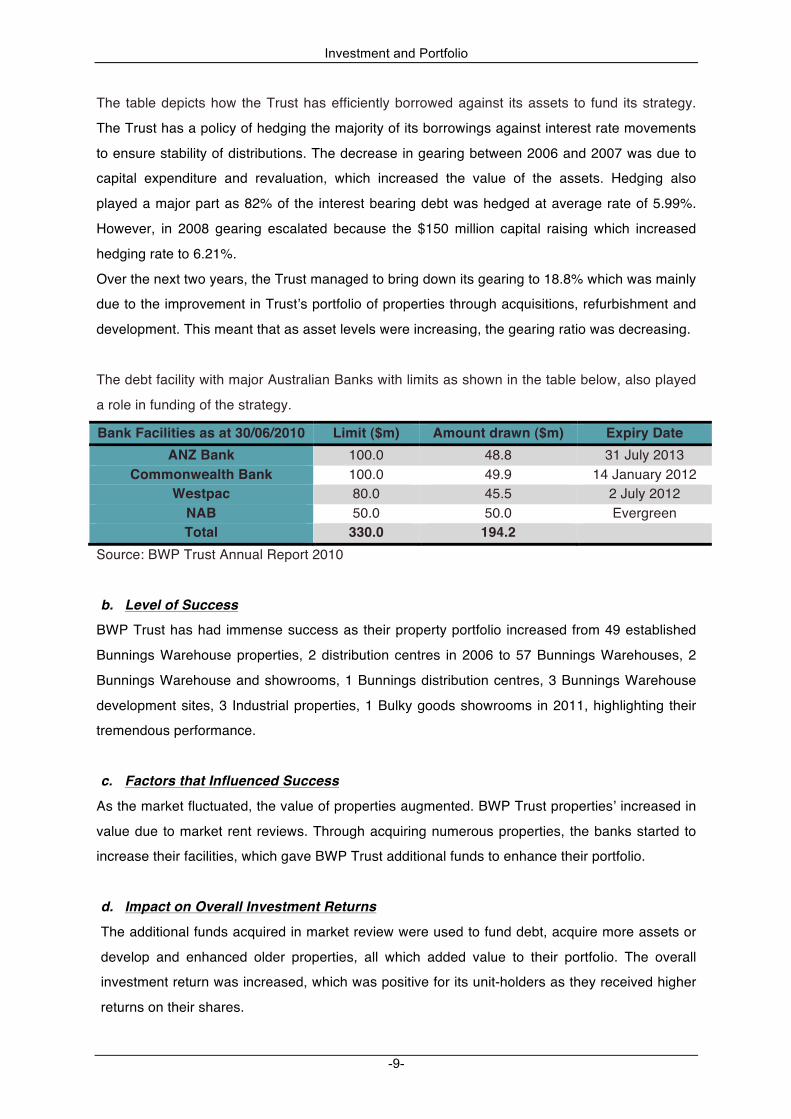
The debt facility with major Australian Banks with limits as shown in the table below, also played
a role in funding of the strategy.
Bank Facilities as at 30/06/2010 Limit ($m) Amount drawn ($m) Expiry Date ANZ Bank 100.0 48.8 31 July 2013
Commonwealth Bank 100.0 49.9 14 January 2012 Westpac 80.0 45.5 2 July 2012
NAB 50.0 50.0 Evergreen Total 330.0 194.2
Source: BWP Trust Annual Report 2010
b. Level of Success
BWP Trust has had immense success as their property portfolio increased from 49 established
Bunnings Warehouse properties, 2 distribution centres in 2006 to 57 Bunnings Warehouses, 2
Bunnings Warehouse and showrooms, 1 Bunnings distribution centres, 3 Bunnings Warehouse
development sites, 3 Industrial properties, 1 Bulky goods showrooms in 2011, highlighting their
tremendous performance.
c. Factors that Influenced Success
As the market fluctuated, the value of properties augmented. BWP Trust propertiesʼ increased in
value due to market rent reviews. Through acquiring numerous properties, the banks started to
increase their facilities, which gave BWP Trust additional funds to enhance their portfolio.
d. Impact on Overall Investment Returns
The additional funds acquired in market review were used to fund debt, acquire more assets or
develop and enhanced older properties, all which added value to their portfolio. The overall
investment return was increased, which was positive for its unit-holders as they received higher
returns on their shares.
Investment and Portfolio
-10-
BWP TRUST OUTLOOK
BWP Trust has the potential to earn large profits as its strong balance sheet is used to fund
growth through appropriate property acquisitions and development of existing properties. The
Board will continue to acquire assets within the investment criteria and quality Bunnings
Warehouses will be the main focus.
BWP Trust will look at developing existing properties through negotiating with the tenant as per
the requirements for their businesses. Scheduled rent reviews are forecasted to produce an
income growth, while other properties will be subject to the Consumer Price Index (CPI) or fixed
percentage increases7.
The Trustʼs relatively high level of interest rate hedging means that increases in interest rates are
not expected to adversely affect borrowing costs. Market predicts that fees and margins on bank
facilities used to service debt are easing for better credit risks.
BWP Trust is a very positive investment as it is buys properties, manages them in Australia. This
means unit-holders can physically see the properties in which they hold shares. Their high
performance over the last 5 years shows that they always meet the expectations of the unit-
holder. Even through the tough times, BWP Trust did a fine job in having amazing results, and
thus it is a good investment.
7 http://www.bwptrust.com.au/media/docs/Outlook_2010_AR.pdf
Investment and Portfolio
-11-
Astro Japan Property Trust (AJT) is an Australian listed property trust, which invests in the real
estate market of the worldʼs second largest economy, Japan. It was previously known as
Babcock & Brown Japan Property Trust. The Astro Group is listed on the Australian Securities
Exchange (ASX) and its stapled securities trade under the ASX code AJA that is comprised of
Astro Japan Property Trust (AJT) and Astro Japan Property Group Limited (AJCo) on a one for
one basis.
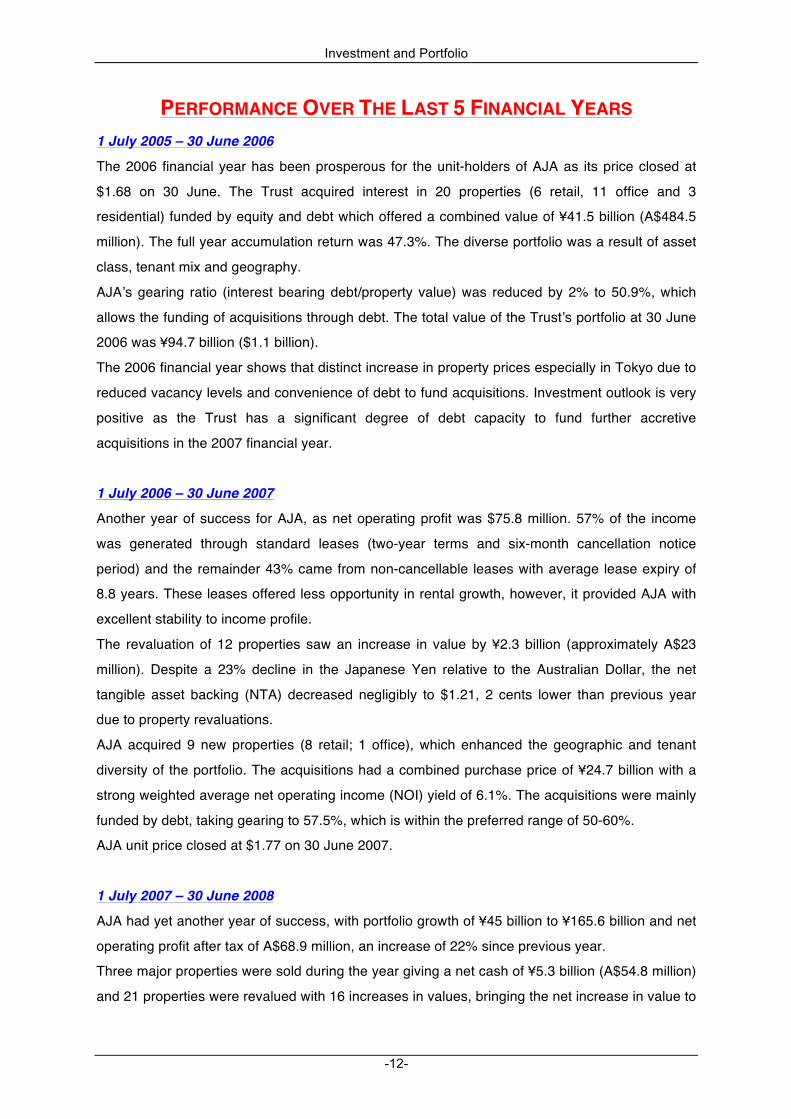
The Astro Group currently has vested interest in 18 retail, 18 office and 5 residential properties
located throughout Japan, each giving over 5.5% yield (NOI yield / book value).
Annual Report 2010
Investment and Portfolio
-12-
PERFORMANCE OVER THE LAST 5 FINANCIAL YEARS 1 July 2005 – 30 June 2006
The 2006 financial year has been prosperous for the unit-holders of AJA as its price closed at
$1.68 on 30 June. The Trust acquired interest in 20 properties (6 retail, 11 office and 3
residential) funded by equity and debt which offered a combined value of ¥41.5 billion (A$484.5
million). The full year accumulation return was 47.3%. The diverse portfolio was a result of asset
class, tenant mix and geography.
AJAʼs gearing ratio (interest bearing debt/property value) was reduced by 2% to 50.9%, which
allows the funding of acquisitions through debt. The total value of the Trustʼs portfolio at 30 June
2006 was ¥94.7 billion ($1.1 billion).
The 2006 financial year shows that distinct increase in property prices especially in Tokyo due to
reduced vacancy levels and convenience of debt to fund acquisitions. Investment outlook is very
positive as the Trust has a significant degree of debt capacity to fund further accretive
acquisitions in the 2007 financial year.
1 July 2006 – 30 June 2007
Another year of success for AJA, as net operating profit was $75.8 million. 57% of the income
was generated through standard leases (two-year terms and six-month cancellation notice
period) and the remainder 43% came from non-cancellable leases with average lease expiry of
8.8 years. These leases offered less opportunity in rental growth, however, it provided AJA with
excellent stability to income profile.
The revaluation of 12 properties saw an increase in value by ¥2.3 billion (approximately A$23
million). Despite a 23% decline in the Japanese Yen relative to the Australian Dollar, the net
tangible asset backing (NTA) decreased negligibly to $1.21, 2 cents lower than previous year
due to property revaluations.
AJA acquired 9 new properties (8 retail; 1 office), which enhanced the geographic and tenant
diversity of the portfolio. The acquisitions had a combined purchase price of ¥24.7 billion with a
strong weighted average net operating income (NOI) yield of 6.1%. The acquisitions were mainly
funded by debt, taking gearing to 57.5%, which is within the preferred range of 50-60%.
AJA unit price closed at $1.77 on 30 June 2007.
1 July 2007 – 30 June 2008
AJA had yet another year of success, with portfolio growth of ¥45 billion to ¥165.6 billion and net
operating profit after tax of A$68.9 million, an increase of 22% since previous year.
Three major properties were sold during the year giving a net cash of ¥5.3 billion (A$54.8 million)
and 21 properties were revalued with 16 increases in values, bringing the net increase in value to
Investment and Portfolio
-13-
¥7.4 billion (A$72.9 million). The five properties that experienced a decrease in value were due to
the difference in the anticipated change and actual market rents and cap rates.
Eight properties were acquired during the year with a combined purchase price of ¥45.3 billion
(A$470 million), which improved the geographic and tenant diversity. Net property income for the
year-end was $100 million, which was $24.3 million higher than net property income for the prior
year primarily due to eight property acquisitions and rental growth.
The Trustʼs gearing ratio was 55.7% at the end of the financial year with the unit price declined to
$1.39, which was disappointing.
1 July 2008 – 30 June 2009
This financial year was difficult as there was a separation of Babcock & Brown Trust and
formation of Astro Japan Property Trust as well as the impacts of the GFC.
AJA had net operating profit after tax of A$64.9 million, which is an 18% increase due to foreign
exchange movements. Portfolio occupancy by area decreased to 94% at 30 June 2009 from
98% at 30 June 2008. On a positive note, all 115 leases expired during the year were renewed
by existing tenants.
In the time of turmoil in global markets, AJA has sold 5 properties with a combine value of ¥25.5
billion (A$299 million), over the past 24 months. These selling have net cash realisation of A$144
million which will be distributed amongst the unit-holders.
AJAʼs gearing ratio increased to 69.4%, primarily due to devaluations during the period. The
Trustʼs debt position was improved as it made a repayment of A$56.5 million to a corporate
facility in October, making corporate level debt equal to zero.
1 July 2009 – 30 June 2010
AJA still showed impacts of the GFC with its net operating profit after tax 26.5% down to A$47.7
million because of a 17.5% decline in net property income and appreciation in the Australian
Dollar to the Japanese Yen. The decline in net property income was due to a reduction in office
occupancy and rental levels.
15 out of 43 properties underwent revaluation which represented a 9.2% decrease in the value of
portfolio to ¥11.6 billion. Valuations of retail assets were only slightly reduced and retail showed
signs of stabilisation. Office assets, however, showed continued weakness, with downward
revaluations for just fewer than 80% of the overall downward portfolio revaluation for the second
half of the year. Portfolio occupancy by area remains high at 93.0% as at 30 June 2010 versus
94.0% as at 30 June 2009.
The NTA backing was A$0.71, much lower than the A$0.93 at 30 June 2009. The decline was
principally due to the reduction in property valuations over the last year. Portfolio gearing was
75.5% at 30 June 2010, an increase of 6.1% from the previous year.
Investment and Portfolio
-14-
AJA INVESTMENT STRATEGY
Strategies
AJAʼs investment strategy is devised to maintain and enhance the security-holders returns. Their
strategy is to invest in the real estate market of Japan only. They will not participate in
competitive bidding and usually acquire properties “off-market”.8
The board focuses on generating sustainable earnings growth through accretive property
acquisitions and effective asset management. Portfolio diversity by geography (across Japan),
asset class and lease type will remain a key element of this strategy, improving the stability of
income and reducing the risks associated with property investment.9
a. How the Strategy was executed and funded?
AJAʼs strategies were executed using the following criteria:
• Acquiring interest in properties which:
o Are expected to provide sustainable earnings
o Offer opportunities to create value through redevelopment, repositioning and asset
management which is pro-active and cost-effective
o Can be in obtained in the form of joint-venture and pre-commitments where risks can be
mitigated
o We pay no more than fair market value as determined by an independent qualified
Japanese property valuer
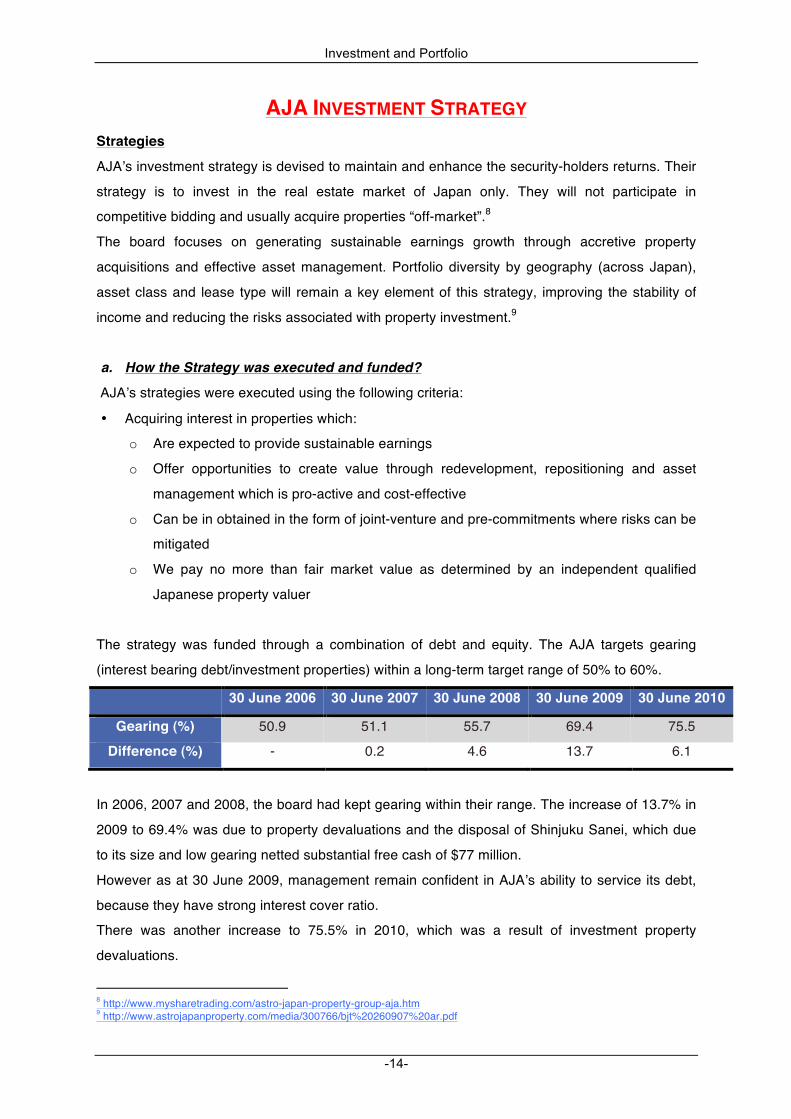
The strategy was funded through a combination of debt and equity. The AJA targets gearing
(interest bearing debt/investment properties) within a long‐term target range of 50% to 60%.
30 June 2006 30 June 2007 30 June 2008 30 June 2009 30 June 2010
Gearing (%) 50.9 51.1 55.7 69.4 75.5
Difference (%) - 0.2 4.6 13.7 6.1
In 2006, 2007 and 2008, the board had kept gearing within their range. The increase of 13.7% in
2009 to 69.4% was due to property devaluations and the disposal of Shinjuku Sanei, which due
to its size and low gearing netted substantial free cash of $77 million.
However as at 30 June 2009, management remain confident in AJAʼs ability to service its debt,
because they have strong interest cover ratio.
There was another increase to 75.5% in 2010, which was a result of investment property
devaluations.
8 http://www.mysharetrading.com/astro-japan-property-group-aja.htm 9 http://www.astrojapanproperty.com/media/300766/bjt%20260907%20ar.pdf
Investment and Portfolio
-15-
b. Level of Success
AJA has had tremendous success as their initial portfolio comprised of only 12 properties (office
and retail) located only in Central and greater Tokyo area. Today, they have diversified and
vested interest in 41 properties (office, retail and residential) across Japan. This shows that they
have been successful in implementing their strategies and achieving success and profits for their
shareholders.
c. Factors that Influenced Success
The Japanese property market is promising as there is a favourable margin, which persists
between property yields and the cost of debt, exceeding that of the USA, Britain, Australian, and
major European markets. It also showed apparent signs of growth in rents and land values and it
has eight times investment grade properties as that of Australia. The market capitalisation rate of
Japanese REITS (J-REITs) is less than half of the A-REITs sector.
This highlights that investments properties in Japan are boundless, which has highly influenced
the success of the AJA.
d. Impact on Overall Investment Returns
Overall investment returns have been going up and down as AJA responds to the Japanese
market. Though, more properties were added to the portfolio, there was also the sell of major
interests, which put pressure on the gearing. The high gearing will eventually lower overall
investment returns, as funds will be needed to finance the borrowings.
Investment and Portfolio
-16-
AJA OUTLOOK
The AJA Board is hoping to show stability within the next year to provide the unit-holders with the
opportunity to maximise returns from the Trustʼs core property portfolio. There is room for
improvement, which the Board has been working on through ongoing systematic and strategic
execution of the strategy to generate long-term sustainable earnings.
The global markets including Japan are showing signs of recovery during the 2011 financial year
and AJA is predicted to display stability within the near future. The Japanese market looks to
have positive results in the capitalisation rates and also the cyclical pressures of declining rent
level may start to look positive.
An improvement in the macroeconomic pressures of recent years will uplift global market
sentiment, which will help the investors of AJA, as this will provide them with a positive
momentum for the unit-price to move ahead.
AJA has shown good results, however, it is not the best investment option. This is because the
Trust is dealing with overseas market, which has the risk of two economies involved. Though
higher risks mean higher returns, it is up to the individual to choose. The vast increase in gearing
also highlights the inefficiency of the Trust to repay its debts, thus, it is not the ideal investment
opportunity.
Investment and Portfolio
-17-
BENCHMARK INDEX OF FINANCIAL PERFORMANCE FOR THE
A-REIT SECTOR
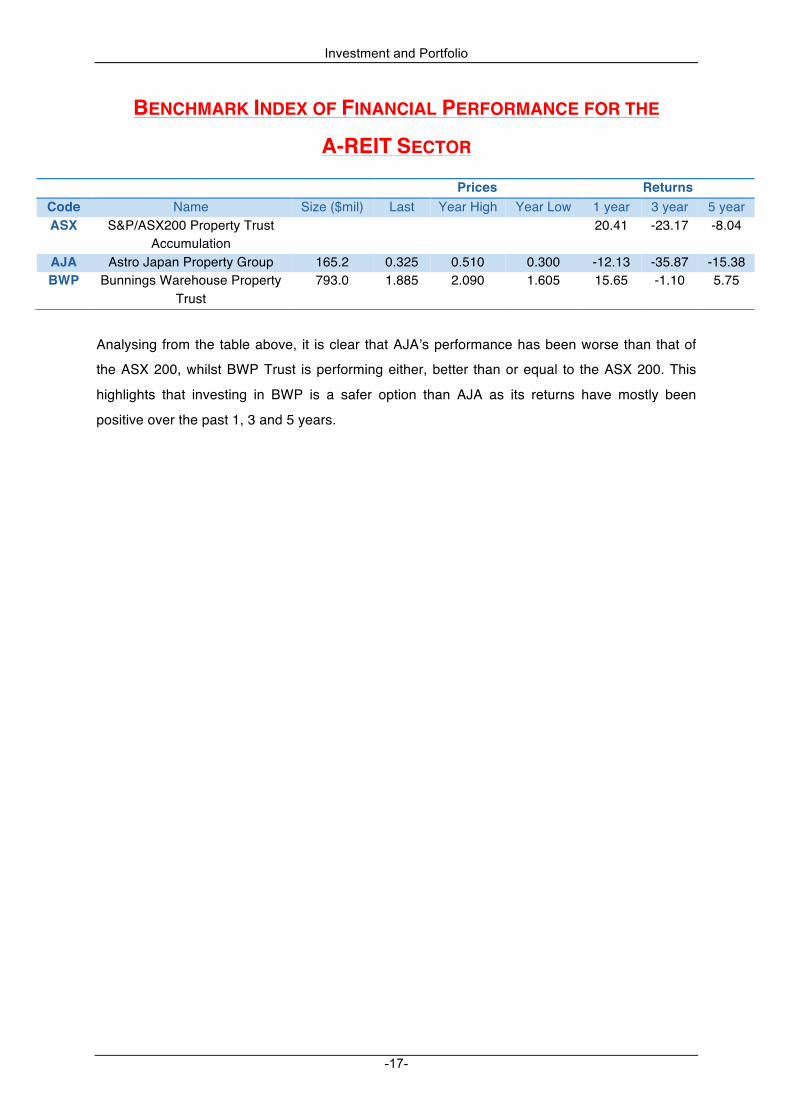
Analysing from the table above, it is clear that AJAʼs performance has been worse than that of
the ASX 200, whilst BWP Trust is performing either, better than or equal to the ASX 200. This
highlights that investing in BWP is a safer option than AJA as its returns have mostly been
positive over the past 1, 3 and 5 years.
Prices Returns Code Name Size ($mil) Last Year High Year Low 1 year 3 year 5 year ASX S&P/ASX200 Property Trust
Accumulation 20.41 -23.17 -8.04
AJA Astro Japan Property Group 165.2 0.325 0.510 0.300 -12.13 -35.87 -15.38 BWP Bunnings Warehouse Property
Trust 793.0 1.885 2.090 1.605 15.65 -1.10 5.75
Investment and Portfolio
-18-
MACROECONOMIC & MICROECONOMIC IMPACTS
In 2008, the global stock markets and financial markets became volatile as a result of the GFC,
which began when there was a loss in the confidence of the US investors in the value of the sub-
prime mortgage market causing a liquidity crisis.
To boost the slow timid economy, the Australian government proposed a stimulus package,
pledging to give cash handouts to taxpayers, and spend more money on longer-term
infrastructure projects.
This event had vast effect on macroeconomic indicators such as GDP, unemployment rates and
prices, which also affected the property market.
In 2010, the A-REIT sector was influenced by equities market and the Chinese economy. The
improvement in employment and retail sales as well as stabilising asset valuations helped the A-
REIT sector recover from the GFC of 2008. In 2010, there was a tight supply of housing, which
put upward pressure on prices.
Improvements in domestic economy indicators; inflation, supply, demand, national income and
output played a crucial role as the GDP progressively strengthened in 2010. The demand in
Australia was stable and thus business and consumer confidence remained buoyant. Monetary
policy took priority over fiscal policy as stimulus spending was removed from the agenda.
Investment and Portfolio
-19-
A-REIT MARKET OVERVIEW The A-REIT sector has shifted to a less risky return profile over the past two years, as there has
been a general reduction in gearing levels, and the adoption of more conservative dividend-to-
earnings payout ratios10.
The A-REIT market is looking to be stable over the next 12 – 18 months. It is expected that the
trustʼs operating environment will improve. Key macroeconomic factors and a modest supply of
new properties in Australia will support the sectorʼs performance over the coming months as well
as the secure financial profile11.
It is projected that the A-REIT will have a total return between 8 – 11%, market yield of
approximately 6%, and capital growth between 2 – 5 % over 2011. These results will be shown if
A-REITs move to higher payout ratios and adopt low risk strategies by reducing overseas
investment and corporate earnings.
As the Australian economy shows signs of progress, so will the valuation of properties, which is
predicted to rise by up to 5%. The balance sheets of A-REITs are expected to stay strong due to
the raising of equity over the past two years meaning that absorption of external shocks will be
handle better than before. This suggests the sector is positioned to perform well.
10 http://www.asx.com.au/resources/a-reits-back-on-course.htm 11 http://moodys.alacra.com/research/moodys-global-credit-research-Stable_Outlook_for_Australian_Real_Estate_Investment_Trusts_A_REITs-PBC_132965
Investment and Portfolio
-20-
REFERENCES
• ASX A-REITs - ASX-listed Australian Real Estate Investment Trusts Fact Sheet
• Astro Japan Property Group Annual Reports (2006, 2007, 2008, 2009, 2010)
• Bunnings Warehouse Property Trust Annual Reports (2006, 2007, 2008, 2009, 2010)
• http://www.bwptrust.com.au/index.php?id=68
• http://www.astrojapanproperty.com/
• http://en.wikipedia.org/wiki/Australian_real_estate_investment_trust
• http://www.bwptrust.com.au/media/docs/Outlook_2010_AR.pdf
• http://www.mysharetrading.com/astro-japan-property-group-aja.htm
• http://www.astrojapanproperty.com/media/300766/bjt%20260907%20ar.pdf
• http://www.asx.com.au/resources/a-reits-back-on-course.htm
• http://moodys.alacra.com/research/moodys-global-credit-research-Stable_Outlook_for_Australian_Real_Estate_Investment_Trusts_A_REITs-PBC_132965
• http://www.asx.com.au/products/managed-funds-product-list.htm
• http://www.asx.com.au/documents/products/a_reits.pdf
• http://www.investorwords.com/6931/stapled_security.html#ixzz1L6F2zqWx
• http://www.globalpropertyguide.com/Asia/Japan/Price-History
• http://northernguide.com.au/2011/03/2011-areit-sector-outlook/
• http://www.asx.com.au/documents/products/lmi_performance_201006.pdf
• http://www.apngroup.com.au/apn/news/?wnGUID=38341cd9-e0a8-48f5-84bd-47d3ba39a2eb
• http://www.theaustralian.com.au/business/property/australias-property-market-strength-set-to-fade-in-2011-under-weight-of-rising-rates-report/story-e6frg9gx-1225977848698