investment and investment finance in europe - financing · pdf file ·...
TRANSCRIPT

2016
Investment and Investment Finance
in Europe
Financing productivity growth
Inve
stm
ent a
nd In
vest
men
t Fin
ance
in E
urop
e
Fi
nanc
ing
prod
uctiv
ity g
row
th


Economics DepartmentEuropean Investment Bank
Investment and Investment Finance
in Europe
Financing productivity growth

Investment and Investment Finance in Europe European Investment Bank
2
Investment and Investment Finance in Europe© Economics Department (EIB), 2016. All rights reserved. Short sections of text, not to exceed two paragraphs, may be quoted in the original language without explicit permission provided that the source is acknowledged.
About the ReportThe EIB annual report on Investment and Investment Finance is designed to serve as a monitoring tool providing a comprehensive overview on the developments and drivers of investment and its financing in the EU. It combines an analysis and understanding of key market trends and developments, with a more in-depth thematic focus, which this year is devoted to the impact of financial constraints on investment dynamics. A new addition to the report this year is the new annual EIB Investment Survey (EIBIS). The report is a flagship product of the EIB Economics Department. It complements internal EIB analysis with contributions from leading experts on the field.
About the Economics Department of the EIBThe mission of the EIB Economics Department is to provide economic analyses and studies to support the Bank in its operations and in the definition of its positioning, strategy and policy. The Department, a team of 30 economists, is headed by Debora Revoltella, Director of Economics.
Main Contributors to this year’s reportEconomic Editors Atanas Kolev (lead), Philipp Brutscher, and Christoph Weiss, under the supervision of
Pedro De Lima, Head of Economic StudiesIntroduction Atanas Kolev Chapter 1 Atanas Kolev (chapter leader), Tim Bending, Philipp-Bastian Brutscher, Rocco Bubicco,
and Tanja Tanayama.Chapter 2 Carol Corrado (The Conference Board), Jonathan Haskel (Imperial College, CEPR and IZA),
Cecilia Jona-Lasinio (Istat and LUISS Lab), and Massimiliano Iommi (Istat and LUISS Lab).Chapter 3 Tim Bending and Philipp-Bastian Brutscher.Chapter 4 Laurent Maurin (chapter leader), Carlo de Nicola, Natacha Valla, Marcin Wolski (Box 3), João Pinto
(Catholic University, Portugal, Box 1) and Paulo Alves (Catholic University, Portugal, Box 1)Chapter 5 Hemlut Kraemer-Eis (EIF, chapter leader), Frank Lang (EIF), Wouter Torfs (EIF), and Salome
Gvetadze (EIF).Chapter 6 Atanas Kolev (chapter leader), Pauline Bourgeon, Christoph Weiss, Noelia Jiménez (Banco de
España, Box 2), Roberto Blanco (Banco de España, Box 2), Emilia Bonaccorsi di Patti (Banca d’Italia, Box 3), Luísa Farinha (Banco de Portugal, Box 4).
Chapter 7 Şebnem Kalemli-Özcan (University of Maryland, CEPR and NBER)
Published by the European Investment Bank.Linguistic editors: Peter Haynes, Chris ShawLayout: Daniel Cima, Marlène Hignoul, EIB GraphicTeamPrinted by Imprimerie Centrale SA on FSC Paper:FSC/Condat Silk (Cover), FSC/MagnoSatin (Content)
DisclaimerThe views expressed in this publication are those of the authors and do not necessarily reflect the position of the EIB.
AcknowledgementsResearch assistance from Floriana Borino, Jonas Heipertz, Benedetta di Lupidio, Ilaria Nava, and Alena Wabitsch is gratefully acknowledged.

CONTENTS
European Investment Bank Investment and Investment Finance in Europe
3
Executive summary 5
Introduction 11
Part I: Gross fixed investment and intangible capital
1. Gross fixed capital formation in the EU 25
2. Growth, tangible and intangible investment in the EU and US 73 before and since the Great Recession
3. The EIB Investment Survey: a preview 103
Part II: Investment finance
4. Credit conditions and corporate investment in Europe 145
5. Bottlenecks in financing SMEs’ competitiveness 193
Part III: Financing productivity growth
6. Credit supply and capital misallocation: implications for corporate investment 225
7. Financial frictions and sources of finance for European firms 259

Investment and Investment Finance in Europe European Investment Bank
4

EXECUTIVE SUMMARY
European Investment Bank Investment and Investment Finance in Europe
5
Executive summary
From investment crisis to sub-optimal investment recovery?Europe’s recovery is slow. Following the recession triggered by the sovereign debt crisis in Europe, a slow recovery began in most EU Member States in early 2013. It started as an export-driven upswing but has been increasingly supported by domestic demand, particularly consumption. Growth of domestic demand has been sustained by falling oil prices and overall inflation, as well as by very accommodating monetary policy and the phasing-out of fiscal retrenchment.
But the recovery of investment is even slower. EU investment growth in the last three years has been 3.1% per year, slightly below the pre-crisis average rate of 3.4% and well below historical rates of investment growth during recoveries from financial crises.
And large differences in regional and sectoral investment performance remain. By mid-2016, investment in the less crisis-hit “old” Member States (hereafter “core countries”) had reached the pre-crisis level but investment in mostly “new” Member State “cohesion countries” was still 9% down.1 In the most crisis-hit “vulnerable countries”, investment is still 27% below the pre-crisis level. In terms of asset composition, expenditure on machinery and equipment and intellectual property is leading the investment recovery, with gaps versus pre-crisis real investment levels still visible in cohesion and vulnerable countries. Construction, both residential and non-residential, remains depressed overall: investment in new construction exceeds pre-crisis levels in only five Member States, while in 15 it is more than 15% below pre-crisis levels.
The gradual recovery of investment overall is good news, but there are downside risks. European firms have suffered a trend of falling productivity growth and returns on investment that poses a threat to future growth. At the same time, investment in innovation-related intangible capital remains low by international comparison, public investment is still subject to fiscal constraints and productivity-enhancing infrastructure investment is actually in decline, contrary to previous estimates. Financing conditions for firms have improved, but this remains dependent on an exceptional monetary policy stance, with cross-border capital flows and financing for small firms yet to fully recover.
Public investment trends are shaped by fiscal space and EU funds Levels of real government investment in core and cohesion countries have recently been comparable to pre-crisis levels, but public investment in vulnerable countries was still 42% down in 2015. It is clear that fiscal consolidation has played a restraining role, particularly in vulnerable countries, and most EU governments do not plan increases in government investment in 2016 and 2017.
In cohesion countries, public investment has been the main driver of investment growth since the recession, but this was dependent on EU Structural and Investment Funds, which accounted for around two fifths of public investment, or nearly 2% of GDP, in recent years. However, latest data for 2016 show that previously strong investment growth in cohesion countries has now suffered from a “cliff effect,” suddenly turning negative after the 2015 deadline for payments under the last EU programming period.
1 “Core” includes Austria, Belgium, Germany, Denmark, Finland, France, Luxembourg, the Netherlands, Sweden and the UK; “Vulnerable” includes Cyprus, Greece, Spain, Ireland, Italy, Slovenia and Portugal; “Cohesion” includes Bulgaria, the Czech Republic, Estonia, Croatia, Hungary, Lithuania, Latvia, Malta, Poland, Romania and Slovakia.

EXECUTIVE SUMMARY
Investment and Investment Finance in Europe European Investment Bank
6
Revised data show that infrastructure investment is fallingThe introduction of the ESA 2010 national accounting categories has enabled a much more accurate estimation of infrastructure investment in Europe. While previously thought to have been quite resilient, we now see that infrastructure investment has fallen by about one quarter, from 2.3% to 1.7% of GDP, since 2009. By 2015 it was well under 2005 levels, with no sign of a turnaround.
While corporate infrastructure investment fell at the start of the crisis, public infrastructure investment accounts for most of the decline since. As mentioned, fiscal consolidation has been the main driver. While the ratio of government investment to GDP is close to its long-term average, this is not true for government investment in infrastructure: in this case the gap remains.
At the EU level, corporate investment has been the main driver of the (slow) investment recovery…Corporate investment is the main contributor to investment growth at the EU level. However, it has reached the pre-crisis peak in core countries, but not in the vulnerable or cohesion groups. In cohesion countries, corporate investment has largely stagnated and is still well below the pre-crisis level, with low investment in buildings and structures providing the main drag. The ratio of corporate investment to GDP in 2015 is below its 1999-2005 average and accounts for a quarter of the decline in total investment to GDP since that period. Thus, while corporate investment is driving the mild investment recovery, it remains weak by historical comparison.
Preliminary results of the EIB Investment Survey (EIBIS) for seven countries confirm this picture of a corporate investment upswing in certain countries. While 80% of firms report that they invested about the right amount in the last three years, 16% report having invested too little. On balance, and by quite small margins, firms in Germany, Greece, Portugal and Slovenia expect to invest more in this financial year than the last, while firms in Finland, Italy and the UK expect to invest less. Firms in the infrastructure sector expect a significant investment slowdown in all seven countries except Portugal. Uncertainty stands out as an issue reported to negatively affect investment decisions, alongside business regulation (particularly in vulnerable countries) and lack of skilled workers (particularly in Germany).
…but it is threatened by falling productivity growth and investment returns Our estimations show that the average realised internal rate of return of firms has been in decline since the beginning of the financial crisis, across countries, sectors and firm sizes. Such a decline is to be expected after a crisis, as sales fall and firms find they have over-invested. But eight years after the crisis broke this explanation becomes less plausible, and it becomes increasingly likely that the decline is driven by falling rates of productivity growth. While easing monetary policy may have cushioned this trend, its continuation would obviously have serious implications for investment and potential growth.
EXECUTIVE SUMMARY
European Investment Bank Investment and Investment Finance in Europe
7
Productivity-enhancing investment in intangible capital has been resilient, but lags global peersProductivity growth can be increased and sustained through more R&D and innovation. In the EU, investment in intellectual property rights, a large part of which is accounted for by R&D expenditures, has fared better than investment in tangible capital, with levels now higher than those in 2008 in most EU members (Greece, Latvia and Romania are notable exceptions). That said, global comparisons are not so flattering. The ratio of R&D expenditures to GDP in the EU has grown only modestly, remaining nearly 1 p.p. below the US level and falling behind relative to rapid growth in China, Japan and South Korea. EU investment in the broader category of intangible assets has proved resilient, but is significantly lower than in the US, with growth too slow to close the gap. Investment in intangibles is positively correlated with greater labour market flexibility and government investment in R&D.
Financial conditions for firms have improved…The ECB and other European central banks have reacted to the crisis with an extraordinary package of monetary easing, including lowering interest rates to their effective lower bound and introducing unconventional measures such as the asset purchase programme. At the same time, the banking union aims to improve the resilience of the banking sector. These measures have gone a long way towards normalising financial conditions for investment by firms. Notably:
• The process of financial market fragmentation is gradually being reversed, particularly in the sense that spreads in bond yields and corporate lending rates between core and vulnerable countries have been compressed.
• Bank lending is gradually increasing and access to external finance in general is improving, supported by extremely accommodative monetary policy. This has so far compensated considerably for the falling returns on investment in the post-crisis period.
…but there remains room for further action Many firms still face financing constraints, and given the possibility of a continued low interest rate environment with declining productivity growth and limited scope for further monetary easing, some areas of weakness are troubling:
• Despite the positive results of the 2016 European Banking Association stress tests and the magnitude of the regulatory adjustment achieved, there has been no confidence rally and European banks continue to suffer from very low valuations. Full recovery may require structural changes in the business model of some banks.
• Despite the monetary policy-driven compression of bond yield spreads within the euro area, cross-border capital flows, particularly to cohesion countries, remain well below their pre-crisis levels. Such capital flows have been one of the key drivers of convergence in the EU.
• SMEs continue to face higher lending rates and are more likely to perceive their financial situation as constrained. Access to equity for SMEs remains difficult, with private equity volumes still well below pre-crisis levels and the venture capital segment still very dependent on government support.

EXECUTIVE SUMMARY
Investment and Investment Finance in Europe European Investment Bank
8
The impact of the crisis on the financial system has had knock-on effects on firm productivity growthOur analysis shows that the crisis has reduced the ability of the EU financial system to allocate resources efficiently to support the most productive firms, thereby contributing to slowing productivity growth overall. Firms in the EU have been particularly exposed to the effects of the crisis because of their heavy reliance on bank lending and lack of opportunities to turn to capital markets. We find that firms that use more equity, retained earnings and trade credit have tended to achieve improved investment and sales, both before and after the crisis, whereas highly leveraged firms have tended to experience the opposite.
The credit-supply shock generated by the financial crisis has also meant that the allocation of bank credit between firms has been determined to a lesser extent by their productivity and growth potential, and more by the balance sheet health of their bank, or by their size. Credit supply to smaller firms fell more and these firms had more difficulties compensating for reduced external financing with other sources of finance. Our research suggests that firms in sectors with a high growth potential have been particularly adversely affected.
Public policies to address market failures and frictions and to enhance productivity growth remain critical Investment in the EU has started to recover, but this recovery is weak by historical comparison, and uneven. Declining investment in infrastructure is a major concern that has implications for Europe’s long-term competitiveness and potential growth. Likewise the slowness of the recovery in investment by firms is disturbing, particularly given the extraordinary monetary stimulus. The continued decline in returns to firm investment suggests that action is needed to raise productivity growth, yet innovation-related investment in intangibles remains low by international standards, and binding financial constraints and other market failures have reduced the efficiency of resource allocation. Avoiding investment stagnation requires continued action on at least three fronts:
• Structural reforms focused on market flexibility to support innovation and productivity growth.• Financial sector reforms to further improve banking sector resilience and further develop capital
markets as an alternative source of finance for European corporations. The banking and capital markets unions are important steps forward in this regard.
• Public support for investment, making the best use of available EU and national financing capacities to address investment gaps in infrastructure and innovation and to help alleviate the financial constraints faced by smaller firms.

EXECUTIVE SUMMARY
European Investment Bank Investment and Investment Finance in Europe
9
The EIB has a unique role to play in supporting investment in EuropeThe EIB plays an important catalytic role in promoting sound investment projects in support of EU policy goals in Europe and beyond. As a bank, it raises money from international capital markets, using its AAA credit rating. As a public institution owned by the 28 Member States of the EU, it lends these funds to finance investment projects that address systemic market failures or financial frictions, targeting four priority areas in support of growth and job creation: innovation and skills, SMEs, climate action and strategic infrastructure.
In 2015, the EIB provided EUR 77.5bn in long-term finance to support private and public productive investment, with the EIF providing EUR 7bn. At a first estimate, this helped realise investment projects worth roughly EUR 230bn and EUR 27bn, respectively. All the projects the EIB finances must not only be bankable, but also comply with strict economic, technical, environmental and social standards in order to yield tangible results in improving people’s lives. Alongside lending, the Bank’s blending activities can help leverage available funding by, for example, helping transform EU resources under the European Structural and Investment Funds (ESIF) into financial products such as loans, guarantees, equity and other risk-bearing mechanisms. Advisory activities and technical assistance can help projects to get off the ground and maximise the value-for-money of investments.
The Investment Plan for Europe undertaken by the European Commission and the EIB further enhances the EU policy response to relaunch investment and restore EU competitiveness. It consists of three main pillars: finance through the European Fund for Strategic Investments (EFSI) to enhance the EIB Group’s capacity to address market failures in risk-taking that hold back investment; the European Investment Advisory Hub (EIAH) to provide comprehensive technical assistance in the sourcing, preparation and development of investment projects; and support for regulatory and structural reform to remove bottlenecks and ensure an investment-friendly environment. As of mid-October 2016, 361 EFSI transactions were approved, potentially leveraging 44% of the full EUR 315bn envisaged.
Debora RevoltellaDirector, Economics Department
European Investment Bank

Investment and Investment Finance in Europe European Investment Bank
10
INTRODUCTION 11
European Investment Bank Investment and Investment Finance in Europe
Introduction
The large decline in investment in the EU during the recession in 2008-9 and the weak recovery in the subsequent years have been of primary concern for policy makers. Lower levels of investment mean fewer new jobs and weaker economic growth not only in the present but also in the medium term. The eight years of weak investment in the EU have had a detrimental effect on productivity in Europe by reducing the contribution of capital deepening.
The EIB Annual Report on Investment and Investment Finance is designed to serve as a monitoring tool providing a comprehensive overview of the developments and drivers of investment and its financing in the EU. It combines an analysis and understanding of key market trends and developments with a more in-depth thematic focus, which this year is devoted to the impact of financial constraints on investment dynamics. The report also complements internal EIB analysis with contributions from leading experts in the field. A new addition to the report this year is the new annual EIB Investment Survey (EIBIS). The survey covers some 12,000 firms across the EU and a wide spectrum of questions on corporate investment and investment finance. It thus provides a wealth of unique firm-level information about investment decisions and investment finance choices, complementing standard macroeconomic data.
EU investment has been recovering since 2013, but is still 9% below the pre-crisis peak
Following the two years of economic recession triggered by the sovereign debt crisis in Europe, a mild recovery began in most members of the EU in early 2013. It started as an export-driven upswing that gradually strengthened and evolved into a recovery supported by domestic demand. Growth of domestic demand was sustained by falling oil prices and overall inflation, as well as by very accommodating monetary policy and the phasing-out of fiscal retrenchment.
Real investment in the EU fell sharply between 2008 and 2013 despite a brief recovery episode in 2010-11. When real investment finally began increasing again in early 2013, its level was about 17% below the pre-crisis peak and the ratio of investment to GDP was 2 percentage points (p.p.) lower than the average in the period 1999-2005 and 2.8 p.p. below the peak in 2008. This is a large decline: in 2015, 2 p.p. of EU GDP amounted to EUR 290bn or about 10% of total EU gross fixed capital formation (GFCF) in 2015.
The start of the subsequent recovery was also staggered across countries. While investment in most EU economies picked up in early 2013, it started to increase in most of the vulnerable countries only in 2014, a year later than in most of their peers. By the end of the second quarter of 2016, investment in the core countries in the EU had reached the pre-crisis peak and the cohesion countries were about 9% below. The group of vulnerable countries was still 27% below the pre-crisis level and the ratio of investment to GDP was about 4.5 p.p. below the average in the period 1999-2005.1
The drawn-out episode of weak investment was not totally unexpected. Decade-long recovery episodes from financial crises are not uncommon even in advanced countries. It took real investment in the Nordic European countries about ten years to recover to pre-crisis peaks following their financial crises in the early 1990s. US real investment also needed nearly ten years to return to the pre-crisis peak attained in 2006, following the financial crisis and the Great Recession. That said, the speed of the investment recovery in the EU since 2013 has been slower than that of the Nordic countries and the US in their respective recovery episodes.
1 Throughout this book, vulnerable countries or vulnerable Member States (VMS) denotes the group of Cyprus, Greece, Ireland, Italy, Portugal, Slovenia and Spain. Cohesion countries refers to the group of all countries that have joined the EU since 2004. Core countries are all the other countries.
INTRODUCTION12
Investment and Investment Finance in Europe European Investment Bank
Household and government investment account for most of the difference with pre-crisis levels, while GFCF in machinery and equipment has reached pre-crisis peaks and investment in intellectual property products is well above them
Low investment by households and general governments remains the main drag on total EU investment and on investment in vulnerable countries in particular. The household and general government sectors together account for 80% of the difference between the level of investment in 2016 and 2008. This effect is driven fully by the vulnerable countries: real investment by the general government and household sectors is 42% and 46% below its pre-crisis levels, respectively. Levels of real government investment in core and cohesion countries are comparable to pre-crisis peaks, while real household investment is still lagging in most of the core and cohesion countries with some notable exceptions.
The large decline in government investment after 2010, especially in the vulnerable countries, was the result of the fiscal retrenchment following the financial crisis. In this period, governments reduced investment disproportionately more than other expenditures. This disproportionate reduction had a particularly strong effect on government infrastructure investment, which declined by more than total government GFCF, when compared to their pre-crisis levels. This was the case not only in vulnerable countries, but also in core countries. Only in cohesion countries, the decline in infrastructure investment relative to 2008 was very small and commensurate with its share in total government investment. Overall for the EU, government infrastructure investment accounts for nearly a fifth of the decline in the ratio of total GFCF to GDP.
Relative to GDP, government infrastructure investment is not only below 2008 levels: the ratio of government infrastructure investment to GDP in 2015 is lower than that in 2005 in both core and vulnerable countries. Only in cohesion countries is it above 2005 levels. Existing budgetary plans for 2016 and 2017 do not envisage a change in this situation: most EU governments do not plan increases in government investment in 2016 and 2017, even though in several countries it has reached its lowest levels in the past 20 years.
A push in government infrastructure investment has the potential to revive overall investment in the EU, also because of the spillover effects. The way this push is carried out, however, is crucial for its success. A proper assessment of infrastructure needs, as well as a careful appraisal at the project level should guarantee that such a push will not be wasteful. Public sector planning capacity and coordination at various levels of administration are of key importance.
Examining the breakdown of GFCF by asset type, the key finding is that investment growth is driven by GFCF in machinery and equipment and intellectual property rights, which are typically corporate investments. GFCF in construction, both residential and non-residential, remains low relative to pre-crisis levels eight years after the crisis started. This weakness is widespread across the EU: investment in new construction exceeds pre-crisis levels in only five Member States, while in 15 it is more than 15% below pre-crisis levels.

INTRODUCTION 13
European Investment Bank Investment and Investment Finance in Europe
Corporate investment has been the main driver of the investment recovery, but remains below pre-crisis levels in vulnerable and cohesion countries
Corporate investment has been the main driver of the investment recovery. That said, corporate investment remains below pre-crisis levels in vulnerable and in cohesion countries. Capital inflows, and in particular foreign direct investment, were an important driver of corporate investment in cohesion countries before 2008. These subsided following the financial crisis and have remained well below their pre-crisis levels throughout the period since 2008, coinciding with weak corporate investment activity. First results from the EIB Investment Survey for seven countries – Finland, Germany, Greece, Italy, Portugal, Slovenia, and the UK – complement the macro view on corporate investment activities. They provide evidence for a continuing strong investment performance in Germany and Slovenia for 2016, as well as for the first signs of a recovery in Greece and Portugal. Firms in the infrastructure sector, on the other hand, anticipate a sharp investment slowdown in 2016.
Replacement investments are the main investment priority for the next three years. Across all countries, firms tend to name replacement of existing buildings, machinery, equipment and IT as their principal investment priority: that is, they name this as a priority about twice as often as investment in new products or processes or investment in capacity expansion. About one fifth of firms expect no investment activities over the next three years at all. This is most common in Portugal, Italy and Greece. Interestingly, a substantial share of firms in the UK is also fairly conservative with respect to their longer-term investment activities.
In line with the sluggish recovery observed at the macro level, the survey results show that 16% of firms state that their investment activities in the last three years were below needs, while only 4% report having invested too much. Firms in Portugal, Greece, Slovenia and the UK are the most likely to report that their investment activities in the last three years were below needs – something which is shown to be strongly negatively correlated with both the share of firms’ equipment that is self-reported as state-of-the-art and that of their building stock that meets high energy efficiency standards.
Generally, more productive firms tend to invest more. While this is true in all of the seven countries, the extent to which this holds varies: the survey findings show a relatively strong link between the two variables in Finland, Italy and Slovenia and a relatively weak one in Portugal and the UK. This leads us to the question about the efficiency with which resources are allocated across firms, which is the topic of part III of this book.
INTRODUCTION14
Investment and Investment Finance in Europe European Investment Bank
Longer-term comparisons qualify some of the post-crisis conclusions
Comparing current investment levels to pre-crisis peaks may not be the most appropriate approach due to the unsustainable surge in investment in the three years preceding the crisis. Comparing investment ratios to GDP with long-term averages addresses this problem to a large extent. It confirms that the weakness of investment in the household sector and in non-residential construction opens a gap between the current investment rate and historical averages. The ratio of government investment to GDP, however, is very close to its long-term average, except for government investment in infrastructure. In this case the gap remains.
This comparison puts in perspective and qualifies the recent role of corporate investment as the main driver of the investment recovery. The ratio of corporate investment to GDP in 2015 was below its average in the period 1999-2005 and accounts for a quarter of the decline of the ratio of total investment to GDP relative to the average in 1999-2005. Thus while corporate investment is driving the mild investment recovery it remains weak by historical comparison.
A combination of supply and demand factors determines the low speed of the current investment recovery; uncertainty, shortage of skilled staff and business regulation are seen by firms as the main obstacles to investment
Variation of aggregate incomes, house prices, the cost of capital and corporate returns are the key drivers of the variation in construction investment across EU members. General improvements in the labour market and in financing conditions, especially in the vulnerable countries, will increase aggregate incomes and housing demand. These developments will address a large part of the decline in construction investment. More worrying is the documented decline in corporate returns that are a key driver of corporate investment. Unless productivity growth increases, it seems unlikely that corporate returns will pick up conspicuously again.
Structural obstacles to investment are another area that cannot be addressed by the general improvement of the economy. When asked about structural obstacles to investment in their countries of operation, the issue reported most frequently by firms is “uncertainty”: overall 67% of firms named this as an obstacle to their investment activities. This is followed by lack of skilled labour (62%) and business regulation (60%). Access to finance follows in 6th place (49%) after high energy costs (55%).
There is a large country and sector-specific component to uncertainty. The highest share of firms reporting uncertainty is in the Greek construction sector, followed by the Greek infrastructure, service and manufacturing sectors. The chain of sectors continues in this manner, with sectors within each country tracking each other very closely in their responses.
In the perception of the importance of business regulation as a barrier to investment there is a clear North-South split. Firms in Greece, Italy and Portugal perceive business regulation to be the most important barrier to investment after uncertainty, while firms in Germany, Finland, and the UK consider business regulation to be much less stifling.
Skilled staff shortages appear to be a general problem in most of the members of the EU: they are considered to be an obstacle by more than half of firms, except in Greece. Lack of skilled labour is seen as an obstacle more often by larger firms and firms active in manufacturing and construction. It is the most severe barrier to investment in Germany: 64% of firms there regard it as an obstacle.
INTRODUCTION 15
European Investment Bank Investment and Investment Finance in Europe
Investment in intangible capital held out better during the crisis but lags behind global peers
Productivity growth can be increased and sustained through more spending on research and development (R&D) and innovation. In the EU, investment in intellectual property rights, a large part of which is accounted for by R&D expenditures, has fared better than investment in fixed tangible capital since 2008. In 2016, levels are higher than those in 2008 in most EU members. Greece, Latvia and Romania are notable exceptions. That said, global comparisons are not so flattering. R&D intensity, the ratio of R&D expenditures to GDP, in the EU has grown only modestly. While this growth was enough to maintain the gap with US R&D intensity, R&D intensities in China and South Korea have grown much faster than in the EU.
Significant heterogeneity of R&D intensities within the EU remains. A group of innovation leaders sustain R&D intensities comparable to those of global leaders – the US, Japan and South Korea. In many EU members, especially from the group of cohesion countries, R&D intensities remain well below those of the leaders.
R&D expenditures make up part of a larger category of investments known as investment in intangible assets. The importance of intangible assets for economic growth is now well established in the academic and applied policy research literature. This importance increases as economies move closer to the global technological frontier, as their possibilities to grow by imitating global technological leaders decline.
European investment in intangible assets has been growing over the past 15 years and at higher rates than investment in tangible capital. Investment in intangible assets also proved more resilient during the financial crisis and the ensuing recession, regaining pre-crisis levels in 2010 and continuing growth throughout the recession in 2011-12, albeit at a slower pace.
The resilience of European investment in intangible assets relative to investment in tangible assets was not sufficient to close the gap with the US, however. US investment in intangibles was higher before the crisis and grew faster after the crisis than in the EU. These differences go some way to explaining the different economic performance of the EU and the US, with intangible assets contributing more to economic growth in the US than in the EU. That said, investment in intangible assets has played only a minor role in the decline of productivity growth since the beginning of the financial crisis, at least in a growth-accounting sense.
Employment protection legislation and government expenditures in R&D are found to be significantly related to investment in intangible capital and its intensity in the economy, as measured by the ratio to tangible assets. These findings provide the rationale for a mix of structural and fiscal policies to address the relative fall of the European economy behind global peers.
INTRODUCTION16
Investment and Investment Finance in Europe European Investment Bank
The European corporate sector has gradually improved financial resilience following the crisis resolution and created conditions for an investment revival
The financial and sovereign debt crisis in Europe exposed the vulnerabilities of the European corporate sector related to a lack of institutional framework for banking market integration in Europe. The most important part of the resolution of the sovereign debt crisis, the creation of the banking union, went a long way to addressing this deficiency. It has contributed to improving the resilience of the banking sector in Europe and the availability of financing for non-financial firms.
Since the beginning of the financial crisis in 2008, central banks in Europe have been confronted with an extremely challenging economic environment. They first reacted by lowering interest rates close to their effective lower bound. The situation persisted for several years with little sign of recovery and growing risks of de-anchoring of inflation expectations in some jurisdictions. Consequently, several central banks in Europe have embarked on a broad set of unconventional measures, mostly of an unprecedented nature: forward guidance, massive provision of longer-term liquidity and the asset purchase programme. As these measures feed through the banking system, and more widely through the financial system, and are transmitted to the real economy, the positive impact starts to be felt, in the euro area first, but also in the overall financial system in the EU. This has helped to arrest the process of financial market fragmentation and to initiate the reverse process. Signs of more integration are now observed between the groups of core and vulnerable countries: government bond yields have come closer together and the cost of bank borrowing for corporations shows signs of convergence. Bank lending is gradually increasing and access to external finance, more broadly, is improving across countries in the euro area. That said, in several countries, the recent improvements in economic conditions are very much dependent on the extremely accommodative monetary policy stance.
SMEs have benefited less from these improvements than larger firms. SMEs face higher lending rates and are more likely to perceive their financial situation as constrained. Access to equity financing for SMEs also remains difficult in Europe. Stock markets are largely inaccessible for them and private equity has only partially rebounded, with total investment and fundraising volumes remaining well below pre-crisis levels. The venture capital segment of private equity has been very dependent on government support since 2008, with government agencies accounting for almost a third of total fundraising in 2015.Improvement of financial conditions over recent years came in lockstep with the gradual improvements in the banking sector. Credit supply conditions went from being extremely adverse during the peaks of the financial crisis – and later the sovereign debt crisis – to broadly neutral for investment. The accommodative monetary policy stance has further contributed to improving overall financing conditions. This neutral to favourable environment should facilitate the increase of investment growth in the near term.
Some areas remain in need of improvement. The positive results of the 2016 EBA stress test have not been accompanied by a confidence rally in the banking sector. Despite the magnitude of the regulatory adjustment achieved, European banks continue to suffer from very low valuations. This most likely reflects a combination of factors, some of which specific to certain countries. The persistence of a low rate environment probably reflects the intense deleveraging cycle through which the banking and corporate sectors have gone and the hysteresis effects from years of very low investment. It may require structural changes in the business model of some banks.

INTRODUCTION 17
European Investment Bank Investment and Investment Finance in Europe
Availability of a wider range of financing options should make productivity growth more resilient to financial distress
Part III of this book studies how finance influences the efficiency of the economy. The central role of the financial system is to direct financing from those with excess to those in need of it. More efficient financial systems improve the efficiency of resource allocation in an economy, which results in improved productivity. Banks hold a special place in financial systems and it is difficult to imagine modern economies without a significant presence of banks. By specialising in screening and monitoring, they are able to mitigate informational asymmetries and provide financing to small and informationally opaque firms that make for an overwhelming share of European economies. In addition, banks play an important role in providing liquidity services, facilitating transactions and exchange.
The financial and sovereign debt crises in Europe brought into the spotlight the size and importance of the banking sector in the EU: the share of European banks in the European financial system is much larger than that in the US or Japan. Whether we look at banking assets relative to GDP, the share of loans in corporate liabilities or the ratio of banking assets to stock- and private bond-market capitalisation, European banks seem to make up an extraordinarily high share of the financial system (Figure 1).
Figure 1 Simplified structure of the financial sector in the EU, 2010-2014 (% GDP, average)
050
100150200250300350400450500
EU US JP
Corporate and government debt securities
Banking sector assets
Equity markets
Source: (Valiante, 2016)
There are at least three issues that arise from being overly reliant on banking. The first is a simple diversification argument: when something goes wrong with the banks there is little scope for resort to other forms of external finance, as the recent financial crisis forcefully reminded us. Indeed, Levine, Lin, and Xie (2016a) argue that equity markets can act as a “spare tire” during banking crises and mitigate the impact on the real economy, but only in countries with strong shareholder protection laws. Arguably, similar conclusions could be drawn about other external financing options like bond markets or private equity.
The second issue is that banks are highly leveraged institutions and thus very influenced by swings in asset prices (Langfield and Pagano, 2016). This makes the banking sector a potential amplifier of business cycles: expanding lending when asset prices increase, bringing asset prices even higher, and contracting lending when asset prices fall, provoking further price declines. In addition to amplifying business cycles such a mechanism misallocates resources across the business cycle, lending too much in booms to lower value projects and too little during economic downturns, foregoing profitable business opportunities (Borio, Kharroubi, Upper, and Zampolli, 2016, and Gopinath, Kalemli-Özcan, Karabarbounis, and Villegas-Sanchez, 2015).
INTRODUCTION18
Investment and Investment Finance in Europe European Investment Bank
Third, banks are an important counterpart for households and SMEs with established businesses and a pool of tangible fixed assets. They are also needed by many large firms to provide and manage liquidity and transactions. Banks, however, are a less suitable counterpart for young and innovative enterprises that typically rely mostly on intangible capital. These companies have the potential to enhance and sustain productivity growth by innovating, which is a risky activity that may take a long period of time before it turns a profit. This feature makes equity a more relevant source of external finance for innovative firms, especially when they are small and young, and allows them to focus on the longer term. A recent OECD study (OECD, 2016a) finds that high productivity growth companies favoured equity as a source of external finance in the period following the financial crisis.
The financial crisis reduced the efficiency of resource allocation and thus had an impact on productivity
A downward trend in productivity growth was already evident before the crisis. The reasons for this are not yet well understood. A comprehensive study on productivity by the OECD (OECD, 2016b) argues that there has been a slowdown in the accumulation of intangible, or knowledge-based, capital since the early 2000s. This type of capital is associated with innovation and therefore productivity growth.
Productivity growth in most European countries came down further following the financial crisis and these effects still seem to be present four years after the end of the sovereign debt crisis in Europe. Part of the explanation may again be the short-lived decline in investment in intangible assets as discussed in Chapter 2 of this book. In addition, not all productivity improvements can be accurately captured in the data. These difficulties in measuring productivity growth may also contribute to the recorded decline.
In Chapter 6 we argue that finance may be another source of productivity slowdown. The focus is thus on the role of the financial system and financial choices of corporates in explaining part of the productivity decline. The financial crisis impaired the capacity of the financial sector to efficiently allocate resources across economies. In general, resources are efficiently allocated if more productive firms attract more resources and produce more than less productive firms. The efficiency of the financial system plays a role in this process as efficient financial systems reallocate credit from less productive firms to more productive ones thereby allowing the latter to expand and the former to contract.
The European banking system took significant blows during both the financial and the sovereign debt crises, which had large effects on credit supply and the efficiency of the allocation of credit in the economy. At the same time, financial constraints became more acute during the financial crisis, as the net worth of corporates fell and pushed up agency costs. This had an additional negative effect on the efficiency of resource allocation, as many young and innovative firms are subject to binding financial constraints.
There exists a well-established body of academic literature on the effects of financial constraints on the efficiency of resource allocation. A common finding in this literature is that financial constraints reduce the efficiency, thereby lowering aggregate productivity levels. A second strand of literature studies the impact of the financial crisis on credit supply in Europe. Despite them looking at different countries and having different research designs, most studies find that the credit supply shock, originating from weak banks, had a significant impact on real activity. This impact was asymmetric along two different dimensions. First, banks with different business models or weak balance sheets were affected differently and therefore transmitted the financial shock to their customers with varying intensity. Second, the financial crisis hit firms asymmetrically along the size distribution: credit supply to smaller firms fell more and these firms had more difficulties compensating for the reduced external financing with other sources of finance.
INTRODUCTION 19
European Investment Bank Investment and Investment Finance in Europe
These two streams of research find a common point, because the financial crisis amplified the effects of financial constraints on the efficiency of resource allocation. Furthermore, the asymmetric nature of the credit supply shock has had additional misallocation effects. The empirical analysis in Chapter 6 provides evidence that the financial crisis indeed worsened the effect of financial constraints on the real economy. Using firm-level data, it shows that the combination of financial constraints and the impact of the financial crisis had a detrimental effect on the efficiency of resource allocation as business opportunities have been missed due to these effects.
Using an empirical decomposition of sectoral productivity into average productivity and allocative efficiency, the analysis in Chapter 6 confirms findings in the existing literature that financial constraints have a negative impact on productivity growth. A large share of this negative effect is explained by the declining allocative efficiency of the economy. The financial crisis had a positive effect on one of the components, namely average sector productivity, possibly by driving smaller unproductive firms out of business. The other component – intra-sectoral efficiency of resource allocation – was negatively affected however. This negative effect can be explained by the tightening of credit constraints.
In the most recent period credit allocation has been improving, as confidence in the banking sector has risen and corporates have strengthened their balance sheets after a long period of deleveraging. While financial constraints seem to be less binding than at the peak of the financial crisis they are still worse than before the crisis, with detrimental effects on the non-financial corporate sector.
Highly leveraged firms were disproportionately affected by the financial crisis
Firms’ financing choices before the financial crisis had an impact on their resilience during the crisis. Many firms whose debt matured at the peak of the crisis were not able to roll it over and suffered from a liquidity shortage. Firms with access to pre-agreed credit lines with their banks could draw on these lines and avoid liquidity problems (Campello, Giambona, Graham, & Harvey, 2012). Firms without such access faced a trade-off between savings and investment (Campello, Giambona, Graham, & Harvey, 2011).
Chapter 7 of this book documents the evolution of the sources of financing for non-financial firms in Europe and the effects of changes in these financing sources on the dynamics of firms’ real activity before and after the European crisis. It argues that smaller firms’ financing choices and their dynamics were very different from those of larger firms. Large firms dominate the aggregate balance sheet. Thus, in order to understand the effects of firms’ financing choices on real outcomes, it is important to study average outcomes, using firm-level data, rather than rely on macro aggregates.
Firms in the euro area accumulated more financial debt than non-euro area firms during the 2000s. This debt came in the form of short-term bank loans and long-term debt, whereas other forms of financing such as equity and retained earnings increased only slightly during the deleveraging process of the crisis years. The increase in short-term loans was mostly driven by SMEs in the euro area periphery countries, whereas long-term debt was accumulated relatively more by large firms in the euro area core countries.
Non-financial debt also played an important role both before and during the crisis period. SMEs in the euro area periphery increased trade credit by a factor of 2.5 whereas firms outside the euro area increased other current liabilities, which mostly consist of intra-group debt.

INTRODUCTION20
Investment and Investment Finance in Europe European Investment Bank
These financing choices affected real outcomes, especially during the crisis. Firms that accumulated more debt experienced declining investment and sales both before and after the crisis. Firms that financed themselves with trade credit, equity and retained earnings before the crisis have proved to be more resilient to financial distress. Since 2008 such firms have been able to increase investment and sales. The importance of these sources of finance is emphasised in other studies, too. Levine and Lin (2016a) and Levine, Lin, and Lie (2016b) make the case for trade credit and for equity. In addition, OECD (2016a) argues that more productive firms tend to use equity financing more intensively in general and in particular following the financial crisis in 2008.
By way of conclusion
The financial crisis has brought to public attention the importance of debt and banking for the European economy. The debt build-up in the years leading up to the crisis and the subsequent drawn-out period of deleveraging brought about an investment boom-and-bust cycle that was associated with significant resource misallocation (Borio, Kharroubi, Upper, & Zampolli, 2016) (Gopinath, Kalemli-Özcan, Karabarbounis, & Villegas-Sanchez, 2015).
Following the financial crisis, investment remained very low for a long period of time, especially in residential and non-residential buildings and structures, and has only recently started to pick up, boosted by improving financial conditions and strengthening domestic demand. Further significant improvement of the labour market should bring investment more into line with past experience. Addressing the slowdown of productivity growth, however, remains a challenge even after the effects of the financial crisis on it have dissipated.
The forced retrenchment of government investment following the sovereign debt crisis has deepened the economic recession in a number of European countries. Furthermore, this retrenchment contributed to the investment decline in most countries in the EU, especially in the infrastructure sector. Compared to earlier periods, government infrastructure investment is weak almost everywhere except for the cohesion countries. At a certain point, run-down and insufficient infrastructure becomes an obstacle to economic growth. Innovation-related investment in intangibles is growing, but remains low by comparison with global peers.
This creates a need for continued action on at least three fronts. Firstly, structural reforms focused on market flexibility are needed to support innovation and productivity growth. Secondly, public support for investment is needed to make the best use of available EU and national financing capacities to address investment gaps in infrastructure and innovation and to help alleviate the financial constraints faced by smaller firms.
Thirdly, the European financial market remains underdeveloped relative to peers and not well integrated, reducing the availability of diverse and independent sources of external finance for corporates. This reduces corporate resilience to financial distress, as the financial crisis made obvious. It revealed the need to further develop European debt and capital markets as an alternative source of finance for European corporations. The deepening of the corporate debt market is especially important to address bottlenecks in the supply of bank credit. The Capital Markets Union initiative should go a long way to addressing these issues. In the longer term, the development of deeper financial markets across Europe would help to achieve better resource allocation and better risk-sharing, and make European economies more resilient to shocks.

INTRODUCTION 21
European Investment Bank Investment and Investment Finance in Europe
Finding your way around this book
The Report consists of three main parts. Part I provides an overview of recent developments in gross fixed capital formation (GFCF) in the EU, in Chapter 1, and investment in intangible capital in Chapter 2. Chapter 1 dissects the recent evolution of EU GFCF by institutional sector and asset type, with special attention paid to the evolution of infrastructure investment. It offers discussion of the drivers of these developments and the implications for European economies. Chapter 2 revises and updates the estimates of intangible capital in Europe from the INTAN-Invest dataset. It then analyses the effects of the financial crisis on investment in intangible capital in Europe and compares it with developments in the US. A novelty this year is Chapter 3. This introduces the new annual EIB Investment Survey (EIBIS) and outlines the wide range of topics that this unique source of information makes it possible to analyse.
Part II focuses on recent developments in investment finance in the EU. Chapter 4 presents an analysis of financing conditions for non-financial corporations and the capacity of the banking system to provide investment finance. It discusses some possible factors behind the relative weakness in corporate investment at this stage of the recovery. Chapter 5 analyses the financing of European small and medium-sized enterprises (SMEs), focusing on the availability and recent development of a wide array of financing instruments intended primarily for SMEs.
As in two previous editions of the Report, Part III focuses on a special topic of relevance to investment and investment finance in Europe. This year the focus is on the impact of the crisis on corporate finance and the lessons for the financing of productivity growth. More specifically, the analysis centres on how corporate financial decisions and the problems in the European banking sector channelled the impact of the financial crisis to the real economy and draws lessons for policy makers. Chapter 6 analyses the effects that the financial crisis had on credit constraints and on the efficiency of resource allocation in the economy. Chapter 7 examines the role of the capital structure of non-financial corporations in transmitting the financial shock to real activity.

INTRODUCTION22
Investment and Investment Finance in Europe European Investment Bank
References
Borio, C., Kharroubi, E., Upper, C., & Zampolli, F. (2016). “Labour Reallocation and Productivity Dynamics: Financial Causes, Real Consequences”. BIS Working paper No. 534.
Campello, M., Giambona, E., Graham, J. R., & Harvey, C. R. (2011). “Liquidity Management and Corporate Investment During a Financial Crisis”. Review of Financial Studies, 24(6), 1944-1979.
Campello, M., Giambona, E., Graham, J. R., & Harvey, C. R. (2012). “Access to Liquidity and Corporate Investment in Europe during the Financial Crisis”. Review of Finance, 16, 323-346.
Gopinath, G., Kalemli-Özcan, S., Karabarbounis, L., & Villegas-Sanchez, C. (2015). “Capital Allocation and Productivity in South Europe”. NBER WP Series, 21453.
Langfield, S., & Pagano, M. (2016). “Bank Bias in Europe: Effects on Systemic Risk and Growth”. Economic Policy, 31(85), 51-106.
Levine, R., Lin, C., & Xie, W. (2016a). “Spare Tire? Stock Markets, Banking Crises, and Economic Recoveries”. Journal of Financial Economics, 120(1), 81-101.
Levine, R., Lin, C., & Xie, W. (2016b). “Corporate resilience to banking crises: The roles of trust and trade credit”. NBER Working Paper No. 22153.
OECD. (2016a). “Corporate Finance and Productivity”. In OECD Business and Finance Outlook 2016.OECD. (2016b). The Future of Productivity. Paris: OECD.
Valiante, D. (2016). "Europe’s Untapped Capital Market: Rethinking Integration after the Great Financial Crisis". CEPS Paperback. London: Rowman & Littlefield International.

23
European Investment Bank Investment and Investment Finance in Europe

24
Investment and Investment Finance in Europe European Investment Bank

25
European Investment Bank Investment and Investment Finance in Europe
Part I
Gross fixed investment and intangible capital
Chapter 1
Gross fixed capital formation in the EU1
1 This chapter was prepared by Atanas Kolev with contributions from Tim Bending, Philipp Brutscher, Rocco Bubbico, and Tanja Tanayama (EIB). Floriana Borino and Alena Wabitsch provided research assistance.

26
Investment and Investment Finance in Europe European Investment Bank

Gross fixed investment and intangible capital PART I 27
European Investment Bank Investment and Investment Finance in Europe
Gross fixed capital formation in the EU
Chapter at a glance
• GFCF in the EU has increased since 2013 following a mild, relative to historical standards, economic recovery. This investment recovery is uneven across countries and over time.
• Corporate investment has been the main driver of the investment increase in core and vulnerable countries, growing at rates well above historical averages. In cohesion countries, corporate investment has not picked up substantially yet and remains well below pre-crisis levels.
• Low investment by households and general governments, in particular in vulnerable countries, remains the main drag on total EU investment and on investment in vulnerable countries in particular. The household and government sectors together account for 80% of the difference between the level of investment in 2016 and 2008.
• Within government GFCF, infrastructure investment was disproportionately more affected. Government infrastructure investment declined by more than total government GFCF, when compared to their pre-crisis averages. Looking ahead, most EU governments do not plan increases in government investment in 2016 and 2017, even though in several countries it has reached its lowest levels in the past 20 years.
• Examining the breakdown of GCFC by asset type: investment growth is driven by GCFC in machinery and equipment and intellectual property rights, which are typically corporate investments. GFCF in construction, both residential and non-residential, remains low relative to pre-crisis levels eight years after the crisis started.
• Variation in aggregate incomes, house prices, the cost of capital and corporate returns are the key drivers of the variation in construction investment across EU members. This suggests that significant improvements in the labour market and financing conditions should address a large part of the construction decline.
• More worrying is the decline in corporate returns that are a key driver of corporate investment. Unless productivity growth increases, it seems unlikely that corporate returns will pick up conspicuously again.
• Comparing current investment levels to pre-crisis peaks may not be the most appropriate approach, due to the unsustainable surge in investment in the three years preceding the crisis. Comparing investment ratios to GDP with long-term averages addresses this problem. Such a comparison confirms that weakness of investment in the household sector and in non-residential construction opens a gap between the current investment rate and historical averages. The government investment ratio to GDP, however, is very close to its long-term average, except for government investment in infrastructure. In this case the gap remains.
• Productivity growth increases through more R&D and innovation. In the EU, investment in intellectual property rights, a large part of which is accounted for by R&D expenditures, has done much better than investment in fixed, tangible capital since 2008. In 2016, levels are higher than those in 2008 in most EU members. Greece, Latvia and Romania are notable exceptions.
• R&D intensity, the ratio of R&D expenditures to GDP, in the EU has grown modestly, however. This growth was enough to maintain the gap with US R&D intensity. R&D intensities in China and South Korea, however, have grown much faster than in the EU.
• Significant heterogeneity among R&D intensities in EU economies remains. A group of innovation leaders maintain R&D intensities comparable to those of global leaders – US, Japan and South Korea. A significant number of EU members, in particular cohesion countries, remain well below the leaders.

PART I Gross fixed investment and intangible capital28
Investment and Investment Finance in Europe European Investment Bank
1.1. IntroductionThe weak record of gross fixed capital formation (GFCF) in the EU since the financial crisis in 2008 has been a major concern for policy makers. Eight years on, real GFCF is still nearly 10% below its level in 2008. The current situation is seen by many as very unusual and worrying, despite expectations early on of a weak and protracted recovery following the twin financial crisis and the investment boom that preceded it. As Reinhart and Rogoff (2010) explain at length, the financial crisis of 2008 and the European sovereign debt crisis are not much different from earlier financial crises and therefore the consequences should be similar. In particular, recoveries from past financial crises were very long and protracted, and U-shaped, because of the necessary time to unwind the debt accumulated before the crisis and to fix the financial sector.
In addition to debt deleveraging and the relatively slow recovery of the banking sector, the twin financial crisis in Europe has significantly affected productivity growth and the efficiency of resource allocation in European economies. This has depressed the rates of return on investment, and ultimately investment and economic growth.
This chapter dissects the recent evolution of GFCF across the EU and discusses the drivers behind it. It consists of four sections. Section 2 briefly outlines the economic environment since the start of the latest economic recovery in 2013. Section 3 examines GFCF in the EU by institutional sector and by asset type and discusses the drivers behind this evolution. It pays special attention to infrastructure investment. The reason for this focus is the particular importance of infrastructure for economic growth. Motivated by the crucial role of R&D expenditure in innovation that is the main determinant of productivity growth and competitiveness, section 4 more closely examines the evolution of R&D expenditures in the EU, adding to the outline of their evolution in section 2.
1.2. The economic environment has been gradually improving
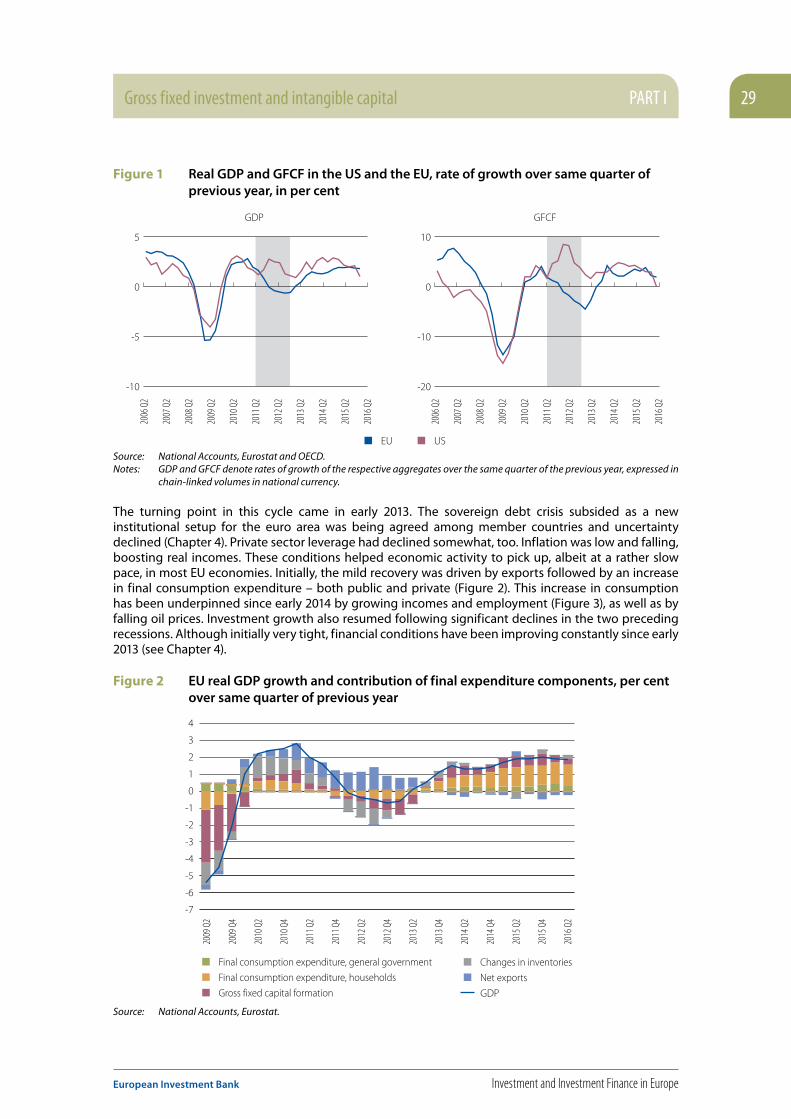
Despite differences in economic structures and policy responses, GDP and GFCF in the US and EU followed very similar dynamics during the Great Recession that started in 2008 and in the two years that followed its end in 2009 (Figure 1). In the second half of 2011, however, the two economies diverged. The unfolding of the European sovereign debt crisis that started in the second half of 2010 and intensified in the following two years has had a serious negative impact on European economies. While investment and output growth accelerated in the US, most EU economies plunged into a recession that lasted until early 2013. Several factors drove this divergence. The sovereign debt crisis increased economic uncertainty everywhere in Europe and not just in the countries that were directly affected. The cost of financing for all sectors in the economy rose, as spreads increased and banks experienced problems with deteriorating portfolios (Chapter 4 of this book). Governments in the most affected countries – Greece, Spain, Ireland and Portugal – had to aggressively address deficits in the midst of massive private sector deleveraging, which in turn led to worsening of the economic recessions in these countries.
Gross fixed investment and intangible capital PART I 29
European Investment Bank Investment and Investment Finance in Europe
Figure 1 Real GDP and GFCF in the US and the EU, rate of growth over same quarter of previous year, in per cent
USEU
GDP GFCF
-10
-5
0
5
-20
-10
0
10
2006
Q2
2007
Q2
2008
Q2
2009
Q2
2010
Q2
2011
Q2
2012
Q2
2013
Q2
2014
Q2
2015
Q2
2016
Q2
2006
Q2
2007
Q2
2008
Q2
2009
Q2
2010
Q2
2011
Q2
2012
Q2
2013
Q2
2014
Q2
2015
Q2
2016
Q2
Source: National Accounts, Eurostat and OECD.Notes: GDP and GFCF denote rates of growth of the respective aggregates over the same quarter of the previous year, expressed in
chain-linked volumes in national currency.
The turning point in this cycle came in early 2013. The sovereign debt crisis subsided as a new institutional setup for the euro area was being agreed among member countries and uncertainty declined (Chapter 4). Private sector leverage had declined somewhat, too. Inflation was low and falling, boosting real incomes. These conditions helped economic activity to pick up, albeit at a rather slow pace, in most EU economies. Initially, the mild recovery was driven by exports followed by an increase in final consumption expenditure – both public and private (Figure 2). This increase in consumption has been underpinned since early 2014 by growing incomes and employment (Figure 3), as well as by falling oil prices. Investment growth also resumed following significant declines in the two preceding recessions. Although initially very tight, financial conditions have been improving constantly since early 2013 (see Chapter 4).
Figure 2 EU real GDP growth and contribution of final expenditure components, per cent over same quarter of previous year
Final consumption expenditure, households
GDP
Final consumption expenditure, general government
Gross fixed capital formation
Changes in inventories
Net exports
2009
Q2
2009
Q4
2010
Q2
2010
Q4
2011
Q2
2011
Q4
2012
Q2
2012
Q4
2013
Q2
2013
Q4
2014
Q2
2014
Q4
2015
Q2
2015
Q4
2016
Q2
-7
-6
-5
-4
-3
-2
-1
0
1
2
3
4
Source: National Accounts, Eurostat.

PART I Gross fixed investment and intangible capital30
Investment and Investment Finance in Europe European Investment Bank
Figure 3 Total employment and real gross disposable income, rate of growth over same quarter of previous year
-4
-3
-2
-1
0
1
2
3
4
-6
-4
-2
0
2
4
6employment real disposable income (right scale)
2009
Q1
2009
Q3
2010
Q1
2010
Q3
2011
Q1
2011
Q3
2012
Q1
2012
Q3
2013
Q1
2013
Q3
2014
Q1
2014
Q3
2015
Q1
2015
Q3
2016
Q1
Source: Eurostat.Notes: Employment denotes the rate of growth of total employment over the same quarter of the previous year. Real disposable
income denotes the rate of growth of disposable income expressed in 2010 chain-linked volumes over the same quarter of the previous year.
While the Euro Area Business Cycle Dating Committee called the end of the recession in the euro area in 2013 Q1, economies did not grow uniformly within the euro area and across Europe. The group of cohesion countries, formed by EU members that joined in 2004 and after, experienced a much briefer and smaller slowdown in 2012 and grew, on average, twice as fast as the older members from 2013 onwards. Public and private consumption expenditure made the largest contribution to this difference. Investment also increased more in cohesion countries than in older members. EU structural and investment funds in conjunction with the fact that 2015 was the last year when payments related to the 2007-2013 programming period could be made helped to boost investment in these countries and their economies overall (Box 1). Within older Member States differences persisted, too. Some of the countries that were most hit by the crisis – Greece, Italy, Portugal, and Spain – resumed growth in early 2014, or about a year later than most EU peers.2 Despite also being in this group, Ireland’s GDP resumed growth in early 2013 as with most other EU members.
1.3. Gross fixed capital formation resumed growth at a low rate
GFCF in the EU picked up again in the second quarter of 2013, after declining for eight consecutive quarters, and increased by a total of 9.5% in the three years to 2016 or about 3.1% per year (Figure 4). This growth increase was driven by core and cohesion countries, but it has not been vigorous by historical standards – only in the group of core countries did it slightly exceed its pre-crisis average. In the VMS, investment growth resumed about a year later with strong contributions from Spain and Ireland. In the first half of 2016, growth of real GFCF slowed down across country groups, turning negative in cohesion countries. The decline in cohesion countries, as well as a large share of the preceding recovery, can be mostly attributed to investments related to European Structural and Investment Funds (ESIF). These investments increased significantly between 2013 and 2015 (see also Figure 7 and Box 1) because 2015 was the last year in which payments from ESIF related to programming period 2007-2013 could be made. In 2016, investment related to the new programming period collapsed, taking down the overall GFCF level (Figure 4). The decline in the VMS is related to a large decline in Ireland and smaller declines
2 Throughout this publication this group, including Cyprus, Greece, Ireland, Italy, Portugal, Slovenia and Spain, is called the group of vulnerable Member States (VMS).

Gross fixed investment and intangible capital PART I 31
European Investment Bank Investment and Investment Finance in Europe
in Portugal, Greece, and Slovenia. The decline in Ireland is related to isolated events, whose effect is likely to be temporary.3
Figure 4 Real GFCF by country group, per cent change relative to same quarter of previous year
-25
-20
-15
-10
-5
0
5
10
Core VMSCohesion
2009
Q2
2009
Q4
2010
Q2
2010
Q4
2011
Q2
2011
Q4
2012
Q2
2012
Q4
2013
Q2
2013
Q4
2014
Q2
2014
Q4
2015
Q2
2015
Q4
2016
Q2
Source: National Accounts, Eurostat.Notes: “Core” includes Austria, Belgium, Germany, Denmark, Finland, France, Luxembourg, the Netherlands, Sweden and the
UK; “VMS” includes Cyprus, Greece, Spain, Ireland, Italy, Slovenia and Portugal; “Cohesion” includes Bulgaria, the Czech Republic, Estonia, Croatia, Hungary, Lithuania, Latvia, Malta, Poland, Romania and Slovakia.
Assuming that GFCF growth maintains its current pace, it will take another three years, until the end of 2018, to get back to 2008 levels of investment. Such a long period is not an exception, however, as Reinhart and Rogoff (2010) have shown. Long and slow recoveries of investment after financial crises are due to extended periods of deleveraging, combined with scarred banking sectors and inflated pre-crisis investment levels. Table 1 shows the number of years that it took for real investment to recover to the pre-crisis peak during the Nordic financial crises in the early 1990s and the 2008 financial crisis in the US. All four countries experienced financial crises that followed substantial surges in private credit and housing booms in the respective periods, similar to aggregate EU developments in the period before 2008. It took between 9 and 11 years for each country’s investment to recover to its pre-crisis peak.4
Table 1 Investment declines and recoveries following financial crises and real estate busts
Country Peak Trough Total decline in % Years to reach previous investment peak
Norway 1987Q3 1992Q2 34 9 ¾
Finland 1990Q1 1993Q3 42 10 ¾
Sweden 1989Q4 1993Q4 31 9 ½
US 2006Q1 2010Q1 20 9 ½
Source: Source: National Accounts, Eurostat and OECD.Notes: Peak and trough denote the highest pre-crisis and the lowest level of investment reached during the crisis, respectively.
Years to reach peak denotes the number of years before the pre-crisis peak had been attained.
3 Ireland has revised its GDP for 2015 upwards by 26%. According to Eurostat, this is primarily due to the relocation to Ireland of a limited number of big economic operators. Details are not yet known, but it seems likely that this revision has affected investment. Investment in intellectual property products, in particular, tripled in the course of 2015 and then declined by 50% in the beginning of 2016.
4 Important to note here is that, unlike some European countries today, none of these countries had a follow-up sovereign debt crisis and all of them addressed the problems in their banking sectors promptly. In addition, the Nordic recoveries were significantly helped by large currency depreciations and solid external demand.

PART I Gross fixed investment and intangible capital32
Investment and Investment Finance in Europe European Investment Bank
The academic literature records similar recovery speeds and times. Reinhart and Rogoff (2014) find that it takes on average eight years to reach the pre-crisis level of income. Cerra and Saxena (2008), in a large panel of countries, find evidence that recoveries are weaker when recessions are longer and that, on average, output losses persist more than ten years after a banking crisis, even for the reduced sample of high income countries. Rioja, Rios-Avila, and Valev (2014) find that the investment rate is, on average 1.7% below pre-crisis levels even nine years after a banking crisis.
Figure 5 (left panel) compares the speed of the investment recovery in the EU since 2013 with the recoveries in Finland and Sweden after their financial crises in the early 1990s, and with that of the US following the financial crisis and recession in 2008-9.5 In the Nordic case, investment grew about three times faster than in the EU in the three years after reaching its lowest value, while in the US investment increased about 1½ times faster. The right panel of Figure 5 presents a similar comparison between the US and the different country groups in the EU. It clearly shows that investment growth in the EU fell behind that in the US in the three years following the investment trough because of the late start of the recovery in the vulnerable countries and a slowdown in the core countries that started in 2014.6 Investment in cohesion countries, as well as in Ireland and Spain, has grown in line with US post-financial crisis rates. This dynamic puts the latter two countries in stark contrast with the rest of their peers in the VMS group.
Growth of GFCF has not been uniform in the groups of core and cohesion countries either. In the group of cohesion countries, GFCF has been broadly flat in Bulgaria and Latvia since 2013, even falling slightly in 2015, while in Estonia it has been declining since 2014. In the group of core EU members, investment in Finland and France has remained flat since 2013, with some recent signs that it may start increasing again.
Figure 5 Total rate of change of real GFCF since last trough
US (2010)
Finland (1993)
Sweden (1993)
EU (2013)
-2 -1 0 1 2 3 4 5 6 7 8 9 10 11 12 130
5
10
15
20
25
30
35
VMS
Cohesion
US (2010)
Core
-2 -1 0 1 2 3 4 5 6 7 8 9 10 11 12 130
5
10
15
20
25
30
35
Source: National Accounts, Eurostat and OECD.Notes: GFCF is expressed in 2010 chain-linked volumes in national currency. Period 0 on the horizontal axis denotes the trough
(lowest investment level) reached during the crisis episode.
5 Period 0 on the charts denotes the quarter when investment reached a trough.6 The slowdown was particularly evident in Germany, France and Austria.
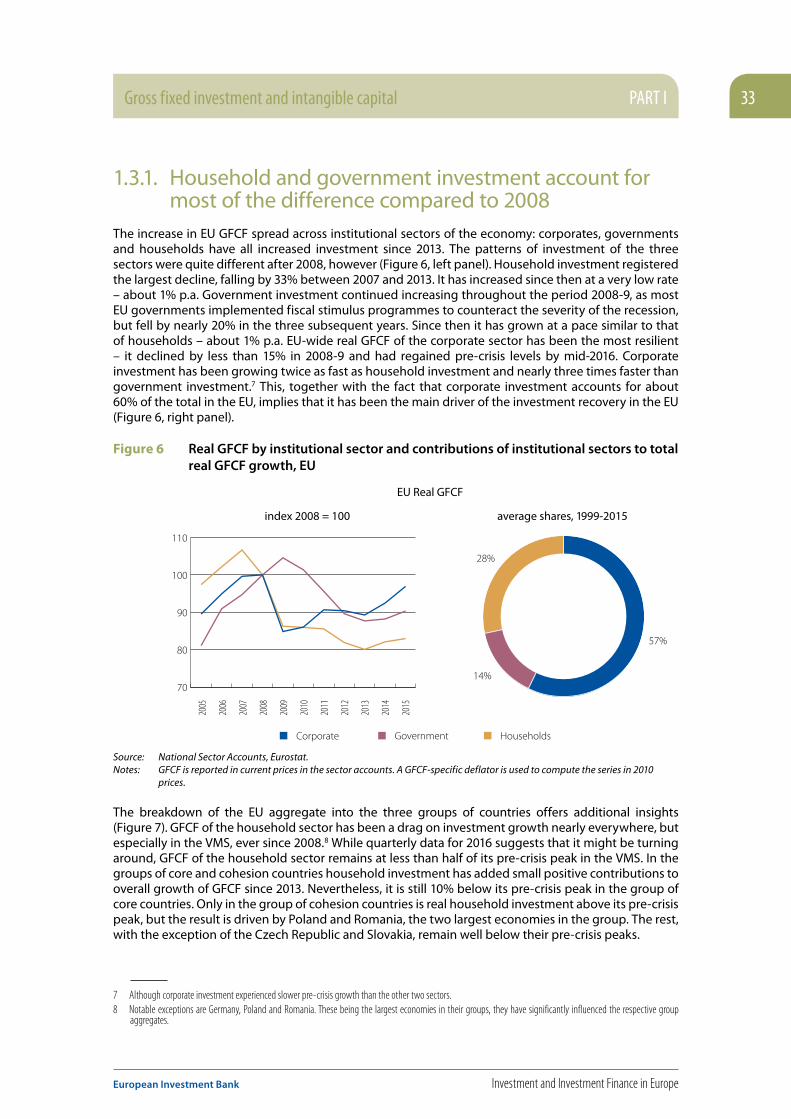
Gross fixed investment and intangible capital PART I 33
European Investment Bank Investment and Investment Finance in Europe
1.3.1. Household and government investment account for most of the difference compared to 2008
The increase in EU GFCF spread across institutional sectors of the economy: corporates, governments and households have all increased investment since 2013. The patterns of investment of the three sectors were quite different after 2008, however (Figure 6, left panel). Household investment registered the largest decline, falling by 33% between 2007 and 2013. It has increased since then at a very low rate – about 1% p.a. Government investment continued increasing throughout the period 2008-9, as most EU governments implemented fiscal stimulus programmes to counteract the severity of the recession, but fell by nearly 20% in the three subsequent years. Since then it has grown at a pace similar to that of households – about 1% p.a. EU-wide real GFCF of the corporate sector has been the most resilient – it declined by less than 15% in 2008-9 and had regained pre-crisis levels by mid-2016. Corporate investment has been growing twice as fast as household investment and nearly three times faster than government investment.7 This, together with the fact that corporate investment accounts for about 60% of the total in the EU, implies that it has been the main driver of the investment recovery in the EU (Figure 6, right panel).
Figure 6 Real GFCF by institutional sector and contributions of institutional sectors to total real GFCF growth, EU
57%
14%
28%
70
80
90
100
110
HouseholdsGovernmentCorporate
index 2008 = 100
EU Real GFCF
average shares, 1999-2015
2005
2006
2007
2008
2009
2010
2011
2012
2013
2014
2015
Source: National Sector Accounts, Eurostat.Notes: GFCF is reported in current prices in the sector accounts. A GFCF-specific deflator is used to compute the series in 2010
prices.
The breakdown of the EU aggregate into the three groups of countries offers additional insights (Figure 7). GFCF of the household sector has been a drag on investment growth nearly everywhere, but especially in the VMS, ever since 2008.8 While quarterly data for 2016 suggests that it might be turning around, GFCF of the household sector remains at less than half of its pre-crisis peak in the VMS. In the groups of core and cohesion countries household investment has added small positive contributions to overall growth of GFCF since 2013. Nevertheless, it is still 10% below its pre-crisis peak in the group of core countries. Only in the group of cohesion countries is real household investment above its pre-crisis peak, but the result is driven by Poland and Romania, the two largest economies in the group. The rest, with the exception of the Czech Republic and Slovakia, remain well below their pre-crisis peaks.
7 Although corporate investment experienced slower pre-crisis growth than the other two sectors.8 Notable exceptions are Germany, Poland and Romania. These being the largest economies in their groups, they have significantly influenced the respective group
aggregates.

PART I Gross fixed investment and intangible capital34
Investment and Investment Finance in Europe European Investment Bank
Figure 7 Real GFCF by institutional sector and contributions of institutional sectors to total real GFCF growth, core, VMS and cohesion countries
50
60
70
80
90
100
110
120
GovernmentCorporate HouseholdsTotal
50
60
70
80
90
100
110
120
2005
2006
2007
2008
2009
2010
2011
2012
2013
2014
2015
0%
20%
40%
60%
80%
100%
2005
2006
2007
2008
2009
2010
2011
2012
2013
2014
2015 Core VMS Cohesion
Core countries, index 2008 = 100
50
60
70
80
90
100
110
120
2005
2006
2007
2008
2009
2010
2011
2012
2013
2014
2015
VMS, index 2008 = 100
Average investment shares, 1999-2015
Real GFCF by country group
Cohesion countries, index 2008 = 100
Source: National Sector Accounts, Eurostat .Notes: GFCF is reported in current prices in the sector accounts. A GFCF-specific deflator is used to compute the series in 2010 prices.
GFCF of the general government sector shows the largest variation across country groups. In the group of core countries, despite four years of fiscal consolidation, real GFCF of the general government has never fallen below pre-crisis levels: it slightly increased in 2015 following the gradual decline between 2010 and 2014. In the group of cohesion countries, the fiscal consolidation started later, lasted for a shorter time and was much more abrupt: government investment fell by 14% in just two years – 2012-2013. In the two years that followed, however, it rebounded, increasing by a total of 12%. These large swings can be explained by the importance of European Structural and Investment Funds for investment in this group (Box 1). The group of VMS experienced the largest decline in real GFCF of the general government: in the four years between 2010 and 2014 it fell by 42%. It picked up again slightly in 2015 only in Italy and Greece, but from a very low base. The dramatic decline in government investment also had important consequences for infrastructure spending in these countries, as discussed in more detail in Section 3.3.

Gross fixed investment and intangible capital PART I 35
European Investment Bank Investment and Investment Finance in Europe
The enormous decline in GFCF of the general government in the VMS has been the result of a necessary fiscal consolidation in the countries in this group, but also of the large fiscal stimulus in 2008-9 in some countries. That said, GFCF accounted for the lion’s share of the decline in total expenditures of the general government during the period of fiscal consolidation 2010-2015, even though GFCF accounts for only a small share of total expenditures – around 6.5%. By the end of 2015, when GFCF of the general government started increasing again, government expenditure as a share of GDP and relative to 2009 fell by 2 p.p. of GDP in the VMS, and GFCF accounted for 90% of this decline (Figure 8).
The share of the decline in government investment in the core countries was much smaller than in the VMS. Nevertheless it exceeded the average share of investment in total expenditures 2½ times, suggesting that governments in the core countries cut investment expenditure disproportionately more than other expenditure. This decline has had a large negative effect on government infrastructure investment (Section 3.3, Figure 19). The reduced government infrastructure investment accounted for about a half of the decline in government GFCF between 2009 and 2015 in both the core countries and VMS.
The group of cohesion countries was the only one in which the decline in government GFCF was very small between 2009 and 2015 and well below the average share of government GFCF in total expenditure. This phenomenon can be attributed to the role of the European Structural and Investment Funds, which require national governments to co-finance projects. Thus, if governments in cohesion countries were to decide to substantially reduce investment, their countries would not be able to benefit from ESIF. The decline between 2009 and 2015 in this group, small as it is, is fully attributable to lower infrastructure investment relative to GDP (Section 3.3).
Figure 8 Change in government expenditure 2009-15, per cent of GDP
TotalGFCF Other
-3.5
-3.0
-2.5
-2.0
-1.5
-1.0
-0.5
0.0
EU Core VMS Cohesion
Source: AMECO.

PART I Gross fixed investment and intangible capital36
Investment and Investment Finance in Europe European Investment Bank
Box 1 Government investment in the EU
Since 2010 public investment relative to GDP in Europe has declined significantly, reaching in 2015 its lowest level since 1998.9 Overall, public investment was fairly stable in Europe between 1995 and 2007, ranging from 2.9% to 3.2% of GDP. The sovereign debt crisis generated a vigorous and coordinated action of fiscal consolidation, slashing public investment programmes and causing a severe contraction of capital spending. Despite the EU Commission recommendations to implement “growth friendly fiscal consolidation”, public investment relative to GDP has kept on decreasing.10 This is particularly evident in the case of the VMS, where public investment fell from 4.2% of GDP in 2009 to 2.3% in 2014. Also, cohesion countries witnessed a contraction of government capital expenditure relative to GDP (0.9 p.p. between 2009 and 2013), but since 2013 public investment has picked up again. In core countries public investment has been on a downward trend since 2009, but is still in line with the pre-crisis level.
In six Member States (Hungary, Bulgaria, Slovakia, Malta, Denmark and Slovenia) public investment in 2015 was at the highest levels observed since 1995, well above the long-term average in these countries (Figure 9). In cohesion countries, this is also due to relatively low public investment spending prior to 2005 and large financing through the European Structural and Investment Funds after joining the EU. At the other end of the spectrum, public investment in the majority of the VMS (Italy, Portugal, Ireland, and Cyprus) and in a few core ones (France and Netherlands) is at its lowest point since 1995. Public investment in Greece has picked up over the last couple of years reaching 3.8% of GDP in 2015, 1½ p.p. above the trough of 2012-2013, but this is still around 50% of the 2008 level.
Figure 9 Public investment (2015) compared to levels observed in 1995-2015 and average levels
20151995-2015 average
0
1
2
3
4
5
6
7
8
0
1
2
3
4
5
6
7
8
0
1
2
3
4
5
6
7
8
HU BG SK EE CZ SI RO MT LV PL SE FI LU EL DK LT NL FR AT HR
UK ES BE IT DE PT CY EI
EU-2
8EU
-15
% o
f GD
P
Source: AMECO database Note: Croatia 2000-2015
9 Gross Fixed Capital Formation of the General Government (ESA2010: P.51g)10 See EC’s Annual Growth Survey 2012, COM(2011) 815 final

Gross fixed investment and intangible capital PART I 37
European Investment Bank Investment and Investment Finance in Europe
The fiscal stance of each country is connected with the shifts in levels of public investment (Figure 10). The countries in which public investment has contracted most (compared to the pre-crisis period) have been facing severe public deficits. However, some countries have registered a public investment level above their pre-crisis period even in conjunction with large average deficits (e.g. Hungary, Slovakia).
Figure 10 Change in public investment (2013-15 average/2005-07 average) and average deficit (2005-2017) as % of GDP
-3.0
-2.5
-2.0
-1.5
-1.0
-0.5
0.0
0.5
1.0
1.5
BE
BG
CZ
DK
DE
EE
IE
EL
ES
FR
HR
IT
CY
LV
LT
LU
HU
MT
NL
AT
PL
PT
ROSI
SK
FI
SEUK
-10 -9 -8 -7 -6 -5 -4 -3 -2 -1 0 1 2
Publ
ic in
vest
men
t (1
3-15
ave
rage
vs.
05-0
7 av
.)
Average deficit 2005-2015
Source: AMECO database.
Regional and local authorities in Europe play a key role in financing and managing public investment programmes, as they are responsible for 53% of the gross fixed capital formation of the general government. This percentage is roughly in line with the pre-crisis level. However, large variations across countries exist, due to a wide range of institutional architectures. In Europe, gross fixed capital formation by sub-national authorities represents 10% of their own total expenditure, compared to only 5% of that of central governments. In 2015, compared to 2007, public investment in Europe declined from 3.2% to 2.9% of GDP. Sub-national authorities are responsible for 75% of this reduction. However, as shown in Table 2, it is complicated to identify general trends as vertical fiscal consolidation strategies have differed significantly and fiscal dependence on central governments varies widely. Among the countries with large average deficits over the period observed, the decline in public investment results mainly from a contraction of sub-national spending (Portugal, Ireland and Spain), with the exception of Greece, where it is essentially due to a reduction of central government spending.

PART I Gross fixed investment and intangible capital38
Investment and Investment Finance in Europe European Investment Bank
Table 2 Change of public investment (in GDP percentage points) between 2007 and 2015, by level of government
Total SNG CG Fiscal dependence Total SNG CG Fiscal dependence
HR -3.31 -1.10 -2.19 43% AT 0.01 0.06 -0.04 55%
IE -3.08 -2.87 -0.21 45% UK 0.13 0.07 0.07 64%
ES -2.12 -1.46 -0.63 32% SE 0.23 0.44 -0.21 29%
LT -1.83 -0.61 -1.18 74% DE 0.23 0.15 0.08 7%
LV -1.47 -1.38 -0.09 33% LU 0.25 0.01 0.25 49%
RO -1.18 0.19 -1.35 72% BE 0.26 0.31 -0.04 46%
PT -1.07 -0.71 -0.36 27% FI 0.51 0.53 0.21 28%
CY -1.06 -0.36 -0.70 41% CZ 0.52 0.62 -0.10 24%
EL -1.02 -0.26 -0.72 66% SI 0.58 0.58 0.01 36%
EE -0.68 -0.72 0.02 70% DK 0.77 0.38 0.39 56%
IT -0.63 -0.45 -0.18 35% MT 0.79 0.00 0.79 65%
FR -0.48 -0.51 0.02 22% BG 1.06 2.64 -1.58 44%
NL -0.33 -0.39 0.06 68% HU 2.40 0.95 1.45 40%
PL -0.07 -0.01 -0.05 34% SK 3.10 0.44 2.67 71%
EU-28 -0.3 -0.2 -0.1 32%
Source: Eurostat.Notes: SNG denotes sub-national governments; CG denotes central government. Data on social security funds not reported.
Fiscal dependence calculated as net transfers between central and sub-national governments as a percentage of total expenditure of sub-national governments in 2015.
Payments from the European budget through the European Structural and Investment Funds, in particular the European Regional Development Fund (ERDF) and the Cohesion Fund (CF), represent a large share of total government investment in most central and eastern European countries (Figure 11). While the share is on average below 10% in the EU-28, it is above 50% in Latvia and the Czech Republic, even without taking into account national co-financing of ESIF projects. In Greece, ERDF and Cohesion Fund payments represented about one third of total public investment in 2015.

Gross fixed investment and intangible capital PART I 39
European Investment Bank Investment and Investment Finance in Europe
Figure 11 Share of ERDF and Cohesion Fund payments in total public investment, 2015
0%
10%
20%
30%
40%
50%
60%
Latv
ia
Cze
chRe
publ
ic
Slov
akia
Hun
gary
Bulg
aria
Pola
nd
Gre
ece
Rom
ania
Slov
enia
Port
ugal
Cypr
us
Mal
ta
Spai
n
Cro
atia
Esto
nia
EU-2
8
Source: DG Regio and AMECO data. Notes: National co-financing not included.
Figure 12 Public investment in cohesion MS and VMS, 2000-2015
GFCF (without ERDF and CF payments)
GFCF
Cohesion VMS
0%
1%
2%
3%
4%
5%
6%
2005
2006
2007
2008
2009
2010
2011
2012
2013
2014
2015
GFCF (without ERDF and CF payments)
GFCF
0%
1%
2%
3%
4%
5%
6%
2005
2006
2007
2008
2009
2010
2011
2012
2013
2014
2015
Source: ECON calculation, DG Regio and AMECO data. Notes: national co-financing not included.
ERDF and CF have increasingly supported public investment in cohesion countries since accession, with a contribution to public capital investment close to 2% of GDP in 2015 (Figure 12). In the VMS, the contribution of European Cohesion Policy to investment has a lower level of magnitude, but increased substantially between 2012 and 2014 compared to the previous years.
Looking ahead, public investment in the EU is expected to remain at similar levels in 2016 and 2017. National budgetary documents presented during the 2016 European Semester (national reform and stability programmes) by large European economies do not contemplate significant increases in public investment levels over the medium term. Substantial heterogeneity remains, however. France, Italy and the Netherlands are expected to register an all-time low in terms of public investment in this period. Public investment in Germany, Denmark, Finland, Sweden and Belgium, on the other hand, is expected to be above long-term averages and pre-crisis levels. Among the large European economies, the Polish stability programme is the only document reporting a fairly significant increase in public investment, with 4.6% of GDP in 2017 and 4.8% in 2018, 0.5 p.p. higher than the level expected in 2016.
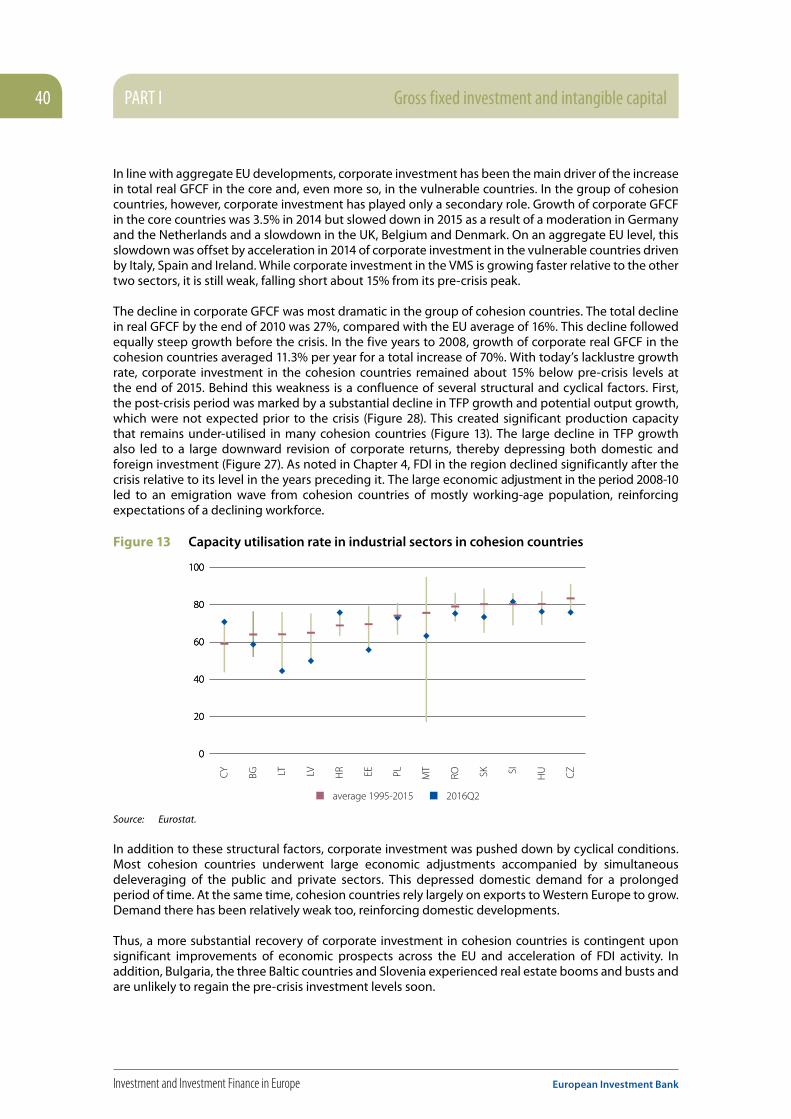
PART I Gross fixed investment and intangible capital40
Investment and Investment Finance in Europe European Investment Bank
In line with aggregate EU developments, corporate investment has been the main driver of the increase in total real GFCF in the core and, even more so, in the vulnerable countries. In the group of cohesion countries, however, corporate investment has played only a secondary role. Growth of corporate GFCF in the core countries was 3.5% in 2014 but slowed down in 2015 as a result of a moderation in Germany and the Netherlands and a slowdown in the UK, Belgium and Denmark. On an aggregate EU level, this slowdown was offset by acceleration in 2014 of corporate investment in the vulnerable countries driven by Italy, Spain and Ireland. While corporate investment in the VMS is growing faster relative to the other two sectors, it is still weak, falling short about 15% from its pre-crisis peak.
The decline in corporate GFCF was most dramatic in the group of cohesion countries. The total decline in real GFCF by the end of 2010 was 27%, compared with the EU average of 16%. This decline followed equally steep growth before the crisis. In the five years to 2008, growth of corporate real GFCF in the cohesion countries averaged 11.3% per year for a total increase of 70%. With today’s lacklustre growth rate, corporate investment in the cohesion countries remained about 15% below pre-crisis levels at the end of 2015. Behind this weakness is a confluence of several structural and cyclical factors. First, the post-crisis period was marked by a substantial decline in TFP growth and potential output growth, which were not expected prior to the crisis (Figure 28). This created significant production capacity that remains under-utilised in many cohesion countries (Figure 13). The large decline in TFP growth also led to a large downward revision of corporate returns, thereby depressing both domestic and foreign investment (Figure 27). As noted in Chapter 4, FDI in the region declined significantly after the crisis relative to its level in the years preceding it. The large economic adjustment in the period 2008- 10 led to an emigration wave from cohesion countries of mostly working-age population, reinforcing expectations of a declining workforce.
Figure 13 Capacity utilisation rate in industrial sectors in cohesion countries
2016Q2average 1995-2015
0
20
40
60
80
100
0
20
40
60
80
100
0
20
40
60
80
100
CY
BG LT LV HR EE PL MT
RO SK SI
HU CZ
Source: Eurostat.
In addition to these structural factors, corporate investment was pushed down by cyclical conditions. Most cohesion countries underwent large economic adjustments accompanied by simultaneous deleveraging of the public and private sectors. This depressed domestic demand for a prolonged period of time. At the same time, cohesion countries rely largely on exports to Western Europe to grow. Demand there has been relatively weak too, reinforcing domestic developments.
Thus, a more substantial recovery of corporate investment in cohesion countries is contingent upon significant improvements of economic prospects across the EU and acceleration of FDI activity. In addition, Bulgaria, the three Baltic countries and Slovenia experienced real estate booms and busts and are unlikely to regain the pre-crisis investment levels soon.

Gross fixed investment and intangible capital PART I 41
European Investment Bank Investment and Investment Finance in Europe
1.3.2. Investment in new construction is a major obstacle to the recovery of total GFCF to pre-crisis levels
The classification of GFCF by asset type – (i) dwellings, (ii) other buildings and structures, (iii) machinery, equipment and weapons systems; and (iv) intellectual property products (IPP) – allows further insights to be gained about the recent rebound of investment and the gap that remains open compared to the pre-crisis peak in 2008.
By the second quarter of 2016, investment in machinery and equipment in the EU accounted for about half of the 9.5% increase in total GFCF since the first quarter of 2013. Investment in construction, of both dwellings and other buildings and structures, contributed one third and GFCF in IPP about a fifth. In the ten years leading up to the financial crisis their shares of investment in total GFCF were about 52% for construction, 33% for machinery and equipment and 14% for IPP. Thus, compared to average historical shares of the different asset types in total investment, construction has contributed disproportionately less to total investment. Historically, weak investment in construction, especially of dwellings, is strongly associated with a fall in output and economic activity (Leamer, 2007). Therefore, it is unlikely that output and overall investment will rebound strongly unless residential investment does. The positive news is that the share of investment in intellectual property products is growing and is well above its historical average. Higher investment in IPP, a large part of which is R&D spending, is associated with higher productivity growth, which is the ultimate driver of growth of output and income in the long term.11
The contributions of the various asset types to the growth of total real GFCF since 2013 differ significantly across country groupings, but the high contributions of machinery and equipment and IPP remain a common feature. Construction has similar contributions to total GFCF in the core and cohesion groups, slightly above 40%. In the group of cohesion countries, the growth contribution of construction is dominated by other buildings and structures, reflecting increased investment activity related to European Structural and Investment Funds. In the core group the growth contribution of construction is mostly due to dwellings, largely owing to solid growth in Germany and the Netherlands. The growth contribution of intellectual property products to the total in core countries is three times higher than that in cohesion countries.
Investment in construction had exerted a substantial drag on the recovery of total GFCF in the VMS by the second quarter of 2016. This is partly explained by the delayed economic recovery in the majority of countries in this group. Since 2015, the mild upturn of construction investment in Ireland, Spain and Portugal pushed up investment in the VMS, too.
11 Section 4 provides more detail on recent developments in R&D. Chapter 2 expands further and explains the link between growth and intangible capital.
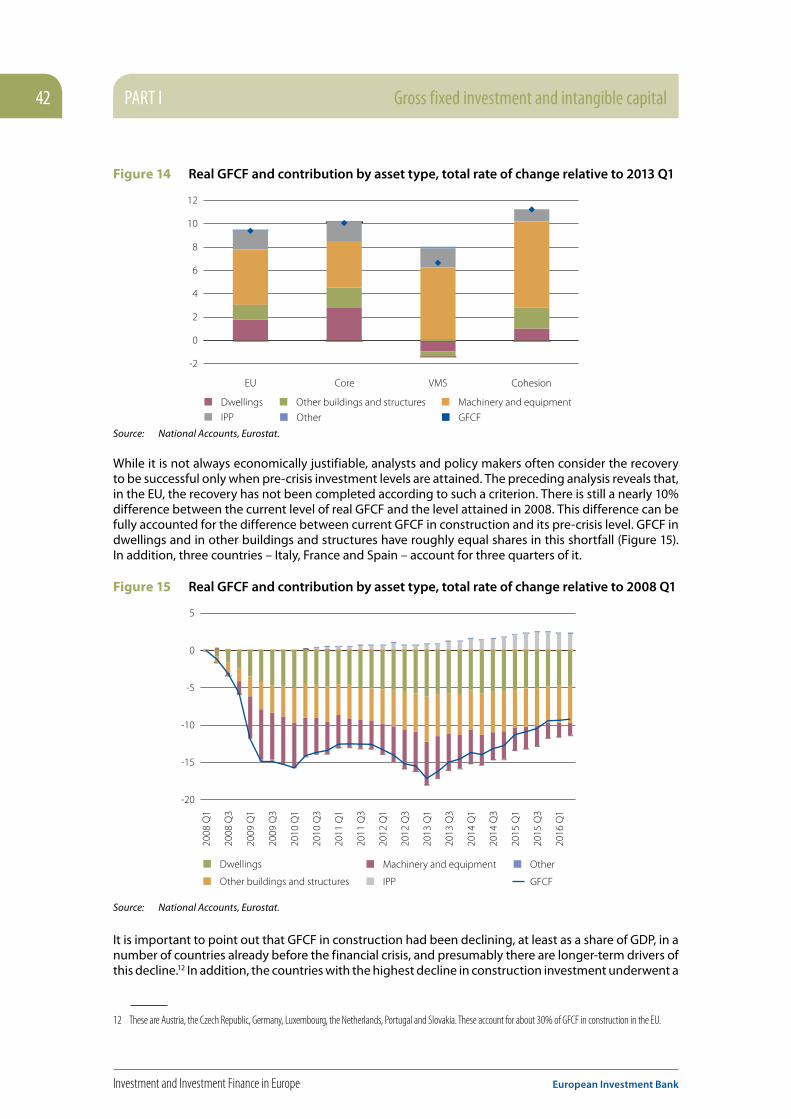
PART I Gross fixed investment and intangible capital42
Investment and Investment Finance in Europe European Investment Bank
Figure 14 Real GFCF and contribution by asset type, total rate of change relative to 2013 Q1
Machinery and equipment
IPP
Dwellings Other buildings and structures
-2
0
2
4
6
8
10
12
Other GFCF
EU Core VMS Cohesion
Source: National Accounts, Eurostat.
While it is not always economically justifiable, analysts and policy makers often consider the recovery to be successful only when pre-crisis investment levels are attained. The preceding analysis reveals that, in the EU, the recovery has not been completed according to such a criterion. There is still a nearly 10% difference between the current level of real GFCF and the level attained in 2008. This difference can be fully accounted for the difference between current GFCF in construction and its pre-crisis level. GFCF in dwellings and in other buildings and structures have roughly equal shares in this shortfall (Figure 15). In addition, three countries – Italy, France and Spain – account for three quarters of it.
Figure 15 Real GFCF and contribution by asset type, total rate of change relative to 2008 Q1
Other buildings and structures
Dwellings Machinery and equipment
IPP
Other
2008
Q1
2008
Q3
2009
Q1
2009
Q3
2010
Q1
2010
Q3
2011
Q1
2011
Q3
2012
Q1
2012
Q3
2013
Q1
2013
Q3
2014
Q1
2014
Q3
2015
Q1
2015
Q3
2016
Q1
-20
-15
-10
-5
0
5
GFCF
Source: National Accounts, Eurostat.
It is important to point out that GFCF in construction had been declining, at least as a share of GDP, in a number of countries already before the financial crisis, and presumably there are longer-term drivers of this decline.12 In addition, the countries with the highest decline in construction investment underwent a
12 These are Austria, the Czech Republic, Germany, Luxembourg, the Netherlands, Portugal and Slovakia. These account for about 30% of GFCF in construction in the EU.
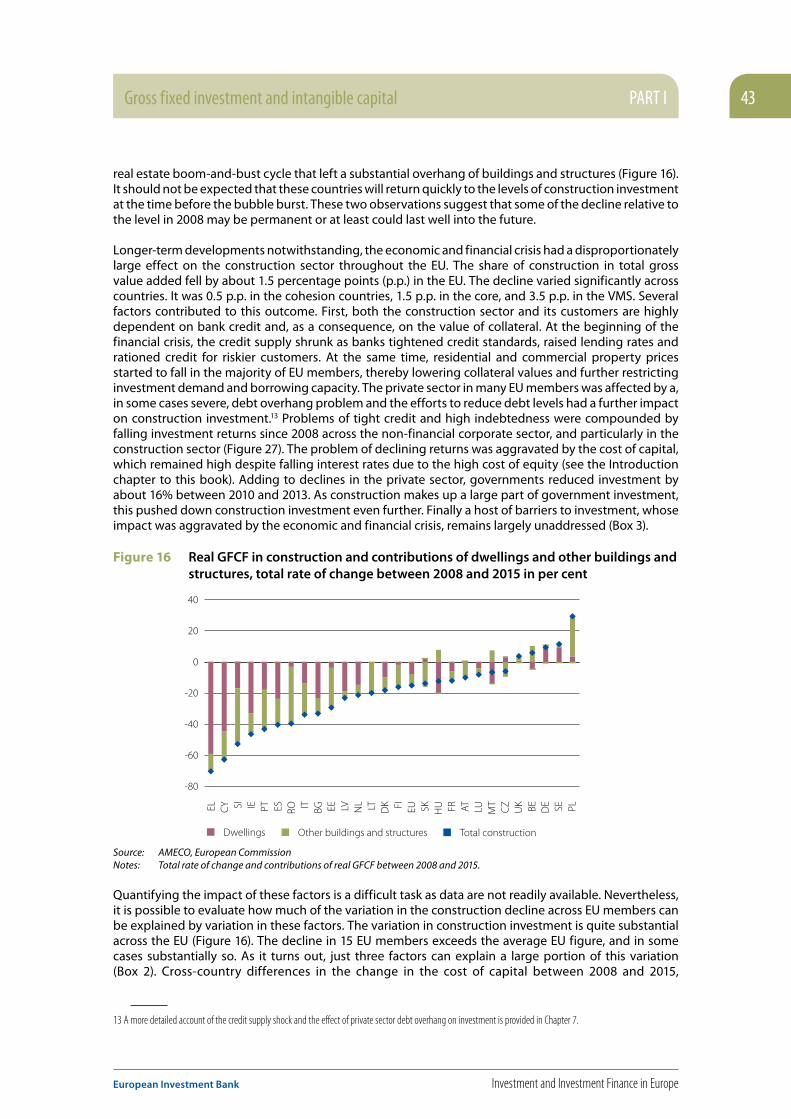
Gross fixed investment and intangible capital PART I 43
European Investment Bank Investment and Investment Finance in Europe
real estate boom-and-bust cycle that left a substantial overhang of buildings and structures (Figure 16). It should not be expected that these countries will return quickly to the levels of construction investment at the time before the bubble burst. These two observations suggest that some of the decline relative to the level in 2008 may be permanent or at least could last well into the future.
Longer-term developments notwithstanding, the economic and financial crisis had a disproportionately large effect on the construction sector throughout the EU. The share of construction in total gross value added fell by about 1.5 percentage points (p.p.) in the EU. The decline varied significantly across countries. It was 0.5 p.p. in the cohesion countries, 1.5 p.p. in the core, and 3.5 p.p. in the VMS. Several factors contributed to this outcome. First, both the construction sector and its customers are highly dependent on bank credit and, as a consequence, on the value of collateral. At the beginning of the financial crisis, the credit supply shrunk as banks tightened credit standards, raised lending rates and rationed credit for riskier customers. At the same time, residential and commercial property prices started to fall in the majority of EU members, thereby lowering collateral values and further restricting investment demand and borrowing capacity. The private sector in many EU members was affected by a, in some cases severe, debt overhang problem and the efforts to reduce debt levels had a further impact on construction investment.13 Problems of tight credit and high indebtedness were compounded by falling investment returns since 2008 across the non-financial corporate sector, and particularly in the construction sector (Figure 27). The problem of declining returns was aggravated by the cost of capital, which remained high despite falling interest rates due to the high cost of equity (see the Introduction chapter to this book). Adding to declines in the private sector, governments reduced investment by about 16% between 2010 and 2013. As construction makes up a large part of government investment, this pushed down construction investment even further. Finally a host of barriers to investment, whose impact was aggravated by the economic and financial crisis, remains largely unaddressed (Box 3).
Figure 16 Real GFCF in construction and contributions of dwellings and other buildings and structures, total rate of change between 2008 and 2015 in per cent
Other buildings and structuresDwellings Total construction
EL CY SI IE PT ES RO IT BG EE LV NL LT DK FI EU SK HU FR AT LU MT
CZ
UK BE DE SE PL
-80
-60
-40
-20
0
20
40
Source: AMECO, European CommissionNotes: Total rate of change and contributions of real GFCF between 2008 and 2015.
Quantifying the impact of these factors is a difficult task as data are not readily available. Nevertheless, it is possible to evaluate how much of the variation in the construction decline across EU members can be explained by variation in these factors. The variation in construction investment is quite substantial across the EU (Figure 16). The decline in 15 EU members exceeds the average EU figure, and in some cases substantially so. As it turns out, just three factors can explain a large portion of this variation (Box 2). Cross-country differences in the change in the cost of capital between 2008 and 2015,
13 A more detailed account of the credit supply shock and the effect of private sector debt overhang on investment is provided in Chapter 7.

PART I Gross fixed investment and intangible capital44
Investment and Investment Finance in Europe European Investment Bank
Box 2 Accounting for the variation in construction GFCF across the EU
The regressions below examine the extent to which the neo-classical determinants of investment account for the gap in construction investment. Business investment is driven by the expected return on investment and the cost of capital. Assuming that one can approximate the expected returns with realised returns, we use the change in the internal rates of return on assets in the corporate sector (∆IRR) as defined in Fama and French (1999) and Wagenvoort and Torfs (2013) (see also Annex A2). The change is calculated for the average IRR 2013-2014 minus the average 2003-2007. The cost of capital is computed as the weighted average cost of capital (WACC), where weights are calculated from Eurostat’s National Sector Accounts for NFCs. In the regression, ∆WACC is the difference between the average cost of capital in 2015 and 2008.
Investment in dwellings is determined by the price of existing dwellings relative to their replacement cost (Q) and expected income, which we approximate with real gross disposable income of households (RGDI). The relative price of dwellings represents the capital gain, or profit, that can be made from selling a dwelling. When the average price of dwellings increases relative to their replacement (construction) cost, the expected profits of builders increase and therefore investment increases. The total rate of change of GDP between 2015 and 2008 is used to control for economic growth. The regressions below explore the extent to which the variation of these determinants across EU countries can account for the variation in the change of current investment in construction relative to the respective pre-crisis level.
All coefficients have the expected sign and are statistically and economically significant, except for the rate of growth of GDP. An increase in the cost of capital is associated with a lower current level of construction GFCF relative to the level in 2008. Higher corporate returns in 2013-2014 and higher real gross disposable income of households in 2015 relative to their respective pre-crisis levels are associated with higher investment in construction today. An increase in the relative price of existing dwellings also results in higher construction investment today.
the change in corporate returns in this period, and the change in the relative price of existing dwellings to new construction can account for about two-thirds of the variation in the shortfall of GFCF in construction relative to its pre-crisis levels. Adding to them the differences in the rate of change in real gross disposable income of households makes it possible to explain 74% of the variation. Focusing on investment in dwellings, just three factors explain 70% of the variation of the shortfall in residential GFCF across the EU: the change in the relative price of existing dwellings, house price inflation and the rate of growth of real gross disposable income of households.
As discussed earlier, the recovery started relatively late in most countries with large declines in construction GFCF. These recoveries follow a long period of depressed economic activity accompanied by very large increases in unemployment rates, consequent declines in aggregate disposable incomes and continuing private sector deleveraging. The depth and persistence of these developments led to a prolonged period of low demand for dwellings. With the recovery gaining traction, these problems should be gradually mitigated. Falling unemployment rates will boost aggregate incomes and reduce income uncertainty. As a result, demand for housing should increase and bolster relative prices of dwellings. This may be a long process however, because the recovery is still rather weak in most EU members and there is substantial inertia in unemployment rates, especially in Europe.

Gross fixed investment and intangible capital PART I 45
European Investment Bank Investment and Investment Finance in Europe
GFCF Total construction
(1) (2) (3)
Constant -37.53 (6.74) -34.02*** (5.76) -27.65*** (5.41)
∆WACC -11.11*** (1.61) -9.15* (2.43) -5.61*** (1.93)
∆IRR 3.29*** (0.80) 3.16*** (0.77) 2.14*** (0.73)
∆Q 0.35*** (0.07) 0.29*** (0.08) 0.21*** (0.07)
∆GDP 0.51 (0.39) 0.17 (0.39)
∆RGDI 0.92** (0.35)
N 27 27 27
Adj R2 0.64 0.68 0.73
Note: *p<0.1; **p<0.05; ***p<0.01; standard errors in parentheses
We run a similar regression of GFCF in dwellings on the relevant determinants of residential investment. Here the factors that are directly associated with firm investment are omitted and instead the regressors include the change of the average annual mortgage rate between 2015 and 2008 and the change in the price index for existing dwellings over the same period. Coefficients are also statistically and economically significant and have the expected sign.
GFCF Dwellings
(1) (2) (3)
Constant -13.24*** (4.01) -20.46* (10.26) -15.68 (9.52)
∆Q 1.34*** (0.19) 1.31*** (0.19) 0.97*** (0.21)
∆MRate -2.49 (2.68) 0.37 (2.74)
∆HPI 0.25* (0.14) 0.24** (0.10)
∆RGDI 1.36*** (0.38)
∆GDP 0.29 (0.43)
N 28 28 28
Adj R2 0.56 0.56 0.70
Note: *p<0.1; **p<0.05; ***p<0.01; standard errors in parentheses
These two simple regressions indicate that a large share of the decline in GFCF in construction can be attributed to weak demand for dwellings and other buildings and structures, as indicated by the importance of aggregate disposable income and rate of return on investment. These should be eliminated with an improvement in the labour markets that raises aggregate real gross disposable income of households as well as an improvement in credit conditions. Such improvements should bid up the house prices relative to construction costs and strengthen incentives for investment in new construction. Strengthening domestic demand should exert certain upward pressure on corporate returns.
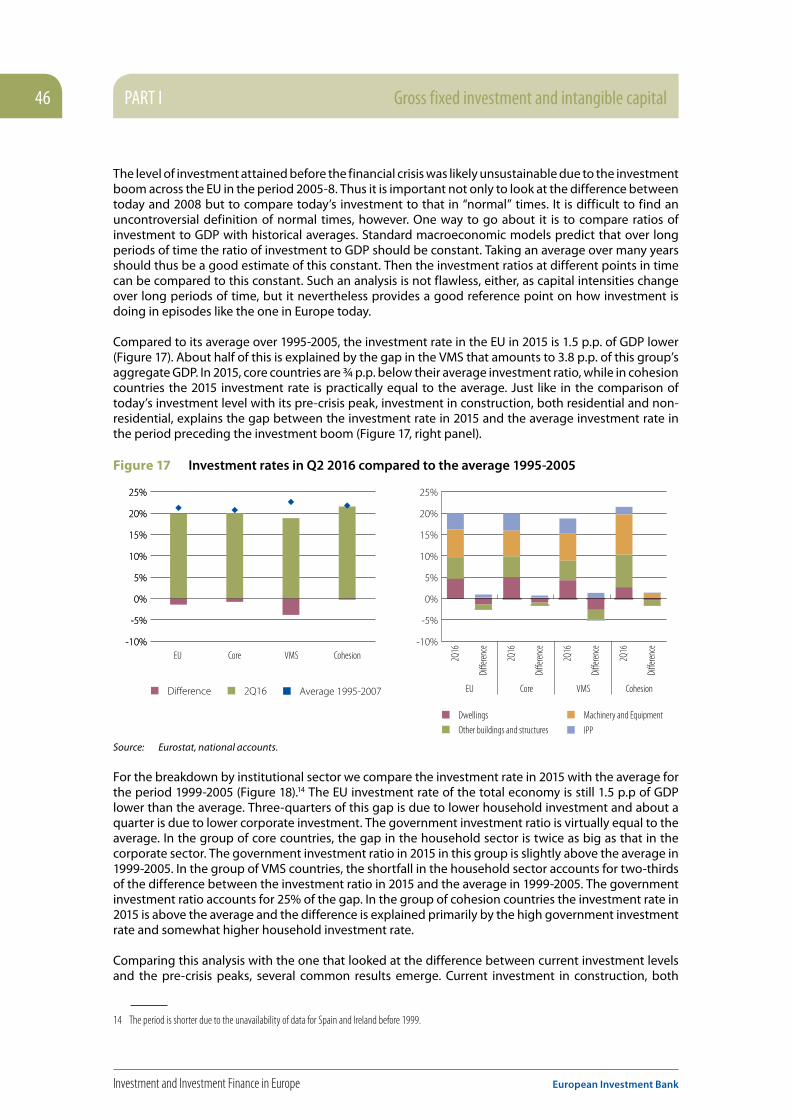
PART I Gross fixed investment and intangible capital46
Investment and Investment Finance in Europe European Investment Bank
The level of investment attained before the financial crisis was likely unsustainable due to the investment boom across the EU in the period 2005-8. Thus it is important not only to look at the difference between today and 2008 but to compare today’s investment to that in “normal” times. It is difficult to find an uncontroversial definition of normal times, however. One way to go about it is to compare ratios of investment to GDP with historical averages. Standard macroeconomic models predict that over long periods of time the ratio of investment to GDP should be constant. Taking an average over many years should thus be a good estimate of this constant. Then the investment ratios at different points in time can be compared to this constant. Such an analysis is not flawless, either, as capital intensities change over long periods of time, but it nevertheless provides a good reference point on how investment is doing in episodes like the one in Europe today.
Compared to its average over 1995-2005, the investment rate in the EU in 2015 is 1.5 p.p. of GDP lower (Figure 17). About half of this is explained by the gap in the VMS that amounts to 3.8 p.p. of this group’s aggregate GDP. In 2015, core countries are ¾ p.p. below their average investment ratio, while in cohesion countries the 2015 investment rate is practically equal to the average. Just like in the comparison of today’s investment level with its pre-crisis peak, investment in construction, both residential and non-residential, explains the gap between the investment rate in 2015 and the average investment rate in the period preceding the investment boom (Figure 17, right panel).
Figure 17 Investment rates in Q2 2016 compared to the average 1995-2005
-10%
-5%
0%
5%
10%
15%
20%
25%
-10%
-5%
0%
5%
10%
15%
20%
25%
-10%
-5%
0%
5%
10%
15%
20%
25%
EU Core VMS Cohesion
Difference 2Q16 Average 1995-2007
Other buildings and structures
Dwellings Machinery and Equipment
IPP
2Q16
Diffe
rence
2Q16
Diffe
rence
2Q16
Diffe
rence
2Q16
Diffe
rence
EU Core VMS Cohesion
Source: Eurostat, national accounts.
For the breakdown by institutional sector we compare the investment rate in 2015 with the average for the period 1999-2005 (Figure 18).14 The EU investment rate of the total economy is still 1.5 p.p of GDP lower than the average. Three-quarters of this gap is due to lower household investment and about a quarter is due to lower corporate investment. The government investment ratio is virtually equal to the average. In the group of core countries, the gap in the household sector is twice as big as that in the corporate sector. The government investment ratio in 2015 in this group is slightly above the average in 1999-2005. In the group of VMS countries, the shortfall in the household sector accounts for two-thirds of the difference between the investment ratio in 2015 and the average in 1999-2005. The government investment ratio accounts for 25% of the gap. In the group of cohesion countries the investment rate in 2015 is above the average and the difference is explained primarily by the high government investment rate and somewhat higher household investment rate.
Comparing this analysis with the one that looked at the difference between current investment levels and the pre-crisis peaks, several common results emerge. Current investment in construction, both
14 The period is shorter due to the unavailability of data for Spain and Ireland before 1999.

Gross fixed investment and intangible capital PART I 47
European Investment Bank Investment and Investment Finance in Europe
residential and non-residential, is very low and drags down total investment. By institutional sector, household investment largely explains today’s investment weakness, while there is no significant gap in corporate investment. The main difference between the two comparisons is government investment. When looking at the government investment rate versus its average in the period 1999-2005 there is virtually no difference. When the comparison is with the pre-crisis peak, however, current government investment is too low, both in terms of levels and as a ratio to GDP. The reason for this difference is that government investment experienced a dramatic increase in the period 2005-2010 on the back of surging government revenue during the overall investment boom in most EU countries. Government investment rates in the EU rose by 20%, only to decline by approximately the same amount during the fiscal retrenchment following 2010. All country groups experienced the boom in government investment, but the differences showed up in the fiscal retrenchment phase. The groups of core and cohesion countries did not fully undo the surge in government investment. Government investment rates are still about 5% higher in the core countries and about 20% higher in the cohesion countries than they were in the early 2000s.
The government investment boom was not a lot about infrastructure, however. As the next section shows, government infrastructure investment in 2015 was lower than both the pre-crisis peak and the years preceding the investment boom.
Figure 18 Investment rates in 2015 compared to average 1999-2005
HouseholdsCorporate Government
-5
0
5
10
15
20
25
EU Core VMS Cohesion
2015
Diffe
rence
2015
Diffe
rence
2015
Diffe
rence
2015
Diffe
rence
Source: Eurostat, national accounts.

PART I Gross fixed investment and intangible capital48
Investment and Investment Finance in Europe European Investment Bank
Box 3 Identifying barriers to investment in Europe
Investment may be hindered by different types of economic and non-economic barriers. These range from regulatory uncertainty and fragmented markets to weak public planning and project preparation capacity and financing bottlenecks.
The third pillar of the Investment Plan for Europe targets the removal of such barriers. At the EU level, European Commission proposals in areas such as the Energy Union and the Capital Markets Union aim to improve the environment for investment. The Commission has also engaged in dialogue with Member States to help remove national obstacles in areas such as insolvency, public procurement and administration.
The EIB Group has contributed to these efforts, drawing on first-hand experience of barriers it has encountered in working on projects across different countries and sectors. This box summarises the findings of an EIB Group publication cataloguing investment barriers met with in the EIB’s work (EIB, 2016b). Examples of innovative solutions encountered by the EIB and detailed in this study are also briefly mentioned below.
A framework for understanding barriers to investment in the EUBarriers to investment are location-specific factors that affect the costs and risks of investing and the level of competition in the market. They can also be grouped under the categories of regulation, market size and structure, public sector promoter constraints and access to finance. Table 3 illustrates this framework. Other barriers to investment reflected in the literature include properties of the legal system and macroeconomic conditions.
Table 3 A typology of barriers to investment
Costs RisksBarriers to competition
Regulation
Regulatory burdens and fragmentation; administrative procedures
Regulatory uncertainty
Barriers to market entry and exit; incentives in regulated sectors
Market size and structure
Market fragmentation Lack of standardsImplementation of competition law and policy
Public sector promoter constraints
Infrastructure, public sector efficiency and capacity
Weak planning and project preparation capacity
Possible unintended consequences of public procurement procedures
Access to finance Cost of financeFinancial instability, lack of instruments to allocate risk
Limiting entry into new product and geographical markets
Source: Frontier Economics, adapted from World Bank (2005).
Some of the main findings in EIB (2016b), including examples of innovative solutions, can be summarised as follows:

Gross fixed investment and intangible capital PART I 49
European Investment Bank Investment and Investment Finance in Europe
Regulatory uncertainty – Investors understand that the regulatory framework – and tariffs, in particular – will evolve over time. Changes can be introduced in a transparent, predictable, and timely manner, so that investors understand the new risk proposition. For example, a four-year consultation process for moving to a new regulatory framework (“RIIO”) for energy network companies was pioneered in the UK. This relatively lengthy process has the advantage of allowing all concerned parties sufficient time to adjust to the change.
Regulatory fragmentation – Undue fragmentation of markets can deter investment and may be exacerbated by regulatory fragmentation: different regulations in comparison to the potential size of the market. For example, the existence of different regulatory frameworks within and amongst Member States has not helped support a pan-European market for investment in energy efficiency in buildings. European legislation on the energy performance of buildings has provided common benchmarks and improved clarity. One innovative solution is the Programmation de la transition énergétique, in France, which establishes a framework for third-party financing by public companies and includes an energy renovation platform (a “one-stop shop’’) to assist private individuals with information concerning finance, certified suppliers, energy audits and construction companies.
Administrative procedures – There is a need to balance the benefits and costs of regulation and the associated administrative procedures. Weak regulation and poorly enforced procedures may lead to poor performance, accidents, etc., whilst unduly burdensome administrative requirements increase costs of market entry and expansion, discouraging investment. Programme contracts for Italian airports seek to address this problem by defining the sequence and timing of revisions in charges and offer guidance as to the charges airports can expect in the long term, giving operators greater certainty on revenues and assisting with scaling investment projects, obtaining planning approvals, and raising finance. Designing regulation to impose time constraints – not only on regulated operators but on the regulators themselves – can thus help.
Market size and structure – Market fragmentation leads to sub-optimal firm sizes without prompting consolidation, stagnant productivity growth without triggering firm restructuring, and insufficient growth of successful, more productive firms. Common standards may not be enough in situations where a substantial leap in technology is required, but an impartial coordinating body can work to incentivise investment by all the players in a sector. For example, Eurocontrol and the SESAR Deployment Manager serve to define air traffic control technology standards across the Member States and play an impartial role in informing and negotiating among all parties, as well as engaging ancillary sectors, to drive implementation.
Public sector promoter constraints – A key constraint on increased, better quality government investment is weak strategic planning and project preparation. Authorities need to define efficient mechanisms/frameworks which provide for the effective planning, allocation and implementation of projects. New financing structures are necessary to enable territorial investment agencies to raise co-financing for integrated territorial investment programmes. In the context, Urban Development Funds are a good example of a revolving financial instrument for financing revenue-generating investment projects, such as brownfield site regeneration or small-scale renewable energy. The funds are an instrument into which a layer of EU or other public grant funding can be paid to absorb some of the risk, thereby attracting further investment from other sources.
Access to finance – To support investment by local public entities across Europe, it is important to develop financial products tailored to their risk profile and to the economic life of the underlying assets. Financing challenges faced by SMEs result particularly from information asymmetries and diseconomies of scale, for example in relation to access to capital markets. Hydrobonds are an example of an innovative financing approach whereby a group of small operators in Italy issued minibonds to fund multi-annual investment programmes in water and wastewater infrastructure. Senior unsecured debt obligations were aggregated in a portfolio and then securitised to reach an investment size sufficient to involve institutional investors.
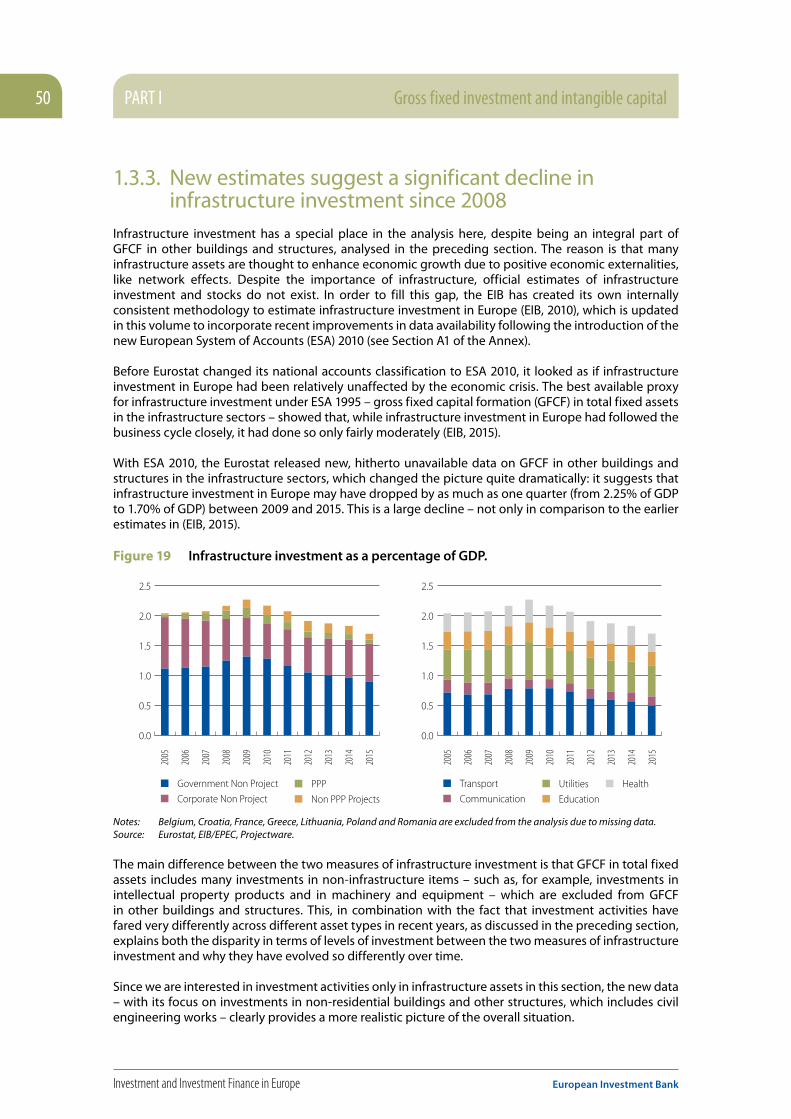
PART I Gross fixed investment and intangible capital50
Investment and Investment Finance in Europe European Investment Bank
1.3.3. New estimates suggest a significant decline in infrastructure investment since 2008
Infrastructure investment has a special place in the analysis here, despite being an integral part of GFCF in other buildings and structures, analysed in the preceding section. The reason is that many infrastructure assets are thought to enhance economic growth due to positive economic externalities, like network effects. Despite the importance of infrastructure, official estimates of infrastructure investment and stocks do not exist. In order to fill this gap, the EIB has created its own internally consistent methodology to estimate infrastructure investment in Europe (EIB, 2010), which is updated in this volume to incorporate recent improvements in data availability following the introduction of the new European System of Accounts (ESA) 2010 (see Section A1 of the Annex).
Before Eurostat changed its national accounts classification to ESA 2010, it looked as if infrastructure investment in Europe had been relatively unaffected by the economic crisis. The best available proxy for infrastructure investment under ESA 1995 – gross fixed capital formation (GFCF) in total fixed assets in the infrastructure sectors – showed that, while infrastructure investment in Europe had followed the business cycle closely, it had done so only fairly moderately (EIB, 2015).
With ESA 2010, the Eurostat released new, hitherto unavailable data on GFCF in other buildings and structures in the infrastructure sectors, which changed the picture quite dramatically: it suggests that infrastructure investment in Europe may have dropped by as much as one quarter (from 2.25% of GDP to 1.70% of GDP) between 2009 and 2015. This is a large decline – not only in comparison to the earlier estimates in (EIB, 2015).
Figure 19 Infrastructure investment as a percentage of GDP.
0.0
0.5
1.0
1.5
2.0
2.5
PPPCorporate Non Project
Government Non Project
0.0
0.5
1.0
1.5
2.0
2.5
Non PPP Projects
UtilitiesCommunication
Transport
Education
2005
2006
2007
2008
2009
2010
2011
2012
2013
2014
2015
2005
2006
2007
2008
2009
2010
2011
2012
2013
2014
2015
Health
Notes: Belgium, Croatia, France, Greece, Lithuania, Poland and Romania are excluded from the analysis due to missing data.Source: Eurostat, EIB/EPEC, Projectware.
The main difference between the two measures of infrastructure investment is that GFCF in total fixed assets includes many investments in non-infrastructure items – such as, for example, investments in intellectual property products and in machinery and equipment – which are excluded from GFCF in other buildings and structures. This, in combination with the fact that investment activities have fared very differently across different asset types in recent years, as discussed in the preceding section, explains both the disparity in terms of levels of investment between the two measures of infrastructure investment and why they have evolved so differently over time.
Since we are interested in investment activities only in infrastructure assets in this section, the new data – with its focus on investments in non-residential buildings and other structures, which includes civil engineering works – clearly provides a more realistic picture of the overall situation.
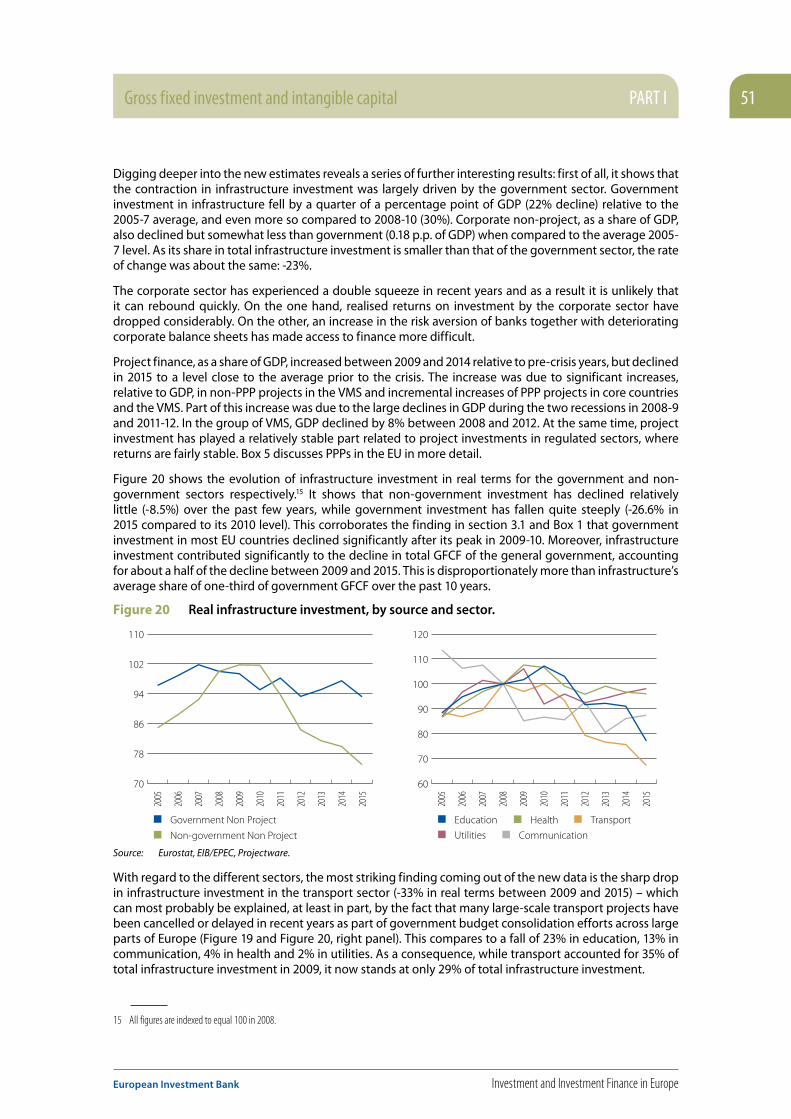
Gross fixed investment and intangible capital PART I 51
European Investment Bank Investment and Investment Finance in Europe
Digging deeper into the new estimates reveals a series of further interesting results: first of all, it shows that the contraction in infrastructure investment was largely driven by the government sector. Government investment in infrastructure fell by a quarter of a percentage point of GDP (22% decline) relative to the 2005-7 average, and even more so compared to 2008-10 (30%). Corporate non-project, as a share of GDP, also declined but somewhat less than government (0.18 p.p. of GDP) when compared to the average 2005-7 level. As its share in total infrastructure investment is smaller than that of the government sector, the rate of change was about the same: -23%.
The corporate sector has experienced a double squeeze in recent years and as a result it is unlikely that it can rebound quickly. On the one hand, realised returns on investment by the corporate sector have dropped considerably. On the other, an increase in the risk aversion of banks together with deteriorating corporate balance sheets has made access to finance more difficult.
Project finance, as a share of GDP, increased between 2009 and 2014 relative to pre-crisis years, but declined in 2015 to a level close to the average prior to the crisis. The increase was due to significant increases, relative to GDP, in non-PPP projects in the VMS and incremental increases of PPP projects in core countries and the VMS. Part of this increase was due to the large declines in GDP during the two recessions in 2008-9 and 2011-12. In the group of VMS, GDP declined by 8% between 2008 and 2012. At the same time, project investment has played a relatively stable part related to project investments in regulated sectors, where returns are fairly stable. Box 5 discusses PPPs in the EU in more detail.
Figure 20 shows the evolution of infrastructure investment in real terms for the government and non-government sectors respectively.15 It shows that non-government investment has declined relatively little (-8.5%) over the past few years, while government investment has fallen quite steeply (-26.6% in 2015 compared to its 2010 level). This corroborates the finding in section 3.1 and Box 1 that government investment in most EU countries declined significantly after its peak in 2009-10. Moreover, infrastructure investment contributed significantly to the decline in total GFCF of the general government, accounting for about a half of the decline between 2009 and 2015. This is disproportionately more than infrastructure’s average share of one-third of government GFCF over the past 10 years.
Figure 20 Real infrastructure investment, by source and sector.
Non-government Non Project
Government Non Project
70
78
86
94
102
110
Health
Utilities
Transport
Communication
Education
60
70
80
90
100
110
120
2005
2006
2007
2008
2009
2010
2011
2012
2013
2014
2015
2005
2006
2007
2008
2009
2010
2011
2012
2013
2014
2015
Source: Eurostat, EIB/EPEC, Projectware.
With regard to the different sectors, the most striking finding coming out of the new data is the sharp drop in infrastructure investment in the transport sector (-33% in real terms between 2009 and 2015) – which can most probably be explained, at least in part, by the fact that many large-scale transport projects have been cancelled or delayed in recent years as part of government budget consolidation efforts across large parts of Europe (Figure 19 and Figure 20, right panel). This compares to a fall of 23% in education, 13% in communication, 4% in health and 2% in utilities. As a consequence, while transport accounted for 35% of total infrastructure investment in 2009, it now stands at only 29% of total infrastructure investment.
15 All figures are indexed to equal 100 in 2008.
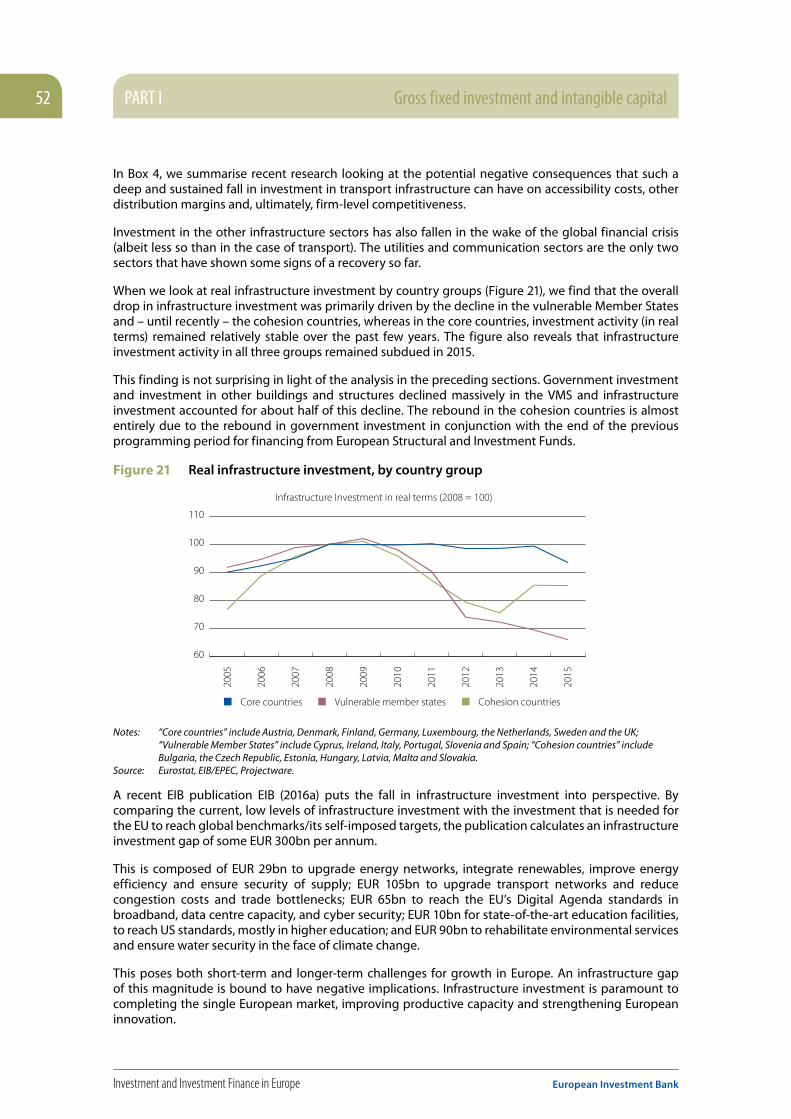
PART I Gross fixed investment and intangible capital52
Investment and Investment Finance in Europe European Investment Bank
In Box 4, we summarise recent research looking at the potential negative consequences that such a deep and sustained fall in investment in transport infrastructure can have on accessibility costs, other distribution margins and, ultimately, firm-level competitiveness.
Investment in the other infrastructure sectors has also fallen in the wake of the global financial crisis (albeit less so than in the case of transport). The utilities and communication sectors are the only two sectors that have shown some signs of a recovery so far.
When we look at real infrastructure investment by country groups (Figure 21), we find that the overall drop in infrastructure investment was primarily driven by the decline in the vulnerable Member States and – until recently – the cohesion countries, whereas in the core countries, investment activity (in real terms) remained relatively stable over the past few years. The figure also reveals that infrastructure investment activity in all three groups remained subdued in 2015.
This finding is not surprising in light of the analysis in the preceding sections. Government investment and investment in other buildings and structures declined massively in the VMS and infrastructure investment accounted for about half of this decline. The rebound in the cohesion countries is almost entirely due to the rebound in government investment in conjunction with the end of the previous programming period for financing from European Structural and Investment Funds.
Figure 21 Real infrastructure investment, by country group
60
70
80
90
100
110
Vulnerable member states Cohesion countriesCore countries
2005
2006
2007
2008
2009
2010
2011
2012
2013
2014
2015
Infrastructure Investment in real terms (2008 = 100)
Notes: “Core countries” include Austria, Denmark, Finland, Germany, Luxembourg, the Netherlands, Sweden and the UK; “Vulnerable Member States” include Cyprus, Ireland, Italy, Portugal, Slovenia and Spain; “Cohesion countries” include Bulgaria, the Czech Republic, Estonia, Hungary, Latvia, Malta and Slovakia.
Source: Eurostat, EIB/EPEC, Projectware.
A recent EIB publication EIB (2016a) puts the fall in infrastructure investment into perspective. By comparing the current, low levels of infrastructure investment with the investment that is needed for the EU to reach global benchmarks/its self-imposed targets, the publication calculates an infrastructure investment gap of some EUR 300bn per annum.
This is composed of EUR 29bn to upgrade energy networks, integrate renewables, improve energy efficiency and ensure security of supply; EUR 105bn to upgrade transport networks and reduce congestion costs and trade bottlenecks; EUR 65bn to reach the EU’s Digital Agenda standards in broadband, data centre capacity, and cyber security; EUR 10bn for state-of-the-art education facilities, to reach US standards, mostly in higher education; and EUR 90bn to rehabilitate environmental services and ensure water security in the face of climate change.
This poses both short-term and longer-term challenges for growth in Europe. An infrastructure gap of this magnitude is bound to have negative implications. Infrastructure investment is paramount to completing the single European market, improving productive capacity and strengthening European innovation.
Gross fixed investment and intangible capital PART I 53
European Investment Bank Investment and Investment Finance in Europe
Box 4 Infrastructure Investment and Regional Competitiveness
In a recent paper, Revoltella, Brutscher, Tsiotras, and Weiss (2016) shed light on the link between transport infrastructure and regional competitiveness. Specifically, the paper examines the extent to which a larger transport stock helps firms to benefit from global growth opportunities.
The basic idea behind this is that transport infrastructure can improve trade by reducing accessibility costs and other distribution margins, which, in turn, facilitates linking local businesses with their global growth opportunities. From this, Revoltella et al. derived the following three hypotheses:
1. A region with a well-developed transport network is expected to have a higher correlation between global growth opportunities and firms’ sales growth than a region with a less well-developed transport network.
2. This correlation should be particularly pronounced in times of “economic slack” (due to more subdued upward pressure on prices and wages that arises from expanding production when below full capacity).
3. The role of a better transport network with respect to the correlation between global growth opportunities and firms’ sales growth should, at least, be partially explained by the facilitation of access to global growth opportunities for existing firms in a region (and not only by the entry of new firms that are very dependent on global growth opportunities into regions with a large well-developed transport stock).
To empirically examine whether a region’s transport stock can act as a catalyst for firms’ capacity to benefit from global growth opportunities, the authors used firm-level data from Bureau van Dijk’s ORBIS database to construct a panel of about 60,000 firms in 119 European regions between 2006 and 2012.
They compute a proxy for global growth opportunities using global industry-specific price-to-earnings ratios16 and link it to the level of transport stock in a region by estimating the following specification:
∆sales i,t
= αi + β
1GGO
i,t-1 + β
2TS
j + β
3 (GGO
i,t-1xTS
j ) + ε
i,j,t [1]
where subscripts i, j and t denote firms, regions and time periods respectively, αi captures firm fixed
effects, GGOi,t-1
is the proxy for global growth opportunities (in logarithm), TSj is an indicator variable
denoting a large stock of transport infrastructure and (GGOi,t-1
xTSj ) is the interaction term between
these two last variables.
In line with hypotheses 1 and 2, their analysis reveals that – in times of positive shocks to global growth opportunities – annual sales growth increases more in regions with a well-developed transport network than in regions with a relatively poor one. A large transport stock is also associated with a milder fall in sales growth during a phase of negative shocks to global growth opportunities.
To disentangle how much of the result is due to:
1. A “magnet effect” – i.e. firms that are more dependent on global growth opportunities being located in regions with a better transport stock; and how much is due to
2. A “lifting all boats effect” – i.e. a better transport stock facilitating access to global growth opportunities for all the firms in a region,
the authors looked at how changes in the regional transport stock affect firms’ capacity to benefit from global growth prospects. Using a panel of existing firms in a region, Revoltella et al. find that the sensitivity of firms to global growth opportunities increased considerably in regions in which the transport stock increased substantially. This suggests that – in line with hypothesis 3 – at least part of the correlation found is, indeed, due to a “lifting all boats effect”.
16 The intuition behind this measure is that these price-to-earnings ratios reflect the market expectations about the future earning potential of an industry. See Bekaert, Harvey, Lundblad, and Siegel (2007).

PART I Gross fixed investment and intangible capital54
Investment and Investment Finance in Europe European Investment Bank
Box 5 Public-Private Partnerships in the EU
The PPP market is so far still relatively small compared to corporate infrastructure investment, but it is also a strategically important form of infrastructure finance. The main idea of PPPs is to harness private sector skills in support of improved public sector services.17 This is achieved by moving away from the direct procurement of physical assets by the public sector and towards the procurement of services from the private sector under public sector regulation/contracts.
The European PPP market peaked in 2006 at around EUR 27bn and has since been in decline, both in terms of volume and total number of deals (Figure 22). The contraction in the PPP market was primarily driven by Europe’s largest PPP market, the UK. The UK’s PPP market shrank from around EUR 15bn in 2006 to only EUR 2.4bn in 2015.
Figure 22 European PPP investments since 2005
0
5
10
15
20
25
30
0
20
40
60
80
100
120
140
160
2005
2006
2007
2008
2009
2010
2011
2012
2013
2014
2015
UK volumeTotal number of projects UK number of projectsTotal volume
EUR
bn
Num
ber o
f pro
ject
s
Note: The project values quoted refer to the projects’ external funding requirements at the time of financial close (i.e. the sum of debt and equity) and exclude public capital contributions. The external funding requirement of a project may be very different from its capital investment cost.
Source: EIB ECON/EPEC database.
From a sectorial perspective, the transport sector continues to account for by far the largest part of Europe’s PPP market value and represented around 60% of the total market value in 2015 (Figure 23). Social infrastructure was the second most active sector in 2015 – after a temporary decline that can be closely linked to the overall decline in PPPs in the UK. Indeed, social infrastructure represented, on average, 70% of UK’s total PPP market value in the period 2005-2007.
17 For more details on PPPs, see e.g. (EIB, 2005) and (EIB, 2010).

Gross fixed investment and intangible capital PART I 55
European Investment Bank Investment and Investment Finance in Europe
Figure 23 Sectoral distribution of European PPP investments
0
5
10
15
20
25
30
2005
2006
2007
2008
2009
2010
2011
2012
2013
2014
2015
Utilities
CommunicationSocial Infrastructure
RDI Other
Transport
Source: EIB ECON/EPEC database.
European PPP financing strongly relies on debt. The average debt-to-equity ratio has come in at around 6:1 over the past decade (Figure 24). Most of this debt is made up of loans (typically provided through syndicates of lenders). Bond financing played an important role in providing funding prior to the crisis, but disappeared almost entirely in the wake of the global financial crisis and sovereign debt crisis. It was only in 2013 that bond financing started its comeback.
Figure 24 Financing structure of European PPP investments
0%
10%
20%
30%
40%
50%
60%
70%
80%
90%
100%
2005
2006
2007
2008
2009
2010
2011
2012
2013
2014
2015
EquityBondLoans
Note A breakdown by source of finance is only available for roughly 80% of all PPP projects in the database. Source: EIB ECON/EPEC database.
When looking at the financing structure of PPPs across countries, significant differences in funding come to light. While loans constitute the main source of finance across the board, their relative importance varies considerably from around 45% in Belgium to more than 95% in Poland (Figure 25). The use of project bonds tends to remain very much limited to some of the core countries (i.e. Belgium, France, Germany, the Netherlands and the UK) plus Ireland.
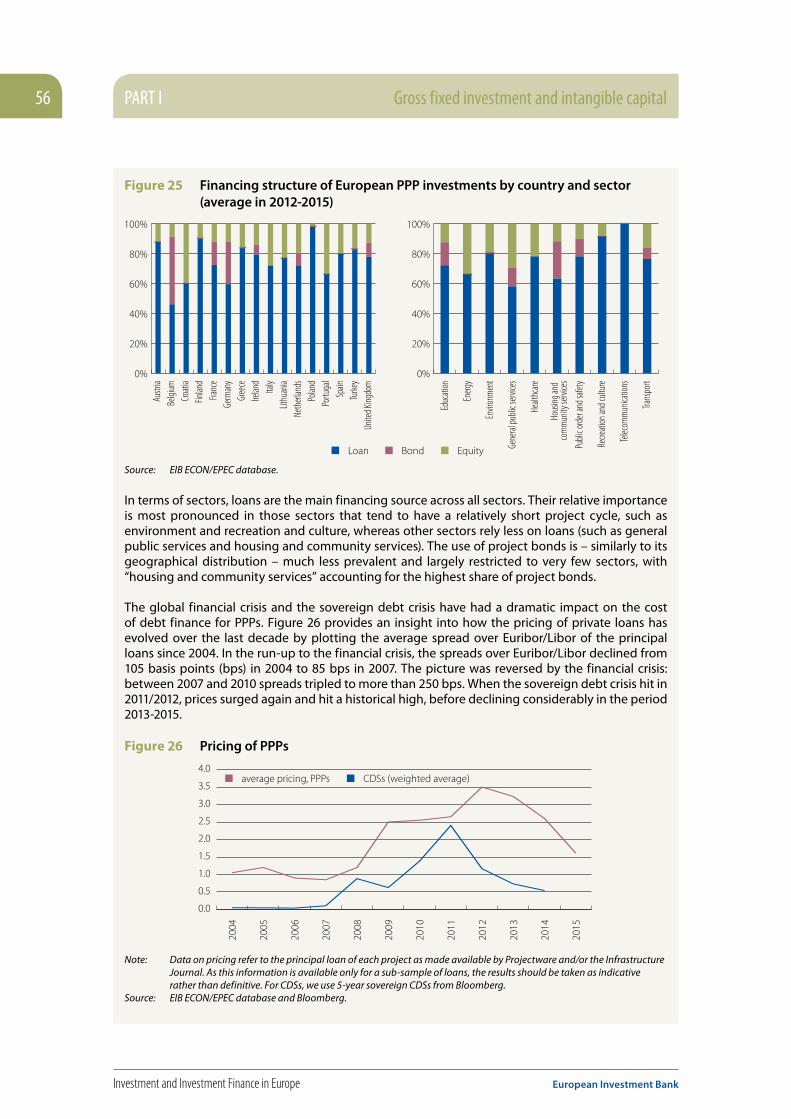
PART I Gross fixed investment and intangible capital56
Investment and Investment Finance in Europe European Investment Bank
Figure 25 Financing structure of European PPP investments by country and sector (average in 2012-2015)
0%
20%
40%
60%
80%
100%
0%
20%
40%
60%
80%
100%
EquityBondLoan
Austr
iaBe
lgium
Croati
aFin
land
Franc
eGe
rman
yGr
eece
Irelan
dIta
lyLit
huan
iaNe
therl
ands
Polan
dPo
rtuga
lSp
ainTu
rkey
Unite
d King
dom
Educ
ation
Energ
y
Envir
onm
ent
Gene
ral pu
blic s
ervic
es
Healt
hcare
Hous
ing an
d co
mm
unity
serv
ices
Publi
c ord
er an
d safe
ty
Recre
ation
and c
ultur
e
Telec
omm
unica
tions
Trans
port
Source: EIB ECON/EPEC database.
In terms of sectors, loans are the main financing source across all sectors. Their relative importance is most pronounced in those sectors that tend to have a relatively short project cycle, such as environment and recreation and culture, whereas other sectors rely less on loans (such as general public services and housing and community services). The use of project bonds is – similarly to its geographical distribution – much less prevalent and largely restricted to very few sectors, with “housing and community services” accounting for the highest share of project bonds.
The global financial crisis and the sovereign debt crisis have had a dramatic impact on the cost of debt finance for PPPs. Figure 26 provides an insight into how the pricing of private loans has evolved over the last decade by plotting the average spread over Euribor/Libor of the principal loans since 2004. In the run-up to the financial crisis, the spreads over Euribor/Libor declined from 105 basis points (bps) in 2004 to 85 bps in 2007. The picture was reversed by the financial crisis: between 2007 and 2010 spreads tripled to more than 250 bps. When the sovereign debt crisis hit in 2011/2012, prices surged again and hit a historical high, before declining considerably in the period 2013-2015.
Figure 26 Pricing of PPPs
0.0
0.5
1.0
1.5
2.0
2.5
3.0
3.5
4.0average pricing, PPPs CDSs (weighted average)
2004
2005
2006
2007
2008
2009
2010
2011
2012
2013
2014
2015
Note: Data on pricing refer to the principal loan of each project as made available by Projectware and/or the Infrastructure Journal. As this information is available only for a sub-sample of loans, the results should be taken as indicative rather than definitive. For CDSs, we use 5-year sovereign CDSs from Bloomberg.
Source: EIB ECON/EPEC database and Bloomberg.

Gross fixed investment and intangible capital PART I 57
European Investment Bank Investment and Investment Finance in Europe
A comparison with the weighted average of sovereign credit default swaps (CDSs) – a broad measure of market conditions – reveals that even though pricing for PPP loans was broadly aligned with CDSs prior to the crisis and during the initial years of the crisis, the two measures diverged in more recent years. While CDSs started to fall already in 2011, pricing for PPP loans increased until 2012, before only slowly starting to follow the downward trend of sovereign credit default swaps.
The trends in PPP finance during the crisis can be explained to a large extent by the retreat of many banks from the infrastructure investment field and the limited fiscal space of sub-sovereigns to directly fund PPP schemes. An additional important constraint on infrastructure finance was the decline in mono-line insurers, which has adversely affected the credit quality of infrastructure investment and therefore compounded the situation of infrastructure investors.
Many additional institutional reasons exist for the decline in PPPs: the European PPP Expertise Centre (EPEC) has recently published a review of some of the key barriers to successful PPPs in Europe, in which it emphasises overly complex contracts and excessive restrictions and caveats on the part of state institutions as key obstacles. In addition, a series of negative examples (including changing commitments in the light of changing political situations) have left a mark on how public-private partnerships are perceived. Public budgets and users’ unwillingness to pay for public services constitute additional bottlenecks.
1.3.4. Low returns are a drag on a more vigorous investment recovery
In the analysis in Box 2 the decline in corporate returns on assets played a statistically and economically significant role in the decline of construction investment, but, unlike demand for housing, the low investment return of NFCs will not be automatically and fully addressed by the economic recovery.
Investment returns are perhaps the single most important factor in investment decisions. An investment will be made only if returns are high enough to compensate for the risk and the cost of capital. Expected or even realised returns on investment, however, are not directly observable and are difficult to infer from available data. As an approximation, we compute the realised average internal rate of return (IRR) on assets for industries and countries in the EU using the ORBIS database: a firm-level database of companies’ financial information.18 ORBIS is produced by Bureau van Dijk and covers a substantial share of European companies. The estimates show that the average realised IRR has been declining ever since the beginning of the financial crisis across countries, industries, and firm sizes (Figure 27). This finding is in line with findings by the IMF (2014) that the reduced profitability of European firms has had a significant effect on real interest rates post-crisis, but not in the period preceding it.
Initially, the economic and financial crisis played a significant role in the decline of corporate returns. In the wake of the financial crisis private demand collapsed as economic uncertainty was high, unemployment quickly increased and private sector borrowing nearly froze. This led to a substantial downward revision of corporate sales relative to expectations and therefore the realised investment returns declined relative to the pre-crisis boom. While plausible in the initial post-crisis years, this explanation becomes less and less relevant eight years after the financial crisis. Following the realisation that the investment boom in the run-up to the financial crisis in 2008 was unsustainable, and that productivity growth had slowed down, people revised their expectations for economic growth across the EU downward significantly, as discussed in EIB (2015). This downward revision also entailed scaling down investment plans in line with post-crisis demand.
18 The methodology is developed in Wagenvoort and Torfs (2013), based on Fama and French (1999), and is outlined in section A2 in the Annex.

PART I Gross fixed investment and intangible capital58
Investment and Investment Finance in Europe European Investment Bank
Figure 27 Nominal internal rates of return in the non-financial corporate sector in the EU, per cent
2008-2010
2011-2012 2013-2014
2003-2007
0
2
4
6
8
10
12
Construction and
Real estate
Manufacturing Services Utilities
0
2
4
6
8
10
12
size 0-9 size 10-49 size 50-249 size 250+
0
2
4
6
8
10
12
14
16
18
Core VMS Cohesion
Source: ORBIS, Bureau van Dijk and EIB staff calculations.Notes: Internal rates of return are computed using the methodology of Fama and French (1999) and Wagenvoort and Torfs (2013).
The low realised IRRs in Figure 27 are significantly associated with low investment rates. Box 6 demonstrates that in a cross-country, cross-industry panel, average realised IRRs are an important determinant of the investment rate. A simple regression of the investment rate on the IRR that controls for country-industry specific, time-invariant effects finds that a 1 percentage point (p.p.) increase in IRR is associated with a 1.6 p.p. increase in the average investment rate. Adding a measure of aggregate economic uncertainty decreases the elasticity of investment rates to the IRR with a coefficient on policy uncertainty being negative and statistically significant.

Gross fixed investment and intangible capital PART I 59
European Investment Bank Investment and Investment Finance in Europe
Admittedly, the IRR rises when an economy is growing and demand is strong as firms increase capacity utilisation and make better use of their assets. Thus controlling for country and time effects as well as using proxies for industry-specific demand, like the growth rate of sales by industry, is necessary to absorb demand fluctuations.19 Adding these controls indeed substantially decreases the elasticity of the investment rate to the IRR, but it still remains rather high. Controlling for the user cost of capital (UCC) and for financial strength does not significantly change the result that the IRR is a key determinant of investment.
The financial and sovereign debt crises in Europe (2008-2012) had a conspicuous effect on this relationship. The elasticity of the investment rate to the IRR declined and the effect of the UCC on the investment rates became significantly negative. The smaller effect of the IRR is consistent with the findings in Chapter 6 that industries with better growth opportunities decreased investment rates by more than those with worse growth opportunities, thereby introducing a resource misallocation effect. The effect of the UCC most likely reflects the tighter financial conditions during this period.
Figure 28 Decomposition of labour productivity growth, per cent annual rate
Capital deepeningLabour Productivity TFP
Core EU VMS Cohesion US
1996
-200
1
2002
-200
8
2009
-201
5
1996
-200
1
2002
-200
8
2009
-201
5
1996
-200
1
2002
-200
8
2009
-201
5
1996
-200
1
2002
-200
8
2009
-201
5
1996
-200
1
2002
-200
8
2009
-201
5
-0.5%
0.0%
0.5%
1.0%
1.5%
2.0%
2.5%
3.0%
3.5%
4.0%
4.5%
5.0%
Source: AMECO and EIB staff calculations.
Falling productivity growth in Europe, both in absolute terms and relative to the US, is likely to be the key driver of falling rates of return (Figure 28 and Chapter 2 in this book). Increasing capital labour ratios, also called capital deepening, may be reinforcing the decline.20 Thus addressing the declining corporate returns should involve addressing the decline in productivity growth and the decline in the labour force.
19 Including country-year fixed effects absorbs the effect of policy uncertainty, and they are therefore dropped from the regression.20 Declining population growth and population-aging that are not accompanied by longer working lives meant that firms invested in labour-saving technologies that
increased the capital labour ratio. Decreasing marginal returns to capital labour ratios, holding constant productivity, imply that returns on investment decline.
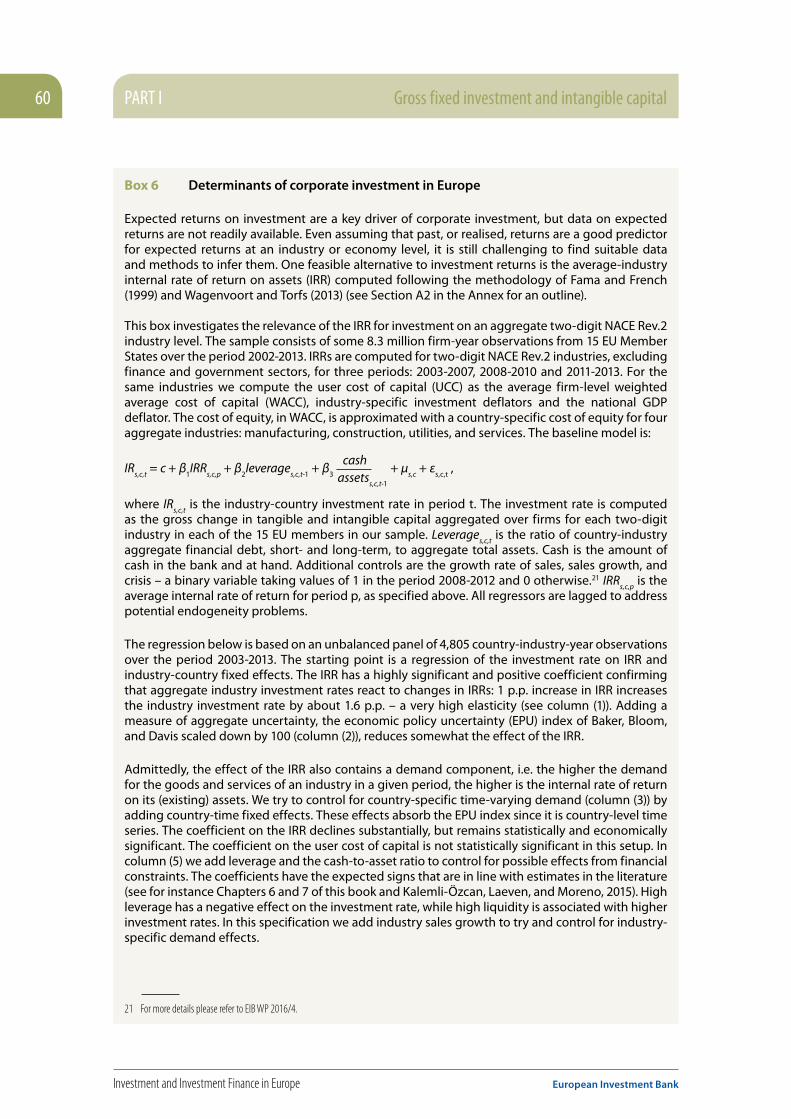
PART I Gross fixed investment and intangible capital60
Investment and Investment Finance in Europe European Investment Bank
Box 6 Determinants of corporate investment in Europe
Expected returns on investment are a key driver of corporate investment, but data on expected returns are not readily available. Even assuming that past, or realised, returns are a good predictor for expected returns at an industry or economy level, it is still challenging to find suitable data and methods to infer them. One feasible alternative to investment returns is the average-industry internal rate of return on assets (IRR) computed following the methodology of Fama and French (1999) and Wagenvoort and Torfs (2013) (see Section A2 in the Annex for an outline).
This box investigates the relevance of the IRR for investment on an aggregate two-digit NACE Rev.2 industry level. The sample consists of some 8.3 million firm-year observations from 15 EU Member States over the period 2002-2013. IRRs are computed for two-digit NACE Rev.2 industries, excluding finance and government sectors, for three periods: 2003-2007, 2008-2010 and 2011-2013. For the same industries we compute the user cost of capital (UCC) as the average firm-level weighted average cost of capital (WACC), industry-specific investment deflators and the national GDP deflator. The cost of equity, in WACC, is approximated with a country-specific cost of equity for four aggregate industries: manufacturing, construction, utilities, and services. The baseline model is:
IRs,c,t
= c + β1IRR
s,c,p + β
2leverage
s,c,t-1 + β
3
cashassets
s,c,t-1
+ μs,c
+ εs,c,t
,
where IRs,c,t
is the industry-country investment rate in period t. The investment rate is computed as the gross change in tangible and intangible capital aggregated over firms for each two-digit industry in each of the 15 EU members in our sample. Leverage
s,c,t is the ratio of country-industry
aggregate financial debt, short- and long-term, to aggregate total assets. Cash is the amount of cash in the bank and at hand. Additional controls are the growth rate of sales, sales growth, and crisis – a binary variable taking values of 1 in the period 2008-2012 and 0 otherwise.21 IRR
s,c,p is the
average internal rate of return for period p, as specified above. All regressors are lagged to address potential endogeneity problems.
The regression below is based on an unbalanced panel of 4,805 country-industry-year observations over the period 2003-2013. The starting point is a regression of the investment rate on IRR and industry-country fixed effects. The IRR has a highly significant and positive coefficient confirming that aggregate industry investment rates react to changes in IRRs: 1 p.p. increase in IRR increases the industry investment rate by about 1.6 p.p. – a very high elasticity (see column (1)). Adding a measure of aggregate uncertainty, the economic policy uncertainty (EPU) index of Baker, Bloom, and Davis scaled down by 100 (column (2)), reduces somewhat the effect of the IRR.
Admittedly, the effect of the IRR also contains a demand component, i.e. the higher the demand for the goods and services of an industry in a given period, the higher is the internal rate of return on its (existing) assets. We try to control for country-specific time-varying demand (column (3)) by adding country-time fixed effects. These effects absorb the EPU index since it is country-level time series. The coefficient on the IRR declines substantially, but remains statistically and economically significant. The coefficient on the user cost of capital is not statistically significant in this setup. In column (5) we add leverage and the cash-to-asset ratio to control for possible effects from financial constraints. The coefficients have the expected signs that are in line with estimates in the literature (see for instance Chapters 6 and 7 of this book and Kalemli-Özcan, Laeven, and Moreno, 2015). High leverage has a negative effect on the investment rate, while high liquidity is associated with higher investment rates. In this specification we add industry sales growth to try and control for industry-specific demand effects.
21 For more details please refer to EIB WP 2016/4.

Gross fixed investment and intangible capital PART I 61
European Investment Bank Investment and Investment Finance in Europe
In our last specification we analyse the effect of the financial crisis and the subsequent recession (2008-2012) on the relationship between investment and returns. The crisis had a significant negative effect on the elasticity of investment to the IRR. The magnitude of the coefficient on the interaction of the IRR with the crisis dummy is high and may be partially capturing the effect of collapsing demand together with the heightened industry-specific uncertainty about the economic outlook in the short and medium term resulting in an investment hold-up. The UCC had a negative and significant impact on the investment rate, which most likely reflects deteriorated financing conditions and limited financing alternatives to bank credit. The effects of the financial ratios did not differ in the pre- and post-crisis periods.
VARIABLES Gross investment(t) / capital(t-1)
(1) (2) (3) (4) (5) (6) IRR 1.62*** 1.49*** 0.65*** 0.87*** 0.63*** 0.67***
(0.05) (0.06) (0.07) (0.08) (0.08) (0.08)
IRR*Crisis -0.21***
(0.08)
UCC(t-1) -0.03 -0.02 0.03
(0.02) (0.02) (0.03)
UCC(t-1)*Crisis -0.25***
(0.06)
Leverage(t-1) -0.13*** -0.13***
(0.05) (0.05)
Leverage(t-1)*Crisis -0.01
(0.03)
Cash/assets(t-1) 0.33*** 0.31***
(0.08) (0.09)
Cash/assets(t-1)*Crisis 0.08
(0.05)
Sales growth(t-1) 0.19*** 0.24***
(0.02) (0.03)
Uncertainty -0.01***
(0.003)
Observations 4,805 4,805 4,794 4,291 4,291 4,291
Adjusted R-squared 0.71 0.71 0.86 0.86 0.87 0.87
Industry FE YES YES YES YES YES YES
Country-year FE YES YES YES YES
Robust standard errors in parenthesis*** p<0.01, ** p<0.05, *p<0.1
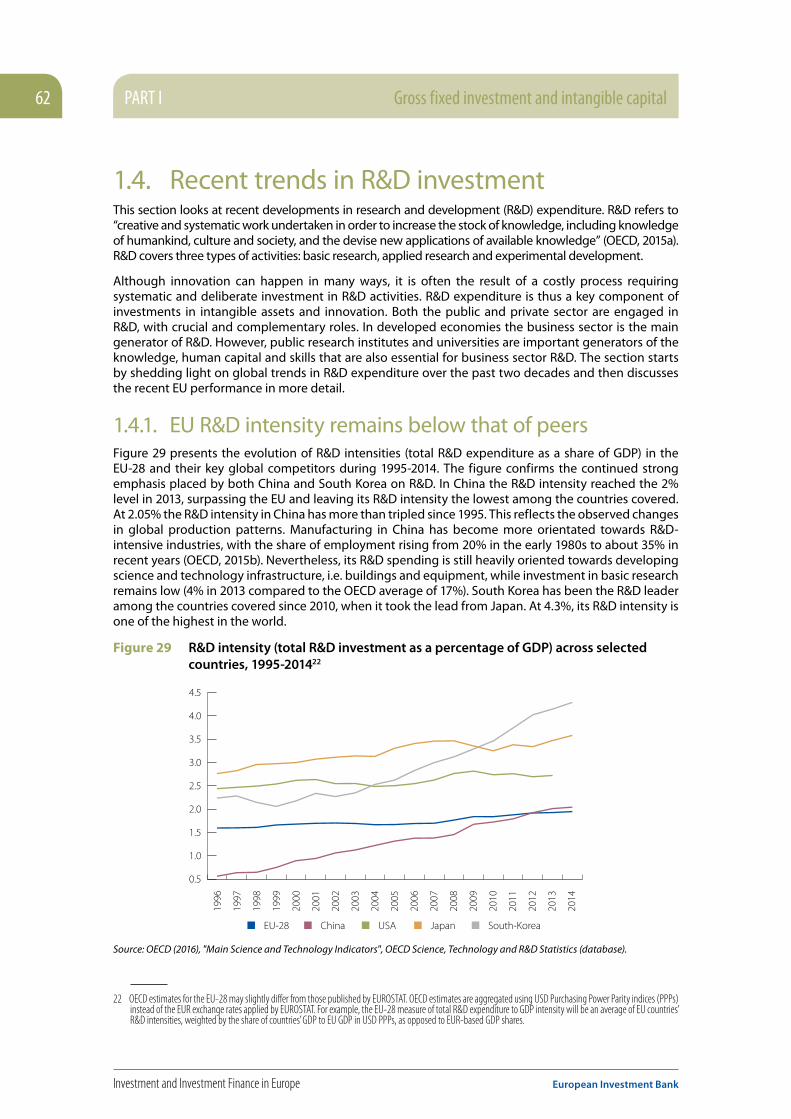
PART I Gross fixed investment and intangible capital62
Investment and Investment Finance in Europe European Investment Bank
1.4. Recent trends in R&D investmentThis section looks at recent developments in research and development (R&D) expenditure. R&D refers to “creative and systematic work undertaken in order to increase the stock of knowledge, including knowledge of humankind, culture and society, and the devise new applications of available knowledge” (OECD, 2015a). R&D covers three types of activities: basic research, applied research and experimental development.
Although innovation can happen in many ways, it is often the result of a costly process requiring systematic and deliberate investment in R&D activities. R&D expenditure is thus a key component of investments in intangible assets and innovation. Both the public and private sector are engaged in R&D, with crucial and complementary roles. In developed economies the business sector is the main generator of R&D. However, public research institutes and universities are important generators of the knowledge, human capital and skills that are also essential for business sector R&D. The section starts by shedding light on global trends in R&D expenditure over the past two decades and then discusses the recent EU performance in more detail.
1.4.1. EU R&D intensity remains below that of peersFigure 29 presents the evolution of R&D intensities (total R&D expenditure as a share of GDP) in the EU-28 and their key global competitors during 1995-2014. The figure confirms the continued strong emphasis placed by both China and South Korea on R&D. In China the R&D intensity reached the 2% level in 2013, surpassing the EU and leaving its R&D intensity the lowest among the countries covered. At 2.05% the R&D intensity in China has more than tripled since 1995. This reflects the observed changes in global production patterns. Manufacturing in China has become more orientated towards R&D-intensive industries, with the share of employment rising from 20% in the early 1980s to about 35% in recent years (OECD, 2015b). Nevertheless, its R&D spending is still heavily oriented towards developing science and technology infrastructure, i.e. buildings and equipment, while investment in basic research remains low (4% in 2013 compared to the OECD average of 17%). South Korea has been the R&D leader among the countries covered since 2010, when it took the lead from Japan. At 4.3%, its R&D intensity is one of the highest in the world.
Figure 29 R&D intensity (total R&D investment as a percentage of GDP) across selected countries, 1995-201422
0.5
1.0
1.5
2.0
2.5
3.0
3.5
4.0
4.5
China USA Japan South-KoreaEU-28
1996
1997
1998
1999
2000
2001
2002
2003
2004
2005
2006
2007
2008
2009
2010
2011
2012
2013
2014
Source: OECD (2016), "Main Science and Technology Indicators", OECD Science, Technology and R&D Statistics (database).
22 OECD estimates for the EU-28 may slightly differ from those published by EUROSTAT. OECD estimates are aggregated using USD Purchasing Power Parity indices (PPPs) instead of the EUR exchange rates applied by EUROSTAT. For example, the EU-28 measure of total R&D expenditure to GDP intensity will be an average of EU countries’ R&D intensities, weighted by the share of countries’ GDP to EU GDP in USD PPPs, as opposed to EUR-based GDP shares.
Gross fixed investment and intangible capital PART I 63
European Investment Bank Investment and Investment Finance in Europe
In the EU, aggregate R&D intensity has increased only modestly since 1995, from 1.6% to 1.95% in 2014. The US has experienced a similar trend – but at a higher level – with R&D intensity increasing from 2.4% to 2.74% in 2013. This has left the R&D intensity gap between the US and the EU more or less stable. The gap reached its peak in 2008 at 1% but has since then gradually declined to close to the starting level of 0.8% in 1995. While in the EU and the US R&D intensity has remained relatively flat since 2008, Japan experienced a clear drop in its R&D intensity in 2008 and 2009, and returned to 2008 levels only in 2013.
All in all, it is fair to say that when compared to investment in general, R&D expenditure in the EU has performed relatively well in recent years. Nevertheless, the growth of R&D expenditure in the EU, the US and Japan has remained below the high growth rates achieved in the years prior to the financial crisis. This reflects the pro-cyclical nature of R&D expenditure.
R&D expenditures can be broken down according to who carries out the R&D: the business sector, higher education, government or private non-profit institutions. In developed economies the business sector is the main generator of R&D. However, public research institutes and universities are important generators of basic research, innovation, knowledge, human capital and skills that are essential for business sector R&D. Among the countries covered the EU has the lowest share of R&D undertaken by the business sector (63%). In the US the business sector accounts for 70% of R&D expenditure while the corresponding figure for China, Japan and South Korea is between 77% and 78%.
In the EU and the US the business sector share remained relatively stable during 1996-2014. In all three Asian countries the business sector’s share has increased compared to 1996. This holds for China in particular, where the share of R&D expenditure in the business sector increased from less than half (43%) in 1996 to over three quarters (77%) in 2014. For Japan and South Korea the corresponding increase was in the range of 5 to 7 percentage points. The lower business sector share in the EU is largely explained by the higher share of R&D performed in the higher education sector (25% compared to 14% in the US, which comes next) whereas government R&D is more on par with the others (within the range of 8-12% for all the others except China, where it stands at 15.8%). EU higher education R&D intensity stood at 0.45% in 2014, the same as in Japan and highest among the countries covered.
Figure 30 shows the evolution of R&D expenditure by different performer. Values for each series have been indexed using 2008 as the reference year (2008=100). The indexing helps to compare within a country how R&D performance in different sectors has changed over time. However, it is worth keeping in mind that due to indexing the levels shown in the figure do not show the correct ranking between the performers or between the countries. As indicated by the R&D shares presented above, business sector R&D is at a much higher level than government or higher education R&D in all the countries covered, and the US is in the lead in terms of total R&D expenditure. Given that the large majority of R&D is performed in the business sector in the countries covered, it is not surprising to see that the evolution of total R&D expenditure closely follows developments in business R&D (Figure 30).

PART I Gross fixed investment and intangible capital64
Investment and Investment Finance in Europe European Investment Bank
Figure 30 Evolution of R&D expenditure by institutional sector (constant PPP dollars, 2008=100, different scale on y-axis for South Korea and China)
050
100150200250300350400
Government
Higher education
Total
Business
2000
2001
2002
2003
2004
2005
2006
2007
2008
2009
2010
2011
2012
2013
2014
0
200
400
600
800
1000
1200
2000
2001
2002
2003
2004
2005
2006
2007
2008
2009
2010
2011
2012
2013
2014
South Korea China
90100110120130140150160170
2000
2001
2002
2003
2004
2005
2006
2007
2008
2009
2010
2011
2012
2013
2014
90100110120130140150160170
2000
2001
2002
2003
2004
2005
2006
2007
2008
2009
2010
2011
2012
2013
2014
EU-28
90100110120130140150160170
2000
2001
2002
2003
2004
2005
2006
2007
2008
2009
2010
2011
2012
2013
2014
Japan
USA
Source: OECD (2016), "Main Science and Technology Indicators", OECD Science, Technology and R&D Statistics (database).
In the EU, total R&D expenditure increased throughout the period 2000-2014 – apart from a tiny 0.16% drop in 2009. The contribution of different R&D performers to growth varied. In 2009 the business sector reduced its R&D expenditure by 2.56%, but this decline was balanced by countercyclical public (government and higher education) R&D expenditure. Firms’ R&D expenditure started to recover relatively quickly in 2010, while the limited fiscal space in most of the EU countries has kept government R&D relatively flat. Despite limited public resources EU higher education R&D has fared somewhat better, but since 2011 the annual growth has been moderate at around 1%.
Compared to the EU, business sector R&D in the US and Japan suffered significantly more from the crisis. Both in the US and Japan the decline in business sector R&D expenditure after 2008 was larger and pre-crisis levels were reached later – in 2013 in the US and a year later in Japan. However, the most recent years show healthy 5% annual business R&D growth in both countries compared to 3% in the EU. In the US government R&D provided strong countercyclical support in 2009 and 2010, increasing by over 10% during the two years, followed by a close to 9% decline in 2012 and 2013.
In South Korea and China R&D expenditure has increased steadily since 2000 in all three sectors with the business sector leading the way. Particularly impressive is the near exponential growth of business R&D expenditure in China.

Gross fixed investment and intangible capital PART I 65
European Investment Bank Investment and Investment Finance in Europe
1.4.2. EU-28 R&D performance varies widely between countries
Aggregate R&D expenditure in the EU is largely driven by a few large R&D spenders. This is due to the fact that R&D expenditure in the EU continues to be geographically concentrated. Germany alone, the largest R&D spender in the EU, accounts for 30% of the expenditure, largely in line with its GDP share. The combined share of the three largest R&D spenders (Germany, France and the UK) is 60%. The share of the non-EU-15 countries has been increasing, but they still account for only some 4% of total R&D expenditure. It is therefore not surprising that the aggregate trends hide considerable heterogeneity across the Member States both in terms of R&D intensity and the growth of R&D expenditure.
Figure 31 Geographical distribution of EU-28 R&D expenditure in 2002, 2008 and 2014
Rest EU-15 RestFR UKDE
28.6%
33.9%
2.7%
2002
18.5%
16.4%
2008
27.7%
38.3%
3.5%
17.1%
13.4%
2014
29.5%
35.8%
4.3%
16.9%
13.5%
Source: Eurostat
The EU countries can be divided into three groups depending on their current R&D intensity: high R&D intensity countries with R&D intensity above 2%, medium R&D intensity countries with R&D intensity between 1% and 2%, and low R&D intensity countries whose R&D intensity is below 1%. Figure 32 shows converging development in the first two groups since 2000 while for the third group the situation is less clear.
Figure 32 Evolution of R&D intensity for different EU country groups 2000-2014(%)
LT LV PL
SK CY EL
HR BG RO
R&D Intensity <= 1
0.20.30.40.50.60.70.80.91.01.1
2000
2002
2004
2006
2008
2010
2012
2014
IE LU UK
ES CZ EE
PT
NL
IT HU
1 < R&D Intensity < 2
0.50.70.91.11.31.51.71.92.12.3
2000
2002
2004
2006
2008
2010
2012
2014
DE DK FI
SE AT BE
FR SI
R&D Intensity >= 2
1.0
1.5
2.0
2.5
3.0
3.5
4.0
2000
2002
2004
2006
2008
2010
2012
2014
Source: Eurostat

PART I Gross fixed investment and intangible capital66
Investment and Investment Finance in Europe European Investment Bank
Among the high R&D intensity countries the convergence has happened from both ends of the range. The EU R&D leaders Finland and Sweden have seen their R&D intensities decline to close to 3.2% while in Germany, Denmark and Austria R&D intensity increased throughout the 2000s to around 3%. In Slovenia R&D intensity increased rapidly from below 1.5% in 2000 to above 2.5% in 2012, but declining higher education and government R&D expenditure caused a setback in 2013 and 2014. Belgium experienced relatively weak development during the first half of the 2000s, but during 2008-2014 the growth rate of its R&D expenditure was among the highest (Figure 33). Belgium was one of the four EU countries with positive average annual growth in business, higher education and government R&D expenditure during both 2008-2011 and 2011-2014. The other countries were Germany, the Czech Republic and Slovakia (see Table in Annex A3).
Among the medium R&D intensity countries the financial crisis had a more marked impact on the evolution of R&D intensities. Prior to 2009 there were clearly two groups of countries (Figure 32). The UK, the Netherlands and Luxembourg were at the top with R&D intensity of around 1.6-1.8%, and a flat or slightly declining trend. The rest of the countries started from clearly lower R&D intensity levels, but were all climbing up. The crisis somewhat broke these general trends. In the Netherlands, Hungary and in particular the Czech Republic R&D intensity has increased steadily. In Hungary the increase was mainly due to R&D carried out in the business sector, but in the Czech Republic good business sector performance was combined with robust increases in government and in particular higher education R&D. In the Netherlands the growth rate declined significantly during the latter period due to weaker business R&D. In the UK and Italy R&D intensity has remained relatively flat in recent years while other medium R&D intensity countries saw their R&D intensity drop. In Ireland this happened despite increasing R&D expenditure, indicating that GDP grew faster than R&D expenditure.
The evolution of R&D intensities among the low R&D intensity countries shows in general more volatility due to low starting levels. When the amount of R&D expenditure is small, relatively small changes to the amounts create larger fluctuations in the intensity. Nevertheless, the data series show a clear upward trend for all the countries except Croatia, Romania and Cyprus. Due to weak and weakening R&D intensity in Romania and Cyprus there has been divergence rather than convergence among the low R&D intensity countries since 2009. Romania is one of the few countries in which the average annual growth rate of R&D expenditure was negative during both 2009-2011 and 2012-2014. Others are Finland, Luxembourg, Portugal and Spain.
Figure 33 Average annual growth rates of total R&D expenditure across the EU countries during 2011-2014 and 2009-201123
-15%
-10%
-5%
0%
5%
10%
15%
20%
High R&D intensity Medium R&D intensity Low R&D intensity
2011-2014 2009-2011
FI SI SE DK FR DE AT BE EE PT ES LU IT NL IE UK
HU CZ
RO CY
HR LV EL LT MT PL SK BG
Source: Eurostat
23 Average annual growth is calculated at compound rates, constant PPP.

Gross fixed investment and intangible capital PART I 67
European Investment Bank Investment and Investment Finance in Europe
High R&D growth rates in the majority of cohesion countries demonstrate the increasing emphasis of those countries on improving their innovation capabilities.24 Strong R&D growth in the business sector is usually the main driver, but this is often combined with significant increases in higher education R&D, and sometimes also in government R&D (see Table in Annex A3). Nevertheless, relatively low levels of R&D spending and the related catching-up potential also contribute to the high growth rates of R&D expenditure in these countries.
To conclude, a few observations are due regarding the progress made towards the EU2020 R&D targets. The EU’s Europe 2020 strategy put forward the goal of a smart, sustainable and inclusive EU economy. In order to achieve this, one of the five objectives to be met by 2020 is to invest 3% of GDP in R&D. As Figure 29 above indicates, overall progress towards this target has been slow. Achieving the objective relies to a large extent on efforts made at the country level. Accordingly, each country has adopted its own targets, which together should enable the EU as a whole to meet the objective.
Overall, for the majority of EU countries, there is a considerable gap between 2014 levels and the 2020 targets. This is documented in Figure 34, which presents the national R&D intensity targets and the situation in 2014. That said, there are significant differences between the EU countries, and some of them have already met or are very close to meeting the target. This includes countries with fairly low targets (Cyprus, Czech Republic) but also those that had relatively high R&D intensities to start with (Germany, Denmark). It is also clear that to reach the 2020 targets within the remaining six years there would need to be a significant step change from the pace of progress over the past six years. For 20 countries the remaining gap between current R&D intensity and the target is greater than the increase in R&D intensity during 2008-2014. For seven out of those 20 countries the R&D intensity was lower in 2014 compared to 2008 (Finland, Sweden, Portugal, Luxembourg, Spain, Croatia and Romania).
Figure 34 R&D intensity in 2014 and in 2008 and the national EU2020 R&D targets across the EU countries
2020 target 20082014
FI SE DK AT DE BE SI FR
EU-2
8C
Z NL
UK IE EE HU PT IT LU ES LT PL SK EL MT
BG HR LV CY
RO
0.0%
0.5%
1.0%
1.5%
2.0%
2.5%
3.0%
3.5%
4.0%
4.5%
Source: Eurostat, European Commission
Furthermore, weak GDP developments during 2009-2014 may have played a non-trivial role in explaining progress in R&D intensities until 2014. The positive side to this development is that in general R&D expenditure reacted less to the crisis than GDP. Nevertheless, it also raises the question of what will happen to R&D intensities when GDP growth starts to pick up again. There might be some downward correction in R&D intensities in the coming years. This underlines the need to try to boost EU R&D expenditure if the EU2020 target is to be achieved.
24 The cohesion countries consist of all the members that joined the EU in or after 2004, except Cyprus. The name of the group derives from the fact that all these countries are eligible for financing from the EU’s Cohesion Fund for the period 2014-2020.

PART I Gross fixed investment and intangible capital68
Investment and Investment Finance in Europe European Investment Bank
References
Baker, S., Bloom, N., & Davis, S. J. (n.d.). Measuring Economic Policy Uncertainty. www.policyuncertainty.com.
Bekaert, G., Harvey, C. R., Lundblad, C., & Siegel, S. (2007). "Global Growth Opportunities and Market Integration". Journal of Finance, 62(3), 1081-1137.
Cerra, V., & Saxena, S. (2008). "Growth Dynamics: The Myth of Economic Recovery". American Economic Review, 98(1), 439-457.
EIB. (2005). Innovative Financing of Infrastructure - the role of public-private partnerships. EIB Papers vol. 10. Luxembourg: EIB.
EIB. (2010). Public and Private Financing of Infrastructure. EIB Papers vol. 15. Luxembourg: EIB.
EIB. (2015). Investment and Investment Finance in Europe: Investing in Competitiveness. Luxembourg.
EIB. (2016a). "Restoring EU Competitiveness: 2016 Updated Version". Luxembourg: European Investment Bank.
EIB. (2016b), “Breaking Down Investment Barriers at Ground Level: Case studies and other evidence related to investment barriers under the third pillar of the Investment Plan for Europe”, forthcoming.
Fama, E., & French, K. (1999). "The Corporate Cost of Capital and the Return on Corporate Investment". Journal of Finance, LIV(6), 1939-1967.
IMF. (2014). "Perspectives on Global Interest Rates". In IMF, World Economc Outlook April 2014. IMF.
Kalemli-Özcan, S., Laeven, L., & Moreno, D. (2015). "Debt Overhang on Europe: Evidence from Firm-Bank-Sovereign Linkages". Mimeo.
Kappeler, A., & Nemoz, M. (2010). Public-Private Partnerships in Europe – before and during the recent financial crisis. Luxembourg: European Investment Bank.
Leamer, E. E. (2007). "Housing is the Business Cycle". Economic Policy Symposium - Jackson Hole (pp. 149-233). Federal Reserve Bank of Kansas City.
OECD. (2015a). “Frascati Manual 2015: Guidelines for Collecting and Reporting Data on Research and Experimental Development: The Measurement of Scientific, Technological and Innovation Activities”, OECD Publishing, Paris.
OECD. (2015b), OECD Science, Technology and Industry Scoreboard 2015: Innovation for growth and society,OECD Publishing, Paris
Reinhart, C., & Rogoff, K. (2010). "This Time is Different: Eight Centuries of Financial Folly". Princeton University Press.
Reinhart, C., & Rogoff, K. (2014). Recovery from Financial Crises: Evidence from 100 Episodes. American Economic Review, 104(5), 50-55.
Revoltella, D., Brutscher, P.-B., Tsiotras, A., & Weiss, C. (2016). "Linking Local Businesses with Global Growth Opportunities: the Role of Infrastructure". Journal of Economic Geography, 32(3), 410-430.
Rioja, F., Rios-Avila, F., & Valev, N. (2014). The Persistent Effect of Banking Crises on Investment and the Role of Financial Markets. Journal of Financial Economic Policy, 6(1), 64-77.
Wagenvoort, R., & Torfs, W. (2013). "Non-financial corporate returns and their impact on investment in Europe". In EIB, Investment and Investment Finance in Europe 2013. Luxembourg: European Investment Bank.
Wagenvoort, R., de Nicola, C., & Kappeler, A. (2010). "Infrastructure Finance in Europe: Composition, Evolution, and Crisis Impact". EIB Papers. 15 (1), pp. 16-39. Luxembourg: EIB.
World Bank (2005), “A Better Investment Climate for Everyone”, available at http://elibrary.worldbank.org/doi/abs/10.1596/0-8213-5682-8.

Gross fixed investment and intangible capital PART I 69
European Investment Bank Investment and Investment Finance in Europe
Annex
A1. Update of the methodology to estimate infrastructure investment
Data on infrastructure investment, let alone its financing sources, are not available in any ready-to-use form. For the new proxy presented in this chapter, we build on the approach first suggested by (Wagenvoort, de Nicola, & Kappeler, 2010).
The basic idea of Wagenvoort et al. was to use Eurostat’s national accounts data on gross fixed capital formation (GFCF) in the sectors commonly considered to be “infrastructure sectors” (i.e. education, health, transport and utilities) to construct estimates of total and government infrastructure investment. Private investment was then derived as the difference between the two.
In a next step, they broke down the private infrastructure aggregate with the help of Projectware data. This allowed them to distinguish between corporate (non-project) infrastructure investment and investments made through Special Purpose Vehicles (SPVs, i.e. projects). The latter could further be divided into Public-Private Partnership projects and non-PPP projects, using data described in (Kappeler & Nemoz, 2010).
The main change that we introduce to Wagenvoort et al.’s methodology in this chapter is that we use newly available Eurostat data on GFCF. While Wagenvoort et al. relied on GFCF in total fixed assets, a recent update of Eurostat’s national accounts data allows us, for the first time, to use a more precise proxy for infrastructure investment, which is GFCF in other buildings and structures.
The new data has the advantage that it excludes many non-infrastructure investments, such as investments in trucks or in other machinery and equipment (that are included in total fixed assets), and therefore reduces the risk of overestimating infrastructure investments. The new Eurostat data also allows us to differentiate between GFCF in the transport sector and in the ICT sector (which were previously lumped together). This gives us a more granular view on individual investment trends across different sectors.
Although the new data captures infrastructure investment better, a few caveats remain. The most important one being the fact that the new data does not allow us to distinguish between GFCF in total fixed assets and in other buildings and structures for the government sector – which means that we have to approximate government investment in other buildings and structures. To do so, we use the following formula:
GGFCF(obs) = GGFCF(tfa) * ( government net capital stock(obs)government net capital stock(tfa)
– implied depreciation)
where GGFCF(obs) and GGFCF(tfa) are government GFCF in other buildings and structures and in total fixed assets respectively and
implied depreciation = ( total economy net capital stock(obs)total economy net capital stock(tfa)
– GFCF(obs)GFCF(tfa) )
That is, we use the share of other buildings and structure in the government capital stock as a proxy for the share of government gross fixed capital formation in other buildings and structures (adjusted for differences in depreciation rates). In other words, we assume that the share of government gross fixed capital formation in other buildings and structures is equal to its historical share.
It should be noted that applying this formula requires us to make two minor data adjustments. First, when data on the net capital stock of a country is missing, we replace the missing value with the average net capital stock of the region in which the country is located (i.e. Northern Europe, Southern Europe or Central and Eastern Europe). Second, to deal with outliers, we set negative implied deprecation differentials equal to zero.

PART I Gross fixed investment and intangible capital70
Investment and Investment Finance in Europe European Investment Bank
A2. Calculation of the internal rate of return on assets
Fama and French (1999) propose a method to estimate the excess return on corporate investment over the cost of capital by comparing two internal rates of return. The cost of capital (ri,m m ) is estimated by assuming that firms are acquired and sold at market value:
IVi0
= ∑ Tt=1
Xit- Iit
(1+ri,m m)t + ∑ Tt=1
FSVit- FBVit
(1+ri,m m)t +
TViT
(1+ri,m m)t [1]
where
IVi0
= the aggregate initial market value of firms present in the sample at the beginning of the sample period for project i,
Xit = the aggregate after-tax cash earnings before deduction of depreciation, interest costs and dividends
in year t of firms that were present in the sample in year t-1,
Iit = the aggregate gross investment in year t of firms that were present in the sample in year t-1,
FSVit = the aggregate market value of firms that are sold in year t,
FBVit = the aggregate market value of firms that are bought in year t,
TVit = the terminal aggregate market value of firms that remain in the sample in year T.
The return on corporate investment (ri,m m ) is estimated by Fama and French (1999) with a similar equation as postulated in equation (1), with the only difference being that firms are bought at book value:
ICi0
= ∑ Tt=1
Xit- Iit
(1+ri,m m)t + ∑ Tt=1
FSVit- FBCit
(1+ri,m m)t +
TViT
(1+ri,m m)t [2]
where
ICi0
= the aggregate initial book value of firms present in the sample at the beginning of the sample period for project i,
FBCit = the aggregate book value of firms that are bought in year t (i.e. firms that enter the sample
between t-1 and t).
If the return on corporate investment exceeds the cost of capital, then Fama and French (1999) conclude that corporate investment on average adds value for those who started up the firm, as they acquired the firm’s assets at book value.
Wagenvoort and Torfs (2013) extend the analysis by including a third IRR, (ri,m m ), which measures the operational return on investment:
ICi0
= ∑ Tt=1
Xit- Iit
(1+ri,b b)t + ∑ Tt=1
FSVit- FBCit
(1+ri,b b)t +
TViT
(1+ri,b b)t [3]
where
FSCit = the aggregate book value of firms that are sold in year t (i.e. firms that leave the sample between
t-1 and t),
TCiT
= the terminal aggregate book value of firms that remain in the sample in year T.
For a more detailed description of the choice and construction of the variables see Wagenvoort and Torfs (2013).

Gross fixed investment and intangible capital PART I 71
European Investment Bank Investment and Investment Finance in Europe
A3. R&D expenditure by country and institutional sector
Table A.1 Average annual growth rates of R&D expenditure by different performers over two periods in EU countries (compound growth rates, constant PPP).
Total Business Higher education Government
2008-2011 2011-2014 2008-2011 2011-2014 2008-2011 2011-2014 2008-2011 2011-2014
R&D intensity > 2
FI -0.2 -5.4 -1.9 -6.6 5.0 -1.0 3.1 -6.1
SI 11.9 -0.8 17.0 0.8 7.1 -4.7 -3.0 -6.0
SE -1.4 0.1 -3.6 -0.8 5.8 3.4 -2.4 -4.4
DK 1.4 1.3 -0.2 -0.1 5.8 3.8 -6.8 5.9
FR 2.5 1.3 3.1 1.8 4.0 0.8 -2.3 -0.5
DE 3.1 1.7 2.3 1.9 5.5 0.2 4.3 2.1
AT 1.5 4.1 1.2 5.2 2.3 2.4 0.2 -0.8
BE 4.6 5.1 4.8 6.4 5.4 1.7 1.1 5.8
1 < R&D intensity =< 2
EE 19.8 -11.9 36.0 -22.1 3.7 2.9 5.8 -2.4
PT -0.7 -5.5 -2.5 -6.3 1.1 1.8 -0.3 -9.8
ES -1.3 -3.4 -3.0 -2.9 0.4 -3.5 1.0 -4.5
LU -2.3 -3.3 -7.6 -10.3 17.7 16.2 10.9 3.8
IT 0.2 0.4 0.8 1.0 -1.9 -1.6 1.9 3.0
NL 4.7 1.0 9.1 0.8 -0.3 0.7 1.1 3.0
IE 2.4 1.9 4.9 3.7 -2.0 -2.8 -6.5 0.0
UK -0.2 2.2 0.6 2.7 -0.8 2.4 -2.3 -1.1
HU 5.2 6.0 11.4 10.9 2.1 -7.3 -7.8 1.2
CZ 7.6 8.8 5.6 9.2 18.6 10.3 2.8 5.8
R&D intensity =< 1
RO -6.4 -5.6 -0.5 -1.1 -13.4 -17.5 -6.6 -3.9
CY 5.2 -2.2 -9.9 4.0 12.5 -2.6 -5.6 -8.3
HR -8.2 0.4 -8.0 3.0 -10.9 -2.1 -5.7 -1.2
LV 1.6 2.7 5.2 11.5 2.7 -3.5 -3.8 3.6
EL -5.9 4.1 3.0 1.4 9.4
LT 1.7 7.5 5.1 11.9 2.4 6.8 -3.8 3.2
MT 10.2 10.1 10.5 6.5 9.6 11.8 11.5 42.0
PL 11.4 10.2 10.4 27.5 13.0 3.6 10.5 -2.4
SK 13.6 12.1 8.3 11.7 28.3 11.5 7.3 13.0
BG 5.4 15.2 26.2 23.6 7.7 9.5 -10.4 1.8
Source: Eurostat

72
Investment and Investment Finance in Europe European Investment Bank

73
European Investment Bank Investment and Investment Finance in Europe
Part I
Gross fixed investment and intangible capital
Chapter 2
Growth, tangible and intangible investment in the EU and
US before and since the Great Recession1
1 This chapter was prepared by Carol Corrado (The Conference Board), Jonathan Haskel (Imperial College, CEPR and IZA), Cecilia Jona-Lasinio (Istat and LUISS Lab), and Massimiliano Iommi (Istat and LUISS Lab).

74
Investment and Investment Finance in Europe European Investment Bank

Gross fixed investment and intangible capital PART I 75
European Investment Bank Investment and Investment Finance in Europe
Growth, tangible and intangible investment in the EU and US before and since the Great Recession
Chapter at a glance
This paper uses a new cross-country cross-industry dataset on investment in tangible and intangible assets for 18 European countries and the US. We set out a framework for measuring intangible investment and capital stocks and their effect on output, inputs and total factor productivity. The analysis provides evidence on the diffusion of intangible investment across Europe and the US over the years 2000-2013 and offers growth accounting evidence before and after the Great Recession in 2008-2009. Our major findings are the following. First, tangible investment fell massively during the Great Recession and has hardly recovered, whereas intangible investment has been relatively resilient and recovered fast in the US but lagged behind in the EU. Second, the sources of growth analysis including only national account intangibles (software, R&D, mineral exploration and artistic originals), suggest that capital deepening is the main driver of growth, with tangibles and intangibles accounting for 80% and 20% in the EU while both account for 50% in the US, over 2000-2013. Extending the asset boundary to the intangible assets not included in the national accounts (Corrado, Hulten and Sichel (2005)) makes capital deepening increase. The contribution of tangibles is reduced both in the EU and the US (60% and 40% respectively) while intangibles account for a larger share (40% in EU and 60% in the US). Then, our analysis shows that since the Great Recession, the slowdown in labour productivity growth has been driven by a decline in TFP growth with relatively a minor role for tangible and intangible capital. Finally, we document a significant correlation between stricter employment protection rules and less government investment in R&D, and a lower ratio of intangible to tangible investment.

PART I Gross fixed investment and intangible capital76
Investment and Investment Finance in Europe European Investment Bank
2.1. IntroductionThe changing nature of the global economy has placed novel attention on intangible capital as a new source of growth. Corrado, Hulten and Sichel (2005, hereafter CHS) expanded the core concept of business investment in national accounts by treating much business spending on “intangibles” – computerised databases, R&D, design, brand equity, firm-specific training, and organisational efficiency – as investment2.
When this expanded view of investment is included in a sources-of-growth analysis, intangible capital is found to account for one-fifth to one-third of labour productivity growth in the market sector of advanced economies.
As overall business intangible investment is large and growing in advanced countries (Corrado et al., 2013) the development of harmonised methods and measures of intangible capital coherent with national accounting practices is essential for a deeper understanding of the sources of growth and for the design of macroeconomic policies aimed at stimulating sustained growth, competitiveness and sustainable development.
Although the fixed asset boundary in national accounts has been continuously expanded in recent decades to better account for the role of intangibles, official estimates treat as investment only a limited range of intangible assets: R&D, mineral exploration, computer software and databases, and entertainment, literary and artistic originals (SNA 2008/ESA 2010).
Following the work of Corrado, Hulten and Sichel (2005, 2009) and Nakamura (1999, 2001) a significant research effort has expanded the number of countries for which estimates of investment in intangible assets based on the CHS approach are available. Much work on intangibles focused on Europe and is comparative in nature. This applies to two projects funded by the European Commission (COINVEST and INNODRIVE) under the 7th Framework Programme and to work conducted by The Conference Board and published by the European Investment Bank (EIB) in December 2009. These projects generated estimates of business intangible investment and capital for the European economies. More recently, great efforts have been devoted to producing harmonised national estimates. This has led to the publication of the INTAN-Invest dataset3, which covered 27 countries of the European Union, plus Norway and the United States (Corrado et al., 2012).
This paper uses a newly revised and updated release of the INTAN-Invest dataset for the market sector (INTAN-Invest 2016) of 18 European countries and the US to analyse the diffusion of intangible investment within Europe and in the US, to investigate the role of intangible capital as a source of growth and to improve our understanding of the drivers of the intangible investment gaps across countries.
The paper is structured into seven sections. Section 2 illustrates the theoretical framework and section 3 provides a data description (INTAN-Invest dataset, 2016). Section 4 illustrates the distribution and trends of intangible investment in the US and in the European economies over the years 2000 to 2013. Section 5 provides evidence about the economic relevance of intangible investment while section 6 explores the drivers of intangible capital accumulation. Section 7 concludes.
In order to understand how intangible assets can be a driver of value creation for individual firms and a source of economic growth, it is important to measure them properly. In recent decades the treatment of intangible assets in national accounts has changed with the decision to capitalise software expenditure as capital formation. Software is an important category of intangible assets as it can
2 The seminal contribution of Corrado, Hulten, and Sichel (2005, 2009, hereafter CHS) was to use an economic view of investment to formalise the arguments for capitalising a broad range of intangibles (not just R&D and software) in company and national accounts. Such assets are created when today’s resources are set aside and used to expand tomorrow’s production capacity. The criterion applies equally to firms’ expenditures on product, market and organisational development because firms expend resources on such activities to increase their future production capacity through “organic growth”, or innovation. This view of investment is common sense, yet it is firmly grounded in economic theory via the optimal growth literature (e.g. Weitzman 1976; see also Hulten 1979).
3 “Harmonised” means that, to the extent possible, the same concepts, methods, and data sources are applied and used for each country.

Gross fixed investment and intangible capital PART I 77
European Investment Bank Investment and Investment Finance in Europe
transform knowledge into computerised information. With the recent adoption of the European System of National and Regional Accounts 2010 (ESA 2010, which replaces ESA 1995), R&D expenditure will also be capitalised as capital formation. However, other intangible assets are notoriously difficult to measure or are simply not measured systematically or consistently across firms or countries and over time. These include assets such as management capability, marketing and employee-training expenditures, which have been shown in the economic literature to be important determinants of a firm’s performance in a market (see, e.g., Bloom and Van Reenen, 2010, for management practices; Belo et al., 2014, for marketing expenditures; and Black and Lynch, 1996, for firm training).
2.2. The theoretical frameworkCHS advanced a simple three-sector model that specified production functions for consumer goods, conventional investment goods, and intangibles. The model was used to show how an economy’s input and output growth changed when business investment in intangibles was capitalised, and its variables were used to identify the prices and quantities that needed to be measured in order to capitalise intangibles and study their contribution to growth.
Here we follow the same strategy but use the related model by Corrado, Goodridge and Haskel (2011) that integrates the various approaches to innovation and integrates innovation into the national accounts to make it measureable (see also Corrado et al., 2013).
The main assumptions of the model are the following. Knowledge (ideas) is an input needed to produce consumption and tangible investment goods together with labour and tangible capital. There exist two types of knowledge. One is knowledge that is generated without using factors of production and that is freely available to firms (free knowledge). The other is knowledge that is produced using inputs and that firms must pay for to use in their production process (commercialised knowledge). Commercialised knowledge is accumulated over time, generating the stock of commercial knowledge via the standard perpetual inventory relation and with its own user cost (explicit or implicit).4
The first implication of the model is a broad definition of investment, which includes expenditure to purchase both tangible goods and commercialised knowledge, and a broad definition of aggregate output, which includes not only consumption goods and tangible investment goods but also commercialised knowledge.
PQQ = PYY + PNN = PCC + PII + PNN [1]
The reason can be thought of by analogy to tangible investment. Suppose an aircraft factory buys in aluminium and produces both final output and its own machines. Then its value added should be properly treated as both the final aeroplanes and the machines, i.e. one might think of the factory as consisting of both an aircraft factory and also a machine factory. Its investment should be treated as equal to the output of the machines. Now suppose the factory also writes its own long-lived software to run the machines. Then we should think of it as both an aircraft factory and machine factory and also a software factory and its investment should include not only the machines but also the software that is produced.
The second implication is that the expression for the sources of growth in value added output is
dlnQ = sQL dlnL + s
QK dlnK + s
QR dlnR + dlnTFP [2]
4 To be more precise, the model considers a simplified economy with just two industries/sectors. The innovation sector produces new finished ideas i.e. it commercialises knowledge (e.g. a way of organising production, or a working software program adapted to the needs of the organisation, say that implements pay and pension calculations for many part-time workers), while the “production” sector uses the knowledge to produce consumption and tangible investment goods. The innovation sector can, at least for some period, appropriate returns to its knowledge, and so this model is identical to Romer (1990) (where patent-protected knowledge is sold at a monopoly price to the final output sector during the period of appropriability), while the production sector is price taker for commercialised knowledge. Both sectors are price takers for labour and tangible capital.

PART I Gross fixed investment and intangible capital78
Investment and Investment Finance in Europe European Investment Bank
where sQ is the share of nominal value added accounted for by payments to the particular factor, dlnTFP is defined as the growth in Q (extended output including commercialised knowledge) over and above the growth contributions of labour, the accumulated stock of tangible capital and the accumulated stock of commercialised knowledge (which are in turn their growth rates, times their factor payment shares in total value added).
The final implication is that the model provides a measure of innovation. Equation 2 says that value added growth is due in part to growth in L and K. This formalises the idea that growth can be achieved by duplication i.e. adding more labour and tangible capital. It further says that growth can be due to the increased use of paid-for ideas, dlnR, but they have to be paid for to be used, and hence make a contribution to dlnQ of sQRdlnR. The final term, dlnTFP, is the growth impact of everything else, which in this model can only be free ideas used in both sectors. Thus in this model, innovation in the sense of use of ideas is also growth net of K and L usage, i.e.
Innovation = sQR dlnR + dlnT F P = dlnQ – (s
QL dlnL + s
QK dlnK) [3]
Many innovation studies have attempted to distinguish between innovation and diffusion, the latter being the spread of new ideas. If the ideas come for free, they are, in this framework, counted in TFP growth. So the part of innovation measured by s
QR dlnR is investment in commercialised new ideas and
that part measured by dlnTFP might be regarded as the diffusion of free ideas.
2.3. Implementation: choice of assets and data sources
2.3.1. Choice of assetsWhat then are intangible assets? They are investments that enable knowledge to be commercialised. CHS group them into three categories (see Table 1 below)
Table 1 CHS intangible assets, national accounts conventions
AssetIntang included in
Nat Accounts?Capitalisation
FactorDepreciation
rate
Computerised Information
Purchased Software Yes 1 0.315Own-Account Software Yes 1 0.315Databases See note 1 0.315
Innovative property
R&D Yes 1 0.15Design No 0.5 0.2Mineral Exploration Yes 1 0.075Financial Innovation No 1 0.2Artistic originals Yes asset-specific asset-specific
Economic Competencies
Advertising No 0.6 0.55Marketing research No 0.6 0.55Own-Account Organisational Capital No 1 0.4Purchased Organisational Capital No 0.8 0.4Training No 1 0.4

Gross fixed investment and intangible capital PART I 79
European Investment Bank Investment and Investment Finance in Europe
Let us review the assets in Table 1. “Computerised information” includes both purchased and own-account software: note that many intangibles are likely to be generated “in-house”. Databases are also included as recommended in SNA 2008.
The second and third broad groups are “innovative property” and “economic competencies”. “Innovative property” is designed to capture a range of assets that may have intellectual property protection associated with them, e.g. R&D, design and artistic originals. Given the huge interest at the time in financial services the CHS list included a special category for them. “Economic competencies” aim at capturing a range of knowledge assets that firms invest to run their businesses, but that might have no IP: the costs of marketing and launching new products, including ongoing investments to maintain the value of a brand, and organisation and human capital management innovations (CHS, 2005, 2009).
2.3.2. Data sourcesAmong the intangible assets listed above, only a few are currently capitalised in national accounts (SNA 2008/ESA 2010): R&D, mineral exploration, computer software and databases, and entertainment, literary and artistic originals (in what follows we refer to this group of assets as national accounts intangibles). Expenditures for design, branding, new financial products, organisational capital and firm-provided training are instead currently treated as intermediate costs (in what follows we refer to this group of assets as new intangibles).
This paper uses a newly revised and updated release of the INTAN-Invest dataset (INTAN-Invest 2016) providing harmonised measures of business intangible investment (Table 1) and capital stocks in 18 European economies and the US. Once new intangibles are treated as investment the overall pattern of national account value added is adjusted to account for the extension of the asset boundaries, thus generating a modified picture of the sources of growth.
The INTAN-Invest 2016 measures of intangibles are obtained following the same estimation strategy adopted in the previous releases of INTAN-Invest but resorting to new NA data sources. INTAN-Invest 2016 data cover total investment in industries from NACE sections A to M (excluding M72) and section S plus the market sector component of NACE M72, P, Q and R (while previous INTAN-Invest estimates did not include industries P and Q but incorporated industry R as a whole). In the analysis reported in this paper we exclude the real estate industry (NACE section L).
As for sources and methods adopted to generate INTAN-Invest measures of intangibles see Appendix 1.
2.4. Intangible investment in the US and the European countries
In this section we provide evidence on the diffusion of business intangible investment over the period 2000-2013 in the US and in 18 EU economies (EU15 excluding Luxembourg (which will be referred to as EU14) plus the Czech Republic, Hungary, Slovakia and Slovenia (which will be referred to as the NMS)).
2.4.1. The overall pictureIn 2000-2013, the average share of intangible investment in GDP is relatively higher in the US (4.2%) than in the EU14 (3.1%) as well as in the four new EU Member States (NMS) included in the analysis (2.2%) (Figure 1). Moreover, national accounts data suggest that the GDP share of tangible investment in the three areas (7.7%, 9.2% and 16.0% respectively) is relatively higher than the intangible share.

PART I Gross fixed investment and intangible capital80
Investment and Investment Finance in Europe European Investment Bank
But when new intangible assets are included in the analysis, the intangible investment gap between the European economies and the US broadens. New intangibles account for 4.6% of GDP in the US, and 4.1% and 4.2% in the EU14 and NMS respectively. Adding new intangibles to national account assets makes the GDP share of total intangible investment increase to 8.8% in the US, 7.2% in the EU14 and 6.4% in the NMS. Hence in the US intangibles outpaced tangible investment while in the European economies the opposite was the case5.
However, within the EU14 economies intangible shares of GDP vary considerably, revealing an interesting geographical pattern (Table 2). Northern Europe (Denmark, Finland, Ireland, Sweden and the UK) and non-German-speaking continental European countries (France, Netherlands and Belgium) are highly intangible intensive and characterised by higher intangible than tangible shares of GDP over the years 2000-2013. Sweden is the leading country with an intangible GDP share of 10.4%, followed by the UK (9.0%), Finland (8.8%), France (8.7%), the Netherlands and Ireland (both at 8.5%) and Belgium (8.1%) and Denmark (7.8%) lagging slightly behind.
The Mediterranean and German-speaking countries are relatively less intangible intensive economies. In Austria, the intangible investment rate (6.7%) is lower compared to the more intangible-oriented economies but still close to the average of the EU14. Portugal (6.0%) and Germany (5.9%) are below the EU14 average intangible share of GDP followed by Italy (5.3%) and Spain (4.6%). Greece shows the lowest average share over the period (3.7%) being an outlier also in terms of the tangible GDP share of investment.
Figure 1 Intangible and tangible investment (% GDP, average 2000-2013)
0%
2%
4%
6%
8%
10%
12%
14%
16%
18%
US EU14 CZ-HU-SI-SK
new intangiblestotal intangibles tangiblesnational accounts intangibles
Source: Source: INTAN-Invest and authors’ elaborations on national accounts
5 Although intangible intensity in the four NMS was slightly lower than in the EU14 region, the ratio of tangible investment to GDP (16%) was almost 50% higher than in the US and almost 60% higher than in the EU14 region.

Gross fixed investment and intangible capital PART I 81
European Investment Bank Investment and Investment Finance in Europe
Table 2 Intangible and tangible investment (% GDP, average 2000-2013)
National Accounts Intangibles
New Intangibles Total Intangibles Tangibles
Austria 3.1% 3.6% 6.7% 11.4%
Belgium 2.9% 5.2% 8.1% 11.7%
Czech Republic 2.5% 4.6% 7.1% 17.8%
Denmark 3.8% 4.1% 7.8% 9.9%
Finland 4.3% 4.4% 8.8% 6.9%
France 4.2% 4.5% 8.7% 7.4%
Germany 2.8% 3.0% 5.9% 9.7%
Greece 0.9% 2.8% 3.7% 8.8%
Hungary 2.0% 4.0% 5.9% 13.3%
Ireland 3.8% 4.7% 8.5% 9.2%
Italy 1.9% 3.4% 5.3% 10.0%
Netherlands 3.4% 5.1% 8.5% 8.3%
Portugal 1.7% 4.3% 6.0% 11.3%
Slovenia 2.5% 4.5% 7.0% 15.1%
Spain 2.1% 2.6% 4.6% 12.7%
Sweden 5.1% 5.3% 10.4% 9.4%
Slovakia 1.5% 3.6% 5.1% 17.2%
United Kingdom 3.4% 5.6% 9.0% 7.5%
United States 4.2% 4.6% 8.8% 7.7%
EU14 3.1% 4.1% 7.2% 9.2%
NMS 2.2% 4.2% 6.4% 16.0%
Source: INTAN-Invest and authors’ elaborations on national accounts
The analysis of the composition of intangible investment (% GDP) reveals that in the US innovative property and economic competencies are the main drivers of intangible capital accumulation (3.5% and 3.7% respectively) while software (1.7%) plays a minor role (Figure 2).
Economic competencies are the main driver of intangible expenditure also in the EU14 and NMS and computer software remains the smallest component. The same pattern holds within the European economies with the notable exception of the Scandinavian countries, Germany and Ireland (Table 3), where innovative property is the main intangible component (as a result of the high propensity for investing in R&D).
The asset breakdown suggests that Germany is lagging behind the more intangible-intensive EU14 countries and the US because of a lower propensity for investing in economic competencies and software, while Italy and Spain are relatively lower across all intangible asset categories.
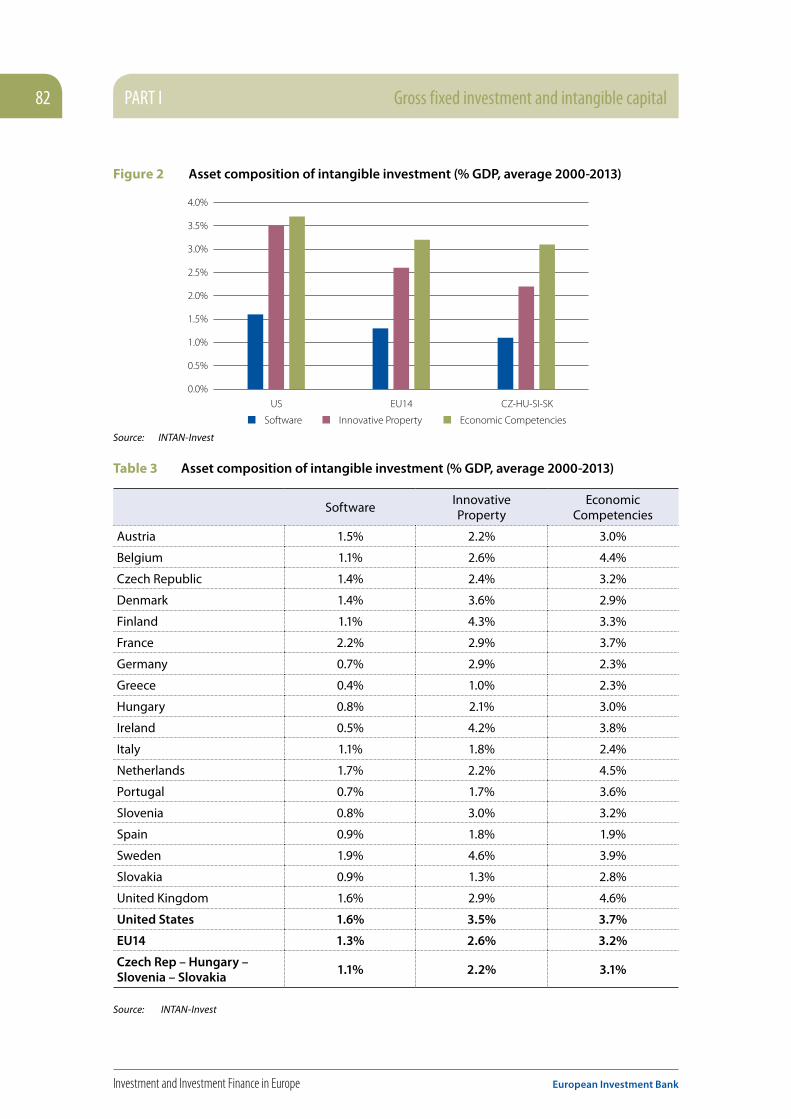
PART I Gross fixed investment and intangible capital82
Investment and Investment Finance in Europe European Investment Bank
Figure 2 Asset composition of intangible investment (% GDP, average 2000-2013)
0.0%
0.5%
1.0%
1.5%
2.0%
2.5%
3.0%
3.5%
4.0%
US EU14 CZ-HU-SI-SK
Innovative PropertySoftware Economic Competencies
Source: INTAN-Invest
Table 3 Asset composition of intangible investment (% GDP, average 2000-2013)
SoftwareInnovative Property
Economic Competencies
Austria 1.5% 2.2% 3.0%
Belgium 1.1% 2.6% 4.4%
Czech Republic 1.4% 2.4% 3.2%
Denmark 1.4% 3.6% 2.9%
Finland 1.1% 4.3% 3.3%
France 2.2% 2.9% 3.7%
Germany 0.7% 2.9% 2.3%
Greece 0.4% 1.0% 2.3%
Hungary 0.8% 2.1% 3.0%
Ireland 0.5% 4.2% 3.8%
Italy 1.1% 1.8% 2.4%
Netherlands 1.7% 2.2% 4.5%
Portugal 0.7% 1.7% 3.6%
Slovenia 0.8% 3.0% 3.2%
Spain 0.9% 1.8% 1.9%
Sweden 1.9% 4.6% 3.9%
Slovakia 0.9% 1.3% 2.8%
United Kingdom 1.6% 2.9% 4.6%
United States 1.6% 3.5% 3.7%
EU14 1.3% 2.6% 3.2%
Czech Rep – Hungary – Slovenia – Slovakia
1.1% 2.2% 3.1%
Source: INTAN-Invest
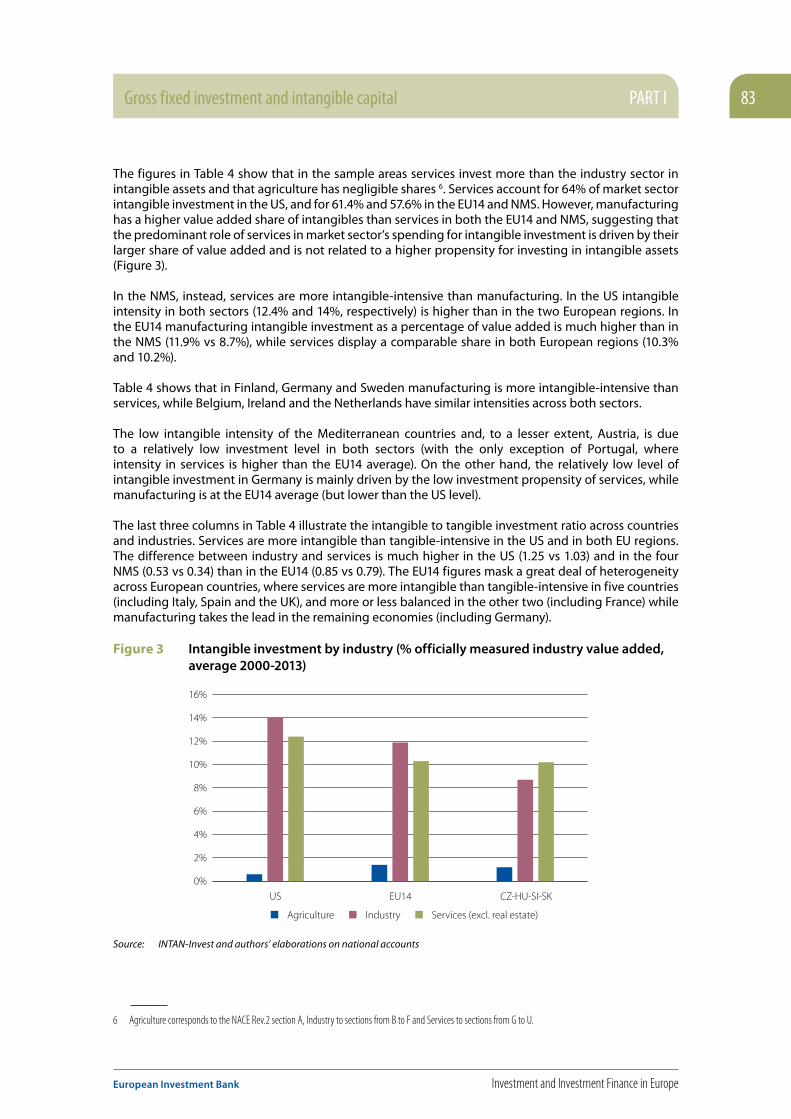
Gross fixed investment and intangible capital PART I 83
European Investment Bank Investment and Investment Finance in Europe
The figures in Table 4 show that in the sample areas services invest more than the industry sector in intangible assets and that agriculture has negligible shares 6. Services account for 64% of market sector intangible investment in the US, and for 61.4% and 57.6% in the EU14 and NMS. However, manufacturing has a higher value added share of intangibles than services in both the EU14 and NMS, suggesting that the predominant role of services in market sector’s spending for intangible investment is driven by their larger share of value added and is not related to a higher propensity for investing in intangible assets (Figure 3).
In the NMS, instead, services are more intangible-intensive than manufacturing. In the US intangible intensity in both sectors (12.4% and 14%, respectively) is higher than in the two European regions. In the EU14 manufacturing intangible investment as a percentage of value added is much higher than in the NMS (11.9% vs 8.7%), while services display a comparable share in both European regions (10.3% and 10.2%).
Table 4 shows that in Finland, Germany and Sweden manufacturing is more intangible-intensive than services, while Belgium, Ireland and the Netherlands have similar intensities across both sectors.
The low intangible intensity of the Mediterranean countries and, to a lesser extent, Austria, is due to a relatively low investment level in both sectors (with the only exception of Portugal, where intensity in services is higher than the EU14 average). On the other hand, the relatively low level of intangible investment in Germany is mainly driven by the low investment propensity of services, while manufacturing is at the EU14 average (but lower than the US level).
The last three columns in Table 4 illustrate the intangible to tangible investment ratio across countries and industries. Services are more intangible than tangible-intensive in the US and in both EU regions. The difference between industry and services is much higher in the US (1.25 vs 1.03) and in the four NMS (0.53 vs 0.34) than in the EU14 (0.85 vs 0.79). The EU14 figures mask a great deal of heterogeneity across European countries, where services are more intangible than tangible-intensive in five countries (including Italy, Spain and the UK), and more or less balanced in the other two (including France) while manufacturing takes the lead in the remaining economies (including Germany).
Figure 3 Intangible investment by industry (% officially measured industry value added, average 2000-2013)
0%
2%
4%
6%
8%
10%
12%
14%
16%
US EU14 CZ-HU-SI-SK
IndustryAgriculture Services (excl. real estate)
Source: INTAN-Invest and authors’ elaborations on national accounts
6 Agriculture corresponds to the NACE Rev.2 section A, Industry to sections from B to F and Services to sections from G to U.
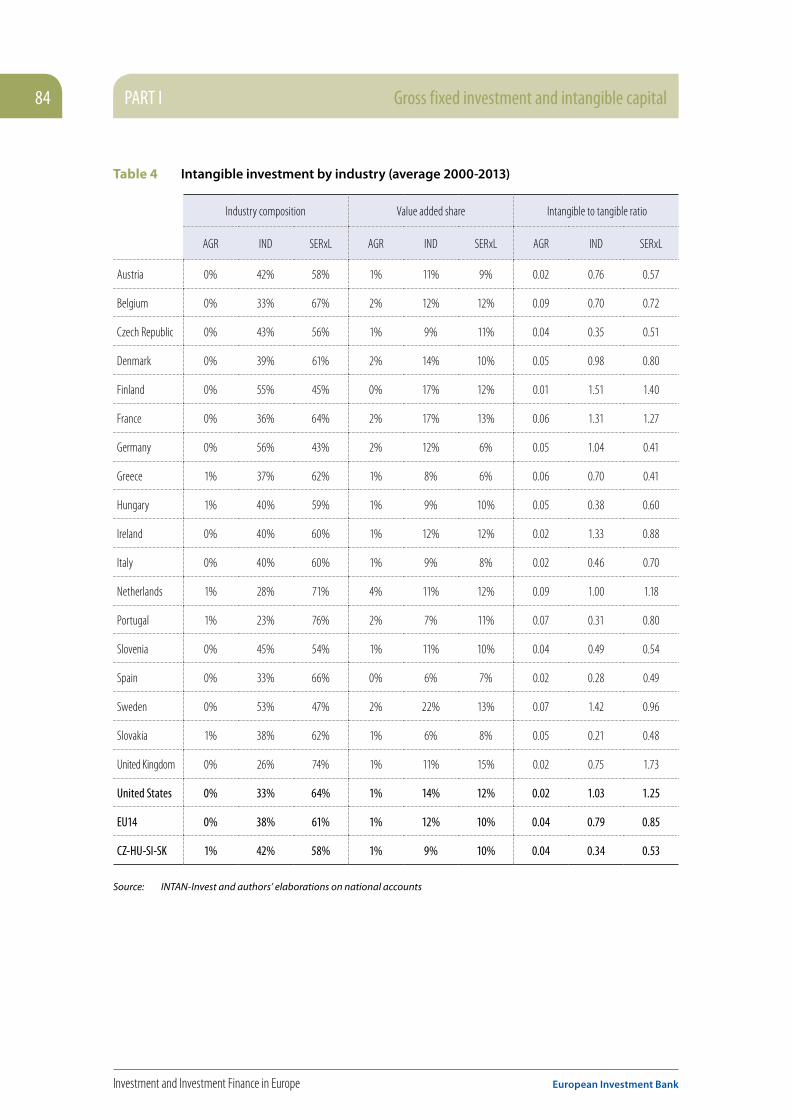
PART I Gross fixed investment and intangible capital84
Investment and Investment Finance in Europe European Investment Bank
Table 4 Intangible investment by industry (average 2000-2013)
Industry composition Value added share Intangible to tangible ratio
AGR IND SERxL AGR IND SERxL AGR IND SERxL
Austria 0% 42% 58% 1% 11% 9% 0.02 0.76 0.57
Belgium 0% 33% 67% 2% 12% 12% 0.09 0.70 0.72
Czech Republic 0% 43% 56% 1% 9% 11% 0.04 0.35 0.51
Denmark 0% 39% 61% 2% 14% 10% 0.05 0.98 0.80
Finland 0% 55% 45% 0% 17% 12% 0.01 1.51 1.40
France 0% 36% 64% 2% 17% 13% 0.06 1.31 1.27
Germany 0% 56% 43% 2% 12% 6% 0.05 1.04 0.41
Greece 1% 37% 62% 1% 8% 6% 0.06 0.70 0.41
Hungary 1% 40% 59% 1% 9% 10% 0.05 0.38 0.60
Ireland 0% 40% 60% 1% 12% 12% 0.02 1.33 0.88
Italy 0% 40% 60% 1% 9% 8% 0.02 0.46 0.70
Netherlands 1% 28% 71% 4% 11% 12% 0.09 1.00 1.18
Portugal 1% 23% 76% 2% 7% 11% 0.07 0.31 0.80
Slovenia 0% 45% 54% 1% 11% 10% 0.04 0.49 0.54
Spain 0% 33% 66% 0% 6% 7% 0.02 0.28 0.49
Sweden 0% 53% 47% 2% 22% 13% 0.07 1.42 0.96
Slovakia 1% 38% 62% 1% 6% 8% 0.05 0.21 0.48
United Kingdom 0% 26% 74% 1% 11% 15% 0.02 0.75 1.73
United States 0% 33% 64% 1% 14% 12% 0.02 1.03 1.25
EU14 0% 38% 61% 1% 12% 10% 0.04 0.79 0.85
CZ-HU-SI-SK 1% 42% 58% 1% 9% 10% 0.04 0.34 0.53
Source: INTAN-Invest and authors’ elaborations on national accounts

Gross fixed investment and intangible capital PART I 85
European Investment Bank Investment and Investment Finance in Europe
2.4.2. Trends in tangible and intangible investment over the period 2000-2013
In this section we look at the dynamics of tangible and intangible investment across 18 European economies and the US over the period 2000-2013. Figure 4 shows that the average annual rate of growth of intangible investment in volume terms is negative in Greece, Italy and, marginally, in Finland. Sweden is the sole country where intangible capital accumulation is significantly less dynamic than tangible capital accumulation. In the US the average rate of growth of intangible investment is 2.6 % per year over 2000-2013, while the rate of tangible investment is 1.0%. The European economies included in our analysis grow at a slower pace both in tangible and intangible investment. In the EU14, intangible investment increases by 2.0% per year while tangibles grow at the modest rate of 0.4% per year. In the NMS the patterns of growth of intangibles and tangibles is even more striking, with the former increasing at 1.2% per year and the latter decreasing by 0.5% per year.
Tangible investment was significantly affected by the financial crisis in all the sample economies (Figure 5). Between the periods 2000-2007 and 2010-2013 the GDP share of tangibles fell across all countries. The decline was stronger in the NMS (probably reflecting the fact that their catching-up process was taking place and that they were converging towards the EU14 levels), in three Mediterranean countries (Portugal, Greece and Spain) and in Denmark. In almost all the sample countries, tangible investment intensity decreased both during (2008-2009) and after the Great Recession (2010-2013).
In contrast, Figure 6 shows that the intangible investment rate in 2010-2013 increased compared to the pre-crisis period 2000-2007 in all countries but Germany and Italy (where it remained stable) and the UK where intangibles decreased. The UK is also the sole country where intangible intensity slowed down during the Great Recession. In Germany, Italy and Sweden intangible intensity remained stable while it increased in all the other economies.
Figure 4 Real tangible and intangible investment growth (chain linked volumes, compounded annual average rates of growth 2000-2013)
-4.0
-3.0
-2.0
-1.0
0.0
1.0
2.0
3.0
4.0
5.0
6.0tangibles
intangibles
EL IT FI DK SE DE
CZ-H
U-SI-
SK NL CZ PT
EU14 UK FR SI HU US AT ES BE IE SK
Source: INTAN-Invest and authors’ elaborations on national accounts
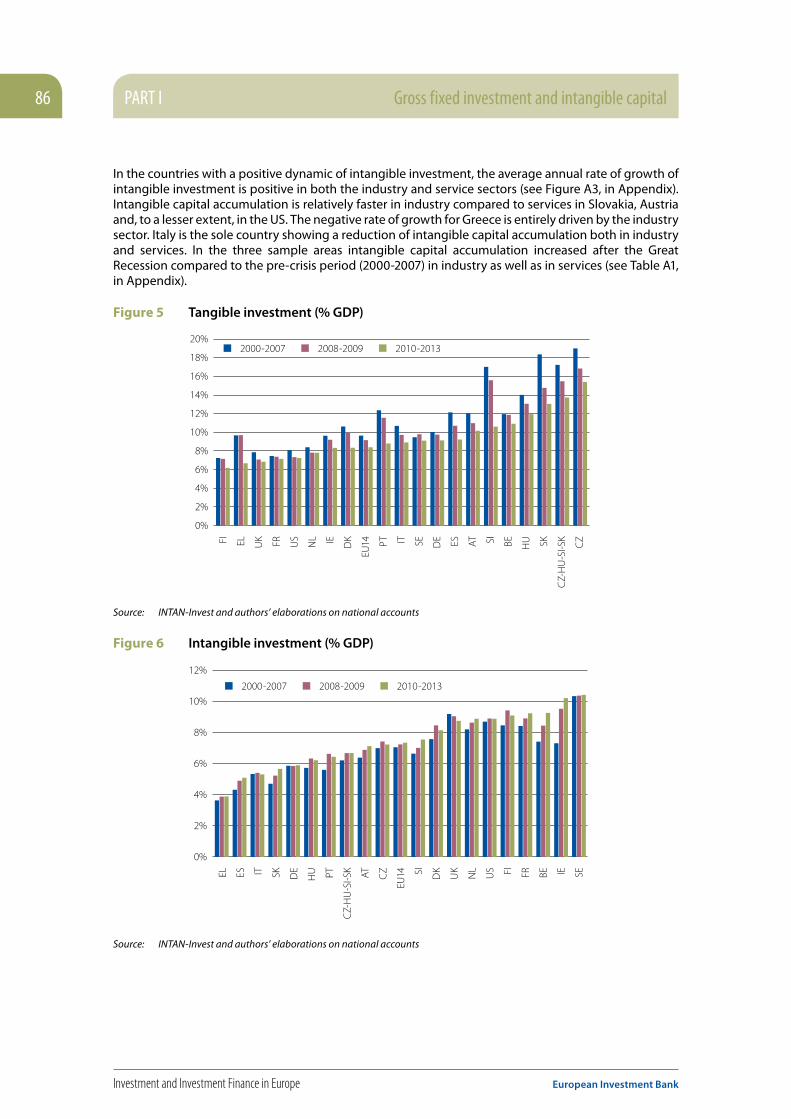
PART I Gross fixed investment and intangible capital86
Investment and Investment Finance in Europe European Investment Bank
In the countries with a positive dynamic of intangible investment, the average annual rate of growth of intangible investment is positive in both the industry and service sectors (see Figure A3, in Appendix). Intangible capital accumulation is relatively faster in industry compared to services in Slovakia, Austria and, to a lesser extent, in the US. The negative rate of growth for Greece is entirely driven by the industry sector. Italy is the sole country showing a reduction of intangible capital accumulation both in industry and services. In the three sample areas intangible capital accumulation increased after the Great Recession compared to the pre-crisis period (2000-2007) in industry as well as in services (see Table A1, in Appendix).
Figure 5 Tangible investment (% GDP)
2000-2007 2008-2009 2010-2013
FI EL UK FR US
NL IE DK
EU14 PT IT SE D
E ES AT SI BE HU SK
CZ-
HU
-SI-S
K
CZ
0%
2%
4%
6%
8%
10%
12%
14%
16%
18%
20%
Source: INTAN-Invest and authors’ elaborations on national accounts
Figure 6 Intangible investment (% GDP)
2000-2007 2008-2009 2010-2013
EL ES IT SK DE
HU PT
CZ-
HU
-SI-S
K AT CZ
EU14 SI DK
UK
NL
US FI FR BE IE SE
0%
2%
4%
6%
8%
10%
12%
Source: INTAN-Invest and authors’ elaborations on national accounts
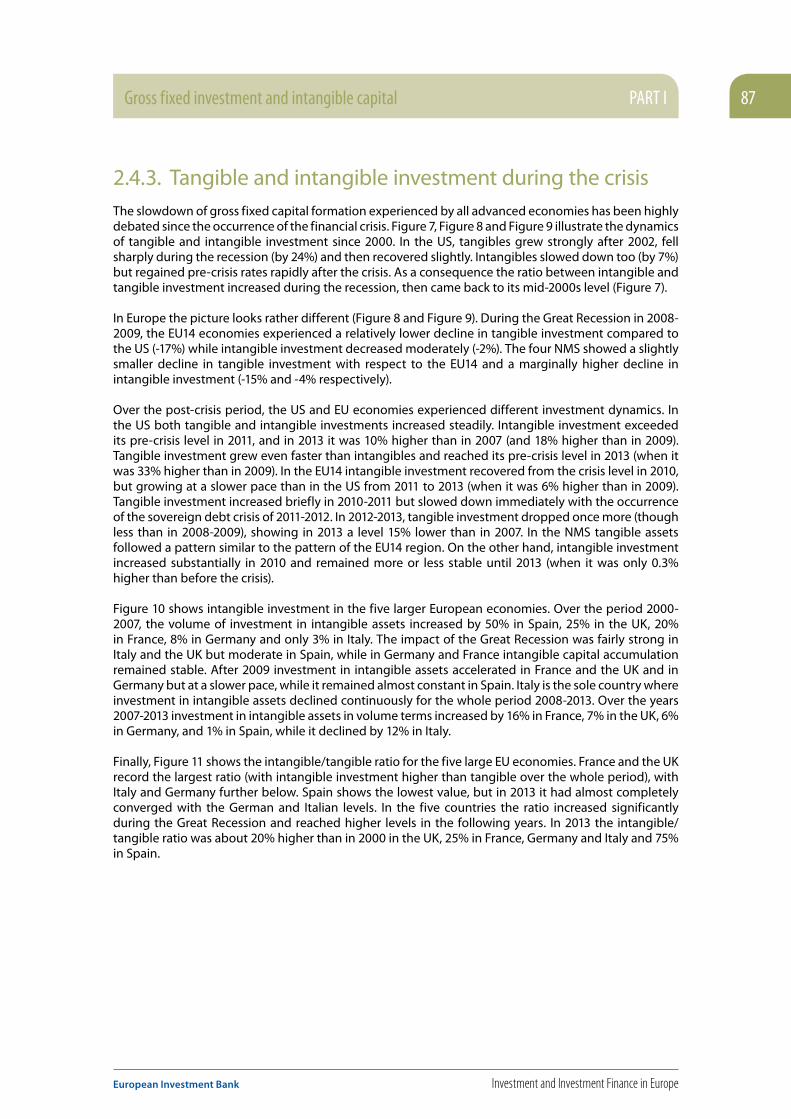
Gross fixed investment and intangible capital PART I 87
European Investment Bank Investment and Investment Finance in Europe
2.4.3. Tangible and intangible investment during the crisisThe slowdown of gross fixed capital formation experienced by all advanced economies has been highly debated since the occurrence of the financial crisis. Figure 7, Figure 8 and Figure 9 illustrate the dynamics of tangible and intangible investment since 2000. In the US, tangibles grew strongly after 2002, fell sharply during the recession (by 24%) and then recovered slightly. Intangibles slowed down too (by 7%) but regained pre-crisis rates rapidly after the crisis. As a consequence the ratio between intangible and tangible investment increased during the recession, then came back to its mid-2000s level (Figure 7).
In Europe the picture looks rather different (Figure 8 and Figure 9). During the Great Recession in 2008-2009, the EU14 economies experienced a relatively lower decline in tangible investment compared to the US (-17%) while intangible investment decreased moderately (-2%). The four NMS showed a slightly smaller decline in tangible investment with respect to the EU14 and a marginally higher decline in intangible investment (-15% and -4% respectively).
Over the post-crisis period, the US and EU economies experienced different investment dynamics. In the US both tangible and intangible investments increased steadily. Intangible investment exceeded its pre-crisis level in 2011, and in 2013 it was 10% higher than in 2007 (and 18% higher than in 2009). Tangible investment grew even faster than intangibles and reached its pre-crisis level in 2013 (when it was 33% higher than in 2009). In the EU14 intangible investment recovered from the crisis level in 2010, but growing at a slower pace than in the US from 2011 to 2013 (when it was 6% higher than in 2009). Tangible investment increased briefly in 2010-2011 but slowed down immediately with the occurrence of the sovereign debt crisis of 2011-2012. In 2012-2013, tangible investment dropped once more (though less than in 2008-2009), showing in 2013 a level 15% lower than in 2007. In the NMS tangible assets followed a pattern similar to the pattern of the EU14 region. On the other hand, intangible investment increased substantially in 2010 and remained more or less stable until 2013 (when it was only 0.3% higher than before the crisis).
Figure 10 shows intangible investment in the five larger European economies. Over the period 2000-2007, the volume of investment in intangible assets increased by 50% in Spain, 25% in the UK, 20% in France, 8% in Germany and only 3% in Italy. The impact of the Great Recession was fairly strong in Italy and the UK but moderate in Spain, while in Germany and France intangible capital accumulation remained stable. After 2009 investment in intangible assets accelerated in France and the UK and in Germany but at a slower pace, while it remained almost constant in Spain. Italy is the sole country where investment in intangible assets declined continuously for the whole period 2008-2013. Over the years 2007-2013 investment in intangible assets in volume terms increased by 16% in France, 7% in the UK, 6% in Germany, and 1% in Spain, while it declined by 12% in Italy.
Finally, Figure 11 shows the intangible/tangible ratio for the five large EU economies. France and the UK record the largest ratio (with intangible investment higher than tangible over the whole period), with Italy and Germany further below. Spain shows the lowest value, but in 2013 it had almost completely converged with the German and Italian levels. In the five countries the ratio increased significantly during the Great Recession and reached higher levels in the following years. In 2013 the intangible/tangible ratio was about 20% higher than in 2000 in the UK, 25% in France, Germany and Italy and 75% in Spain.
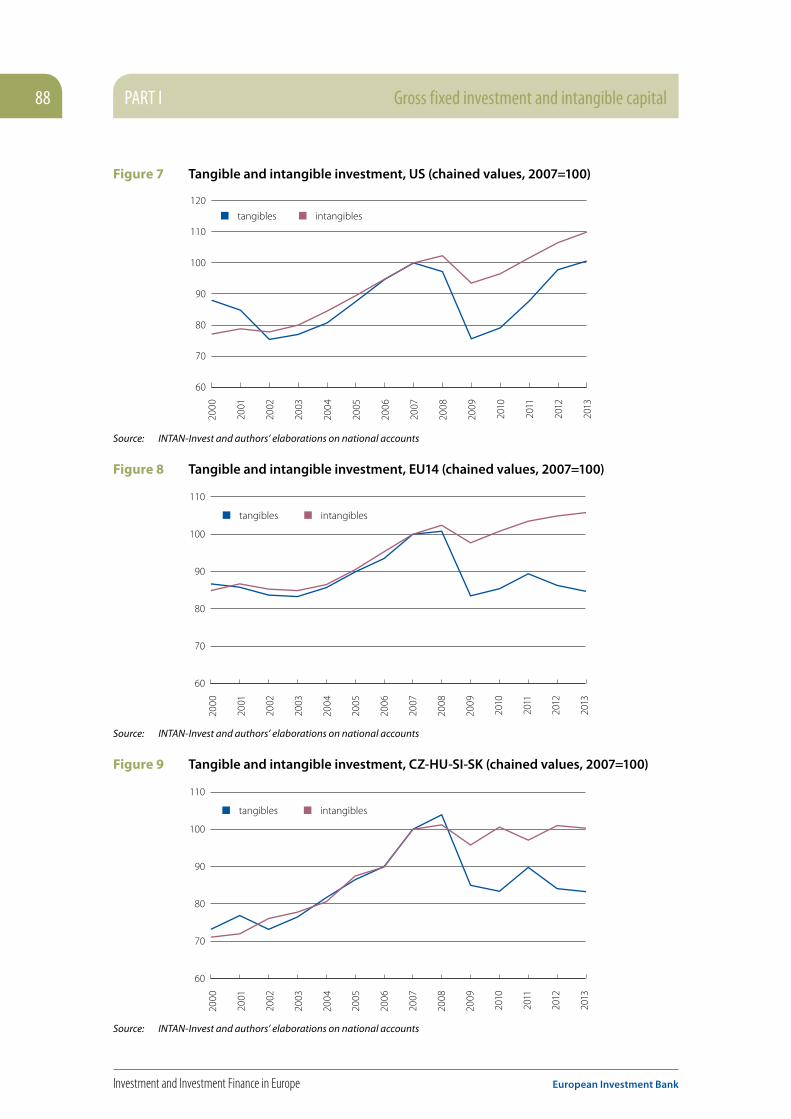
PART I Gross fixed investment and intangible capital88
Investment and Investment Finance in Europe European Investment Bank
Figure 7 Tangible and intangible investment, US (chained values, 2007=100)
intangiblestangibles20
00
2001
2002
2003
2004
2005
2006
2007
2008
2009
2010
2011
2012
2013
60
70
80
90
100
110
120
Source: INTAN-Invest and authors’ elaborations on national accounts
Figure 8 Tangible and intangible investment, EU14 (chained values, 2007=100)
intangiblestangibles
2000
2001
2002
2003
2004
2005
2006
2007
2008
2009
2010
2011
2012
2013
60
70
80
90
100
110
Source: INTAN-Invest and authors’ elaborations on national accounts
Figure 9 Tangible and intangible investment, CZ-HU-SI-SK (chained values, 2007=100)
intangiblestangibles
2000
2001
2002
2003
2004
2005
2006
2007
2008
2009
2010
2011
2012
2013
60
70
80
90
100
110
Source: INTAN-Invest and authors’ elaborations on national accounts
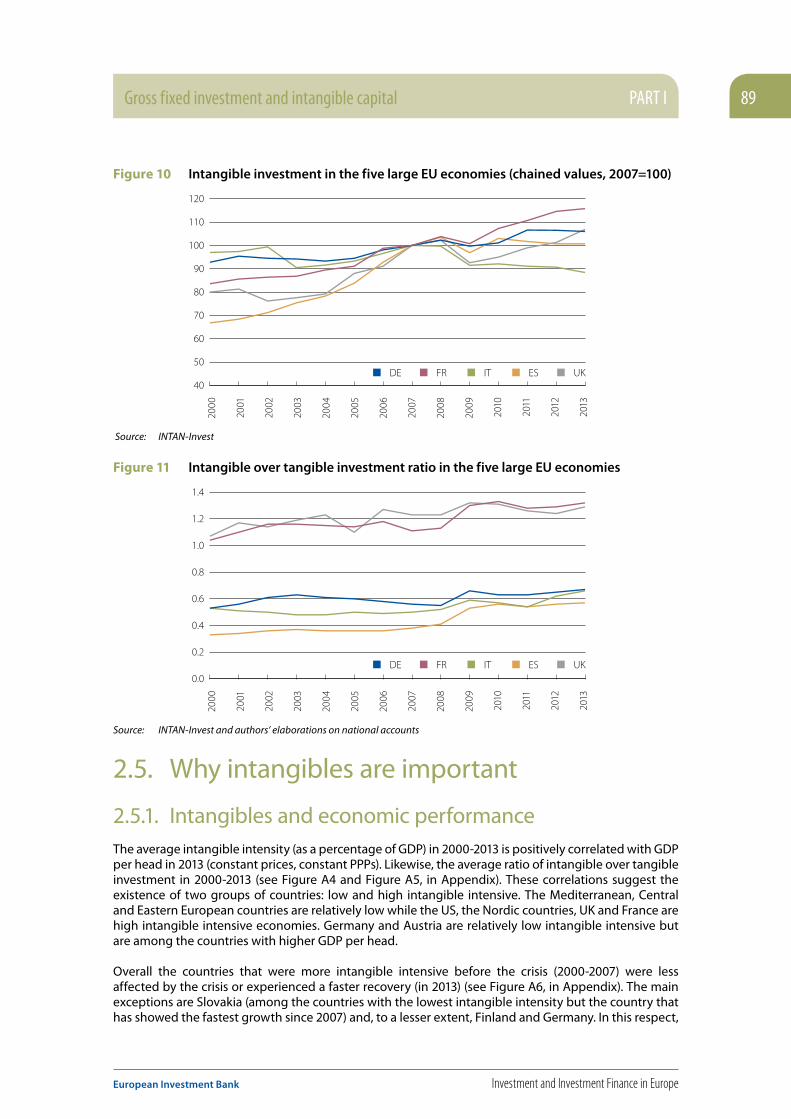
Gross fixed investment and intangible capital PART I 89
European Investment Bank Investment and Investment Finance in Europe
Figure 10 Intangible investment in the five large EU economies (chained values, 2007=100)
FR IT ES UKDE
2000
2001
2002
2003
2004
2005
2006
2007
2008
2009
2010
2011
2012
2013
40
50
60
70
80
90
100
110
120
Source: INTAN-Invest
Figure 11 Intangible over tangible investment ratio in the five large EU economies
2000
2001
2002
2003
2004
2005
2006
2007
2008
2009
2010
2011
2012
2013
0.0
0.2
0.4
0.6
0.8
1.0
1.2
1.4
FR IT ES UKDE
Source: INTAN-Invest and authors’ elaborations on national accounts
2.5. Why intangibles are important
2.5.1. Intangibles and economic performance The average intangible intensity (as a percentage of GDP) in 2000-2013 is positively correlated with GDP per head in 2013 (constant prices, constant PPPs). Likewise, the average ratio of intangible over tangible investment in 2000-2013 (see Figure A4 and Figure A5, in Appendix). These correlations suggest the existence of two groups of countries: low and high intangible intensive. The Mediterranean, Central and Eastern European countries are relatively low while the US, the Nordic countries, UK and France are high intangible intensive economies. Germany and Austria are relatively low intangible intensive but are among the countries with higher GDP per head.
Overall the countries that were more intangible intensive before the crisis (2000-2007) were less affected by the crisis or experienced a faster recovery (in 2013) (see Figure A6, in Appendix). The main exceptions are Slovakia (among the countries with the lowest intangible intensity but the country that has showed the fastest growth since 2007) and, to a lesser extent, Finland and Germany. In this respect,

PART I Gross fixed investment and intangible capital90
Investment and Investment Finance in Europe European Investment Bank
the composition of total investment expenditure makes a material difference: there is a positive, although not very strong, correlation between the average ratio of intangible over tangible investment in 2000-2007 and the volume change of GDP from 2007 to 2013 (see Figure A7, in Appendix).
2.5.2. Sources of growth The sources of growth exercise covers all 19 countries included in the descriptive analysis. To the best of our knowledge, this is the first attempt to provide an analysis of the sources of labour productivity growth that explicitly accounts for the contribution of tangible capital and an exhaustive list of intangible assets for so many European countries. The extended country coverage is not a free lunch. In fact, there is a trade-off between the number of countries and the number of years and variables that can be included in the analysis. Data availability does not allow us to account for the contribution of labour composition. Therefore, the measure of the residual component is the sum of the contributions of multi-factor productivity (MFP) and labour composition (LQ) to labour productivity growth. Moreover, we are not able to disentangle the contribution of tangible capital into the ICT and the non-ICT components. The analysis covers the period 2000-2013.
2.5.2.1. 2000-2013
From 2000 to 2013, labour productivity growth was by far the highest in the four new Member States and in Ireland (Table 5). Also the US and Sweden, Portugal and Austria showed relatively fast productivity growth. Among the larger European countries, the UK, France, Germany and Spain all showed positive rates of growth but well below the US, while productivity growth was slightly negative in Italy. Productivity slowed down significantly in Greece too, while in Denmark, the Netherlands and Belgium it was in line with the UK, France, Germany and Spain.
Capital deepening was the main driver of labour productivity growth in 8 out of 19 countries (FR, EL, HU, IE, IT, PT, ES, SE, US), whereas MFP&LQ accounted for the largest part of labour productivity growth in only six countries (FI, DE, NL, SK, SI, UK) (Table 5 and Figure 12). Capital deepening and MFP&LQ provided a comparable contribution in Austria, Belgium, the Czech Republic, Sweden and Denmark.
Intangible capital emerges as an important source of labour productivity growth in almost all countries, the only exception being the countries that showed negative (Italy and Greece) or modest growth (Denmark).
The last three rows in Table 5 show the rate of growth for the US, EU14 and NMS (CZ-HU-SI-SK). In the US labour productivity growth is 1.8%, in the EU14 1% and in the NMS 3%. Intangible capital provided a relatively smaller contribution in the EU14 than in the US (0.3% against 0.6%) and the same holds for MFP&LQ. In the NMS intangible capital accounts for a similar contribution as in the EU14 while the contribution of tangible and MFP&LQ are significantly higher.
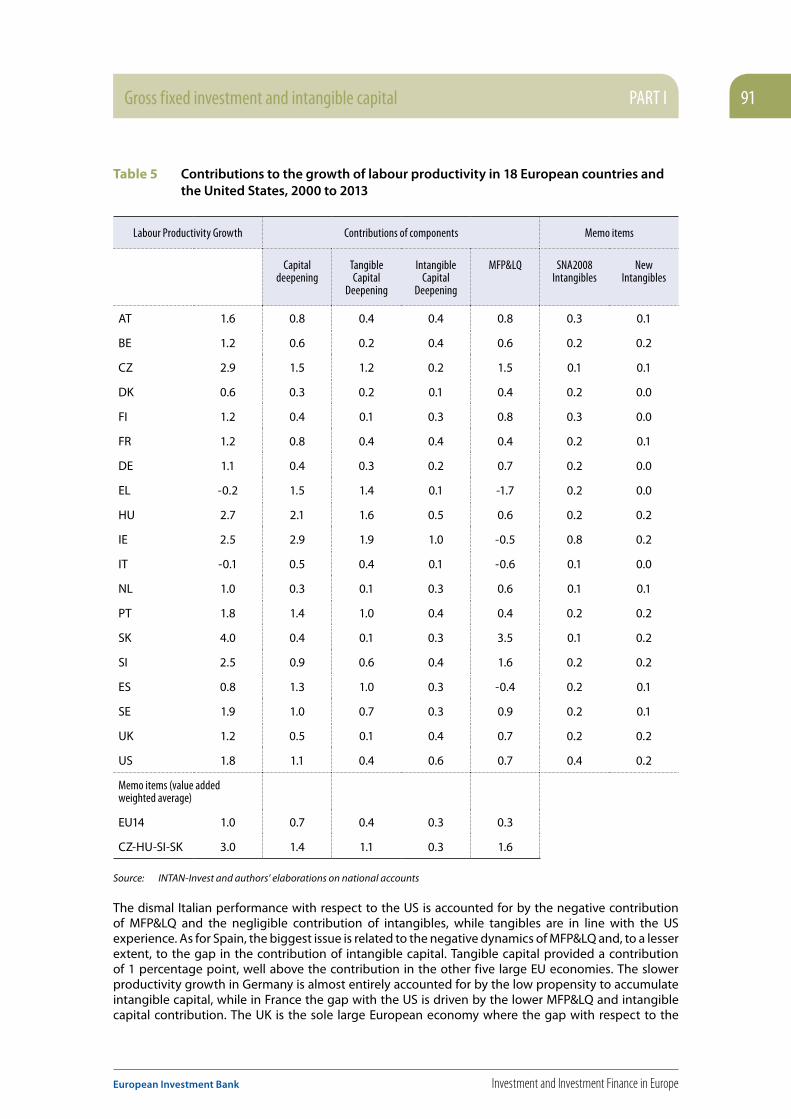
Gross fixed investment and intangible capital PART I 91
European Investment Bank Investment and Investment Finance in Europe
Table 5 Contributions to the growth of labour productivity in 18 European countries and the United States, 2000 to 2013
Labour Productivity Growth Contributions of components Memo items
Capital deepening
Tangible Capital
Deepening
Intangible Capital
Deepening
MFP&LQ SNA2008 Intangibles
New Intangibles
AT 1.6 0.8 0.4 0.4 0.8 0.3 0.1
BE 1.2 0.6 0.2 0.4 0.6 0.2 0.2
CZ 2.9 1.5 1.2 0.2 1.5 0.1 0.1
DK 0.6 0.3 0.2 0.1 0.4 0.2 0.0
FI 1.2 0.4 0.1 0.3 0.8 0.3 0.0
FR 1.2 0.8 0.4 0.4 0.4 0.2 0.1
DE 1.1 0.4 0.3 0.2 0.7 0.2 0.0
EL -0.2 1.5 1.4 0.1 -1.7 0.2 0.0
HU 2.7 2.1 1.6 0.5 0.6 0.2 0.2
IE 2.5 2.9 1.9 1.0 -0.5 0.8 0.2
IT -0.1 0.5 0.4 0.1 -0.6 0.1 0.0
NL 1.0 0.3 0.1 0.3 0.6 0.1 0.1
PT 1.8 1.4 1.0 0.4 0.4 0.2 0.2
SK 4.0 0.4 0.1 0.3 3.5 0.1 0.2
SI 2.5 0.9 0.6 0.4 1.6 0.2 0.2
ES 0.8 1.3 1.0 0.3 -0.4 0.2 0.1
SE 1.9 1.0 0.7 0.3 0.9 0.2 0.1
UK 1.2 0.5 0.1 0.4 0.7 0.2 0.2
US 1.8 1.1 0.4 0.6 0.7 0.4 0.2
Memo items (value added weighted average)
EU14 1.0 0.7 0.4 0.3 0.3
CZ-HU-SI-SK 3.0 1.4 1.1 0.3 1.6
Source: INTAN-Invest and authors’ elaborations on national accounts
The dismal Italian performance with respect to the US is accounted for by the negative contribution of MFP&LQ and the negligible contribution of intangibles, while tangibles are in line with the US experience. As for Spain, the biggest issue is related to the negative dynamics of MFP&LQ and, to a lesser extent, to the gap in the contribution of intangible capital. Tangible capital provided a contribution of 1 percentage point, well above the contribution in the other five large EU economies. The slower productivity growth in Germany is almost entirely accounted for by the low propensity to accumulate intangible capital, while in France the gap with the US is driven by the lower MFP&LQ and intangible capital contribution. The UK is the sole large European economy where the gap with respect to the

PART I Gross fixed investment and intangible capital92
Investment and Investment Finance in Europe European Investment Bank
US is driven by the accumulation of both tangible and, to a lesser extent, intangible capital. The EU lagged behind the US in 2000-2013 mainly because of the relatively lower dynamic of intangible capital deepening and of MFP&LQ.
The bottom line in Table 5 is that, although intangible capital has been an important driver of growth in the EU14 countries excluding Greece, Italy, Denmark, and, to a lesser extent, Germany, the growth contribution of intangible capital is comparatively too small to catch up with the US.
A deeper look at the differences between the composition of intangible contributions in the US and in the EU economies reveals that in the US the three asset categories provided a high contribution. Within innovative property, the contribution of minerals and artistic originals7 seems particularly strong in the US, while R&D, design and new financial products accounted for a similar share in both areas. The high contribution of economic competencies in the US is driven by training (which is falling in Europe) and brand equity. On the other hand, organisational capital accounted for a larger share in the EU14 than in the US.
Figure 12 Contributions to the growth of labour productivity in 18 European countries and the United States, 2007-2013
tangibles intangiblestfp labour productivity
EL IT DK ES NL
DE FR FI BE UK AT PT US SE IE SI
HU CZ SK
-3
-2
-1
0
1
2
3
4
5
Source: INTAN-Invest and authors’ elaborations on national accounts
7 Measurement errors might affect these results.
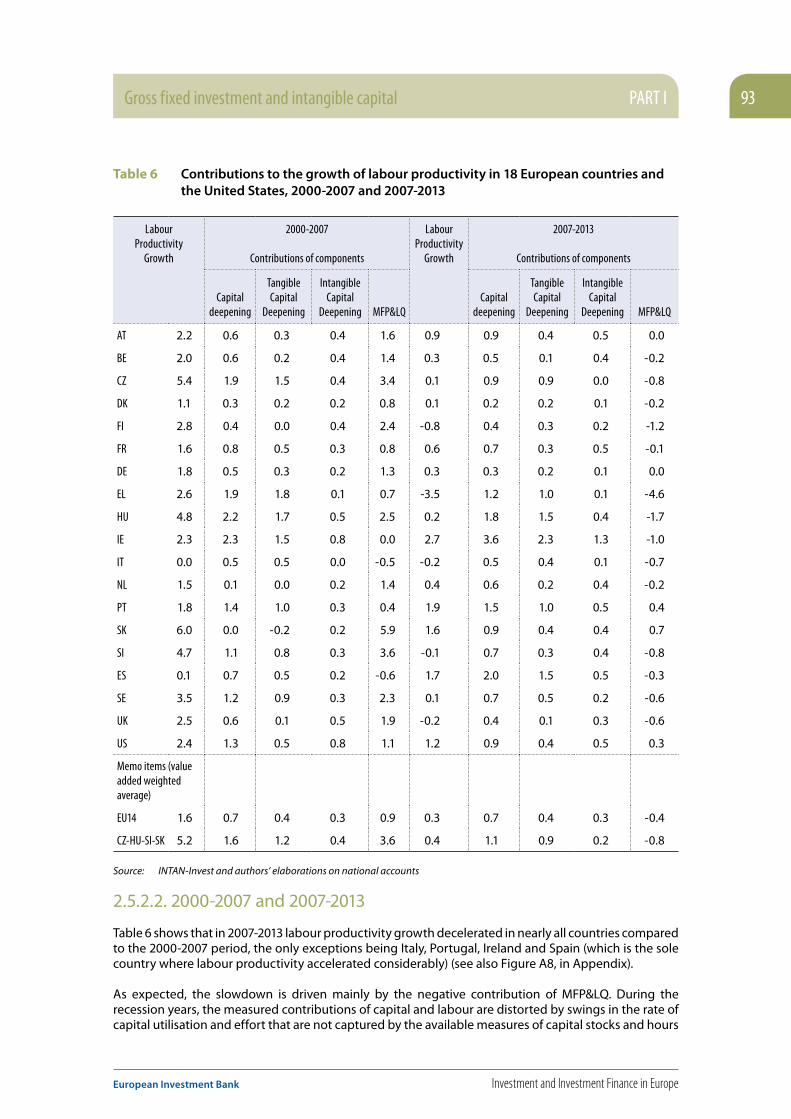
Gross fixed investment and intangible capital PART I 93
European Investment Bank Investment and Investment Finance in Europe
Table 6 Contributions to the growth of labour productivity in 18 European countries and the United States, 2000-2007 and 2007-2013
Labour Productivity
Growth
2000-2007
Contributions of components
Labour Productivity
Growth
2007-2013
Contributions of components
Capital deepening
Tangible Capital
Deepening
Intangible Capital
Deepening MFP&LQCapital
deepening
Tangible Capital
Deepening
Intangible Capital
Deepening MFP&LQ
AT 2.2 0.6 0.3 0.4 1.6 0.9 0.9 0.4 0.5 0.0
BE 2.0 0.6 0.2 0.4 1.4 0.3 0.5 0.1 0.4 -0.2
CZ 5.4 1.9 1.5 0.4 3.4 0.1 0.9 0.9 0.0 -0.8
DK 1.1 0.3 0.2 0.2 0.8 0.1 0.2 0.2 0.1 -0.2
FI 2.8 0.4 0.0 0.4 2.4 -0.8 0.4 0.3 0.2 -1.2
FR 1.6 0.8 0.5 0.3 0.8 0.6 0.7 0.3 0.5 -0.1
DE 1.8 0.5 0.3 0.2 1.3 0.3 0.3 0.2 0.1 0.0
EL 2.6 1.9 1.8 0.1 0.7 -3.5 1.2 1.0 0.1 -4.6
HU 4.8 2.2 1.7 0.5 2.5 0.2 1.8 1.5 0.4 -1.7
IE 2.3 2.3 1.5 0.8 0.0 2.7 3.6 2.3 1.3 -1.0
IT 0.0 0.5 0.5 0.0 -0.5 -0.2 0.5 0.4 0.1 -0.7
NL 1.5 0.1 0.0 0.2 1.4 0.4 0.6 0.2 0.4 -0.2
PT 1.8 1.4 1.0 0.3 0.4 1.9 1.5 1.0 0.5 0.4
SK 6.0 0.0 -0.2 0.2 5.9 1.6 0.9 0.4 0.4 0.7
SI 4.7 1.1 0.8 0.3 3.6 -0.1 0.7 0.3 0.4 -0.8
ES 0.1 0.7 0.5 0.2 -0.6 1.7 2.0 1.5 0.5 -0.3
SE 3.5 1.2 0.9 0.3 2.3 0.1 0.7 0.5 0.2 -0.6
UK 2.5 0.6 0.1 0.5 1.9 -0.2 0.4 0.1 0.3 -0.6
US 2.4 1.3 0.5 0.8 1.1 1.2 0.9 0.4 0.5 0.3
Memo items (value added weighted average)
EU14 1.6 0.7 0.4 0.3 0.9 0.3 0.7 0.4 0.3 -0.4
CZ-HU-SI-SK 5.2 1.6 1.2 0.4 3.6 0.4 1.1 0.9 0.2 -0.8
Source: INTAN-Invest and authors’ elaborations on national accounts
2.5.2.2. 2000-2007 and 2007-2013
Table 6 shows that in 2007-2013 labour productivity growth decelerated in nearly all countries compared to the 2000-2007 period, the only exceptions being Italy, Portugal, Ireland and Spain (which is the sole country where labour productivity accelerated considerably) (see also Figure A8, in Appendix).
As expected, the slowdown is driven mainly by the negative contribution of MFP&LQ. During the recession years, the measured contributions of capital and labour are distorted by swings in the rate of capital utilisation and effort that are not captured by the available measures of capital stocks and hours
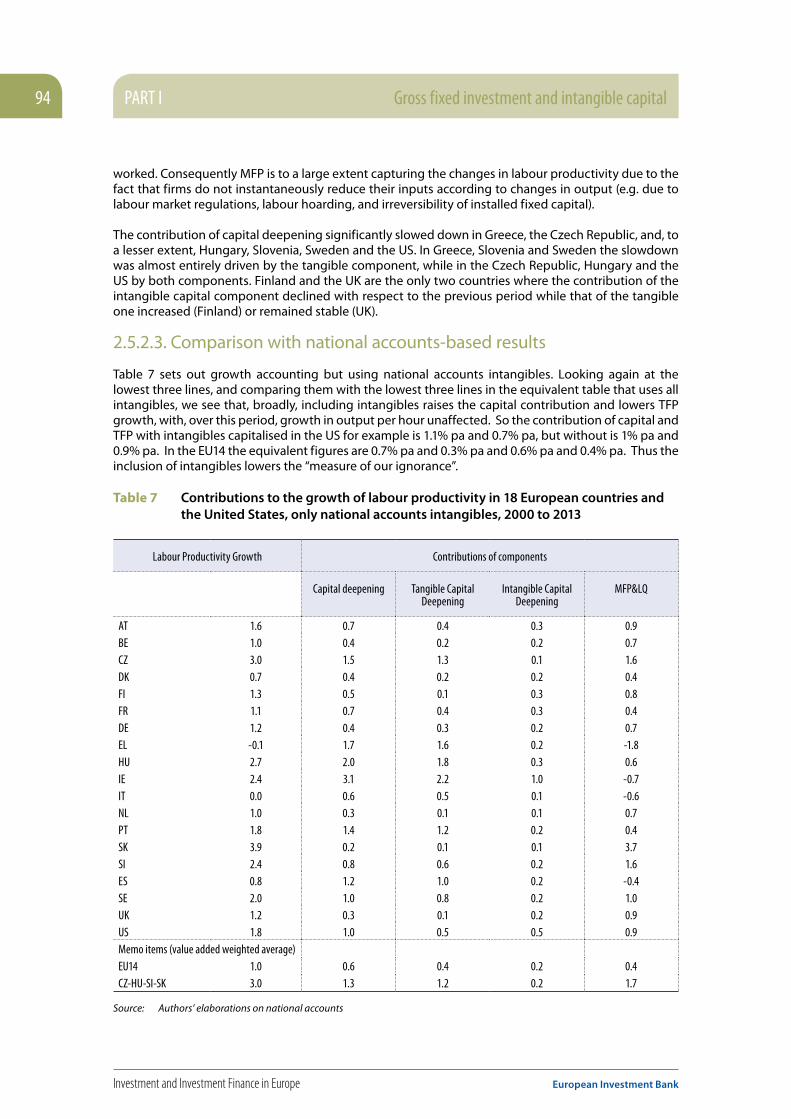
PART I Gross fixed investment and intangible capital94
Investment and Investment Finance in Europe European Investment Bank
worked. Consequently MFP is to a large extent capturing the changes in labour productivity due to the fact that firms do not instantaneously reduce their inputs according to changes in output (e.g. due to labour market regulations, labour hoarding, and irreversibility of installed fixed capital).
The contribution of capital deepening significantly slowed down in Greece, the Czech Republic, and, to a lesser extent, Hungary, Slovenia, Sweden and the US. In Greece, Slovenia and Sweden the slowdown was almost entirely driven by the tangible component, while in the Czech Republic, Hungary and the US by both components. Finland and the UK are the only two countries where the contribution of the intangible capital component declined with respect to the previous period while that of the tangible one increased (Finland) or remained stable (UK).
2.5.2.3. Comparison with national accounts-based results
Table 7 sets out growth accounting but using national accounts intangibles. Looking again at the lowest three lines, and comparing them with the lowest three lines in the equivalent table that uses all intangibles, we see that, broadly, including intangibles raises the capital contribution and lowers TFP growth, with, over this period, growth in output per hour unaffected. So the contribution of capital and TFP with intangibles capitalised in the US for example is 1.1% pa and 0.7% pa, but without is 1% pa and 0.9% pa. In the EU14 the equivalent figures are 0.7% pa and 0.3% pa and 0.6% pa and 0.4% pa. Thus the inclusion of intangibles lowers the “measure of our ignorance”.
Table 7 Contributions to the growth of labour productivity in 18 European countries and the United States, only national accounts intangibles, 2000 to 2013
Labour Productivity Growth Contributions of components
Capital deepening Tangible Capital Deepening
Intangible Capital Deepening
MFP&LQ
AT 1.6 0.7 0.4 0.3 0.9BE 1.0 0.4 0.2 0.2 0.7CZ 3.0 1.5 1.3 0.1 1.6DK 0.7 0.4 0.2 0.2 0.4FI 1.3 0.5 0.1 0.3 0.8FR 1.1 0.7 0.4 0.3 0.4DE 1.2 0.4 0.3 0.2 0.7EL -0.1 1.7 1.6 0.2 -1.8HU 2.7 2.0 1.8 0.3 0.6IE 2.4 3.1 2.2 1.0 -0.7IT 0.0 0.6 0.5 0.1 -0.6NL 1.0 0.3 0.1 0.1 0.7PT 1.8 1.4 1.2 0.2 0.4SK 3.9 0.2 0.1 0.1 3.7SI 2.4 0.8 0.6 0.2 1.6ES 0.8 1.2 1.0 0.2 -0.4SE 2.0 1.0 0.8 0.2 1.0UK 1.2 0.3 0.1 0.2 0.9US 1.8 1.0 0.5 0.5 0.9Memo items (value added weighted average) EU14 1.0 0.6 0.4 0.2 0.4CZ-HU-SI-SK 3.0 1.3 1.2 0.2 1.7
Source: Authors’ elaborations on national accounts
Gross fixed investment and intangible capital PART I 95
European Investment Bank Investment and Investment Finance in Europe
2.6. Drivers of investment in intangible assets In the previous section we showed that the propensity to invest in intangible assets is positively correlated with some measures of economic performance (GDP per head and GDP growth since the beginning of the Great Recession) and that, in a growth accounting sense, intangible investment is an important driver of labour productivity growth. At this point, it is natural to ask why some countries appear to invest more in intangible investment than others. A comprehensive discussion of all the potential determinants of intangible investment is well beyond the scope of the paper. In this section we present a very preliminary analysis of the correlation between intangible investment and two elements that could potentially affect it: firm size, and product and labour market regulation.
2.6.1. Intangibles and firm size The issue of the link between firm size and investment in intangible assets is surveyed by Arrighetti et al. (2014). Firm size is likely to have a positive impact on the propensity to invest in intangible assets for three reasons. Firstly, large firms are better able than small ones to exploit economies of scale in intangible asset accumulation (Dierickx and Cool, 1989). Secondly, big firms can be more effective in protecting their intangible stock than small ones, and thus have a greater incentive to invest. Thirdly, it may be argued that large firms are also capable of supporting a greater amount of the uncertainty that is associated with intangible asset investments as compared to small firms (Ghosal and Loungani, 2000).The (scant) empirical evidence on the link between firm size and intangible investment is consistent with the view that the propensity to invest in intangible assets is positively correlated with firm size. Arrighetti et al. (2014) show that in a sample of Italian manufacturing firms, size significantly increases the probability of being an intangible-intensive firm (where intangibles are measured as a subset of the costs usually reported under the item “intangible fixed assets” in firms’ financial statements). The NESTA survey “Investing in innovation” for the UK (Awano et al., 2010) finds that among firms that replied to the survey, large firms are more likely to report positive spending on one or more intangible assets than smaller firms, although for all intangible spend, intensity does not vary with size, so large firms, who have a higher overall spend, do not have larger intensity. Likewise, a recent study from the European Commission (2013) shows that the smaller the company, the more likely they are to have made no investment in intangible assets (either using internal resources or external providers). For instance, 39% of companies with 1-9 employees say they invested nothing using internal resources for organisational or business process improvement in 2011, compared to 8% of those with 250 or more. Although the empirical evidence on intangible investment is scant, there is a vast body of literature analysing the links between firm size and innovation (often measured as R&D expenditure). Here we only mention the results of the Community Innovation Survey 2008, which shows that large enterprises are more likely to introduce innovations than SMEs in almost all countries for which data are available (Eurostat, 2012).
To investigate this issue, we have calculated the cross-country correlation between intangible investment (measured both as a percentage of value added and as an intangible/tangible ratio) and the average firm size, measured as the share of persons employed in firms with more than 250 employees. Correlations are calculated by industry to control for different average firm size in various economic activities (see Table A2, in Appendix). Intangible intensity and the intangible to tangible ratio are positively correlated with the average firm size in 10 out of 11 industries, the only exception being “Water supply; sewerage, waste management and remediation activities” (where the correlation is negative but very close to zero). The correlation between intangible intensity and average firm size is higher than 0.2 in 8 out of 11 industries, while the correlation between intangible to tangible ratio and average firm size is higher than 0.2 in 9 out of 11 industries.
PART I Gross fixed investment and intangible capital96
Investment and Investment Finance in Europe European Investment Bank
2.6.2. Intangibles and product and labour market regulation The issue of the link between product market regulation (PMR) and investment and innovation is surveyed by Schiantarelli (2016) and we rely heavily on his work. Alesina et al. (2005) identify several ways in which product market regulation can affect investment. First, changes in regulation affect the markup of prices over marginal costs, because of their impact, for instance, on entry barriers and, hence, on the number of firms. Second, regulation can influence the costs that even existing firms face when expanding their productive capacity. Third, for certain sectors, regulation imposes a ceiling on the rate of return on capital that firms are allowed to earn; this leads firms to increase the level of capital stock beyond the profit-maximising level in order to obtain a greater total remuneration for capital. Removing the constraint on the rate of return (if binding) would, instead, reduce the desired capital stock and therefore investment. Finally, if product markets’ regulatory reforms occur together with privatisation (or nationalisation) policies, changes in ownership structure can also affect investment. Public enterprises are often heavy investors, either because of political mandates or because of incentives to over-expand on firms’ managers. Reduced investment by the public sector may therefore occur. Ultimately, which effect dominates is an empirical question. Alesina et al. (2005), in their empirical work, examine investment in non-manufacturing industries (e.g. energy, utilities, communication, and transport) in OECD countries that have experienced profound changes in their regulatory framework. The results suggest that reducing regulation has a significant and sizeable positive effect on the investment rate, particularly if the regulation affects barriers to entry.
Studies that focus on liberalisation episodes in specific sectors provide further evidence on the effect of product market regulation on investment. For instance, Schivardi and Viviano (2011) provide evidence on the relaxation of limits to the opening of large stores in Italy. The results suggest that reducing entry barriers stimulates investment in information and telecommunication technologies (which, in their data, also includes investment in computer software).
Contrasting forces may influence the effect of greater competition on innovation. On the one hand, innovation activity is primarily driven by the aim of achieving monopoly profits on new products or processes. If monopoly profits decrease as a result of regulatory reforms, the pace of innovation may likewise be reduced. Furthermore, monopoly profits help firms to accumulate enough funds to finance innovation. In fact, funds generated internally through retained profits are crucial given the presence of information asymmetries, which may make it costly or difficult to obtain external funds from financial markets for risky innovation activities that are difficult to evaluate. Indeed, in the early quality ladder endogenous growth models of Aghion and Howitt (1992) and Grossman and Helpman (1991) and in the product variety model of Romer (1990) a reduction in rents generated by regulatory changes would adversely affect the incentive to innovate. Nevertheless, in more recent models, incumbent firms also innovate (rather than just newcomers) (Aghion and Griffith, 2005). In these models, the difference between post and pre-innovation monopoly profits determines the incentive to innovate. Greater competition reduces both, but if the pre-innovation profits decrease more than the post-innovation profits, this fosters innovation. Essentially, competition stimulates innovation due to the threat of (or actual) entry of newcomers into a market, which provides incentives for incumbents to innovate in order to escape competition.
The issue of the effects of employment protection legislation (EPL) on productivity and investment is nicely surveyed by Bassanini, Nunziata, and Venn (2009), who make a number of points. First, the effects of EPL depend on how much they are offset by wage adjustments. If wages do not fully adjust to any costs that EPL might impose, then EPL can have real effects. Second, those effects can vary. If labour costs rise, then investment rises as labour gets more expensive. Against this, investment might fall if workers cannot commit to future wages and EPL strengthens the bargaining position of labour to extract any ex post rents from sunk capital (Grout, 1984). If intangible capital is more sunk relative to tangible capital, then investment in intangibles will fall more. The wage effect, however, might be moderated by (perhaps centralised) unions, who might find it easier to precommit, perhaps in national wage bargains. This is the story in the Sapir report (Aghion et al., 2003), suggesting that centralised German unions were useful in the long period of post-war tangible capital accumulation by Europe,
Gross fixed investment and intangible capital PART I 97
European Investment Bank Investment and Investment Finance in Europe
but might be much less useful now when intangible capital and experimentation are required. Finally, Bartelsman, Gautier, and de Wind (2011) suggest that experimentation with risky technologies might be lessened, so average productivity falls. The effects are likely to be analogous with product market regulation.
Finally, Ciriaci et al. (2016) show that product market regulation and employment protection legislation significantly affect the location decision of top R&D investors’ subsidiaries. When taken separately, the level of PMR has the greatest negative effect on companies’ location decisions, while EPL does not appear to play a significant role in such choices. When considering the interaction between PMR and EPL, results show that these two regulations exert a mutually reinforcing negative effect on the decision of top R&D investors about where to locate their subsidiaries.
The evidence from INTAN-Invest data is that countries with less stringent regulations in product and labour markets tend to have higher rates of investment in intangible assets and higher intangible to tangible investment ratios (see Figures A9 to A12, in Appendix). The negative relation between the propensity to invest in intangible assets and the level of product market regulation holds for all three major components of intangible assets (computer software and databases, innovative property and economic competencies) and for all three high-level economy-wide indicators of product market regulation (state control, barriers to entrepreneurship and barriers to trade and investment) (see Table A3, in Appendix).
2.6.3. Determinant of the intangible to tangible investment ratio
In this section we attempt to explore econometrically why some countries appear to invest more in intangible investment than others, allowing for more factors than just the regulatory factors set out above. The following points are worth noting.
First, there may be some “structural” reasons for this. For example, countries with more services might be more intangible-intensive. Or countries with more ICT intensity. Second, public sector R&D might be complementary to private sector intangible investment, and hence it might be that countries with more government-funded R&D are investing more. Third, the neo-classical explanation is that relative prices will determine relative investment, with relative prices particularly affected by the tax treatment of intangibles and tangibles.
Fourth, econometric estimation of investment equations has not often found it easy to find plausible price elasticities and discover the effects of e.g. liquidity constraints and the like. Part of this is that investment seems to be cyclical in ways that prices and adjustment costs have problems describing them, perhaps due to animal spirits and other unmeasureables. This suggests that we might proceed by exploring intangible investment relative to tangible investment, thereby sweeping out any common effects affecting investment “sentiment” that seem so hard to model. Thus we ran the following regression, where the dependent variable is the log of relative intangible to tangible real investment
ln(I INTAN / I TAN)c,t
= α1 ln(P INTAN / P TAN )
c,t + α
2STRICTNESS
c,t + α
3ICT_INTEN
c,t
+ α4share _mfring
c,t + α
5(GovR & D / GDP)
c,t + λ
t + ν
c,t
and where the terms on the right are, respectively, relative investment price, the OECD index of employment strictness, the ratio of ICT capital rental payments to total tangible rental capital payments, the share of employment in manufacturing and the ratio of government-funded R&D to GDP. Each variable is at the country-year dimension, where for convenience the variables are all averages over the following four periods: 1997-1999, 2000-2003, 2004-2008 and 2011-2013. The equation also includes a constant and three time dummies and estimation is by random effects (we could not reject the hypothesis that the fixed effects were jointly zero). For this exercise we have data on 12 countries. The relative investment, prices and ICT intensity data are all for the private sector.
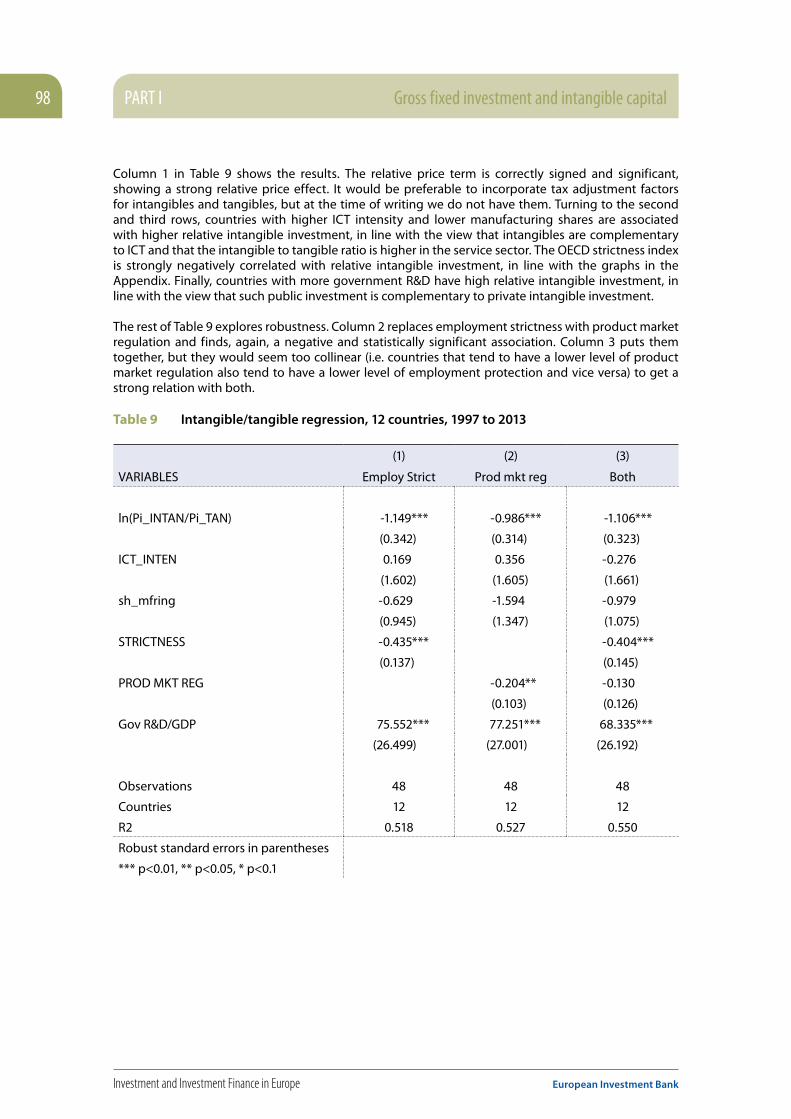
PART I Gross fixed investment and intangible capital98
Investment and Investment Finance in Europe European Investment Bank
Column 1 in Table 9 shows the results. The relative price term is correctly signed and significant, showing a strong relative price effect. It would be preferable to incorporate tax adjustment factors for intangibles and tangibles, but at the time of writing we do not have them. Turning to the second and third rows, countries with higher ICT intensity and lower manufacturing shares are associated with higher relative intangible investment, in line with the view that intangibles are complementary to ICT and that the intangible to tangible ratio is higher in the service sector. The OECD strictness index is strongly negatively correlated with relative intangible investment, in line with the graphs in the Appendix. Finally, countries with more government R&D have high relative intangible investment, in line with the view that such public investment is complementary to private intangible investment.
The rest of Table 9 explores robustness. Column 2 replaces employment strictness with product market regulation and finds, again, a negative and statistically significant association. Column 3 puts them together, but they would seem too collinear (i.e. countries that tend to have a lower level of product market regulation also tend to have a lower level of employment protection and vice versa) to get a strong relation with both.
Table 9 Intangible/tangible regression, 12 countries, 1997 to 2013
(1) (2) (3)
VARIABLES Employ Strict Prod mkt reg Both
ln(Pi_INTAN/Pi_TAN) -1.149*** -0.986*** -1.106***
(0.342) (0.314) (0.323)
ICT_INTEN 0.169 0.356 -0.276
(1.602) (1.605) (1.661)
sh_mfring -0.629 -1.594 -0.979
(0.945) (1.347) (1.075)
STRICTNESS -0.435*** -0.404***
(0.137) (0.145)
PROD MKT REG -0.204** -0.130
(0.103) (0.126)
Gov R&D/GDP 75.552*** 77.251*** 68.335***
(26.499) (27.001) (26.192)
Observations 48 48 48
Countries 12 12 12
R2 0.518 0.527 0.550
Robust standard errors in parentheses
*** p<0.01, ** p<0.05, * p<0.1

Gross fixed investment and intangible capital PART I 99
European Investment Bank Investment and Investment Finance in Europe
2.7. Conclusions and policy implicationsSumming up from the descriptive analysis reported in section 4 we can identify the following stylised facts. First, from 2000 to 2013 average intangible intensity (% GDP) in the US (8.8%) was higher than in the EU14 (7.2%) and in the four new Member States included in our analysis (6.4%). In the US investment in intangible assets outpaced tangible capital accumulation, while in the EU regions it is the opposite. Within the EU14 countries the propensity for investing in intangibles varies considerably with Scandinavian, Northern European (Denmark, Finland, Ireland, Sweden and the UK) and non-German-speaking continental European countries (France, the Netherlands and Belgium) characterised by relatively high intangible shares of GDP. On the other hand, the Mediterranean and German-speaking countries are relatively more tangible-intensive economies.
In all the sample economies, intangible investments are more dynamic than tangibles. Greece, Italy and marginally Finland are an exception because they experienced a slowdown of intangible capital accumulation (even if less pronounced than the downturn of tangible capital accumulation). The Great Recession had a differentiated effect on tangible and intangible investment: tangibles fell massively during the crisis and have hardly recovered, whereas intangible investment has been relatively resilient and recovered fast in the US but lagged behind in the EU.
In the previous sections we have shown that intangible intensity and the intangible to tangible ratio are positively correlated with the level of GDP per head and negatively associated with the financial shock of the Great Recession (measured as the ratio of chained GDP in 2013 to the value in 2007).
The sources of growth analysis first support the evidence that intangible capital deepening is an important driver of growth in 2000-2013 in the US and in the EU14 countries with the exception of Greece, Italy, Denmark, and, to a lesser extent, Germany. These results are sensitive to the extension of the national account asset boundary to the CHS list of intangibles. Once all intangible assets are capitalised capital deepening remains a relevant driver of growth but with a more prominent contribution of intangible capital. Sources of growth results suggest that since the Great Recession labour productivity slowdown has been driven primarily by TFP.
Our preliminary analysis of the drivers of investment in intangible assets shows that countries with higher average firm size and less stringent regulations in product and labour markets have a higher intangible investment rate and higher intangible to tangible investment ratio. The econometric analysis on a subset of countries reveals a significant correlation between having stricter employment protection rules and less government investment in R&D, such as in the Mediterranean countries, and a lower ratio of intangible to tangible investment (controlling for other factors).
Our findings suggest that intangible investment is a key policy variable. A relevant characteristic of intangible capital is that it is growth-promoting (Corrado, Haskel, and Jona-Lasinio, 2014) thus potentially contributing to reducing the growth gap between the EU and the US. Therefore policies designed to foster innovation and to make the economic environment more conducive to investment in intangible assets should adopt a view of innovation that is broader than R&D. In fact, our growth accounting results show that the investment gap between the EU14 and the US is more related to the lower contributions of computer software and databases, artistic originals, mineral exploration, brand and training than to the contribution of R&D.
Finally, the very preliminary evidence presented in this paper on the drivers of intangible investment is consistent with the view that economic policies should target SMEs, focus on maintaining well-functioning product and labour markets and guarantee an appropriate level of government investment in R&D. Additional research is needed to validate our preliminary findings. The next steps will be to refine our econometric analysis extending the number of countries, including additional explanatory variables and exploiting the industry dimension of INTAN-Invest 2016.

PART I Gross fixed investment and intangible capital100
Investment and Investment Finance in Europe European Investment Bank
ReferencesAghion, P, G Bertola, M Hellwig, J Pisani-Ferry, A Sapir, J Vinals, and H Wallace. 2003. An Agenda for a Growing Europe: The Sapir Report. Book. Oxford University Press.
Aghion, P., and R. Griffith, (2005), Competition and Growth; Reconciling Theory and Evidence. Cambridge, MA: MIT Press.
Aghion, P. and P. Howitt, (1992), “A model of growth through creative destruction”. Econometrica, 60, 323-351.
Alesina, A., S. Ardagna, G. Nicoletti, and F. Schiantarelli. “Regulation and investment.” Journal of the European Economic Association 3:4 (2005): 791−825.
Arrighetti Alessandro, Fabio Landini and Andrea Lasagni, (2014), “Intangible assets and firms’ heterogeneity: evidence from Italy”, Research Policy, vol. 43, n. 1:202-213.
Awano, Gaganan, Mark Franklin, Jonathan Haskel, and Zafeira Kastrinaki (2010). “Investing in Innovation: Findings from the UK Investment in Intangible Assets Survey.” NESTA Index Report (July).
Bartelsman, Eric J, Pieter A Gautier, and Joris de Wind. 2011. “Employment Protection, Technology Choice, and Worker Allocation.” Techreport.
Bassanini, Andrea, Luca Nunziata, and Danielle Venn. 2009. “Job Protection Legislation and Productivity Growth in OECD Countries.” Economic Policy 24 (58): 349–402. doi:10.1111/j.1468-0327.2009.00221.x.
Ciriaci, Daria, Nicola Grassano and Antonio Vezzani, (2016), “Regulation, Red Tape and Location Choices of Top R&D Investors”, European Economy Discussion paper 031, European Commission, Directorate-General for Economic and Financial Affairs.
Corrado, Carol, Jonathan Haskel and Cecilia Jona-Lasinio, (2014), “Knowledge Spillovers, ICT and Productivity Growth”. IZA Discussion Paper No. 8274.
Corrado, Carol, Jonathan Haskel, Cecilia Jona-Lasinio and Massimiliano Iommi, (2012), “Intangible Capital and Growth in Advanced Economies: Measurement Methods and Comparative Results” Working Paper, June, available at http://www.intan-invest.net.
Corrado, Carol, Jonathan Haskel, Cecilia Jona-Lasinio and Massimiliano Iommi, (2013). “Innovation and intangible investment in Europe, Japan and the United States,” Oxford Review of Economic Policy 29 (2): 261-286.
Corrado, Carol, Charles Hulten, and Daniel Sichel (2005). “Measuring Capital and Technology.” In Measuring Capital in the New Economy, C. Corrado, J. Haltiwanger, and D. Sichel, eds., Studies in Income and Wealth, Vol. 65, 11-14. Chicago: The University of Chicago Press.
Corrado, Carol, Charles Hulten and Daniel Sichel (2009). “Intangible Capital and US Economic Growth.” The Review of Income and Wealth 55: 3 (September), 661-685.
Corrado, Carol, Peter Goodridge, and Jonathan Haskel (2011). “Constructing a Price Deflator for R&D: Estimating the Price of Knowledge as a Residual.” The Conference Board Economics Program Working Paper EPWP #11-03.
Dierickx, I., Cool, K., (1989), “Asset stock accumulation and sustainability of competitive advantage”, Management Science 35, 1504-1511.
European Commission (2013). “Investing in intangibles: Economic assets and innovation drivers for growth”. Flash Eurobarometer No. 369. European Commission, Directorate-General for Enterprise and Industry. Data available at http://dx.doi.org/10.4232/1.1190
Eurostat (2012), “Europe in figures – Eurostat yearbook 2012”
Gross fixed investment and intangible capital PART I 101
European Investment Bank Investment and Investment Finance in Europe
Ghosal, V., Loungani, P., (2000), “The Differential Impact of Uncertainty on Investment in Small and Large Businesses”, Review of Economics and Statistics 82, 338-343.
Grossman G.M. and E. Helpman, (1991), “Quality ladders in the theory of growth”. Review of Economic Studies. Vol. (58(1)), 43-61.
Grout, Paul A. 1984. “Investment and Wages in the Absence of Binding Contracts: A Nash Bargaining Approach.” Econometrica 52 (2): 449. doi:10.2307/1911498.
Hulten, Charles R., “On the ‘Importance’ of Productivity Change,” American Economic Review, 69, 126–36, 1979.
Nakamura, Leonard (1999). “Intangibles: What Put the New in the New Economy?” Federal Reserve Bank of Philadelphia Business Review (July/August): 3-16.
Nakamura, Leonard (2001). “What is the US Gross Investment in Intangibles? (At Least) One Trillion Dollars a Year!” Federal Reserve Bank of Philadelphia Working Paper No. 01-15.
Romer, Paul M. (1990). “Endogenous Technological Change.” Journal of Political Economy, Vol. 98:5 (October), Part 2: S71-S102.
Schiantarelli, Fabio (2016). “Do product market reforms stimulate employment, investment, and innovation?”. IZA World of Labor 2016: 266. doi: 10.15185/izawol.266
Schivardi, F., and E. Viviano. “Entry barriers in retail trade.” Economic Journal 121:551 (2011): 145−170.
Weitzman, Martin L., “On the Welfare Significance of National Product in a Dynamic Economy,” Quarterly Journal of Economics, 90, 156–62, 1976.

102
Investment and Investment Finance in Europe European Investment Bank

103
European Investment Bank Investment and Investment Finance in Europe
Part I
Gross fixed investment and intangible capital
Chapter 3
The EIB Investment Survey: a preview1
1 This chapter was prepared by Tim Bending and Philipp Brutscher (EIB).

104
Investment and Investment Finance in Europe European Investment Bank

Gross fixed investment and intangible capital PART I 105
European Investment Bank Investment and Investment Finance in Europe
The EIB Investment Survey: a preview
Chapter at a glance
The purpose of this chapter is to give a foretaste of the results of the new EIB Group Survey on Investment and Investment Finance (EIBIS). Using preliminary data available for seven countries (Finland, Germany, Greece, Italy, Portugal, Slovenia, and the UK), it presents summary statistics and some first explorative analyses of these data.
Investment activities in 2015 varied significantly across countries and sectors. While the share of firms investing was similar (72%), there were substantial cross-country/cross-sector differences in terms of firms’ investment outlays per employee. The highest investment intensities were reported in Finland, Germany and Slovenia as well as in the infrastructure sector.
Regarding firms’ outlook for investment in 2016, we find evidence of a continuing strong investment performance in Germany and Slovenia, as well as (weak) signs of a recovery in Greece and Portugal. Firms in the infrastructure sector, on the other hand, anticipate a sharp investment slowdown in 2016.
16% of firms state that their investment activities in the last three years were below needs, while only 4% report having invested too much. Firms in Portugal, Greece, Slovenia and the UK are the most likely to report that their investment activities in the last three years were below needs – something which we show is strongly (negatively) correlated with both the share of firms’ equipment that is self-reported as state-of-the-art and that of their building stock that meets high energy efficiency standards.
Uncertainty is seen as the most important short-term barrier to investment in all countries apart from Germany. Firms report that the political and regulatory climate negatively affects their ability to carry out planned investments. Firms are more divided on the impact of the overall economic climate, while sector-specific business prospects and the availability of finance are seen more positively.
In terms of longer-term barriers to investment, uncertainty tops the list (cited by 67% of firms), followed by the lack of skilled workers (the leading obstacle in Germany) and business regulation (particularly in Greece, Italy and Portugal).
With regard to investment finance, the data confirms firms’ strong reliance on internal sources (70% on average) and bank loans (60% of external finance on average). What is more, the data suggests that firms on average have little desire to change their financing mix. If anything, they tend to want more of the external finance types that they already heavily use, including bank lending and leasing.
Finance-constrained firms are most prevalent in Greece (22%), Portugal (11%), Italy (12%) and Slovenia (15%). To the extent that such finance constraints are driven by weak bank balance sheets, we show that – for the southern countries – this weakness tends to be passed through primarily by means of shorter maturities and lower amounts granted. Interestingly, the costs of funding or collateral requirements tend to vary much less with the weakness of lender balance sheets. Finance constraints tend to be negatively correlated with firm productivity, but this relationship breaks down with regard to firms that have recorded a loss in the last financial year.

PART I Gross fixed investment and intangible capital106
Investment and Investment Finance in Europe European Investment Bank
3.1. IntroductionBeing able to track changes in business investment, identify investment needs and understand the constraints that hold back investment is vital for effective policy-making to support growth and job creation across Europe. The annual EIB Group Survey on Investment and Investment Finance (EIBIS) is a new initiative that will help address this challenge.
EIBIS is an EU-wide survey that gathers qualitative and quantitative information on investment activities by both SMEs and larger corporates, their financing requirements and the difficulties they face. The survey is intended to improve our understanding of the needs, opportunities and constraints faced by businesses. It will be used to inform policy dialogue on the drivers and barriers to investment and to refine the support for investment provided by the EIB.
The main module of the survey involves interviews with 12,000 SMEs and larger corporates. It collects data on firm characteristics and performance, past investment activities and future plans, sources of finance (including firm-bank relationships), and challenges that businesses face. The module is designed to be representative across different sectors, firm sizes and all 28 EU Member States. Furthermore, it is designed to build a panel of enterprise data that enables the analysis of investment and business environment trends over time. More details on the design of EIBIS are to be found in the appendix.
The purpose of this chapter is to give a foretaste of what the survey will be able to deliver. It uses the first set of data available, covering Finland, Germany, Greece, Italy, Portugal, Slovenia, and the UK, the countries where fieldwork is complete at the time of writing. Nonetheless, these data, and any conclusions drawn from them, should still be seen as provisional.1
The following is divided into two parts. The first provides summary statistics on firms’ self-reported investment activity, plans, priorities and needs, as well as the short and long-term drivers of their investment decisions. The second examines how firms finance investment, whether they are finance-constrained, and their satisfaction with the financing conditions they are able to obtain. In each section we present some simple preliminary analyses to explore questions arising from the data: How do short-term drivers affect the type of investment firms prioritise? How does the size of the investment gap reported by firms relate to the quality of their capital stock? How does banks’ balance sheet health pass through to firms’ investment financing? Do firms want a different finance mix? Is investment finance directed to the most productive firms? Two boxes examine the impact of the UK’s decision to leave the EU, and the calculation of firm-level total factor productivity.
3.2. Investment activity, outlook and drivers
3.2.1. Investment activity72% of firms invested in 2015,2 with Finland, Germany, Slovenia and the UK pulling up the average. The median investment outlay of firms was EUR 2,100 per employee.3 Investment performance in Finland, Germany, Slovenia and the UK clearly outpaced that in Greece, Italy and Portugal in 2015. The first group showed both a higher share of firms with positive investment spending and higher investment outlays per employee. That is, in 2015, there were not only relatively more firms investing in Finland, Germany, Slovenia and the UK than in Greece, Italy and Portugal but those firms also tended to spend relatively more on their investment activities. If we take into account that capital inputs tend to
1 More information on the survey and data will be made available on www.eib.org/eibis2 We set the minimum threshold for a firm to be considered investing at EUR 500 per employee.3 In the survey, investment is defined as spending on land, business buildings and infrastructure, machinery and equipment, research and development; software,
data, IT networks and website activities; training of employees; organisation and business process improvements with the intention of maintaining or increasing a company’s future earnings.

Gross fixed investment and intangible capital PART I 107
European Investment Bank Investment and Investment Finance in Europe
be more expensive in Finland, Germany and the UK than in Greece, Portugal, or Slovenia, the differences in investment outlays per employee become somewhat less pronounced (with the notable exception of Slovenia, which stands out even more after the adjustment); yet the overall picture – with one group of countries outpacing the other in terms of investment activities – remains unchanged.
Figure 1 Firm investment activity
Share of firms investing Investment intensityInvestment intensity PPP
0.0
0.2
0.4
0.6
0.8
1.0
0
1000
2000
3000
4000
5000
6000
7000
8000
All
Finl
and
Ger
man
y
Gre
ece
Italy
Port
ugal
Slov
enia UK
cons
truc
tion
infra
man
ufac
turin
g
serv
ices
larg
e
med
ium
smal
l
mic
ro
0
1000
2000
3000
4000
5000
6000
7000
8000
Shar
e of
firm
s
EUR
per e
mpl
oyee
Base: All firms (excluding don’t know/refused responses). The columns indicate the proportion of firms that have invested (at least EUR 500 per employee) in the last financial year. The red dash line indicates the value of the investment intensity. It is defined as the median of investment relative to the number of employees of investing firms. The green diamond adjusts firms’ investment intensity using Eurostat capital input PPPs.
Unsurprisingly, the infrastructure sector leads in terms of investment outlays per employee. The share of firms investing was relatively similar across sectors (coming in at around 75% in all cases in 2015). The main difference was firms’ investment intensity: firms active in the typically capital-intensive infrastructure sector invested, on average, four times more than firms in the service and construction sectors and three times more than firms active in the manufacturing sector. This can be explained, at least in part, by differences in capital intensity across sectors.4
Investment activities are correlated with size, with micro firms investing least per employee. The share of firms investing increases with firm size. While in 2015, 66% of micro firms recorded positive investment outlays, the same is true for 87% of large firms. The difference between micro and large is even more pronounced if we focus on investment intensity: while the median investment outlay of SMEs amounted to some EUR 2,600 per employee in 2015, large firms spent more than twice as much (that is, approximately EUR 5,700 per employee). This discrepancy between smaller companies and larger ones is particularly pronounced in countries with a challenging investment environment. For example, while the difference in median investment outlays of small and large firms in Italy was nearly 100% in 2015, the same difference in Germany amounted to less than 50%.5
More productive firms tend to invest more. A simple regression analysis of firms’ investment intensity on their total factor productivity (controlling for country, sector, size, and age as well as differences in firms’ levels of capacity utilisation) shows a positive and statistically significant correlation between the
4 Differences in the relative importance of capital-intensive industries can also explain some of the cross-country differences.5 The same holds true for firms in Portugal or Slovenia and also the UK; the only exception is Greece, where investment outlays are fairly depressed even for larger
companies.

PART I Gross fixed investment and intangible capital108
Investment and Investment Finance in Europe European Investment Bank
two variables.6 While more productive firms tend to invest more in all countries, the extent to which this is true varies: we find a relatively strong link between the two variables in Finland, Italy and Slovenia and a relatively weak one in Portugal and the UK – raising the question of what factors determine whether a (productive) firm can pursue its investment aspirations or not. (We explore the role of finance in this context in Box 4. A much more profound analysis of this question is provided in Chapter 6 of this publication).
Figure 2 Firm investment by type
0.0
0.2
0.4
0.6
0.8
1.0
M&ER&D
TrainingProcess improvements
Land, buildings and infra
Software, Data, IT
All
Finlan
d
Germ
any
Gree
ce
Italy
Portu
gal
Slove
nia UK
cons
tructi
on infra
man
ufac
turin
g
serv
ices
large
med
ium small
micr
o
Ave
rage
inve
stm
ent s
hare
Base: All firms that have invested in the last financial year (excluding don’t know/ refused responses) Q. In the last financial year, how much did your business invest in each of the following with the intention of maintaining or increasing your company’s future earnings?
The breakdown of investments by type largely reflects expected differences between sectors. Firms’ investments are largely concentrated in machinery and equipment, which make up on average 42% of all investment outlays. This share is higher in capital-intensive sectors (such as infrastructure and construction). Investments in software, data, IT networks and website activities constitute the second most important area of firms’ investment activities (19%). In particular, service sector firms in Greece allocate a large share of their investment outlays to the modernisation of their businesses (on average 50% of investment outlays). The average share of investment in training activities is driven primarily by micro firms, whereas investments in land, business buildings and infrastructure play a more important role for larger firms. Investments in organisation and business process improvements play an important role primarily among firms in those countries which show an, on average, somewhat weaker investment climate (that is, in particular, Greece, Italy and Portugal).
6 We estimate a linear regression model of firms’ investment outlays over the number of employees on their total factor productivity (see Box 1 for more details on TFP) plus a set of control variables. The control variables include a dummy indicating whether a firm produces at or above maximum capacity and a set of dummies at the country, sector, size and age level. We winsorize our dependent variable at the 98% level in order to reduce the impact of outliers.
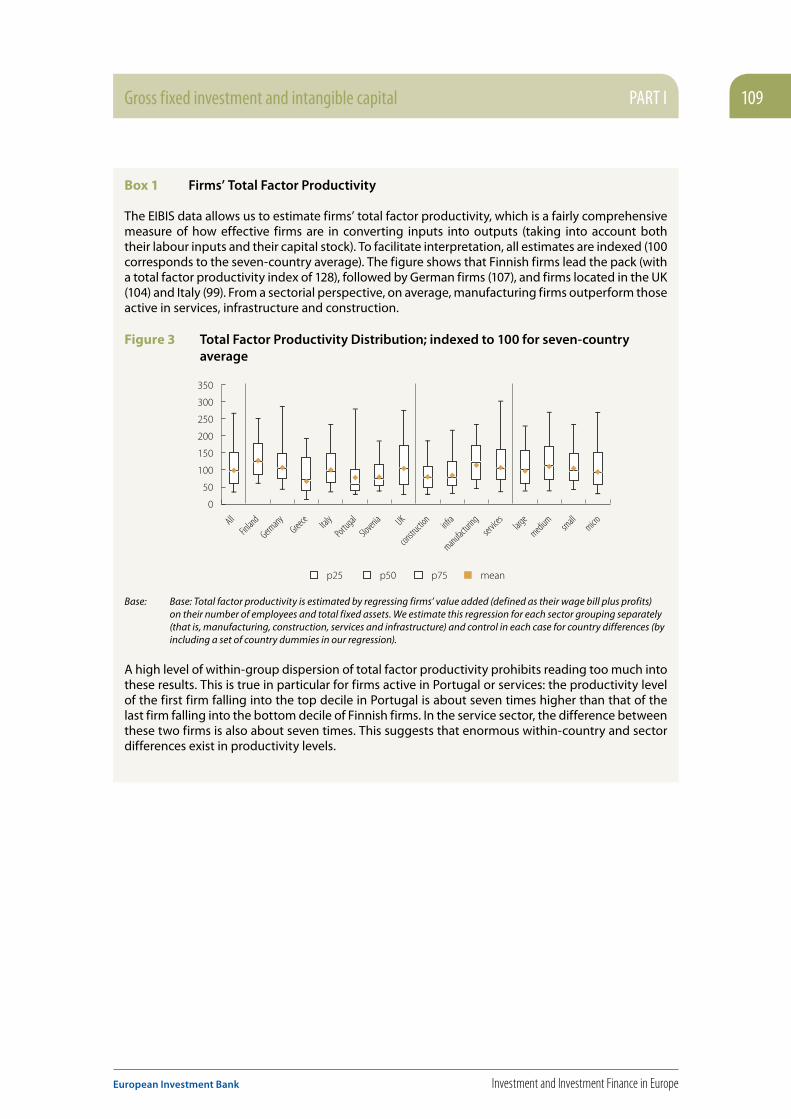
Gross fixed investment and intangible capital PART I 109
European Investment Bank Investment and Investment Finance in Europe
Box 1 Firms’ Total Factor Productivity
The EIBIS data allows us to estimate firms’ total factor productivity, which is a fairly comprehensive measure of how effective firms are in converting inputs into outputs (taking into account both their labour inputs and their capital stock). To facilitate interpretation, all estimates are indexed (100 corresponds to the seven-country average). The figure shows that Finnish firms lead the pack (with a total factor productivity index of 128), followed by German firms (107), and firms located in the UK (104) and Italy (99). From a sectorial perspective, on average, manufacturing firms outperform those active in services, infrastructure and construction.
Figure 3 Total Factor Productivity Distribution; indexed to 100 for seven-country average
Total Factor Productivity Distribution
AllFin
land
Germany
Greece Ital
y
Portugal
Slovenia UK
constructio
ninfra
manufacturing
service
slarg
e
mediumsm
allmicro
350
300
250
200
150
100
50
0
p25 p50 p75 mean
Base: Base: Total factor productivity is estimated by regressing firms’ value added (defined as their wage bill plus profits) on their number of employees and total fixed assets. We estimate this regression for each sector grouping separately (that is, manufacturing, construction, services and infrastructure) and control in each case for country differences (by including a set of country dummies in our regression).
A high level of within-group dispersion of total factor productivity prohibits reading too much into these results. This is true in particular for firms active in Portugal or services: the productivity level of the first firm falling into the top decile in Portugal is about seven times higher than that of the last firm falling into the bottom decile of Finnish firms. In the service sector, the difference between these two firms is also about seven times. This suggests that enormous within-country and sector differences exist in productivity levels.

PART I Gross fixed investment and intangible capital110
Investment and Investment Finance in Europe European Investment Bank
3.2.2. Investment outlook for 2016 For 2016, the survey results suggest a modest improvement in investment activity in our seven countries (vis-à-vis 2015). 31% of firms expect to expand their investment activities; 40% expect them to remain the same; and 29% expect a contraction in investment activities vis-à-vis the previous year. On balance, therefore, the share of firms with a positive investment outlook slightly outweighs the share of firms with a negative one (+2%).
Figure 4 Firms’ investment outlook
0%
10%
20%
30%
40%
50%
60%
70%
80%
90%
100%
Remains the same ContractionExpansion
All
Finlan
d
Germ
any
Gree
ce
Italy
Portu
gal
Slove
nia UK
cons
tructi
on infra
man
ufac
turin
g
serv
ices
large
med
ium small
micr
o
Shar
e of
firm
s
Base: All firms (excluding don’t know/refused responses). Data is derived from two questions: firms that had invested in the last financial year were asked if they expected to invest more, around the same amount or less than last year; firms that had not invested in the last financial year were asked if they had already invested, or expected to invest in the current year.
Figure 5 Firms’ investment outlook. Share of positive views minus share of negative views
-0.20
-0.15
-0.10
-0.05
-0.00
0.05
0.10
0.15
All
Finlan
d
Germ
any
Gree
ce
Italy
Portu
gal
Slove
nia UK
cons
tructi
on infra
man
ufac
turin
g
serv
ices
large
med
ium small
micr
o
Base: All firms (excluding don’t know/refused responses). Data is derived from two questions: firms that had invested in the last financial year were asked if they expected to invest more, around the same amount or less than last year; firms that had not invested in the last financial year were asked if they had already invested, or expected to invest in the current year.

Gross fixed investment and intangible capital PART I 111
European Investment Bank Investment and Investment Finance in Europe
Figure 6 Investment cycle diagram. Quadrants are based on EU average
0.50 0.55 0.60 0.65 0.70 0.75 0.80 0.85 0.90 0.95 1.00-2.0
-1.5
-1.0
-0.5
0.0
0.5
1.0
1.5
2.0
GR
PT
IT
SERV MANF DE
SI
UKCONS FIN
INFR
Inve
stm
ent O
utlo
ok- N
et B
alan
ce
Share of firms investing in the last financial year
Investment Upswing Solid Investment Situation
Investment Drought Investment Downswing
Base: All firms (excluding don’t know/refused responses). The horizontal axis reports the share of firms investing (more than EUR 500) in the last financial year. The vertical axis reports the net balance for the investment outlook of 2016 (share of positive views minus share of negative views).
Investment performance is strong in Germany and Slovenia, with signs of recovery in Greece and Portugal. Firms in Germany and – to a lesser extent – Slovenia are notably most positive about their investment outlook (with net balances of +6.5% and +2%, respectively). With a relatively strong investment performance in 2015 already, this suggests that these two countries are in a sustained investment upswing. Firms in Greece and Portugal, on the other hand, are more aptly characterised as entering, or about to enter, an investment upswing, with a poor investment performance in 2015 but a positive share of firms anticipating increasing investment activities in 2016 (+8% and +1%).
Investment in Finland and the UK may be in for a contraction, and is yet to bottom out in Italy. Investment in Finnish and UK firms appears likely to contract in 2016 after a strong investment performance in 2015. They anticipate, on balance, weaker investment activities in 2016 (-5%; -2%, respectively). Firms in Italy remain in a relative investment slump: even after a year of low investment activities, firms do not expect an uptick in their investment activities in 2016. On the contrary, more firms expect to further reduce their investment activities than expect an expansion (-2.5%).
Figure 7 Firms’ investment outlook for the infrastructure sector. Share of positive views minus share of negative views.
-0.3
-0.2
-0.1
0.0
0.1
0.2
0.3
All
Finlan
d
Germ
any
Gree
ce
Italy
Portu
gal
Slove
nia UK
large
med
ium small
micr
o
Base: All firms in the infrastructure sector (excluding don’t know/refused responses). Data is derived from two questions: firms that had invested in the last financial year were asked if they expected to invest more, around the same amount or less than last year; firms that had not invested in the last financial year were asked if they had already invested, or expected to invest in the current year.

PART I Gross fixed investment and intangible capital112
Investment and Investment Finance in Europe European Investment Bank
Firms in the infrastructure sector are signaling a sharp investment downturn. On balance, firms active in the transport, energy, water and ICT sub-sectors (here summarised as the “infrastructure” sector) report that 2016 will see much weaker investment activities, after a strong investment performance in 2015. While part of this may be due to the nature of investment – where years with high investment activity in a sector are often followed by years with somewhat lower investment activity – the fairly consensual view of firms in the infrastructure sector across countries (with the notable exception of Portugal) suggests that more global factors may be at work.
Figure 8 Firms’ investment outlook for the manufacturing sector. Share of positive views minus share of negative views.
-0.3
-0.2
-0.1
0.0
0.1
0.2
0.3
All
Finlan
d
Germ
any
Gree
ce
Italy
Portu
gal
Slove
nia UK
large
med
ium small
micr
o
Base: All firms in the manufacturing sector (excluding don’t know/refused responses). Data is derived from two questions: firms that had invested in the last financial year were asked if they expect to invest more, around the same amount or less than last year; firms that had not invested in the last financial year were asked if they had already invested, or expect to invest in the current year.
Firms in manufacturing and services tend to be more positive about investment activities in 2016. However, while this is a positive signal, it would be premature to expect a strong stimulus from this. In particular in the manufacturing sector, the positive outlook is strongest among firms in Greece and Portugal, which start from relatively low levels of investment, suggesting that an expansion of their investment activities will most probably entail only a modest expansion of overall investment outlays. In addition, manufacturing firms across all countries see as their main investment priority for the coming years investment in replacement of existing buildings and machinery and in new products and processes (see below). Both of these items are associated with relatively low investment outlays.
3.2.3. Types of investment prioritised by firmsReplacement investments are the main priority for the next three years. Across all countries, firms tend to name replacement of existing buildings, machinery, equipment and IT as their principal investment priority for the coming years. About 40% of all firms in our sample name replacement as their most important area of investment. This is followed by about 20% of firms reporting investments in new products or processes as their investment priority, and another 20% of firms seeing their investment priority as capacity expansion.

Gross fixed investment and intangible capital PART I 113
European Investment Bank Investment and Investment Finance in Europe
Figure 9 Firms’ investment priorities for the next three years
0%
10%
20%
30%
40%
50%
60%
70%
80%
90%
100%
Capacity Expansion
New Products and Processes No Investment Planned
Replacement
All
Finlan
d
Germ
any
Gree
ce
Italy
Portu
gal
Slove
nia UK
cons
tructi
on infra
man
ufac
turin
g
serv
ices
large
med
ium small
micr
o
Shar
e of
firm
s
Base: Base: All firms (excluding those who have no investment planned/don’t know/refused responses). Q. Looking ahead to the next three years, which of the following is your investment priority (a) replacing existing buildings, machinery, equipment, IT (b) expanding capacity for existing products/services (c) developing or introducing new products, processes, services?
21% of firms expect no significant investment activities over the next three years. The share of firms expecting no investment activities in the next three years is relatively high in Portugal, Italy and Greece (between 25% and 30% of firms indicating no desire to invest). Interestingly, a substantial share of firms in the UK is also fairly conservative with respect to their longer-term investment activities (27%). On average half of all firms that have no investment plans for the next three years did not invest in the last financial year. Turning this around, this means that for about 40% of firms that did not invest in the last financial year, there is no improvement in sight; and, thus, investment is glued to the ground.
The purpose of investment can be related to the intensity of investment. A simple regression analysis shows that – all else being equal7 – firms’ investment outlays (per employee) tend to decrease as more of firms’ investment goes into the replacement of existing buildings, machinery, equipment and IT. It tends to increase modestly as firms start to pay more attention to investments in the development or introduction of new products, processes or services, and increases substantially as firms focus (relatively) more of their investment activities on capacity expansion. The general prioritisation of replacement investments for the coming three years, therefore, does not necessarily bode well for overall investment outlays.
7 We estimate a linear regression model of firms’ investment outlays over the number of employees on the share of their investment that goes into capacity expansion, replacement, and new products and services, respectively, plus a set of control variables. The control variables include a dummy indicating whether a firm produces at or above maximum capacity and a set of control dummies at the country, sector, size and age level. We winsorize our dependent variable at the 98% level in order to reduce the impact of outliers.

PART I Gross fixed investment and intangible capital114
Investment and Investment Finance in Europe European Investment Bank
Box 2 How do short-term drivers affect the type of investment firms prioritise?
The intensity of investment by firms is correlated with the main purpose of investment, as described above. The prioritisation of the replacement of existing buildings, machinery, equipment and IT tends to be associated with lower investment outlays (per employee). Investment intensity increases modestly when priority is given to the development of new products, processes or services, and substantially as firms focus (relatively) more of their investment activities on capacity expansion.
Firms’ investment priorities are, in turn, very sensitive to their perceptions of the business outlook in their specific sector. This can be shown by regressing firms’ share of investment that goes into i) capacity expansion; ii) replacement of existing buildings, machinery, equipment and IT; and iii) the development or introduction of new products, processes or services, each on their perception of sector-specific business prospects, the overall economic climate and a series of controls (see Appendix). This shows that capacity expansion and investment in new products and processes tend to decrease in relative importance as firms’ business outlook worsens while the share of investment going into the replacement of existing buildings and machinery increases.
This suggests a clear substitution pattern in firms’ investment activities, away from capacity expansion and innovation and towards replacement, as firms’ business outlook worsens. Investments in capacity expansion may be particularly sensitive to firms’ business outlook because they are often fairly lumpy (and thus large scale), much more so than more continuous investments needed to replace existing buildings, machinery, equipment and IT, for example. Similarly, the high risk of investments in new products and processes means that firms are often only willing to carry them out if they are reasonably confident that the market situation will allow them to deal with potential setbacks – making this type of investment (again) much more sensitive to firms’ business outlook than replacement investments. This implies that it may be optimistic to expect firms to “innovate themselves out of a crisis”; innovation appears to be more likely as a response to a positive sector outlook, than to a negative one.
3.2.4. Investment needsOn balance, firms consider their past investment activities to have been too low. Looking back at their investment activities over the past three years, 16% of firms state that their investment activities were too low to ensure the success of their business going forward; 80% state that their investments were in line with needs; and 4% state that their investment activities exceeded needs. The balance between those that consider their past investment activities to have been too high and those that consider them too low is therefore negative (-12%).

Gross fixed investment and intangible capital PART I 115
European Investment Bank Investment and Investment Finance in Europe
Figure 10 Firms’ self-perceived investment gap
0%
10%
20%
30%
40%
50%
60%
70%
80%
90%
100%
about right too littletoo much
All
Finlan
d
Germ
any
Gree
ce
Italy
Portu
gal
Slove
nia UK
cons
tructi
on infra
man
ufac
turin
g
serv
ices
large
med
ium small
micr
o
Shar
e of
firm
s
Base: All firms (excluding don’t know/refused responses). Q. Looking back at your investment over the last three years, was it too much, too little, or about the right amount to ensure the success of your business going forward?
This perceived investment gap is largest in Portugal, Greece, Slovenia and the UK. With a net balance of -5% and -6%, the investment gap is smallest in Finland and Germany. Despite a good investment performance in 2015, firms in Slovenia still report a fairly large investment gap (-25%) suggesting that they see a (continued) need to catch up after a relatively weak post-crisis investment performance. Firms in Greece and Portugal are in a similar situation (to firms in Slovenia): on the one hand, they tend to report a relatively large (self-perceived) investment gap (-28% and -20%, respectively); on the other, they hold a fairly positive investment outlook (giving hope for a narrowing of their investment gap over the coming years). Things look less promising for firms in the UK and Italy, where a large share of firms report an investment gap (-15% and -12%, respectively) and a fairly negative investment outlook at the same time.
Figure 11 Firms’ self-perceived investment gap. Share of positive views minus share of negative views.
-0.30
-0.25
-0.20
-0.15
-0.10
-0.05
0.00
All
Finlan
d
Germ
any
Gree
ce
Italy
Portu
gal
Slove
nia UK
cons
tructi
on infra
man
ufac
turin
g
serv
ices
large
med
ium small
micr
o
Base: All firms (excluding don’t know/refused responses). Q. Looking back at your investment over the last three years, was it too much, too little, or about the right amount to ensure the success of your business going forward?
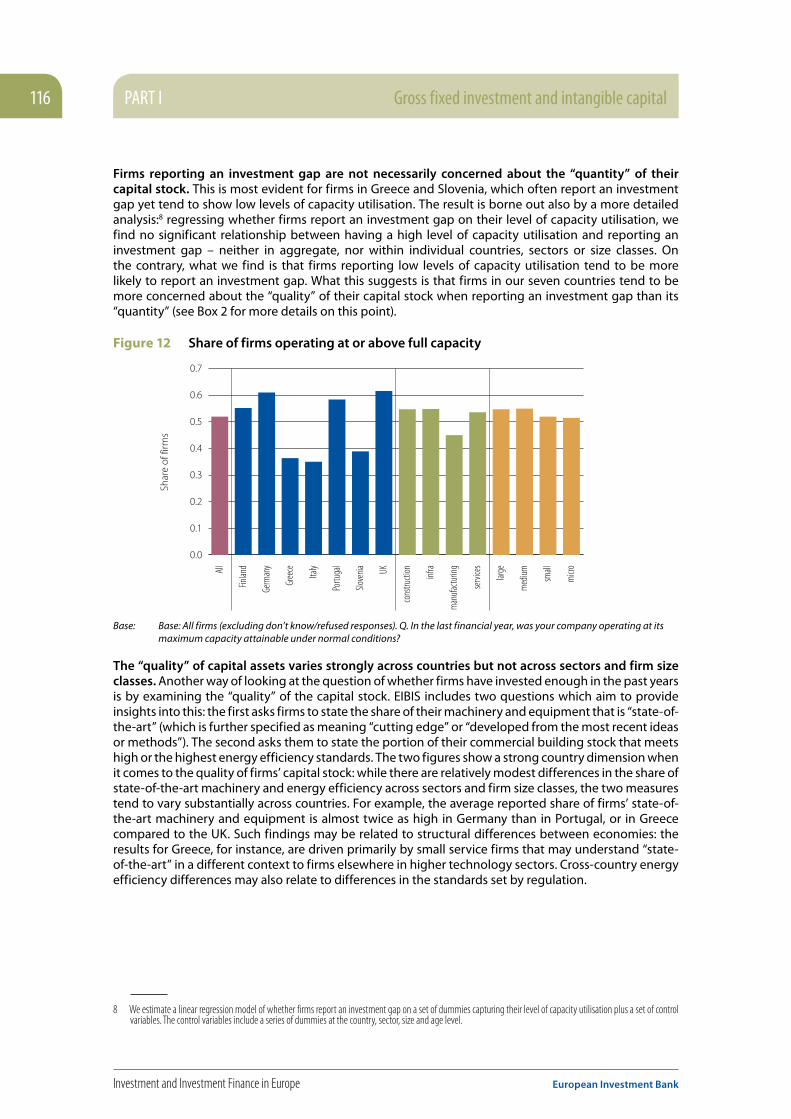
PART I Gross fixed investment and intangible capital116
Investment and Investment Finance in Europe European Investment Bank
Firms reporting an investment gap are not necessarily concerned about the “quantity” of their capital stock. This is most evident for firms in Greece and Slovenia, which often report an investment gap yet tend to show low levels of capacity utilisation. The result is borne out also by a more detailed analysis:8 regressing whether firms report an investment gap on their level of capacity utilisation, we find no significant relationship between having a high level of capacity utilisation and reporting an investment gap – neither in aggregate, nor within individual countries, sectors or size classes. On the contrary, what we find is that firms reporting low levels of capacity utilisation tend to be more likely to report an investment gap. What this suggests is that firms in our seven countries tend to be more concerned about the “quality” of their capital stock when reporting an investment gap than its “quantity” (see Box 2 for more details on this point).
Figure 12 Share of firms operating at or above full capacity
0.0
0.1
0.2
0.3
0.4
0.5
0.6
0.7
All
Finlan
d
Germ
any
Gree
ce
Italy
Portu
gal
Slove
nia UK
cons
tructi
on infra
man
ufac
turin
g
serv
ices
large
med
ium small
micr
o
Shar
e of
firm
s
Base: Base: All firms (excluding don’t know/refused responses). Q. In the last financial year, was your company operating at its maximum capacity attainable under normal conditions?
The “quality” of capital assets varies strongly across countries but not across sectors and firm size classes. Another way of looking at the question of whether firms have invested enough in the past years is by examining the “quality” of the capital stock. EIBIS includes two questions which aim to provide insights into this: the first asks firms to state the share of their machinery and equipment that is “state-of-the-art” (which is further specified as meaning “cutting edge” or “developed from the most recent ideas or methods”). The second asks them to state the portion of their commercial building stock that meets high or the highest energy efficiency standards. The two figures show a strong country dimension when it comes to the quality of firms’ capital stock: while there are relatively modest differences in the share of state-of-the-art machinery and energy efficiency across sectors and firm size classes, the two measures tend to vary substantially across countries. For example, the average reported share of firms’ state-of-the-art machinery and equipment is almost twice as high in Germany than in Portugal, or in Greece compared to the UK. Such findings may be related to structural differences between economies: the results for Greece, for instance, are driven primarily by small service firms that may understand “state-of-the-art” in a different context to firms elsewhere in higher technology sectors. Cross-country energy efficiency differences may also relate to differences in the standards set by regulation.
8 We estimate a linear regression model of whether firms report an investment gap on a set of dummies capturing their level of capacity utilisation plus a set of control variables. The control variables include a series of dummies at the country, sector, size and age level.

Gross fixed investment and intangible capital PART I 117
European Investment Bank Investment and Investment Finance in Europe
Figure 13 Firms' average share of state-of-the-art machinery and equipment
0
10
20
30
40
50
60
70
All
Finlan
d
Germ
any
Gree
ce
Italy
Portu
gal
Slove
nia UK
cons
tructi
on infra
man
ufac
turin
g
serv
ices
large
med
ium small
micr
o
Ave
rage
sha
re
Base: Base: All firms (excluding don’t know/refused responses). Q. What proportion, if any, of your machinery and equipment, including ICT, would you say is state-of-the-art?
Firms reporting an investment gap tend to report a lower “quality” of their capital assets. Looking at the correlation between whether or not firms report an investment gap and their share of state-of-the-art machinery and equipment / their share of commercial building stock that meets high energy efficiency standards, we find a high level of inter-dependency: that is, firms with an investment gap tend to report significantly lower levels of state-of-the-art machinery and equipment as well as energy efficient buildings stock. This suggests that if firms report an investment gap, what they are often concerned about is the “quality” of their capital stock (Box 2 provides a more detailed analysis on this question).
Figure 14 Firms' average share of energy efficient commercial building stock (self-reported)
0
10
20
30
40
50
60
70
All
Finlan
d
Germ
any
Gree
ce
Italy
Portu
gal
Slove
nia UK
cons
tructi
on infra
man
ufac
turin
g
serv
ices
large
med
ium small
micr
o
Ave
rage
sha
re
Base: Base: All firms (excluding don’t know/refused responses). Q. What proportion, if any, of your commercial building stock meets high or the highest energy efficiency standards?
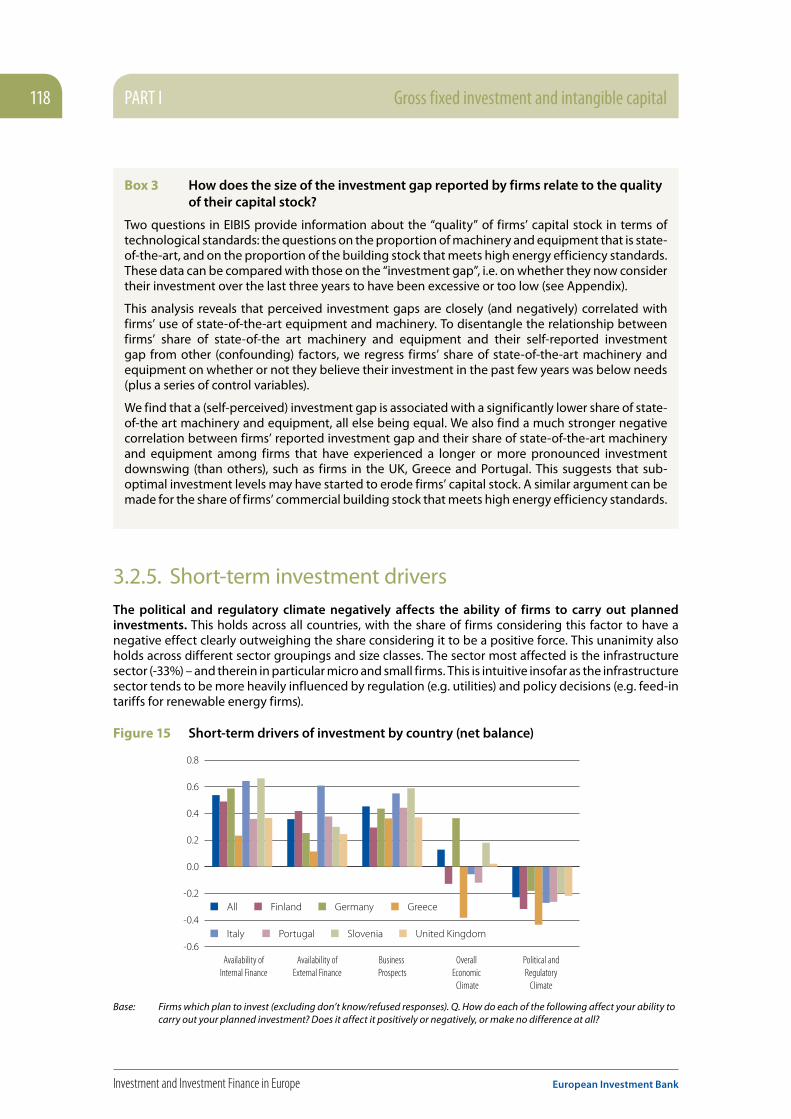
PART I Gross fixed investment and intangible capital118
Investment and Investment Finance in Europe European Investment Bank
Box 3 How does the size of the investment gap reported by firms relate to the quality of their capital stock?
Two questions in EIBIS provide information about the “quality” of firms’ capital stock in terms of technological standards: the questions on the proportion of machinery and equipment that is state-of-the-art, and on the proportion of the building stock that meets high energy efficiency standards. These data can be compared with those on the “investment gap”, i.e. on whether they now consider their investment over the last three years to have been excessive or too low (see Appendix).
This analysis reveals that perceived investment gaps are closely (and negatively) correlated with firms’ use of state-of-the-art equipment and machinery. To disentangle the relationship between firms’ share of state-of-the art machinery and equipment and their self-reported investment gap from other (confounding) factors, we regress firms’ share of state-of-the-art machinery and equipment on whether or not they believe their investment in the past few years was below needs (plus a series of control variables).
We find that a (self-perceived) investment gap is associated with a significantly lower share of state-of-the art machinery and equipment, all else being equal. We also find a much stronger negative correlation between firms’ reported investment gap and their share of state-of-the-art machinery and equipment among firms that have experienced a longer or more pronounced investment downswing (than others), such as firms in the UK, Greece and Portugal. This suggests that sub-optimal investment levels may have started to erode firms’ capital stock. A similar argument can be made for the share of firms’ commercial building stock that meets high energy efficiency standards.
3.2.5. Short-term investment driversThe political and regulatory climate negatively affects the ability of firms to carry out planned investments. This holds across all countries, with the share of firms considering this factor to have a negative effect clearly outweighing the share considering it to be a positive force. This unanimity also holds across different sector groupings and size classes. The sector most affected is the infrastructure sector (-33%) – and therein in particular micro and small firms. This is intuitive insofar as the infrastructure sector tends to be more heavily influenced by regulation (e.g. utilities) and policy decisions (e.g. feed-in tariffs for renewable energy firms).
Figure 15 Short-term drivers of investment by country (net balance)
Germany GreeceAll Finland
Slovenia United KingdomItaly Portugal-0.6
-0.4
-0.2
0.0
0.2
0.4
0.6
0.8
Availability ofInternal Finance
Business Prospects
Overall Economic
Climate
Political and Regulatory
Climate
Availability ofExternal Finance
Base: Firms which plan to invest (excluding don’t know/refused responses). Q. How do each of the following affect your ability to carry out your planned investment? Does it affect it positively or negatively, or make no difference at all?
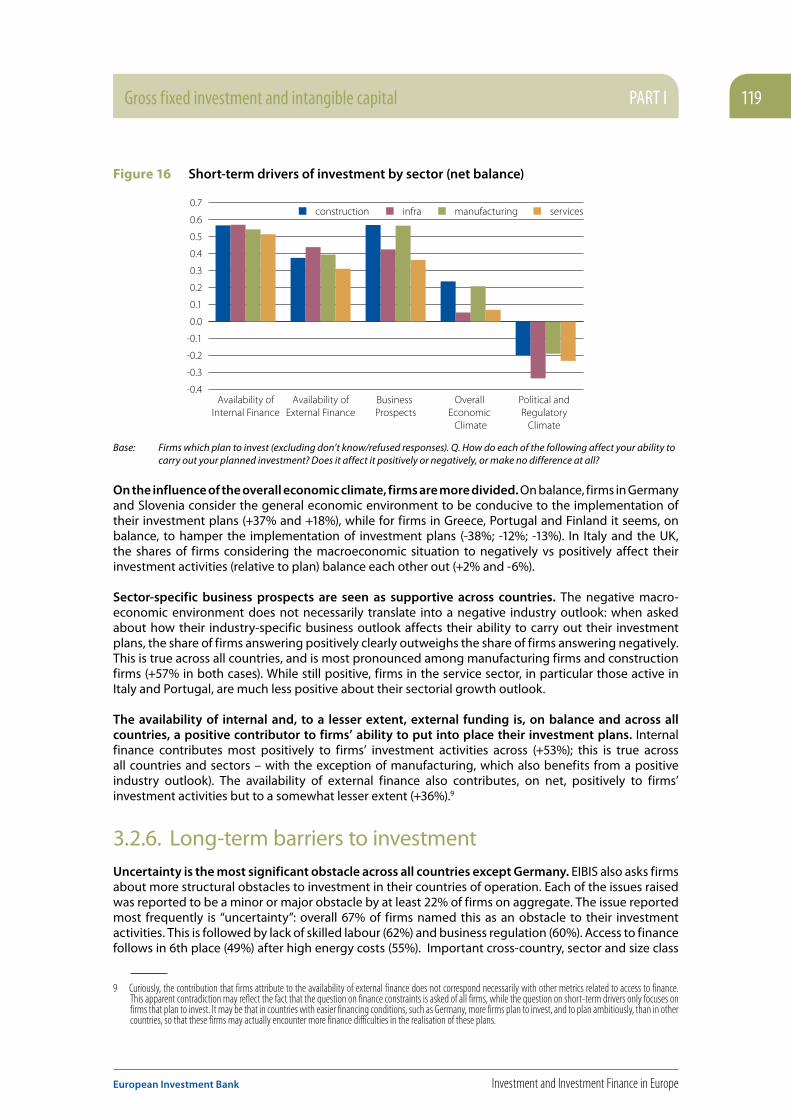
Gross fixed investment and intangible capital PART I 119
European Investment Bank Investment and Investment Finance in Europe
Figure 16 Short-term drivers of investment by sector (net balance)
manufacturing servicesconstruction infra
-0.4
-0.3
-0.2
-0.1
0.0
0.1
0.2
0.3
0.4
0.5
0.6
0.7
Availability ofInternal Finance
Business Prospects
Overall Economic
Climate
Political and Regulatory
Climate
Availability ofExternal Finance
Base: Firms which plan to invest (excluding don’t know/refused responses). Q. How do each of the following affect your ability to carry out your planned investment? Does it affect it positively or negatively, or make no difference at all?
On the influence of the overall economic climate, firms are more divided. On balance, firms in Germany and Slovenia consider the general economic environment to be conducive to the implementation of their investment plans (+37% and +18%), while for firms in Greece, Portugal and Finland it seems, on balance, to hamper the implementation of investment plans (-38%; -12%; -13%). In Italy and the UK, the shares of firms considering the macroeconomic situation to negatively vs positively affect their investment activities (relative to plan) balance each other out (+2% and -6%).
Sector-specific business prospects are seen as supportive across countries. The negative macro-economic environment does not necessarily translate into a negative industry outlook: when asked about how their industry-specific business outlook affects their ability to carry out their investment plans, the share of firms answering positively clearly outweighs the share of firms answering negatively. This is true across all countries, and is most pronounced among manufacturing firms and construction firms (+57% in both cases). While still positive, firms in the service sector, in particular those active in Italy and Portugal, are much less positive about their sectorial growth outlook.
The availability of internal and, to a lesser extent, external funding is, on balance and across all countries, a positive contributor to firms’ ability to put into place their investment plans. Internal finance contributes most positively to firms’ investment activities across (+53%); this is true across all countries and sectors – with the exception of manufacturing, which also benefits from a positive industry outlook). The availability of external finance also contributes, on net, positively to firms’ investment activities but to a somewhat lesser extent (+36%).9
3.2.6. Long-term barriers to investmentUncertainty is the most significant obstacle across all countries except Germany. EIBIS also asks firms about more structural obstacles to investment in their countries of operation. Each of the issues raised was reported to be a minor or major obstacle by at least 22% of firms on aggregate. The issue reported most frequently is “uncertainty”: overall 67% of firms named this as an obstacle to their investment activities. This is followed by lack of skilled labour (62%) and business regulation (60%). Access to finance follows in 6th place (49%) after high energy costs (55%). Important cross-country, sector and size class
9 Curiously, the contribution that firms attribute to the availability of external finance does not correspond necessarily with other metrics related to access to finance. This apparent contradiction may reflect the fact that the question on finance constraints is asked of all firms, while the question on short-term drivers only focuses on firms that plan to invest. It may be that in countries with easier financing conditions, such as Germany, more firms plan to invest, and to plan ambitiously, than in other countries, so that these firms may actually encounter more finance difficulties in the realisation of these plans.
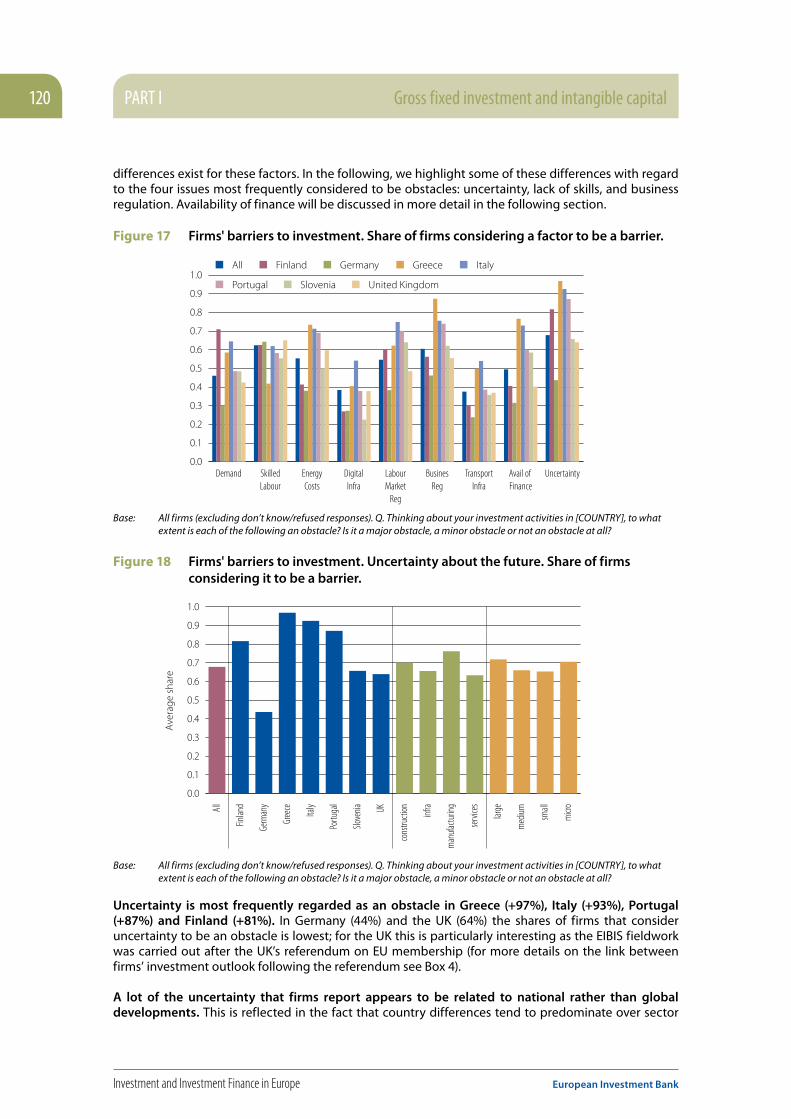
PART I Gross fixed investment and intangible capital120
Investment and Investment Finance in Europe European Investment Bank
differences exist for these factors. In the following, we highlight some of these differences with regard to the four issues most frequently considered to be obstacles: uncertainty, lack of skills, and business regulation. Availability of finance will be discussed in more detail in the following section.
Figure 17 Firms' barriers to investment. Share of firms considering a factor to be a barrier.
Demand
Germany GreeceAll Finland
Slovenia United Kingdom
Italy
Portugal
0.0
0.1
0.2
0.3
0.4
0.5
0.6
0.7
0.8
0.9
1.0
DigitalInfra
LabourMarket
Reg
BusinesReg
TransportInfra
SkilledLabour
EnergyCosts
Avail of Finance
Uncertainty
Base: All firms (excluding don’t know/refused responses). Q. Thinking about your investment activities in [COUNTRY], to what extent is each of the following an obstacle? Is it a major obstacle, a minor obstacle or not an obstacle at all?
Figure 18 Firms' barriers to investment. Uncertainty about the future. Share of firms considering it to be a barrier.
0.0
0.1
0.2
0.3
0.4
0.5
0.6
0.7
0.8
0.9
1.0
All
Finlan
d
Germ
any
Gree
ce
Italy
Portu
gal
Slove
nia UK
cons
tructi
on infra
man
ufac
turin
g
serv
ices
large
med
ium small
micr
o
Ave
rage
sha
re
Base: All firms (excluding don’t know/refused responses). Q. Thinking about your investment activities in [COUNTRY], to what extent is each of the following an obstacle? Is it a major obstacle, a minor obstacle or not an obstacle at all?
Uncertainty is most frequently regarded as an obstacle in Greece (+97%), Italy (+93%), Portugal (+87%) and Finland (+81%). In Germany (44%) and the UK (64%) the shares of firms that consider uncertainty to be an obstacle is lowest; for the UK this is particularly interesting as the EIBIS fieldwork was carried out after the UK’s referendum on EU membership (for more details on the link between firms’ investment outlook following the referendum see Box 4).
A lot of the uncertainty that firms report appears to be related to national rather than global developments. This is reflected in the fact that country differences tend to predominate over sector

Gross fixed investment and intangible capital PART I 121
European Investment Bank Investment and Investment Finance in Europe
differences. For example, the highest share of firms naming uncertainty as a barrier to investment is in the Greek construction sector, followed by the Greek infrastructure, service and manufacturing sectors in that order. Subsequently, we find the Italian construction sector, followed by the Italian manufacturing, infrastructure and service sectors. The chain of sectors continues in this manner, with sectors within each country tracking each other very closely in their responses.
Unavailability of skilled staff is considered to be an obstacle by more than half of firms – except in Greece. The fact that firms in Greece are relatively unconcerned about the availability of skilled labour for their investment activities is unsurprising given the still very high levels of unemployment (23%) and youth unemployment (50%) in the country. At the same time, this result is somewhat comforting insofar as prolonged periods of high unemployment often translate into skill mismatches (as unemployed workers start losing their skills and the most skilled tend to leave the country (see, for example, Pissarides, 1992), which does not (yet) seem to be the case at a level that affects firms’ investment activities.
Figure 19 Firms' barriers to investment. Lack of skilled labour. Share of firms considering it to be a barrier.
0.0
0.1
0.2
0.3
0.4
0.5
0.6
0.7
0.8
All
Finlan
d
Germ
any
Gree
ce
Italy
Portu
gal
Slove
nia UK
cons
tructi
on infra
man
ufac
turin
g
serv
ices
large
med
ium small
micr
o
Ave
rage
sha
re
Base: All firms (excluding don’t know/refused responses). Q. Thinking about your investment activities in [COUNTRY], to what extent is each of the following an obstacle? Is it a major obstacle, a minor obstacle or not an obstacle at all?
Lack of skilled labour is more of an issue for larger firms and firms active in manufacturing and construction. The situation is most tense among medium-sized and large construction companies in Finland and manufacturing firms in the UK (where employers traditionally have to compete for talent with the high tech sector and financial sector, respectively).
Lack of skilled staff is the most severe barrier to investment in Germany. 64% of firms there regard this as an obstacle. There are likely to be various drivers at work: most importantly, Germany is very close to full employment, generally considered to be the case when the unemployment rate hits 4-6% in industrialised countries. In addition, due to demographic changes, Germany's overall workforce may have begun to shrink already. Over the next few years, this trend is expected to continue and lead to a decrease in the workforce by as much as 16% by 2030 (putting further pressure on employers to secure talent early). Some German companies are reported to be capitalising on weakness around Europe to hire foreign staff, although employers say that language and other issues limit their ability to fill the gap this way.10
There are significant cross-country differences in firms’ perceptions of business regulation. On the one hand, firms in Greece, Italy and Portugal perceive business regulation to be the most important
10 http://www.wsj.com/articles/germany-grapples-with-growing-shortage-of-skilled-labor-1402064223

PART I Gross fixed investment and intangible capital122
Investment and Investment Finance in Europe European Investment Bank
barrier to investment (after uncertainty); on the other hand firms in Germany, Finland, and the UK are much more benign about business regulation. In Germany less than half of all firms consider business regulation to be an issue; in Finland and the UK, this share is just over 50% (at 55% and 56%, respectively). Firms in Slovenia fall somewhere between the two camps. The highest shares of firms considering business regulation to be an obstacle are reported in the Greek infrastructure sector (92% of all firms), the Greek services sector (87%), the manufacturing and construction sectors (84%), followed by the Portuguese infrastructure sector (83%), the Italian services sector (81%) and the Italian construction sector (79%). At the other end of the spectrum are the German (37% of firms) and Finnish services sectors (51%).11
Figure 20 Firms' barriers to investment. Business regulation. Share of firms considering it to be a barrier.
0.0
0.1
0.2
0.3
0.4
0.5
0.6
0.7
0.8
0.9
1.0
All
Finlan
d
Germ
any
Gree
ce
Italy
Portu
gal
Slove
nia UK
cons
tructi
on infra
man
ufac
turin
g
serv
ices
large
med
ium small
micr
o
Ave
rage
sha
re
Base: All firms (excluding don’t know/refused responses). Q. Thinking about your investment activities in [COUNTRY], to what extent is each of the following an obstacle? Is it a major obstacle, a minor obstacle or not an obstacle at all?
11 The correlation between uncertainty and business regulation is relatively mild at 0.4

Gross fixed investment and intangible capital PART I 123
European Investment Bank Investment and Investment Finance in Europe
Box 4 Brexit and Firm Investment
EIBIS asked firms how the UK’s exit from the European Union is likely to affect their investment activities in the coming year.
Given the time sensitivity of the question, the results from this question were updated with the arrival of new data for 14 countries. All interviews took place between July and October 2016; that is, the months directly following the referendum.
Most firms in our sample reported that they do not expect the outcome of the Brexit referendum to affect their investment activities in a significant way (81% of firms). This may partially reflect the fact that for many firms, investment decisions depend mostly on domestic economic activity and/or exports to other EU countries, which they do not expect to suffer much from the outcome of the referendum. In part, the results may reflect the fact that the outcome of the referendum has brought no immediate change to the relationship between the UK and the European Union so far.
Figure 21 Effect of Brexit referendum on investment activities
0
10
20
30
40
50
60
70
80
90
100
Positive No ImpactUncertain Negative
All
Austr
iaBu
lgaria
Croati
aCy
prus
Denm
arkEs
tonia
Finlan
dGe
rman
yGr
eece
Hung
ary
Irelan
dIta
lyLa
tvia
Lithu
ania
Malt
aPo
rtuga
lRo
man
iaSlo
venia
Spain
Swed
en UKco
nstru
ction infra
man
ufac
turin
gse
rvice
slar
gem
edium sm
allm
icro
Shar
e of
firm
s
Base: All firms (excluding don’t know/refused responses). Q.: How do you expect the outcome of the UK referendum on EU membership to affect your investment activities in the coming year?
A small – but noteworthy – share of firms (11%) expects the outcome of the referendum to have a negative effect on their investment activities. A still smaller share of firms expects the Brexit referendum to have a positive impact (approximately 3% of all firms in our sample).
In general, countries with a high share of "negatives" either tend to also have a relatively high share of "positives" (and uncertainty), indicating that, in countries with strong trade links, there are winners and losers from the Brexit referendum, or tend to fall into the group of countries with significant economic headwinds. Ireland, Cyprus and Malta can be placed in the first category; Greece, Portugal and Finland in the second.
Firms in the UK are most divided on the likely effect of the referendum outcome: both the share of firms expecting a negative effect from the EU referendum and the share of firms expecting a positive effect are among the highest for the UK. About 24% of UK firms expect a negative effect; 8% of firms – primarily micro firms – expect a positive effect.

PART I Gross fixed investment and intangible capital124
Investment and Investment Finance in Europe European Investment Bank
Figure 22 Effect of Brexit referendum on investment activities: difference between the share of firms expecting a positive effect and the share of firms expecting a negative effect.
-45
-40
-35
-30
-25
-20
-15
-10
-5
0
All
Austr
iaBu
lgaria
Croati
aCy
prus
Denm
arkEs
tonia
Finlan
dGe
rman
yGr
eece
Hung
ary
Irelan
dIta
lyLa
tvia
Lithu
ania
Malt
aPo
rtuga
lRo
man
iaSlo
venia
Spain
Swed
en UKco
nstru
ction infra
man
ufac
turin
gse
rvice
slar
gem
edium sm
allm
icro
Base: All firms (excluding don’t know/refused responses). Q.: How do you expect the outcome of the UK referendum on EU membership to affect your investment activities in the coming year?
The balance between positive and negative expectations is generally tilted towards negative responses. This is most pronounced for Ireland and Malta (with net balances between positive and negative answers of -39% and -35%, respectively). Firms in Greece (-21%), Portugal (-18%) and a lesser extent Spain (-11%) are, on balance, also fairly concerned about possible negative effects of the outcome of the Brexit referendum on their investment activities. The net balance is least negative in Croatia (0%), Germany (-3%), and Austria (-4%).
From a sectorial point of view, manufacturing firms are among those that are most concerned about the potential negative effects of the outcome of the Brexit referendum. The share of manufacturing firms expecting a negative effect of the Brexit vote clearly outweighs the share of firms expecting a positive effect (-13% on balance). This reflects the stronger export orientation of manufacturers and their generally closer integration into global value chains compared to firms active in other industries.
3.3. Investment finance
3.3.1. Firms’ use of internal versus external financing Firms tend to finance their investment predominantly through internal sources. While internal funds or retained earnings such as cash or profits account for more than two thirds of total investment of the average firm (70%), a considerable contribution is also made by external sources (29%). A small part of the investment capital is sourced through intra-group funding such as loans from a parent company (1%); this is most used among larger companies (where intra-group funding accounts for, on average, 5% of total firm funding). The fact that firms meet the bulk of their financing needs through internal sources is not particular to firms in our sample, but rather a general characteristic of firms’ financing mixes (see, for instance, Damodaran, 2014).

Gross fixed investment and intangible capital PART I 125
European Investment Bank Investment and Investment Finance in Europe
Figure 23 Firms' sources of investment finance
0%
10%
20%
30%
40%
50%
60%
70%
80%
90%
100%
External Intra-groupInternal
All
Finlan
d
Germ
any
Gree
ce
Italy
Portu
gal
Slove
nia UK
cons
tructi
on infra
man
ufac
turin
g
serv
ices
large
med
ium small
micr
o
Ave
rage
sha
re
Base: All firms that invested in the last financial year (excluding don’t know/refused responses). Q. Approximately what proportion of your investment in the last financial year was financed by each of the following?
Italian firms use most external finance; Greek and UK firms the least. The large cross-country variation in the breakdown of investment finance between internal and external sources suggests a strong country dimension in firms’ financing mix. With an average share of around 43%, Italian firms champion reliance on external financing compared to other firms in our sample, while Greek firms almost exclusively resort to their internal sources of funds (11%). The low share of external financing in Greece is most likely a reflection of the country’s tight credit conditions and the attempt of Greek lenders to deleverage and reduce risk exposure. External investment financing by Portuguese and Finnish firms is close to average and smaller for firms domiciled in Germany (25%), Slovakia (21%) and the United Kingdom (16%).
Businesses in infrastructure and manufacturing have a higher external financing share. Investments by businesses active in infrastructure are on average more heavily financed through external sources than those active in the other sectors. This might be related to the fact that these businesses are larger on average (infrastructure: 58 employees) and more capital intensive, which is likely to make it easier for them to come up with the required collateral12 and to access external financing sources.13 Larger firms rely more heavily on external financing than do smaller firms (large: 34% vs micro: 26%)
3.3.2. External sources of investment financeBank loans are the main external financing source, while capital markets are rarely used. Bank loans account for almost two thirds of firms’ external financing (60%) on average. Leasing or hire purchases as well as other types of bank finance, such as overdrafts and other credit lines, are also used to a considerable extent (18% and 10% respectively). This might reflect firms’ reluctance to take on risk, and preference for more flexible financing products, in an economic climate with an uncertain outlook. Capital markets, both equity and debt, are used by an extremely small proportion of firms, making up on average only 0.1% and 0.4% of external finance. Grants including from public sources account for on average around 2% of firms’ external financing (ranging from 0.1% in Germany to 7% in Finland and 9% in Greece).
12 See graph on dissatisfaction with collateral constraints: lowest dissatisfaction13 See graph on credit constraints: lowest share of credit-constrained firms.
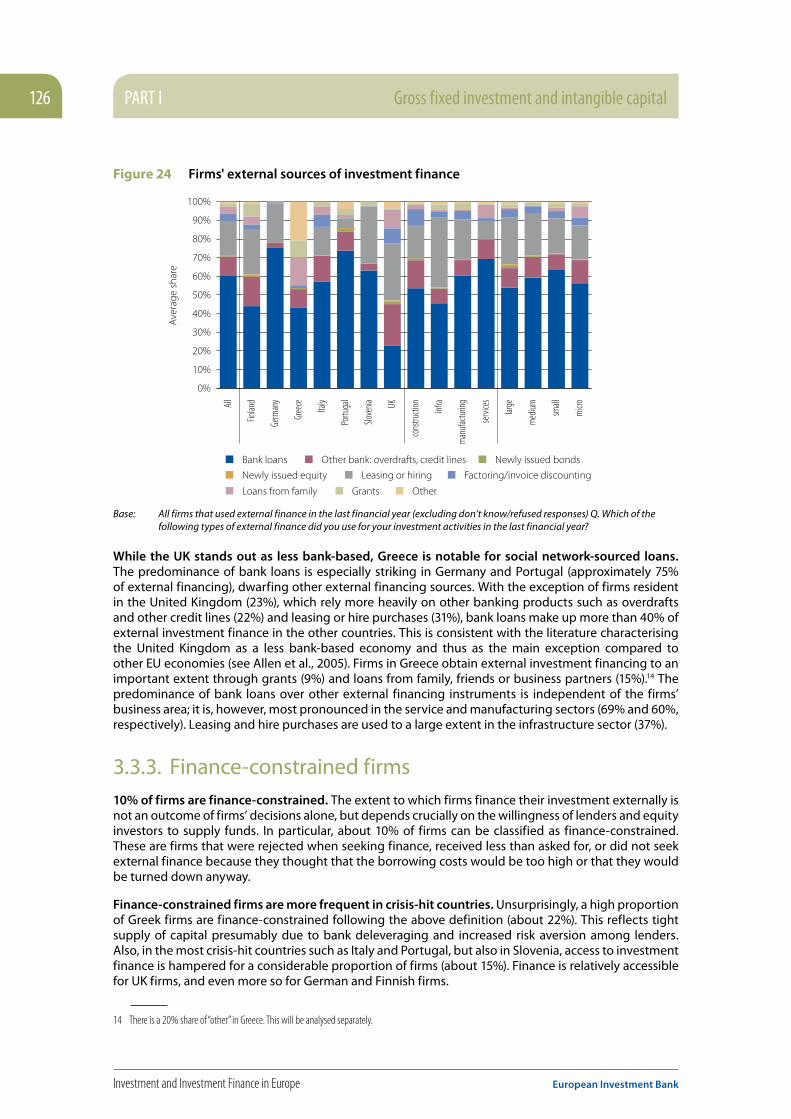
PART I Gross fixed investment and intangible capital126
Investment and Investment Finance in Europe European Investment Bank
Figure 24 Firms' external sources of investment finance
0%
10%
20%
30%
40%
50%
60%
70%
80%
90%
100%
All
Finlan
d
Germ
any
Gree
ce
Italy
Portu
gal
Slove
nia UK
cons
tructi
on infra
man
ufac
turin
g
serv
ices
large
med
ium small
micr
o
Ave
rage
sha
re
Newly issued bonds
Newly issued equity
Bank loans Other bank: overdrafts, credit lines
Loans from family Grants Other
Leasing or hiring Factoring/invoice discounting
Base: All firms that used external finance in the last financial year (excluding don’t know/refused responses) Q. Which of the following types of external finance did you use for your investment activities in the last financial year?
While the UK stands out as less bank-based, Greece is notable for social network-sourced loans. The predominance of bank loans is especially striking in Germany and Portugal (approximately 75% of external financing), dwarfing other external financing sources. With the exception of firms resident in the United Kingdom (23%), which rely more heavily on other banking products such as overdrafts and other credit lines (22%) and leasing or hire purchases (31%), bank loans make up more than 40% of external investment finance in the other countries. This is consistent with the literature characterising the United Kingdom as a less bank-based economy and thus as the main exception compared to other EU economies (see Allen et al., 2005). Firms in Greece obtain external investment financing to an important extent through grants (9%) and loans from family, friends or business partners (15%).14 The predominance of bank loans over other external financing instruments is independent of the firms’ business area; it is, however, most pronounced in the service and manufacturing sectors (69% and 60%, respectively). Leasing and hire purchases are used to a large extent in the infrastructure sector (37%).
3.3.3. Finance-constrained firms10% of firms are finance-constrained. The extent to which firms finance their investment externally is not an outcome of firms’ decisions alone, but depends crucially on the willingness of lenders and equity investors to supply funds. In particular, about 10% of firms can be classified as finance-constrained. These are firms that were rejected when seeking finance, received less than asked for, or did not seek external finance because they thought that the borrowing costs would be too high or that they would be turned down anyway.
Finance-constrained firms are more frequent in crisis-hit countries. Unsurprisingly, a high proportion of Greek firms are finance-constrained following the above definition (about 22%). This reflects tight supply of capital presumably due to bank deleveraging and increased risk aversion among lenders. Also, in the most crisis-hit countries such as Italy and Portugal, but also in Slovenia, access to investment finance is hampered for a considerable proportion of firms (about 15%). Finance is relatively accessible for UK firms, and even more so for German and Finnish firms.
14 There is a 20% share of “other” in Greece. This will be analysed separately.

Gross fixed investment and intangible capital PART I 127
European Investment Bank Investment and Investment Finance in Europe
Figure 25 Share of finance-constrained firms
0.00
0.05
0.10
0.15
0.20
0.25
All
Finlan
d
Germ
any
Gree
ce
Italy
Portu
gal
Slove
nia UK
cons
tructi
on infra
man
ufac
turin
g
serv
ices
large
med
ium small
micr
o
Shar
e of
firm
s
Base: All firms (excluding don’t know/refused responses). Finance-constrained firms include: those dissatisfied with the amount of finance obtained (received less), firms that sought external finance but did not receive it (rejected) and those that did not seek external finance because they thought borrowing costs would be too high (too expensive) or they would be turned down (discouraged)
Small and micro firms are more likely to be finance-constrained, as are service sector firms. The prevalence of finance-constrained service sector firms could be linked to the fact that collateral demands are more difficult to meet in less capital-intensive sectors. Interestingly, medium-sized firms (50 – 250 employees) find it easier to obtain external financing than larger as well as smaller firms. While for larger firms this might be driven by the higher volume of capital demanded, for small firms this is most probably linked to their higher risk profile and the fact that relatively high fixed costs make them unattractive for many lenders.
Box 5 Is investment finance directed to the most productive firms?
An efficient allocation of resources requires that capital flows into the most productive investment opportunities. Theoretically, the efficient allocation of capital is supported by a return distribution over investment opportunities that incentivises the flow of resources to the most productive firms. Therefore, more productive firms should face fewer difficulties when trying to mobilise external financing than is the case for less productive firms. However, in times of ongoing tense economic and social conditions in Europe, it is possible that the allocation of financial resources is driven by additional motives that lead to a decoupling of firm-level fundamentals (such as total factor productivity) and access to finance.
For instance, and as suggested in the literature, lenders and equity investors might be reluctant to realise losses and turn a blind eye to fundamentals of firms demanding credit (such as productivity) in order to improve their balance sheet performance measures. Alternatively, lending decisions of external finance providers can be largely driven by increased risk aversion dominating other considerations than firms’ bottom line. This disconnect of fundamentals from fundamentals is often seen as an important risk factor for future growth prospects (for a more detailed discussion of this, see Chapter 6).
Using the EIBIS data we try to shed some light on this question (see Appendix). This preliminary analysis investigates how a firm’s probability of being finance-constrained relates to its total factor productivity (estimated using sector-by-sector OLS regressions with country dummies). Moreover, we explore how this relation differs for firms in distress from firms in better conditions.
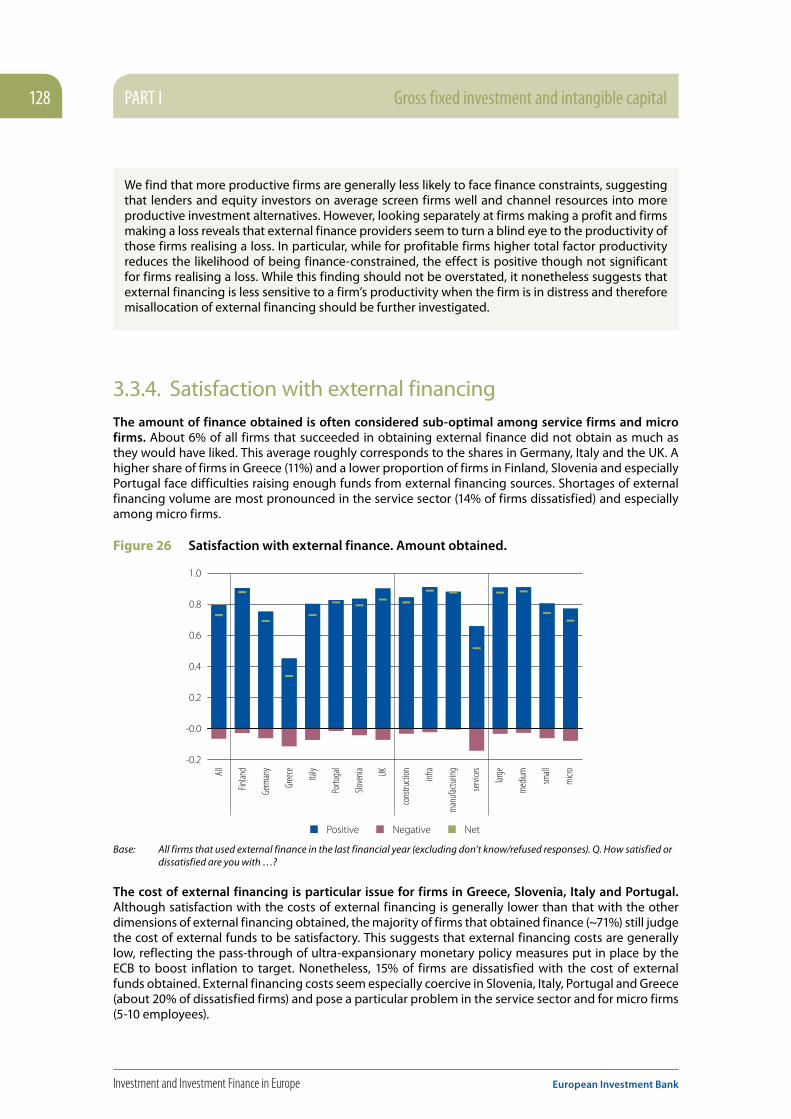
PART I Gross fixed investment and intangible capital128
Investment and Investment Finance in Europe European Investment Bank
We find that more productive firms are generally less likely to face finance constraints, suggesting that lenders and equity investors on average screen firms well and channel resources into more productive investment alternatives. However, looking separately at firms making a profit and firms making a loss reveals that external finance providers seem to turn a blind eye to the productivity of those firms realising a loss. In particular, while for profitable firms higher total factor productivity reduces the likelihood of being finance-constrained, the effect is positive though not significant for firms realising a loss. While this finding should not be overstated, it nonetheless suggests that external financing is less sensitive to a firm’s productivity when the firm is in distress and therefore misallocation of external financing should be further investigated.
3.3.4. Satisfaction with external financingThe amount of finance obtained is often considered sub-optimal among service firms and micro firms. About 6% of all firms that succeeded in obtaining external finance did not obtain as much as they would have liked. This average roughly corresponds to the shares in Germany, Italy and the UK. A higher share of firms in Greece (11%) and a lower proportion of firms in Finland, Slovenia and especially Portugal face difficulties raising enough funds from external financing sources. Shortages of external financing volume are most pronounced in the service sector (14% of firms dissatisfied) and especially among micro firms.
Figure 26 Satisfaction with external finance. Amount obtained.
Positive NetNegative
-0.2
-0.0
0.2
0.4
0.6
0.8
1.0
All
Finlan
d
Germ
any
Gree
ce
Italy
Portu
gal
Slove
nia UK
cons
tructi
on infra
man
ufac
turin
g
serv
ices
large
med
ium small
micr
o
Base: All firms that used external finance in the last financial year (excluding don’t know/refused responses). Q. How satisfied or dissatisfied are you with …?
The cost of external financing is particular issue for firms in Greece, Slovenia, Italy and Portugal. Although satisfaction with the costs of external financing is generally lower than that with the other dimensions of external financing obtained, the majority of firms that obtained finance (~71%) still judge the cost of external funds to be satisfactory. This suggests that external financing costs are generally low, reflecting the pass-through of ultra-expansionary monetary policy measures put in place by the ECB to boost inflation to target. Nonetheless, 15% of firms are dissatisfied with the cost of external funds obtained. External financing costs seem especially coercive in Slovenia, Italy, Portugal and Greece (about 20% of dissatisfied firms) and pose a particular problem in the service sector and for micro firms (5-10 employees).

Gross fixed investment and intangible capital PART I 129
European Investment Bank Investment and Investment Finance in Europe
Figure 27 Satisfaction with external finance. Cost of funding.
Positive NetNegative
-0.4
-0.2
-0.0
0.2
0.4
0.6
0.8
1.0
All
Finlan
d
Germ
any
Gree
ce
Italy
Portu
gal
Slove
nia UK
cons
tructi
on infra
man
ufac
turin
g
serv
ices
large
med
ium small
micr
o
Base: All firms that used external finance in the last financial year (excluding don’t know/refused responses). Q. How satisfied or dissatisfied are you with …?
Loan maturity is generally less of an issue, except for clients of weaker banks. The maturity of external financing instruments seems generally well adjusted to the needs of firms: 87% of firms are satisfied with the length of time over which funds need to be repaid. The exception to this overall picture is Greek firms, which seem to face major difficulties raising capital over longer horizons – which is likely to impede their capacity to invest in long-term projects (approximately 28% of firms are dissatisfied with the maturity of their external funds). This is true to a lesser, but still considerable, extent for Portuguese firms (9.4%). Although maturities are not a major source of dissatisfaction on aggregate, this is nonetheless a channel through which banks may pass on stresses to the real economy. We examine this link below.
Figure 28 Satisfaction with external finance. Maturity.
-0.4
-0.2
-0.0
0.2
0.4
0.6
0.8
1.0
Positive NetNegative
All
Finlan
d
Germ
any
Gree
ce
Italy
Portu
gal
Slove
nia UK
cons
tructi
on infra
man
ufac
turin
g
serv
ices
large
med
ium small
micr
o
Base: All firms that used external finance in the last financial year (excluding don’t know/refused responses). Q. How satisfied or dissatisfied are you with …?
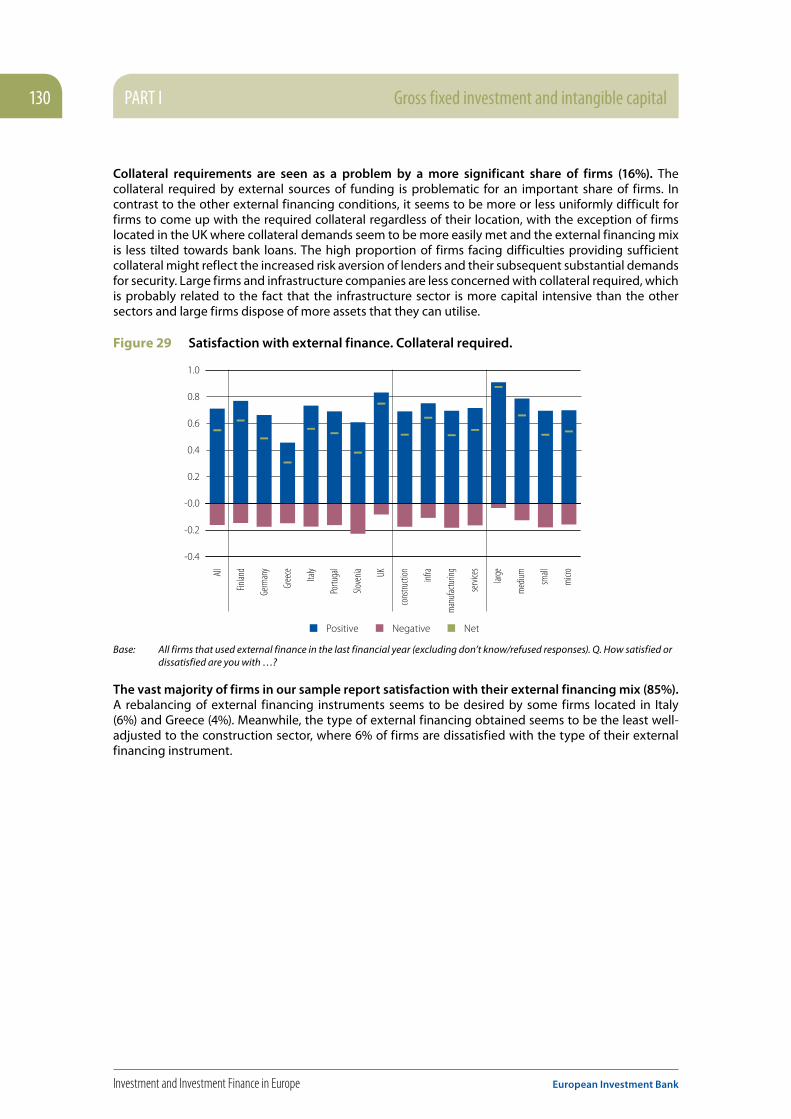
PART I Gross fixed investment and intangible capital130
Investment and Investment Finance in Europe European Investment Bank
Collateral requirements are seen as a problem by a more significant share of firms (16%). The collateral required by external sources of funding is problematic for an important share of firms. In contrast to the other external financing conditions, it seems to be more or less uniformly difficult for firms to come up with the required collateral regardless of their location, with the exception of firms located in the UK where collateral demands seem to be more easily met and the external financing mix is less tilted towards bank loans. The high proportion of firms facing difficulties providing sufficient collateral might reflect the increased risk aversion of lenders and their subsequent substantial demands for security. Large firms and infrastructure companies are less concerned with collateral required, which is probably related to the fact that the infrastructure sector is more capital intensive than the other sectors and large firms dispose of more assets that they can utilise.
Figure 29 Satisfaction with external finance. Collateral required.
-0.4
-0.2
-0.0
0.2
0.4
0.6
0.8
1.0
Positive NetNegative
All
Finlan
d
Germ
any
Gree
ce
Italy
Portu
gal
Slove
nia UK
cons
tructi
on infra
man
ufac
turin
g
serv
ices
large
med
ium small
micr
o
Base: All firms that used external finance in the last financial year (excluding don’t know/refused responses). Q. How satisfied or dissatisfied are you with …?
The vast majority of firms in our sample report satisfaction with their external financing mix (85%). A rebalancing of external financing instruments seems to be desired by some firms located in Italy (6%) and Greece (4%). Meanwhile, the type of external financing obtained seems to be the least well-adjusted to the construction sector, where 6% of firms are dissatisfied with the type of their external financing instrument.

Gross fixed investment and intangible capital PART I 131
European Investment Bank Investment and Investment Finance in Europe
Box 6 How does banks’ balance sheet health pass through to firms’ investment financing?
Financial sector problems transmit to the real sector through the credit channel. If credit from banks freezes or is not sufficiently adjusted to the individual firm conditions, business activity and firms’ investment decisions are crucially affected. It is likely that the fragility of banks has an impact on the terms of the loan. For instance, banks might restore the quality of their asset through higher collateral requirements, lending more short term or tightening credit volume. The transmission of financial shocks to the real economy is the subject of a large and growing body of literature spurred by the financial crisis, but is often constrained to a more aggregated level (for a review of the literature, see Chapter 6).
Through the unique EIBIS data, it is possible to observe firm-bank pairs formed by their financial contracts and thereby link the financial conditions of banks directly to firms. In the following, we explore how the fragility of banks that gave the last or current loan impacts firms’ satisfaction with the terms of their financial contract with their bank. In particular, we regress the level of a firm’s satisfaction on the ratio of non-performing loans over total loans outstanding of the contracting bank.
We find that banking fragility seems not to transmit to the real sector in the northern (or less crisis-hit) European countries of our sample (Finland, Germany, United Kingdom), whereas there is a significant impact on firms’ satisfaction with their external financing terms in the south (Greece, Italy, Portugal, Slovenia). It seems that fragile banks seek to restore their asset quality predominantly by restricting the amount of the loan, and most of all the maturity of loans disbursed, which implies higher levels of dissatisfaction of financed firms.
Figure 30 Satisfaction with external finance. Financing Mix.
-0.2
-0.0
0.2
0.4
0.6
0.8
1.0
Positive NetNegative
All
Finlan
d
Germ
any
Gree
ce
Italy
Portu
gal
Slove
nia UK
cons
tructi
on infra
man
ufac
turin
g
serv
ices
large
med
ium small
micr
o
Base: All firms that used external finance in the last financial year (excluding don’t know/refused responses). Q. How satisfied or dissatisfied are you with …?
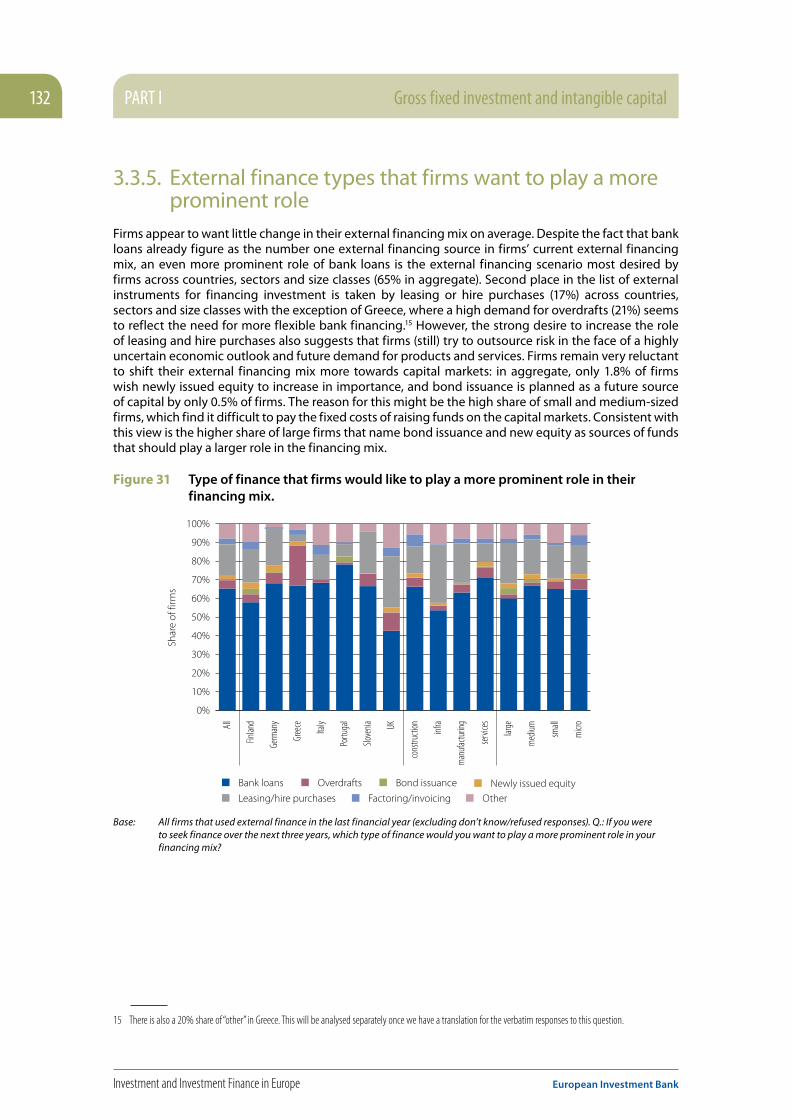
PART I Gross fixed investment and intangible capital132
Investment and Investment Finance in Europe European Investment Bank
3.3.5. External finance types that firms want to play a more prominent role
Firms appear to want little change in their external financing mix on average. Despite the fact that bank loans already figure as the number one external financing source in firms’ current external financing mix, an even more prominent role of bank loans is the external financing scenario most desired by firms across countries, sectors and size classes (65% in aggregate). Second place in the list of external instruments for financing investment is taken by leasing or hire purchases (17%) across countries, sectors and size classes with the exception of Greece, where a high demand for overdrafts (21%) seems to reflect the need for more flexible bank financing.15 However, the strong desire to increase the role of leasing and hire purchases also suggests that firms (still) try to outsource risk in the face of a highly uncertain economic outlook and future demand for products and services. Firms remain very reluctant to shift their external financing mix more towards capital markets: in aggregate, only 1.8% of firms wish newly issued equity to increase in importance, and bond issuance is planned as a future source of capital by only 0.5% of firms. The reason for this might be the high share of small and medium-sized firms, which find it difficult to pay the fixed costs of raising funds on the capital markets. Consistent with this view is the higher share of large firms that name bond issuance and new equity as sources of funds that should play a larger role in the financing mix.
Figure 31 Type of finance that firms would like to play a more prominent role in their financing mix.
0%
10%
20%
30%
40%
50%
60%
70%
80%
90%
100%
All
Finlan
d
Germ
any
Gree
ce
Italy
Portu
gal
Slove
nia UK
cons
tructi
on infra
man
ufac
turin
g
serv
ices
large
med
ium small
micr
o
Bond issuance Newly issued equityBank loans Overdrafts
OtherLeasing/hire purchases Factoring/invoicing
Shar
e of
firm
s
Base: All firms that used external finance in the last financial year (excluding don’t know/refused responses). Q.: If you were to seek finance over the next three years, which type of finance would you want to play a more prominent role in your financing mix?
15 There is also a 20% share of “other” in Greece. This will be analysed separately once we have a translation for the verbatim responses to this question.

Gross fixed investment and intangible capital PART I 133
European Investment Bank Investment and Investment Finance in Europe
3.4. ConclusionThis chapter has provided a snapshot of some of the information gathered by the new EIB Group Survey on Investment and Investment Finance (EIBIS). Although the data presented here are still provisional and cover only the seven countries in which fieldwork was first completed, they provide a wealth of indications about the status of investment and investment financing by firms in Europe. Some of the main conclusions are as follows:
Investment activities in 2015 varied significantly across countries and sectors. While the share of firms investing was similar (72%), there were substantial cross-country/cross-sector differences in terms of firms’ investment intensity. The highest investment intensities were reported in Finland, Germany and Slovenia as well as in the infrastructure sector.
Regarding firms’ outlook for investment in 2016, we found evidence of a continuing strong investment performance in Germany and Slovenia, as well as (weak) signs of a recovery in Greece and Portugal. Firms in the infrastructure sector, on the other hand, anticipate a sharp investment slowdown in 2016.
16% of firms state that their investment activities in the last three years were below needs, while only 4% report having invested too much. Firms in Portugal, Greece, Slovenia and the UK are the most likely to report that their investment activities in the last three years were below needs – something which we show is strongly (negatively) correlated with the share of firms’ equipment that is self-reported as state-of-the-art.
Uncertainty is seen as the most important short-term barrier to investment in all countries apart from Germany. Firms report that the political and regulatory climate negatively affects their ability to carry out planned investments. Firms are more divided on the impact of the overall economic climate, while sector-specific business prospects and the availability of finance are seen more positively.
In terms of longer-term barriers to investment, uncertainty tops the list (cited by 67% of firms), followed by the lack of skilled workers (the leading obstacle in Germany) and business regulation (particularly in Greece, Italy and Portugal).
With regard to investment finance, the data confirms firms’ strong reliance on internal sources (70% on average) and bank loans (60% of external finance on average). What is more, the data suggests that
Box 7 Do firms want a different external finance mix?
The type of financing instrument that firms would like in the future is to an important extent determined by their current financing mix. Theoretically, firms might either wish to substitute one financial instrument with another, thereby changing the composition of their financing mix (rebalancing at the extensive margin) or rebalance their financing mix using more/fewer financial instruments than were already used as a source of investment financing in the past (rebalancing at the intensive margin). The EIBIS data shows that firms generally seek to rebalance their financing mixes along the intensive margin (see Appendix).
In particular, there is strong evidence that firms are more likely to wish for more of the financing sources that they already use extensively. However, we also find evidence that some financing instruments are relatively overused. Firms using more factoring and invoice discounting, for example, are more likely to seek more overdraft financing in the future, which might reflect the additional need among these firms for flexible financing. Along the same line of reasoning, loans from family, friends and business partners also do not seem to be well adapted, increasing the likelihood of seeking both more equity issuance and factoring/invoicing in the future.
PART I Gross fixed investment and intangible capital134
Investment and Investment Finance in Europe European Investment Bank
firms on average have little desire to change their financing mix. If anything, they tend to want more of the external finance types that they already heavily use, including bank lending and leasing.
Finance-constrained firms are most prevalent in Greece (22%), Portugal (11%), Italy (12%) and Slovenia (15%). To the extent that such finance constraints are driven by weak bank balance sheets, we show that – for the southern countries – this weakness tends to be passed through primarily by means of shorter maturities and lower amounts granted. Interestingly, the costs of funding or collateral requirements tend to vary much less with the weakness of lender balance sheets. Finance constraints tend to be negatively correlated with firm productivity, but this relationship breaks down with regard to firms that have recorded a loss in the last financial year.
ReferencesDamodaran, Aswath - Applied Corporate Finance, Fourth Edition, Wiley, 2015, Allen, F., L. Bartiloro, and O. Kowalewski – The financial system of the EU 25, Available at SSRN: http://ssrn.com/abstract=871454, 2005
Lai, Y; Saridakis, G; Blackburn, R; and Johnstone, S (2016): ‘In a recession, large firms are more likely than SMEs to resort to personnel cuts’. LSE Business Review.
Dee, P., Gali, J. (2005): ‘The Trade and Investment Effects of Preferential Trading Arrangements, in International Trade; published in East Asia, NBER-East Asia Seminar on Economics, Volume 14
Pissarides, C. (1992): ‘Loss of Skill During Unemployment and the Persistence of Employment Shocks’ in The Quarterly Journal of Economics; Vol. 107, No. 4 (Nov., 1992), pp. 1371-1391

Gross fixed investment and intangible capital PART I 135
European Investment Bank Investment and Investment Finance in Europe
Technical Appendix
Survey BackgroundEIBIS data collection is expected to take place in three annual waves: the first has taken place in 2016 already; the second and third waves are scheduled for 2017 and 2018. In all three waves, the survey consists of a General Module and an Online Follow-up.
The General Module will collect cross-sectional and time-series data on investment and investment finance decisions. The Online Follow-up will comprise each year a discrete choice experiment to test pairs of hypothetical financing offers. The idea is to thereby elicit firm preferences with respect to different finance characteristics (such as interest, maturity, seniority, repayment schedule) and to quantify the trade-offs between them.
Fieldwork for the first wave of the General Module and its Follow-up started in July/August 2016 (depending on the country) and continued until October 2016 in most countries. The survey was carried out by telephone.
Sampling methodology
The sample for the General Module represents non-financial enterprises16 in the 28 EU Member States, in NACE categories C to J17 with a minimum of five employees18. Eligible respondents were senior persons with responsibility for investment decisions and how these are financed. This person could be the owner, a Finance Manager, the Finance Director or Head of Accounts, the Chief Financial Officer (CFO) or the Chief Executive Officer (CEO).
The Bureau van Dijk ORBIS dataset was used as a sampling frame in all countries. The ORBIS database is a commercial dataset, which contains administrative and financial data on 130 million firms worldwide. Using it as a sampling frame has the advantage that it allows survey responses to be matched with respondents’ (current and past) balance sheet information and information from their income statement.19
In the choice of sampling frames for different countries, this had to be weighted against ORBIS coverage (vis-à-vis alternative sampling frames): a detailed review prior to fieldwork showed that in 20 out of the 28 EU Member States ORBIS provides the broadest coverage of the target population. In the other cases20, the difference from the best alternative was deemed sufficiently small that – for the sake of comparability across countries and the additional information contained in ORBIS – it was still the best option for this initiative.21
16 The sampling targeted head offices; branches were filtered out of the sample frame, but any branches or sites were not screened out in the interview.17 Includes: C. manufacturing; D. electricity, gas, steam and air conditioning supply; E. water supply; sewerage, waste management and remediation activities; F.
construction; G. wholesale and retail trade; repair of motor vehicles and motorcycles; H. transportation and storage; I. accommodation and food service activities; and J. information and communication.
18 This included freelancers working regularly for a company. Full-time and part-time employees were counted as one employee. Employees working less than 12 hours per week were excluded.
19 Survey respondents were asked during the interview process to give their consent to matching their survey answers to their firm’s balance sheet information. The matching was done by a service provider (outside of the EIB) before anonymisation.
20 These include: AT; HR; DK; FR; DE; IT; SL; and the UK.21 Given that ORBIS does not include telephone numbers for 30% of the survey population, an exhaustive telephone number search was undertaken using Dun &
Bradstreet.

PART I Gross fixed investment and intangible capital136
Investment and Investment Finance in Europe European Investment Bank
Sample size targets: General Module and Weighting
The target sample sizes for the 2016 General Module Survey were as per the table below:
Table 1 EIBIS target sample size by country
Country N Country N Country N Country N Country N
AT 475 CY 150 ES 475 PL 475 HU 475
BE 475 CZ 475 FI 475 PT 475 SL 400
BG 475 DE 600 LU 150 RO 475 SK 400
IE 400 DK 475 LV 400 SE 475 UK 600
IT 600 EE 400 MT 150 FR 600
LT 400 EL 400 NL 475 HR 475
Quotas (sample size targets) were set within each EU Member State for four industry groupings: (i) manufacturing – NACE C; (ii) services – NACE G & I & J; (iii) construction - NACE F; and (iv) infrastructure – NACE D & E & H); and four size classes: (i) micro (5-9 employees); (ii) small (10-49 employees); (iii) medium (50-249 employees); and (iv) large (250+ employees). Wherever country sample sizes allowed, the quotas were set to achieve a minimum sample size of around100 interviews in each group.
Post stratification weighting was used in order to correct for any over sampling and under sampling.
Regression Analyses
How do short-term drivers affect the type of investment firms prioritise? (Box 2)
We estimate a linear regression model of firms’ investment share by purpose on whether they judge their business outlook and general economic outlook to be neutral or negative, respectively plus a set of control variables. The control variables include a dummy indicating whether a firm produces at or above maximum capacity and a set of control dummies at the country, sector, size and age level.
Let y denote a firm’s share of investment for a particular purpose (capacity expansion, replacement, innovation), business prospect2 and 3 dummy variables taking a value of 1 if the firm judges its sector- specific business outlook to be neutral or negative; overall economic climate2 and 3 dummy variables if the firm judges the overall economic climate to be neutral or negative; x a dummy variable of a firm operating at or above maximum capacity and γ
i a set of dummy variables at level i є {country,size,sector,age}.
y = β0 + β
1business outlook2 + β
2business outlook3 + β
3general outlook2 + β
4general outlook3
+ β5 x + +γ
j,country + γ
j,sector + γ
j,size + γ
j,age + u
We estimate the above equation by means of Ordinary Least Squares.

Gross fixed investment and intangible capital PART I 137
European Investment Bank Investment and Investment Finance in Europe
Table 1 shows the results:
Table 2 Regression of the share of firms’ investment for each purpose on sector prospects and economic climate (plus controls)
(1) (2) (3)
VARIABLES
Q18 - A. Replacing existing buildings
machinery equipment and IT
Q18 - B. Expanding capacity for existing
products/services
Q18 - C. Developing or introducing new
products processes or services
Q23 - C. Business prospects specific to your sector or industry = 2, Make no difference to the ability to carry out planned investment
4.989** -2.007 -2.912**
(1.993) (1.538) (1.378)
Q23 - C. Business prospects specific to your sector or industry = 3, Negatively affect the ability to carry out planned investment
5.177* -5.371** -0.333
(2.756) (2.126) (1.904)
Q23 - D. Overall economic climate = 2, Make no difference to the ability to carry out planned investment
-2.288 0.825 0.834
(2.130) (1.643) (1.472)
Q23 - D. Overall economic climate = 3, Negatively affect the ability to carry out planned investment
-0.255 -0.0718 0.222
(2.208) (1.703) (1.526)
(2.949) (2.275) (2.038)
(11.71) (9.035) (8.095)
Control variables
Country of the firm Yes
Sector of the firm Yes
Size class of firm Yes
Age class of firm Yes
Level of capacity utilisation Yes
Observations 2,156 2,156 2,156
R-squared 0.048 0.038 0.044
Notes: Standard errors in parentheses *** p<0.01, ** p<0.05, * p<0.1
Table 2 shows that a change in firms’ (sector-specific) business prospects from positive to negative tends to reduce the share of investment in capacity expansion by an even larger 5 percentage points (or 15%); a shift from a positive to neutral business prospects reduces the share of investment in new products or processes by 3 percentage points (or 6%); while it increases the share of investment going into the replacement of existing buildings, machinery and equipment by 3 percentage points (or 11%). Interestingly, it is primarily the perceived sector prospects that seem to matter for firms’ investment decisions, and much less so firms’ perceptions of the general economic climate.

PART I Gross fixed investment and intangible capital138
Investment and Investment Finance in Europe European Investment Bank
How does the size of the investment gap reported by firms relate to the quality of their capital stock? (Box 3)
We estimate a linear regression model of firms’ share of machinery and equipment that is state-of-the-art on whether they report an investment gap (i.e. investments below needs) plus a set of control variables. The control variables include a dummy indicating if a firm produces at or above maximum capacity and a set of control dummies at the country, sector, size and age level.
Let y denote a firm’s share of machinery and equipment that is state-of-the-art, investment gap a variable equal to 1 if the firm judges its past investments below needs, x a dummy variable of a firm operating at or above maximum capacity and γ
i a set of dummy variables at level i є {country, size,
sector, age}.y = β
0 + β
1 investment gap + β
5x + γ
j,country + γ
j,sector + γ
j,size + γ
j,age + u
We estimate the above equation by means of Ordinary Least Squares.
Table 3 shows the results:
Table 3 Regression of firms’ share of state-of-the-art machinery and equipment on whether or not they report an investment gap (plus controls).
VARIABLES [Q39 & Q40] - Proportion of state-of-the-art machinery and equipment
Investment Gap -11.80***
(1.377)
Control variables
Country of the firm Yes
Sector of the firm Yes
Size class of firm Yes
Age class of firm Yes
Level of capacity utilisation Yes
Observations 3,082
R-squared 0.209
Notes: Standard errors in parentheses *** p<0.01, ** p<0.05, * p<0.1
The table shows that firms with a self-perceived investment gap tend to report – on average and all else being equal – a share of state-of-the-art machinery and equipment that is some 12 percentage points (or 24%) lower than firms without an investment gap. That is, all else being equal, a (self-perceived) investment gap is associated with a significantly lower share of state-of-the-art machinery and equipment.
Can we conclude from this that an investment gap ultimately affects the quality of firms’ capital stock? No, we cannot. However, the fact that firms that experienced a longer or more pronounced investment downswing (than others), such as firms in the UK, Greece and Portugal, tend to show a much stronger negative correlation between reporting an investment gap and the share of state-of-the-art machinery and equipment, is an indication in this direction.
Using an expectation maximisation algorithm, we can show that there are two distinct groups of firms in our dataset: one which shows a negative, but moderate, relationship between firms’ self-perceived investment gap and their share of state-of-the-art machinery and equipment; and one with a much stronger relationship between the two variables (the result of this is shown in Table 4 below).22
22 It shows that for the first group a (self-reported) investment gap tends to be associated with a 2.5 percentage points lower share of state-of-the-art machinery and equipment. For the second group – which is the one with firms reporting no or very low levels of investment, located in countries and sectors most affected by the crisis – the share of state-of-the-art machinery and equipment tends to be about 14.5 percentage points lower for firms with a (self-perceived) investment gap. For the finite mixture model, two components are assumed, as well as a student-t distribution.
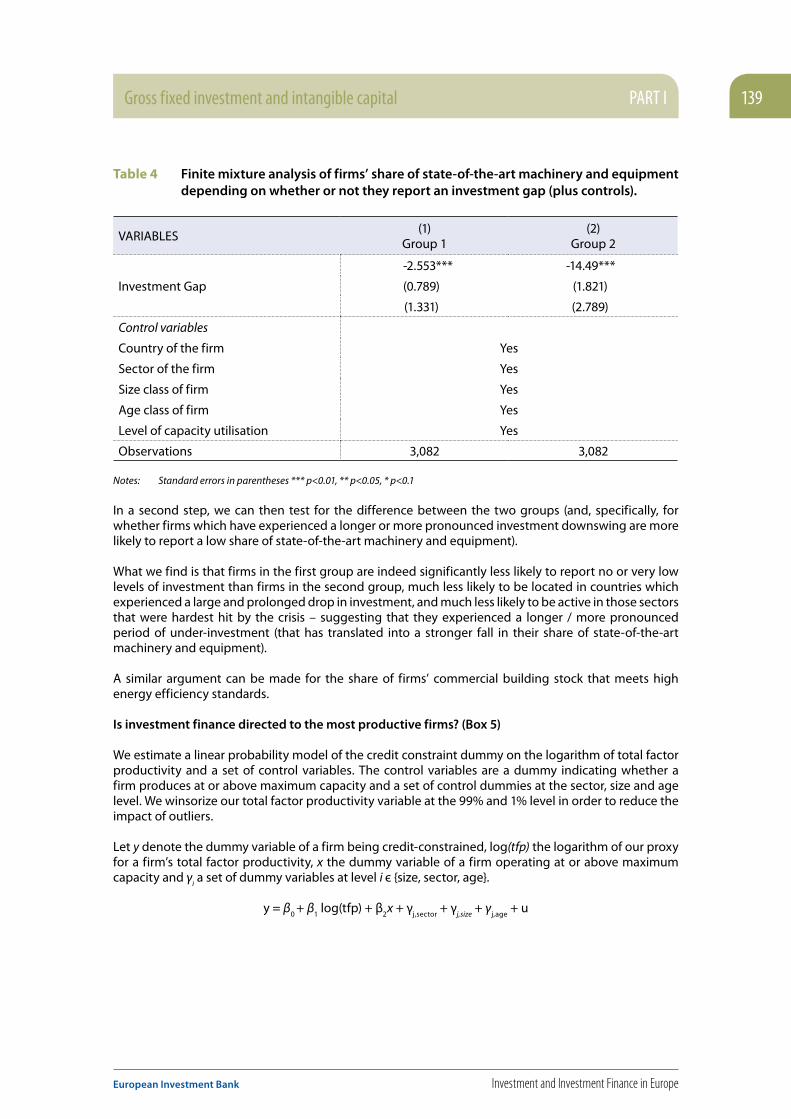
Gross fixed investment and intangible capital PART I 139
European Investment Bank Investment and Investment Finance in Europe
Table 4 Finite mixture analysis of firms’ share of state-of-the-art machinery and equipment depending on whether or not they report an investment gap (plus controls).
VARIABLES(1)
Group 1(2)
Group 2
Investment Gap
-2.553*** -14.49***
(0.789) (1.821)
(1.331) (2.789)
Control variables
Country of the firm Yes
Sector of the firm Yes
Size class of firm Yes
Age class of firm Yes
Level of capacity utilisation Yes
Observations 3,082 3,082
Notes: Standard errors in parentheses *** p<0.01, ** p<0.05, * p<0.1
In a second step, we can then test for the difference between the two groups (and, specifically, for whether firms which have experienced a longer or more pronounced investment downswing are more likely to report a low share of state-of-the-art machinery and equipment).
What we find is that firms in the first group are indeed significantly less likely to report no or very low levels of investment than firms in the second group, much less likely to be located in countries which experienced a large and prolonged drop in investment, and much less likely to be active in those sectors that were hardest hit by the crisis – suggesting that they experienced a longer / more pronounced period of under-investment (that has translated into a stronger fall in their share of state-of-the-art machinery and equipment).
A similar argument can be made for the share of firms’ commercial building stock that meets high energy efficiency standards.
Is investment finance directed to the most productive firms? (Box 5)
We estimate a linear probability model of the credit constraint dummy on the logarithm of total factor productivity and a set of control variables. The control variables are a dummy indicating whether a firm produces at or above maximum capacity and a set of control dummies at the sector, size and age level. We winsorize our total factor productivity variable at the 99% and 1% level in order to reduce the impact of outliers.
Let y denote the dummy variable of a firm being credit-constrained, log(tfp) the logarithm of our proxy for a firm’s total factor productivity, x the dummy variable of a firm operating at or above maximum capacity and γ
i a set of dummy variables at level i є {size, sector, age}.
y = β0 + β
1 log(tfp) + β
2x + γ
j,sector + γ
j,size + γ
j,age + u

PART I Gross fixed investment and intangible capital140
Investment and Investment Finance in Europe European Investment Bank
Table 5 shows the results:
Table 5 Regression of whether a firm is credit-constrained on its total factor productivity (plus controls). Results are reported separately for i) all firms; ii) firms making a profit; and iii) firms making a loss.
VARIABLES(1)
All firms(2)
Firms making a profit
(3) Firms making
a loss
Total Factor Productivity -.0171* -.0166* -.0019
(.0092) (.0097) (.0345)
Control variables
Country of the firm Yes
Sector of the firm Yes
Size class of firm Yes
Age class of firm Yes
Level of capacity utilisation Yes
Observations 1,864 1,652 197
Pseudo R-squared 0.0238 0.0276 0.0019
Notes: Standard errors in parentheses; *** p<0.01, ** p<0.05, * p<0.1
It shows that more productive firms are generally less likely to face finance constraints, suggesting that lenders and equity investors on average screen firms well and channel resources into more productive investment alternatives. However, looking separately at firms making a profit and firms making a loss reveals that external finance providers seem to turn a blind eye to the productivity of those firms realising a loss. In particular, while for profitable firms higher total factor productivity reduces the likelihood of being finance-constrained, the effect is positive though not significant for firms realising a loss.
How does banks’ balance sheet health pass through to firms’ investment financing? (Box 6)
We estimate a linear probability model of the satisfaction of a firm with its external financing conditions along different dimensions (q30) on the ratio of non-performing loans over total outstanding loans of the bank that gave the last or the current loan (q34 and q35) obtained from Bureau van Dijk’s BANKSCOPE database and a set of control dummies at the sector, size and age level.
Let γj denote the satisfaction of a firm with its external financing conditions of dimension j є {amount,
costs, maturity, collateral, type}, npl the ratio of non-performing loans over total outstanding loans and γ
j,i a set of dummy variables at level i є {size, sector, age}.
yj = β
j,0 + β
1npl + γ
j,sector + γ
j,size + γ
j,age + u
j
We estimate the above equation for each dimension j of external financing conditions separately, both for the southern countries (Greece, Italy, Portugal, Slovenia) and the northern countries (Finland, Germany, United Kingdom) of our sample by the Method of Ordinary Least Squares.

Gross fixed investment and intangible capital PART I 141
European Investment Bank Investment and Investment Finance in Europe
Table 6 shows the results:
Table 6 Regression of firms’ satisfaction with the finance they received on their bank’s ratio of non-performing loans over total loans outstanding (plus controls). Results are reported separately for northern Europe and southern Europe.
(1) (2) (3) (4) (5)
PANEL A: NORTH Q30 - A. Amount Q30 - B. Costs Q30 - C. Maturity Q30 - D. Collateral Q30 - E. Type
Health of the bank that gave last or current loan
NPL ratio 0.0832 -0.03935 0.00773 -0.05435 -0.02232
(0.05952) (0.06668) (0.05468) (0.07857) (0.04836)
Control variables
Sector of the firm Yes
Size class of the firm Yes
Age class of the firm Yes
Observations 235 235 234 232 233
Adj. R-squared 0.0306 0.0086 -0.0089 0.0217 0.0277
Notes: Standard errors in parentheses; *** p<0.01, ** p<0.05, * p<0.1
(1) (2) (3) (4) (5)
PANEL B: SOUTH Q30 - A. Amount Q30 - B. Costs Q30 - C. Maturity Q30 - D. Collateral Q30 - E. Type
Health of the bank that gave last or current loan
NPL ratio 0.00829*** 0.00618 0.01038*** 0.00647 0.00683**
(0.00319) (0.00395) (0.00317) (0.00401) (0.00301)
Control variables
Sector of the firm Yes
Size class of the firm Yes
Age class of the firm Yes
Observations 430 431 428 393 430
Adj. R-squared 0.027 0.019 0.0306 0.0069 0.0181
Notes: Standard errors in parentheses; *** p<0.01, ** p<0.05, * p<0.1; satisfaction from 1:=very satisfied to 5:= very dissatisfied.
It shows that banking fragility seems not to transmit to the real sector in the northern (or less crisis-hit) European countries of our sample, whereas there is a significant impact on firms’ satisfaction with their external financing terms in the south (panel B). It seems that fragile banks seek to restore their asset quality predominantly by restricting the amount of the loan, and most of all the maturity of loans disbursed (see Panel B), which implies higher levels of dissatisfaction of financed firms.

PART I Gross fixed investment and intangible capital142
Investment and Investment Finance in Europe European Investment Bank
Do firms want a different external finance mix? (Box 7)
We estimate a multinomial logit model of firms’ choice of financing instrument type that they wish to play a more prominent role in their financing mixes (q36) on the shares of financial instruments of different type in their current financing mix (q29) and a set of control dummies at country, sector, size and age level.
Let j = 1, …, J denote financing instruments, xj the share of instrument j in a firm’s current financing mix,
γj,i a set of dummies specific to alternative j at level i є {country, size, sector, age} and y the instrument
that a firm wishes to play a more prominent role in its financing mix. For the model to be identified we need to choose a base outcome. Here we choose bank loans denoted by j=1.
exp (βj,0
+ βj,2
x2 + … + β
j,J2 x
J + γ
j,country + γ
j,sector + γ
j,size + γ
j,age + u
j )
Pr(y = j) = , j = 2,…,J
1 + ∑
J
j exp (β
j,0 + β
j,2 x
2 + … + β
j,J x
J + γ
j,country + γ
j,sector + γ
j,size + γ
j,age + u
j
The model is estimated by the Method of Maximum Likelihood.
Table 7 shows the results:
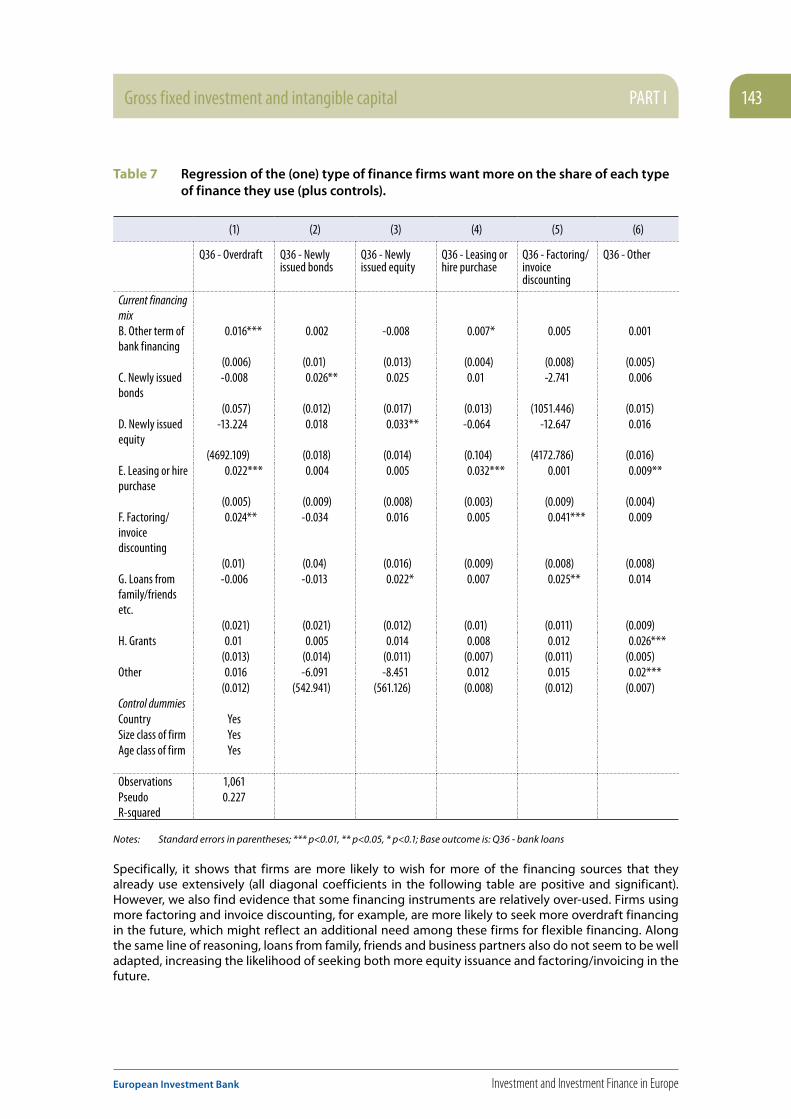
Gross fixed investment and intangible capital PART I 143
European Investment Bank Investment and Investment Finance in Europe
Table 7 Regression of the (one) type of finance firms want more on the share of each type of finance they use (plus controls).
(1) (2) (3) (4) (5) (6)
Q36 - Overdraft Q36 - Newly issued bonds
Q36 - Newly issued equity
Q36 - Leasing or hire purchase
Q36 - Factoring/invoice discounting
Q36 - Other
Current financing mixB. Other term of bank financing
0.016*** 0.002 -0.008 0.007* 0.005 0.001
(0.006) (0.01) (0.013) (0.004) (0.008) (0.005)C. Newly issued bonds
-0.008 0.026** 0.025 0.01 -2.741 0.006
(0.057) (0.012) (0.017) (0.013) (1051.446) (0.015)D. Newly issued equity
-13.224 0.018 0.033** -0.064 -12.647 0.016
(4692.109) (0.018) (0.014) (0.104) (4172.786) (0.016)E. Leasing or hire purchase
0.022*** 0.004 0.005 0.032*** 0.001 0.009**
(0.005) (0.009) (0.008) (0.003) (0.009) (0.004)F. Factoring/invoice discounting
0.024** -0.034 0.016 0.005 0.041*** 0.009
(0.01) (0.04) (0.016) (0.009) (0.008) (0.008)G. Loans from family/friends etc.
-0.006 -0.013 0.022* 0.007 0.025** 0.014
(0.021) (0.021) (0.012) (0.01) (0.011) (0.009)H. Grants 0.01 0.005 0.014 0.008 0.012 0.026*** (0.013) (0.014) (0.011) (0.007) (0.011) (0.005)Other 0.016 -6.091 -8.451 0.012 0.015 0.02*** (0.012) (542.941) (561.126) (0.008) (0.012) (0.007)Control dummiesCountry YesSize class of firm YesAge class of firm Yes
Observations 1,061Pseudo R-squared
0.227
Notes: Standard errors in parentheses; *** p<0.01, ** p<0.05, * p<0.1; Base outcome is: Q36 - bank loans
Specifically, it shows that firms are more likely to wish for more of the financing sources that they already use extensively (all diagonal coefficients in the following table are positive and significant). However, we also find evidence that some financing instruments are relatively over-used. Firms using more factoring and invoice discounting, for example, are more likely to seek more overdraft financing in the future, which might reflect an additional need among these firms for flexible financing. Along the same line of reasoning, loans from family, friends and business partners also do not seem to be well adapted, increasing the likelihood of seeking both more equity issuance and factoring/invoicing in the future.

144
Investment and Investment Finance in Europe European Investment Bank

145
European Investment Bank Investment and Investment Finance in Europe
Part II
Investment finance
Chapter 4
Credit conditions and corporate investment in Europe1
1 This chapter was prepared by Laurent Maurin with contributions from Natacha Valla, Carlo de Nicola and Marcin Wolski (EIB) and research assistance by Benedetta di Lupidio and Alena Wabitsch.

146
Investment and Investment Finance in Europe European Investment Bank
Investment finance PART II 147
European Investment Bank Investment and Investment Finance in Europe
Investment finance
Chapter at a glance
This chapter analyses recent developments in credit conditions in the EU in order to discuss some of the possible factors behind the relative weakness in corporate investment at this stage of the recovery. With the sovereign debt crisis, Europe has gone through a major crisis. During its resolution, both the corporate and the banking sectors have become stronger.
• Financial conditions have gradually normalised over recent years, from adverse credit supply conditions to conditions broadly neutral for EU corporate investment. Together with the accommodative monetary policy stance, they should support capital expenditure.
• The low interest rate environment may well reflect the profound deleveraging cycle that the banking and corporate sectors have gone through. To some extent, the length of the adjustment process may well reflect its magnitude, which pushed monetary policy to its limits in several parts of Europe. Besides, the current slow recovery may reflect some hysteresis effects from years of very low investment.
• The EU financial system seems to be starting to revert slowly from a situation of high fragmentation. Between core countries and vulnerable countries, government bond yields, the corporate cost of bank borrowing, bank credits and, more widely, access to external finance are starting to move in tandem across the euro area. Still, some stigma effects cannot be denied at this stage. Compared to the pre-crisis situation, capital flows in the cohesion countries have not resumed yet.
• The positive results of the 2016 EBA stress test have not been accompanied by a confidence rally in the banking sector. Despite the magnitude of the regulatory adjustment achieved, European banks continue to suffer from very low valuations. This most likely reflects a combination of factors, some of them being specific to some countries. The persistence of a low rate environment may require structural changes in the business model of some banking sectors.
• The European financial market is underdeveloped and not well integrated. The crisis has shown the need to further develop the European debt and capital markets as an alternative source of finance for European corporations. The deepening of the corporate debt market is especially important to free up bottlenecks in the distribution of bank credits.
Putting aside the negative risks going forward, the conditions for a strengthening of economic activity are met. This will be accompanied by acceleration of corporate investment in Europe. Looking beyond the cycle, the development of deeper financial markets across Europe would help to achieve better resource allocation, reduce the likelihood of entering secular stagnation, and better protect European economies against shocks.

PART II Investment finance148
Investment and Investment Finance in Europe European Investment Bank
We focus on the macro-financial environment of corporate investment in the EU, with a view to analysing how financing conditions, firms’ financial policies and banks’ credit supply conditions affect capital expenditure. The developments reviewed in this chapter support the view of a gradual normalisation over recent years, from adverse credit supply conditions to conditions broadly neutral for EU corporate investment overall, with some differences across groups of countries and types of firms. Asymmetric economic conditions between vulnerable and other economies continue to prevail, but are reducing. Cohesion countries are more affected by the retrenchment of cross-border financial flows. Small corporations are still facing tighter financing conditions.
We also find some evidence of increased financial soundness of the corporate sector, with some evidence of deleveraging, especially in vulnerable countries. As shown by the EBA 2016 stress test results, banks have also strengthened their balance sheets. However, their current valuation and its sensitivity to specific negative news or events suggest that they are continuing to evolve in a difficult environment. Looking forward, their capacity to accumulate capital may suffer from the environment of low and flat yields if it were to remain. Already, there are several signs that the business model of the European banking sector is being challenged.
This is one of the main risks with which the EU economy is confronted. Others such as the resurgence of uncertainty following the Brexit referendum, the persistent decline in long-term growth and the likelihood of entering a so-called secular stagnation scenario are also to be taken into consideration.
The current macro-financial environment results in a challenging situation for the financial system, banks and central banks, but also pension funds and more widely investment funds. So far, the financial system has proved relatively resilient, but its capacity to channel savings into their most efficient use may be harmed. On the monetary policy front, many of the parameters of current policies are close to their limits. The longer the current environment of low and flat yields remains in place, the higher the likelihood that the detrimental effects predominate.
In a context where monetary policy may start reaching the limits of what it can do to re-inflate the economy and keep price expectations anchored, support from other policies is urgently needed. On top of demand policy, structural policies aimed at deepening capital markets are needed. The European stock market remains undersized and Europe is missing a liquid and unified corporate debt market. The Banking Union and Capital Market Union (CMU) should become two pillars for increasing the efficient allocation of capital within the EU. The progress achieved since the crisis provides grounds for some cautious optimism but advancing more quickly and deeply in setting them up would increase the capacity of the EU economy to withstand the risks going forward.
This chapter consists of five sections and three boxes. In the first section, we review the macroeconomic environment surrounding corporate investment. Financial conditions have improved, but the negative impact of the rise in uncertainty resulting from the Brexit referendum may be expected. In the second section, we review the changes in worldwide cross-border financial flows in the aftermath of the financial crisis, with special attention devoted to countries belonging to the European Union. We show that FDI flows have proved relatively more resilient but intra-flows towards cohesion countries are still well below the pre-crisis level and several indicators suggest that the European financial system remains fragmented, thereby limiting the possibilities of risk-sharing. In the third section, we analyse the changes which have occurred regarding the financing of corporate capital expenditure. Financial resilience has increased along with reduced debt, a rise in income, a longer debt maturity structure

Investment finance PART II 149
European Investment Bank Investment and Investment Finance in Europe
and decreases in the cost of borrowing triggered by monetary policy. In the fourth section, we review the strengths and weaknesses of the EU banking sector. We show that banks go through a period of structural transformation and are probably affected by weak investor preference. The evolution of their balance sheets since the crisis will enable them to withstand current economic conditions as long as the low interest rate environment and the flat yield curve do not persist for too long. Section 5 concludes. The first box focuses on project finance and its attractiveness and peculiarity in comparison to corporate finance. The second box sheds some light on the role of demand and credit conditions in explaining the different pattern of financial flows in vulnerable and other countries. The third box presents models of bank lending rate pass-through to show that the risk components, mostly external to corporations, have contributed to raising bank lending spreads in the wake of the sovereign debt crisis.
4.1. Non-financial corporates’ investment in the
current macro-financial environment In mid-2016, eight years after Lehman´s bankruptcy, EU GDP was around its pre-crisis level while investment and bank loans remained at a lower level. So far, as shown in detail in Chapter 1, the recovery which started after the sovereign debt crisis has remained lacklustre. A debate has emerged about the causes of the weak recovery in a context of very accommodative monetary policy. Some have advanced the hypothesis of secular stagnation while others have evoked a deep debt deflation episode. In Europe, the deleveraging pressure has been uneven, but was especially strong in vulnerable countries during the sovereign debt crisis (Box 2). More recently, since the end of June 2016, risks of an even weaker recovery have increased, along with the prospect of Brexit.
4.1.1. Ongoing recovery but investment abnormally weak…Across Europe, the decline in bank loans came to a halt in 2015 and NFCs’ investment picked up in 2016 (Figure 1). However, the recovery in capital expenditure appears subdued compared to previous historical episodes of recovery, such as in 2005. NFCs’ investment remains well below its pre-crisis level and the investment share is well below its average value since the end of the nineties (Figure 2). While, after several years of weak investment, the reversion of investment towards this long-run value can be expected to provide support for investment, expectations such as those entailed in consensus economics support the view of a marginal acceleration of EU NFCs’ investment this year and the next. This comes at odds with the very accommodative monetary policy stance and the fiscal stance as well as specific policy measures such as the so-called Juncker Plan. Indeed, as shown in Chapter 1, the long-run historical relationship between investment, demand, profits and the cost of borrowing accounts for part of the subdued capital expenditure. The projected strengthening of both domestic and external demand, and the historically low cost of external financing, should indeed provide stronger support for investment growth.

PART II Investment finance150
Investment and Investment Finance in Europe European Investment Bank
Figure 1 Real investment growth (Annual growth rate, %, 4-qtr moving average)
Figure 2 Investment share in GDP (nominal, 4-qtr moving average)
Vulnerable Euro areaEU Cohesion (rhs)Core
-20
-15
-10
-5
0
5
10
2000
20
02
2004
20
06
2008
20
10
2012
20
14
2016
0.090
0.095
0.100
0.105
0.110
0.115
0.120
0.125
0.130
2000
20
02
2004
20
06
2008
20
10
2012
20
14
2016
-30-25-20-15-10-5051015202530
0.11
0.12
0.13
0.14
0.15
0.16
Source: ECON calculations based on Eurostat. Note: 4-quarter moving average. “Core countries” include Austria, Belgium, Germany, Denmark, Finland, France, Luxembourg,
the Netherlands, Sweden and the UK. “Vulnerable Member States” (VMS) include Cyprus, Greece, Spain, Ireland, Italy, Slovenia and Portugal. “Cohesion countries” include Bulgaria, the Czech Republic, Estonia, Hungary, Lithuania, Latvia, Malta, Poland, Romania and Slovakia. The availability of the series depends on the indicator and the country. Hence, it is not possible to maintain a constant composition. For some, the country may be missing over the whole period. For others, it may have reported during the recent past only. In this case, the aggregate series is back-cast using a changing composition.
4.1.2. … despite accommodative policies… The past negative surprises in corporate investment conditional upon the macroeconomic environment are striking as financial fragmentation diminishes across the euro area, financing conditions have improved and both monetary and fiscal policies appear supportive. On the one hand, the fiscal stance is assessed to be slightly supportive (EC 2016 spring forecast), and the Juncker Plan is becoming an important tool for supporting demand. On the other hand, the very accommodative monetary policy stance has successfully contributed to reducing the cost of external financing for NFCs, with non-standard measures (NSMs) in place to restore its transmission to the real economy.
More precisely, regarding monetary policy, across Europe several central banks have cut further the levels of monetary policy rates, and some, such as the Central Bank of Denmark, the Riksbank, and the ECB have entered into a so-called negative interest rate policy (NIRP) (Figure 3). Consequently, money market rates have become negative, and it has become clear that the Zero Lower Bound is below zero. The Zero Lower Bound corresponds to the monetary policy rate below which the resulting deposit rate in the banking sector would lead corporations and households to withdraw their bank deposits and hoard cash. Given, on the one hand, the uncertainty regarding the level of the ZLB and the impairments in the monetary transmission mechanism, and, on the other, the need to provide further monetary accommodation to restore a level of inflation ensuring the anchoring of inflation expectations, the cuts in monetary policy rates have been augmented by other measures, known as NSMs. Among these are forward guidance, liquidity injection measures and/or the asset purchase programme (APP) – first sovereign bonds, asset-backed securities and covered bonds, then bank debt and more lately, since June 2016, corporate bonds.2 The policy package has contributed to flattening the safe risk yield curve so that a larger portion of it has entered negative rate territory. Even the long-end of the sovereign yield curve has also gone down substantially and stands at an historically exceptionally low level (Figure 4).
2 The full-allotment policy as well as the extension of the pool of collateral may also be considered as part of the NSMs.

Investment finance PART II 151
European Investment Bank Investment and Investment Finance in Europe
Figure 3 Money market rates in the US and selected EU economies (% p.a., 3-month maturity)
Figure 4 10-year nominal government bond yields in the EU (% p.a.)
-1
0
1
2
3
4
5
6
7
Sweden UK USEuro area
02-2
000
02-2
016
02-2
014
02-2
012
02-2
010
02-2
008
02-2
006
02-2
004
02-2
002
0
1
2
3
4
5
6
7
8
0
1
2
3
4
5
6
7
8
interquartile range (50%) Euro area average
04-2
000
04-2
015
04-2
012
04-2
009
04-2
006
04-2
003
Source: Thomson Reuters.Note: last observation: September 2016.
Taking a longer-term perspective, long-term yields have declined in all euro area countries in the past three decades, possibly not only owing to the decline in inflation or, more recently, non-standard measures. In mid-2016, 18% (40%) of the world economy, weighted by GDP, is operating in an environment of negative (below 1%) central bank policy rates (Draghi, 2016). For most of the developed economies, government bond yields remain in negative territory over a large portion of the maturity spectrum (Figure 5).
Figure 5 Government bond yields in negative territory
SwitzerlandJapanGermanyNetherlandsFinlandAustriaSwedenFranceBelgiumDenmarkSpainItalyNorwayUKUS
1 2 3 4 5 6 7 8 9 10 30
Negative yield
Positive yield
Source: ECON calculations based on Thomson Reuters.Note: The x-axis refers to the maturity of the bonds in years. The countries in bold and italics belong to the EU. The graph refers to
the yields recorded in July 2016.
There are two main views on the main drivers of interest rates since the crisis, one related to cyclical factors, the “financial cycle”, and the other related to structural factors, “secular stagnation”. Each has very different implications in terms of outlook and policies required.

PART II Investment finance152
Investment and Investment Finance in Europe European Investment Bank
According to the secular stagnation view (Hansen 1939), the current exceptional policy configuration reflects a strong decline in the neutral rate of interest, the monetary policy rate consistent with price stability when output is at its potential level. In turn, the lower neutral rate of interest results from ageing, lower demographic growth and slower technological progress, as well as possibly capital scrapping and the global saving glut.
The natural rate of interest may currently not be reachable owing to the ZLB, and this is one of the reasons why monetary policy needs to deploy non-standard measures to produce an equivalent monetary stimulus. Indeed, several analysts, commentators and policy makers have recognised the disappointing recovery of advanced economies despite the low levels of rates recorded for a long time (William, 2016). The reason is that the industrial world is plagued by an increasing propensity to save and a declining propensity to invest, resulting in a declining equilibrium real interest rate (Constâncio, 2016, ICMBS, 2015, Hördah et al., 2016). In such a secular stagnation scenario for Europe, potential growth is adjusted downward substantially, as the EU is ageing, agents revise their anticipations, productivity growth recedes and political pressures towards a reversal of the globalisation trend or EU construction strengthen.
Rachel and Smith (2015) estimate that structural factors can account for a decline of up to 450 bps in long-term real interest rates over the past 30 years. An empirical analysis by the IMF (2014) shows that common forces explain a large part of the worldwide decline in real rates. According to a principal component analysis, the weight of the first component of the variation in real rates at the global level increased from 55% between 1980 and 1995 to 75% between 1995 and 2012. Some estimates even point to a negative neutral interest rate currently in the euro area and more widely in Europe (Holston, Katryn, and Laubach, 2016). In this case, it is possible that the real interest rate will not increase back to a positive “normal” level (Eggertsson and Woodford, 2003).
An alternative to the secular stagnation view is provided by the debt cycle view, developed in section 3. In this case, low interest rates prevail for a long period but are not permanent, financial risks increase as the financial sector changes, the banking sector must shrink, the economy adjusts painfully, and deleveraging is slower/more costly as growth weakens. While the two views are usually presented as alternatives, they share common ground. Corporate deleveraging puts additional downward pressures on long-term interest rates. Furthermore, the long period of low activity with which it is associated leads economic agents to revise downward long-term anticipations of economic growth, thereby reinforcing the adverse impact of lower productivity and demographic trends.
4.1.3. … and loosened financing conditions When filtering a large number of financial indicators available at relatively high frequency, the signal received is that, overall, financial conditions have remained relatively stable since 2015 in comparison to the marked swing recorded since the crisis. This assessment is confirmed by looking at the VIX indicator only up until the Brexit referendum (Figure 12). In mid-2016, financing conditions are estimated to be loosened compared to their level in 2014 (Figure 6). As they normalise, they are no longer hampering the economic outlook and investment, and, in some cases, are considered to be supportive.
Given the transmission lags, the past tighter financial conditions are estimated to have contributed to negatively affecting industrial production up until mid-2015 (Figure 7). But, since mid-2015, they have contributed to pushing up activity, compressing bank lending spreads and increasing loan demand. In the very last months, a slight reversal of the positive trend has been observed. This may be the first signs of the uncertainty shock surrounding the prospect of Brexit as, while the result of the referendum was not widely anticipated, the uncertainty it created contributed to creating volatility across financial markets.
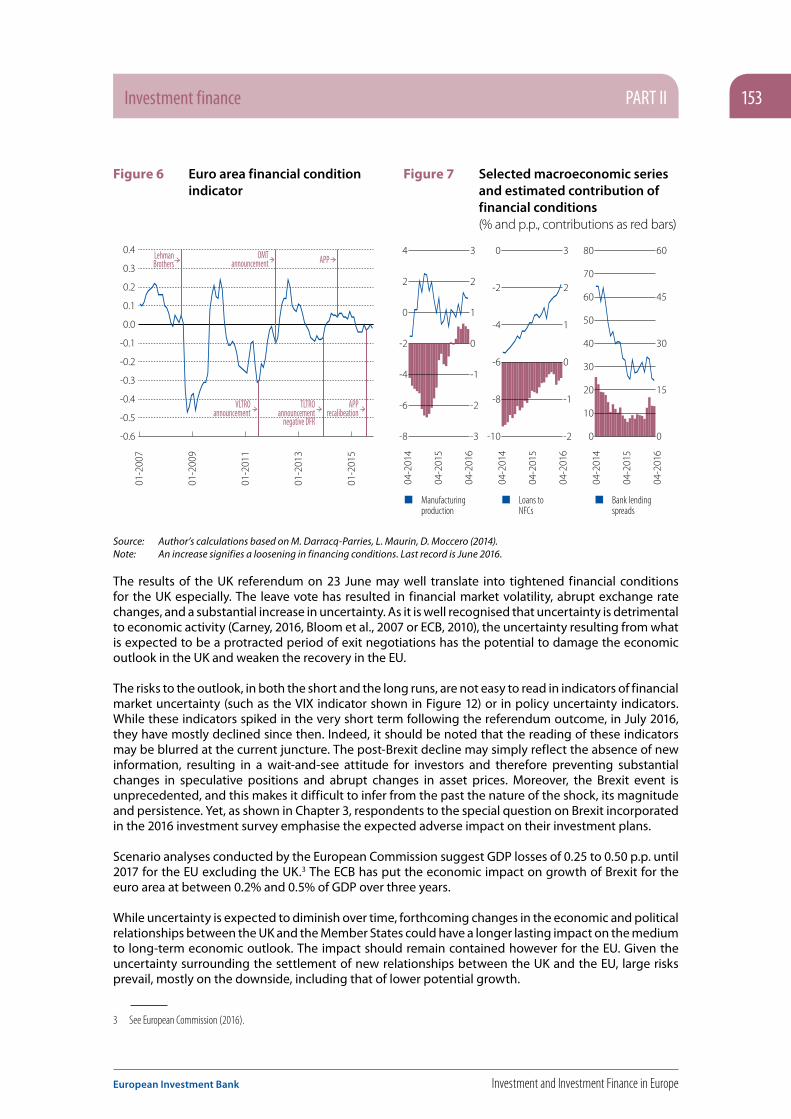
Investment finance PART II 153
European Investment Bank Investment and Investment Finance in Europe
Figure 6 Euro area financial condition indicator
Figure 7 Selected macroeconomic series and estimated contribution of financial conditions (% and p.p., contributions as red bars)
-0.6
-0.5
-0.4
-0.3
-0.2
-0.1
0.0
0.1
0.2
0.3
0.4
01-2
007
01-2
015
01-2
013
01-2
011
01-2
009
LehmanBrothers
VLTROannouncement
TLTROannouncement
negative DFR
APPrecalibeation
OMTannouncement APP
-3
-2
-1
0
1
2
3
-2
-1
0
1
2
3
0
15
30
45
60
04-2
014
04-2
015
04-2
016
04-2
014
04-2
015
04-2
016
04-2
014
04-2
015
04-2
016
-8
-6
-4
-2
0
2
4
-10
-8
-6
-4
-2
0
0
10
20
30
40
50
60
70
80
Manufacturing production
Loans to NFCs
Bank lending spreads
Source: Author’s calculations based on M. Darracq-Parries, L. Maurin, D. Moccero (2014). Note: An increase signifies a loosening in financing conditions. Last record is June 2016.
The results of the UK referendum on 23 June may well translate into tightened financial conditions for the UK especially. The leave vote has resulted in financial market volatility, abrupt exchange rate changes, and a substantial increase in uncertainty. As it is well recognised that uncertainty is detrimental to economic activity (Carney, 2016, Bloom et al., 2007 or ECB, 2010), the uncertainty resulting from what is expected to be a protracted period of exit negotiations has the potential to damage the economic outlook in the UK and weaken the recovery in the EU.
The risks to the outlook, in both the short and the long runs, are not easy to read in indicators of financial market uncertainty (such as the VIX indicator shown in Figure 12) or in policy uncertainty indicators. While these indicators spiked in the very short term following the referendum outcome, in July 2016, they have mostly declined since then. Indeed, it should be noted that the reading of these indicators may be blurred at the current juncture. The post-Brexit decline may simply reflect the absence of new information, resulting in a wait-and-see attitude for investors and therefore preventing substantial changes in speculative positions and abrupt changes in asset prices. Moreover, the Brexit event is unprecedented, and this makes it difficult to infer from the past the nature of the shock, its magnitude and persistence. Yet, as shown in Chapter 3, respondents to the special question on Brexit incorporated in the 2016 investment survey emphasise the expected adverse impact on their investment plans.
Scenario analyses conducted by the European Commission suggest GDP losses of 0.25 to 0.50 p.p. until 2017 for the EU excluding the UK.3 The ECB has put the economic impact on growth of Brexit for the euro area at between 0.2% and 0.5% of GDP over three years.
While uncertainty is expected to diminish over time, forthcoming changes in the economic and political relationships between the UK and the Member States could have a longer lasting impact on the medium to long-term economic outlook. The impact should remain contained however for the EU. Given the uncertainty surrounding the settlement of new relationships between the UK and the EU, large risks prevail, mostly on the downside, including that of lower potential growth.
3 See European Commission (2016).

PART II Investment finance154
Investment and Investment Finance in Europe European Investment Bank
4.2. How persistent are the changes in cross-border investment flows in Europe?
International financial flows play a central role in the international monetary system, not just because they represent the necessary counterpart to trade flows. Together with trade flows, they act as a powerful channel through which domestic shocks are transmitted across borders. In good times, they channel savings to the countries and regions of the world where they are most productive. In crisis times, they have the potential to disrupt the domestic financial systems of the most dependent economies. Hence, close monitoring of international financial flows is key to assessing the state of the global economic environment and the risks surrounding it.
In recent years, international capital flows have registered profound changes, not only in terms of their magnitude but also in terms of geographical distribution and composition, bank flows, foreign direct investment, and portfolio (debt and equity) flows. Besides, in Europe, the sovereign debt crisis triggered a process of defragmentation of the financial system. This resulted in fewer intra-Europe cross-border financial flows. In this section, we highlight the recent evolution of international financial flows with a special focus on intra-European flows. We provide evidence of the resilience of foreign direct investment and show that the European financial system remains fragmented.
4.2.1. The “Great Retrenchment” of gross international financial flows seems fairly persistent and applies mainly to Europe and advanced economies
The decade preceding the financial crisis which erupted in 2008 was one of financial globalisation. The ramping-up of international capital flows and the accumulation of external assets and liabilities in the decades preceding the global financial crisis were perhaps even more dramatic than the already impressive acceleration of trade flows and the development of current account imbalances that took place over this period. As suggested by the index of Chinn and Ito (2008), part of the robust expansion of gross financial flows can be related to increased financial liberalisation and greater capital account openness (Figure 8).

Investment finance PART II 155
European Investment Bank Investment and Investment Finance in Europe
Figure 8 Capital account openness and the pre-crisis boom of gross inflows (as % GDP)
Figure 9 Post-crisis, global financial flows settled at a lower level (4-qtr moving average)
0.0
0.2
0.4
0.6
0.8
1.0
-0.5
0
0.5
1.0
1.5
2.0
2.5
3.0USD Trillions
1980 1985 1990 1995 2000 Q12005
Q12007
Q12009
Q12011
Q12013
Q12015
2005 2010 2015
As % of GDP
Index EME (lhs) Index ADV(lhs)
Inflows EME(rhs, % GDP) Inflows ADV(rhs, % GDP)
0
5
10
15
20
25
Level (left) % of GDP (right)
-2%
0%
2%
4%
6%
8%
10%
12%
Source: Chinn-Ito Index and ECON calculations based on IMF balance of payments statistics.
Note: EME consists of Latin America, Central and Eastern Europe, Emerging Asia. ADV consists of North America, Western Europe, Asia (China is not included). 2015 data partially extrapolated.
Source: ECON calculations based on IMF balance of payments statistics.
Note: World capital outflows. Last record, 2015Q4, partially extrapolated.
In the years preceding 2008, gross international financial flows were very substantial, hovering around 8% of global GDP from 2005 to 2007.4 The onset of the financial crisis in the summer of 2007 put a sudden stop to that flourishing regime and in the second quarter of 2008, international financial flows were abruptly reduced. In addition, the Lehman event set the stage for the banking collapse in the fourth quarter of 2008, when aggregate gross flows massively retrenched (Figure 9). In that quarter alone, their reversal was equivalent to -2% of global GDP.
Since then, gross cross-border financial flows have not returned to the buoyancy of the pre-crisis period, settling at a “new average” of around 4% of GDP in 2015. This muted revival is puzzling as it could mean, if it persists, that the global economy is becoming more fragmented than it used to be, after decades of increasing globalisation. Moreover, it raises questions about whether the pre-crisis intensification of global financial linkages was too exuberant.
The retrenchment in international financial flows seems to affect all economic regions, albeit to a different extent, being more pronounced for advanced than for emerging market economies. The EU has recorded significantly lower flows since the outburst of the crisis: in 2009, net flows declined by 3% of GDP (Figure 10). Among EU countries, the “core” ones suffered the largest shrinkage of net flows, of around 3.5% of GDP in 2009. In 2015, however, net flows sharply recovered, thereby driving the increase also recorded at the EU level, but gross flows remain well below their pre-crisis levels. Moreover, the increase in net flows recorded for “vulnerable” countries was much less pronounced, and, contrastingly, the “cohesion” countries continued to record diminishing net flows.5
4 International financial flows suffer from measurement problems and reconciling stock and flow measures is a further challenge. For this reason, we need to rely on different data sources, including the IMF Balance of Payments database, BIS Locational Banking Statistics and the TICS data for the US.
5 For a more detailed perspective on EU international financial flows in comparison to the rest of the world, see Bussière, Schmidt and Valla (2016).

PART II Investment finance156
Investment and Investment Finance in Europe European Investment Bank
These flows mirror the changes in the current account. In the EU, after having been substantially positive from 2012 to 2014, it became negative again in 2015. Looking at the core countries, and distinguishing between euro area and non-euro area Member States, it appears that the shift in the current account, from a substantial surplus in 2014 to a deficit in 2015 reflected the increase in the current account deficit of non-euro area countries, mostly the UK and Denmark. Core country members of the euro area continued to record a current account surplus of around 3% GDP at the end of 2015, mostly on the back of the very large current account surplus in Germany. Since the start of the sovereign debt crisis, both vulnerable and cohesion countries have recorded a major adjustment in their current account balance. At the end of the period, the current account of vulnerable countries is balanced and that of cohesion countries is in surplus. The changes in the current account balance have been mirrored by changes in the three main components of the financial balance, as we now analyse.
Figure 10 Evolution of capital outflows and inflows in the EU (level, USD trillions, lhs, and net flows in % GDP, rhs, both 4-qtr moving average)
European Union
Outflows Inflows Net inflows
-8
-4
0
4
8
-8
-4
0
4
8
-5.0%
-2.5%
0.0%
2.5%
5.0%
2001
Q1
2003
Q1
2005
Q1
2007
Q1
2009
Q1
2011
Q1
2013
Q1
2015
Q1
Core Countries
-8
-4
0
4
8
-8
-4
0
4
8
-5.0%
-2.5%
0.0%
2.5%
5.0%20
01Q1
2003
Q1
2005
Q1
2007
Q1
2009
Q1
2011
Q1
2013
Q1
2015
Q1
2001
Q1
2003
Q1
2005
Q1
2007
Q1
2009
Q1
2011
Q1
2013
Q1
2015
Q1
2001
Q1
2003
Q1
2005
Q1
2007
Q1
2009
Q1
2011
Q1
2013
Q1
2015
Q1
Vulnerable Countries
-2
-1
0
1
2
-2
-1
0
1
2
-10%
-5%
0%
5%
10%
Cohesion Countries
-0.4
-0.2
0.0
0.2
0.4
-10%
-5%
0%
5%
10%
Source: ECON calculations based on IMF balance of payments statistics.Note: See note to Figure 1 for the definition of the country groups. 4-quarter moving average. The net inflows are obtained by
subtracting outflows from inflows. A positive (negative) inflow is associated with a current account deficit (surplus)

Investment finance PART II 157
European Investment Bank Investment and Investment Finance in Europe
4.2.2. The composition of international financial flows also changed
The collapse of international financial flows described above and the sharp shifts in the current account balances have been mirrored by uneven changes across the main categories of the financial account, foreign direct investment, equity and debt instruments in international portfolios, and “other investment” encompassing mostly bank flows.6 Although all types of flows have been affected by the slowdown, some have been significantly more resilient than others, resulting in a marked change in the composition of financial flows. For each group of EU countries and each type of flow, we constructed a synthetic indicator that reflects the changes by type of flow, inflows and outflows. The indicator, called the “retrenchment ratio”, reports the difference between the value of these flows in the pre-crisis period (2005Q1–2007Q2) and the post-crisis period (2012Q1–2014Q4) in relation to GDP. Table 1 reports the retrenchment indicator computed at the level of each of the main categories.
Table 1 Retrenchment indicator decomposed across main categories (% GDP)
Source: Authors' calculations on the basis of IMF Balance of Payments (BoP) data (restricted sample). Note: Difference between average annual flows after the crisis (2012Q1-2014Q4) and before (2005Q1-2007Q2). CORE stands for
Core Countries in the EU, VUL for Vulnerable Countries, COH for Cohesion Countries.
The retrenchment indicator shows that the collapse of the other investment category explains the bulk of the financial retrenchment in Europe. It is particularly pronounced for core and vulnerable countries. This is related to the confidence crisis faced by the European banking sector in the wake of the sovereign debt crisis, which contributed to the fragmentation of the European financial system. This led it to undertake a deleveraging process, predominantly operated on external assets. This process lowered cross-border lending by banks to other financial institutions. Consequently, in Europe, local lending by foreign bank affiliates may now substitute for cross-border lending (IMF, 2015). This particularly suits the CESEE region, where roughly 50% of the international banks active in the area signal intentions to expand operations in the foreseeable future, albeit to a different extent among countries. Notably for the cohesion countries, the retrenchment of the other investment component has been much less pronounced in absolute terms and mostly focused on a reduction of inflows. This is associated with the specific nature of the banking sector in the region, which is dominated by international banks that used to finance local market development via direct funding from the parent company. As the crisis started, net inflows of intra-company loans declined, but massive outflows were prevented in the context of a gradual rebalancing of the local banking model towards more domestic financing.7
Turning to the other flows, one can note that the fall in FDI flows recorded in Western Europe was mainly driven by core countries, on the outflows side, and had a large impact on FDI inflows in cohesion countries, which declined much more than portfolio flows. Finally, portfolio category flows have fallen substantially in Western Europe, with the fall being less pronounced for equity flows.
Figure 11 shows the resulting changes in the composition of international financial flows in Europe. In the core countries, the other investment category (mostly bank flows) used to account for 47% of total
6 By construction, the current account balance mirrors the financial balance and the capital balance.7 See EIB (2016), “CESEE Bank Lending Survey, H1-2016”.
Outflows Inflows
Portfolio Equity
Portfolio Debt
Direct Investment
Other investment
Total Portfolio Equity
Portfolio Debt
Direct Investment
Other investment
Total
CORE -1.0 -5.3 -4.0 -19.8 -30.1 -0.7 -6.6 -2.0 -21.1 -30.4
VUL 0.8 -6.2 -2.9 -10.9 -19.2 1.4 -14.1 0.1 -12.2 -24.8
COH -0.4 -0.1 -2.0 -0.7 -3.2 0.5 -0.2 -3.4 -4.2 -7.3
EU -0.5 -5.6 -3.9 -17.6 -27.5 -0.2 -8.3 -1.5 -18.8 -28.7

PART II Investment finance158
Investment and Investment Finance in Europe European Investment Bank
flows before the crisis, whereas after the crisis they constitute a much smaller share of the total (8%). Conversely, the share of FDI has substantially increased in the core countries as well as the vulnerable countries. Differently in the cohesion countries, the decline in the share of other investment was not matched by an increase in the share of FDI flows but mostly by a shift towards portfolio flows. Within the portfolio category, the different paths described above have also led to a considerable reallocation: before the crisis, portfolio debt used to be two-thirds of the size of equity flows in the core and vulnerable countries, whereas they are now of roughly equal magnitudes in the former and in opposite proportions in the latter. On the other hand, one can notice portfolio debt overtaking equity flows after the crisis in the cohesion countries.
Figure 11 The resilience of direct investment and equity flows contrasts with the contraction of bank flows and portfolio debt (average annual level, USD billions or millions)
pre-crisis post-crisis pre-crisis post-crisis
Core Countries Vulnerable Countries Cohesion Countries
USD
Tril
lions
0.0
0.5
1.0
1.5
2.0
2.5
-0.1
-0.0
0.1
0.2
0.3
0.4
0.5
0
5
10
15
20
25
30
35
Portf
olio
Equit
y
Portf
olio
Debt
Portf
olio
Inves
tmen
t
FDI
Othe
rInv
estm
ents
Portf
olio
Equit
y
Portf
olio
Debt
Portf
olio
Inves
tmen
t
FDI
Othe
rInv
estm
ents
Portf
olio
Equit
y
Portf
olio
Debt
Portf
olio
Inves
tmen
t
FDI
Othe
rInv
estm
ents
pre-crisis post-crisis
Source: ECON computations based on IMF balance of payments statistics.Note: See footnote to Table 1 for the definition of the periods.
The changing composition of international financial flows documented above is a striking feature of the global economic environment. Weak economic activity is both a factor that could have triggered this change and at the same time, since negative shocks are transmitted through financial linkages, a consequence of weaker financial flows. Another key feature to emphasise is that some types of flows seem to be inherently more volatile than others. In this respect, bank flows and portfolio flows are often described as “hot money” (see, for instance, Bluedorn et al., 2013). By contrast, FDI flows are typically more stable over time, which is why they are generally considered to be a safer form of financing (in addition to other benefits they carry, such as technological transfers). Also, within portfolio flows, equities have been more resilient than debt. Yet, overall, the behaviour of financial flows after the global financial crisis has therefore been faithful to their reputation: “hot money” (with the exception of equity flows) has evaporated quickly, whereas FDI has been more robust (Table 2).
Table 2 Volatility of flows by sectors and by sub-periods (Coefficient of variation, entire world)
Source: ECON calculations based on IMF balance of payments statistics. Note: See footnote to Table 1 for definition of the periods.
Outflows Inflows
Portfolio Equity
Portfolio Debt Direct Investment
Other investment
Portfolio Equity
Portfolio Debt
Direct Investment
Other investment
CORE 0.36 0.23 0.30 0.54 0.34 0.25 0.25 0.58
COH 0.41 0.63 0.26 2.53 0.39 0.46 0.32 6.74
EU 0.87 1.08 0.33 2.35 0.78 0.67 0.33 2.46

Investment finance PART II 159
European Investment Bank Investment and Investment Finance in Europe
Among the possible explanatory factors, the paper by CGFS (2011) highlighted the role of risk aversion, proxied by the VIX index. Figure 12 reports the VIX, together with the policy indicators calculated by Bloom (2014) and Bloom et al. (2007). The rise of the VIX in the wake of Lehman Brothers correlates well with the drop in capital flows that took place during this period. The VIX has considerably abated since then, but this is not associated with a rebound in capital flows. Other uncertainty indicators do not seem to point to a high degree of uncertainty in recent years, suggesting that uncertainty does not play a central role in the weakness of financial flows. To some extent, the fall in bank flows could be interpreted as a correction from the “global banking glut” that prevailed in the pre-crisis period (Shin, 2011), through which European banks helped to enhance intermediation capacities in the US. These considerations represent a convincing argument as to why it is important to look at gross and not just net international financial flows.
The consequences of these changes, for financial stability issues, are not clear at this stage. The fact that the share of “hot money” has gone down while that of FDI has increased may lead to a more stable international monetary system, although “hot money” may actually impose discipline on the receiving countries. The changes that have taken place since the global financial crisis may correspond to a simple normalisation, after “exuberant” times in the pre-crisis period (see B. Coeuré, 2015).
4.2.3. Post-crisis stigma, fragmentation and bottleneck in the allocation of savings?
Besides the implications for financial stability, the reduction in intra-European capital flows may hamper European convergence by limiting the allocation of savings to their most productive use. A simple regression shows that indeed the response of domestic investment to domestic saving has increased on two occasions since the beginning of 2003 (Figure 13), after the Lehman bankruptcy and during the sovereign debt crisis. Theoretically, as argued by Feldstein and Horioka (1986), and later Obtsfeld (1994), in a world of perfect capital mobility, capital expenditure should be independent from domestic savings. Hence, the elasticity of investment to domestic savings should be close to zero. Figure 13 plots the median and the confidence interval of the time-varying coefficient obtained from individual regressions on EU countries. The figure shows important changes across the period, with the coefficient becoming significant at the 60% level in the wake of the Lehman bankruptcy when capital markets froze. The increase was much more pronounced during the sovereign debt crisis but the coefficient remained not significant at the 60% level, showing that, differently from the Lehman episode, not all European countries were affected. While having started to decline again at the end of the period, the coefficient remains relatively high. However, this does not necessarily reflect an elevated degree of fragmentation. Indeed, being estimated over a rolling window of 16 quarters, the value at the end of 2015 reflects an average over the period 2012 to 2015. Hence, by construction, the coefficient lags latest developments.

PART II Investment finance160
Investment and Investment Finance in Europe European Investment Bank
Figure 12 The role of the VIX and uncertainty indicators (3-month moving average)
Figure 13 Slope of the regression of investment on domestic savings for EU countries (rolling regression, windows of 4 years)
USA VIX (rhs)EU Median 85th decile15th decile
2005 2007 2009 2011 2013 2015 0
100
200
300
0
200
400
600
-0.8
-0.4
0.0
0.4
0.8
1.2
2003
Q1
2005
Q1
2007
Q1
2009
Q1
2011
Q1
2013
Q1
2015
Q1
Source: Scott R. Baker, Nicholas Bloom and Steven J. Davis (2016). http://www.policyuncertainty.com
Note: Last record is June 2016 except for the EU (July 2016).
Source: ECON calculations based on Eurostat.Note: Based on the distribution of the values estimated
with an OLS static regression including a constant.
Another indication of the degree of fragmentation of the European banking sector is provided by the evolution of cross-border asset holdings, loans and debt securities. After the sovereign debt crisis, the European financial system became fragmented. Cross-border financial flows diminished substantially mostly on the back of reduced investment in assets issued in other Member States, by governments Figure 14, banks Figure 15, or corporates. While the reduction has come to a half since the end of the sovereign crisis, so far the recovery in cross-border financial flow has remained subdued. This suggests that the financial system remains fragmented. Low intra-European financial flows limit the scope to benefit from risk-sharing as well as the potential to enhance economic growth with an efficient allocation of savings (see Alcidi and Thirion, 2016).
Figure 14 Euro area MFI holdings of government debt securities (EUR billions)
Figure 15 Euro area MFI holdings of MFI debt securities (EUR billions)
Government bonds issued by domestic Member StateGovernment bonds issued by another Member State
0
500
1000
1500
2000
1999
Q1 20
01Q1
2003
Q1 20
05Q1
2007
Q1 20
09Q1
2011
Q1 20
13Q1
2015
Q1
Loans, EA domestic
Loans, EU non-EA
Loans EA non-domestic
0
2000
4000
6000
8000
1999
Q1 20
01Q1
2003
Q1 20
05Q1
2007
Q1 20
09Q1
2011
Q1 20
13Q1
2015
Q1
Source: ECON calculations based on ECB.
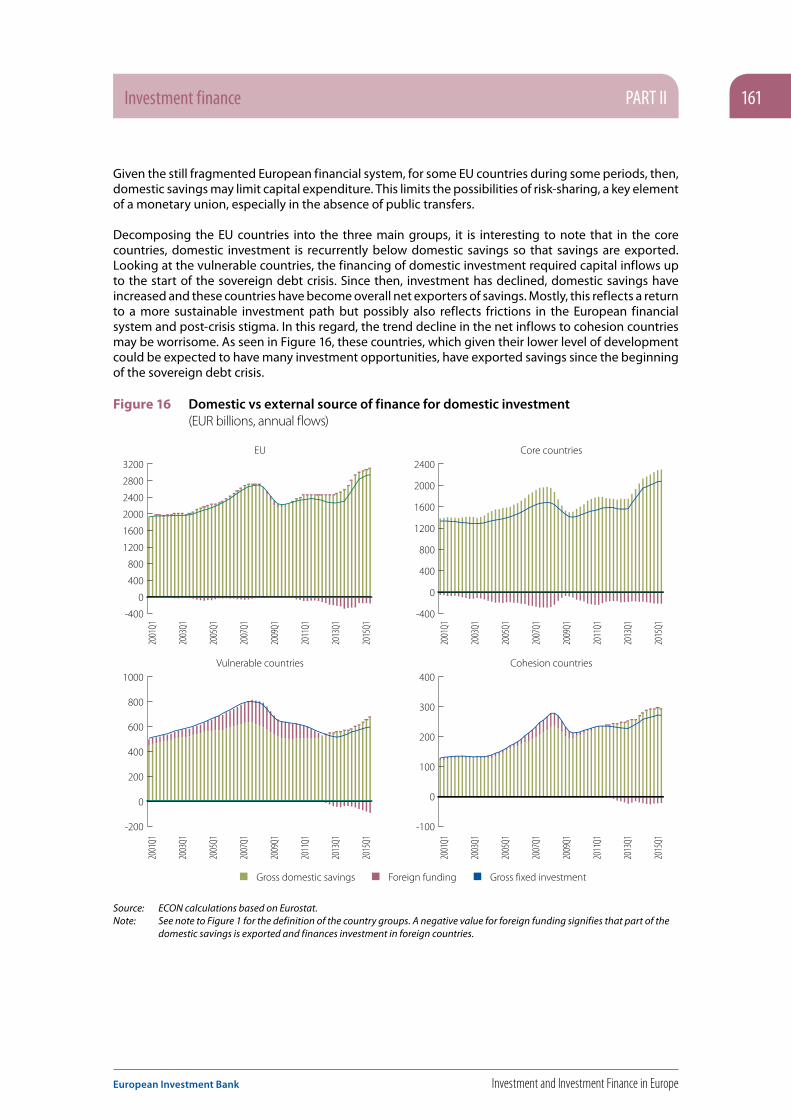
Investment finance PART II 161
European Investment Bank Investment and Investment Finance in Europe
Given the still fragmented European financial system, for some EU countries during some periods, then, domestic savings may limit capital expenditure. This limits the possibilities of risk-sharing, a key element of a monetary union, especially in the absence of public transfers.
Decomposing the EU countries into the three main groups, it is interesting to note that in the core countries, domestic investment is recurrently below domestic savings so that savings are exported. Looking at the vulnerable countries, the financing of domestic investment required capital inflows up to the start of the sovereign debt crisis. Since then, investment has declined, domestic savings have increased and these countries have become overall net exporters of savings. Mostly, this reflects a return to a more sustainable investment path but possibly also reflects frictions in the European financial system and post-crisis stigma. In this regard, the trend decline in the net inflows to cohesion countries may be worrisome. As seen in Figure 16, these countries, which given their lower level of development could be expected to have many investment opportunities, have exported savings since the beginning of the sovereign debt crisis.
Figure 16 Domestic vs external source of finance for domestic investment (EUR billions, annual flows)
EU
Gross domestic savings Foreign funding Gross fixed investment
-400
0
400
800
1200
1600
2000
2400
2800
3200Core countries
-400
0
400
800
1200
1600
2000
2400
2001
Q1
2003
Q1
2005
Q1
2007
Q1
2009
Q1
2011
Q1
2013
Q1
2015
Q1
2001
Q1
2003
Q1
2005
Q1
2007
Q1
2009
Q1
2011
Q1
2013
Q1
2015
Q1
2001
Q1
2003
Q1
2005
Q1
2007
Q1
2009
Q1
2011
Q1
2013
Q1
2015
Q1
2001
Q1
2003
Q1
2005
Q1
2007
Q1
2009
Q1
2011
Q1
2013
Q1
2015
Q1Vulnerable countries
-200
0
200
400
600
800
1000Cohesion countries
-100
0
100
200
300
400
Source: ECON calculations based on Eurostat.Note: See note to Figure 1 for the definition of the country groups. A negative value for foreign funding signifies that part of the
domestic savings is exported and finances investment in foreign countries.

PART II Investment finance162
Investment and Investment Finance in Europe European Investment Bank
4.3. Can the balance sheet adjustment of NFCs explain the weakness in investment?
An alternative explanation of the weakness in investment is that, after the banking crisis, banks and corporations needed to deleverage to restore sound balance sheets (Lo and Rogoff, 1995). According to the “financial cycle” view, after years of relatively strong economic growth during which agents accumulated excessive debt on the basis of overly optimistic expectations of future income and revenues and a sharp regulatory adjustment, agents have to deleverage. The need to repay existing debt and also contract less new debt dampens investment spending. Household savings increase along a protracted corporate deleveraging process (Borio, 2012) and the interaction between the two behaviours reinforces the persistence of the cyclical dip (Cuerpo et al., 2013). The deleveraging process is weighing on investment and changes are at play in the corporate liability structure. The adjustment is long but the decline in economic momentum is not permanent and interest rates are expected to normalise at some point.
This section focuses on corporate finance and provides some elements supporting the debt supercyle view, as well as some analysis of the adjustment taking place within the euro area between core and vulnerable countries. Box 1 focuses on public project finance, a form of financing relatively developed in Europe where around half of the borrowers are located. The box details how its financial characteristics differ from those of corporate finance. It shows that, compared to corporate finance, this source of finance is more used for capital-intensive facilities and utilities and is associated with lower spreads.
4.3.1. Rebound in NFCs’ earnings accompanied by cash accumulation
While in the first years of the crisis, weak demand compressed internal financing capacity, more recently the start of a recovery in Europe has resulted in increased gross entrepreneurial income (Figure 17). This bodes well for corporate capital expenditure as retained earnings constitute around 70% of investment finance. As shown in Figure 17, the acceleration in gross entrepreneurial income was shared across the four EU groups. For the EU, core and vulnerable countries, the annual growth rate increased from around zero in the first half of 2013 to more than 5% in the first quarter of 2016. For cohesion countries, the acceleration over the period was very similar, but started from a higher level.
Higher gross entrepreneurial income has increased corporates’ financing capacity. Together with weaker capital expenditure, this has reduced the ratio of net borrowing over investment, similarly across country groups. Indeed, after the start of the financial crisis, since the middle of 2009, non-financial corporations have recorded negative financial gaps (Figure 18): they have invested less than their financing capacity. With the exception of the core countries, this is an unusual pattern over history since the beginning of the millennium. Moreover, the swing from net borrower to net saver is especially pronounced for cohesion countries and vulnerable countries. While for vulnerable countries, this may reflect the need for a sustained adjustment, it is difficult to explain for cohesion counties, which, being less advanced, should have more investment opportunities. From a macroeconomic perspective, since the financial crisis, in net terms, the European corporate sector has been providing savings to the rest of the economy. In 2015 and at the beginning of 2016, no major change was observed in this unusual pattern (Figure 18).

Investment finance PART II 163
European Investment Bank Investment and Investment Finance in Europe
Figure 17 Gross entrepreneurial income (annual growth rate, %, 4-qtr moving average)
Figure 18 Net borrowing over investment (%)
Vulnerable Euro areaEU CohesionCore
-20
-10
0
10
20
30
2000
2002
2004
2006
2008
2010
2012
2014
2016
-60
-40
-20
0
20
40
60
2000
2002
2004
2006
2008
2010
2012
2014
2016
Source: ECON calculations based on EUROSTAT sectoral accounts. Note: 4-quarter moving average of the annual growth rate of non-seasonally adjusted data. See note to Figure 1 for the
definition of the country groups.
Becoming net savers, European NFCs have improved their net financial position, partly by reducing debt, partly by accumulating financial assets. An interesting feature is that a large part of the asset accumulation has taken the form of the most liquid assets, cash and deposits (Figure 19). From the beginning of 2000 until the end of 2015, the ratio of cash and deposits of EU NFCs over GDP increased from 13% to 22%, a rise which was very similar among the group of countries. Nonetheless, it should be noted that the rise started well before the crisis, and does not seem to have accelerated since then. In fact, it is almost a trend increase over the period since 2000. Hence, it is difficult to disentangle what in the most recent developments reflects a reaction to the crisis – cash hoarding in the face of increased uncertainty – from other possible reasons, such as improvements in treasury management, or composition effects. The latter may be especially relevant. As shown by the Survey on the Access to Finance of Enterprises in the euro area (ECB, 2016), the level of liquid assets held by NFCs differs widely across companies as well as by size of enterprise. The percentage of firms reporting higher than usual levels of liquid assets minus those reporting levels lower than usual is positive, at 4% for large enterprises, but negative, at -11% for small and medium-sized enterprises (SMEs).8 Looking backward, the stronger cash position of European corporations reflects the lack of investment, at least in part, but looking forward, it is a relatively good sign as it reflects a stronger financial position. It reinforces the capacity to react quickly to a more pronounced pick-up in demand.
8 For a deeper analysis of the financing situation of SMEs in Europe, see the chapter “SME finance in Europe” in this report.
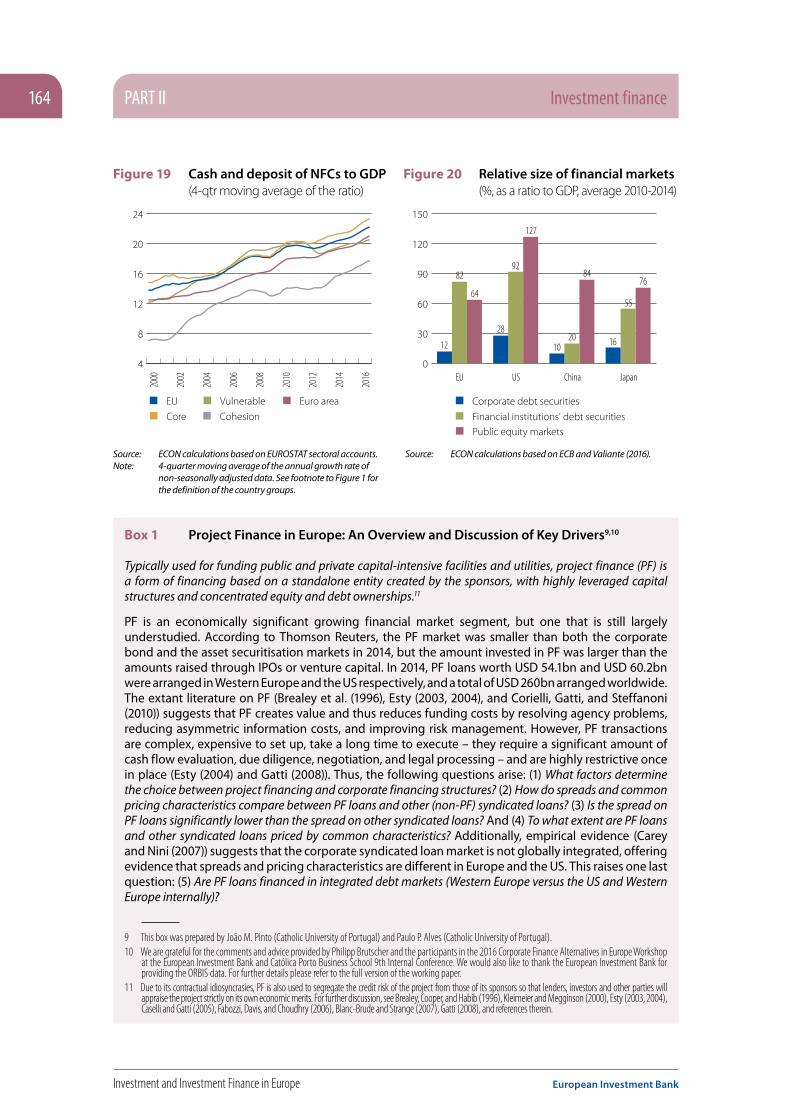
PART II Investment finance164
Investment and Investment Finance in Europe European Investment Bank
Box 1 Project Finance in Europe: An Overview and Discussion of Key Drivers9,10
Typically used for funding public and private capital-intensive facilities and utilities, project finance (PF) is a form of financing based on a standalone entity created by the sponsors, with highly leveraged capital structures and concentrated equity and debt ownerships.11
PF is an economically significant growing financial market segment, but one that is still largely understudied. According to Thomson Reuters, the PF market was smaller than both the corporate bond and the asset securitisation markets in 2014, but the amount invested in PF was larger than the amounts raised through IPOs or venture capital. In 2014, PF loans worth USD 54.1bn and USD 60.2bn were arranged in Western Europe and the US respectively, and a total of USD 260bn arranged worldwide. The extant literature on PF (Brealey et al. (1996), Esty (2003, 2004), and Corielli, Gatti, and Steffanoni (2010)) suggests that PF creates value and thus reduces funding costs by resolving agency problems, reducing asymmetric information costs, and improving risk management. However, PF transactions are complex, expensive to set up, take a long time to execute – they require a significant amount of cash flow evaluation, due diligence, negotiation, and legal processing – and are highly restrictive once in place (Esty (2004) and Gatti (2008)). Thus, the following questions arise: (1) What factors determine the choice between project financing and corporate financing structures? (2) How do spreads and common pricing characteristics compare between PF loans and other (non-PF) syndicated loans? (3) Is the spread on PF loans significantly lower than the spread on other syndicated loans? And (4) To what extent are PF loans and other syndicated loans priced by common characteristics? Additionally, empirical evidence (Carey and Nini (2007)) suggests that the corporate syndicated loan market is not globally integrated, offering evidence that spreads and pricing characteristics are different in Europe and the US. This raises one last question: (5) Are PF loans financed in integrated debt markets (Western Europe versus the US and Western Europe internally)?
9 This box was prepared by João M. Pinto (Catholic University of Portugal) and Paulo P. Alves (Catholic University of Portugal).10 We are grateful for the comments and advice provided by Philipp Brutscher and the participants in the 2016 Corporate Finance Alternatives in Europe Workshop
at the European Investment Bank and Católica Porto Business School 9th Internal Conference. We would also like to thank the European Investment Bank for providing the ORBIS data. For further details please refer to the full version of the working paper.
11 Due to its contractual idiosyncrasies, PF is also used to segregate the credit risk of the project from those of its sponsors so that lenders, investors and other parties will appraise the project strictly on its own economic merits. For further discussion, see Brealey, Cooper, and Habib (1996), Kleimeier and Megginson (2000), Esty (2003, 2004), Caselli and Gatti (2005), Fabozzi, Davis, and Choudhry (2006), Blanc-Brude and Strange (2007), Gatti (2008), and references therein.
Figure 19 Cash and deposit of NFCs to GDP (4-qtr moving average of the ratio)
Figure 20 Relative size of financial markets (%, as a ratio to GDP, average 2010-2014)
Vulnerable Euro areaEU
CohesionCore
4
8
12
16
20
24
2000
2002
2004
2006
2008
2010
2012
2014
2016
0
30
60
90
120
150
EU US China Japan
12
82
64
28
92
127
1020
84
16
55
76
Financial institutions' debt securitiesPublic equity markets
Corporate debt securities
Source: ECON calculations based on EUROSTAT sectoral accounts.Note: 4-quarter moving average of the annual growth rate of
non-seasonally adjusted data. See footnote to Figure 1 for the definition of the country groups.
Source: ECON calculations based on ECB and Valiante (2016).
Investment finance PART II 165
European Investment Bank Investment and Investment Finance in Europe
To compare the financial characteristics of PF loans to those of non-PF loans and examine which factors may explain the choice between project financing and corporate financing, we use a dataset including a comprehensive sample of syndicated loans closed between 1 January 2000 and 31 December 2014. Our sample contains information about 10,950 PF loans (5,935 PF deals worth USD 2,108.8bn) and 199,323 (129,256 non-PF deals worth USD 40,592.6bn) non-PF loans. In addition to deal characteristics (Dealscan), and in order to analyse what factors determine the choice between project financing and corporate financing structures, we also collected firm-specific accounting and market data (Datastream for publicly traded firms and Orbis for privately held firms) and macroeconomic variables, such as the level of interest rates, market volatility, and slope of the yield curve (Datastream).
Figures 1 to 3 present the distribution of PF deals across time, industry, and region. Figure 1 shows that PF lending peaked in 2008, fell in 2009 and rose again in 2010 and 2011. In 2014 a record USD 259.9bn in PF funding was globally arranged, a 278.5% increase from the USD 68.7bn reported for 2000. Similarly, a record USD 3,905.8bn in non-PF syndicated loans was globally arranged in 2014, a 101.1% increase from the USD 1,942.7bn reported for 2000. PF did not significantly contract during the 2007-2008 financial crisis when compared to other forms of syndicated credit. Figure 2 shows that PF lending is concentrated in five key industries, whereas the general population of non-PF deals reveals a far less concentrated industrial pattern: i.e. utilities (29.8%), construction (13.7%), manufacturing (12.6%), mining (10.7%) and transportation (10.7%) account for 77.3% of all PF lending, but only 55.2% of non-PF syndicated deals. This finding is consistent with the common understanding that PF is used primarily to fund tangible-asset-rich and capital-intensive projects. Figure 3 also shows clear differences between the countries which attract PF lending and those where other types of syndicated loans are directed. Whereas the majority of non-PF lending is concentrated in the US (46.1%), only 10.4% of PF lending goes to US borrowers. The biggest recipients of PF lending are Western Europe and Eastern Asia. These regions account for 23.4% and 18.4% of the total value of PF loans, respectively. UK borrowers and the rest of Western Europe accounts for an almost identical fraction (23.4% versus 24.3%) of both types of lending. The relevance of PF lending in Western Europe reflects two major trends. First, the emphasis placed by UK governments on the Private Finance Initiative (PFI): i.e. on private rather than public financing of large public infrastructure projects. Second, PF, especially public-private partnerships (PPPs), played an important role in reducing the need for government borrowing and shifting project risks to the private sector in Southern European countries. Through PPP structures, governments shift construction and operating risks to the private sector, which is usually more efficient in building and running the asset, and obtains both private sector funding and private sector management.
Figure 1 Evolution of PF and non-PF deals by year PF and non-PF deals by year
PF non-PF
2000
2001
2002
2003
2004
2005
2006
2007
2008
2009
2010
2011
2012
2013
2014
0
50000
100000
150000
200000
250000
300000
1500000
2000000
2500000
3000000
3500000
4000000
USD million

PART II Investment finance166
Investment and Investment Finance in Europe European Investment Bank
Figure 2 Evolution of PF and non-PF deals by year PF and non-PF deals by year
Agriculture, Forestry and Fishing
Mining
Construction
Manufacturing
Wholesale Trade
Retail Trade
Real Estate
Services
Utilities
Financial Services
Transportation
Public Administration/Government
Other
non-PF major industry groupPF major industry group
11%
13%13%
4%
5%
30%
1% 11%
3%
9%
2%
27%5%
5%
8%
12%
14% 11%
5%
1%
3%
7%
Figure 3 Geographic distribution of the full sample of PF and non-PF deals
US
Asia - Other
Asia - Western
Asia - Eastern
Africa
Australia and Pacific
Caribbean
Latin America
Europe-Western
Europe-Eastern
Canada
non-PF by regionPF by region
4.4%
2.4%
10.4%
15.7%
12.3%
18.4%
3.4%3.9%
0.5% 5.1%
23.4%
46.1%
3.3%
11.7%
0.7% 3.9% 0.3% 1.3%
24.3%
1.5%
5.1%
Univariate analyses show that most of the common pricing characteristics differ significantly between PF and non-PF loans, with PF being most commonly used for capital-intensive facilities and utilities in riskier than average countries, using relatively long-term financing.
In order to answer questions (3) to (5) we employ an OLS regression with standard errors clustered by deal. A Chow test for a structural break is used to investigate whether the credit spreads associated with PF and non-PF loans are influenced differently by common pricing factors, as well as whether PF loans in the US and Western Europe are priced in integrated or segmented debt markets. Our results reveal that PF loans and other syndicated loans – corporate control loans, capital structure loans, fixed asset based loans, and general corporate purpose loans – are debt instruments influenced differently by common pricing characteristics. Additionally, we create sub-samples for loans by US and Western European borrowers and we find that PF loans and each of the four categories of non-PF loans are not priced in an integrated debt market.
The results suggest that PF loans are associated with lower spreads: ceteris paribus, spreads on PF loans are, on average, 42.1 bps lower than the spreads on otherwise comparable corporate financing loans. Our results remain unchanged when estimating our base model for sub-samples created, based on whether the borrower is located in the US, UK, or Western Europe or when using

Investment finance PART II 167
European Investment Bank Investment and Investment Finance in Europe
the total cost of borrowing (TCB) measure as proposed by Berg, Saunders, and Steffen (2015) as an alternative to the spread. However, when re-estimating our model for each category of non-PF loans separately, we find that (i) PF loans are associated, when other factors remain constant, with lower spreads than corporate control, capital structure, and general corporate purpose loans; and (ii) whereas for loans extended to US borrowers, the spread on PF loans and fixed asset based loans do not differ significantly, the PF dummy variable is associated with a statistically significant 20.7 bps drop in spreads for loans arranged for Western European borrowers. Overall results support hypotheses of PF transactions as mechanisms for asymmetric information problems, principal-agent conflict reduction and improving risk management within the project: i.e. risks are allocated to the parties that are in the best position to manage them.
Our results also indicate that PF loans in the US and Western Europe are priced in segmented debt markets and that those in Western Europe are associated with lower spreads: PF loans extended to US borrowers are associated with a statistically significant 85.2 bps increase in the spread. Our results remain unchanged when estimating our model for sub-samples created, based on whether the Western European borrower is located in Continental Europe or in the UK. We also conclude that PF loans extended to Continental European and UK borrowers are priced in integrated debt markets and that PF loans are influenced differently by common pricing characteristics when considering borrowers located in Northern Europe versus Southern Europe. Finally, we document that the 2007-2008 financial crisis and the subsequent European sovereign debt crisis significantly impacted PF loan spreads and pricing processes: spreads increased significantly and bank liquidity and sovereign risk became important credit spread determinants during the crisis period.
In order to investigate how firms’ characteristics influence the choice between PF and non-PF debt we use a unique dataset, compiled from three different data providers (Dealscan, Orbis, and Datastream). Our sample includes 750 PF loans (470 PF deals) and 33,962 non-PF loans (25,838 non-PF deals) closed by 6,381 publically traded firms located in Western Europe and the US. It also includes 89 PF loans (59 PF deals) and 3,384 PF loans (2,031 non-PF deals) closed by 1,107 privately held firms. Following the extant literature, we focus on the firm characteristics that reflect transaction costs, renegotiation and liquidation risks, and information asymmetries. For this analysis, we use a logistic regression model. Our dependent variable, choice of debt, is a binary variable equal to 1 if the firm closes a PF loan and 0 if it, instead, closes a non-PF loan. We control for debt contracting characteristics and as the financing choice may be sector-specific, we use dummy variables to control for industry factors. We also account for macroeconomic conditions and if firms employ multiple debt types (PF loans and non-PF loans) within our sample period.
Our results regarding publicly traded firms’ choice between project financing and corporate financing support hypotheses of project financing as a mechanism of overcoming agency conflicts between borrowers and lenders, but provide mixed evidence concerning the relevance of PF in reducing deadweight costs from asymmetric information problems. We find that sponsors choose PF transactions when they seek long-term financing and want to maintain financial flexibility and protect their credit standing. Furthermore, firms that employ project financing over corporate financing are larger and more financially constrained; they also have higher asset tangibility and operate in countries with lower sovereign debt ratings. Finally, firms prefer project financing when issuing relatively lower amounts of debt and are less profitable.
Regarding privately held firms, our results support the asymmetric information hypothesis: Western European sponsors choose project financing when they are relatively smaller and seek long-term financing. Our results document that firms choose PF transactions for relatively large amounts of debt to economise on scale. In addition, firms that employ project financing over corporate financing are less profitable and operate in countries with lower sovereign debt ratings. Finally, UK borrowers positively affect the probability of observing a PF loan rather than a non-PF loan.
For both public and private sponsors, we document that firms which employ both PF and corporate finance lending within our sample period are more likely to choose PF loans when issuing new debt.

PART II Investment finance168
Investment and Investment Finance in Europe European Investment Bank
In addition, the 2007-2008 financial crisis and the subsequent European sovereign debt crisis increased the probability of choosing PF over other syndicated loans in Western Europe. Finally, transactions by firms in Western European countries with higher sovereign credit risk are more likely to be arranged as PF loans than other syndicated loans. These results noticeably reflect the importance of PF, namely PPPs, in reducing a government’s borrowing and shifting project risks to the private sector during the crisis period, mainly in Southern European countries.
References Berg, T., A. Saunders, and S. Steffen, 2015. The Total Cost of Corporate Borrowing in the Loan Market: Don't Ignore the Fees, Journal of Finance 71, 1357-1392.
Blanc-Brude, F., and R. Strange, 2007. How banks price loans to public-private partnerships: Evidence from the European markets, Journal of Applied Corporate Finance 19, 94-106.
Brealey, R., I. Cooper, and M. Habib, 1996. Using PF to fund infrastructure investments, Journal of Applied Corporate Finance 9, 25-38.
Carey, M., and G. Nini, 2007. Is the corporate loan market globally integrated? A pricing puzzle, Journal of Finance 62, 2969-3007.
Caselli, S., and S. Gatti, 2005. Structured Finance: Techniques, Products and Market, Springer: Berlin.
Corielli, F., S. Gatti, and A. Steffanoni, 2010. Risk Shifting through Nonfinancial Contracts: Effects on Loan Spreads and Capital Structure of PF Deals, Journal of Money, Credit and Banking 42, 1295-1320.
Esty, Benjamin, 2003. The Economic Motivations for Using PF, Boston: Harvard Business School publishing.
Esty, Benjamin, 2004. Modern PF – A Casebook, John Wiley & Sons, Inc.
Fabozzi, F., H. Davis, and M. Choudhry, 2006. Introduction to Structured Finance, Wiley Finance.
Gatti, Stefano, 2008. PF in Theory and Practice – Designing, Structuring, and Financing Private and Public Projects, Academic Press Advanced Finance Series.
Kleimeier, S., and W. Megginson, 2000. Are PF loans different from other syndicated credits?, Journal of Applied Corporate Finance 13, 75-87.
4.3.2. NFCs’ financial liabilities dominated by debtIn comparison to GDP, the size of equity markets in Europe is well below that in the US (Figure 20). It is even lower than in China and Japan. Turning to NFC debt securities, the outstanding amount is around 12% of GDP in the EU, while it is above that in Japan and the US. In fact, differently from the US where debt is almost equally split into securities traded on a market, in Europe most of corporate debt consists of banks loans. Looking across country groups, the predominance of bank loans is confirmed and remains a structural characteristic of the EU financial system12 and, overall, the European financial system is bank-centred when compared to the US. In particular, corporate bond issuance plays a relatively limited role. Equity financing plays a much smaller role in new external financing than in the US and the development of securitisation is much more limited.
Taking a time-series perspective and looking at the evolution of the liability structure of European NFCs, the ratio of debt to equity, which peaked in 2009, has since then declined, substantially in most countries apart from cohesion countries (Figure 21). In the latter, it remained unchanged but at a relatively lower level. The decline in the debt to equity ratio was more pronounced in vulnerable countries than in core countries, from more than 120% to less than 80% in the former and around 80% to 60% in the latter.
12 For more details, see EIB (2015), “Recent developments in investment finance”, Investment and Investment Finance in Europe, especially Figures 7 and 8.
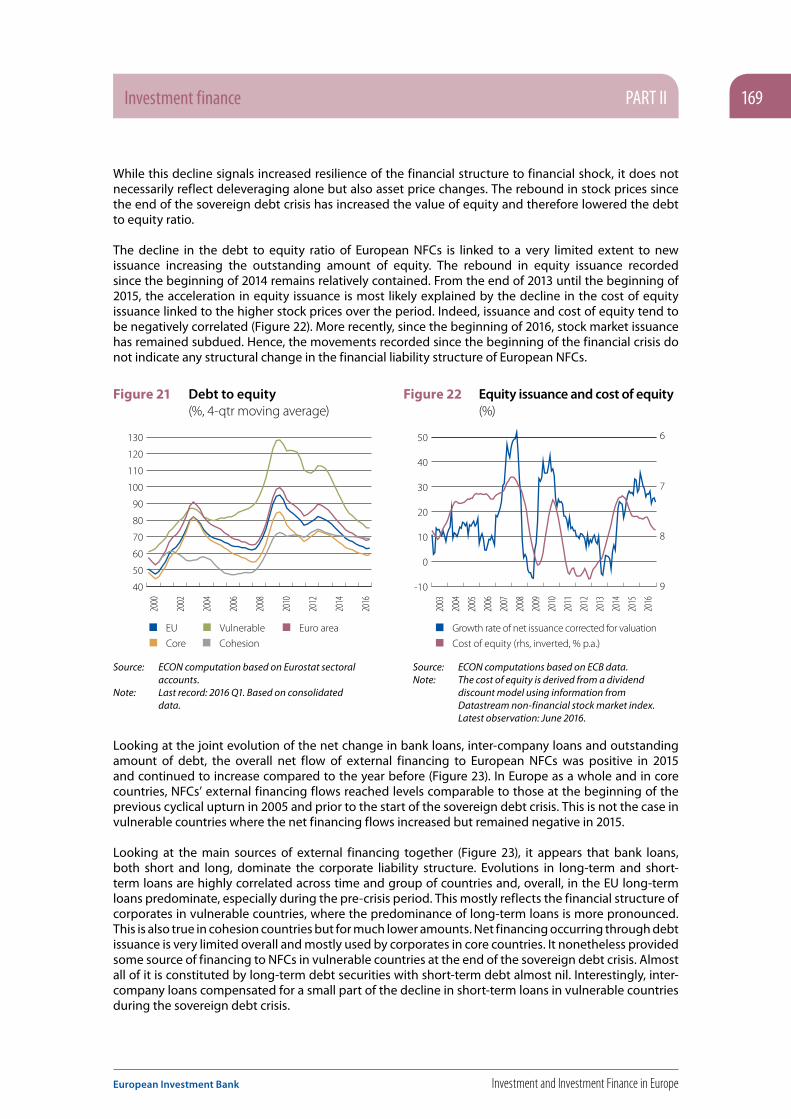
Investment finance PART II 169
European Investment Bank Investment and Investment Finance in Europe
While this decline signals increased resilience of the financial structure to financial shock, it does not necessarily reflect deleveraging alone but also asset price changes. The rebound in stock prices since the end of the sovereign debt crisis has increased the value of equity and therefore lowered the debt to equity ratio.
The decline in the debt to equity ratio of European NFCs is linked to a very limited extent to new issuance increasing the outstanding amount of equity. The rebound in equity issuance recorded since the beginning of 2014 remains relatively contained. From the end of 2013 until the beginning of 2015, the acceleration in equity issuance is most likely explained by the decline in the cost of equity issuance linked to the higher stock prices over the period. Indeed, issuance and cost of equity tend to be negatively correlated (Figure 22). More recently, since the beginning of 2016, stock market issuance has remained subdued. Hence, the movements recorded since the beginning of the financial crisis do not indicate any structural change in the financial liability structure of European NFCs.
Figure 21 Debt to equity
(%, 4-qtr moving average)Figure 22 Equity issuance and cost of equity
(%)
Vulnerable Euro areaEU
CohesionCore
40
50
60
70
80
90
100
110
120
130
2000
2002
2004
2006
2008
2010
2012
2014
2016
2003
2004
2005
2006
2007
2008
2009
2010
2011
2012
2013
2014
2015
2016
-10
0
10
20
30
40
50 6
7
8
9
Cost of equity (rhs, inverted, % p.a.)
Growth rate of net issuance corrected for valuation
Source: ECON computation based on Eurostat sectoral accounts.
Note: Last record: 2016 Q1. Based on consolidated data.
Source: ECON computations based on ECB data.Note: The cost of equity is derived from a dividend
discount model using information from Datastream non-financial stock market index. Latest observation: June 2016.
Looking at the joint evolution of the net change in bank loans, inter-company loans and outstanding amount of debt, the overall net flow of external financing to European NFCs was positive in 2015 and continued to increase compared to the year before (Figure 23). In Europe as a whole and in core countries, NFCs’ external financing flows reached levels comparable to those at the beginning of the previous cyclical upturn in 2005 and prior to the start of the sovereign debt crisis. This is not the case in vulnerable countries where the net financing flows increased but remained negative in 2015.
Looking at the main sources of external financing together (Figure 23), it appears that bank loans, both short and long, dominate the corporate liability structure. Evolutions in long-term and short-term loans are highly correlated across time and group of countries and, overall, in the EU long-term loans predominate, especially during the pre-crisis period. This mostly reflects the financial structure of corporates in vulnerable countries, where the predominance of long-term loans is more pronounced. This is also true in cohesion countries but for much lower amounts. Net financing occurring through debt issuance is very limited overall and mostly used by corporates in core countries. It nonetheless provided some source of financing to NFCs in vulnerable countries at the end of the sovereign debt crisis. Almost all of it is constituted by long-term debt securities with short-term debt almost nil. Interestingly, inter-company loans compensated for a small part of the decline in short-term loans in vulnerable countries during the sovereign debt crisis.

PART II Investment finance170
Investment and Investment Finance in Europe European Investment Bank
Figure 23 External financing of NFCs (net transactions in EUR billions, 4-qtr sums, clockwise, EU, Core countries, Cohesion countries and Vulnerable countries)
EU
ST debt sec. LT debt sec. ST loans (cons)LT loans (cons) Inter-company loans Sum
-800
-400
0
400
800
1200Core countries
2001
Q1
2003
Q1
2005
Q1
2007
Q1
2009
Q1
2011
Q1
2013
Q1
2015
Q1
-400
0
400
800
-400
0
400
800
2001
Q1
2003
Q1
2005
Q1
2007
Q1
2009
Q1
2011
Q1
2013
Q1
2015
Q1
2001
Q1
2003
Q1
2005
Q1
2007
Q1
2009
Q1
2011
Q1
2013
Q1
2015
Q1
2001
Q1
2003
Q1
2005
Q1
2007
Q1
2009
Q1
2011
Q1
2013
Q1
2015
Q1
-300
0
300
600
-40
0
40
80
120Vulnerable countries Cohesion countries
Source: ECON computations based on Eurostat integrated accounts.Note: Breakdown between intra and extra company loans and debt based on annual accounts. Latest observation: 2015Q4.
4.3.3. Reduction of the debt burden and shift towards longer maturity
Looking at corporate debt over GDP to assess where corporations stand in the deleveraging process, one can see that the corporate ratio has marginally declined in Europe. This mostly reflects the deleveraging process in vulnerable countries, where the ratio came down by around 15 pps, from 100% in 2010 to 85% at the beginning of 2016. Across all the country groups, the ratio at the beginning of 2016 significantly retained its value at the beginning of the latest cyclical upturn in 2005 (Figure 24). However, it is not certain that, measured at the aggregated level, the long-term ratio of corporate indebtedness should remain constant over the period. For each firm individually, the capacity to repay debt should be the criteria determining the sustainable level of indebtedness, and this should evolve with productivity, activity and the cost of indebtedness. But measured at the aggregated level, the increase in the debt ratio also reflects changes in the composition of the debt holder, and the possibility for new firms to tap external sources of financing. Indeed, along with financial liberalisation and openness, the development of information technology has enabled firms to relax their short-term financing constraints and may
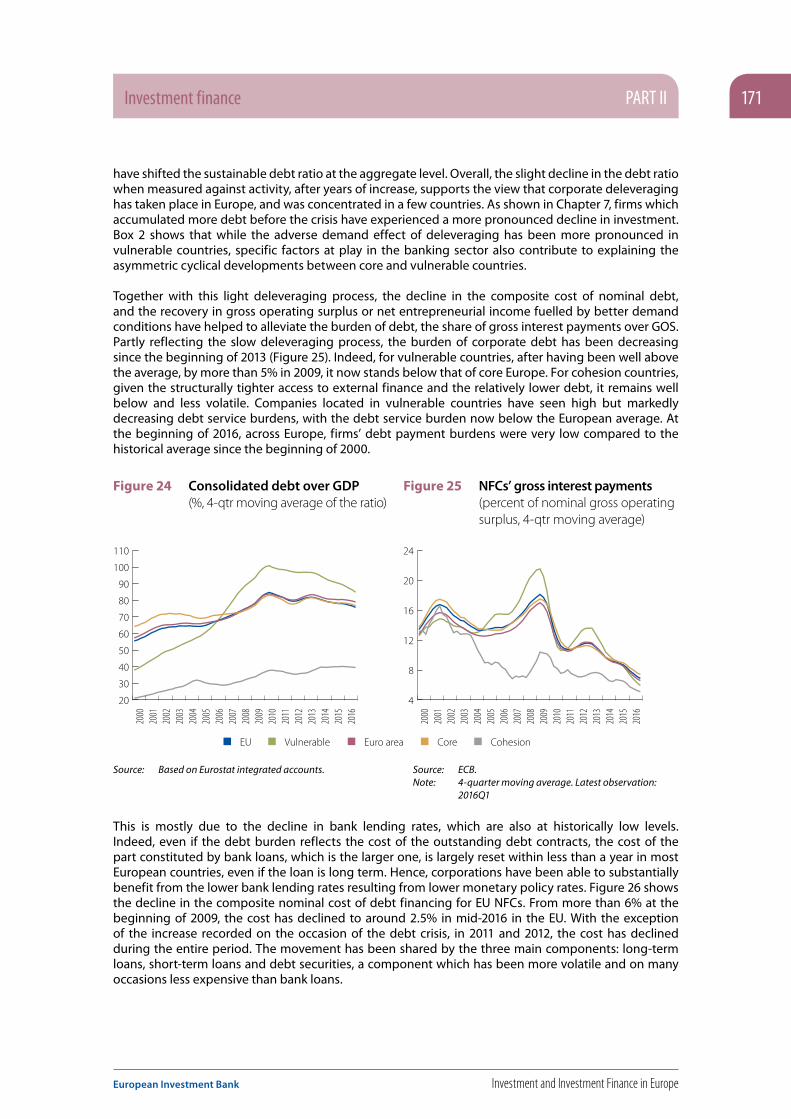
Investment finance PART II 171
European Investment Bank Investment and Investment Finance in Europe
have shifted the sustainable debt ratio at the aggregate level. Overall, the slight decline in the debt ratio when measured against activity, after years of increase, supports the view that corporate deleveraging has taken place in Europe, and was concentrated in a few countries. As shown in Chapter 7, firms which accumulated more debt before the crisis have experienced a more pronounced decline in investment. Box 2 shows that while the adverse demand effect of deleveraging has been more pronounced in vulnerable countries, specific factors at play in the banking sector also contribute to explaining the asymmetric cyclical developments between core and vulnerable countries.
Together with this light deleveraging process, the decline in the composite cost of nominal debt, and the recovery in gross operating surplus or net entrepreneurial income fuelled by better demand conditions have helped to alleviate the burden of debt, the share of gross interest payments over GOS. Partly reflecting the slow deleveraging process, the burden of corporate debt has been decreasing since the beginning of 2013 (Figure 25). Indeed, for vulnerable countries, after having been well above the average, by more than 5% in 2009, it now stands below that of core Europe. For cohesion countries, given the structurally tighter access to external finance and the relatively lower debt, it remains well below and less volatile. Companies located in vulnerable countries have seen high but markedly decreasing debt service burdens, with the debt service burden now below the European average. At the beginning of 2016, across Europe, firms’ debt payment burdens were very low compared to the historical average since the beginning of 2000.
Figure 24 Consolidated debt over GDP
(%, 4-qtr moving average of the ratio)Figure 25 NFCs’ gross interest payments
(percent of nominal gross operating surplus, 4-qtr moving average)
Vulnerable Euro areaEU CohesionCore
20
30
40
50
60
70
80
90
100
110
2000
2001
2002
2003
2004
2005
2006
2007
2008
2009
2010
2011
2012
2013
2014
2015
2016
4
8
12
16
20
24
2000
2001
2002
2003
2004
2005
2006
2007
2008
2009
2010
2011
2012
2013
2014
2015
2016
Source: Based on Eurostat integrated accounts. Source: ECB. Note: 4-quarter moving average. Latest observation:
2016Q1
This is mostly due to the decline in bank lending rates, which are also at historically low levels. Indeed, even if the debt burden reflects the cost of the outstanding debt contracts, the cost of the part constituted by bank loans, which is the larger one, is largely reset within less than a year in most European countries, even if the loan is long term. Hence, corporations have been able to substantially benefit from the lower bank lending rates resulting from lower monetary policy rates. Figure 26 shows the decline in the composite nominal cost of debt financing for EU NFCs. From more than 6% at the beginning of 2009, the cost has declined to around 2.5% in mid-2016 in the EU. With the exception of the increase recorded on the occasion of the debt crisis, in 2011 and 2012, the cost has declined during the entire period. The movement has been shared by the three main components: long-term loans, short-term loans and debt securities, a component which has been more volatile and on many occasions less expensive than bank loans.

PART II Investment finance172
Investment and Investment Finance in Europe European Investment Bank
Figure 26 Composite nominal cost of debt financing for NFCs in the EU (% p.a., 3-month moving average)
Figure 27 Composite nominal bank lending rate on corporate loans in the EU (% p.a., 3-month moving average)
1
2
3
4
5
6
7
8
Debt
Short-term loans Long-term loans
Overall CoreEU
Euro area Vulnerable
Cohesion (lhs)
1
2
3
4
5
6
7
8
2008 2009 2010 2011 2012 2013 2014 2015 2016 2008 2009 2010 2011 2012 2013 2014 2015 20163
4
5
6
7
8
9
10
Source: ECON calculations based on ECB and Thomson Reuters.
Note: The overall cost of financing for NFCs is calculated as a weighted average of the cost of bank lending and the cost of market-based debt, based on their respective amounts outstanding derived from the EU sectoral accounts. Latest observation: June 2016.
In parallel to the change in the overall amount of corporate debt, the maturity of the corporate debt has also changed. Indeed, the ratio of short to long-term debt trends downward, a good sign of financial soundness (Figure 28). This can reflect two very different factors. On the one hand, simply the fact that short-term loans (debt), being renewed more frequently, are impacted more quickly than long-term loans (debt); on the other hand, an active policy of companies which want to benefit from the relatively low-term spread. Corporates in vulnerable and cohesion countries substantially modified their maturity structure before the crisis by debt instrument, increasing the share of short-term liabilities, while corporates in core countries were reducing it. For loans, the share of short-term diminished during the entire period. The change was more pronounced in vulnerable countries.
Figure 28 Maturity structure of main liabilities (ratio of short over long)
CoreEU
Euro area Vulnerable
CohesionCoreEU
Euro area Vulnerable
Cohesion
0.2
0.3
0.4
0.5
0.6
0.7
0.8
0.9
1.0
2000 2002 2004 2006 2008 2010 2012 2014 2016 2000 2002 204 206 2008 2010 2012 2014 20160.00
0.05
0.10
0.15
0.20
0.25
0.30
0.35
Source: ECON computations based on Eurostat integrated accounts.Note: Ratio of short to longer-term debt; corrected with short-term lending as proxy for inter-company loans.

Investment finance PART II 173
European Investment Bank Investment and Investment Finance in Europe
4.3.4. Evidence of corporate bond issuance fuelled by ECB policy
With an outstanding amount of EUR 1.8tn (1.2) respectively in the EU and in the euro area in mid-2016, the stock of non-financial corporate debt securities remains relatively low, at around 10% of GDP, and well below that of bank loans (50%). Although there is some evidence of a long-run trend increase, the pace is very slow. Being relatively small, the European corporate debt market is also concentrated across countries and firms, with a few issuers having a large market share (Figure 29). Corporates located in France represent the larger issuers, with a share averaging 31% in the first half of 2016, followed by those located in the UK (27%). Corporates in Germany represent the third largest issuers, but with a share well below the first two (8%). Together, the three largest European economies represent around two-thirds of the EU debt market. The market is not only concentrated by country but also on individual issuers. In the euro area, the first 20 issuers account for 45% of the turnover.
Figure 29 Geographical breakdown of the
European corporate debt market (%)
Figure 30 Net issuance of securities in the euro area (sum since the start of the year, billions)
-40
0
40
80
120
160
ItalySwedenNetherlands
France UKGermany
Others
201220112010
201520142013
2016
Source: Eurostat, ECB. Note: Last record is June 2016 (lhs, annual average from mid-2015 to mid-2016).
From the start of the sovereign debt crisis, in 2011, until 2015, corporate debt issuance in Europe remained relatively stable, except in 2012, with net issuance at the end of the year ranging between EUR 40 and 50bn (Figure 30). In 2012, net issuance amounted to more than EUR 120bn, a record number, explained by some specific factors. At the beginning of 2016, the pace of issuance was starting below that of the years excluding 2012, but since then, in February 2016, the pace has markedly shifted upward, catching up with the rhythm recorded in 2012. Moreover, differently from the recent past, the spike in activity was shared across core and vulnerable countries (Box 2). The increase is likely to partly result from a reaction to the ECB corporate-sector purchase programme announced in March 2016. The programme was part of a recalibration of the non-standard measure package. In June 2016, investment-grade euro-denominated bonds issued by non-bank corporations established in the euro area became eligible for the APP. The purchases can be conducted in the primary and secondary markets for ratings above BBB- and maturities of 6 months to 30 years. The programme, widely expected by market participants, has the capacity to foster debt security issuance (Box 2).

PART II Investment finance174
Investment and Investment Finance in Europe European Investment Bank
Box 2 Explaining the differences in investment dynamics between vulnerable and other euro area countries
Demand, policies, access to external financing and pricing conditions are all relevant factors to explain changes in business investment across the business cycles. Since the start of the sovereign crisis, capital spending has been weak in the euro area, and much more so in vulnerable countries. To understand the reasons behind the weakness of investment in Europe overall and the factors behind asymmetric patterns between core and vulnerable countries, we use two SVAR models. We show that beyond the weakness in demand, factors at play in the banking sector have also contributed in the vulnerable countries. While debt issuance may have helped corporations to circumvent tight access to bank credit, this possibility has been limited by the size and degree of concentration of the corporate debt market.
Given the data limitation, core countries are proxied by Germany, France and the Netherlands, while vulnerable countries consist of Italy and Spain. For each group, the country data are aggregated using GDP weights. We estimate two SVAR models consisting of the same seven variables each: entrepreneurial income, bank lending spreads, MFI loans, debt premium, annual growth in the outstanding amount of NFC debt securities, business investment (other private investment until end-2015 extended by gross fixed capital formation), and real short-term rate.13 All the series are country-specific except the series on corporate bond yields, which is available for EU NFCs only. The estimation covers the period from 1992Q1 – 2016Q2, 102 quarterly observations.
After estimation of the two models, that for core countries and that for vulnerable countries, the shocks are extracted following a recursive decomposition. Demand shocks are then assimilated to shocks to investment and to gross entrepreneurial income, shocks to access to bank loans assimilated to shocks on corporate loans and lending spreads, and shocks to access to the debt market to shocks to debt premiums and to debt issuance. Together with the estimated impulse response, the shocks are used to compute the contributions to each variable in each group of countries. This makes it possible to identify the factors which may have contributed to the different evolution observed between the core and the vulnerable countries for the variables in the model. We focus on investment, bank loans, bank lending spreads and debt issuance. Figures A-D below depict by how much the asymmetric demand conditions, and tighter access to bank loans or to the debt market, between the core and the vulnerable countries can account for the different evolution. The Figures in level are also appended.
Figure A shows that from the beginning of the 2010s to the beginning of 2014, investment growth in the vulnerable countries was much below, by more than two standard deviations, that in the core countries. Since then, the gap between the two has decreased, and at the end of 2015 investment growth in the core countries was above that in the vulnerable countries only marginally. The bulk of the difference was explained by demand conditions, which are estimated to have been in favour of the core countries over virtually the entire period. Yet, access to bank loans also played a role, but a more balanced one.
Figure B shows how much the swing in bank loans has been pronounced in the vulnerable countries, from well above the core countries from 2003 until 2007 to well below since 2010, and still remaining below at the end of the period. Differently than for investment, the main drivers of these differences are to be found in access to bank loans, which pushed bank loans before the crisis in favour of the vulnerable countries and has restricted them permanently since then. This was similar for demand. Again, access to debt markets plays a relatively minor role but may have favoured bank loans in the vulnerable countries at a time of high stress, given the difficulty to issue.
13 See Maurin L. (2014) for a detailed description of the model and its estimation at the euro area level.

Investment finance PART II 175
European Investment Bank Investment and Investment Finance in Europe
Figure A Investment growth (annual growth rate, %, and contribution, p.p., de-meaned)
Figure B MFI loans to NFCs (annual growth rate, %, and contribution, p.p., de-meaned)
Demand conditions Access to bank loans Access to debt market
Bank loans (other) Bank loans (vulnerable)
-0.2
-0.1
0.0
1999 2001 2003 2005 2007 2009 2011 2013 2015
0.1
-0.2
-0.1
0.0
0.1
0.2
1999 2001 2003 2005 2007 2009 2011 2013 2015
Source: Based on Maurin L. (2014). Note: Based on a SVAR identified with Choleski decomposition and incorporating the series in the following order:
entrepreneurial income, bank lending spread, MFI loans, debt premium, stock of debt, business investment, real short-term rate. The shadow area portrays the period during which investment growth in the vulnerable countries is below that in the other by more than two standard deviations. The contribution is the difference between that in the core and that in the vulnerable countries. The actual series are plotted in deviation from the historical average.
The differences in the movements in bank lending spreads are even more pronounced than for bank loans, with a gap opening in mid-2011. Since then, bank lending spreads in vulnerable countries have remained well above those in the core economies. The gap widened to around 120 bps at the turn of 2012 and subsequently declined to around 25 bps in mid-2016 (Figure C). According to the model, from mid-2011 until the end of 2015, the gap reflects more adverse demand conditions in the vulnerable countries, and therefore the inclusion of a stronger credit risk in the pricing of the loans, but not that alone. Indeed, factors specific to the banking sector, such as more impaired assets, fewer capital buffers and recapitalisation needs, resulted in tighter conditions for accessing bank loans in vulnerable countries during that period. These are estimated to have become more symmetric across the two groups of countries since the middle of 2015. Interestingly, relatively better debt issuance conditions in vulnerable countries have contributed to reducing the gap, as in 2013 and 2014 some corporations in vulnerable countries were able to substitute funding sources and benefit quickly from improved conditions in the debt market.
Debt issuance is much more volatile (Figure D). As explained in the main text, the law of large numbers does not apply, as the bulk of issuance is driven by a few corporations. Therefore, issuance activity may reflect conditions specific to the firms or the sector in which they operate more than the macroeconomy. As such, it is not surprising that the bulk of the differences in debt issuance appears to be driven by idiosyncratic events, portrayed by the green bars. Also, these contributions do not seem very persistent. Still, it is interesting to note that from 1999 until the beginning of 2012, debt issuance co-moves in core and vulnerable countries. Thereafter, until the end of 2014, debt issuance increases in the vulnerable countries when it decreases in the core and vice versa. At the end of the period, at the beginning of 2016, debt issuance rebounds in both groups of countries. This is due to specific factors becoming more supportive in both areas. Most likely, the support results from the extension of the ECB asset purchase programme to corporate debt securities.

PART II Investment finance176
Investment and Investment Finance in Europe European Investment Bank
Figure C Bank lending spread (p.p per annum, and contribution p.p., de-meaned)
Figure D Debt issuance (annual growth, %, and contribution p.p., de-meaned)
Demand conditions Access to bank loans Access to debt market
Bank lending spread (other) Bank lending spread (vulnerable)
-1
0
1
2
1999 2001 2003 2005 2007 2009 2011 2013 2015
0.1
1999 2001 2003 2005 2007 2009 2011 2013 2015-0.3
-0.2
-0.1
0.0
0.2
0.3
Source and Note: See Figure A
Besides demand conditions, conditions specific to the financial sector help to explain some of the differences recorded between vulnerable and core countries since the beginning of the sovereign debt crisis: a more pronounced decline in investment, a sharper decline in bank loans and the opening of a gap in bank lending spreads. Also, the limited capacity to issue debt securities is considered to have partly safeguarded core countries from the lasting effects of the banking sector adjustment. More recently, with the inclusion of corporate debt in the APP, the ECB may have reactivated this channel for the entire euro area. Beyond its role in supporting capital expenditure in the short-to-medium term this policy contributes to promoting the development of more diversified financial markets, improving market stability and resilience and the monetary transmission channel (Valiante, 2016). Helping to foster the corporate debt market, the inclusion of corporate debt in the APP can be instrumental to establishing the Capital Market Union. Although still at an early stage, the Capital Market Union can be expected to make it easier for smaller firms to raise funding, for example, by helping to free up bank balance sheets.
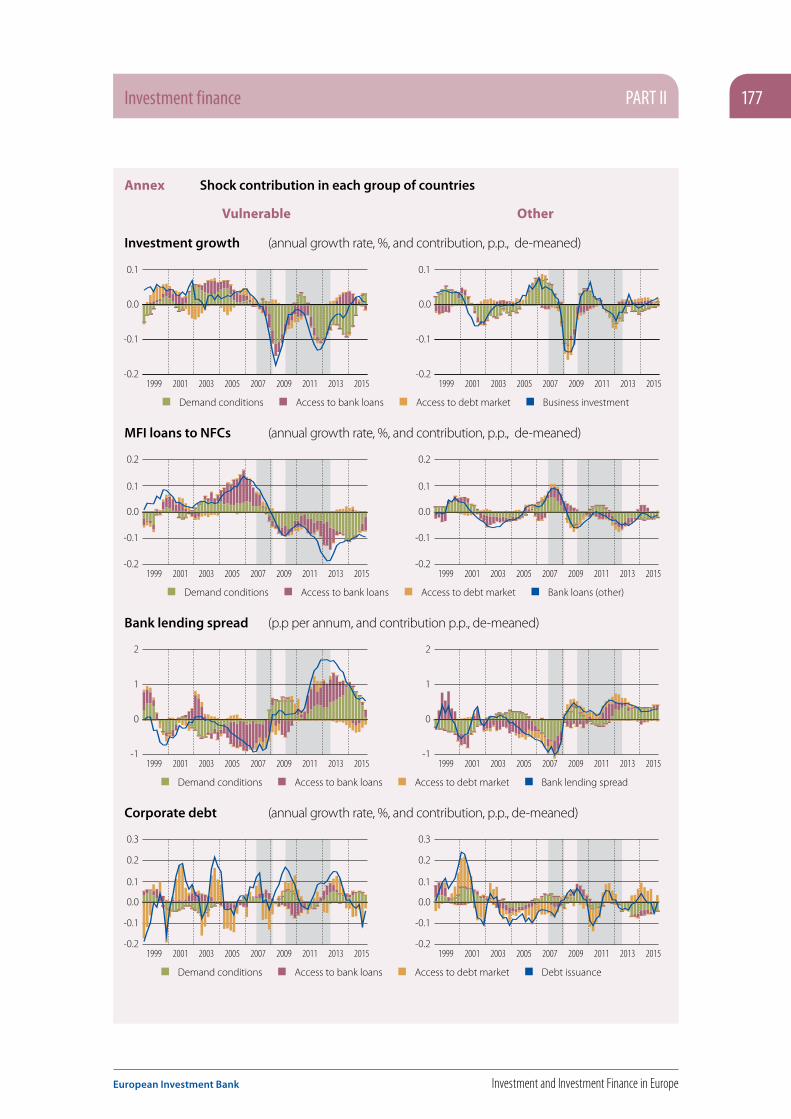
Investment finance PART II 177
European Investment Bank Investment and Investment Finance in Europe
Annex Shock contribution in each group of countries
Vulnerable Other
Investment growth (annual growth rate, %, and contribution, p.p., de-meaned)
Demand conditions Access to bank loans Access to debt market Business investment
-0.2
-0.1
0.0
0.1
1999 2001 2003 2005 2007 2009 2011 2013 2015-0.2
-0.1
0.0
1999 2001 2003 2005 2007 2009 2011 2013 2015
0.1
MFI loans to NFCs (annual growth rate, %, and contribution, p.p., de-meaned)
Demand conditions Access to bank loans Access to debt market Bank loans (other)
-0.2
-0.1
0.0
0.1
0.2
1999 2001 2003 2005 2007 2009 2011 2013 2015-0.2
-0.1
0.0
0.1
0.2
1999 2001 2003 2005 2007 2009 2011 2013 2015
Bank lending spread (p.p per annum, and contribution p.p., de-meaned)
Demand conditions Access to bank loans Access to debt market Bank lending spread
-1
0
1
2
1999 2001 2003 2005 2007 2009 2011 2013 2015-1
0
1
2
1999 2001 2003 2005 2007 2009 2011 2013 2015
Corporate debt (annual growth rate, %, and contribution, p.p., de-meaned)
Demand conditions Access to bank loans Access to debt market Debt issuance
-0.2
-0.1
0.0
0.1
0.2
0.3
1999 2001 2003 2005 2007 2009 2011 2013 2015-0.2
-0.1
0.0
0.1
0.2
0.3
1999 2001 2003 2005 2007 2009 2011 2013 2015
PART II Investment finance178
Investment and Investment Finance in Europe European Investment Bank
4.4. Banking sector’s capacity to take risk and finance capital expenditure
In this section, we analyse the strength of the European banking sector, in order to assess its capacity to provide loans. We review where banks stand in terms of capital adjustment and show that the European banking sector has become more resilient, as supported by the EBA 2016 stress test. ECB monetary policy has been successful in restoring the transmission channel of monetary policy, so that the pass-through of monetary policy rates to the cost of bank borrowing has been restored.
Box 3 shows that the risk components have been especially elevated for vulnerable countries in the wake of the sovereign debt crisis. However, the bulk of the risks reflect the vicious bank-to-sovereign loop and not risks originating in the corporate sector. More recently, since mid-2014, as Box 3 shows, the cuts in monetary policy rates have been passed-through to the cost of borrowing so that pricing conditions have become more symmetric across Europe. However, the European banking sector is going through a period of structural adjustment and the quality of bank assets remains very diverse across European jurisdictions. Looking forward, banking sectors may differ in their capacity to finance them through accumulated earnings in a low interest rate environment. This would be especially important if the current environment were to remain persistent. Banking sectors encumbered with impaired assets and drawing most of their income from net interest revenue would then be more exposed.
4.4.1. EU banks have strengthened their balance sheets…Over the last four years, EU banks have increased their capital ratio substantially, in an unprecedented manner. At the end of 2015, the EU banking sector had a Core Tier 1 capital ratio of 13.2% (EBA 2016).14 This was 200 bps higher than in the stress sample of 2014 and 400 bps higher than in that of 2011. A large part of the adjustment has occurred through equity issuance and capital retention. Indeed, the increase in the CET1 capital base is estimated to have contributed to almost all of the 3 p.p. increase in the CET1 ratio since the beginning of 2010 (Figure 31). This mostly resulted from recapitalisation.15 This was accompanied by a rise in assets, being offset by de-risking, and a change in the asset composition of banks towards relatively less risky components. The fact that the bulk of the adjustment took place through a stronger capital base does not mean that the effect on the economy was muted. Indeed, part of the stronger capital base resulted from higher earnings retention achieved through a higher bank lending margin. There is some evidence in the literature that the capital adjustment towards a more resilient banking sector has been detrimental to the provision of credit (BIS, 2010 or Bridges et al., 2014).
The CET1 capital ratio is one of the measures of bank balance sheet strength and it is possible that during the adjustment to more stringent capital requirements, European banks optimised their response by implementing regulatory arbitrage, following the less costly strategy to achieve the same goal. For instance, analysis has shown that banks implementing the Internal Risk Based Approach (IRBA) were reporting lower risk weights than those applying the Standard Risk Methodology (EBA, 2013). To some extent, this reflects differences in the sample of banks considered. Banks implementing IRBA are larger banks which have more expertise and more scope to minimise the risk on their entire portfolio by covering positions with risks negatively correlated. However, the implementation of IRBA may have also enabled banks to lower risk weights. This is supported by the fact that changes in risk weights contributed positively to the capital ratio over the period; they declined at the time of one of the worst economic crisis (Figure 31). Of course, several technical factors may explain this evolution, among them the shift of part of the bank portfolio towards the distressed portfolio during the crisis. However, in these conditions, other ratios, such as the leverage ratios, can provide a more accurate measure of the strength of bank balance sheets (Blundell-Wignal and Roulet, 2013). To take this possibility into consideration, we provide a measure of the change in capital ratio which computes the principal component of a broad set of measures, such as total capital ratio, risk-weighted capital ratio, leverage ratio, loan to deposit.
14 The stress test sample consists of 51 banks, covering around 70% of the European banking sector. 37 banks are domiciled in the euro area, with the remainder in Denmark, Hungary, Norway, Poland, Sweden and the United Kingdom.
15 See Maurin L. and M. Toivanen (2015).

Investment finance PART II 179
European Investment Bank Investment and Investment Finance in Europe
The rise observed in Figure 32 confirms that banks have strengthened the resilience of their balance sheets and their overall solvency. This assessment is confirmed by the stress test results released in July 2016, which show that, overall, the EU banking sector is robust enough to withstand adverse economic conditions.
Moreover, it confirms that the regulatory adjustment of capital ratios recommended under Basel III and enforced under CRR-CRD IV has come to completion.
Figure 31 Accounting-based decomposition of the change in CET1 capital ratios of EU banks
Figure 32 Factor-based measure of capital and leverage ratio of EU banks
-1.5
0.0
1.5
3.0
4.5
6.0
-2
-1
0
1
2
3
Change in total asset
Change in risk-weight
Change in capital
Change in CET1 ratio
25% quartile 75% quartileMedian
2010
Q1
2011
Q1
2012
Q1
2013
Q1
2014
Q1
2015
Q1
2016
Q1
2005
2006
2007
2008
2009
2010
2011
2012
2013
2014
2015
2016
Source: ECON calculations based on Eikon DataStream.Note: Change since 2010 and contributions (pp). Based
on the average of 33 listed banks. See footnote to Figure 32.
Source: ECON computations based on Eikon DataStream. Note: Based on 33 listed banks located in DE, FR, IT, ES,
AU, UK, SW and DK, see Galiay A. and L. Maurin (2015). For each bank, the principal component of a set of balance sheet indicators related to capital and leverage is computed and de-meaned over 2003Q1-2016Q2. The blue line inside the green ones portrays the median of the indicator across the sample of banks while the two green lines represent the 25% and 75% quartiles.
4.4.2 … and should be relatively resilient in the current environment…
On the one hand, the cost of funding of banks has substantially declined. Indeed, as shown in Figure 33, the spread to the underlying reference rate has declined by almost 200 bps since the beginning of 2013. However, it has remained relatively stable since the beginning of 2015, above the pre-Lehman period. This indicator may provide a rosy picture of the current situation and underestimate the tensions, at least in the euro area given that the incentive to issue bank debt may be relatively weak, especially in the euro area where Targeted Longer-Term Refinancing Operations and full allotment policies are being implemented. In this context, the less creditworthy issuer may favour recourse to ECB funding. Yet, as reiterated by the results of the July 2016 EBA stress tests, EU banks are well capitalised. In the adverse scenario, which entails a GDP 7.1 p.p. below the EC baseline forecast in 2018, the capital ratio decreases by 380 bps but stands at 9.4% at the end of 2018. European banks continue to suffer from weak investor preference and their valuation remains very sensitive to negative events hurting specific institutions.

PART II Investment finance180
Investment and Investment Finance in Europe European Investment Bank
As developed in Chapter 1 and reiterated throughout this report, the current macroeconomic environment, whilst remaining challenging, is improving across Europe. Hence, many indications suggest improved bank balance sheets and higher income. An indication of these improvements is provided in Figure 34. For most of the larger European banks, a dataset mixing indicators of the domestic macroeconomic environment where the bank is domiciled together with key indicators of profit and loss, liquidity and funding and capital and leverage ratios is set up. Out of it, the common component is extracted. The indicator characterises the bank’s operating environment: the higher it is, the more supportive it is to the conduct of banking operations and the supply of loans. Figure 34 reports the median common component and the inter-quartile interval for the 33 banks operating in the eight EU countries covered in the sample. It appears that after the trough of the Lehman crisis at the turn of 2008 and, more recently, that of the sovereign debt crisis, in mid-2012, the indicator has improved but remains below the levels reached before 2008. Interestingly also, the dispersion around the indicator has decreased, thereby suggesting less divergence across European banking systems.16
Figure 33 Spread between the cost of bank
debt issuance and the EURIBOR 3 months
Figure 34 Indicator of EU banks' operating environment
-5
-4
-3
-2
-1
0
1
2
3
4
-2
-1
0
1
2
3
4
25% quartile 75% quartileMedian
2005
2006
2007
2008
2009
2010
2011
2012
2013
2014
2015
2016
2005
2006
2007
2008
2009
2010
2011
2012
2013
2014
2015
2016
Source: ECON computation based on Eikon Datastream.Note: See Galiay A. and L. Maurin (2015). For each quarter,
the blue (green) line portrays the median (quartiles) of the spread at issuance between the bank bonds issued by European banks and the EURIBOR 3 months.
Source: ECON computations based on Eikon DataStream. Note: Based on 33 listed banks located in DE, FR, IT, ES,
AU, UK, SW and DK, see Galiay A. and L. Maurin (2015). For each bank, the principal component of around 15 indicators comprising both bank-specific indicators related to P&L and the macroeconomic situation of the country where the parent bank is located is computed and de-meaned over 2003Q1-2016Q2. The blue line inside the green ones portrays the median of the indicator across the sample of banks while the two green lines represent the 25% and 75% quartiles.
16 A very similar picture is provided by the systemic risk indicator computed over more than 300 European banks by the VLAB at the NY Stern University available on http://vlab.stern.nyu.edu/analysis/RISK.WORLDFIN-MR.GMES. See Archarya et al. (2012).
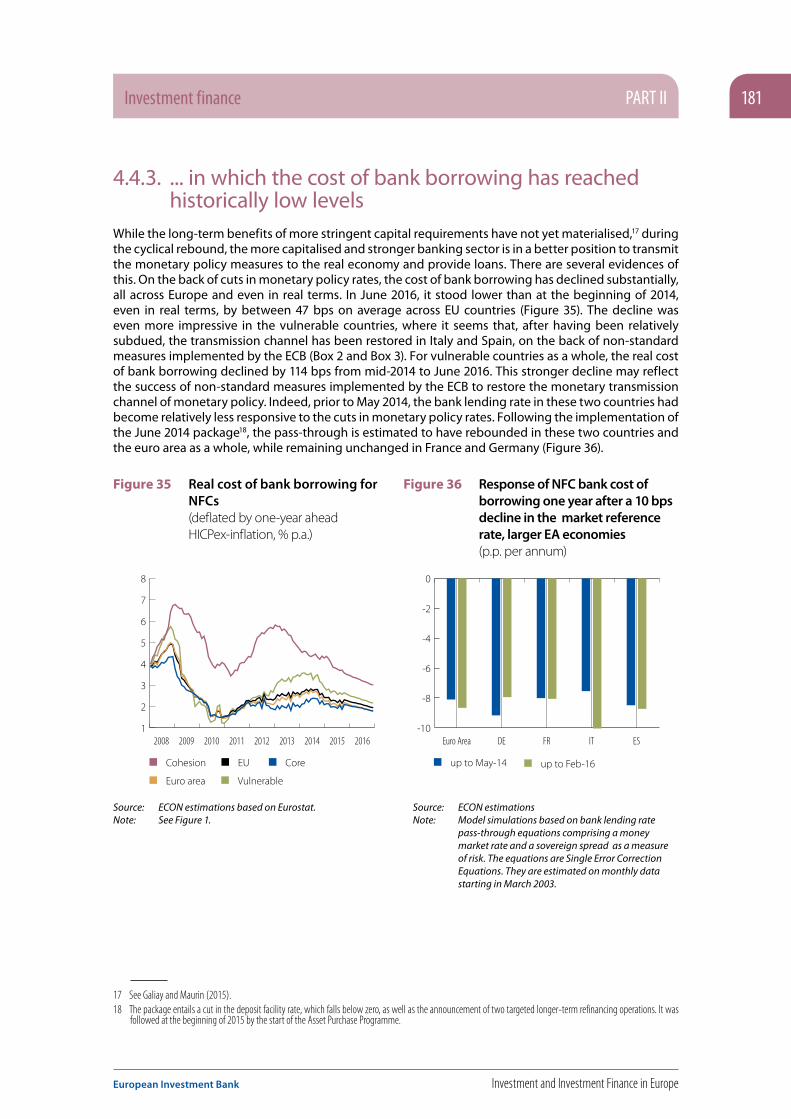
Investment finance PART II 181
European Investment Bank Investment and Investment Finance in Europe
4.4.3. ... in which the cost of bank borrowing has reached historically low levels
While the long-term benefits of more stringent capital requirements have not yet materialised,17 during the cyclical rebound, the more capitalised and stronger banking sector is in a better position to transmit the monetary policy measures to the real economy and provide loans. There are several evidences of this. On the back of cuts in monetary policy rates, the cost of bank borrowing has declined substantially, all across Europe and even in real terms. In June 2016, it stood lower than at the beginning of 2014, even in real terms, by between 47 bps on average across EU countries (Figure 35). The decline was even more impressive in the vulnerable countries, where it seems that, after having been relatively subdued, the transmission channel has been restored in Italy and Spain, on the back of non-standard measures implemented by the ECB (Box 2 and Box 3). For vulnerable countries as a whole, the real cost of bank borrowing declined by 114 bps from mid-2014 to June 2016. This stronger decline may reflect the success of non-standard measures implemented by the ECB to restore the monetary transmission channel of monetary policy. Indeed, prior to May 2014, the bank lending rate in these two countries had become relatively less responsive to the cuts in monetary policy rates. Following the implementation of the June 2014 package18, the pass-through is estimated to have rebounded in these two countries and the euro area as a whole, while remaining unchanged in France and Germany (Figure 36).
Figure 35 Real cost of bank borrowing for NFCs (deflated by one-year ahead HICPex-inflation, % p.a.)
Figure 36 Response of NFC bank cost of borrowing one year after a 10 bps decline in the market reference rate, larger EA economies (p.p. per annum)
up to Feb-16up to May-14CoreEU
Euro area Vulnerable
Cohesion
1
2
3
4
5
6
7
8
2008 2009 2010 2011 2012 2013 2014 2015 2016 Euro Area DE FR IT ES-10
-8
-6
-4
-2
0
Source: ECON estimations based on Eurostat. Note: See Figure 1.
Source: ECON estimationsNote: Model simulations based on bank lending rate
pass-through equations comprising a money market rate and a sovereign spread as a measure of risk. The equations are Single Error Correction Equations. They are estimated on monthly data starting in March 2003.
17 See Galiay and Maurin (2015).18 The package entails a cut in the deposit facility rate, which falls below zero, as well as the announcement of two targeted longer-term refinancing operations. It was
followed at the beginning of 2015 by the start of the Asset Purchase Programme.
PART II Investment finance182
Investment and Investment Finance in Europe European Investment Bank
Box 3 Drivers of bank lending rates
In normal times, as a consequence of arbitrage opportunities and market competition, banks’ lending rates closely reflect changes in their funding costs. In abnormal times, as a result of heterogeneous risk components and market segmentation, this relationship can be distorted, making policy-making particularly difficult. In the largely banking-dependent European financial sector this can place an additional burden on the corporate sector and curb real economic activity.
Asymmetric developments in bank lending rates in recent years have weighed on the process of financial integration across Europe. In this respect, the euro area is a particular example, as even with access to the common liquidity provided by the European Central Bank (ECB), bank lending rates differ strongly across different jurisdictions. As a consequence, the transmission of the euro-wide policy instruments to the real economy is hampered, or can even create asymmetric distortions across the Member States. Better understanding of the factors driving bank lending conditions can ensure more effective policy implementation and alleviate many of the borrowers’ constraints.
Empirical studies highlight that heterogeneity in bank lending conditions can originate in high levels of sovereign debt, sluggish economic activity, weak banks or high economic uncertainty (Paries, et al. 2014). High levels of sovereign indebtedness and therefore higher sovereign funding costs are a sign of unsustainable fiscal policy. They can increase the solvency risk of a country and force banks to account for them when granting loans. In the case of a sovereign default, debtors who are government-dependent would find it more difficult to finance their obligations, which will have a direct effect on banks. Similarly, in a slow-growing or stagnating economy incomes and investments are stalled, making the debt more burdensome than had been assumed when applying for a loan. The banks need to compensate for this risk by raising retail lending rates. Weak banking positions, i.e. low capital ratios or high riskiness of balance sheets, limit the incentives to take additional risk by granting new loans as well as increasing the counterparty risk in the interbank market. These two effects put upward pressure on retail rates. Similarly, high economic uncertainty and subdued economic growth increase the risk that the debtor will not be able to repay its obligations, which eventually makes banks demand higher risk premia on the loans they grant.
In this box we study the evolution of the factors which affected bank lending rates, taking the example of four euro area countries: Germany, France, Italy and Spain. We distinguish between three potential factors affecting bank lending: namely sovereign, supply-side and demand-side conditions, which we approximate by generalised macroeconomic measures. We look at interest rates on small loans (up to and including EUR 1m) which the Monetary Financial Institutions (MFIs) granted to Non-Financial Corporates (NFCs) in the period from January 2000 until March 2016. We estimate a factor-augmented pass-through model, explaining the dynamics of the bank lending rates (BR
t) as a function of interbank market rates (IR
t) and sovereign (SOV
t), supply (SF
t) and demand
factors (DFt). One can formally write the model as
∆BRt =
j = 1
J
∑ δj ΔBR
t-j+
j = 1
K
∑ λk ΔIR
t-k +
s = 1
S
∑ ωs ΔSOV
t-s +
m = 1
M
∑ σm
ΔSFt-m
+ n = 1
N
∑ ΔDFt-n
+ α(BRt-1
– β1 IR
t-1) – β
2 SOV
t-1
– β
3SF
t-1 – β
4 DF
t-1 – β
0 ) + ε
t ,
where Δ denotes the changes and εt is the error term. We approximate sovereign and supply-side
components by probabilities of default (PD). In particular, we take 1-year PDs for the sovereign, and sample median of 1-year PDs for the banking sector.19 As a demand-side proxy we take labour market conditions, expressed by either employment expectations or unemployment rate, depending on
19 The banking samples for which PDs are available tend to be skewed towards larger and more transparent entities. We therefore carried out several robustness checks, including rates granted on bigger loans and different quantiles of the PD distributions. The main results were robust to these specifications.
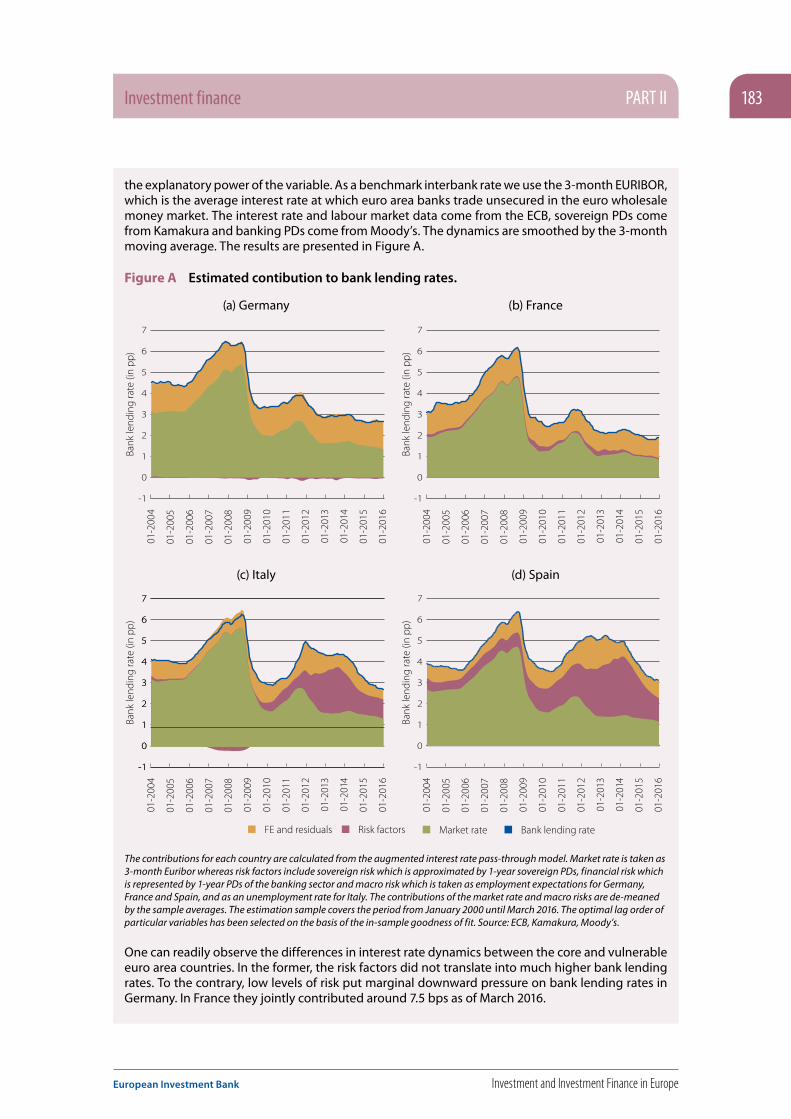
Investment finance PART II 183
European Investment Bank Investment and Investment Finance in Europe
the explanatory power of the variable. As a benchmark interbank rate we use the 3-month EURIBOR, which is the average interest rate at which euro area banks trade unsecured in the euro wholesale money market. The interest rate and labour market data come from the ECB, sovereign PDs come from Kamakura and banking PDs come from Moody’s. The dynamics are smoothed by the 3-month moving average. The results are presented in Figure A.
Figure A Estimated contibution to bank lending rates.
(a) Germany (b) France
-1
0
1
2
3
4
5
6
7
Risk factors Market rateFE and residuals Bank lending rate
01-2
004
01-2
016
01-2
015
01-2
014
01-2
013
01-2
012
01-2
011
01-2
010
01-2
009
01-2
008
01-2
007
01-2
006
01-2
005
-1
0
1
2
3
4
5
6
7
-1
0
1
2
3
4
5
6
7
01-2
004
01-2
016
01-2
015
01-2
014
01-2
013
01-2
012
01-2
011
01-2
010
01-2
009
01-2
008
01-2
007
01-2
006
01-2
005
-1
0
1
2
3
4
5
6
7
Bank
lend
ing
rate
(in
pp)
Bank
lend
ing
rate
(in
pp)
01-2
004
01-2
016
01-2
015
01-2
014
01-2
013
01-2
012
01-2
011
01-2
010
01-2
009
01-2
008
01-2
007
01-2
006
01-2
005
-1
0
1
2
3
4
5
6
7
Bank
lend
ing
rate
(in
pp)
Bank
lend
ing
rate
(in
pp)
01-2
004
01-2
016
01-2
015
01-2
014
01-2
013
01-2
012
01-2
011
01-2
010
01-2
009
01-2
008
01-2
007
01-2
006
01-2
005
(c) Italy (d) Spain
-1
0
1
2
3
4
5
6
7
Risk factors Market rateFE and residuals Bank lending rate
01-2
004
01-2
016
01-2
015
01-2
014
01-2
013
01-2
012
01-2
011
01-2
010
01-2
009
01-2
008
01-2
007
01-2
006
01-2
005
-1
0
1
2
3
4
5
6
7
-1
0
1
2
3
4
5
6
7
01-2
004
01-2
016
01-2
015
01-2
014
01-2
013
01-2
012
01-2
011
01-2
010
01-2
009
01-2
008
01-2
007
01-2
006
01-2
005
-1
0
1
2
3
4
5
6
7
Bank
lend
ing
rate
(in
pp)
Bank
lend
ing
rate
(in
pp)
01-2
004
01-2
016
01-2
015
01-2
014
01-2
013
01-2
012
01-2
011
01-2
010
01-2
009
01-2
008
01-2
007
01-2
006
01-2
005
-1
0
1
2
3
4
5
6
7
Bank
lend
ing
rate
(in
pp)
Bank
lend
ing
rate
(in
pp)
01-2
004
01-2
016
01-2
015
01-2
014
01-2
013
01-2
012
01-2
011
01-2
010
01-2
009
01-2
008
01-2
007
01-2
006
01-2
005
The contributions for each country are calculated from the augmented interest rate pass-through model. Market rate is taken as 3-month Euribor whereas risk factors include sovereign risk which is approximated by 1-year sovereign PDs, financial risk which is represented by 1-year PDs of the banking sector and macro risk which is taken as employment expectations for Germany, France and Spain, and as an unemployment rate for Italy. The contributions of the market rate and macro risks are de-meaned by the sample averages. The estimation sample covers the period from January 2000 until March 2016. The optimal lag order of particular variables has been selected on the basis of the in-sample goodness of fit. Source: ECB, Kamakura, Moody’s.
One can readily observe the differences in interest rate dynamics between the core and vulnerable euro area countries. In the former, the risk factors did not translate into much higher bank lending rates. To the contrary, low levels of risk put marginal downward pressure on bank lending rates in Germany. In France they jointly contributed around 7.5 bps as of March 2016.

PART II Investment finance184
Investment and Investment Finance in Europe European Investment Bank
The risk factors have substantially dampened monetary policy transmission in Italy and Spain, in particular, in the years following the financial and sovereign debt crises. Financial intermediation was strongly disturbed in Italy after 2008, reaching the apogee in 2013. Spanish risk contributed around 50 bps to bank lending rates before the crisis, but the effect surged during the sovereign debt crisis, mostly driven by sovereign disturbance. During the peak period in 2014 the risk factors added almost 2.6 pp to lending rates in Spain, and even though they declined over recent months they still contribute around 1.1 pp. In Italy, during the peak period, the risk built up to around 2.1 pp and it recently converged to nearly 0.9 pp.
With non-responsive retail rates the standard monetary policy actions are largely ineffective. The fact that the ECB operates near to the zero lower bound environment makes bank lending only more difficult to stimulate as the conventional tools run out of scope. Strategies which could improve the effectiveness of the transmission channels should gain more attention. These could include policies aimed at restoring market confidence, cross-border risk-sharing and fostering financial integration in the euro area.
BibliographyParies, Matthieu Darracq, Diego N. Moccero, Elizaveta Krylova, and Claudia Marchini. The Retail Bank Interest Rate Pass-Through: The Case of the Euro Area During the Financial and Sovereign Debt Crisis. Occasional Paper Series No 155, Frankfurt am Main: European Central Bank, 2014, 1-45.
4.4.4. But the persistence of the current policy configuration may pose a risk to the capacity to provide credits…
The most recent experience suggests that the Zero Lower Bound (ZLB) is below zero. The rate is defined as the minimum monetary policy rate that can be achieved without transmitting into a deposit rate provided by banks to money holders, which would trigger a rush on cash. Even the deposit rate may be below zero as storing and insuring a large quantity of cash is costly. However, should the return on monetary assets go down further and be expected to remain lower for a prolonged period, such behaviour could be triggered.
Because of this possibility, banks are reluctant to pass on negative interest rates to their depositors and the funding cost of banks becomes less elastic to monetary policy rates at low levels. Hence, when lowering the lending rate they offer on corporate loans, the net interest rate margin can be reduced. If all banks were sharing the same funding structure while operating competitively, the lending rate would just move according to the change in the funding cost without impacting the net interest margin. But banks have different liability structures, across countries and within countries, some being more market-funded and others more deposit-funded. The latter are likely to be more negatively affected by a negative interest rate policy (NIRP).
Beside the possible detrimental effect of a NIRP on the net interest margin, the current monetary policy may contribute to weakening banks’ income as it flattens the yield curve. Banks operate maturity transformation; they borrow short and lend long. Hence, their profits are negatively affected by a decline in the term spread. The reaction may however take time to materialise as given the maturity structure of banks’ balance sheets, the funding costs react more quickly than the return on assets. Assuming a high share of fixed rate loans, the short-term effect may even be positive.

Investment finance PART II 185
European Investment Bank Investment and Investment Finance in Europe
To summarise, banks’ interest margins may be negatively affected by the current monetary policy configuration. More exposed are banks which have a larger deposit base offering floating rate loans. However, this remains only part of the overall effect. The rebound in activity fuelled by the monetary accommodation is also likely to increase asset quality and loan demand, resulting in more activity for banks. Hence, it is difficult to draw conclusions about the impact of the current policy on banks’ returns, and the negative partial effect of the current monetary policy on banks’ net interest margins has to be compounded by the capital gains for banks and, beyond, the positive effects, in terms of stronger growth, for the economy as a whole.
Given the lack of public statistics on individual banks’ P&Ls, one should remain very cautious before drawing conclusions about what has recently happened, as aggregated figures may mask opposite dynamics partly explained by the reasons mentioned above. On top, other factors contribute to explaining the developments in banks’ P&Ls which can therefore not be directly attributed to policy. Some information suggests that indeed, net interest margins have declined, but that this decline has been offset and the return on equity has increased (Figure 37). Anecdotal evidence suggests that banks have started adapting their business model, increasing fees and commissions and reducing operating expenses. Asset quality also seems to have increased, resulting in lower provisions. So far, no clear signs of negative impact are visible in Europe and the euro area. But given the differences in business models, banks with a higher share of incomes drawn from net interest income may be more exposed (Figure 38).
Figure 37 Bank profitability and contributing factors (percentages of asset, average, 4-qtr moving average)
Figure 38 Share of net interest income and net fee and commission income in the income of the EU banking sector (average %, over 2008-2013)
Net interest income Non interest income
Non interest expenses Provisions for loan losses
Net return (rhs)
-0.4
-0.2
0.0
0.2
0.4
-0.10
-0.05
0.00
0.05
0.10
0.0 0.2 0.4 0.6 0.8 1.0
GR
IE
CY
SK
HR
MT
BG
SI
BE
DE
PL
UK
IT
FR
LU
EE
HU
DK
NL
CZ
RO
ES
AT
SE
EU
LT
PT
FI
LV
2006Q1 2008Q1 2010Q1 2012Q1 2014Q1 2016Q1
Net interest incomeNet fee and commission income
Source: ECON calculations based on Thomson Reuters.Note: Profit components are annualised median values
displayed as shares of equity. Yearly figures are 4-quarter averages. Based on a sample of 31 EU banks. Latest observation: 2016 Q2.
Source: ECON calculations based on ECB consolidated banking data.
While this assessment takes stock of the current picture, stock market information may help to gauge future evolutions (Figure 39). Indeed, European banks are suffering from an undervaluation which accelerated during the summer of 2016 after the release of the stress test results. This comes at odds with the conclusions of the EBA stress test released on 29 July 2016 (EBA, 2016), which shows that almost all the EU banks stress tested are well-capitalised and can withstand an adverse macroeconomic scenario.
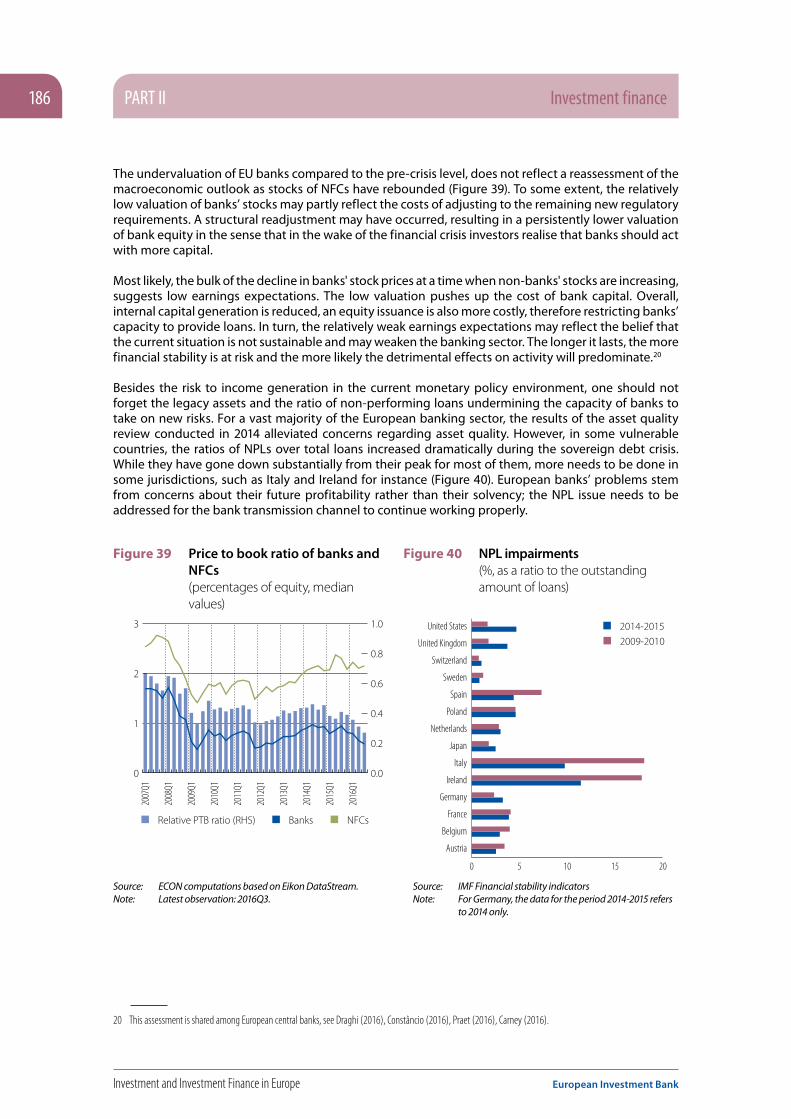
PART II Investment finance186
Investment and Investment Finance in Europe European Investment Bank
The undervaluation of EU banks compared to the pre-crisis level, does not reflect a reassessment of the macroeconomic outlook as stocks of NFCs have rebounded (Figure 39). To some extent, the relatively low valuation of banks’ stocks may partly reflect the costs of adjusting to the remaining new regulatory requirements. A structural readjustment may have occurred, resulting in a persistently lower valuation of bank equity in the sense that in the wake of the financial crisis investors realise that banks should act with more capital.
Most likely, the bulk of the decline in banks' stock prices at a time when non-banks' stocks are increasing, suggests low earnings expectations. The low valuation pushes up the cost of bank capital. Overall, internal capital generation is reduced, an equity issuance is also more costly, therefore restricting banks’ capacity to provide loans. In turn, the relatively weak earnings expectations may reflect the belief that the current situation is not sustainable and may weaken the banking sector. The longer it lasts, the more financial stability is at risk and the more likely the detrimental effects on activity will predominate.20
Besides the risk to income generation in the current monetary policy environment, one should not forget the legacy assets and the ratio of non-performing loans undermining the capacity of banks to take on new risks. For a vast majority of the European banking sector, the results of the asset quality review conducted in 2014 alleviated concerns regarding asset quality. However, in some vulnerable countries, the ratios of NPLs over total loans increased dramatically during the sovereign debt crisis. While they have gone down substantially from their peak for most of them, more needs to be done in some jurisdictions, such as Italy and Ireland for instance (Figure 40). European banks’ problems stem from concerns about their future profitability rather than their solvency; the NPL issue needs to be addressed for the bank transmission channel to continue working properly.
Figure 39 Price to book ratio of banks and NFCs (percentages of equity, median values)
Figure 40 NPL impairments (%, as a ratio to the outstanding amount of loans)
Relative PTB ratio (RHS) Banks NFCs
0.0
0.2
0.4
0.6
0.8
1.0
0
1
2
3
0 5 10 15 20
United States
United Kingdom
Switzerland
Sweden
Spain
Poland
Netherlands
Japan
Italy
Ireland
Germany
France
Belgium
Austria
2007
Q1
2008
Q1
2009
Q1
2010
Q1
2011
Q1
2012
Q1
2013
Q1
2014
Q1
2015
Q1
2016
Q1
2014-20152009-2010
Source: ECON computations based on Eikon DataStream.Note: Latest observation: 2016Q3.
Source: IMF Financial stability indicatorsNote: For Germany, the data for the period 2014-2015 refers
to 2014 only.
20 This assessment is shared among European central banks, see Draghi (2016), Constâncio (2016), Praet (2016), Carney (2016).
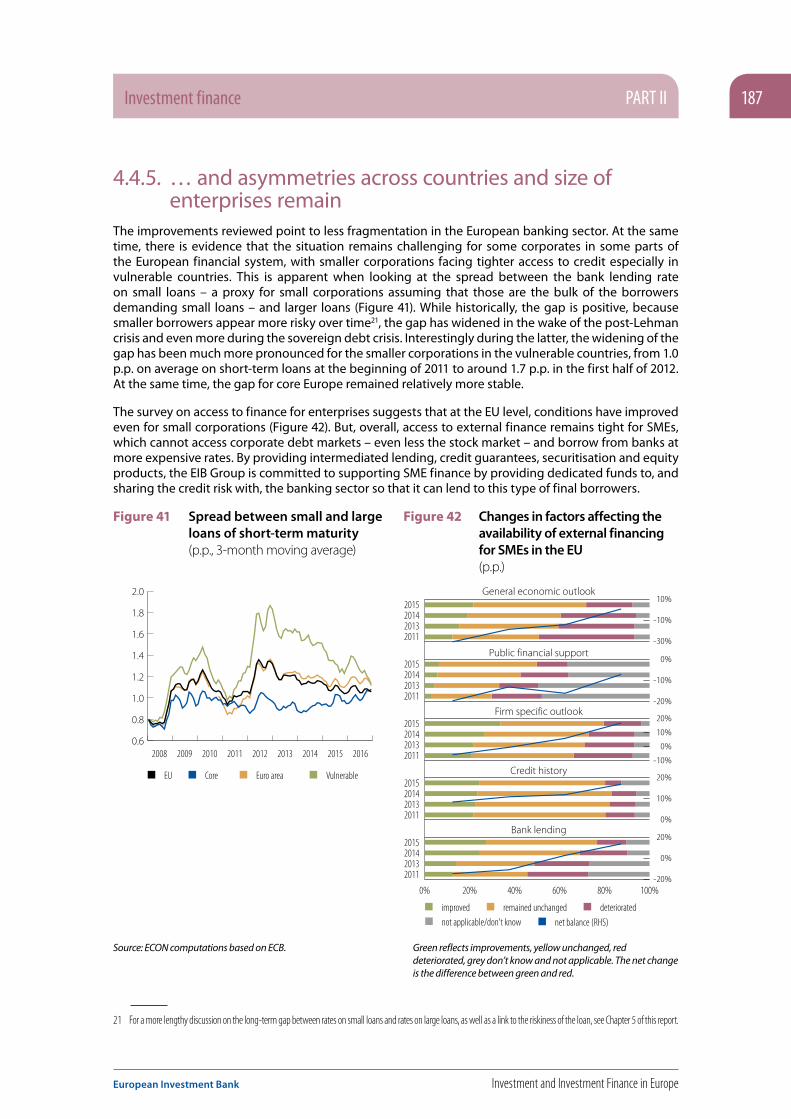
Investment finance PART II 187
European Investment Bank Investment and Investment Finance in Europe
4.4.5. … and asymmetries across countries and size of enterprises remain
The improvements reviewed point to less fragmentation in the European banking sector. At the same time, there is evidence that the situation remains challenging for some corporates in some parts of the European financial system, with smaller corporations facing tighter access to credit especially in vulnerable countries. This is apparent when looking at the spread between the bank lending rate on small loans – a proxy for small corporations assuming that those are the bulk of the borrowers demanding small loans – and larger loans (Figure 41). While historically, the gap is positive, because smaller borrowers appear more risky over time21, the gap has widened in the wake of the post-Lehman crisis and even more during the sovereign debt crisis. Interestingly during the latter, the widening of the gap has been much more pronounced for the smaller corporations in the vulnerable countries, from 1.0 p.p. on average on short-term loans at the beginning of 2011 to around 1.7 p.p. in the first half of 2012. At the same time, the gap for core Europe remained relatively more stable.
The survey on access to finance for enterprises suggests that at the EU level, conditions have improved even for small corporations (Figure 42). But, overall, access to external finance remains tight for SMEs, which cannot access corporate debt markets – even less the stock market – and borrow from banks at more expensive rates. By providing intermediated lending, credit guarantees, securitisation and equity products, the EIB Group is committed to supporting SME finance by providing dedicated funds to, and sharing the credit risk with, the banking sector so that it can lend to this type of final borrowers.
Figure 41 Spread between small and large loans of short-term maturity (p.p., 3-month moving average)
Figure 42 Changes in factors affecting the availability of external financing for SMEs in the EU (p.p.)
CoreEU Euro area Vulnerable
0.6
0.8
1.0
1.2
1.4
1.6
1.8
2.0
2008 2009 2010 2011 2012 2013 2014 2015 2016
0% 20% 40% 60% 80% 100%
2011201320142015
2011201320142015
2011201320142015
2011201320142015
2011201320142015
-30%
-10%
10%
-20%
-10%
0%
-10%
0%
10%
20%
0%
10%
20%
-20%
0%
20%
General economic outlook
Public financial support
Firm specific outlook
Credit history
Bank lending
remained unchangedimproved deteriorated
net balance (RHS)not applicable/don't know
Source: ECON computations based on ECB. Green reflects improvements, yellow unchanged, red deteriorated, grey don’t know and not applicable. The net change is the difference between green and red.
21 For a more lengthy discussion on the long-term gap between rates on small loans and rates on large loans, as well as a link to the riskiness of the loan, see Chapter 5 of this report.

PART II Investment finance188
Investment and Investment Finance in Europe European Investment Bank
4.5. Concluding remarksIn this chapter we have analysed the macro-financial environment of European NFCs with a view to detecting financial factors possibly hindering their capital expenditure. We have provided evidence that the macro-financial environment has improved significantly since the end of 2012, and to a lesser extent since the end of 2014. Recently, the financing conditions appear to have been relatively supportive of investment, up to mid-2016 at least. After years of financial crisis, this positive achievement results from several policy measures, primarily monetary policy.
In this context, we have shown that the corporate sector has taken the opportunity to improve its financial soundness, very significantly where it was most needed, in vulnerable economies. At the same time, the banking sector has built up capital buffers and, having increased its resilience, stands in a better position to provide funding. However, the sector needs to adapt its business model. It is going through a period of major transformation and is confronted by weak investor preference.
Going forward, together with the high level of impaired assets, the low and flat yield environment may become a risk to the banking sector’s capacity to provide loans. In some countries, the twin coincidence of a banking sector more exposed to the low and flat yield environment, owing to structural features, and impaired assets, owing to a more pronounced cyclical dip, could prove very harmful to the European economy as a whole.
Monetary policy being close to its limits, other policies should be implemented. In the context of the EFSI plan, the EIB is providing more and more support for the recovery. In the longer term, the development of deeper financial markets across Europe would help to achieve better resource allocation, reduce the likelihood of entering secular stagnation, and better protect European economies against shocks.

Investment finance PART II 189
European Investment Bank Investment and Investment Finance in Europe
ReferencesAcharya, Viral, Pedersen Lasse, Phillipon Thomas and Matthew Richardson (2012), “Measuring Systemic Risk”, CEPR Discussion Paper, 8824.
Aglietta, Michel and Natacha Valla (2016), “Introduction générale à la problématique des taux d´intérêt négatifs”, taux d´intérêt négatifs, douze regards, Institut Messine.
Alcidi , Cinzia and Gilles Thirion, (2016), “Risk sharing, consumption smoothing and fiscal policy”, CEPS special report, n° 146, September.
Andy, Andreas, and Huidan Lin Jobst, (2016), “Negative Interest Rate Policy (NIRP): Implications for Monetary Transmission and Bank Profitability in the Euro Area”, IMF Working Paper, 16/172, August.
Backer, Scott R., and Bloom, Nicholas, and Steven J. Davis (2016). “Measuring Economic Policy Uncertainty”, at www.PolicyUncertainty.com.
Bank for International Settlements (2010), Final Report on “Assessing the macroeconomic impact of the transition to stronger capital and liquidity requirements”, Macroeconomic Assessment Group
Bloom, Nicholas (2014), Fluctuations in Uncertainty, Journal of Economic Perspectives, vol. 28, no. 2, Spring 2014, pp. 153-76
Bloom, Nick, John Van Reenen and Stephen Bond (2007), “Uncertainty and Investment Dynamics”, NBER Working Paper, No. 12383.
Borio, Claudio and Leonardo Gambacorta and Boris Hofmann (2015), “The influence of monetary policy on bank profitability”, BIS working paper, 514, October.
Bluedorn, John, Rupa Duttagupta, Jaime Guadardo and Petia Topalova (2013), “Capital flows are fickle: anytime, anywhere”, IMF working paper, 13/183.
Blundell-Wignal, Adriand and Carolien Roulet (2013), “Business models of banks, leverage and distance-to-default”, OECD Journal: Financial Market Trends, vol. 2012/2.
Borio, Claudio (2012), “The financial cycle and macroeconomics: What have we learnt?”, Bank for International Settlements Working Papers, No. 395.
Bussière, Matthieu, Julia Schmidt and Natacha Valla (2016), “International financial flows in the new normal: key patterns (and why we should care)”, EIB Working Paper, 2016/02.
Bridges, Jonathan, Gregory, David, Nielsen, Mette, Pezzini, Silvia, Radia, Amar and Spaltro, Marco (2014), “The impact of capital requirements on bank lending”, Bank of England Staff Working Paper No. 486
Carney, Mark, (2016), ‘’Uncertainty, the economy and policy”, Speech, Court Room, Bank of England, 30 June 2016.
Chinn, Menzie D. and Hiro Ito (2008), “A New Measure of Financial Openness”, Journal of Comparative Policy Analysis, Volume 10, Issue 3 September 2008, p. 309 - 322.
Coeuré, Benoît (2016), “Assessing the implications of negative interest rates”, Speech at Yale Financial Crisis Forum, 28 July.
PART II Investment finance190
Investment and Investment Finance in Europe European Investment Bank
Coeuré Benoit, (2015), Paradigm lost: Rethinking international adjustments, Egon and Joan von Kashnitz Lecture, Clausen Center for International Business and Policy, Berkeley, 21 November 2015.
Committee on the Global Financial System (2011), “Global liquidity - concept, measurement and policy implications”, CGFS Paper, No 45.
Constâncio, Victor (2016), “The challenge of low real interest rates for monetary policy”, Lecture, Macroeconomics Symposium, Utrecht School of Economics, 15 June 2016.
Cuerpo, Claudio, Ines Drumond, Julia Lendvai, Peter Pontuch and Rafal Raciborski (2013). “Indebtedness, Deleveraging Dynamics and Macroeconomic Adjustment”, European Economy, Economic Papers, No. 477.
Darracq-Parries, Matthieu, Laurent Maurin and Diego Moccero (2014), “Financing Condition Index and identification of credit supply shock for the euro area”, International finance, Vol. 17, Issue 3, p.p. 297-321.
Darracq-Parries, Matthieu, Elizaveta Krylova, Claudia Marchini, and Diego Moccero (2014), “The retail interest rate pass-through in the euro area during the financial and sovereign debt crisis”, ECB occasional paper, 155, https://www.ecb.europa.eu/pub/pdf/scpops/ecbop155.pdf?5a584c009e35f04fc83b38d5e8d8d5b3.
Didier, Tatiana, Ross Levine and Sergio L. Schmukler (2016), “Capital market financing, firm growth, and firm size distribution”, ESRB Working Paper Series, n°4, March 2016.
Draghi, Mario (2016), “Addressing the causes of low interest rates”, Introductory speech, Annual Meeting of the Asian Development Bank, 2 May 2016.
Eggertsson, G. B. and N. Mehrotra (2014). “A model of secular stagnation”, in Secular Stagnation: Facts, Causes, and Cures, C. Teulings and R. Baldwin, eds., Centre for Economic Policy Research
Eggertsson, Gauti, and Michael Woodford (2003), “the Zero Lower Bound on interest rates and optimal monetary policy”, Working Paper Columbia University, June
European Banking Authority (2016), “2016 EU-wide stress test results”, 29 July 2016.
European Banking Authority (2013), “Summary report on the comparability and pro-cyclicality of capital requirements under the Internal Ratings Basel approach in accordance with Article 502 of capital requirements regulation”, 17 December 20136.
European Central Bank (2010), “Macroeconomic and financial system uncertainty during the latest recession”, Financial Stability Review, June, pp. 66-71.
European Commission (2016), “The economic outlook after the UK referendum: a first assessment for the Euro Area and the EU”, Institutional Paper, 032, July 2016.
ECB (2016), “Survey on the Access to Finance of Enterprises in the euro area, October 2015 to March 2016”, June 2016.
Galiay, Artus, and Laurent Maurin (2015), “Drivers of banks’ cost of debt and long-term benefits of regulation – an empirical analysis based on EU banks”, ECB Working Paper 1849, https://www.ecb.europa.eu/pub/pdf/scpwps/ecbwp1849.en.pdf.
Hansen, Alvin H. (1939), “Economic progress and declining population growth”, The American Economic Review, Vol. 29, N°1, March, pp. 1-15.

Investment finance PART II 191
European Investment Bank Investment and Investment Finance in Europe
Harimohan, Rashmi, and Michael McLeay and Garry Young (2015), “Pass-through of bank funding costs to lending and deposit rates: lessons from the financial crisis”, BOE Working Paper, 590.
Holston, Katryn, Thomas Laubach and John C. Williams (2016), “Measuring the natural rate of interest: international trends and determinants, Federal Reserve Bank of San Francisco Working Paper Series, 2016-11, June.
Hördahl, Peter, Jhuvesh Sobrun and Philip Turner (2016), “Low long-run interest rates as a global phenomenon”, BIS Working Papers, n° 574.
International Center for Monetary and Banking Studies and Centre for European Policy Research (2015), “Low for long? Causes and consequences of persistency low interest rates” Bean, Charles and Christian Broda and Ito Takatoshi and Randall Rowsner Eds., Geneva reports on the world economy, 17, September 2015.
International Monetary Fund (2015), “International banking after the crisis: increasingly local and safer?”, Global Financial Stability Report, April.
International Monetary Fund (2014), “Perspectives on global real interest rates”, World Economic Outlook, Ch. 3.
Lo, Stéphanie and Kenneth Rogoff (2015). “Secular stagnation, debt overhang and other rationales for sluggish growth, six years on”, Bank for International Settlements Working Papers, No 482.
Maurin, Laurent, and Mervi Toivanen (2015), “Risk, capital buffer and bank lending: a granular approach to the adjustment of euro area banks”, Journal of Banking and Financial Economics, 1(3) 2015, 113–129. http://www.wz.uw.edu.pl/portaleFiles/3842-journal-of-b/articles/JBFE_1(3)2015_art5_kor3.pdf
Maurin, Laurent (2014), “Analysing recent developments in the financing of euro area NFCs”, in a flow-of-funds perspective on the financial crisis, B. Winkler, A. van Riet and P. Bull Eds, Palgrave Macmillan.
Valiante, Diego (2016), “Europe’s Untapped Capital Market: Rethinking financial integration after the crisis”, Centre for European Policy Studies, https://www.ceps.eu/topics/capital-markets-union.
Valla, Natacha, Xavier Ragot and Christian Thimann (2016), “Taux d´intérêt très bas: symptôme ou opportunité?”, forthcoming in rapport du Conseil d Analyse Economique.
Valla, Natacha, Jesper Berg, Laurent Clerc, Olivier Garnier and Erik Nielsen (2015), “A holistic approach to ECB asset purchases, the investment plan and CMU”, CEPII Policy Brief, n°7, April.
Rachel, Lukasz and Thomas Smith (2015), “Secular drivers of the global real interest rate”, Bank of England Staff Working Paper, n° 571.
Rey, Hélène (2013) “Dilemma not Trilemma: The global financial cycle and monetary policy independence”, Symposium, Global Dimensions of Unconventional Monetary Policy
Shin, Hyun Song (2011), “Global banking glut and loan risk premium”, Mundell-Fleming lecture conference.
Summers, L. H. (2014). “US Economic Prospects: Secular Stagnation, Hysteresis, and the Zero Lower Bound”, Business Economics, Vol. 49, No.2.
Williams, John (2016), “Monetary Policy in a Low R-star World”, FED San Francisco.

192
Investment and Investment Finance in Europe European Investment Bank

193
European Investment Bank Investment and Investment Finance in Europe
Part II
Investment finance
Chapter 5
Bottlenecks in financing SMEs’ competitiveness1
1 Helmut Kraemer-Eis, Frank Lang, Wouter Torfs, and Salome Gvetadze (EIF).

194
Investment and Investment Finance in Europe European Investment Bank
Investment finance PART II 195
European Investment Bank Investment and Investment Finance in Europe
Bottlenecks in financing SMEs’ competitiveness2
Chapter at a glance
• Given the importance of small and medium-sized enterprises (SMEs) as the backbone of the EU economy, the financing of their activities and their access to finance is of particular relevance. In this paper we analyse the current state of SME finance in Europe.
• Access to finance remains of greater concern to SMEs than to large enterprises, mainly because SMEs depend very much on bank financing.
• Both the general economic environment and the SME-specific business climate are continuing to improve. However, the recovery remains fragile: recently, growth estimates have been revised downwards and SMEs remain pessimistic about future investment opportunities. The outcome of the recent Brexit referendum adds to European policy uncertainty and can therefore be expected to have a negative effect on the recovery process.
• Traditional bank lending can be complemented (or sometimes even replaced) by additional instruments that help to alleviate SMEs’ difficulties in accessing finance, such as loan guarantees and securitisation, microfinance and private equity/venture capital.
• Credit guarantee schemes “are used widely across economies as important tools to ease financial constraints for SMEs and start-ups” (OECD, 2013). In Europe, the volume of outstanding guarantees as a percentage of GDP is highest in Italy, Portugal and Hungary, i.e. “in those countries, where a network of local or sectoral guarantee institutions is well established” (OECD, 2013). In 2015, the total outstanding guarantee volume of members of the European Association of Guarantee Institutions (AECM) increased by 2.2% to EUR 80.3bn.
• SME securitisation (SMESec) indirectly creates a secondary market for SME loans. The benefits for banks and investors can feed through to have a positive effect on SMEs’ access to finance. Despite the crisis, SMESec in Europe performed relatively well in terms of default rates; however, it is still suffering in terms of issuance. Regarding future regulation, reasonably defined criteria for “high quality”-labelled securitisations might be a way to support the market revival.
• Microenterprises are important contributors to employment. Especially in countries with high unemployment rates, microenterprises act as a driving force for job creation. In light of this, it is particularly problematic that their overall business environment remains unfavourable compared to their larger peers. While the supply of microfinance has been on the rise recently, MFIs expect a reduction in public support in the coming years – a direct consequence of austerity policies (EMN-MFC, 2016 and EMN, 2014). This could threaten the future development of the sector.
2 EIF regularly describes the current situation in SME financing markets in its publication “European Small Business Finance Outlook” (ESBFO), which is published twice a year (usually in June and December) and provides the framework for this paper. See Kraemer-Eis, Lang, Torfs and Gvetadze (2016).

PART II Investment finance196
Investment and Investment Finance in Europe European Investment Bank
• Following the severe crash in 2008/2009, private equity (PE) partially rebounded, including in the venture capital (VC) segment; however, the total investment and fundraising volumes are still below pre-crisis levels. Investors’ cautious sentiment towards VC is shown in the shift in the investor base since 2008. Government agencies accounted for almost a third of total VC fundraising in 2015, thereby continuing to support the market recovery. In addition, some of the gap left by the fall in VC investment has been filled by increased business angel activity.
• There are market imperfections for SME finance that are serious enough to warrant public support. Such support must improve SMEs’ access to finance without distorting efficient market forces.

Investment finance PART II 197
European Investment Bank Investment and Investment Finance in Europe
5.1. IntroductionSmall and medium-sized enterprises (SMEs)3 are commonly known as the backbone of the European economy. In the European Union (EU)’s non-financial sector, more than 22.3 million SMEs accounted for 99.8% of all enterprises, employed 90 million people (66.9% of total employment) and generated EUR 3.7tn in value added (57.8% of total value added) (European Commission, 2015).
Financial institutions are usually reluctant to extend uncollateralised credit4 to SMEs, even at high interest rates. This is rooted in the fact that obtaining adequate information on the true credit quality of firms is costly, which holds particularly true for small, typically young, companies (see also Chapter 4). This can lead to a phenomenon that is referred to as the SME financing gap, i.e. an insufficient supply of credit to SMEs (OECD, 2006). The SME financing gap is driven by a market failure typical of the credit market: information asymmetries.5 Information asymmetries can lead to credit rationing through either moral hazard problems or an adverse selection of low quality borrowers (Akerlof, 1970; Jaffee and Russel, 1976; Stiglitz and Weiss, 1981). Information asymmetry induced credit rationing is particularly prevalent in the market for lending to SMEs, for two reasons. The first relates to their lack of collateral: the availability of collateral provides a way for borrowers to directly eliminate the asymmetric information problem. Pledging collateral in a loan agreement allows firms to bindingly signal their true credit worthiness. In particular new or young firms, with a lack of collateral and by definition without a track record, are those that encounter the greatest difficulty in securing access to finance (Kraemer-Eis, 2014). The second reason relates to the fact that credit market information asymmetries are more pronounced for small firms and the cost of monitoring them is higher. Large companies are required to adhere to corporate norms, legal standards, formal reporting requirements etc., whereas business decision-making processes, transparency rules, dividing lines between company and personal assets are less defined for SMEs. Market failures in the bank lending market therefore imply that many SMEs with economically viable projects will not be able to obtain the necessary financing from the regular system of financial intermediation (BIS, 2012). Given the strategic importance of SMEs as drivers of economic growth and innovation, it is of crucial importance to address the consequences of credit market failures in order to exploit the externalities from entrepreneurial dynamism (Honohan, 2009).6
Apart from such structural difficulties, the financial, debt and economic crisis has made it even harder for SMEs to access funds in recent years (Pelly and Kraemer-Eis, 2012). Before the crisis the OECD (2006) concluded that “in the major OECD countries […] no generalized financing gap can be identified”, but since then the financing landscape has changed significantly. Although global economic prospects have gradually improved since 2009, the recovery has lagged for small enterprises, and access to finance remains a pressing problem for European SMEs, in particular microenterprises.
In addition to traditional bank lending, there exists a range of financial instruments that can help in alleviating SMEs’ difficulties in securing access to finance. In the following sections, we shall look at some of these instruments for SMEs. We cover loan guarantees and loan securitisation (section 5.3), microfinance (section 5.4) and private equity (section 5.5). Loan guarantees can replace missing collateral and hence enable banks to grant more loans. SME loan securitisation aims to enhance the lending capacity of financial intermediaries such as banks and can thus help to improve the availability and terms of debt for SMEs.
3 As defined in European Commission Recommendation 2003/361, SMEs are companies that have fewer than 250 employees and either a turnover not exceeding EUR 50m or a balance sheet total not exceeding EUR 43m. See the dedicated website of the European Commission, Directorate-General Enterprise and Industry, for more details: http://ec.europa.eu/growth/smes/business-friendly-environment/sme-definition/index_en.htm.
4 An analogous argument is valid for equity financing.5 See OECD (2014) for an overview of market failures in SME lending and mitigation techniques.6 For a more elaborate description of market failures in the SME lending market, see Kraemer-Eis, Lang, Torfs and Gvetadze (2016).
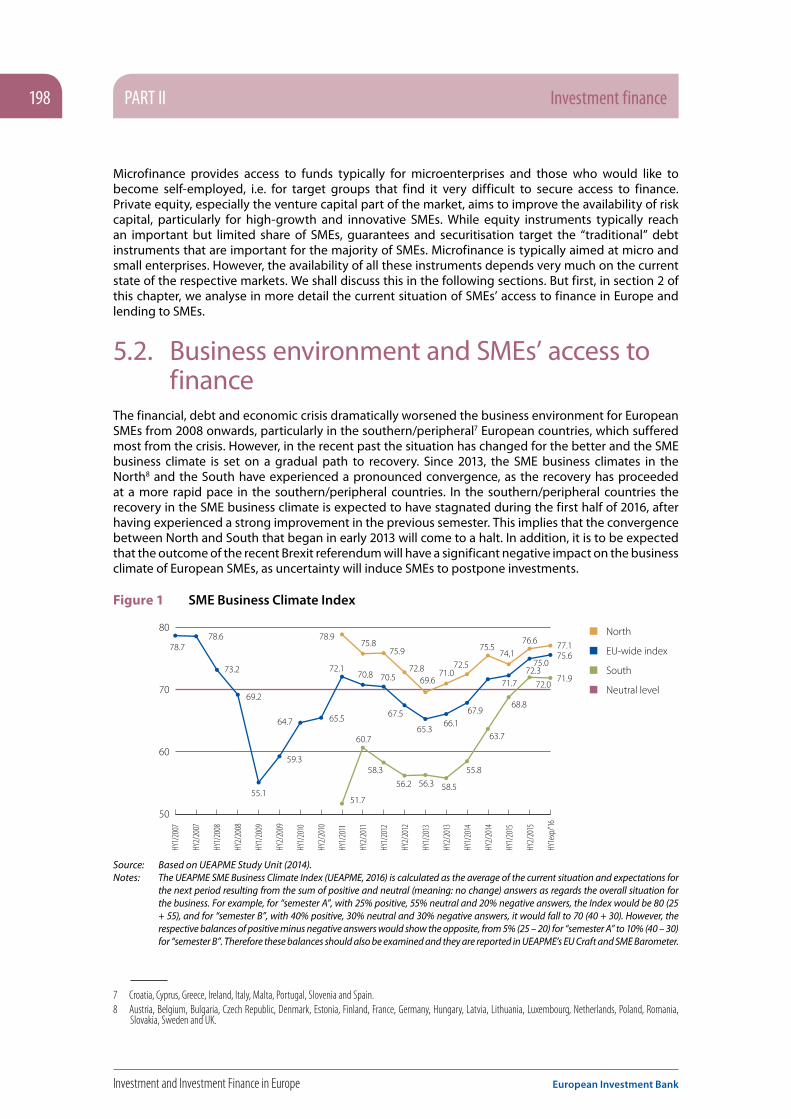
PART II Investment finance198
Investment and Investment Finance in Europe European Investment Bank
Microfinance provides access to funds typically for microenterprises and those who would like to become self-employed, i.e. for target groups that find it very difficult to secure access to finance. Private equity, especially the venture capital part of the market, aims to improve the availability of risk capital, particularly for high-growth and innovative SMEs. While equity instruments typically reach an important but limited share of SMEs, guarantees and securitisation target the “traditional” debt instruments that are important for the majority of SMEs. Microfinance is typically aimed at micro and small enterprises. However, the availability of all these instruments depends very much on the current state of the respective markets. We shall discuss this in the following sections. But first, in section 2 of this chapter, we analyse in more detail the current situation of SMEs’ access to finance in Europe and lending to SMEs.
5.2. Business environment and SMEs’ access to finance
The financial, debt and economic crisis dramatically worsened the business environment for European SMEs from 2008 onwards, particularly in the southern/peripheral7 European countries, which suffered most from the crisis. However, in the recent past the situation has changed for the better and the SME business climate is set on a gradual path to recovery. Since 2013, the SME business climates in the North8 and the South have experienced a pronounced convergence, as the recovery has proceeded at a more rapid pace in the southern/peripheral countries. In the southern/peripheral countries the recovery in the SME business climate is expected to have stagnated during the first half of 2016, after having experienced a strong improvement in the previous semester. This implies that the convergence between North and South that began in early 2013 will come to a halt. In addition, it is to be expected that the outcome of the recent Brexit referendum will have a significant negative impact on the business climate of European SMEs, as uncertainty will induce SMEs to postpone investments.
Figure 1 SME Business Climate Index
50
60
70
80
HY1/
2007
HY2/
2007
HY1/
2008
HY2/
2008
HY1/
2009
HY2/
2009
HY1/
2010
HY2/
2010
HY1/
2011
HY2/
2011
HY1/
2012
HY2/
2012
HY1/
2013
HY2/
2013
HY1/
2014
HY2/
2014
HY1/
2015
HY2/
2015
HY1e
xp/’1
6
78.778.6
73.2
69.2
55.151.7
60.7
58.3
56.2 56.3
55.8
58.5
63.7
59.3
64.7 65.5
78.9
72.170.8 70.5
67.5
65.366.1
67.968.8
71.971.7
75.675.0
72.0
72.3
75.875.9
72.869.6
71.072.5
75.574,1
76.6 77.1
Neutral level
EU-wide index
South
North
Source: Based on UEAPME Study Unit (2014).Notes: The UEAPME SME Business Climate Index (UEAPME, 2016) is calculated as the average of the current situation and expectations for
the next period resulting from the sum of positive and neutral (meaning: no change) answers as regards the overall situation for the business. For example, for “semester A”, with 25% positive, 55% neutral and 20% negative answers, the Index would be 80 (25 + 55), and for “semester B”, with 40% positive, 30% neutral and 30% negative answers, it would fall to 70 (40 + 30). However, the respective balances of positive minus negative answers would show the opposite, from 5% (25 – 20) for “semester A” to 10% (40 – 30) for “semester B”. Therefore these balances should also be examined and they are reported in UEAPME’s EU Craft and SME Barometer.
7 Croatia, Cyprus, Greece, Ireland, Italy, Malta, Portugal, Slovenia and Spain.8 Austria, Belgium, Bulgaria, Czech Republic, Denmark, Estonia, Finland, France, Germany, Hungary, Latvia, Lithuania, Luxembourg, Netherlands, Poland, Romania,
Slovakia, Sweden and UK.

Investment finance PART II 199
European Investment Bank Investment and Investment Finance in Europe
Although the economic environment is improving for SMEs, significant difficulties remain. According to the ECB’s latest Survey on the Access to Finance of Enterprises, or SAFE (ECB, 2016), about 10% of SMEs in the euro area still report access to finance as their most important problem in the second semester of 2015 (see Figure 2). Also here, this euro aggregate hides a significant amount of cross-country heterogeneity: in Italy, for example, the number of SMEs experiencing difficulties in accessing external finance exceeds the European average: 13.4% of SMEs considered access to finance to be their most important problem, up 1 percentage point from the previous semester. In Germany, this percentage amounted to just 6.4%, a decrease of 1 percentage point compared to the previous semester.
Figure 2 Euro area SMEs’ most pressing problems
0% 10% 20% 30% 40% 50% 60% 70% 80% 90% 100%
Costs of productionFinding customers
Availability of skilled staff Availability of skilled staff or experienced managers regulation Other
Access to financeCompetition
HY2/2015
HY1/2015
HY2/2014
HY1/2014
HY2/2013
HY1/2013
HY2/2012
HY1/2012
HY2/2011
HY1/2011
HY2/2010
HY1/2010
4
6
7
8
8
7
7
8
9
12
11
11
14
13
13
15
15
14
13
10
7
7
6
6
17
17
14
16
14
14
13
13
13
15
12
12
14
14
14
13
15
14
14
14
14
13
14
11
14
14
14
14
14
14
14
13
13
14
14
16
10
11
11
13
13
15
15
17
18
16
16
15
27
25
26
20
21
22
24
26
27
23
25
28
Source: ECB SAFE Survey.
Figure 3 SMEs’ most pressing problems in Germany, Spain, France and Italy
5%
6%
7%
8%
9%
10%
11%
12%
13%
14%
Germany Spain France Italy Eurozone
HY2/2015HY1/2015
Source: ECB SAFE Survey.
Some positive signs have also been observed on the supply side of the SME bank lending market. According to the reporting banks in the ECB’s Bank Lending Survey, debt suppliers continued to ease credit standards applied to the approval of loans or credit lines for SMEs, but credit standards for loans to enterprises are still considered to be above their historical average (ECB, 2016b).

PART II Investment finance200
Investment and Investment Finance in Europe European Investment Bank
It appears that financial hurdles remain a greater concern to SMEs than to large firms. One potential reason for this structural weakness is that SMEs are more dependent on bank finance, such as loans and credit lines, than large firms, which can launch public offerings for debt and equity (OECD, 2014; ECB, 2013). During the crisis a combination of balance sheet concerns, increased risk aversion and higher credit risks in the SME business made banks reluctant to lend to SMEs (Kraemer-Eis, Lang and Gvetadze, 2013). Furthermore, the difficulty of securitising loans possibly contributed to this reluctance (Carbó-Valverde et al, 2012; Nassr and Wehinger, 2014). Hence SMEs, in particular unlisted companies, are more affected by changes in bank lending due to bank deleveraging than other firms.9
In this section we have described the current state of “traditional” SME finance in Europe.10 Access to finance is of greater concern to SMEs than to large enterprises, mainly because SMEs are highly dependent on bank financing. Apart from such structural difficulties, the financial crisis made it even harder for SMEs to access funds, and corporate demand for loans had been falling for several years. In addition, banks’ balance sheet and risk considerations had also led to more restrictive lending behaviour on the supply side. Although some improvements have been observed recently, these problems are still more pronounced in those countries that were most affected by the financial and sovereign debt crisis. It is therefore necessary to distinguish weaknesses in access to finance by country/region and to carefully analyse the particular situation.
5.1. SME loan guarantees and securitisation
5.3.1. SME loan guaranteesGuarantee mechanisms, “whereby should the borrower default the guarantor compensates a pre-defined share of the outstanding loan” (OECD, 2014, 2015), are a commonly used response to address the consequences of market failures in SME financing (see section 5.1 for a detailed description of the nature of these market failures), as guarantees reduce the risk of lenders and favour the provision of financing to viable businesses that are constrained in their access to finance. Credit guarantee schemes (CGSs) “are used widely across economies as important tools to ease financial constraints for SMEs and start-ups” (OECD, 2013), in order to alleviate market failures in SME financing. Moreover, loan guarantee programmes expanded substantially in the years 2007-2011, as governments responded to the financial crisis. Carefully designed guarantee schemes have positive macroeconomic effects, if the costs for taxpayers due to default payments are outweighed by the positive stimulating effects (such as on employment and tax revenue) of guarantees for the economy.
In addition, CGSs hold other advantages. First, the final lending decision stays with a market-based, private-sector entity – the bank – which has the expertise and the necessary technology to evaluate credit applications and projects. This is likely to ensure more efficient selection of borrowers than if the task is done by a public agency, since – given that the guarantee is partial – it leaves part of the risk with the privately operating lender. Second, compared to direct lending programmes, CGSs have much lower initial cash flow needs, and as such, have a leverage component. As a consequence, they can also be used when fiscal constraints are tight. However, the small initial cash outlay of credit guarantee schemes also has disadvantages. Honohan (2010) notes that, as a large number of borrowers can be reached with only relatively small initial costs in the short run, political incentives exist for the public sector to supply guarantees generously, while concealing the true long-term fiscal costs of a programme behind the uncertainty around the expected long-term losses on the guarantee portfolio. This can result in unexpected fiscal costs further down the road. Third, supranational CGSs can contribute to an efficient cross-border allocation of risk and credit. Results from a recent EIB survey on European CGSs (forthcoming) highlight that all existing CGSs choose to operate within the national borders of the country in which they are headquartered. This can be explained by the existence of cross-border information frictions related to national legal frameworks that govern the functioning of CGSs.
9 On bank deleveraging and risk-taking capacity, see section 4 of Chapter 4.10 Kraemer-Eis, Lang, Torfs and Gvetadze (2016) discuss the state of the SME financing market in greater detail and introduce a new SME financing indicator.

Investment finance PART II 201
European Investment Bank Investment and Investment Finance in Europe
Based on an analysis of the Multi-Annual Programme for enterprises and entrepreneurship (MAP) EU SME Guarantee Facility and focusing on Central, Eastern and South-Eastern Europe (CESEE) countries, Asdrubali and Signore (2015) find significant positive effects of this EU guarantee programme on the beneficiary firms. By breaking down the sample by country, signature year, size and age classes, the authors find that micro and young SMEs have benefited most from MAP-guaranteed loans in terms of economic additionality.
Market information concerning CGS in Europe is gathered by AECM, the European Association of Guarantee Institutions.11 Key figures for countries with at least one AECM member are presented in Table 1. In 2015, on average the guarantee activity of AECM members increased considerably compared to the year before. The total outstanding guarantee volume of AECM members grew by 2.2% to EUR 80.3bn. In terms of total amounts of guarantees outstanding, the core countries are Italy (EUR 33.6bn), France (EUR 16.7bn), Turkey (EUR 5.9bn), Germany (EUR 5.6bn) and Spain (EUR 4.1bn). Italy also has the highest total number of outstanding guarantees (1,058,747), followed by Turkey (759,848) and France (705,448). The total number of SME beneficiaries in the portfolios of the AECM members amounted to more than 2.7 million.
Compared to the value of economic activity, guarantees are relatively important (measured by the volume of outstanding guarantees in the portfolio as a percentage of GDP) in Italy (2.1%), Portugal (1.8%) and Hungary (1.4%), as shown in Figure 5. According to the OECD (2013), guarantees are particularly relevant “in those countries where a network of local or sectoral guarantee institutions is well established”.
11 We thank our colleagues from AECM for their support. AECM currently has 40 members in 21 EU Member States plus Bosnia and Herzegovina, Russia, Serbia and Turkey. In the AECM member countries, the AECM members cover all or almost all SME guarantee activity. Some AECM members are national associations or networks and thus have their own member organisations. AECM has purely private, mutual, public, and public-private mixed members.
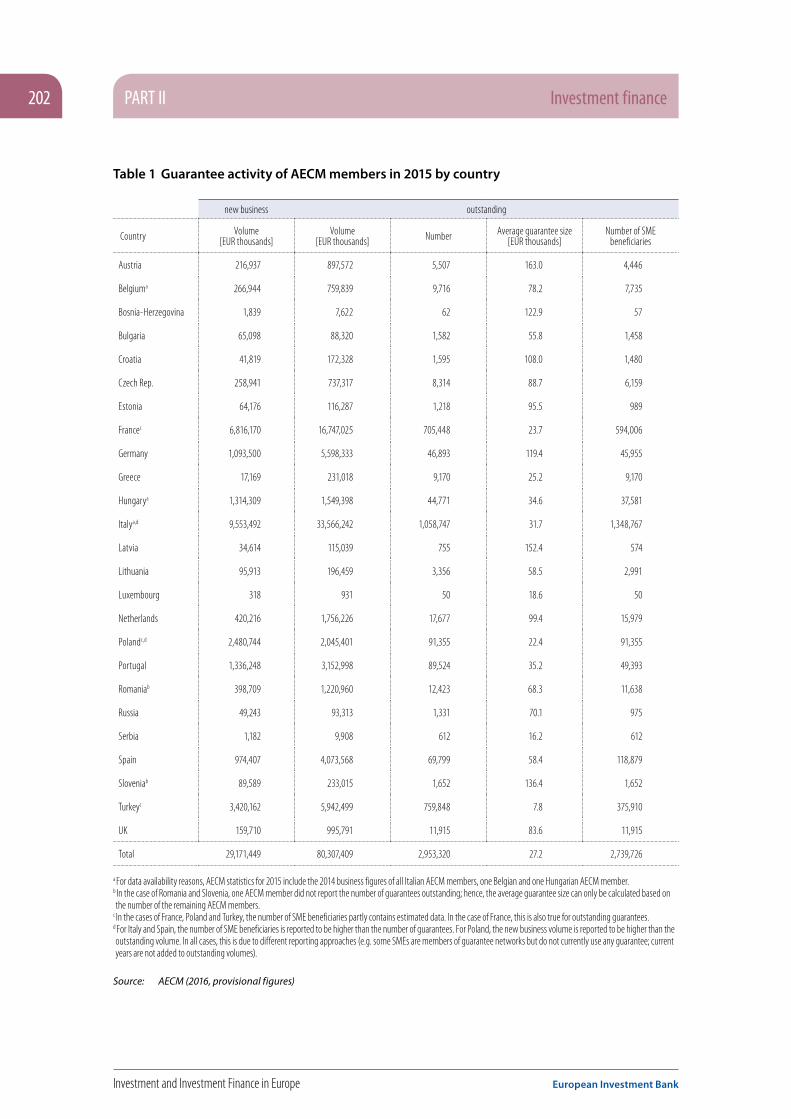
PART II Investment finance202
Investment and Investment Finance in Europe European Investment Bank
Table 1 Guarantee activity of AECM members in 2015 by country
new business outstanding
Country Volume [EUR thousands]
Volume [EUR thousands] Number Average guarantee size
[EUR thousands]Number of SME
beneficiaries
Austria 216,937 897,572 5,507 163.0 4,446
Belgiuma 266,944 759,839 9,716 78.2 7,735
Bosnia-Herzegovina 1,839 7,622 62 122.9 57
Bulgaria 65,098 88,320 1,582 55.8 1,458
Croatia 41,819 172,328 1,595 108.0 1,480
Czech Rep. 258,941 737,317 8,314 88.7 6,159
Estonia 64,176 116,287 1,218 95.5 989
Francec 6,816,170 16,747,025 705,448 23.7 594,006
Germany 1,093,500 5,598,333 46,893 119.4 45,955
Greece 17,169 231,018 9,170 25.2 9,170
Hungarya 1,314,309 1,549,398 44,771 34.6 37,581
Italya,d 9,553,492 33,566,242 1,058,747 31.7 1,348,767
Latvia 34,614 115,039 755 152.4 574
Lithuania 95,913 196,459 3,356 58.5 2,991
Luxembourg 318 931 50 18.6 50
Netherlands 420,216 1,756,226 17,677 99.4 15,979
Polandc,d 2,480,744 2,045,401 91,355 22.4 91,355
Portugal 1,336,248 3,152,998 89,524 35.2 49,393
Romaniab 398,709 1,220,960 12,423 68.3 11,638
Russia 49,243 93,313 1,331 70.1 975
Serbia 1,182 9,908 612 16.2 612
Spain 974,407 4,073,568 69,799 58.4 118,879
Sloveniab 89,589 233,015 1,652 136.4 1,652
Turkeyc 3,420,162 5,942,499 759,848 7.8 375,910
UK 159,710 995,791 11,915 83.6 11,915
Total 29,171,449 80,307,409 2,953,320 27.2 2,739,726
a For data availability reasons, AECM statistics for 2015 include the 2014 business figures of all Italian AECM members, one Belgian and one Hungarian AECM member.b In the case of Romania and Slovenia, one AECM member did not report the number of guarantees outstanding; hence, the average guarantee size can only be calculated based on the number of the remaining AECM members.
c In the cases of France, Poland and Turkey, the number of SME beneficiaries partly contains estimated data. In the case of France, this is also true for outstanding guarantees.d For Italy and Spain, the number of SME beneficiaries is reported to be higher than the number of guarantees. For Poland, the new business volume is reported to be higher than the outstanding volume. In all cases, this is due to different reporting approaches (e.g. some SMEs are members of guarantee networks but do not currently use any guarantee; current years are not added to outstanding volumes).
Source: AECM (2016, provisional figures)

Investment finance PART II 203
European Investment Bank Investment and Investment Finance in Europe
Figure 5 Volumes of outstanding guarantees in portfolio scaled by GDP, 2015 data
Luxe
mbo
urg
Russ
ia
Serb
ia UK
Bosn
ia-H.
Gree
ce
Germ
any
Belg
ium
Bulg
aria
Neth
erlan
ds
Austr
ia
Spain
Croa
tia
Czec
h Rp
Latv
ia
Polan
d
Lithu
ania
Esto
nia
Slove
nia
Rom
ania
Fran
ce
Turk
ey
Hung
ary
Portu
gal
Italy
0.0%
0.5%
1.0%
1.5%
2.0%
1.76
0.900.770.76
0.600.570.530.480.470.450.390.38
0.270.260.200.190.180.13
0.050.040.030.010.002
1.42
2.05
Sources: AECM (2016, provisional figures), IMF, own calculations.
5.3.2 SME loan securitisationEuropean companies, and in particular SMEs, rely heavily on bank lending: Figure 6 provides an indication based on IMF data. As outlined in more detail in Kraemer-Eis (2014), this ratio is moving towards more capital market action: Cour-Thimann and Winkler (2013) state that external financing (financing other than retained earnings) of the non-financial corporate sector is dominated by bank financing in the euro area. Moreover, banks in peripheral countries are facing the highest deleveraging pressure and these banks typically have large corporate and SME loan portfolios (IMF, 2012). Against this background, a well-functioning securitisation market could be a way to ease supply problems by helping banks to diversify their funding and achieve capital relief (see Kraemer-Eis, Passaris and Tappi (2013), IMF (2014a), or ECB and BoE (2014) for details).
Figure 6 Reliance on bank financing by non-financial corporations (in %)
United States
Greece
Austria
Italy
Portugal
France
GermanyBelgium
United Kingdom
Corporate loans (as % of outstanding debt)
2015 2011
Corp
orat
e len
ding (
as %
of to
tal b
ank a
sset
s)
Large domestic bank corp. loanbookLow reliance on loans for nonfin corp.
Large domestic bank corp. loanbookHigh reliance on loans for nonfin corp.
Small domestic bank corp. loanbookLow reliance on loans for nonfin corp.
Small domestic bank corp. loanbookHigh reliance on loans for nonfin corp.
0% 10% 20% 30% 40% 50% 60% 70% 80% 90% 100%0%
5%
10%
15%
20%
25%
30%
Source: Authors, based on IMF (2012) and updated information.

PART II Investment finance204
Investment and Investment Finance in Europe European Investment Bank
There are many advantages of SME securitisation (SMESec)12 – for banks, for investors, and – most importantly – for the SMEs (for a detailed discussion see Kraemer-Eis, Schaber and Tappi, 2010, Wehinger and Nassr, 2015, Bank of America/Merrill Lynch, 2015a, or Aiyar, Al-Eyd, Barkbu and Jobst, 2015). SMEs have only very limited access to capital markets and SMESec is an indirect way to provide capital market funding for SMEs (illiquid SME loans become tradable/collateralisable). Key to the understanding of the usefulness of securitisations for SMEs is the realisation that banks will not lend to SMEs based purely on macroeconomic development motives (i.e. supporting the economy). Banks will always make a complex calculation of the profitability of their SME lending business, especially relative to their other activities. Three areas, however, have an overriding impact on the profitability of SME lending and hence on the required loan margins for SMEs: refinancing spreads, risk costs and capital requirements. Therefore, from a lender/issuer perspective in particular, the following features of SMESec can have a positive impact on banks’ (SME) lending behaviour (for details see Kraemer-Eis, Schaber and Tappi, 2010); while keeping the business relationship with the SMEs and continuing to be an active SME lender the technique gives banks the possibility to:
• generate economic / regulatory capital relief;• use it as tool for Asset/Liability Management and portfolio management;• have an alternative source of funding (although currently less relevant).
On the one hand, many banks are reluctant to generate additional (SME-) risk on their balance sheets, deleverage, and reduce their balance sheet risks – with a negative impact on their SME lending. On the other hand, many non-bank investors (e.g. insurers, pension funds) are interested in investing in SME risk. They seek investment assets with maturities and returns that match their liability profiles and their needs for portfolio diversification (Mersch, 2014). SMESec can create a link between them – with advantages for SMEs and the financial system.
However, SMESec placed with investors currently represents only a tiny portion of total placed asset-backed securities (ABS) issuance. In 2015 only 5.7% of total SME issuance was placed in the primary market (see also Figure 7), with the bulk of SME ABS being retained for ECB refinancing purposes (Kraemer-Eis, Lang, Torfs, Gvetadze, 2016).
12 The term SME securitisation (SMESec) comprises transactions based on SME loans, leases, etc. It is important to look not only at banks/lending when analysing SMESec, but equally at leasing companies, which form part of the securitisation market. Given that bank financing is and will be less available for leasing companies post-crisis, it can be expected that SMESec will be particularly relevant in the leasing area. For more information on the importance of leasing for SME finance, see Kraemer-Eis and Lang (2014).

Investment finance PART II 205
European Investment Bank Investment and Investment Finance in Europe
Market activity13
The European securitisation market had grown steadily from the beginning of the previous decade until the outbreak of the crisis. During the crisis, issuance initially remained at high levels (compared to pre-crisis values) in Europe, but these volumes were almost exclusively driven by the eligibility of ABS as collateral for ECB liquidity operations;14 then the overall market activity decreased to the 2003/2004 levels, in particular due to regulatory uncertainties15 and tighter euro system collateral rules.
During the crisis, the large volumes of synthetic SMESec transactions that were evidenced pre-2007 on SME portfolios – dominated primarily by German SMEs on the back of KfW’s PROMISE programme – also virtually disappeared. Rating downgrades, based on revised rating agency criteria (i.e. counterparty and country ceiling criteria, without grandfathering), on downgrades of counterparties involved in the transactions, and on negative credit trends, contributed to the overall negative market sentiment.
Figure 7 European SMESec by retention (EUR bn and %)
SMESec retained (lhs)SMESec placed (lhs) Retained as % of total issued (rhs)
0
10
20
30
40
50
60
70
80
90
100
bn E
UR
2007 2008 2009 2010 2011 2012 2013 2014 2015
0%
10%
20%
30%
40%
50%
60%
70%
80%
90%
100%
46.8
69.9
96.399.6 98.0 97.8
86.1
94.9 94.3
Source: Authors, based on data from AFME.
The most active markets in Europe in 2015 in terms of overall securitisation issuance were the UK (market share: 21%), Germany (21%), Italy (15%), Spain (12%), the Netherlands (10%) and France (8%). The overall market activity in 2015 (EUR 214bn) was similar to 2014 (EUR 217bn). In 2016, so far (Q1), a volume of almost EUR 57bn has been issued, an increase of 61% compared to Q1/2015.
SMESec issuance is still suffering from the crisis. The overall issued volume of SME deals in 2015 (EUR 27bn) was well below the 2014 values (EUR 33bn, see Figure 8). This year, Q1 SME issuance was higher than in Q1/2015 (EUR 4.6bn compared to EUR 4.1bn). The market share of SMESec in overall securitisation issuance rose (with some volatility) from 6% in 2001 to 18% (of total yearly issuance) in 2012, the highest value ever registered in Europe. This, however, came about due to the base effect, as overall activity went down (while SMESec activity decreased slightly less). In 2015, the share of SMESec was 13%, slightly lower than the year before (15%); in Q1/2016 the share was only 8%.
13 Unless otherwise flagged, the data source is AFME, the Association for Financial Markets in Europe (AFME, 2014).14 The ECB’s asset repurchase or "repo" facility allows (among other assets) asset-backed securities to be used as collateral for funding.15 For details concerning the regulatory developments see e.g. AFME (2016).
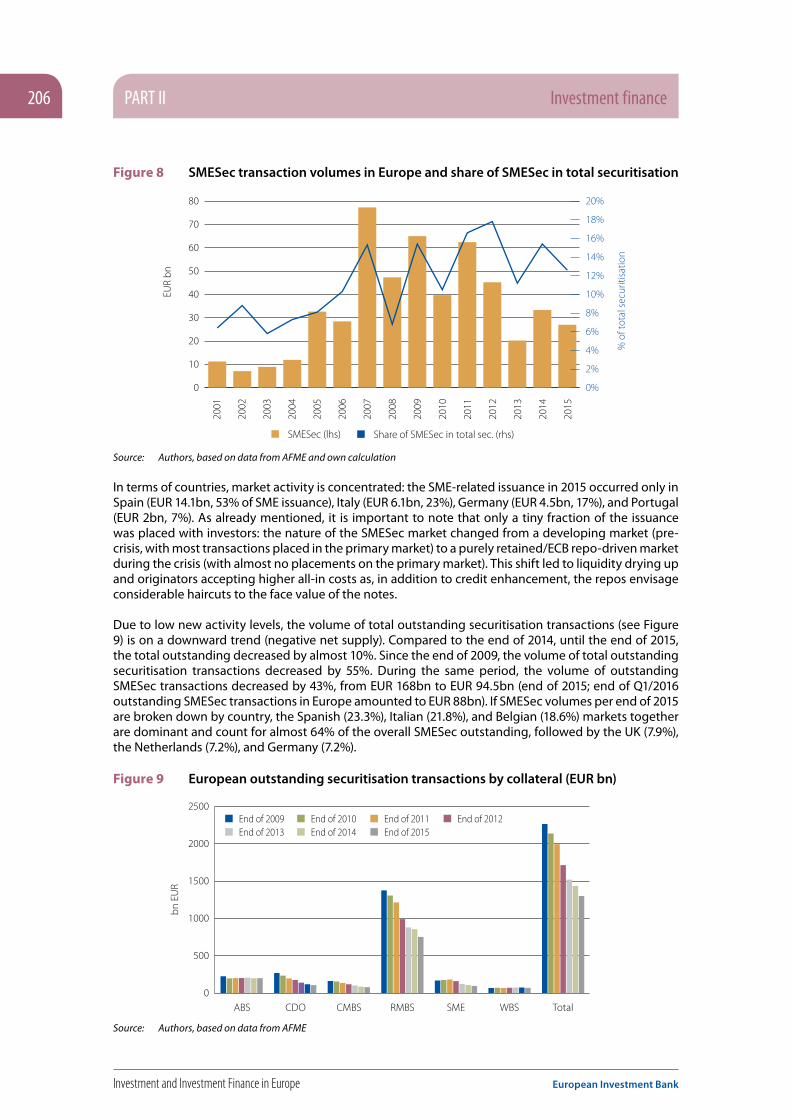
PART II Investment finance206
Investment and Investment Finance in Europe European Investment Bank
Figure 8 SMESec transaction volumes in Europe and share of SMESec in total securitisation
Share of SMESec in total sec. (rhs)SMESec (lhs)
0
10
20
30
40
50
60
70
8020
01
2002
2003
2004
2005
2006
2007
2008
2009
2010
2011
2012
2013
2014
2015
% o
f tot
al s
ecur
itisa
tion
EUR
bn
0%
2%
4%
6%
8%
10%
12%
14%
16%
18%
20%
Source: Authors, based on data from AFME and own calculation
In terms of countries, market activity is concentrated: the SME-related issuance in 2015 occurred only in Spain (EUR 14.1bn, 53% of SME issuance), Italy (EUR 6.1bn, 23%), Germany (EUR 4.5bn, 17%), and Portugal (EUR 2bn, 7%). As already mentioned, it is important to note that only a tiny fraction of the issuance was placed with investors: the nature of the SMESec market changed from a developing market (pre-crisis, with most transactions placed in the primary market) to a purely retained/ECB repo-driven market during the crisis (with almost no placements on the primary market). This shift led to liquidity drying up and originators accepting higher all-in costs as, in addition to credit enhancement, the repos envisage considerable haircuts to the face value of the notes.
Due to low new activity levels, the volume of total outstanding securitisation transactions (see Figure 9) is on a downward trend (negative net supply). Compared to the end of 2014, until the end of 2015, the total outstanding decreased by almost 10%. Since the end of 2009, the volume of total outstanding securitisation transactions decreased by 55%. During the same period, the volume of outstanding SMESec transactions decreased by 43%, from EUR 168bn to EUR 94.5bn (end of 2015; end of Q1/2016 outstanding SMESec transactions in Europe amounted to EUR 88bn). If SMESec volumes per end of 2015 are broken down by country, the Spanish (23.3%), Italian (21.8%), and Belgian (18.6%) markets together are dominant and count for almost 64% of the overall SMESec outstanding, followed by the UK (7.9%), the Netherlands (7.2%), and Germany (7.2%).
Figure 9 European outstanding securitisation transactions by collateral (EUR bn)
End of 2009 End of 2012End of 2013 End of 2014 End of 2015
End of 2011End of 2010
0
500
1000
1500
2000
2500
ABS CDO CMBS RMBS SME WBS
bn E
UR
Total Source: Authors, based on data from AFME

Investment finance PART II 207
European Investment Bank Investment and Investment Finance in Europe
Prospects
In general, a well-functioning securitisation market can be essential in helping financial intermediaries broaden their funding base, achieve capital relief and ultimately increase their SME financing. Strengthening the SME securitisation market can be an effective way to facilitate the flow of funds to the real economy, while not creating too much distortion. In this respect, public initiatives that support SMESec may be helpful – though of course, in doing this, the introduction of new risks should be avoided (for instance, securitisation transactions have to be transparent and have standardised structures; in addition, originators have to have sufficient skin in the game to avoid moral hazard (Kaya, 2014)).
Overall, the SMESec market in Europe is still underdeveloped (AFME and BCG, 2015). The benefits arising from originators tapping the securitisation market can feed through to have a positive effect on SMEs’ access to finance and hence on the SMEs themselves, especially as a result of a targeted intervention aimed specifically at this goal. The recovery and development of the primary securitisation markets could play a role in unlocking credit supply and economic recovery. However, this will only be to the benefit of SMEs if the freed-up capital/fresh liquidity is going to be used to finance the real economy (i.e. for new SME lending).
In November 2014, the ECB started its Asset-Backed Securities Purchase Programme (ABSPP). The overall objective is to enhance the transmission of monetary policy, support the provision of credit to the euro area economy and, as a result, provide further monetary policy accommodation. The ECB’s support for the ABS market in general, and the SMESec market in particular, is a positive step. However, the programme has so far not achieved significant volumes; as it is based on publicly placed transactions, moreover, there is almost no direct impact on the SME segment of the market. As per end-April 2016, EUR 19.043bn had been bought by the ECB (mainly in the secondary market), compared to around EUR 172.253bn under the Covered Bond Purchase Programme (source: ECB16).
As described above, even seven years after the start of the financial crisis, European SMESec has still not recovered. Unbalanced regulation is still to be seen as the main impediment (see Kraemer-Eis, Passaris, Tappi and Inglisa, 2015). Most individual proposed regulations make sense on a stand-alone basis, but negative spill-overs from a non-holistic approach lead to unintended consequences that hinder market development. For instance, the newly proposed Capital Requirements Regulation’s (CRR) Article 270 provides certain regulatory capital advantages to the originators in the context of synthetic transactions executed with a multi-lateral development bank; however, such an advantage is not achievable if a private investor also enters into the transaction, which is a non-desirable outcome.
Originators and investors need to have certainty and clarity. Short and medium-term reasonably defined criteria for high quality securitisations (HQS – including SMESec) – which should consist of structures that are simple, transparent and efficient and which should receive preferential regulatory treatment – could be a way out of this dilemma.17 However, it also has to be borne in mind that the proposed risk weights for HQS will still result in increased capital requirements for internal ratings-based (IRB) banks compared to today. Moreover, another perspective regarding HQS – mentioned by some market participants – is that they can even prevent a proper securitisation market recovery if “everything but HQS” is still seen as being toxic. New securitisation regulation can only be expected towards the end of 2017 at the earliest, and the first “quality-labelled” transactions will not happen before 2018.
The regulators’ views regarding the future regulation design are now on the table and under discussion – which is good in order to reduce the respective uncertainty. The approach likely to be steering the
16 https://www.ecb.europa.eu/mopo/implement/omt/html/index.en.html. On 10 September 2015, the ECB clarified its intention to buy mezzanine tranches of European ABS with an eligible third party guarantee. However, the ECB’s requirement of a guarantee on demand (“The guarantee shall be payable on first demand independently of the guaranteed marketable asset or credit claim”) leads, for guarantors, to a gap between their payment obligation to the ECB (on demand) and the receipt of payment from the mezzanine ABS tranches. This feature limits the number of potential guarantors significantly since a wrap of this sort would not be a market standard. To our knowledge there have so far been no transactions of this kind.
17 We use HQS as a term here – in the current discussions, other terminologies are also used in the same context, e.g. STS (simple, transparent, and standardised) securitisation, used e.g. by the ECB, or STC (simple, transparent and comparable) securitisation, used by BCBS-IOSCO, or SST (simple, standard and transparent) securitisation, used by the European Banking Authority. September’s proposed regulation published by the European Commission suggests that the STS acronym will prevail in European regulation.
PART II Investment finance208
Investment and Investment Finance in Europe European Investment Bank
forthcoming regulation suggests a “light” set of high quality criteria, which in turn translates into a marginal (rather than substantial) reduction in the risk weights.18 Concerning the forthcoming Capital Requirements Regulation, more could be achieved in terms of both increasing the breadth of the market for synthetic transactions19 and reducing the overall reliance on rating agencies, especially with a view to establishing a level playing field among different asset classes and funding instruments.
5.4. Microfinance“Microcredit is generally recognised […] as an effective financing channel for job creation and social inclusion, which can attenuate the adverse effects of the current financial crisis while contributing to entrepreneurship and economic growth in the EU” (European Commission, 2012). In Europe, microfinance consists mainly of microloans (less than EUR 25,000) tailored to microenterprises and people who would like to become self-employed but are facing difficulties in accessing traditional banking services.
Microenterprises, making up 93% of all European businesses, are important contributors to employment. Micro-businesses seem to be relatively more important in countries with high unemployment levels: in Spain, Portugal and Italy employment by microenterprises accounts for more than 40% of total employment and in Greece this figure rises to almost 60%.
The European microfinance market is highly fragmented and diverse, characterised by a wide spectrum of final beneficiaries and financial intermediaries. Part of this fragmentation is geographically rooted, as the role of microfinance is seen very differently across Europe. In Western Europe, microfinance is considered to be a social policy tool, as it serves businesses that are not commercially attractive to the mainstream finance providers, but nevertheless are able to create social value. In Eastern Europe on the other hand, microfinance is seen more as a business activity, which targets viable microenterprises that are financially excluded because the traditional credit market remains underdeveloped (Kraemer-Eis and Conforti, 2009; Bruhn-Leon, Eriksson and Kraemer-Eis, 2012).
Microfinance is an essential tool to facilitate necessity-driven business creation, which arises when a combination of poor labour market prospects and poverty drives people to start new businesses. In 2015, the highest necessity-driven entrepreneurial rates were recorded in Eastern Europe. For example, in Croatia, Bulgaria and Slovenia a third of entrepreneurs started their business because they had no better options in the labour market (GEM, 2016).
While microenterprises are an important element of the European economic fabric, they generally face more challenging conditions compared to their larger counterparts. For the first half of 2016, 4.9% of microenterprises are on balance expecting a positive change in their overall situation, thereby being significantly less optimistic than their larger counterparts (11.0% for small and 15.2% for medium-sized enterprises). This is reflected in the fact that they expect their investment climate to worsen (UEAPME, 2016). The ECB survey on the access to finance of enterprises (SAFE) in the euro area (ECB, 2016a) provides additional insights regarding the financing situation of European microenterprises. According to the latest SAFE survey, the proportion of microenterprises reporting “access to finance” to be their most important problem consistently exceeds the proportion of bigger SMEs, a discrepancy that grew larger over the last three semesters.
Difficult access to finance, in particular bank loans, might be the key reason why microenterprises in Europe use bank loans and other external financing sources considerably less than other SME size classes. Figure 10 shows that the use of different financing sources on average typically increases with the size of the SME (ECB, 2016a). Among the reasons why bank loans are less relevant for microenterprises, insufficient collateral or guarantees was reported, as well as high interest rates or prices. Bank loan
18 See also in this context the Working Document by Rapporteur Tang for the European Parliament, Committee on Economic and Monetary Affairs (European Parliament, 2016).
19 See Kraemer-Eis, Lang, Torfs, Gvetadze (2016) for more information about “synthetics“.
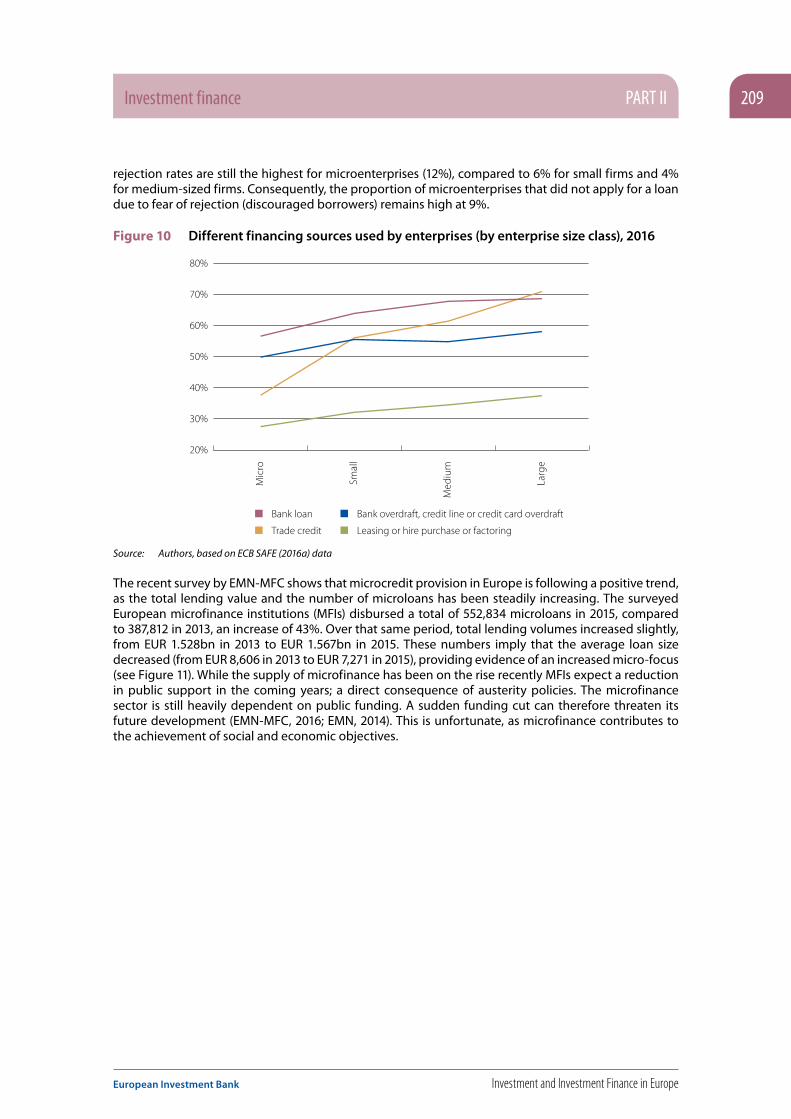
Investment finance PART II 209
European Investment Bank Investment and Investment Finance in Europe
rejection rates are still the highest for microenterprises (12%), compared to 6% for small firms and 4% for medium-sized firms. Consequently, the proportion of microenterprises that did not apply for a loan due to fear of rejection (discouraged borrowers) remains high at 9%.
Figure 10 Different financing sources used by enterprises (by enterprise size class), 2016
Mic
ro
Smal
l
Med
ium
Larg
e
20%
30%
40%
50%
60%
70%
80%
Bank overdraft, credit line or credit card overdraft
Leasing or hire purchase or factoring
Bank loan
Trade credit
Source: Authors, based on ECB SAFE (2016a) data
The recent survey by EMN-MFC shows that microcredit provision in Europe is following a positive trend, as the total lending value and the number of microloans has been steadily increasing. The surveyed European microfinance institutions (MFIs) disbursed a total of 552,834 microloans in 2015, compared to 387,812 in 2013, an increase of 43%. Over that same period, total lending volumes increased slightly, from EUR 1.528bn in 2013 to EUR 1.567bn in 2015. These numbers imply that the average loan size decreased (from EUR 8,606 in 2013 to EUR 7,271 in 2015), providing evidence of an increased micro-focus (see Figure 11). While the supply of microfinance has been on the rise recently MFIs expect a reduction in public support in the coming years; a direct consequence of austerity policies. The microfinance sector is still heavily dependent on public funding. A sudden funding cut can therefore threaten its future development (EMN-MFC, 2016; EMN, 2014). This is unfortunate, as microfinance contributes to the achievement of social and economic objectives.

PART II Investment finance210
Investment and Investment Finance in Europe European Investment Bank
Figure 11 Evolution of microfinance in Europe
0
200
400
600
800
1,000
1,200
1,400
1,600
1,800
Value of microloan, EUR m Number of microloans
0
100,000
200,000
300,000
400,000
500,000
600,000
Source: Authors, based on data from EMN-MFC (2016)
Microenterprises in general, and workers from vulnerable labour market segments that cherish entrepreneurial ambitions in particular, still face significant difficulties in accessing financial resources from traditional credit channels. Disadvantaged groups, such as the long-term unemployed, or workers with a migrant background, lack the necessary collateral to secure loans from traditional loan providers (see Kraemer-Eis, Lang, Torfs and Gvetadze, 2016, for more information). In this environment of selective credit allocation, lending might be allocated away from small, young and opaque firms as they are perceived to be more risky than their larger peers and have smaller financing needs which are difficult for mainstream funding providers to cover in a cost-efficient manner. In addition to the financial support, unemployed people are often in need of acquiring the necessary skills for success through coaching and mentoring. Microfinance can be an important tool to overcome the effects of the crisis for some specific groups and in particular to support inclusive growth.
5.5. Private equity and venture capitalFollowing the severe crash of European private equity (PE) investment in 2008/2009, it had partially rebounded over 2010-2011. Following a setback in 2012, the recovery continued in 2013 and 2014, albeit at lower levels. In 2015, investments by PE funds located in Europe increased by 13%, compared to the year before, to EUR 47.4bn, according to Invest Europe data (see Figure 12). In contrast, the number of companies financed decreased by 10% to 5,171 in 2015.

Investment finance PART II 211
European Investment Bank Investment and Investment Finance in Europe
Figure 12 Investment activity by private equity firms located in Europe
Investments Number of companies financed
0
10
20
30
40
50
60
70
80
90
10020
00
2001
2002
2003
2004
2005
2006
2007
*
2008
2009
2010
2011
2012
2013
2014
2015
35.0
24.327.6 29.1
36.9
47.1
54.6
25.0
43.347.0
37.7 38.141.9
47.4
10,440
8,104
8,351
7,446 6,985 7,210
5,340
5,828
4,975
5,255 5,168 5,267 5,171
5,7685,327
71.2 72.9
7,536
0
2,000
4,000
6,000
8,000
10,000
EUR
bn
Source: Authors, based on Invest Europe data. Notes: Invest Europe PE statistics do not include infrastructure funds, real estate funds, distressed debt funds, primary funds of
funds, secondary funds of funds or PE/VC-type activities not conducted by PE funds. Furthermore, activities of business angels and hedge funds as well as corporate acquisitions outside of dedicated corporate venture programmes are not included in the statistics. Invest Europe statistics can differ from the numbers reported by other data providers for the reasons just mentioned and due to, e.g. differences in methodology, definitions and interpretations of the PE fund and investment stages and geographical definitions (e.g. of “Europe”). Investment figures are equity value, i.e. excluding leverage. See also for more details: Invest Europe (2016), the Invest Europe website (www.investeurope.eu) and Kraemer-Eis, Lang, Torfs and Gvetadze (2016).
In terms of amounts invested, strong positive growth rates were recorded in the buyout (+15% to EUR 36.5bn) and growth capital (+11% to EUR 6.1bn) segments of the PE market. Venture Capital (VC) investments increased by 11% to EUR 4.0bn.20 Within the VC market segment, investments with a focus on the start-up (+9% to EUR 2.1bn) and later stage (+11% to EUR 1.8bn) increased, but the relatively tiny sector of seed investments also recorded a strong upswing (+26% to EUR 0.13bn); (see Figure 13). Life sciences, computer/consumer electronics and communications have remained the most relevant industries for VC investment since 2007 (Kraemer-Eis, Lang, Torfs and Gvetadze, 2016).
20 Venture capital is a type of private equity typically invested in entrepreneurial, innovative businesses to help them grow. It focuses on non-mature companies. Three VC stages can be distinguished: seed, start-up and later-stage venture. Crucially, as well as funding, venture capitalists offer tailored support for companies, from refining strategy and helping commercialise innovation through to new product and service development and bringing businesses onto the global circuit. (Source: http://www.investeurope.eu/about-private-equity/vc-for-entrepreneurs/).
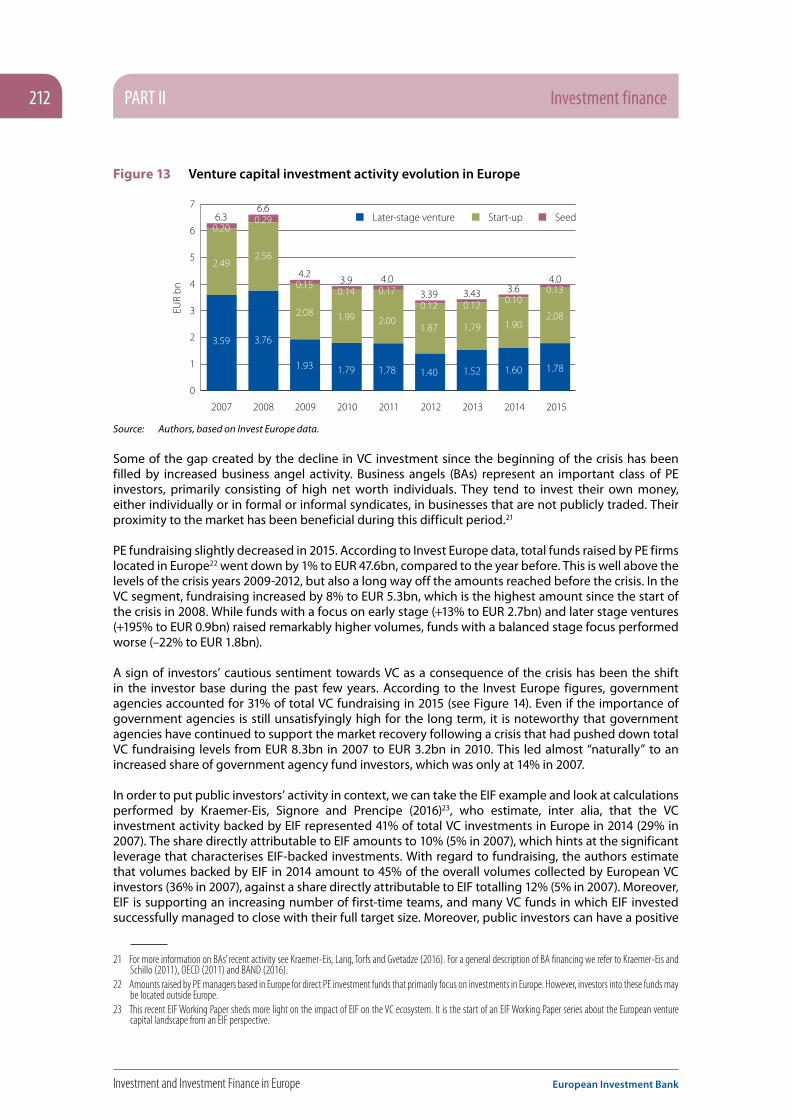
PART II Investment finance212
Investment and Investment Finance in Europe European Investment Bank
Figure 13 Venture capital investment activity evolution in Europe
0
1
2
3
4
5
6
7Later-stage venture Start-up Seed
3.59 3.76
1.93 1.79 1.78 1.40 1.52 1.60 1.78
2.49 2.56
2.08 1.99 2.00 1.87 1.79 1.90
2.08
0.20 0.29
0.15 0.14 0.17
0.12 0.12 0.10 0.13
6.3 6.6
4.2 3.9
2007 2008 2009 2010 2011 2012 2013 2014 2015
4.0
3.39 3.43 3.6 4.0
EUR
bn
Source: Authors, based on Invest Europe data.
Some of the gap created by the decline in VC investment since the beginning of the crisis has been filled by increased business angel activity. Business angels (BAs) represent an important class of PE investors, primarily consisting of high net worth individuals. They tend to invest their own money, either individually or in formal or informal syndicates, in businesses that are not publicly traded. Their proximity to the market has been beneficial during this difficult period.21
PE fundraising slightly decreased in 2015. According to Invest Europe data, total funds raised by PE firms located in Europe22 went down by 1% to EUR 47.6bn, compared to the year before. This is well above the levels of the crisis years 2009-2012, but also a long way off the amounts reached before the crisis. In the VC segment, fundraising increased by 8% to EUR 5.3bn, which is the highest amount since the start of the crisis in 2008. While funds with a focus on early stage (+13% to EUR 2.7bn) and later stage ventures (+195% to EUR 0.9bn) raised remarkably higher volumes, funds with a balanced stage focus performed worse (–22% to EUR 1.8bn).
A sign of investors’ cautious sentiment towards VC as a consequence of the crisis has been the shift in the investor base during the past few years. According to the Invest Europe figures, government agencies accounted for 31% of total VC fundraising in 2015 (see Figure 14). Even if the importance of government agencies is still unsatisfyingly high for the long term, it is noteworthy that government agencies have continued to support the market recovery following a crisis that had pushed down total VC fundraising levels from EUR 8.3bn in 2007 to EUR 3.2bn in 2010. This led almost “naturally” to an increased share of government agency fund investors, which was only at 14% in 2007.
In order to put public investors’ activity in context, we can take the EIF example and look at calculations performed by Kraemer-Eis, Signore and Prencipe (2016)23, who estimate, inter alia, that the VC investment activity backed by EIF represented 41% of total VC investments in Europe in 2014 (29% in 2007). The share directly attributable to EIF amounts to 10% (5% in 2007), which hints at the significant leverage that characterises EIF-backed investments. With regard to fundraising, the authors estimate that volumes backed by EIF in 2014 amount to 45% of the overall volumes collected by European VC investors (36% in 2007), against a share directly attributable to EIF totalling 12% (5% in 2007). Moreover, EIF is supporting an increasing number of first-time teams, and many VC funds in which EIF invested successfully managed to close with their full target size. Moreover, public investors can have a positive
21 For more information on BAs’ recent activity see Kraemer-Eis, Lang, Torfs and Gvetadze (2016). For a general description of BA financing we refer to Kraemer-Eis and Schillo (2011), OECD (2011) and BAND (2016).
22 Amounts raised by PE managers based in Europe for direct PE investment funds that primarily focus on investments in Europe. However, investors into these funds may be located outside Europe.
23 This recent EIF Working Paper sheds more light on the impact of EIF on the VC ecosystem. It is the start of an EIF Working Paper series about the European venture capital landscape from an EIF perspective.

Investment finance PART II 213
European Investment Bank Investment and Investment Finance in Europe
signalling effect, which crowds in investors, rather than a crowding-out effect. This view was confirmed in an Unquote Intelligence (2014) survey among General Partners (GPs) and Limited Partners (LPs), which found that “the overriding benefit of [public funding bodies’] (PFB) money is the crucial role it plays in attracting other investors”. Moreover, “[h]aving PFB money in a fund does not deter other LPs from committing”.
Figure 14 Investor base: share of government agencies in VC fundraising24
0%
5%
10%
15%
20%
25%
30%
35%
40%
45%
0
2
4
6
8
10
2007
2008
2009
2010
2011
2012
2013
2014
2015
2007
2008
2009
2010
2011
2012
2013
2014
2015
■ Government agencies ■ Family offices & private individuals
■ Classified ■ Unclassified
■ Corporate investors ■ Insurance companies ■ Banks
■ Pension funds ■ Fund of funds & other asset managers ■ Academic inst./endowments/foundations ■ Capital markets ■ Sovereign wealth funds
New funds raised (excluding capital gains)
EUR b
n
8.15
6.21
3.63 3.21
5.17
3.86 4.61 4.95 5.33
Source: Based on data from EVCA.
The exit markets remained remarkably strong in 2015. In the previous two years, Invest Europe statistics had already recorded the highest PE divestment amounts ever. In 2015, total divestments by PE firms located in Europe registered another increase, i.e. by 3% to EUR 41.0bn.25 Moreover, the relative importance of write-offs has continuously decreased since 2010 (except for a slight increase in 2013). Trade sales and sales to another PE house together account for more than half of the total PE divestment amounts. In the VC market segment, divestments have increased as well, amounting to EUR 2.1bn in 2015; the relative importance of write-offs decreased only slightly, while trade sales and sales to a financial institution increased.
Looking forward, the favourable developments in the PE market might become more strongly countered by risks related to the current economic and monetary environment. According to a recent Preqin survey (Preqin, 2016), pricing/valuations of investment targets were by far perceived as the biggest challenge investors were facing. While 70% of fund investors across the globe raised this concern, performance and deal flow were mentioned by 40% and 34% respectively; regulation is still among investors’ concerns, albeit at a lower rank than before. All this is quite a remarkable change from the situation two years ago, when regulation, performance and the economic environment had been Limited Partners’ key concerns (Preqin, 2014). Warnings of possible overheating have been voiced for some time (e.g. Go4Venture Advisers, 2015), because of the strongly expansive monetary policy stance that has led to ample global liquidity and low interest rates. In line with this, fundraising, liquidity and availability/pricing of debt financing are to be found only towards the lower end of the ranking of investors’ biggest challenges (Preqin, 2016b). Another key issue is the possibly longer period of uncertainty about the timing and nature of the UK’s departure from the EU, following the Brexit vote on 23 June, which might have negative implications for the PE industry, investors and (potential) investee companies.
24 Based on incremental amounts raised during the year (in contrast to final closings only).25 Invest Europe statistics show divestment amounts at cost, i.e. the total amount divested is shown as the total amount that had been previously invested, hence not
including any profit on the investment.
PART II Investment finance214
Investment and Investment Finance in Europe European Investment Bank
Moreover, the economic developments over the last few years have resulted in significant structural changes in the global and European economic landscape. The digitalisation of the economy has led to a differentiation of market segments. On the one hand, companies in research-intensive sectors continue to follow more traditional growth models with capital-intensive development stages at the beginning of their life. On the other, companies in the digital space are able to start their activities with very limited resources but are exposed to unprecedented needs for funding in the internationalisation and globalisation of their business models. As a result, and depending on the sector and the business models of the companies, time spans from start-up to global leader have shortened considerably and require companies to scale quickly to withstand the risk of seeing their business model being out-dated before they capture a significant market share.
On a global level, the VC market has adapted to this new diversity of its target sectors. This has led to a split in the market between sometimes relatively small funds aimed at scouting emerging business models and a new class of giant VC funds that has expanded globally from the US, providing large-scale capital to businesses in their global market expansion. In the large-scale technology growth capital space Europe has no established players, which explains why virtually every European funding round, especially in digital technology growth capital, has been led by US VC growth capital funds. However, a number of growth stage VC funds have successfully completed their fundraising recently and hence, going forward aim to play the lead role in funding rounds of, for example, digital economy companies in Europe on their way to becoming global category leaders.
In the shadow of companies driving or directly affected by the “digital revolution”, SMEs and mid-caps in traditional industries are reshaping their strategies for competing in a rapidly changing economic environment and are in need of flexible funding instruments with growth equity, mezzanine debt and hybrid debt to classical debt features. Moreover, recent EIF market insight showed that growth-stage companies are experiencing a serious lack of growth (follow-on) funding in order to accelerate their international expansion and to strengthen their position vis-à-vis global competitors.
All of these challenges continue to create access-to-funding problems in the European VC market. The difficulties for young innovative companies to access seed and early stage finance increased during the crisis, as VCs became more risk-averse and focused more on later stage investments (Wilson, 2015). In line with this argument, a Coller Capital (2013) study found that more than half of the global LPs believe that there are insufficient sources, other than VC, available to finance innovation and growth in Europe. This supports the view that public backing is needed in order to strengthen the market. In Kraemer-Eis, Lang, Torfs and Gvetadze (2016), we provided a detailed description of the items that need to be considered when shaping a successful policy approach to support innovative companies’ access to PE/VC. A statement summarising this discussion is that Europe needs an integrated portfolio of funding instruments in support of the various segments of its start-up, SME and mid-cap landscape to foster the recovery from the 2008 financial crisis and to unleash the full potential of EU companies’ competitiveness and their contribution to Europe’s economic growth and innovation. Instruments should be complementary to existing initiatives in terms of sector, stage or geographic focus. However, the dynamics of recent economic developments – e.g. in the area of the digital economy – have made the segmentation between early stage and late stage VC somewhat redundant. Policy instruments that create artificial boundaries in the development stages of businesses could be prohibitive to an efficient VC market. Moreover, the EU’s VC markets show different development stages and so require different policy instruments. In less developed markets instruments may need to work strongly together with the actors in the informal VC markets (BAs, Incubators, TT Centres) and be complemented by flexible co-investment products to grow the domestic VC market. However, companies with global ambitions compete globally. Instruments investing in future industry leaders compete for investors who seek exposure to the best companies on a global scale, not with respect to a given geography. Therefore, providing flexibility in the geographic boundaries of policy instruments is not only key to retaining EU-based businesses in Europe but may attract non-EU based businesses to relocate to Europe. Based on these considerations, it appears vital to offer a flexibility of instruments adapted to diverse market conditions in the various geographies of the EU. This should be implementable in a time and cost efficient manner. Moreover, in times of economic slowdown and scarcity of private capital the temptation grows to construct policy instruments that substitute for the private sector. However, there is in fact a need to use public sector resources with the primary objective of mobilising private sector capital,

Investment finance PART II 215
European Investment Bank Investment and Investment Finance in Europe
as clearly demonstrated by several current initiatives on a European level (see Kraemer-Eis, Lang, Torfs and Gvetadze, 2016, for more details).
5.6. Concluding remarksThe general economic and financial situation improved noticeably over the past two years, which also led to a more favourable business environment for SMEs. However, looking ahead, the economic outlook is blurred, among other things, by the difficult growth perspectives of Europe’s main trading partners, unsolved risks in the banking market and heightened geopolitical tensions. Moreover, the already high level of political uncertainty is now magnified by the expressed will of the British people to leave the EU. It can be expected that the decision will have negative consequences for the economic recovery process. The increased policy uncertainty will also weigh on SMEs’ investment decisions.
Since 2012, access to finance has become, on average, a less important problem for European SMEs. However, a significant proportion of small businesses still experience barriers in access to finance and this proportion varies strongly from country to country. According to available information, corporate demand for loans has further improved, while average credit standards continued to ease, implying less restrictive lending behaviour on the supply side. Nevertheless, access to credit has remained more difficult in those countries that were most affected by the financial, debt and economic crisis.
There are instruments that can add to (or sometimes even replace) traditional bank lending, thereby alleviating SMEs’ difficulties in obtaining access to finance, including loan guarantees, loan securitisation, microfinance and private equity/venture capital. All these instruments can improve SMEs’ access to funds. However, while equity instruments typically reach a sizeable but limited share of SMEs, guarantees and securitisation focus on the more “traditional” debt instruments that are important for the majority of SMEs. Microfinance typically targets microenterprises and small companies. Despite their importance in broadening the financing base of SMEs, these instruments have also been affected by the financial crisis to different extents.
As outlined above, there are market imperfections as well as cyclical difficulties for SME finance, and these are serious enough to warrant intervention. SMEs need a balance of equity and debt finance, and this balance shifts across the SME life cycle. Hence, public support for SME financing has to consider the whole range of financial products needed throughout the various development stages of SMEs.
As we described in greater detail in the 2013 EIB Annual Economics Conference publication (see Kraemer-Eis, Lang and Gvetadze, 2013), “this intervention to mitigate the ‘bottlenecks’ must be conditional upon ensuring ‘additionality’, i.e. not crowding out private activities, but rather serving as a catalyst for the entry of private capital in order to create self-sustainable markets in the long run.”
In the field of debt instruments, such targeted policy intervention could be implemented with a wider use of risk-sharing tools, such as, for example, the instruments implemented by EIF, in order to generate a leverage effect in terms of the SME lending (or leasing) volume. We have also shown that public support can contribute to the re-emergence of the primary European SME securitisation market, which could be an important factor in enhancing access to finance for SMEs in Europe. In this context not only the volumes of the intervention matter, but also the positive signalling effect triggered by the public involvement and support. However, this will only benefit SMEs if the freed-up capital/fresh liquidity is going to be used by the banks to finance the real economy (i.e. for new SME lending) and not for regulatory arbitrage, for instance. Moreover, investors will only return in volume if they regain trust in the quality of the transactions and if there is satisfactory secondary market liquidity. Originators will return if transactions are economically feasible. For both, a stable and reliable regulatory framework is also a key precondition. Hence, a recovery of the European structured finance market will depend not only on the development of market fundamentals and the enhancement of investors’ confidence but also to a large extent on the direct and indirect impact of regulatory priorities. For loans to SMEs, a standardised, highly transparent and quality-controlled securitisation market could transform these illiquid loans into an asset class with adequate market liquidity.

PART II Investment finance216
Investment and Investment Finance in Europe European Investment Bank
The private equity market has recently shown signs of improvement. However, activity levels are still very low when compared to pre-crisis levels, in particular in the venture capital segment. Public support for this market is still needed and public actors should continue to play their role in supporting the market recovery and catalysing private investment. The long-term objective of this support is to establish a well-functioning, liquid equity market that attracts a wide range of private sector investors. Moreover, alternative investor categories should be incentivised to invest in European VC.
Microfinance can play an important role in overcoming the effects of the crisis for some specific groups and in particular in supporting inclusive growth. However, the outlook for the sector in terms of growth and self-sufficiency are limited if microfinance providers do not have access to stable funding. Against the background of the current difficult environment, support at European level has become even more important – via funding, guarantees and technical assistance for a broad range of financial intermediaries, from small non-bank financial institutions to well-established microfinance banks – in order to make microfinance a fully-fledged segment of the European financial sector.
The financing landscape for SMEs is changing. Although banks continue to be the main external financing sources for SMEs, alternative financing instruments, which are often but not exclusively driven by Fintechs, are gaining importance (including crowdfunding, debt funds, etc.). Given their increasing role in the financing landscape, these market players might become increasingly relevant as financial intermediaries to enhance access to finance for SMEs. These market developments are in line with the spirit of the European Commission’s plan to establish a Capital Markets Union (CMU) and to diversify the financing possibilities for SMEs. The CMU is an important part of the Investment Plan for Europe (IPE), which aims to revive investment across the EU.26
26 See Kraemer-Eis, Lang, Torfs and Gvetadze (2016) for a description of the CMU, the IPE and the role of the EIB and EIF in these initiatives.

Investment finance PART II 217
European Investment Bank Investment and Investment Finance in Europe
ReferencesAFME (2016). Securitisation data report Q4/2015 (and earlier reports). http://www.afme.eu/Documents/Statistics-and-reports.aspx
Aiyar, S., Al-Eyd, A., Barkbu, B., and Jobst, A. (2015). Revitalizing Securitization for Small and Medium-Sized Enterprises in Europe. IMF Staff Discussion Note SDN/15/07, May 2015. http://www.imf.org/external/pubs/cat/longres.aspx?sk=42859
Akerlof, G. A. (1970). “The Market for ‘Lemons’: Quality Uncertainty and the Market Mechanism”, in Quarterly Journal of Economics, Vol. 84, No. 3, pp. 488–500.
Anginer, D., De la Torre, A., and Ize, A. (2014). Risk-bearing by the state: When is it good public policy?. Journal of Financial Stability, 10, 76-86.
Arping, S., Lóránth, G., and Morrison, A. D. (2010). Public initiatives to support entrepreneurs: Credit guarantees versus co-funding. Journal of Financial Stability, 6(1), 26-35.
Arrow, K. J. (1985). “The Economics of Agency”, in J. W. Pratt and R. J. Zeckhauser, “Principals and Agents: The Structure of Business”, Boston, pp. 37–51.
Asdrubali, P. and Signore, S. (2015). The Economic Impact of EU Guarantees on Credit to SMEs. Evidence from CESEE countries. European Commission’s European Economy Discussion Paper 002 and EIF Working Paper 2015/29. July 2015. http://ec.europa.eu/economy_finance/publications/eedp/pdf/dp002_en.pdf and http://www.eif.org/news_centre/publications/eif_wp_29_economic-impact-guarantees_july15_fv.pdf.
BAND (2016). BANDquartal: How to explore the landscape of Angel Investing in Europe. Issue 1. June 2016. http://www.business-angels.de/wp-content/uploads/2016/06/BANDquartal-1_16.pdf
Bank of America/Merrill Lynch (2015). Week of 8th June 2015: Qualifying synthetics? In: European SF & CB Weekly. 14.06.2015.
BIS (2012). “SME access to external finance”, in BIS Economic Paper No. 16, January 2012.
Bruhn-Leon, B., Eriksson, P.-E., and Kraemer-Eis, H. (2012). Progress for microfinance in Europe. EIF Research and Market Analysis. Working Paper 2012/013. EIF Research & Market Analysis. January 2012. http://www.eif.org/news_centre/research/index.htm
Carbó-Valverde, S., Degryse, H., & Rodriguez-Fernandez, F. (2012). Lending relationships and credit rationing: the impact of securitization. In Midwest Finance Association 2013 Annual Meeting Paper.
Chong, T. T. L., Lu, L., and Ongena, S. (2013). Does banking competition alleviate or worsen credit constraints faced by small and medium-sized enterprises? Evidence from China. Journal of Banking & Finance, 37(9), 3412-3424.
Coller Capital (2013). Global Private Equity Barometer. Winter 2013-14. http://www.collercapital.com/uploaded/documents/Publications/2013/Coller_Capital_Global_Barometer_-_Winter_2013.pdf
Council of the EU (2015). Proposal for a Regulation of the European Parliament and of the Council laying down common rules on securitisation and creating a European framework for simple, transparent and standardised securitisation and amending Directives 2009/65/EC, 2009/138/EC, 2011/61/EU and Regulations (EC) No 1060/2009 and (EU) No 648/2012, Presidency compromise, 30.11.2015. http://data.consilium.europa.eu/doc/document/ST-14537-2015-INIT/en/pdf
Cour-Thimann, P. and Winkler, B. (2013). The ECB’s non-standard monetary policy measures. The role of institutional factors and financial structure. ECB Working Paper Series. No 1528. April 2013. http://www.ecb.europa.eu/pub/pdf/scpwps/ecbwp1528.pdf

PART II Investment finance218
Investment and Investment Finance in Europe European Investment Bank
EBF (2015). Financial Dialogue. Fostering financial knowledge among European SMEs. http://www.ebf-fbe.eu/publications/thematic-publications/.
ECB (2013). Monthly Bulletin, July 2013.
ECB (2016a). Survey on the access to finance of enterprises in the Euro Area. October 2015 to March 2016. June 2016.
ECB (2016b). The Euro Area bank lending survey. First quarter 2016. April 2016
EMN (2014). Bendig, M., Unterberg, M., and Sarpong, B. (2014). Overview of the Microcredit Sector in the European Union 2012-2013. European Microfinance Network. September 2014. http://www.europeanmicrofinance.org/docs/emn_publications/emn_overview/Overview2012-2013_Nov2014.pdf
EMN-MFC (2016). Preliminary results of the EMN-MFC Microcredit Overview Survey 2014-15. 2016.
Euler Hermes (2016). Macroeconomic, Country Risk and Global Sector Outlook. Economic Outlook. April, 2016.
European Commission (2012). Report from the Commission to the European Parliament and the Council on the application of Directive 2006/48/EC to microcredit. COM (2012) 769 final. 18.12.2012.
European Commission (2015). Annual Report on European SMEs 2014/2015 – SMEs start hiring again. http://ec.europa.eu/growth/smes/business-friendly-environment/performance-review/index_en.htm
European Parliament (2016). Working Document on common rules on securitisation and creating a European framework for simple, transparent and standardised securitisation. Committee on Economic and Monetary Affairs. Rapporteur: Paul Tang, 19.05.2016. http://www.europarl.europa.eu/sides/getDoc.do?type=COMPARL&reference=PE-580.483&format=PDF&language=EN&secondRef=01
GEM (2016). 2015/16 Global Report. Global Entrepreneurship Monitor.
Go4Venture Advisers (2015). European Venture & Growth Equity Market Monthly Bulletin. March 2015. 02.05.2015. http://www.go4venture.com/bulletin/
Holmstrom, B. and Tirole, J. (1997). Financial intermediation, loanable funds, and the real sector. The Quarterly Journal of Economics, 663-691.
Honohan, P. (2010). Partial credit guarantees: principles and practice. Journal of Financial Stability, 6(1), 1-9.
Invest Europe (2016). 2015 European Private Equity Activity. Statistics on Fundraising, Investments & Divestments. May 2016. http://www.investeurope.eu/media/476271/2015-european-private-equity-activity.pdf
Jaffee, D.M. and Russel, T. (1976). Imperfect information, uncertainty and credit rationing. In: Quarterly Journal of Economics. Vol. 90. November 1976.
Kaya, O. (2014). SME financing in the Euro Area. New solutions to an old problem. EU Monitor – Global Financial Markets. Deutsche Bank Research. 14.10.2014. https://www.dbresearch.com/PROD/DBR_INTERNET_EN-PROD/PROD0000000000344173/SME+financing+in+the+euro+area%3A+New+solutions+to+an+old+problem.PDF
Kolev, A., Tanayama, T. and Wagenvoort, R. (ec. eds.) (2013). “Investment and Investment Finance in Europe”. EIB Economics Department.
Kraemer-Eis, H. and Lang, F. (2014). “The importance of leasing for SME financing”, in: World Leasing Yearbook 2014, Euromoney, January 2014. http://www.eif.org/news_centre/research/eif_euromoney_importance-of-leasing-for-smes_fv.pdf
Kraemer-Eis and Schillo (2011). “Business Angels in Germany – EIF's initiative to support the non-
Investment finance PART II 219
European Investment Bank Investment and Investment Finance in Europe
institutional financing market”. EIF Working Paper 2011/011, November 2011. http://www.eif.org/news_centre/research/index.htm
Kraemer-Eis, H. and Conforti, A. (2009). Microfinance in Europe. A market overview. EIF Working Paper 2009/001. http://www.eif.org/news_centre/research/index.htm
Kraemer-Eis, H. and Lang, F. (2012). The importance of leasing for SME finance. EIF Working Paper 2012/15. 22.08.2012. http://www.eif.org/news_centre/research/index.htm
Kraemer-Eis, H. and Lang, F. (2014). The importance of leasing for SME financing. In: World Leasing Yearbook 2014. Euromoney, January 2014. http://www.eif.org/news_centre/research/eif_euromoney_importance-of-leasing-for-smes_fv.pdf
Kraemer-Eis, H. and Passaris, G. (2015). SME Securitization in Europe. In: The Journal of Structured Finance, Vol. 20, No. 4, Winter 2015.
Kraemer-Eis, H., Lang, F. and Gvetadze, S. (2013). “Bottlenecks in SME financing”, in: Kolev, A., Tanayama, T. and Wagenvoort, R. (ec. eds.) (2013). “Investment and Investment Finance in Europe”. EIB Economics Department, pp. 277 et seq. http://www.eif.org/news_centre/publications/Bottlenecks-in-SMEfinancing.htm
Kraemer-Eis, H., Lang, F., Torfs, W. and Gvetadze, S. (2016). “European Small Business Finance Outlook”. EIF Working Paper 2016/35, EIF Research & Market Analysis, June 2016. http://www.eif.org/news_centre/research/index.htm
Kraemer-Eis, H., Passaris, G., and Tappi, A. (2013). SME loan securitisation 2.0 – Market assessment and policy options. EIF Working Paper 2013/019. October 2013. http://www.eif.org/news_centre/publications/EIF_Working_Paper_2013_19.htm
Kraemer-Eis, H., Passaris, G., Tappi, A., and Inglisa, G. (2015). SME Securitisation – at a crossroads? EIF Working Paper 2013/031. December 2015. http://www.eif.org/news_centre/publications/eif_wp_31.pdf
Kraemer-Eis, H., Schaber, M., and Tappi, A. (2010). SME loan securitisation. An important tool to support European SME lending. EIF Working Paper 2010/007. October 2010. http://www.eif.org/news_centre/publications/eif-wp_2010_007_smesec.pdf
Kraemer-Eis, H., Signore, S., and Prencipe, D. (2016). The European venture capital landscape: an EIF perspective. Volume I: The impact of EIF on the VC ecosystem. EIF Working Paper 2016/34. EIF Research & Market Analysis. June 2016. http://www.eif.org/news_centre/research/index.htm
Mersch, Y. (2014). Banks, SMEs and securitisation. https://www.ecb.europa.eu/press/key/date/2014/html/sp140407.en.html
Nassr, I. K., & Wehinger, G. (2014). Non-bank debt financing for SMEs. OECD Journal: Financial Market Trends, 2014(1), 139-162.
OECD (2006). “The SME Financing Gap, Vol. 1, Theory and Evidence”.
OECD (2011). “Financing high-growth firms. The role of angel investors”. December 2011.
OECD (2013). “SME and Entrepreneurship Financing: The Role of Credit Guarantee Schemes and Mutual Guarantee Societies in supporting finance for small and medium-sized enterprises. Final Report”. CFE/SME(2012)1/FINAL. Unclassified, 30.01.2013.
OECD (2015). New Approaches to SME and Entrepreneurship Financing: Broadening the Range of Instruments. https://www.oecd.org/cfe/smes/New-Approaches-SME-full-report.pdf.
OECD (2016). Financing SMEs and Entrepreneurs 2016. An OECD Scoreboard. http://www.oecd.org/cfe/smes/financing-smes-and-entrepreneurs-23065265.htm.

PART II Investment finance220
Investment and Investment Finance in Europe European Investment Bank
Pelly, R. and Kraemer-Eis, H. (2012). “Improving the funding landscape for entrepreneurs”, in “SMEs in the single market. A growth agenda for the 21st century”. Lisbon Council Publication, 2012.
Preqin (2014). “Preqin Investor Outlook: Alternative Assets. H1 2014”. https://www.preqin.com/docs/reports/Preqin_Investor_Outlook_Alternative_Assets_H1_2014.pdf
Preqin (2016). Preqin Investor Outlook: Alternative Assets H1 2016. https://www.preqin.com/docs/reports/Preqin-Investor-Outlook-Alternative-Assets-H1-2016.pdf
Ryan, R. M., O’Toole, C. M., and McCann, F. (2014). Does bank market power affect SME financing constraints? Journal of Banking & Finance, 49, 495-505.
Stiglitz, J. and Weiss, A. (1981). “Credit Rationing in Markets with Incomplete Information”, in American Economic Review, Vol. 71, No. 3, pp. 393-410.
Tirole, J. (2010). The theory of corporate finance. Princeton University Press.
UEAPME Study Unit (2016). The EU Craft and SME Barometer 2016/H1. March 2016.
Uhde, A. and Heimeshoff, U. (2009). Consolidation in banking and financial stability in Europe: Empirical evidence. Journal of Banking & Finance, 33(7), 1299-1311.
Wehinger, G. and Nassr, I (2015). Unlocking SME finance through market-based debt: Securitisation, private placements and bonds, In: OECD Journal: Financial Market Trends. April 2015. http://www.oecd.org/daf/fin/financial-markets/Unlocking-SME-finance-through-market-based-debt.pdf
Wilson, K. (2015). Policy Lessons from Financing Innovative Firms. OECD Science, Technology and Industry Policy Papers, No. 24. OECD Publishing, Paris. 24 June 2015. http://dx.doi.org/10.1787/5js03z8zrh9p-en

Investment finance PART II 221
European Investment Bank Investment and Investment Finance in Europe
List of acronyms ABS: Asset-backed security
AECM: European Association of Mutual Guarantee Societies
AFME: Association for Financial Markets in Europe
BA: Business Angel
BCBS-IOSCO: Basel Committee on Banking Supervision – Board of the International Organisation of Securities Commissions
BCG: Boston Consulting Group
BIS: Bank for International Settlements
BLS: Bank Lending Survey
bn: billion
BoE: Bank of England
bp: basis point(s)
CDO: Collateralised Debt Obligation
CESEE (countries): (countries in) Central, Eastern and South-Eastern Europe
CGS: Credit Guarantee Scheme
CLO: Collateralised Loan Obligation
CMBS: Commercial mortgage-backed securities
CMU: Capital Markets Union
COM: European Commission (also: EC)
COSME: Programme for the competitiveness of enterprises and SMEs (COSME) 2014-2020
CRR: Capital Requirements Regulation
EBF: European Banking Federation
EC: European Commission (also: COM)
ECB: European Central Bank
EIB: European Investment Bank
EIF: European Investment Fund
EMN: European Microfinance Network
ESBFO: European Small Business Finance Outlook
EU-28: the 28 EU Member States
EUR: Euro
EVCA: European Private Equity & Venture Capital Association

PART II Investment finance222
Investment and Investment Finance in Europe European Investment Bank
GDP: Gross Domestic Product
GEM: Global Entrepreneurship Monitor
GP: General Partner
HQS: High Quality Securitisation
HY: Half Year
IMF: International Monetary Fund
IPE: Investment Plan for Europe
IRB: Internal Ratings Based
k: thousand
KfW: Kreditanstalt für Wiederaufbau, Germany
LBO: Leveraged buy-out
LP: Limited Partner
m: million
MAP: Multi Annual Programme for Enterprise and Entrepreneurship
MFC: Microfinance Centre
MFI (in the context of ECB): Monetary Financial Institutions
MFI (in the context of microfinance): Microfinance Institution
NFC: Non-financial corporation
OECD: Organisation for Economic Co-Operation and Development
PE: Private Equity
PFB: Public Funding Body
Q: Quarter
RMA: Research and Market Analysis
RMBS: Residential mortgage-backed securities
SAFE: Survey on the Access to Finance of Enterprises
sf: Structured Finance
SIA: Social Impact Accelerator
SMEs: Small and medium-sized enterprises
SMESec: SME Securitisation (comprising transactions based on SME loans, leases, etc.)
SST: simple, standard and transparent
STC: simple, transparent and comparable
STS: simple, transparent and standardised

Investment finance PART II 223
European Investment Bank Investment and Investment Finance in Europe
UEAPME: European Association of Craft, Small and Medium-sized Enterprises
UK: United Kingdom
US: United States
VC: Venture Capital
WBS: Whole Business Securitisation

224
Investment and Investment Finance in Europe European Investment Bank

225
European Investment Bank Investment and Investment Finance in Europe
Part III
Financing productivity growth
Chapter 6
Credit supply and capital misallocation: implications for corporate investment1
1 This chapter was prepared by Atanas Kolev (EIB) with contributions by Pauline Bourgeon and Christoph Weiss (EIB). Roberto Blanco and Noelia Jiménez (Box 2), Emilia Bonaccorsi di Patti (Box 3), and Luísa Farinha (Box 4) authored boxes 2, 3, and 4.

226
Investment and Investment Finance in Europe European Investment Bank
Financing productivity growth PART III 227
European Investment Bank Investment and Investment Finance in Europe
Credit supply and capital misallocation: implications for corporate investment
Chapter at a glance
The financial crisis and the sovereign debt crisis in Europe have reinforced the deceleration of productivity growth in most European countries and these effects are still lingering four years after the sovereign debt crisis subsided.
This chapter focuses on one of the channels of transmission: the reduced capacity of the financial sector to efficiently allocate resources across economies, following the financial crisis. The resulting misallocation of resources has had negative effects on the level of productivity.
One strand of existing academic literature studies the effect of financial constraints on the efficiency of resource allocation in the economy and finds that financial constraints may reduce efficiency, thereby lowering aggregate productivity levels. A second strand studies the impact of the financial crisis on credit supply in Europe. Its findings are that the credit supply shock originating from weak banks had a significant impact on real activity. This impact was asymmetric because some banks were more affected than others and because smaller firms were hit harder.
These two strands come together as the financial crisis amplified the effects of financial constraints on the efficiency of resource allocation. Furthermore, the asymmetric nature of the credit supply shock should have had further misallocation effects.
Using firm-level data, the analysis provides evidence that the financial crisis indeed worsened the effects of financial constraints on the real economy. Furthermore, the adverse effects of the credit supply shock were distributed asymmetrically across firms with different growth outlooks, which resulted in misallocation of resources as profitable business opportunities were missed.
Financial constraints are found to have a negative impact on productivity growth. A large share of this negative effect is explained by the declining allocative efficiency of the economy. The financial crisis had a positive effect on average sector productivity possibly by driving smaller, unproductive firms out of business. It had a negative effect on the intra-sectoral efficiency of resource allocation, however, due to tightening credit constraints.
Recent developments show that credit allocation has been improving, although financial constraints still seem to be worse than before the crisis.
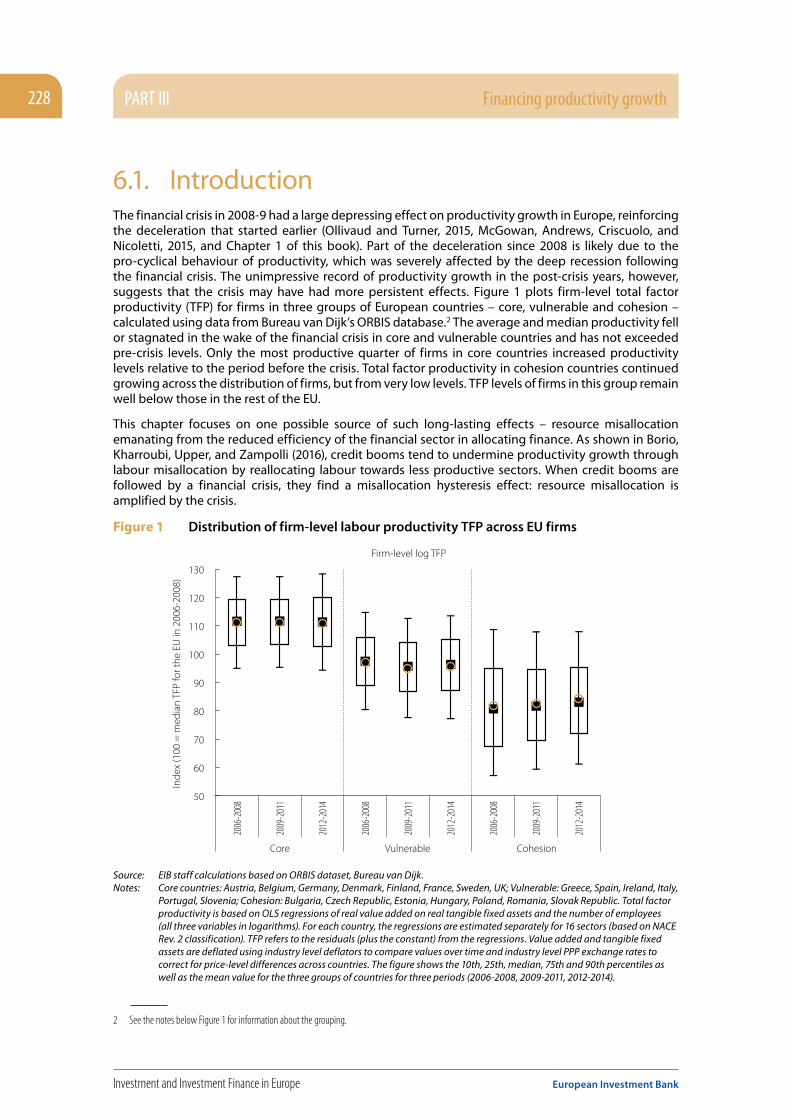
PART III Financing productivity growth228
Investment and Investment Finance in Europe European Investment Bank
6.1. IntroductionThe financial crisis in 2008-9 had a large depressing effect on productivity growth in Europe, reinforcing the deceleration that started earlier (Ollivaud and Turner, 2015, McGowan, Andrews, Criscuolo, and Nicoletti, 2015, and Chapter 1 of this book). Part of the deceleration since 2008 is likely due to the pro-cyclical behaviour of productivity, which was severely affected by the deep recession following the financial crisis. The unimpressive record of productivity growth in the post-crisis years, however, suggests that the crisis may have had more persistent effects. Figure 1 plots firm-level total factor productivity (TFP) for firms in three groups of European countries – core, vulnerable and cohesion – calculated using data from Bureau van Dijk’s ORBIS database.2 The average and median productivity fell or stagnated in the wake of the financial crisis in core and vulnerable countries and has not exceeded pre-crisis levels. Only the most productive quarter of firms in core countries increased productivity levels relative to the period before the crisis. Total factor productivity in cohesion countries continued growing across the distribution of firms, but from very low levels. TFP levels of firms in this group remain well below those in the rest of the EU.
This chapter focuses on one possible source of such long-lasting effects – resource misallocation emanating from the reduced efficiency of the financial sector in allocating finance. As shown in Borio, Kharroubi, Upper, and Zampolli (2016), credit booms tend to undermine productivity growth through labour misallocation by reallocating labour towards less productive sectors. When credit booms are followed by a financial crisis, they find a misallocation hysteresis effect: resource misallocation is amplified by the crisis.
Figure 1 Distribution of firm-level labour productivity TFP across EU firms
Firm-level log TFP
Inde
x (1
00 =
med
ian
TFP
for t
he E
U in
200
6-20
08)
2006
-200
8
2009
-201
1
2012
-201
4
2006
-200
8
2009
-201
1
2012
-201
4
2006
-200
8
2009
-201
1
CohesionVulnerableCore
130
120
110
100
90
80
70
60
50
2012
-201
4
Source: EIB staff calculations based on ORBIS dataset, Bureau van Dijk.Notes: Core countries: Austria, Belgium, Germany, Denmark, Finland, France, Sweden, UK; Vulnerable: Greece, Spain, Ireland, Italy,
Portugal, Slovenia; Cohesion: Bulgaria, Czech Republic, Estonia, Hungary, Poland, Romania, Slovak Republic. Total factor productivity is based on OLS regressions of real value added on real tangible fixed assets and the number of employees (all three variables in logarithms). For each country, the regressions are estimated separately for 16 sectors (based on NACE Rev. 2 classification). TFP refers to the residuals (plus the constant) from the regressions. Value added and tangible fixed assets are deflated using industry level deflators to compare values over time and industry level PPP exchange rates to correct for price-level differences across countries. The figure shows the 10th, 25th, median, 75th and 90th percentiles as well as the mean value for the three groups of countries for three periods (2006-2008, 2009-2011, 2012-2014).
2 See the notes below Figure 1 for information about the grouping.

Financing productivity growth PART III 229
European Investment Bank Investment and Investment Finance in Europe
The central role of a financial system is to direct financing from those with excess to those in need of it. Financial systems emerge and develop in order to address and reduce fundamental problems in borrower-lender relationships. These problems originate in the asymmetric information that exists between borrowers and lenders. Borrowers have more and better information about their projects and about the effort that they exert in implementing them than do lenders. In addition to this private information problem, managers of borrowing firms have different goals and incentives than owners of these firms and their lenders. These problems generate the so-called agency costs, which result in too little financing and increase its cost and may reduce the efficiency of capital allocation. Inefficient capital allocation reduces the level of aggregate productivity and economic welfare.
The degree to which agency problems are mitigated and the efficiency of capital allocation depend on the efficiency of the financial system. There is a lot of variation in the degree of efficiency of financial systems across countries and over time. Well-functioning financial systems reduce the effects of financial constraints, thereby increasing the availability of external finance to businesses and improving the allocation of capital (Boyd and Prescott, 1986 and Greenwood and Jovanovich, 1990). For instance, the costs to individual savers of searching and assessing possible investment projects are in most cases prohibitively high. As a result, too little savings are made available to finance potential investments and there is no guarantee that the most productive firms are financed. Hence business opportunities will be missed due to lack of finance and capital may be inefficiently allocated.
Banks hold a special place in financial systems, because by specialising in screening and monitoring, they are able to mitigate informational asymmetries and provide financing to small and informationally opaque firms that make for an overwhelming share of European economies. Banks may also help technological innovation by identifying those entrepreneurs with the best chances to successfully launch new goods and production processes (King and Levine, 1993 and Acemoglu, Aghion, and Zilibotti, 2006). The functioning of banking systems typically improves with economic development (Levine, 2005 and Banerjee and Dufflo, 2005), but it may also vary across states of the world, holding the level of development constant. Banking crises are typical examples. They cause the functioning of banking systems to deteriorate, reducing their capacity to reallocate capital from less productive to more productive projects, resulting in the misallocation of resources in the economy.
Most small and informationally opaque firms depend on one or few banks for external financing and have difficulties substituting with other forms of external financing, when their banks refuse credit.3 During banking crises, credit constraints become binding and credit does not necessarily go to the most productive projects but to those that are able to provide more collateral and rely less on leverage. This reduces the efficiency of resource allocation in the economy.
Khan and Thomas (2013) rationalise the link between financial crises and resource misallocation in the presence of financial constraints. They study capital reallocation in an economy where investment is partially reversible and firms borrow against collateral. A credit crisis, following a financial shock in this economy generates a persistent recession: binding financing constraints generate persistent disruptions to the distribution of the capital stock, misallocating capital and affecting aggregate productivity. As a result investment declines significantly and output recovers only gradually.
This chapter argues that the financial and sovereign debt crisis in Europe has had a similar negative impact on the efficiency of resource allocation. The credit supply shock that was caused by this twin crisis negatively affected resource reallocation across firms and industries, offsetting the potential cleansing effects of economic downturns and depressing aggregate productivity. Section 2 reviews the literature on financial constraints and resource reallocation and links to financial crises and credit supply disruptions. Section 3 reviews the literature on credit supply shocks and their impact on the economy. Section 4 offers an empirical assessment of the role of the financial sector and of credit constraints on resource misallocation in Europe with a focus on the impact of the financial crisis. Section 5 concludes with policy options.
3 See for instance Jiménez, Ongena, Peydró, and Saurina (2012).

PART III Financing productivity growth230
Investment and Investment Finance in Europe European Investment Bank
6.2. Financial constraints and resource misallocation
The academic literature on determinants of productivity growth has emphasised the role of many different factors including human capital, institutions, technology uses and financial development. With the growing availability of micro-level data, recent works have particularly focused on the role of the micro-origins of aggregate performance. Within this strand of literature researchers study the effects of resource allocation on productivity, mostly focusing on intra-industry reallocation. This focus is motivated by the fact that in developed countries inter-industry changes seem to play a minor role in resource misallocation since most mechanisms that may distort allocation of resources within an economy occur at the industry level.
The available estimates of job reallocation, or turnover, for various developed and transition economies point to two main conclusions. First, efficiency of job reallocation reaches the highest levels in the US whereas developed European economies are characterised by higher job reallocation than transition countries. Second, these papers attest to a high variation of job reallocation volumes across countries and this variation is related to the differences of aggregate productivity across countries.
The contribution of reallocation to aggregate productivity growth is significant. In EIB (2015), we show that in Europe over 2005-2011 aggregate productivity would have been between 12% and 60% lower if labour had been randomly allocated across firms. The range of figures is in line with the ones obtained by Bartelsman, Haltiwanger, and Scarpetta (2013) and CompNet Task Force (2014). Foster, Haltiwanger, and Syverson (2008) find that reallocation explains between 25% and 50% of 5-year TFP growth in the US. Several authors estimate similar large effects for other countries.4 An important study by Hsieh and Klenow (2009) estimates the large TFP gains that would arise from reducing misallocation in India and China to the level of the US. The estimates range between 30% and 60%.
Aware that resource allocation matters for aggregate productivity, the research focus shifted to specific mechanisms that may distort efficient allocation. The regulatory framework is often the first quoted channel as labour and product market regulations distort firms’ entry and exit decisions. Any other policies that regulate the functioning of an industry such as tax incentives, trade policies or size-related policies may also directly impact labour reallocation. Andrews and Cingano (2014) exploit firm-level data on OECD countries to assess the effect of the various mechanisms. They provide empirical evidence that labour and product market regulations have a large impact on the level of allocative efficiency. Bloom, Sadun, and Van Reenen (2016) test another mechanism by looking at the role of management practices on productivity in 34 advanced and developing countries. On average they estimate that management practices account for 30% of aggregate productivity through the reallocation of economic activity towards the better managed firms.
The role of financial markets, which is the focus of this chapter, has drawn much attention in recent years. A number of studies focus on the impact of financial constraints on the efficiency of resource allocation. Financial constraints are modelled as borrowing limits (Midrigan and Xu, 2014), collateral constraints (Banerjee and Moll, 2010, Moll, 2014 and others) or endogenous collateral constraints that arise from limited enforcement of contracts as in Buera and Shin (2013), and Buera, Kaboski, and Shin (2011). In these models, firms accumulate capital with a precautionary motive. The more productive a firm is the higher its return on capital and the greater the incentive to save and reinvest its savings so that it can eventually grow out of the external borrowing constraints. This mechanism assigns little significance to resource misallocation across existing firms. Resource misallocation due to the inefficient entry and exit of firms is, nevertheless, found to be typically more important due to fixed costs related to market entry. Because most entrants have neither sufficient collateral nor a productive technology that allows
4 See Disney, Haskel, and Heden (2003) for the UK, Lewrick, Mohler, and Weder (2014) for Switzerland.

Financing productivity growth PART III 231
European Investment Bank Investment and Investment Finance in Europe
them to save and finance their entry themselves they have to resort to external finance. In the presence of inefficient financial intermediaries, too few firms obtain external financing and therefore entry is inefficiently low, which reduces innovation and productivity growth.
In Erosa and Hidalgo Cabrillana (2008) the limited ability to enforce contracts and asymmetric information between borrowers and lenders gives rise to misallocation of resources across firms with different productivities, and across industries with different needs for external financing. There are two drivers of this misallocation in their model. First, limited contract enforcement makes it difficult for lenders to penalise borrowers for not revealing private information truthfully. Second, depressed wages and high output prices create economic rents for operators of less productive technologies.
Buera, Kaboski, and Shin (2011), and Midrigan and Xu (2014) study the productivity losses, both across existing firms and due to inefficient entry and exit, that arise from credit constraints. Buera, Kaboski, and Shin (2011) find that financing frictions impact sectors with smaller fixed costs, and therefore less dependent on external finance, mostly across existing firms, while more than half of the impact of financing frictions in the more investment-intensive sectors is through inefficient entry and exit of firms. Moreover, the impact of financial constraints is disproportionately larger in finance-intensive sectors, as shown empirically in Rajan and Zingales (1998).5
Recently, there has been substantial research work analysing the role of financial frictions on the allocation of resources. Borio, Kharroubi, Upper, and Zampolli (2016) find that credit booms have a detrimental effect on productivity by facilitating labour reallocations to low productivity sectors, resulting in misallocation of resources across industries. Binding credit constraints, which typically occur during financial crises, conspicuously amplify this misallocation effect. CompNet Task Force (2015) shows that the financial crisis has somewhat improved reallocations across firms as their results attest that the least productive firms suffered more from credit constraints during the Great Recession in stressed countries. Andrews and Cingano (2014) also exploit cross-section micro-level data to examine the contributions of labour, product and financial market regulations on allocative efficiency. They find a substantial effect of labour and product market regulations, but they see no significant role of financial markets on allocation of resources. Osotimehin and Pappadà (2016) demonstrate that financial shocks considerably affect the reallocation process but only through the entry and exit of firms. Box 2 examines the role of Spanish banks and firm-level financial constraints in the efficient allocation of credit before and after the financial crisis in 2008. The authors find that financial constraints became more binding after the beginning of the financial crisis, as the probability that a firm with a weak financial position would receive a loan declined much more than that for a firm with strong financial position. Credit was allocated to a larger extent to more productive firms after 2008.
5 EIB (2015) provides a more extended review of this literature.
PART III Financing productivity growth232
Investment and Investment Finance in Europe European Investment Bank
6.3. Credit supply shocks and their role in resource misallocation
Small and transitory events may have large and persistent effects on the economy because of the presence of financial constraints on non-financial firms (Bernanke and Gertler, 1989, Bernanke, Gertler, and Gilchrist, 1999, Kyiotaki and Moore, 1997). Effects are not only persistent but also amplify initial shocks through borrowers’ balance sheets and asset prices. This occurs because asymmetric information between borrowers and lenders generates agency costs that raise the cost of external finance and borrowing limits. Agency costs and borrowing limits fluctuate over the business cycle reinforcing the effects of financial shocks.
Holmstrom and Tirole (1997) argue that banks are also borrowers and are also subject to agency costs. Changes in their net worth or the market value of assets may affect the non-financial sector through the supply of credit. Banks mitigate the agency problems with the amount of capital that they hold. The loss of capital that typically occurs during banking crises, due to falling asset prices and asset quality, means that banks limit loan supply in an attempt to hold up their capital base. Declining supply of loans raises the demand for bond financing that, in turn, increases market risk premiums in order to attract risk-averse investors to buy risky corporate bonds. Higher risk premiums intensify the effects of the credit shock. Gertler and Kyiotaki (2010) combine credit constraints of non-financial borrowers and of financial intermediaries so that the net worth of both financial and non-financial companies has effects on availability of credit and on real activity. They find that the endogenous disruptions to financial intermediation substantially magnify economic downturns.
The financial crisis of 2008-9 and the subsequent sovereign debt crisis in Europe in 2010-12 provided a forceful reminder of the detrimental impact of credit supply shocks on real activity. The relatively recent availability of granular data on loans and loan applications for several European countries, notably Italy, Spain and Portugal, combined with the large disruption in financial markets has helped the research efforts significantly in truly disentangling the effects of credit supply from credit demand.
Box 3 reviews such studies focusing on Italy and argues that the credit supply shock played a significant role in the decline of bank lending in Italy during the financial crisis. Box 4 discusses the role of credit supply on financial conditions for Portuguese non-financial firms both before and after the financial crisis. Reduced credit supply from banks affected by the sovereign debt crisis had a negative impact on the Portuguese corporate sector and especially on highly leveraged firms with large holdings of short-term debt. A common finding of Boxes 2, 3 and 4 is that credit conditions and credit allocation have improved lately in Italy, Portugal and Spain. Borrowers’ balance sheets and riskiness remain key determinants of banks’ lending decisions in the three countries.
The liquidity squeeze following the financial crisis (Ippolito, Peydró, Polo, and Sette, 2016, Iyer, Peydró, da-Rocha-Lopes, and Schoar, 2014), low capital ratios (Jiménez, Ongena, Peydró, and Saurina, 2012, Acharya, Eisert, Eufinger, and Hirsch, 2016) and excessive exposure to debt securities issued by governments in financial distress (Europe Acharya, Eisert, Eufinger, and Hirsch, 2016 and Popov and Van Horen, 2015) created an asymmetric transmission of the financial shock to the real economy as different banks were affected to different degrees by these problems. More affected banks reduced credit by more than the rest. At the same time borrowers could not compensate for this reduction by obtaining credit from less affected banks or other alternative sources of external finance.
The impact was also asymmetric across the non-financial firm size distribution. Consistent with earlier empirical findings of Gerter and Gilchrist (1994) and theoretical arguments that financial constraints deriving from asymmetric information are more relevant for smaller and less transparent firms, Bottero, Lenzu, and Mezzanotti (2015) find that credit for smaller and riskier firms with high exposure to affected banks was reduced more than for those with low exposure and that this had significant negative effect on their investment and employment decisions. Investment and employment of large firms were not significantly affected. This asymmetry is also related to the fact that smaller firms are more dependent

Financing productivity growth PART III 233
European Investment Bank Investment and Investment Finance in Europe
on their main partner bank. Many studies find that firms whose initial loan application was rejected could not compensate for the decline in external finance availability by obtaining a loan from elsewhere (Jiménez, Ongena, Peydró, and Saurina, 2012, Albertazzi and Marcchetti, 2010, Bottero, Lenzu, and Mezzanotti, 2015, and Iyer, Peydró, da-Rocha-Lopes, and Schoar, 2014).
The asymmetry of the supply shocks across lenders and size of borrowers meant that finance did not necessarily go to the most productive projects. Such asymmetric effects of credit constraints and their impact on resource misallocation during financial crises is analysed in Buera, Jaef, and Shin (2015). They find that a credit crunch has a higher negative impact on small and young firms, who reduce their net employment growth rate more than larger, older firms. This impact creates a capital misallocation effect, as borrowing constraints tighten for low net worth but potentially productive borrowers’ capital is channelled to firms that may be less productive but unconstrained. These are able to expand their production and hire more people, as they encounter lower factor prices. The aggregate result is lower productivity in the economy.
Loan evergreening practices by weak banks that try to postpone declaring losses on non-performing loans are another source of resource misallocation as documented by Peek and Rosengren (2005) and Caballero, Hoshi, and Kashyap (2008) for Japan. Albertazzi and Marcchetti (2010) find evidence of such practices in Italy, especially in large banks with low capitalisation, during the financial crisis.
6.4. Assessing the role of the financial sector in resource misallocation in Europe
Taking stock of the literature on financial constraints, resource misallocation and the role of banks in transmitting financial distress to the real economy, this section examines some evidence on the impact of the financial crisis and the accompanying credit supply shock on resource misallocation in Europe. We look at two aspects: misallocation across sectors and misallocation within sectors using data from Bureau van Dijk’s ORBIS database.
As discussed in section 2, the recent literature on resource misallocation concludes that historically within-sector misallocation of resources has had a much larger quantitative effect on aggregate productivity than inter-sectoral resource misallocation. The years before and immediately after the financial crisis were anything but ordinary, however. First, large imbalances built up across sectors before the crisis in several European countries, where industries from the non-tradable sector, and construction in particular, expanded substantially relative to those in the tradable sector, only to implode after 2008. This boom and bust cycle has created large flows of resources across industries that may have plausibly affected productivity. In section 4.1. we look at the impact of the crisis on reallocation across sectors of the economy. Section 4.2. takes the perspective of intra-sectoral resource allocation. In particular, it examines the relationship between measures of financial friction and productivity and how it may have changed after 2008.
6.4.1. Financial frictions and inter-sectoral misallocation6
We look at the impact of the financial crisis on investment by firms with high and low growth opportunities and the role of financial constraints on the intensity of this impact. The analysis uses the ORBIS database from Bureau van Dijk together with data on global price-earnings (PE) ratios for 30 broad sectors of the economy that are mapped into 662 four-digit industries from NACE Rev. 2 classification. Our data covers all EU members in the period 2004-2013.7 Following the approach of Bekaert, Harvey, Lundblad, and Siegel (2007), we use sector-specific global PE ratios as proxies for growth opportunities of a firm in a
6 This section is based on work done by Francesca Barbiero, Alexander Popov, Philipp Brutscher, Atanas Kolev and Marcin Wolski within the CEPR-ASSONIME project on Restarting European long-term investment finance.
7 See Barbiero, Popov, and Wolski (2016) for more details about the data.

PART III Financing productivity growth234
Investment and Investment Finance in Europe European Investment Bank
given sector. Firms in industries with global PE ratios above the median in any given year are considered to have good global growth opportunities (GGO) in that year. We interpret total leverage as a proxy for financial constraints and check robustness with other potential indicators of financial constraints. Our key finding is that the financial crisis exacerbated the effects of financial constraints on investment of firms. Moreover it had asymmetric effects on the non-financial corporate sector affecting relatively more the firms with a good business outlook. The combined effect was that profitable business opportunities were missed, which we interpret as evidence of resource misallocation. We find that negative effects of the financial crisis were likely transmitted to firms through their relationship with weak banks.
The empirical specification is a difference-in-differences design. In particular, we examine how the banking crisis and financial constraints affect investment of firms in industries with better growth prospects – our treatment group – relative to other firms. The baseline regression is:
IƒcstKƒcst-1 = β
1GGO
st x Crisis
ct + β
2GGO
st x ( Debt
Total assets )ƒcst-1 + β
3X
ƒcst-1 + β
4θ
ƒ + β
5μ
st + β
6δ
ct + ε
ƒcst (1)
Investment is measured in net terms as the annual change in the book value of tangible and intangible capital, adjusted for industry-specific investment deflators. The capital stock is measured as the sum of tangible and intangible fixed assets. Crisis is a dummy variable taking values of 1 if a country has had a financial crisis in any given year, according to the dataset of Laeven and Valencia (2012), and zero otherwise. X is a vector of firm-specific control variables, including our indicators for financial constraints. Debt to total assets denotes total debt to total assets and is our main indicator of financial constraints. The motivation to choose this ratio as our measure of financial constraints is that high indebtedness increases the wedge between the cost of internal and external finance. This raises the cost of borrowing and at the same time reduces the willingness of lenders to extend credit due to higher agency costs. Lenders may further want to ration credit to highly leveraged firms due to their increasing incentives to invest in riskier but not necessarily very productive projects (Jensen and Meckling, 1976) and a bias for tangible assets to create a larger collateral base (Kim and Maksimovich, 1990).
As a robustness check, we use three different variables to proxy for financial constraints: (i) a dummy variable taking the value of 1 if a firm has fewer than 250 employees and annual sales of less than EUR 10m and is 0 otherwise;8 (ii) the ratio of tangible fixed assets to total assets – the collateral ratio; (iii) the ratio of earnings before interest, taxes and depreciation relative to interest payments – the coverage ratio. The rationale for using firm size as a proxy for financial constraints is that smaller firms are more informationally opaque, which implies that they are exposed to higher agency costs. The collateral ratio approximates the ability of firms to obtain secured debt. Higher ability to provide collateral makes access to finance easier. Finally, the coverage ratio measures the capacity of firms to meet their current obligations with current resources. Lower coverage ratios will signal a higher need for external financing but also lower capacity to repay future obligations.
Firm-specific time-invariant characteristics are controlled for by using firm fixed effects. The specification is further saturated with country-time and industry-time fixed effects to control for unobserved time-varying country- and industry-specific drivers of investment, such as aggregate demand or sector-specific investment opportunities.9
8 This choice reflects the definition of the European Commission of a small or medium-sized enterprise (SME).9 Sector-year fixed effects absorb the variable controlling for growth opportunities, GGO, and therefore it appears in the regression only through its interaction with the
measures of financial constraints and the crisis indicator.
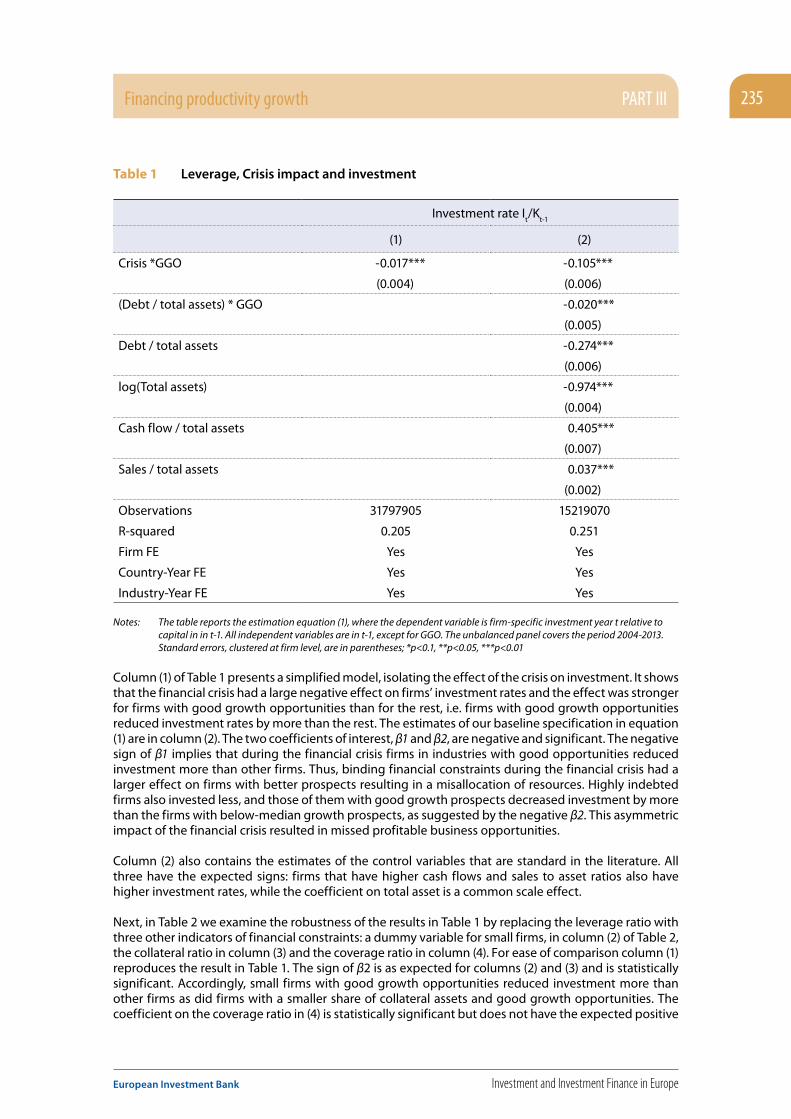
Financing productivity growth PART III 235
European Investment Bank Investment and Investment Finance in Europe
Table 1 Leverage, Crisis impact and investment
Investment rate It/K
t-1
(1) (2)
Crisis *GGO -0.017*** -0.105***
(0.004) (0.006)
(Debt / total assets) * GGO -0.020***
(0.005)
Debt / total assets -0.274***
(0.006)
log(Total assets) -0.974***
(0.004)
Cash flow / total assets 0.405***
(0.007)
Sales / total assets 0.037***
(0.002)
Observations 31797905 15219070
R-squared 0.205 0.251
Firm FE Yes Yes
Country-Year FE Yes Yes
Industry-Year FE Yes Yes
Notes: The table reports the estimation equation (1), where the dependent variable is firm-specific investment year t relative to capital in in t-1. All independent variables are in t-1, except for GGO. The unbalanced panel covers the period 2004-2013. Standard errors, clustered at firm level, are in parentheses; *p<0.1, **p<0.05, ***p<0.01
Column (1) of Table 1 presents a simplified model, isolating the effect of the crisis on investment. It shows that the financial crisis had a large negative effect on firms’ investment rates and the effect was stronger for firms with good growth opportunities than for the rest, i.e. firms with good growth opportunities reduced investment rates by more than the rest. The estimates of our baseline specification in equation (1) are in column (2). The two coefficients of interest, β1 and β2, are negative and significant. The negative sign of β1 implies that during the financial crisis firms in industries with good opportunities reduced investment more than other firms. Thus, binding financial constraints during the financial crisis had a larger effect on firms with better prospects resulting in a misallocation of resources. Highly indebted firms also invested less, and those of them with good growth prospects decreased investment by more than the firms with below-median growth prospects, as suggested by the negative β2. This asymmetric impact of the financial crisis resulted in missed profitable business opportunities.
Column (2) also contains the estimates of the control variables that are standard in the literature. All three have the expected signs: firms that have higher cash flows and sales to asset ratios also have higher investment rates, while the coefficient on total asset is a common scale effect.
Next, in Table 2 we examine the robustness of the results in Table 1 by replacing the leverage ratio with three other indicators of financial constraints: a dummy variable for small firms, in column (2) of Table 2, the collateral ratio in column (3) and the coverage ratio in column (4). For ease of comparison column (1) reproduces the result in Table 1. The sign of β2 is as expected for columns (2) and (3) and is statistically significant. Accordingly, small firms with good growth opportunities reduced investment more than other firms as did firms with a smaller share of collateral assets and good growth opportunities. The coefficient on the coverage ratio in (4) is statistically significant but does not have the expected positive
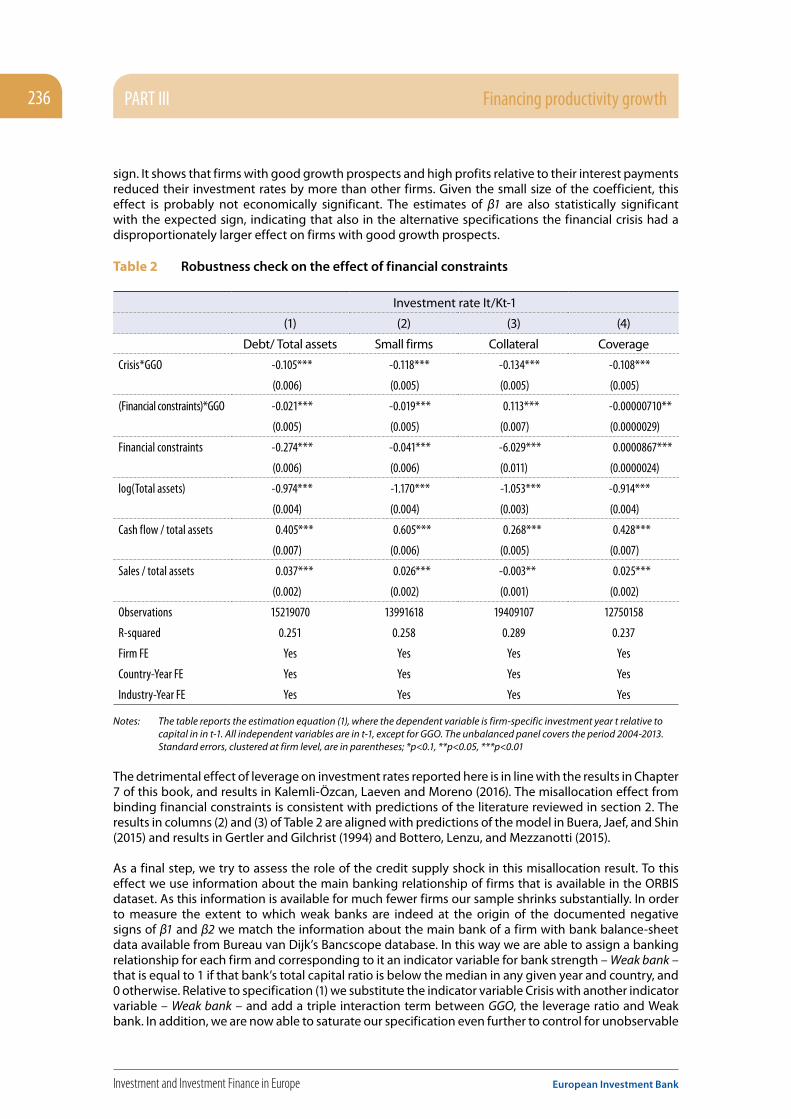
PART III Financing productivity growth236
Investment and Investment Finance in Europe European Investment Bank
sign. It shows that firms with good growth prospects and high profits relative to their interest payments reduced their investment rates by more than other firms. Given the small size of the coefficient, this effect is probably not economically significant. The estimates of β1 are also statistically significant with the expected sign, indicating that also in the alternative specifications the financial crisis had a disproportionately larger effect on firms with good growth prospects.
Table 2 Robustness check on the effect of financial constraints
Investment rate It/Kt-1
(1) (2) (3) (4)
Debt/ Total assets Small firms Collateral Coverage
Crisis*GGO -0.105*** -0.118*** -0.134*** -0.108***
(0.006) (0.005) (0.005) (0.005)
(Financial constraints)*GGO -0.021*** -0.019*** 0.113*** -0.00000710**
(0.005) (0.005) (0.007) (0.0000029)
Financial constraints -0.274*** -0.041*** -6.029*** 0.0000867***
(0.006) (0.006) (0.011) (0.0000024)
log(Total assets) -0.974*** -1.170*** -1.053*** -0.914***
(0.004) (0.004) (0.003) (0.004)
Cash flow / total assets 0.405*** 0.605*** 0.268*** 0.428***
(0.007) (0.006) (0.005) (0.007)
Sales / total assets 0.037*** 0.026*** -0.003** 0.025***
(0.002) (0.002) (0.001) (0.002)
Observations 15219070 13991618 19409107 12750158
R-squared 0.251 0.258 0.289 0.237
Firm FE Yes Yes Yes Yes
Country-Year FE Yes Yes Yes Yes
Industry-Year FE Yes Yes Yes Yes
Notes: The table reports the estimation equation (1), where the dependent variable is firm-specific investment year t relative to capital in in t-1. All independent variables are in t-1, except for GGO. The unbalanced panel covers the period 2004-2013. Standard errors, clustered at firm level, are in parentheses; *p<0.1, **p<0.05, ***p<0.01
The detrimental effect of leverage on investment rates reported here is in line with the results in Chapter 7 of this book, and results in Kalemli-Özcan, Laeven and Moreno (2016). The misallocation effect from binding financial constraints is consistent with predictions of the literature reviewed in section 2. The results in columns (2) and (3) of Table 2 are aligned with predictions of the model in Buera, Jaef, and Shin (2015) and results in Gertler and Gilchrist (1994) and Bottero, Lenzu, and Mezzanotti (2015).
As a final step, we try to assess the role of the credit supply shock in this misallocation result. To this effect we use information about the main banking relationship of firms that is available in the ORBIS dataset. As this information is available for much fewer firms our sample shrinks substantially. In order to measure the extent to which weak banks are indeed at the origin of the documented negative signs of β1 and β2 we match the information about the main bank of a firm with bank balance-sheet data available from Bureau van Dijk’s Bancscope database. In this way we are able to assign a banking relationship for each firm and corresponding to it an indicator variable for bank strength – Weak bank – that is equal to 1 if that bank’s total capital ratio is below the median in any given year and country, and 0 otherwise. Relative to specification (1) we substitute the indicator variable Crisis with another indicator variable – Weak bank – and add a triple interaction term between GGO, the leverage ratio and Weak bank. In addition, we are now able to saturate our specification even further to control for unobservable
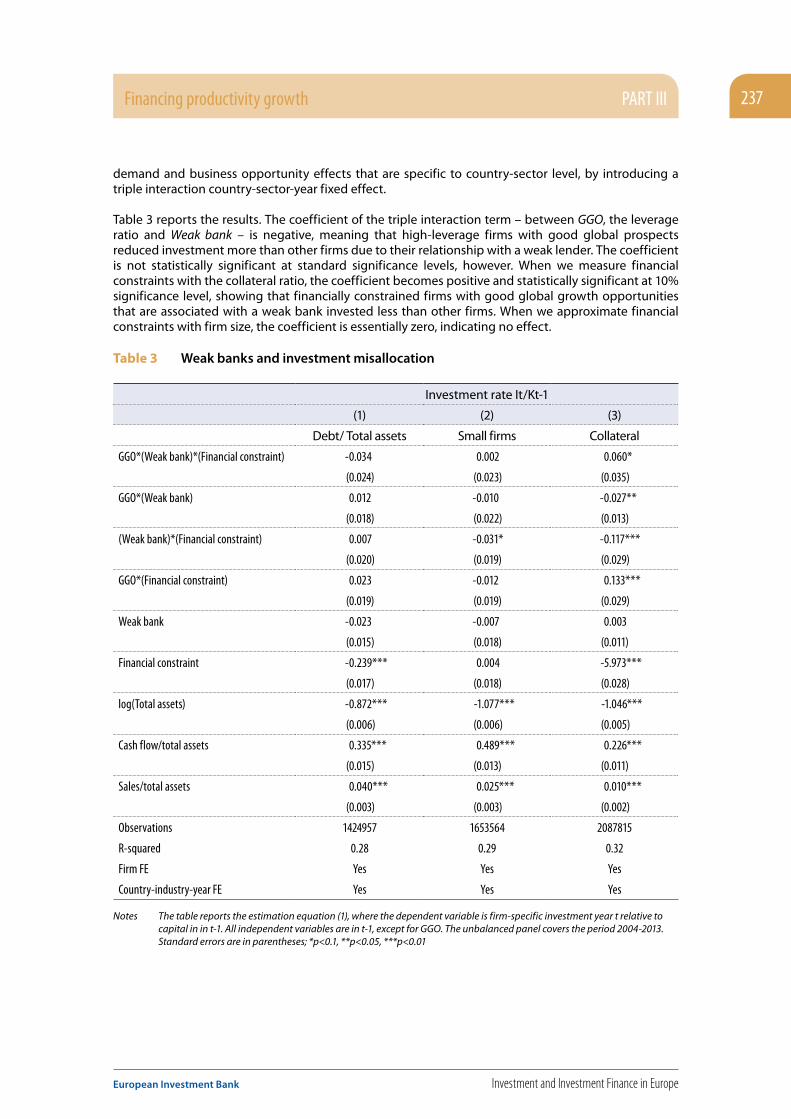
Financing productivity growth PART III 237
European Investment Bank Investment and Investment Finance in Europe
demand and business opportunity effects that are specific to country-sector level, by introducing a triple interaction country-sector-year fixed effect.
Table 3 reports the results. The coefficient of the triple interaction term – between GGO, the leverage ratio and Weak bank – is negative, meaning that high-leverage firms with good global prospects reduced investment more than other firms due to their relationship with a weak lender. The coefficient is not statistically significant at standard significance levels, however. When we measure financial constraints with the collateral ratio, the coefficient becomes positive and statistically significant at 10% significance level, showing that financially constrained firms with good global growth opportunities that are associated with a weak bank invested less than other firms. When we approximate financial constraints with firm size, the coefficient is essentially zero, indicating no effect.
Table 3 Weak banks and investment misallocation
Investment rate It/Kt-1
(1) (2) (3)
Debt/ Total assets Small firms Collateral
GGO*(Weak bank)*(Financial constraint) -0.034 0.002 0.060*
(0.024) (0.023) (0.035)
GGO*(Weak bank) 0.012 -0.010 -0.027**
(0.018) (0.022) (0.013)
(Weak bank)*(Financial constraint) 0.007 -0.031* -0.117***
(0.020) (0.019) (0.029)
GGO*(Financial constraint) 0.023 -0.012 0.133***
(0.019) (0.019) (0.029)
Weak bank -0.023 -0.007 0.003
(0.015) (0.018) (0.011)
Financial constraint -0.239*** 0.004 -5.973***
(0.017) (0.018) (0.028)
log(Total assets) -0.872*** -1.077*** -1.046***
(0.006) (0.006) (0.005)
Cash flow/total assets 0.335*** 0.489*** 0.226***
(0.015) (0.013) (0.011)
Sales/total assets 0.040*** 0.025*** 0.010***
(0.003) (0.003) (0.002)
Observations 1424957 1653564 2087815
R-squared 0.28 0.29 0.32
Firm FE Yes Yes Yes
Country-industry-year FE Yes Yes Yes
Notes The table reports the estimation equation (1), where the dependent variable is firm-specific investment year t relative to capital in in t-1. All independent variables are in t-1, except for GGO. The unbalanced panel covers the period 2004-2013. Standard errors are in parentheses; *p<0.1, **p<0.05, ***p<0.01
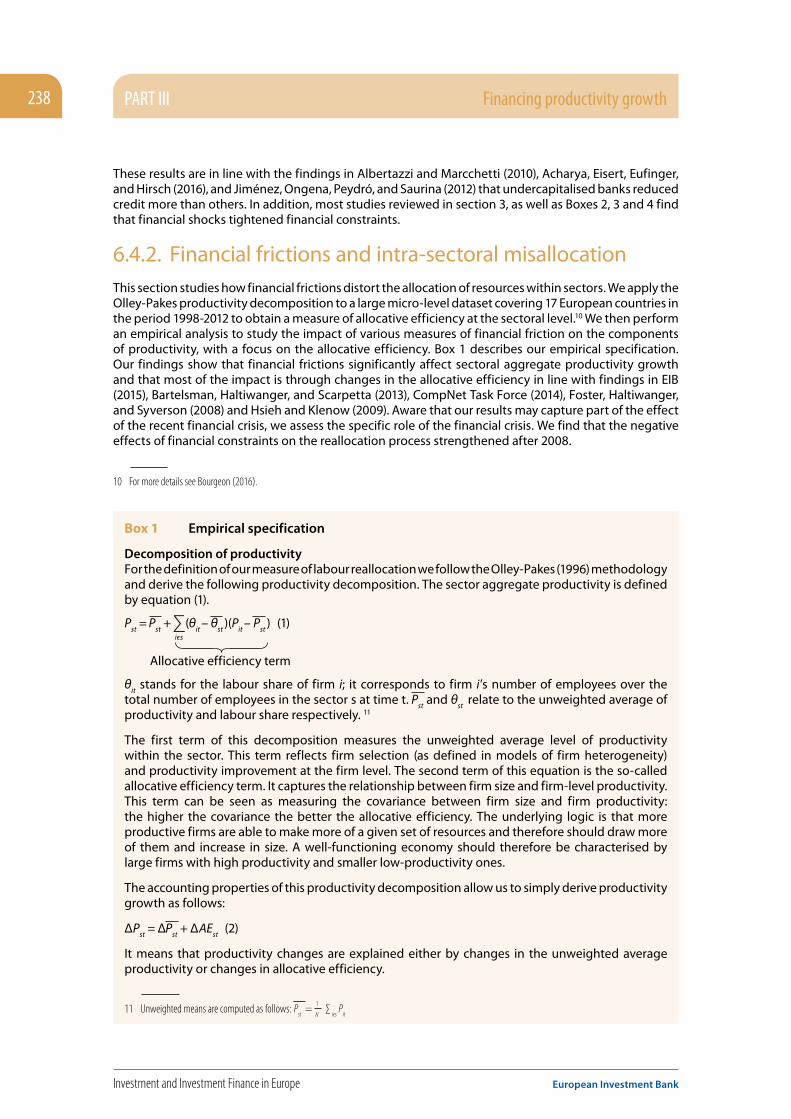
PART III Financing productivity growth238
Investment and Investment Finance in Europe European Investment Bank
These results are in line with the findings in Albertazzi and Marcchetti (2010), Acharya, Eisert, Eufinger, and Hirsch (2016), and Jiménez, Ongena, Peydró, and Saurina (2012) that undercapitalised banks reduced credit more than others. In addition, most studies reviewed in section 3, as well as Boxes 2, 3 and 4 find that financial shocks tightened financial constraints.
6.4.2. Financial frictions and intra-sectoral misallocationThis section studies how financial frictions distort the allocation of resources within sectors. We apply the Olley-Pakes productivity decomposition to a large micro-level dataset covering 17 European countries in the period 1998-2012 to obtain a measure of allocative efficiency at the sectoral level.10 We then perform an empirical analysis to study the impact of various measures of financial friction on the components of productivity, with a focus on the allocative efficiency. Box 1 describes our empirical specification. Our findings show that financial frictions significantly affect sectoral aggregate productivity growth and that most of the impact is through changes in the allocative efficiency in line with findings in EIB (2015), Bartelsman, Haltiwanger, and Scarpetta (2013), CompNet Task Force (2014), Foster, Haltiwanger, and Syverson (2008) and Hsieh and Klenow (2009). Aware that our results may capture part of the effect of the recent financial crisis, we assess the specific role of the financial crisis. We find that the negative effects of financial constraints on the reallocation process strengthened after 2008.
10 For more details see Bourgeon (2016).
Box 1 Empirical specification
Decomposition of productivityFor the definition of our measure of labour reallocation we follow the Olley-Pakes (1996) methodology and derive the following productivity decomposition. The sector aggregate productivity is defined by equation (1).
Pst
= Pst
+ ∑iєs
(θit
– θst
)(Pit
– Pst
) (1)
θit stands for the labour share of firm i; it corresponds to firm i’s number of employees over the
total number of employees in the sector s at time t. Pst and θ
st relate to the unweighted average of
productivity and labour share respectively. 11
The first term of this decomposition measures the unweighted average level of productivity within the sector. This term reflects firm selection (as defined in models of firm heterogeneity) and productivity improvement at the firm level. The second term of this equation is the so-called allocative efficiency term. It captures the relationship between firm size and firm-level productivity. This term can be seen as measuring the covariance between firm size and firm productivity: the higher the covariance the better the allocative efficiency. The underlying logic is that more productive firms are able to make more of a given set of resources and therefore should draw more of them and increase in size. A well-functioning economy should therefore be characterised by large firms with high productivity and smaller low-productivity ones.
The accounting properties of this productivity decomposition allow us to simply derive productivity growth as follows:
ΔPst
= ΔPst
+ ΔAEst (2)
It means that productivity changes are explained either by changes in the unweighted average productivity or changes in allocative efficiency.
11 Unweighted means are computed as follows: Pst =
1
N ∑
iєs Pit
Allocative efficiency term

Financing productivity growth PART III 239
European Investment Bank Investment and Investment Finance in Europe
Empirical strategyWe regress productivity and its components on various measures of financial friction, country-time fixed effects, χ
ct, and several control variables:
ΔYcst
= βΔfin. frictionscst
+ α1 Nfirms
cst + α
2Nfirmsst
+ α3Nemployees
st + α4Tech
s + χ
ct + ε
cst , (3)
where ΔYcst
can be the annual rate of change of aggregate productivity of sector s in country c and at time t, (denoted by ΔP
cst in equation(2)) or one of the two components from the Olley-
Pakes decomposition – ΔPst or ∆AE
cst. We include the number of firms in a given sector, the average
number of firms and the average number of employees across sectors as control variables to capture sector-specific characteristics and control for entry and exit. Haltiwanger, Jarmin, and Miranda (2010) demonstrate the importance of accounting for firms’ size to accurately study labour reallocation. Finally, we include a dummy variable indicating the technological sophistication of a sector according to the Eurostat classification. Depending on the level of R&D expenditures a sector is classified as a high technology, a medium-high technology, a medium-low technology or a low technology sector. This variable controls for technology-induced entry costs as in Andrews and Cingano (2014). These additional control variables capture the main sources of time-varying sector characteristics.
6.4.2.1. Measuring financial constraints
Financial constraints refer to any type of mechanism that impedes the functioning of capital markets, preventing capital from flowing between lenders and borrowers. Here, we focus on mechanisms that may impede reallocation of labour from low productive firms to high productive firms.
As we cannot directly observe the access to external finance we use financial ratios to proxy for it. Following previous works using firm-level data to study financial frictions, we select three different variables to measure firm-level financial frictions, aggregated at the sector level. First we consider the coverage ratio computed as the amount of earnings before interest and tax (EBIT) over interest paid. This ratio captures a firm’s ability to meet its short-term liabilities. This ratio signals good financial health and we expect it to be positively correlated with sector productivity.
We add two more variables: one capturing indebtedness; and another, dependence on external finance. We first compute the leverage ratio as the amount of long-term debt over total assets. This ratio captures the level of general indebtedness and may materialise as a financial constraint because high indebtedness may reduce access to new loans due to higher credit risk and less available collateral. We therefore expect this variable to negatively affect productivity. Finally we compute the financial expenses ratio as the amount of financial expenses over turnover. This variable assesses the external finance burden, i.e. how much of the operating cycle is dedicated to paying back investors. We expect this variable to reflect difficulties in financing productivity enhancement and reallocation of labour12.
4.2.2. Estimation results
Table 4 contains the results from estimating the specification described in Box 1. It shows that financial frictions have a significant effect on productivity growth through the allocative efficiency channel. On average, a 10% increase in the leverage growth rate reduces aggregate productivity growth by 1.8% and more than 80% of this decrease is explained by the slowdown of allocative efficiency. These results support the argument that financial frictions reduce the pace of an efficient reallocation process, in line with EIB (2015), Bartelsman, Haltiwanger, and Scarpetta (2013), CompNet Task Force (2014) and several other studies reviewed in section 2.
12 The selection of these financial friction measures is in line with the literature studying finance and international trade. See Stiebale (2011) for an application with Orbis data.

PART III Financing productivity growth240
Investment and Investment Finance in Europe European Investment Bank
Table 4 Financial frictions and productivity growth components (1-year change)
∆=1 year ∆ Coverage ∆ Leverage ∆ Fin. Exp.
(1) (3) (4)
Panel A - ∆ Aggregate-productivity (Pcst
)
Coefficient (β) 0.014*** -0.018*** -0.054***
0.003 0.007 0.007
R² 0.304 0.293 0.269
Panel B - ∆ Average productivity (( Pcst
)
Coefficient (β) 0.005** -0.003 -0.035***
0.002 0.005 0.006
R² 0.582 0.579 0.548
Panel C - ∆ Allocative efficiency (AEcst
)
Coefficient (β) 0.009*** -0.015** -0.019**
0.002 0.006 0.006
R² 0.311 0.308 0.268
Observations 4,418 4,425 4,782
# Country*year fixed effects 252 229 252
Note: all variables are in logs. The variable productivity is the log of turnover per employee in real terms. Coefficients of industry-specific control variables, as described in Box 1, are not shown in this table. Standard errors are in italics. *** p<0.01, ** p<0.05, * p<0.1.
Source: author’s computation based on Bureau Van Dijk’s Orbis database, period: 1995-2012.
In order to assess the effect of the financial crisis on the relationship between productivity and financial constraints, we estimate the preceding specification adding a dummy variable for the crisis period 2008-2012 and an interaction term of this dummy with the measure of financial friction. The results are in Table 5.
The relationship between aggregate productivity and the measures of financial constraints did not change significantly in the period following the financial crisis relative to the pre-crisis period. It did change, however, for the two components – average productivity and allocative efficiency. While the leverage ratio did not have a discernible effect on allocative efficiency before the crisis, it exerted a significant negative effect on the growth rate of allocative efficiency after 2008. This finding is consistent with the findings in the preceding section that the leverage ratio was a significant source of resource misallocation. The leverage ratio changed its effect on the rate of growth of average productivity after 2008, too, switching from negative to positive. One possible explanation for this change is that less productive firms, which are typically smaller and less leveraged, exited during the crisis thus pushing up simultaneously average productivity and the average leverage ratio.

Financing productivity growth PART III 241
European Investment Bank Investment and Investment Finance in Europe
Table 5 Financial frictions and productivity components (pre-crisis and post-crisis)
∆=1 year ∆ Coverage ∆ Leverage ∆ Fin. Exp.
(1) (3) (4)
Panel A - ∆ Aggregate-productivity (Pcst
)
Coefficient (β) 0.017*** -0.018** -0.589***
0.003 0.007 0.008
D Post-crisis Interaction Coefficient -0.009 -0.002 0.030
0.006 0.016 0.020
R² 0.300 0.291 0.269
Panel B - ∆ Average productivity Pcst
Coefficient (β) 0.003 -0.015*** -0.029***
0.003 0.006 0.006
D Post-crisis Interaction Coefficient 0.008 0.060*** -0.035**
0.005 0.013 0.015
R² 0.578 0.580 0.548
Panel C - ∆ Allocative efficiency AEcst
Coefficient (β) 0.014*** -0.003 -0.030***
0.003 0.006 0.007
D Post-crisis Interaction Coefficient -0.017 -0.062*** 0.065***
0.005 0.014 0.017
R² 0.309 0.311 0.270
ControlsFixed effects Observations
4,408 4,422 4,779
Note: all variables are in logs. D post-crisis is a dummy variable equals to 1 if year>2008 and zero otherwise. The variable productivity is the log of turnover per employee in real terms. Coefficients of industry-specific control variables, as described in Box 1, are not shown in this table. Standard errors are in italics. *** p<0.01, ** p<0.05, * p<0.1.
Source: author’s computation based on Bureau Van Dijk’s Orbis database, period: 1995-2012.
6.5. Policy implicationsThis chapter explores the link between the asymmetric effects of the tightening in credit supply during the financial and the sovereign debt crises in Europe in the period 2008-2012 and the decline in efficiency of resource allocation during this period that manifested itself in declines in total factor productivity.
The widespread weakness of the European banking sector resulted in significant declines of credit supply by the affected credit institutions. Small and informationally opaque firms, which are most often subject to credit constraints, were hit disproportionately more by this contraction. Such firms were not able to substitute bank loans from their primary bank with other sources of financing. This credit crunch resulted in reduced efficiency of resource allocation as growth of viable firms was constrained by lack of external finance while at the same time finance was relatively more available to firms that could offer collateral but had poorer quality projects and prospects. This experience confirms the importance of prioritising the quick resolution of problems in weak banks in times of financial distress. This reduces possible spillover effects to the rest of the banking sector and the real economy, while at the same time increasing public confidence in the banking sector.

PART III Financing productivity growth242
Investment and Investment Finance in Europe European Investment Bank
Box 2 The role of the banking system in the credit reallocation process in the Spanish corporate sector over the recent business cycle13
The aggregate stock of bank lending to Spanish firms has been falling since 2009, with a rate of contraction that is progressively moderating. Micro data show that this development has been accompanied by a significant credit reallocation within the corporate sector. Against this background, this box analyses the credit reallocation process in the Spanish corporate sector before and after the crisis and the role of banks in it.
The micro data from the Banco de España’s Central Credit Register (CCR) and the Central Balance Sheet Data Office (CBSO)14 show that the contraction in the aggregate stock of corporate bank credit since 2009 has been compatible with the existence of a significant percentage of companies (close to 35% at its minimum, in 2012) whose stock of credit did not fall (see Panel 1 of Figure 1). Panel 2 of Figure 1 reveals that before the crisis the differences in the mean total factor productivity (TFP) levels between firms whose stock of bank credit does not diminish and those whose stock of bank credit diminishes were positive but very small, whereas this gap increased considerably during the crisis and has continued to do so in the most recent recovery period. The same results can be observed for the main sectors of activity (see Panel 3 of Figure 1). A simple statistical t test indicates that before the crisis, differences in TFP levels between the two types of firms were not significant in some sectors. However, since then, those tests point more clearly to significant differences in productivity levels between the two groups of firms in most sectors. Panel 4 of Figure 1 shows that similar results are obtained when comparing variables that proxy for the financial soundness of firms (such as indebtedness or interest burden) for the two groups of firms. More specifically, those firms whose stock of bank credit does not diminish are financially stronger than those that are deleveraging, and these differences have increased since the start of the crisis. This shows that a healthy credit reallocation process has been taking place in the recent period within the Spanish corporate sector. In particular, bank lending is shifting from less productive and financially weaker firms to more productive and financially sounder firms.
13 This box was prepared by Roberto Blanco and Noelia Jiménez, Financial Analysis Division, Banco de España. The views expressed in the box are those of the authors and do not necessarily reflect those of the Banco de España or the Eurosystem.
14 The CCR compiles monthly individual information on the credit balances and credit situation of loans over EUR 6,000 provided by all credit institutions operating in Spain. The CBSO database contains information on firms’ profit and loss accounts and balance sheets.
As we show in this chapter, the past financial crisis revealed, once again, the dangers of rapid debt build-up and the debt overhang in the wake of the crisis. This experience strengthens the case for macro prudential and regulatory tools and policies to avoid large debt build-ups.
Our results advocate for a more resilient financial system. More resilience implies fewer financing constraints that may otherwise lead to large-scale misallocation of resources, to people being stuck in low productivity jobs or to having high rates of unemployment. Higher resilience can be achieved through more diversification of financing sources and instruments. Addressing financing constraints is another key policy priority. It requires a mix of structural policies and new or more accessible financing instruments, in order to make long-term external finance less dependent on business cycle fluctuations. While banks are an indispensable part of modern financial systems, they are very exposed to cyclical fluctuations due to their high leverage levels. Excessive reliance on bank lending may leave borrowers without external financing precisely when liquidity is most needed. Therefore it is important that during non-crisis times, efforts are concentrated on increasing the diversity of independent external finance instruments, especially for small firms that are unable to substitute bank loans with direct financing from capital markets. Continuing the development of pan-European policies to provide a framework that strengthens the banking sector, as well as fostering the availability of other sources of finance should be a key priority. In this regard, the setting-up of the Banking Union and initial steps towards establishing a Capital Market Union are very important.
Financing productivity growth PART III 243
European Investment Bank Investment and Investment Finance in Europe
The increasing reallocation of credit towards more productive and financially stronger firms observed during the recent period could be the result of demand factors (i.e. demand for new lending from more productive and financially sounder firms has increased compared to demand from less productive and financially weaker firms) and also supply factors (i.e. banks are discriminating more among firms according to their different economic and financial situations when granting loans). This box focuses on supply factors using the CCR, which is a unique dataset to test for the existence of such factors. In particular, it contains the requests for information that banks file with the CCR to ascertain the debt position of firms that apply for loans and with which they have no previous exposure. Using these information requests it is possible to identify a subgroup of firms that is seeking bank funding, and by observing how their credit balances evolve it is also possible to know whether those firms actually obtained that funding.15 A linear probability model has been estimated for the subgroup of firms applying for loans to banks with which they had no previous debt and for which individual firm characteristics are available in the CBSO. The probability of a firm being granted a loan has been modelled as a function of a series of firm-specific variables and a set of fixed effects, allowing at the same time for time-varying coefficients by sub-period to check for the existence of possible structural breaks.16 In particular, three sub-periods are considered: the expansionary phase before the crisis (2004 07, sub-period 1), the crisis (2008 12, sub-period 2) and the economic recovery (2013 15, sub-period 3). Table 1 shows that firm age and size have an unexpected negative effect on the probability of obtaining a loan, a result which may be linked to a possible bias in the sample of firms used in the estimations.17 The estimated coefficients for all the financial variables – indebtedness, interest burden and the binary variable of having previous non-performing loans – have the expected sign and are statistically significant. The analysis by sub-period shows that, from the start of the crisis, the probability of obtaining a loan became more sensitive to changes in the financial situation of firms, i.e. the absolute value of the coefficients for the indebtedness and interest burden variables increased notably, suggesting that banks started to discriminate more between firms according to their financial situation compared to the previous expansionary phase. During the current recovery period, in absolute terms the coefficients have increased only marginally. The changes in the values of the coefficients between sub-periods 1 and 2 and between sub-periods 2 and 3 are statistically significant. By contrast, the coefficient for the doubtful loan variable changed only marginally in the three sub-periods and the changes were not statistically significant.
Based on the above estimations, Figure 2 shows the estimated probability of obtaining a loan for the median firm and for firms with stronger and weaker financial positions.18 According to those estimates, during the crisis the probability declined for all firms, but the decrease was more marked for those with higher debt and interest burden ratios than for those with a better financial situation. Moreover, whereas in the case of stronger firms the probability started to recover in 2012, for weaker firms it only started to increase in 2014 and the rise was more moderate. Thus, in 2015, the probability for stronger firms was around 5 pp below the 2005 level, whereas for weaker firms the difference was around 18 pp.
15 More specifically, a firm is considered to have obtained a loan when its credit balance (including both the amount drawable and the amount drawn) increases between t 1 and t+3 with banks with which it had no exposure.
16 The estimates derive from a linear probability model that includes, as explanatory variables, asset size, a binary variable that indicates whether the firm has an NPL balance, the logarithm of 1 plus the age in years of the firm, the debt ratio (calculated as interest-bearing borrowing minus cash over total assets) and the interest burden ratio (calculated as interest payments over gross operating profit plus financial revenue). It also includes fixed firm effects and fixed time effects. The estimates were made for the subgroup of firms in the CCR for which there is information in the CBSO. The data cover the period 2004 to 2015.
17 In particular, the CCR only provides information on loan applications from firms that apply for loans to banks with which they have no previous exposure. In this regard, this finding could reflect the fact that larger and older firms applying for loans to banks with which they have no exposure tend to be riskier than other firms with similar observable characteristics. In particular, some of those firms may be seeking loans from new banks because their usual banks have refused to grant them funding in view of their perceived poor credit quality. As a matter of fact, when a linear probability model is estimated for the probability of obtaining a loan from any bank – with or without previous exposures – including the same explanatory variables, firm age and size have the expected positive impact. When using this alternative definition, the main qualitative results of this box remain unchanged.
18 To compute the probability of obtaining a loan for the median firm, the median value of every independent variable is considered. For firms in a weaker and a stronger financial position, the value of the 90th and 10th percentiles, respectively, of the interest burden and the debt ratio are taken and the median for the other variables.
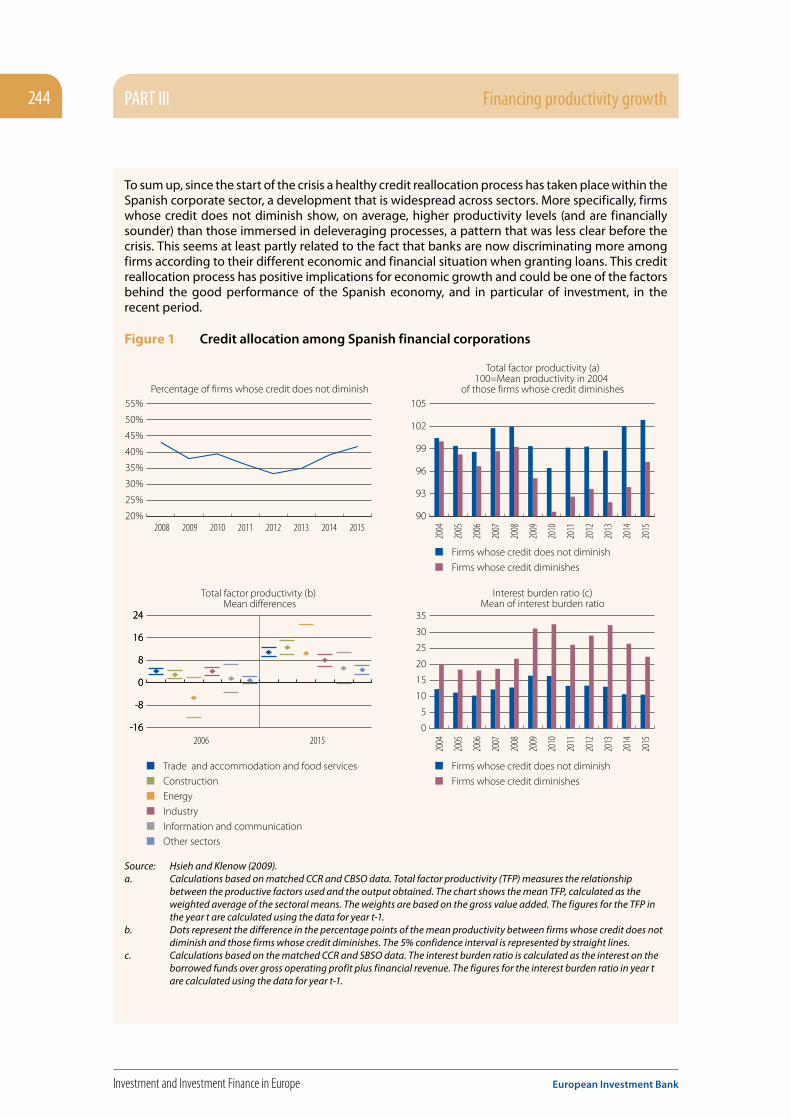
PART III Financing productivity growth244
Investment and Investment Finance in Europe European Investment Bank
To sum up, since the start of the crisis a healthy credit reallocation process has taken place within the Spanish corporate sector, a development that is widespread across sectors. More specifically, firms whose credit does not diminish show, on average, higher productivity levels (and are financially sounder) than those immersed in deleveraging processes, a pattern that was less clear before the crisis. This seems at least partly related to the fact that banks are now discriminating more among firms according to their different economic and financial situation when granting loans. This credit reallocation process has positive implications for economic growth and could be one of the factors behind the good performance of the Spanish economy, and in particular of investment, in the recent period.
Figure 1 Credit allocation among Spanish financial corporations
20%
25%
30%
35%
40%
45%
50%
55%
Firms whose credit diminishes
Firms whose credit does not diminish
Firms whose credit diminishes
Firms whose credit does not diminish
90
93
96
99
102
105
0
5
10
15
20
25
30
35
2004
2005
2006
2007
2008
2009
2010
2011
2012
2013
2014
2015
2004
2005
2006
2007
2008
2009
2010
2011
2012
2013
2014
2015
Percentage of firms whose credit does not diminish
Total factor productivity (a)100=Mean productivity in 2004
of those firms whose credit diminishes
-16
-8
0
8
16
24
-16
-8
0
8
16
24
-16
-8
0
8
16
24
Total factor productivity (b) Mean differences
Interest burden ratio (c)Mean of interest burden ratio
2008 2009 2010 2011 2012 2013 2014 2015
Trade and accommodation and food servicesConstruction
Energy
Industry
Information and communication
Other sectors
2006 2015
Source: Hsieh and Klenow (2009).a. Calculations based on matched CCR and CBSO data. Total factor productivity (TFP) measures the relationship
between the productive factors used and the output obtained. The chart shows the mean TFP, calculated as the weighted average of the sectoral means. The weights are based on the gross value added. The figures for the TFP in the year t are calculated using the data for year t-1.
b. Dots represent the difference in the percentage points of the mean productivity between firms whose credit does not diminish and those firms whose credit diminishes. The 5% confidence interval is represented by straight lines.
c. Calculations based on the matched CCR and SBSO data. The interest burden ratio is calculated as the interest on the borrowed funds over gross operating profit plus financial revenue. The figures for the interest burden ratio in year t are calculated using the data for year t-1.

Financing productivity growth PART III 245
European Investment Bank Investment and Investment Finance in Europe
Figure 2 Probability of obtaining a loan (a)
0
10
20
30
40
50
60
Weaker firms Stronger firmsMedian firm
2005 2006 2007 2008 2009 2010 2011 2012 2013 2014 2015
Source: Banco de España.a. Calculations are based on the estimation results of Table 1. For the median firm, the median values of all variables are
considered; for the stronger and weaker firms, the 10th percentile and the 90th percentile, respectively, of the interest burden ratio and the indebtedness ratio are considered and the median values for the other variables.
Table 1 Marginal impact on the probability of obtaining a loan (a)
2005-2007 2008-2012 2013-2015
Total assets -0.041*** -0.034*** -0.030***
Previous doubtful loans -0.130*** -0.120*** -0.123***
Age -0.025*** -0.008 -0.019
Indebtedness -0.059*** -0.161*** -0.173***
Interest burden ratio -0.001* -0.004*** -0.005*** * 10% significance** 5% significance*** 1% significanceSource: Banco de España.a. Estimated coefficients from a linear probability model with data from 2004 to 2015. The dependent variable is a
dummy variable that takes 1 if the loan is granted and 0 otherwise. The explanatory variables are: asset size, a binary variable indicating whether the firm has a non-performing loan balance, age, the debt ratio and the interest burden ratio. For a more detailed description, see footnote 16.
PART III Financing productivity growth246
Investment and Investment Finance in Europe European Investment Bank
Box 3 Studies of supply and demand of bank credit to non-financial firms in Italy19
Bank credit to Italian non-financial firms during the global financial and sovereign debt crises. During the first half of 2007, before the outbreak of the global financial crisis, bank credit to non-financial firms in Italy was growing at around 12% on an annual basis, following a period of rapid expansion (Figure 1). By the end of 2008 bank loan growth had markedly slowed down. After a brief recovery in 2010-11, the growth rate of bank lending to both large and small businesses further declined and by the end of 2012 turned negative, consistently with the sluggish economic growth. The contraction of bank loans has been gradually slowing down in the last three years and in the first months of 2016, but aggregate figures mask significant heterogeneity by firm size and sector, as discussed below.
Disentangling supply from demand. Understanding the contribution of supply and demand factors to credit dynamics, particularly after a crisis, is critical to the end of choosing the appropriate policy response. The empirical challenge of disentangling the roles of credit supply shocks and of the contraction in demand can be tackled in many ways. These include the examination of survey-based data on banks (responses of Italian banks participating in the euro area Bank Lending Survey and the regional survey conducted by the Banca d'Italia) and firms (see for example the Banca d’Italia Financial Stability Report 1, 2016), together with the analysis of credit volumes and loan spreads (e.g. Panetta and Signoretti, 2010).
A robust strategy to identify supply shifts is to investigate the relationship between firms and multiple banks with the use of micro data. Difference-in-difference regressions of loan growth are estimated controlling for demand with firm fixed effects, as suggested by Khwaja and Mian (2008). During the global financial crisis, in 2007 and 2008, Italian banks were primarily hit by negative shocks on the funding side of the balance sheet, originated by the instability on wholesale markets. Larger institutions were affected most. Empirical studies analysed the transmission of these shocks to borrowers, using bank-firm relationship data and exploiting the heterogeneity of the shocks across intermediaries. Such studies show that banks that were relying more extensively on the interbank market before the global financial crisis reduced the amount of granted loans and were less likely to accept new loan applications. Similarly, banks that used to fund larger shares of their loans through securitisation tightened credit supply conditions more than other institutions after the freeze of the securitisation market (Bonaccorsi di Patti and Sette, 2016). Although borrowers with closer relationships with their lenders experienced a milder credit supply shift (Sette and Gobbi, 2015), banks generally tightened their lending policies in response to the higher risk of borrowers after 2007. Banks increasingly relied on balance sheet indicators of borrowers’ financial strength, such as leverage, rather than on signals of growth prospects or on soft information to grant loans (Albareto and Finaldi Russo, 2012).
The credit supply effect of the higher funding costs during the sovereign debt crisis on both the volume and the cost of loans was studied by comparing lending by foreign banks’ subsidiaries established in Italy and Italian banks in 2010-2011; the analysis employs bank-firm relationship data on a very large sample of firms (Bofondi, Carpinelli and Sette, 2013). Analyses of this kind are robust in identifying the existence of a supply channel but cannot be used to assess the magnitude of a credit supply restriction affecting the whole banking system nor the impact of concurrent demand shifts (absorbed by the firm fixed effects).
A different approach is followed by Del Giovane, Nobili and Signoretti (2013), based on the responses of Italian banks to the euro area Bank Lending Survey and on bank-level data for 2002-201220. The study estimates a system of simultaneous equations for loan demand and supply curves describing
19 This box was prepared by Emilia Bonaccorsi di Patti, Financial Stability Directorate, Banca d’Italia. The opinions expressed do not necessarily reflect those of the Banca d’Italia, the Eurosystem or their staffs.
20 Another study by Del Giovane, Eramo, and Nobili (2011) uses the BLS and bank-level data to estimate the effects of demand and supply factors on loan volumes in Italy during the global financial crisis, up to the immediate aftermath of the Lehman Brothers failure.

Financing productivity growth PART III 247
European Investment Bank Investment and Investment Finance in Europe
a partial equilibrium framework in which the restrictions of credit supply lead to an adjustment of the quantities via the elasticity of loan demand to the cost of credit; a disequilibrium framework, in turn, accounts for the possibility of credit rationing. Banks’ funding cost and the perception of growing risk mostly affected the dynamics of loans to firms via the elasticity of loan demand to the bank margin. A worsening in banks’ capital position and funding difficulties exerted a direct negative effect on credit growth, consistent with quantity rationing; this effect was largest at the end of 2011 and decreased as liquidity conditions improved following the measures adopted by the ECB. The study suggests that on average the negative contribution of supply shifts to the growth rate of loans was smaller than the one of demand-side factors, except for during the fourth quarters of 2008 and 2011. The supply effect was nonetheless sizeable; as of the second quarter of 2012, had supply conditions remained at the pre-crisis levels interest rates applied to borrowers would have been around 200 basis points lower and the stock of credit would have been 8% higher.
Complementary evidence from studies focusing on data from samples of firms suggests that credit constraints did have a significant impact at the firm level (Gaiotti, 2011; Cingano, Manaresi and Sette, 2016), although they are not the most important factor in explaining why investment remained persistently weak after 200821 (Bond, Rodano, Serrano-Velarde, 2015).
Heterogeneity in recent credit dynamics.The sharp contraction in lending to firms observed in the past three years is gradually waning. In the first half of 2016 credit to non-financial firms stagnated, but the aggregate figures conceal significant heterogeneity across sectors (Figure 2). The growth of bank loans is positive for firms in manufacturing and in some segments of the service sector, but remains negative for those in the construction industry and in sectors in which the recovery in economic activity has been weaker (see the box: “Recent trends in lending to firms according to sector of activity”, Banca d’Italia Economic Bulletin n. 1, 2016). Survey-based information collected from Italian banks participating in the euro area Bank Lending Survey indicates that demand is picking up. At the same time, according to the banks interviewed, credit supply conditions have gradually eased since 2014. Nevertheless, assessing credit supply conditions in absolute terms is difficult because the survey questions only refer to quarterly changes with respect to the previous period. In March 2016, according to the responses to a specific question on this topic, the credit standards applied in the first quarter of this year by most banks were still slightly tighter than those applied on average between the second quarter of 2010 and the end of 2015 (see the box: “Credit Supply and Demand”, Banca d’Italia Economic Bulletin n. 3, 2016).
The riskiness of borrowers remains one of the main drivers of credit supply conditions; a breakdown of firms by broad risk class shows that firms that exhibit strong balance sheets are expanding their borrowing (Figure 3) while for risky ones loans are contracting. Nevertheless, a significant difference persists between medium-large firms and the smallest businesses, even within the same risk categories (Banca d’Italia Financial Stability Report 1, 2016). A role for specific supply constraints on smallest firms’ access to credit is suggested by the ECB Survey on Access to Finance in the Euro Area (SAFE), according to which obstacles to obtaining bank loans, still relevant for Italian SMEs, are more significant for microenterprises (see the October 2015-March 2016 wave, at https://www.ecb.europa.eu).
21 An analysis of the determinants of the drop in investment in Italy based on aggregated data can be found in the box “The determinants of the decline in investment”, Banca d’Italia, Annual Report on 2014.
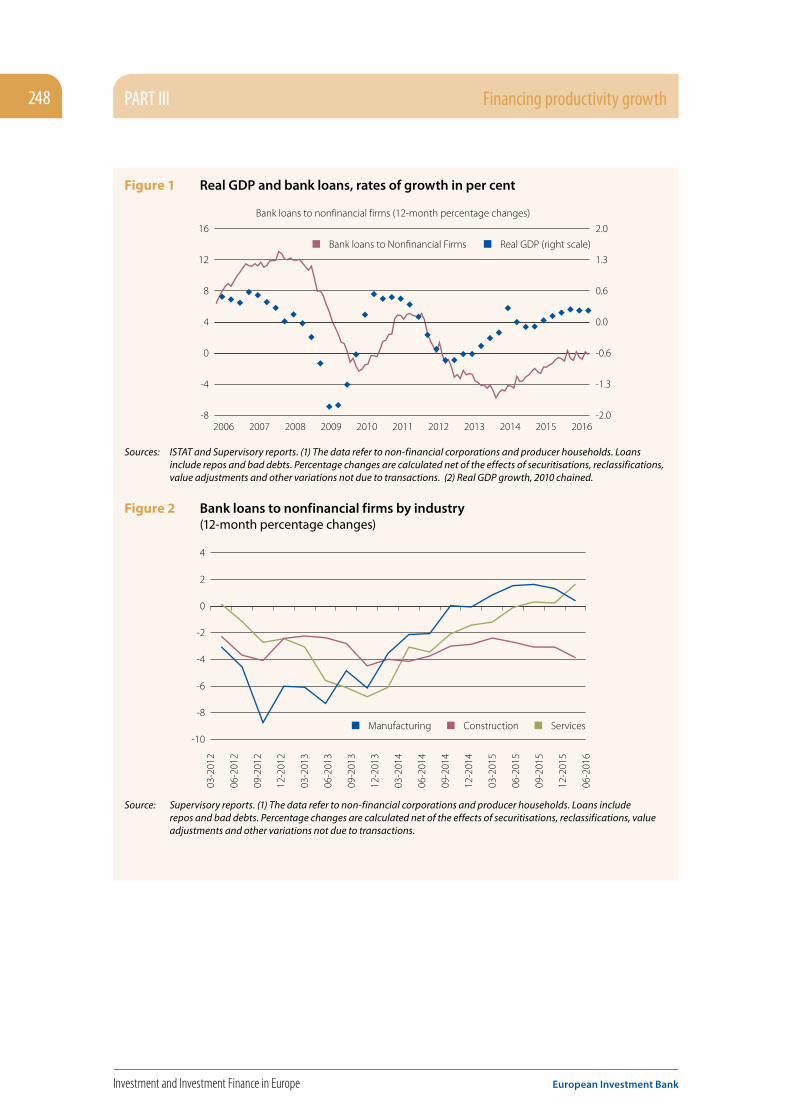
PART III Financing productivity growth248
Investment and Investment Finance in Europe European Investment Bank
Figure 1 Real GDP and bank loans, rates of growth in per cent
-8
-4
0
4
8
12
16
-2.0
-1.3
-0.6
0.0
0.6
1.3
2.0
Bank loans to Nonfinancial Firms Real GDP (right scale)
20162006 2007 2008 2009 2010 2011 2012 2013 2014 2015
Bank loans to nonfinancial firms (12-month percentage changes)
Sources: ISTAT and Supervisory reports. (1) The data refer to non-financial corporations and producer households. Loans include repos and bad debts. Percentage changes are calculated net of the effects of securitisations, reclassifications, value adjustments and other variations not due to transactions. (2) Real GDP growth, 2010 chained.
Figure 2 Bank loans to nonfinancial firms by industry (12-month percentage changes)
-10
-8
-6
-4
-2
0
2
4
Construction ServicesManufacturing
03-2
012
06-2
012
09-2
012
12-2
012
03-2
013
06-2
013
09-2
013
12-2
013
03-2
014
06-2
014
09-2
014
12-2
014
03-2
015
06-2
015
09-2
015
12-2
015
06-2
016
Source: Supervisory reports. (1) The data refer to non-financial corporations and producer households. Loans include
repos and bad debts. Percentage changes are calculated net of the effects of securitisations, reclassifications, value adjustments and other variations not due to transactions.

Financing productivity growth PART III 249
European Investment Bank Investment and Investment Finance in Europe
Figure 3 Loans to non-financial firms by risk category and size (12-month percentage changes)
Medium-size LargeMicro Small
-15
-10
-5
0
5
10
15
Sound Vulnerable Risky
2014 2015 2014 2015 2014 2015
Sources: Banca d'Italia and Cerved. (1) Loans granted by banks and financial companies. Data for 2014 refer to a sample of about 423,000 companies; those for 2015 refer to about 373,000 companies whose 2014 balance sheets are available. The classification by risk category is according to the scores assigned by Cerved.

PART III Financing productivity growth250
Investment and Investment Finance in Europe European Investment Bank
Box 4 The supply of financing available to non-financial corporations in Portugal: an overview22
In understanding the economic consequences of the evolution of credit supply in Portugal during the crisis it is important to go back to the genesis of the strong accumulation of debt, which began in the years preceding the euro. To a certain extent, this building-up of debt was regarded as borrowing against expected future growth, as the Portuguese economy converged with the European core (Fagan and Gaspar, 2007). In a context of increasing financial liberalisation and integration together with persistent low global risk aversion, Portuguese banks easily funded their needs in the international financial market, ensuring the financing of a bank-dependent non-financial private sector. For more than a decade, the building-up of the negative external position of the Portuguese economy mirrored the building-up of the non-financial sectors’ debt (Figure 1).
Figure 1 Indebtedness of households, non-financial corporations and general government and international investment position (% of GDP)
General government
Non-financial corporations
Households
0
50
100
150
200
250
300
350
400
19
97 19
99 20
01 20
03 20
05 20
07 20
09 20
11 20
13 20
15 19
97 19
99 20
01 20
03 20
05 20
07 20
09 20
11 20
13 20
15
-140
-120
-100
-80
-60
-40
-20
0
Indebtedness International investment position
Sources: INE and Banco de Portugal
Contradicting initial expectations, the beginning of EMU marked the start of a prolonged period of low growth for Portugal while private sector indebtedness maintained an upward trend. While Blanchard (2007) blames nominal wage and price rigidities and a countercyclical fiscal policy, Reis (2013) proposes an explanation for the slump of the 2000s based on the misallocation of the abundant capital flows received from abroad. Reis argues that an inefficient financial sector sustained the expansion of an unproductive non-tradable sector at the expense of the more productive tradable sector. In line with these arguments, the research by Dias et al. (2015, 2016) finds that the inefficiency in the allocation of resources, both across sectors and across firms within sectors, increased over the last 15 years, contributing to the poor economic performance of the economy in this period. Figure 2 illustrates these arguments by showing that indebtedness ratios increased most in construction and real estate activities and declined in manufacturing. Moreover, an incorrect risk perception by the banking system contributed to biasing the stock of bank loans towards firms with higher risk.23
22 This box was prepared by Luísa Farinha, Economics and Research Department, Banco de Portugal. The views expressed in the box are those of the author and do not necessarily reflect those of the Banco de Portugal or the Eurosystem.
23 Risk is measured by firm-level z-scores (see Antunes and Martinho, 2012).
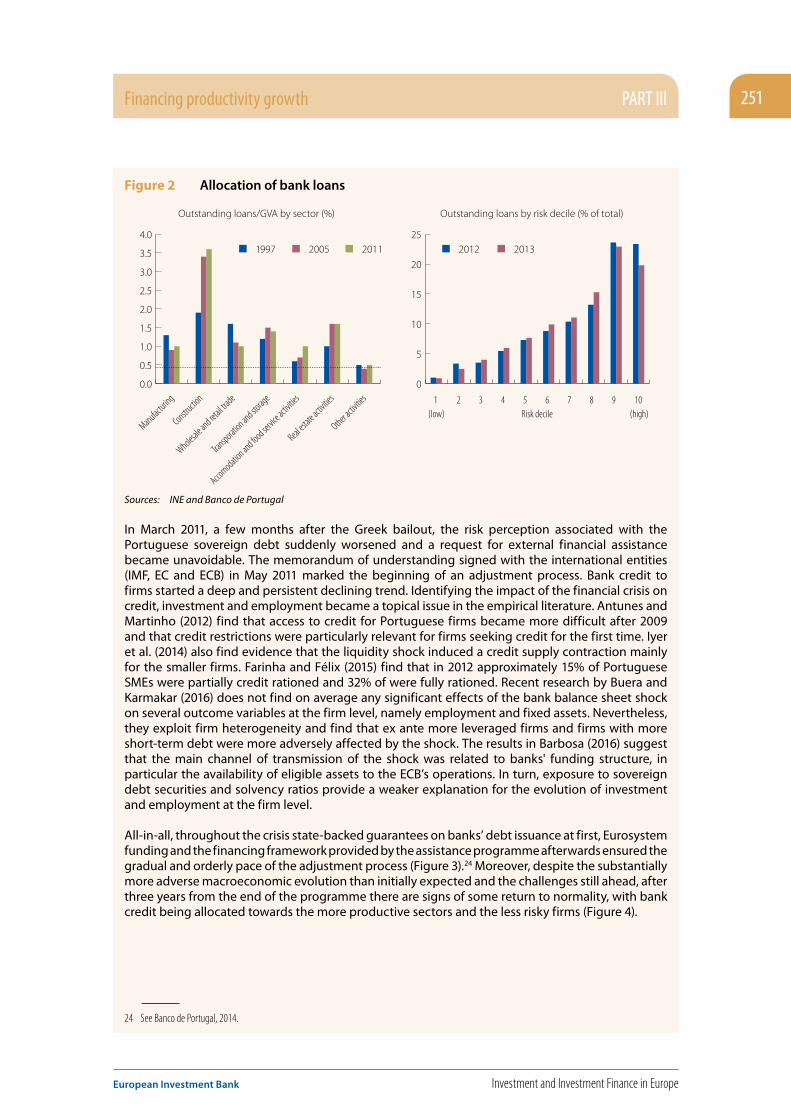
Financing productivity growth PART III 251
European Investment Bank Investment and Investment Finance in Europe
Figure 2 Allocation of bank loans
Manufacturing
Constructio
n
Wholesale a
nd retail
trade
Transporati
on and sto
rage
Accomodatio
n and food ser
vice act
ivities
Real est
ate act
ivities
Other activ
ities
Outstanding loans/GVA by sector (%)
2012 20131997 2005 2011
0
5
10
15
20
25
0.0
0.5
1.0
1.5
2.0
2.5
3.0
3.5
4.0
Outstanding loans by risk decile (% of total)
1 (low)
2 3 4 5 6 7 8 9 10 (high)Risk decile
Sources: INE and Banco de Portugal
In March 2011, a few months after the Greek bailout, the risk perception associated with the Portuguese sovereign debt suddenly worsened and a request for external financial assistance became unavoidable. The memorandum of understanding signed with the international entities (IMF, EC and ECB) in May 2011 marked the beginning of an adjustment process. Bank credit to firms started a deep and persistent declining trend. Identifying the impact of the financial crisis on credit, investment and employment became a topical issue in the empirical literature. Antunes and Martinho (2012) find that access to credit for Portuguese firms became more difficult after 2009 and that credit restrictions were particularly relevant for firms seeking credit for the first time. Iyer et al. (2014) also find evidence that the liquidity shock induced a credit supply contraction mainly for the smaller firms. Farinha and Félix (2015) find that in 2012 approximately 15% of Portuguese SMEs were partially credit rationed and 32% of were fully rationed. Recent research by Buera and Karmakar (2016) does not find on average any significant effects of the bank balance sheet shock on several outcome variables at the firm level, namely employment and fixed assets. Nevertheless, they exploit firm heterogeneity and find that ex ante more leveraged firms and firms with more short-term debt were more adversely affected by the shock. The results in Barbosa (2016) suggest that the main channel of transmission of the shock was related to banks' funding structure, in particular the availability of eligible assets to the ECB’s operations. In turn, exposure to sovereign debt securities and solvency ratios provide a weaker explanation for the evolution of investment and employment at the firm level.
All-in-all, throughout the crisis state-backed guarantees on banks’ debt issuance at first, Eurosystem funding and the financing framework provided by the assistance programme afterwards ensured the gradual and orderly pace of the adjustment process (Figure 3).24 Moreover, despite the substantially more adverse macroeconomic evolution than initially expected and the challenges still ahead, after three years from the end of the programme there are signs of some return to normality, with bank credit being allocated towards the more productive sectors and the less risky firms (Figure 4).
24 See Banco de Portugal, 2014.

PART III Financing productivity growth252
Investment and Investment Finance in Europe European Investment Bank
Figure 3 International financial flows (EUR bn)
Private foreign assets in PT (except Financial assistance and MRO)
Net private inflows
Private Portuguese assets abroad
-60
-40
-20
0
20
40
60
-60
-40
-20
0
20
40
60
-60
-40
-20
0
20
40
60
1997
1999
2001
2003
2005
2007
2009
2011
2013
-40
-30
-20
-10
0
10
20
30
40
-40
-30
-20
-10
0
10
20
30
40
1999
2001
2003
2005
2007
2009
2011
2013
Recourse to the Eurosystem
Net private inflows
Financial account
Financial assistance
Sources: Banco de Portugal
Figure 4 Bank credit to firms, by activity sector and risk profile (annual rates of change, %)
Construction and real estate activities
Euro area
Manufacturing
Core
2nd Quartile
3rd Quartile
1st Quartile (Less risk)
4th Quartile (More risk)
-15
-10
-5
0
5
10
15
01-2
010
07-2
010
01-2
011
07-2
011
01-2
012
07-2
012
01-2
013
07-2
013
01-2
014
07-2
014
01-2
015
07-2
015
01-2
016
01-2
010
07-2
010
01-2
011
07-2
011
01-2
012
07-2
012
01-2
013
07-2
013
01-2
014
07-2
014
01-2
015
07-2
015
01-2
016
-15
-10
-5
0
5
10
15
Sources: Banco de Portugal

Financing productivity growth PART III 253
European Investment Bank Investment and Investment Finance in Europe
ReferencesAcemoglu, D., Aghion, P., and Zilibotti, F. (2006). “Distance to Frontier, Selection, and Economic Growth”. Journal of the European Economic Association, 4(1), 37-74.
Acharya, V., Eisert, T., Eufinger, C., and Hirsch, C. (2016). “The Real Effects of the Sovereign Debt Crisis in Europe: Evidence from Syndicated Loans”. Available at SSRN 2612855.
Albareto G., and Finaldi Russo, P. (2012). ”Financial fragility and growth prospects: credit rationing during the crisis” (only in Italian). Banca d’Italia Occasional Papers 127.
Albertazzi, U., and Marcchetti, D. J. (2010). “Credit Supply, Flight to Quality and Evergreening: An Analysis of Bank-Firm Relationships after Lehman”. Banca d’Italia Working Paper No. 756.
Andrews, D., and Cingano, F. (2014). “Public policy and resource allocation: evidence from firms in OECD countries”. Economic Policy, 29, 253-296.
Antunes, A., and Martinho R. (2012). “Access to credit by non-financial firms”. Financial Stability Report, May 2012, Banco de Portugal.
Banco de Portugal (2014). “The ongoing adjustment process in the Portuguese economy”, Annual Report 2014.
Banerjee, A. V., and Dufflo, E. (2005). “Growth Theory through the Lens of Development Economics”. In P. Aghion, S. Durlauf, Handbook of Economic Growth (1 ed., Vol. 1, pp. 473-552). Elsevier.
Barbiero, F., Popov, A., and Wolski, M. (2016). “Misallocation of Investment in Europe: Debt Overhang, Credit Market Distress, or Weak Demand?”. CEPR Discussion Paper.
Barbosa, L. (2016). “Lending relationships and the real economy: evidence in the context of the euro area sovereign debt crisis”. mimeo.
Bartelsman, E. J., Haltiwanger, J., and Scarpetta, S. (2013). “Cross-Country Differences in Productivity: The Role of Allocation and Selection”. American Economic Review, 103(1), 305-334.
Bekaert, G., Harvey, C. R., Lundblad, C., and Siegel, S. (2007). “Global Growth Opportunities and Market Integration”. Journal of Finance, 62(3), 1081-1137.
Bernanke, B., and Gertler, M. (1989). “Agency Costs, Net Worth, and Business Fluctuations”. American Economic Review, 79(1), 14-31.
Bernanke, B., Gertler, M., and Gilchrist, S. (1999). “The Financial Accelerator in a Quantitative Business Cycle Framework”. Handbook of Macroeconomics. 1C, pp. 1341-1393. Elsevier Science.
Blanchard, O. (2007). “Adjustment within the euro: the difficult case of Portugal”. Portuguese Economic Journal, 6.
Bloom, D., Draca, M. and Van Reenen, J. (2011). “Trade Induced Technical Change? The Impact of Chinese Imports on Innovation, IT and Productivity”, CEP Discussion Paper No 1000.
Bloom, N., Sadun, R., and Van Reenen, J. (2016). “Management as a Technology?”. NBER Working paper No. 22327.
Bloom, D. and Van Reenen, J. (2010). “Why Do Management Practices Differ Across Firms and Countries?”, Journal of Economic Perspectives, 24, 203-224.
Bofondi M., Carpinelli, L. and Sette, E. (2013). “Credit supply during a sovereign debt crisis”. Banca d’Italia Working Paper No. 909.

PART III Financing productivity growth254
Investment and Investment Finance in Europe European Investment Bank
Bonaccorsi di Patti E., and Sette, E. (2016). “Did the securitization market freeze affect bank lending during the financial crisis: evidence from a credit register”. Journal of Financial Intermediation 25, 54-76.
Bond, S., Rodano, G. and Serrano-Velarde, N. (2015). “Investment dynamics in Italy: financing constraints, demand and uncertainty”, Banca d’Italia Occasional Papers 283.
Borio, C., Kharroubi, E., Upper, C., and Zampolli, F. (2016). “Labour Reallocation and Productivity Dynamics: Financial Causes, Real Consequences”. BIS Working Paper No. 534.
Bottero, M., Lenzu, S., and Mezzanotti, F. (2015). “Sovereign Debt Exposure and the Bank Lending Channel: Impact on Credit Supply and the Real Economy”. Banca d’Italia Working Paper No. 1032.
Bourgeon, P. (2016). “Financial Frictions and Allocative Efficiency”. EIB Working Paper No. 2016/5.
Boyd, J. H., and Prescott, E. C. (1986). “Financial intermediary-coalitions”. Journal of Economic Theory, 38, 211-232.
Bresnahan, T. and Trajtenberg, M. (1995). “General Purpose Technologies: Engines of Growth?”, Journal of Econometrics, 65, 83-108.
Buera, F. J., Jaef, R. N., and Shin, Y. (2015). “Anatomy of a Credit Crunch: From Capital to Labor Markets”. Review of Economic Dynamics, 18, 101-117.
Buera, F. J., Kaboski, J. P., and Shin, Y. (2011). “Finance and Development: A Tale of Two Sectors”. American Economic Review, 101, 1964-2002.
Buera, F., and Karmakar S. (2016). “Real effects of financial distress: the role of heterogeneity”. mimeo.
Caballero, R. J., Hoshi, T., and Kashyap, A. K. (2008). “Zombie Lending and Depressed Restructuring in Japan”. American Economic Review, 98(5), 1943-1977.
Cingano, F., Manaresi, F., and Sette, E. (2016). “Does Credit Crunch Investments Down? New Evidence on the Bank-lending Channel”. Review of Financial Studies.
Cette, G. and Lopez, J. (2012). “ICT Demand Behavior: An International Comparison”, Economics of Innovation and New Technology, Taylor and Francis Journals, 21, 397-410.
Cette, G., Lopez, J. and Mairesse, J. (2013). «Upstream Product Market Regulations, ICT, R&D and Productivity», NBER Working Paper 19488.
CompNet Task Force (2014). “Micro-based Evidence of EU Competitiveness: The CompNet Database”. NBB Working Paper Research 253.
CompNet Task Force (2015). “Assessing European Competitiveness: The New CompNet Micro-based Database”. NBB Working Paper Research 279.
Del Giovane, P., Eramo, G. and Nobili, A. (2011). “Disentangling demand and supply in credit developments: A survey-based analysis for Italy”. Journal of Banking and Finance 35 (10), 2719–2732.
Del Giovane, P., Nobili, A. and Signoretti, F.M. (2013). “Supply tightening or lack of demand: an analysis of credit developments during the Lehman Brothers and the sovereign debt crises”. Banca d’Italia Working Paper No. 942.
Dias, D., Robalo Marques, C. and Richmond C. (2015). “Misallocation and Productivity in the Lead Up to the Eurozone Crisis”. FRB International Finance Discussion Paper No. 1146.
Dias, D., Robalo Marques, C. and Richmond C. (2016). “Comparing misallocation between sectors in Portugal”. Banco de Portugal Economic Studies, vol. II, 1.

Financing productivity growth PART III 255
European Investment Bank Investment and Investment Finance in Europe
Disney, R., Haskel, J., and Heden, Y. (2003). “Restructuring and productivity growth in UK manufacturing”. Economic Journal, 113, 666-694.
EIB. (2015). Investment and Investment Finance in Europe: Investing in Competitiveness. Luxembourg.
Erosa, A., and Hidalgo Cabrillana, A. (2008). “On Finance as a Theory of TFP, Cross-industry Productivity Differences, and Economic Rents”. International Economic Review, 49(2).
Fagan, G. and Gaspar, V. (2007). “Adjusting to the euro”. Banco de Portugal, Working Paper, 2007-03.
Farinha, L. and Félix, S. (2015). “Credit rationing for Portuguese SMEs”. Finance Research Letters, 14, pp. 167-177.
Foster, L., Haltiwanger, J., and Syverson, C. (2008). “Reallocation, Firm Turnover, and Efficiency: Selection on Productivity or Profitability?”. American Economic Review, 98(1), 394-425.
Frankel, J. and Romer, D. (1999). “Does Trade Cause Growth?”, American Economic Review, 89, 379-399.
Gaiotti, E., (2013). “Credit availability and investment: Lessons from the ‘Great Recession’”. European Economic Review 59, 212–227.
Garicano, L., Lelarge, C. and Van Reenen, J. (2013). “Firm Size Distortion and the Productivity Distribution: Evidence from France”, NBER Working Paper 18841.
Gerter, M., and Gilchrist, S. (1994). “Monetary Policy, Business Cycles, and the Behavior of Small Manufacturing Firms”. Quarterly Journal of Economics, CIX(2).
Gertler, M., and Kyiotaki, N. (2010). “Financial Intermediation and Credit Policy in Business Cycle Analysis”. In B. M. Friedman, and M. Woodford (Ed.), Handbook of Monetary Economics. 3. Elsevier.
Gilchrist, S., Sim, J. W., and Zakrajsek, E. (2013). “Misallocation and Financial Market Frictions: Some Direct Evidence from the Dispersion in Borrowing Costs”. Review of Economic Dynamics, 16, 159-176.
Gobbi G., and Sette, E. (2015). “Relationship Lending During a Financial Crisis”. Journal of the European Economic Association 13 (3), 453-481.
Greenwood, J., and Jovanovich, B. (1990). “Financial Development, Growth, and the Distribution of Income”. Journal of Political Economy, 98, 1076-1107.
Haltiwanger, J., Jarmin, R. S., and Miranda, J. (2010). “Who Creates Jobs? Small vs. Large vs. Young”. NBER Working Paper No. 16300.
Helpman, E. (1981). “International Trade in the Presence of Product Differentiation, Economies of Scale, and Monopolistic Competition: A Chamberlin-Heckscher-Ohlin Model”, Journal of International Economics, 11, 305-340.
Helpman, E. (2004). “The Mystery of Economic Growth”, Harvard University Press.
Holmstrom, B., and Tirole, J. (1997). “Financial Intermediation, Loanable Funds, and the Real Sector”. Quarterly Journal of Economics, 112, 663-691.
Hopenhayn, H. (1992). “Entry, Exit and Firm Dynamics in Long Run Equilibrium”, Econometrica, 60 (5), 1127-1150.
Hsieh, C.-T., and Klenow, P. J. (2009). “Misallocation and Manufacturing TFP in China and India”. Quarterly Journal of Economics, 124(4), 1403-1448
Klette, T. and Kortum, S. (2004). “Innovating Firms and Aggregate Innovation.” Journal of Political Economy 112, 986-1018.

PART III Financing productivity growth256
Investment and Investment Finance in Europe European Investment Bank
Koch, W. (2014), “Bank-Based Versus Market-Based Finance as Appropriate Institution”, mimeo UQAM.
Krugman, P. (1980). “Scale Economies, Product Differentiation, and the Pattern of Trade”, American Economic Review, 70, 950-959.
Melitz, M. (2003). “The Impact of Trade on Intra-Industry Reallocations and Aggregate Industry Productivity”, Econometrica, 71, 1695-1725.
Nunn, N. and Trefler, D. (2010). “The Structure of Tariffs and Long-Term Growth,” American Economic Journal: Macroeconomics, vol. 2(4), pages 158-94.
Solow, R. (1956). “A Contribution to the Theory of Economic Growth”, Quarterly Journal of Economics, 70, 65-94.
Syverson, C. (2004). “Market Structure and Productivity: A Concrete Example”, Journal of Political Economy, 112, 1181-1222.
Vandenbussche, J., Aghion, P. and Meghir, C. (2006). “Distance to Frontier, Growth, and the Composition of Human Capital”, Journal of Economic Growth, 11, 97-127.
Wacziarg, R. (2001). “Measuring the Dynamic Gains from Trade”, The World Bank Economic Review, 15, 393-429.

257
European Investment Bank Investment and Investment Finance in Europe

258
Investment and Investment Finance in Europe European Investment Bank

259
European Investment Bank Investment and Investment Finance in Europe
Part III
Financing productivity growth
Chapter 7
Financial Frictions and Sources of Finance for European Firms1
1 This paper was prepared for the 2016 EIB Annual Conference by Şebnem Kalemli-Özcan (University of Maryland, CEPR and NBER). The author thanks Di Wang for providing superb research assistance.

260
Investment and Investment Finance in Europe European Investment Bank

Financing productivity growth PART III 261
European Investment Bank Investment and Investment Finance in Europe
Financial Frictions and Sources of Finance for European Firms
Chapter at a glance
• This paper documents the evolution of sources of financing for non-financial firms in Europe and the effects of changes in these financing sources on firms’ real outcome dynamics before and after the European crisis.
• I rely on unique pan-European firm-level data that encompasses the balance sheets and income statements of privately held firms, including a large and representative number of small and medium-sized enterprises (SMEs).
• I find that firms in the euro area accumulated more financial debt than non-euro area firms during the 2000s. This debt came in the form of short-term bank loans and long-term debt, whereas other forms of financing such as equity and retained earnings increased only slightly during the deleveraging process of the crisis years.
• These results are mainly driven by SMEs in the periphery countries, where such firms financed themselves more with loans and with trade credit. Long-term debt is accumulated relatively more by large firms in the core countries.
• In terms of investment, profits and sales, firms that accumulated more debt have experienced declining investment and sales both before and after the crisis, whereas firms that financed themselves with trade credit, equity and retained earnings have experienced the opposite outcome.
• Profits have a negative correlation with trade credit and a positive correlation with debt before the crisis but do not correlate with any form of financing during the crisis.

PART III Financing productivity growth262
Investment and Investment Finance in Europe European Investment Bank
7.1. IntroductionThe recent global financial crisis has renewed attention on the macroeconomic effects of changes in financial market conditions. One important link between financial markets and the real economy is through firms’ financing of their productive activities via external funds obtained through financial markets. A common feature of the global financial crisis on both sides of the Atlantic is the decline in credit to non-financial corporations. This decline in external finance to NFCs is also accompanied by a decline in investment. While investment has recovered to some extent in the US and Japan, this is not the case in Europe (see Figure 1). To understand these differences in investment patterns and hence the differences in the speed of recovery from the recession, we need to understand the factors that led to the decline in credit to firms in Europe. These factors will relate to both the reduced supply of finance by banks since many banks collapsed and needed to be bailed out, but also to the reduced demand for credit by firms given the lack of good investment opportunities during the recession. The economic uncertainty is also a big contributing factor to the decline in credit demand since households have reduced their demand for goods and services produced by firms.
Figure 1 Corporate Investment Gross Investment by Non-Financial Corporations (% of GDP, Year 2000 = 1)
2012
2000
2001
2002
2003
2004
2005
2006
2007
2008
2009
2010
2011
0.7
0.8
0.9
1.0
1.1
European Union Japan United States
Source: Eurostat, Cabinet Office, and Bureau of Economic Analysis.
The existing explanations for low investment in Europe have so far emphasised the role of low aggregate demand and financial frictions. Financial frictions can operate via banks, where banks’ balance sheet problems prevent them from lending to any borrower, or via firms, where firms with deteriorating balance sheets become risky borrowers. I would argue that the capital structure of firms’ balance sheets and how this structure has changed over time in terms of different financing sources is key to explaining the financial frictions operating via firms’ balance sheets. To put it differently: if the sluggish recovery were all about low consumer demand and/or weak banks, we would not see differences in investment and in speeds of recovery from the recession across different countries, since these factors are common to several countries in general. As I show in this paper, firm heterogeneity in terms of firm size and how firm size is correlated with firm financing behaviour over time has important implications in terms of explaining the differences in the performance of the aggregate economy for different countries.
I start by documenting the changes in the sources of financing for NFCs in Europe, using a detailed pan-European firm-level dataset. Without an understanding of how firms’ balance sheet structures for liabilities and assets change by firm size and over time, we cannot have an understanding of the different patterns of investment by different sized firms that finance themselves differently. Focusing on European Union countries and mostly small privately held non-financial firms, as opposed
Financing productivity growth PART III 263
European Investment Bank Investment and Investment Finance in Europe
to the literature that has so far only focused on large listed firms, this paper can shed light on pressing policy issues such as which firms were unable to replace debt with equity financing in the midst of the crisis when weak banks cut the supply of credit.2
There is an active body of literature on the cyclical properties of debt versus equity financing. This literature focuses exclusively on the US using either aggregate data from the US Federal Reserve Flow of Funds database or firm-level data from the universe of listed firms as reported in Compustat. This literature has so far produced a puzzle. While both firm and issuance-level data suggest pro-cyclical equity financing and counter-cyclical debt financing, aggregate data-based papers suggest the opposite. Jermann and Quadrini (2006, 2012) document counter-cyclical equity financing using flow-of-funds data. Covas and Den Haan (2012) show pro-cyclical equity issuance and they model this with exogenous, counter-cyclical equity issuance costs. This is a reasonable explanation since Hennessy and Whited (2007) show that external financing costs differ during booms and recessions and also by firm size. Covas and Den Haan (2012) show that the largest listed firms have the opposite financing pattern to smaller listed firms over business cycles. In particular, they find that both debt and equity financing are pro-cyclical for listed US firms except for the top 1% of firms by asset size, which exhibit counter-cyclical equity issues. While the number of the top 1% of firms is small, their substantial size affects aggregate series, which explains the results of Jermann and Quadrini (2006, 2012).3 As a result, aggregate data will mask important heterogeneity in terms of the cyclical properties of firms’ financing behaviour, which is critical in understanding the differences in aggregate investment patterns.
This issue is even more important in Europe. We do not have any evidence on the cyclical properties of equity versus debt financing in Europe, especially by firm size. Europe is very different to the US in many ways. First of all, small firms not only make up a big chunk of the economy but are also responsible for a big chunk of aggregate output. Given the fact that this is the more financially constrained group, Europe provides a perfect testing laboratory for the effects of financial frictions on the macroeconomy. According to the European Commission (2015), more than 98% of all non-financial firms in Europe are SMEs and account for 60% of value added and 67% of employment. Hence in Europe, SMEs matter a lot for aggregate investment and growth. If we wish to understand the effect of financial frictions on the macroeconomy, we have to understand the behaviour of SME financing over time in Europe.
Secondly, Europe is more of a bank-based system than a capital market-based system as in the US. From the supply side, SMEs also account for a big proportion of bank loans. New loans to SMEs represented 30% of all new loans to NFCs during the 2000s, and this figure was 40% for Italy and Spain.4 Of course one issue is why do SMEs in Europe not tap other sources of financing like in the US, such as angel investors and venture capitalists. SMEs in Europe are financed by banks three times more than their counterparts in the US.5 The consensus explanation for this problem is the lack of well developed equity markets in Europe compared to the US.
I find that firms in the euro area accumulated more financial debt than those in the non-euro area during the boom years. This result resonates with the large body of literature that shows the enhancing effects of the removal of currency risk on capital flows and increased borrowing in the euro area countries after 1999. As I demonstrate, this debt accumulation came in the form of short-term bank loans and long-term debt in these countries, whereas other forms of financing such as equity and retained earnings have decreased during normal times and increased only slightly during the deleveraging process of the crisis years. Hence for the euro area countries debt financing is pro-cyclical to a certain extent, although the deleveraging process is not yet complete. Equity financing is counter-cyclical, although the increase in equity financing during the recession years has been modest.
2 The database covers all countries in the European Union except Cyprus and Malta. Data quality for Romania before 2009 is poor and fails to convey pre- and post-crisis variation. Romania is therefore excluded from the sample.
3 Begenau and Salomao (2015) also show that in booms small firms acquire more funds through equity than through debt which is reasonable since small firms are more financially constrained.
4 See Navaretti, Calzolari, and Pozzolo (18 November 2015).5 See Watson (2 November 2015).

PART III Financing productivity growth264
Investment and Investment Finance in Europe European Investment Bank
These results are mainly driven by small and medium-sized firms (SMEs), as such firms financed themselves more with loans and trade credit during the boom years compared to large firms. Long-term debt is accumulated more by large firms both in Euro and non-euro area countries. These results suggest the importance of financial frictions in European capital markets, where small firms have a harder time in accessing long-term bank finance and equity finance so they either use trade credit or short-term bank loans to finance themselves. Gopinath, Kalemli-Özcan, Karabarbounis, and Villegas-Sánchez (2016) show that small firms are more financially constrained than larger firms in the periphery countries of the European Union, which led to the misallocation of capital to lower productivity firms and an aggregate TFP decline in the manufacturing sector during the boom years in Southern European countries.
In terms of investment, profits and sales, firms that accumulated more debt experienced declining investment and sales both before and after the crisis, whereas firms that financed themselves with trade credit, equity and retained earnings experienced the opposite outcome. This result hints at the importance of debt overhang on investment and sales.6 Profits have a negative correlation with trade credit and equity during normal times (a typical finding in the literature) and a positive correlation with debt before the crisis, but do not correlate with any form of financing during the crisis.
The paper proceeds as follows. Section 2 describes the literature. Section 3 presents the data. Section 4 shows the descriptive patterns in the cyclical properties of different forms of financing. Section 5 presents investment, sales growth and profit regressions as a function of changes in the sources of financing. Section 6 concludes with policy implications.
7.2. Literature Firms’ financial positions are important amplification mechanisms for understanding business cycle fluctuations. Bernanke and Gertler (1989) develop a neoclassical model and show that business downturns reduce borrowers’ net worth, raise agency costs of financing, and lower real capital investment, which amplifies the downturn (vice versa for upturns). The term “financial accelerator" has been used to refer to the mechanism whereby adverse shocks to the economy may be amplified by worsening financial market conditions (see Bernanke, Gertler, and Gilchrist, 1999). Another seminal work by Kiyotaki and Moore (1997) models a dynamic economy in which borrowers’ credit limits are affected by the prices of the collateralised assets on their balance sheet, and at the same time these prices are affected by the size of the credit limits. The dynamic interaction between credit limits and asset prices turns out to be a powerful transmission mechanism by which the effects of shocks are amplified.
Finance literature investigates what determines firms’ balance sheet structures in terms of risk and return trade-offs. Macro-literature argues that, in the presence of financial frictions, an important determinant of firms’ capital structure choices are macroeconomic conditions, since financing decisions depend on the business cycle through its effect on defaults. Korajczyk (2003) documents the fact that target leverage is counter-cyclical for relatively unconstrained firms, but pro-cyclical for relatively constrained firms. Jermann and Quadrini (2012) show that financial frictions and shocks that affect firms’ ability to borrow are important for macroeconomic fluctuations. The tightening of firms’ financing conditions has significant real effects as it contributes to the sharp downturn in GDP and labour.
Covas and Den Haan (2012) develop a model in which firms finance investment needs with both debt and equity. Since debt financing increases the likelihood of default, firms have an incentive to issue equity in order to avoid excessive leverage when they issue debt. Begenau and Salomao (2015) build a model in which small firms issue debt and equity pro-cyclically for a similar reason as in Covas and Den Haan (2012). However, the largest firms find debt financing much cheaper during expansion due to the lower credit constraints that these firms face.
6 For a detailed study on the effect of debt overhang on corporate investment see Kalemli-Özcan, Laeven and Moreno (2016), who use matched firm-bank data to separate the firm debt overhang effect on investment from the “weak bank, low credit supply” effect.
Financing productivity growth PART III 265
European Investment Bank Investment and Investment Finance in Europe
A separate but related body of work studies how the supply of finance varies with economic conditions, in particular shocks to the financial institutions. Beginning with the work of Peek and Rosengren (1997), several papers have studied whether bank supply shocks halt credit provision in the domestic economy. See, for example, Kashyap and Stein (2000), Khwaja and Mian (2008), Paravisini, Rappoport, Schnabl, and Wolfenzon (2015), Schnabl (2012) and Jiménez, Ongena, Peydró, and Saurina (2012). Kashyap, Stein, and Wilcox (1993) highlight the change in firms’ composition of financing when they switched to commercial paper issuance from bank lending as a result of tighter credit conditions. A recent version of this early idea is the work by Adrian, Colla, and Shin (2012), which criticises the use of aggregate flow-of-funds data. They show, using micro-level data on loan and bond issuance, an increase in bond financing when there is a reduction in bank loan supply.
The evidence on firm-level real outcomes, such as investment and sales, is sparse. Duchin, Ozbas, and Sensoy (2010) investigate the effect of the 2008 crisis on the corporate investment of US listed firms. Their paper shows that firms with more collateral reduce investment less. Almeida, Campello, Laranjeira, Weisbenner et al. (2012) show that the investment outcomes of firms differed in their long-term debt maturity structure during the 2008 financial crisis. Acharya, Eisert, Eufinger, and Hirsch (2015) investigate the effects of a shock to GIIPS banks on investment by firms that borrow from GIIPS banks. Kalemli-Özcan, Kamil, and Villegas-Sánchez (2016) quantify the effect of the lending channel on investment simultaneously with the effect of the balance sheet channel on investment, since they trace the effect of shocks to banks on investment by firms that borrow from those banks at the same time as the effect of shocks to firms’ own balance sheets. Finally, Kalemli-Özcan, Laeven, and Moreno (2016) match a pan-European firm-level dataset to banks and investigate the effect of firms’ debt overhang on their low investment in the aftermath of the crisis, taking account of the fact that these firms may have also been borrowing from weak banks. They find that firms that entered the crisis with higher levels of debt ended up reducing investment more in the aftermath of the crisis. Firms who borrowed from weak banks also reduced their investment more. These authors define weak banks as those with high exposures to sovereign debt, especially the debt of periphery countries.
7.3. Description of the DataOur data comes from the ORBIS-AMADEUS database, which is compiled by Bureau van Dijk Electronic Publishing (BvD). Administrative data at the firm level are initially collected by local Chambers of Commerce through business registers and, in turn, relayed to BvD. BvD complements the data via 40 different information providers. In Europe company reporting is a regulatory requirement in most countries through business registers and therefore firm coverage is relatively good.
The dataset contains financial accounting information from detailed harmonised balance sheets, income statements, and profit and loss accounts of firms. Roughly 99% of companies in the dataset are private. Our sample is mainly composed of small and medium-sized enterprises with fewer than 250 employees, and these firms account for almost 70% of the value added and employment in Europe, both in the manufacturing sector and in the aggregate economy.7 This crucially differentiates our data from other datasets commonly used in the literature such as Compustat for the United States, Compustat Global and Worldscope, which mainly contain information on large listed companies.
This paper will focus on financing variables reported on firms’ balance sheets (see Figure 3). The main financial variables used in the analysis are equity, retained earnings, bank loans, trade credit, long-term debt, total liabilities and assets. Detailed definitions of variables are listed in Table 7. I transform nominal financial variables to real using CPI with a 2005 base and converting to dollars using the end-of-year 2005 dollar/national currency exchange rate. The dataset presents detailed sector classification. Using this classification, I drop financial firms and government-owned firms, and use firms (NFCs) in all the other sectors.
7 See Kalemli-Özcan, Sørensen, Villegas-Sánchez, Volosovich, and Yeşiltaş (2015) for extra information on AMADEUS data.

PART III Financing productivity growth266
Investment and Investment Finance in Europe European Investment Bank
Tables A1 – A6 show the great coverage of the data since these tables report the percentage of missing observations for each financing item in the balance sheet.8 It is clear that there are few missing observations in few countries for the key financial variables that we are interested in.
Table 8, 9 and 10 report the descriptive statistics. It can immediately be seen that the standard deviations are big for each group of countries: euro area and non-euro area. The retained earnings category has a higher average across firms in the non-euro area, whereas the average levels of trade credits are generally similar between the two groups of countries.
7.4. Descriptive Results on Dynamics of Financing
Figure 2 shows an obvious increase in corporate debt to GDP for the countries in the EU, compared to the US and Japan. This is based on aggregate data and does not reveal which type of corporates has driven this increase. To be able to understand this we need to investigate the firms’ balance sheet structure and dynamic changes to this structure at the firm level.
Figure 2 Corporate Debt Debt of Non-Financial Corporations (% of GDP, Year 2000 = 1)
2012
2000
2001
2002
2003
2004
2005
2006
2007
2008
2009
2010
2011
0.7
0.8
0.9
1.0
1.1
1.2
1.3
European Union Japan United States
Source: Organisation for Economic Co-operation and Development, and World Bank Organization.
Figure 3 shows the typical balance sheet structure of an NFC. Firms’ investments can be funded by both short and long-term external finance (debt and equity), and also by internal finance such as cash and retained earnings and intra-group debts. Cash and intra-group debts are reported under other current liabilities. The literature tends to model investment finance as only long term, but in reality this may not be the case. For external finance, firms can use short-term bank loans (short term refers to a maturity of less than 1 year at the loan origination) and trade credit, which is debt to suppliers and contractors. They can also use more long-term finance such as long-term debt (any financial obligation that has a maturity of longer than a year) and trade debt, which will be booked under other non-current liabilities. Note that trade credit that is short-term is reported under current liabilities but accumulated trade debt can be booked under non-current liabilities.
8 Tables are available in the online appendix to this chapter.
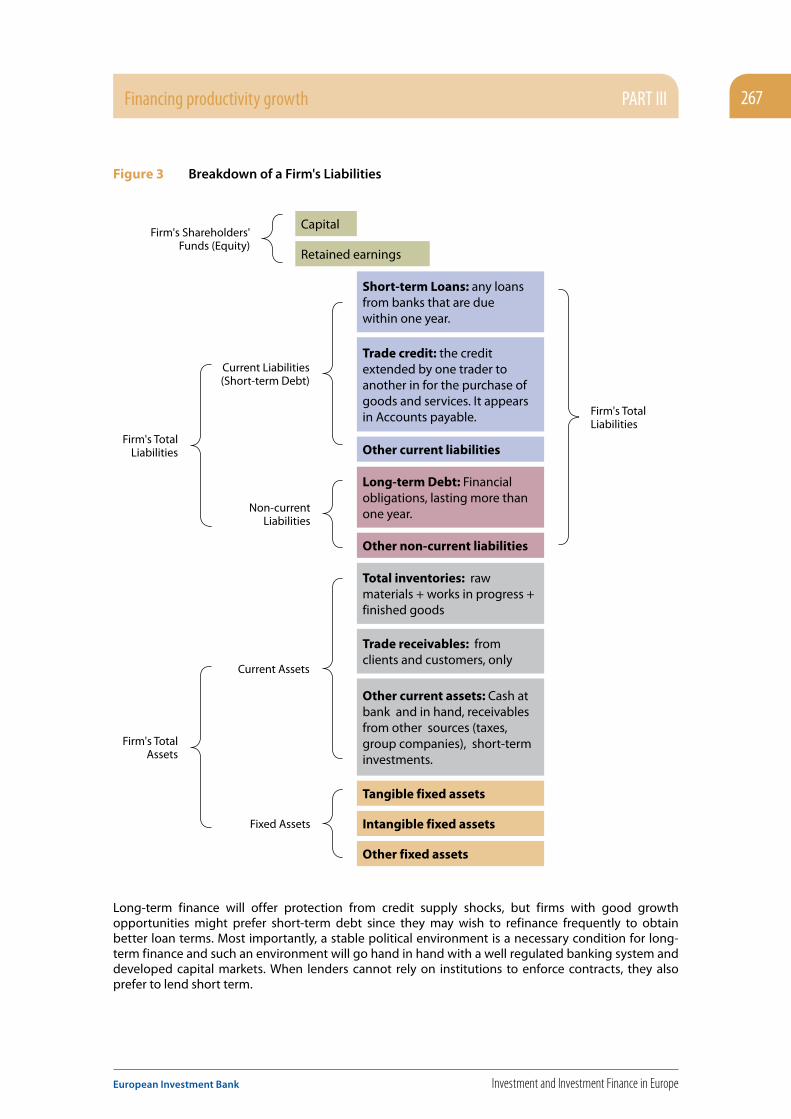
Financing productivity growth PART III 267
European Investment Bank Investment and Investment Finance in Europe
Figure 3 Breakdown of a Firm's Liabilities
Capital
Short-term Loans: any loans from banks that are due within one year.
Trade credit: the credit extended by one trader to another in for the purchase of goods and services. It appears in Accounts payable.
Other current liabilities
Other non-current liabilities
Tangible fixed assets
Intangible fixed assets
Other fixed assets
Total inventories: raw materials + works in progress + finished goods
Trade receivables: from clients and customers, only
Other current assets: Cash at bank and in hand, receivables from other sources (taxes, group companies), short-term investments.
Long-term Debt: Financial obligations, lasting more than one year.
Retained earnings
Firm's Shareholders' Funds (Equity)
Non-current Liabilities
Fixed Assets
Current Liabilities(Short-term Debt)
Firm's Total Liabilities
Firm's Total Liabilities
Firm's Total Assets
Current Assets
Long-term finance will offer protection from credit supply shocks, but firms with good growth opportunities might prefer short-term debt since they may wish to refinance frequently to obtain better loan terms. Most importantly, a stable political environment is a necessary condition for long-term finance and such an environment will go hand in hand with a well regulated banking system and developed capital markets. When lenders cannot rely on institutions to enforce contracts, they also prefer to lend short term.
PART III Financing productivity growth268
Investment and Investment Finance in Europe European Investment Bank
Any equity financing will be booked under capital or retained earnings, as shown in Figure 3, where, in the case of private firms, such financing can come from private equity, angel investors, venture capitalists or other equity investors including foreign investors. Balance sheet data will not provide details on these. We would also not know from balance sheet data exactly what type of finance has financed what type of investment, since balance sheet data constitutes regulatory/voluntary reporting depending on the country and not a survey that asks a precise question on investment finance. The advantage of balance sheet data is that it is administrative and also longitudinal, as opposed to surveys where response rates can be low and most of the time not the same set of firms are followed over time.
The key point here is to understand, first and foremost, the behaviour of different financing sources over time as reported on balance sheets, before linking these dynamic changes in the balance sheet structure to changes in firms’ real outcomes over time.9 This will have the advantage of capturing direct shocks to firms’ balance sheets and hence the impact of financial frictions on firms’ investment and sales/profits.
Figure 4 plots secured debt (financial debt) for two groups of countries in four panels. This debt is the sum of short-term loans and long-term debt as a ratio to total liabilities, so this ratio is only composed of the firms’ interest-bearing financial obligations to financial intermediaries, both long term and short term, that are secured by collateral. In the top two panels, I plot the “aggregate ratio” in levels on the left and normalised by first year (2000) on the right, each by country groups, euro area and non-euro area. The aggregate ratio is calculated by adding up all short-term loans and long-term debt (financial debt) of the firms in the countries belonging to each country group and dividing by the sum of total liabilities. The bottom two panels plot the average ratio, that is the average of the ratios of all firms in these countries. The figures make it very clear that aggregate behaviour will be driven by large firms and average behaviour by small firms, and hence the two can deviate from each other if small and large firms have different balance sheet structures that vary over time differentially.
9 In most European countries, firms have to report full balance sheets regardless of their size.

Financing productivity growth PART III 269
European Investment Bank Investment and Investment Finance in Europe
Figure 4 Financial Debt/Total Liabilities, Evolution by Country Groups
Normalised Aggregate RatioAggregate Ratio
0.0
0.1
0.2
0.3
0.4
0.5
2000
2001
2002
2003
2004
2005
2006
2007
2008
2009
2010
2011
2012
0.0
0.2
0.4
0.6
0.8
1.0
1.2
1.4
1.6
1.8
2.0
2000
2001
2002
2003
2004
2005
2006
2007
2008
2009
2010
2011
2012
Normalised Average RatioAverage Ratio
Euro areaNon-euro area
Euro areaNon-euro area
Euro areaNon-euro area
Euro areaNon-euro area
0.0
0.1
0.2
0.3
0.4
0.5
2000
2001
2002
2003
2004
2005
2006
2007
2008
2009
2010
2011
2012
0.0
0.2
0.4
0.6
0.8
1.0
1.2
1.4
1.6
1.8
2.0
2000
2001
2002
2003
2004
2005
2006
2007
2008
2009
2010
2011
2012
According to the normalised ratios, there is a 60% increase in financial debt of NFCs in the euro area countries. This is much less in the non-euro area countries. In fact there is a slight decreasing tendency over time in the financial debt of those countries. 40% of aggregate total liabilities are represented by financial debt in the euro area, whereas for the average firm, this figure is around 20-25%.
Figure 5 plots major components of the balance sheet as shown in Figure 3, as a ratio to total liabilities if the component is a liability and as a ratio to total assets in the case of retained earnings and equity financing. These are ratios calculated on the basis of average firm-level data. I plot normalised ratios to get a better sense of time changes. The large increase over the boom years came in the form of bank loans and long-term debt for the euro area countries. In the non-euro area countries, however, this large increase is due to the increased share of other current liabilities financing, which mainly includes intra-group debt and is hence akin to trade credit. In the non-euro area countries, there is also an increase in retained earnings for the average firm right before the crisis. There is a dramatic collapse in retained earnings in the non-euro area countries during the crisis. It is not clear why this is the case, but since these countries are not subject to fiscal austerity programmes it is likely that firms smooth out the crisis shock using their savings. There is also a decline, though not as dramatic, in the average firm equity among these countries, which might be driven by the same considerations.

PART III Financing productivity growth270
Investment and Investment Finance in Europe European Investment Bank
Figure 5 Normalised Average Ratios by Country Group (averages of firm-level ratios and normalized at first year)
Trade Credit/Total LiabilitiesShort-term Loans/Total Liabilities
0.5
0.6
0.7
0.8
0.9
1.0
1.1
1.2
1.3
1.4
1.5
2000
2001
2002
2003
2004
2005
2006
2007
2008
2009
2010
2011
2012
0.5
0.6
0.7
0.8
0.9
1.0
1.1
1.2
1.3
1.4
1.5
2000
2001
2002
2003
2004
2005
2006
2007
2008
2009
2010
2011
2012
Euro areaNon-euro area
Euro areaNon-euro area
Long-term Debt/Total LiabilitiesOther Current Liabilities/Total Liabilities
0.4
0.6
0.8
1.0
1.2
1.4
2000
2001
2002
2003
2004
2005
2006
2007
2008
2009
2010
2011
2012
0.5
1.0
1.5
2.0
2.5
2000
2001
2002
2003
2004
2005
2006
2007
2008
2009
2010
2011
2012
Euro areaNon-euro area
Euro areaNon-euro area
Retained Earnings/Total AssetsEquity/Total Assets
0.5
0.6
0.7
0.8
0.9
1.0
1.1
1.2
1.3
1.4
1.5
2000
2001
2002
2003
2004
2005
2006
2007
2008
2009
2010
2011
2012
0.0
0.5
1.0
1.5
2000
2001
2002
2003
2004
2005
2006
2007
2008
2009
2010
2011
2012
Euro areaNon-euro area
Euro areaNon-euro area
Figure 6 and 7 (in the Appendix) investigate the role of firm size in detail. Following Eurostat’s official definition, I define firms with 1 to 249 employees as an SME and firms with 250 and more employees as large. Each row plots the normalised average ratio for a given financing item for Euro and non-euro area countries in the respective columns. Within each window I separate out SMEs and large firms. The key result is that SMEs in euro area countries increased loans and trade credit forms of financing during the boom years whereas SMEs in the non-euro area countries preferred other current liabilities as their key
Financing productivity growth PART III 271
European Investment Bank Investment and Investment Finance in Europe
financing option. As shown in Figure 7, long-term debt has increased for the average firm in the euro area countries for both the average SME and average large firm. Equity and retained earnings, on the other hand, slightly increased especially after the crisis for the average SME in the euro area countries. In the non-euro area countries, the average SME increased both equity and retained earnings during the boom years but these financing options quickly disappeared during the recession for SMEs in these countries.
It is worth noting that core and periphery countries in the euro area behave quite differently. Figures 8 to 11 (in the Appendix) break down the group of euro area countries in Figures 4 to 7 into the groups of core and periphery. Figure 8 shows that the substantial increase in the financial debt of NFCs in the euro area countries around the year 2005 was largely driven by the rapid accumulation of financial debt in the core countries. However, this debt ratio has been steadily increasing in the periphery countries from 20% to 30% while in the core countries it has been declining since 2007. This may reflect the attractiveness of risk premiums offered by peripheral markets.
Figure 9 plots major components of the balance sheet grouped by core, periphery and non-euro area countries. Compared with Figure 4, it shows that the increase of bank loans and trade credit over the boom years in the euro area countries all came from the periphery countries. The core countries even witnessed a decrease in these two types of short-term liability. In contrast, the core countries experienced a large increase in long-term debt in the boom years. This difference in debt maturities may be due to the low issuing costs of long-term debt in the core countries.
Figures 10 and 11 reveal how the dimension of firm size drives the patterns observed in Figure 9. In the periphery countries, SMEs contribute to the large increase in the share of bank loans and trade credit, and the substantial decrease in the share of other current liabilities in these countries. However, in the core countries, the increase in the share of long-term debt comes more from large firms than SMEs. The dip in equity and retained earnings’ shares in total assets during the boom years was driven by SMEs in both groups, especially in the core countries.
7.5. Regression Analysis: Investment, Sales, Profit Dynamics
7.5.1. Regression MethodologyThe previous section showed that there are important differences in the time paths of different sources of financing and that these differences also vary by firm size. To understand these differences in investment and other real outcome dynamics across firm types, financing sources and countries better, I run a standard investment regression, using our country-year-firm panel dataset, as a function of firms’ financing sources. I also look at the effect of these financing sources and the dynamic changes in them on the firms’ sales and profits. I run:
Yict
= αi+ ω
ct + β
1Sales Growth
ic,t-1 + β
2Size
ic,t-1 + β
3
Debt
Total Assets ic,t-1
+ εict
where αi is a firm-specific fixed effect and ω
ct is a country-year fixed effect and absorbs most of the
country-wide recession and fall in demand. Sales growth is a standard variable that captures the growth opportunities of the firm. Notice that I cannot use a Tobin Q measure here, which is another growth opportunity variable, since this variable can only be calculated for listed firms and listed firms are only 1% of our sample. The size of the firm is measured with log (total assets) and the ratio of debt to total assets measures firm indebtedness, where I will use different financing sources from firms’ balance sheets for this variable.

PART III Financing productivity growth272
Investment and Investment Finance in Europe European Investment Bank
Y will be the ratio of investment to capital, Sales Growth, and the ratio of profits to capital in three different sets of regressions I run. I measure capital, K, with tangible fixed assets and investment as a ratio of the change in tangible fixed assets to capital, K. Sales Growth is measured as the change in log Sales.
I also run this regression by interacting all the variables with a Crisisct
dummy, where this dummy takes a value of one during the crisis years of 2008 and after depending on when each country enters the recession (it is a country-time specific crisis dummy).10 This regression will help us to understand whether the effect of financing resources on investment, profits and sales differs before and after the crisis and hence can inform us on the nature of the financial frictions. Hence I run:
Yict
= αi+ ω
ct + β
1Sales Growth
ic,t-1 + β
2 Sales Growth
ic,t-1 xCrisis
ct + β
3Size
ic,t-1 xCrisis
ct + β
4
Debt
Total Assets ic,t-1
+ β5
Debt
Total Assets ic,t-1
xCrisisct
+ εict
7.5.2. ResultsTable 10 in the Appendix presents descriptive statistics for the variables used in our regression. There is a high degree of variation in all our variables. The countries in the regression sample are: Austria, Belgium, Bulgaria, Croatia, Czech Republic, Denmark, Estonia, Finland, France, Germany, Greece, Hungary, Ireland, Italy, Latvia, Lithuania, Luxembourg, Netherlands, Poland, Portugal, Slovakia, Slovenia, Spain, Sweden, United Kingdom.
For most variables I have around 26 million firm-year observations with the exception of profit, a much less well reported variable on the balance sheet (since it is actually from the income statement and a flow variable, as opposed to the stock variables on the balance sheet).
Table 1 shows the results of the regression in equation (1). As expected, sales growth and investment are positively correlated and size (measured by log assets) and investment are negatively correlated. So firms with higher growth opportunities invest more and larger firms invest less. These results are standard in the literature.
Column (1) shows the results when the total debt to capital ratio is added as a regressor, and each additional column shows the effect of another form of debt/savings to gauge the effect of different forms of financing on investment. Each type of financing is positively related to investment, except bank loans and total debt. The largest positive economic impact is from equity, where a 1% increase in the equity to total assets ratio increases the investment ratio by 0.43 percentage points. Given the large standard deviation of equity, the effect is sizeable.
10 When sales growth is on the left hand side instead of the investment to capital ratio, I remove sales growth from the right hand side of the regression.

Financing productivity growth PART III 273
European Investment Bank Investment and Investment Finance in Europe
Table 1 Net investment/Capital, All Firms Sample
Dependent variable: (Net investment/Capital)t
(1) (2) (3) (4) (5)
Independent variable
Total Debt Trade Credit Loans Equity Retained Earnings
Sales Growtht−1
0.0916*** 0.0898*** 0.0894*** 0.0892*** 0.0870***(55.26) (54.08) (53.80) (51.35) (50.11)
Sizet−1
-0.687*** -0.663*** -0.662*** -0.686*** -0.719***(-249.45) (-242.46) (-242.09) (-236.27) (-242.34)
Total Debtt−1
-0.436***(-107.75)
Trade Creditt−1
0.176***(29.07)
Loanst−1
-0.452***(-58.38)
Equityt−1
0.430***(86.48)
Retained Earningst−1
0.427***(90.35)
Observations 15,729,901 15,645,178 15,641,081 14,380,747 14,373,344R2 0.22 0.22 0.23 0.23 0.23Firm FE yes yes yes yes yes
t statistics in parentheses. Clustered errors at the firm level. Country-sector-year fixed effects are controlled.Notes: Net investment is the % annual change in total fixed assets, at constant 2005 dollars. Right hand side variables are
lagged with respect to net investment. Total Debt, Trade Credit, Loans, Equity and Retained Earnings are short names for Total Liabilities/Total Assets, Trade Credit/Total Assets, Short-term Loans/Total Assets, Equity/Total Assets and Retained Earnings/Total Assets respectively. Sales Growth is logarithmic change in real sales. Size is log(Total Assets).
*p<0.10,**p<0.05,***p<0.001
Since I use firm fixed effects, I identify from within variation that consists of changes in firm level investment and changes in the sources of financing over time. Country-sector-year effects control for all the policy changes and also aggregate demand fluctuations at country-sector-year level. Hence I am very well positioned to evaluate the effect of the crisis conditional on aggregate demand fluctuations and industry-level demand fluctuations and using the crisis as a shock to firms’ balance sheets, i.e. their financing sources.
Table 2 does exactly this by reporting results for the regression equation (2). The interesting result of this table is the fact that the effect of all sources of financing has smaller magnitudes during the crisis, meaning the total effect of different sources of financing during the crisis is still similar to their normal time effect in terms of their sign but smaller in magnitude. Hence, the total effect of all the variables is similar to Table 1. This might be due to the fact that our data ends at the end of 2012 and hence cannot capture the full effect of the crisis, which lasted well into 2015 in many countries.
In terms of partial effects, only trade credit has a positive sign during the crisis. In fact during the crisis, only firms with better growth opportunities (sales growth) and firms that financed investment with trade credit can increase their investment. Large firms can also increase their investment during the crisis given the positive partial effect but the total effect of size is still negative. In a similar vein, retained earnings have a partial negative effect on investment during the crisis, but the full effect is still positive. Hence the interpretation is similar to the other sources of financing, that is the positive effect of retained earnings on trade credit during the crisis is a smaller positive. This might be due to the fact that firms with high retained earnings did not want to invest right away and preferred to adopt a “wait and see” approach.

PART III Financing productivity growth274
Investment and Investment Finance in Europe European Investment Bank
These results shed light on the nature of financial frictions. Conditional on firm size and the time series patterns in the sources of financing shown in the previous section, it is clear that the trade credit result is driven by SMEs. SMEs are financially constrained to start with and become more financially constrained given the shortage of bank financing during the crisis and hence finance their investment with trade credit, which is a form of unsecured debt.
Table 2 Net investment/Capital, with Recession Indicator Interactions
Dependent variable: (Net investment/Capital)t
(1) (2) (3) (4) (5)Independent variable Total Debt Trade Credit Loans Equity Retained
EarningsPost*Sales Growth
t−10.0228*** 0.0247*** 0.0268*** 0.0253*** 0.0261***
(6.93) (7.47) (8.13) (7.34) (7.59)Sales Growth
t−10.0812*** 0.0789*** 0.0775*** 0.0779*** 0.0755***
(34.89) (33.89) (33.28) (31.90) (30.94)Post*Size
t−10.0064*** 0.0131*** 0.0107*** 0.0045*** 0.0064***
(6.68) (13.79) (11.28) (4.57) (6.47)Size
t−1-0.692*** -0.670*** -0.668*** -0.689*** -0.723***
(-242.58) (-236.39) (-235.63) (-229.31) (-236.01)Post*Total Debt
t−1-0.0356***
(-8.17)Total Debt
t−1-0.415***
(-83.30)Post*Trade Credit
t−10.0381***
(4.55)Trade Credit
t−10.162***
(22.34)Post*Loans
t−1-0.0320***(-2.79)
Loanst−1
-0.436***(-45.50)
Post*Equityt−1
-0.0002(-0.03)
Equityt−1
0.429***(70.37)
Post*Retained Earningst−1
-0.0237***(-4.79)
Retained Earningst−1
0.441***(74.82)
Observations 15,729,901 15,645,178 15,641,081 14,380,747 14,373,344R2 0.22 0.22 0.22 0.23 0.23Firm FE yes yes yes yes yes
t statistics in parentheses. Clustered errors at the firm level. Country-sector-year fixed effects are controlled.
Notes: Net investment is the % annual change in total fixed assets, at constant 2005 dollars. Post is a recession indicator which equals 0 between year 2000 and 2007, and 1 between year 2008 and 2012. Right hand side variables are lagged with respect to net investment. Total Debt, Trade Credit, Loans, Equity and Retained Earnings are short names for Total Liabilities/Total Assets, Trade Credit/Total Assets, Short-term Loans/Total Assets, Equity/Total Assets and Retained Earnings/Total Assets respectively. Sales Growth is logarithmic change in real sales. Size is log(Total Assets).
*p<0.10,**p<0.05,***p<0.001

Financing productivity growth PART III 275
European Investment Bank Investment and Investment Finance in Europe
Table 3 and 4 repeat the same exercise for profits. I use the profit to capital ratio now as the dependent variable instead of the investment to capital ratio. Total debt and loans are now positively correlated with profits (as opposed to investment) and equity and retained earnings negatively correlated. However, as shown in Table 4, the effects of different forms of financing do not change their sign during the crisis for the profit ratio. In fact during the crisis it does not matter in terms of profits what form of financing is used. This can be because profits were down for everyone given the recession regardless of the form of financing different firms use.
Table 3 Profit/Capital, All Firms Sample
Dependent variable: (Profit/Capital)t
(1) (2) (3) (4) (5)
Independent variable Total Debt Trade Credit Loans Equity Retained Earnings
Sales Growtht−1
1.136*** 1.057*** 1.155*** 1.010*** 1.059***(6.71) (6.23) (6.80) (5.66) (5.94)
Sizet−1
-3.526*** -3.461*** -3.526*** -3.411*** -2.776***(-12.82) (-12.59) (-12.76) (-11.75) (-9.41)
Total Debtt−1
6.593***(11.10)
Trade Creditt−1
6.275***(8.27)
Loanst−1
1.914**(2.20)
Equityt−1
-5.900***(-9.53)
Retained Earningst−1
-4.202***(-7.58)
Observations 652,319 651,759 650,515 592,610 592,072R2 0.64 0.64 0.64 0.64 0.64Firm FE yes yes yes yes yes
t statistics in parentheses. Clustered errors at the firm level. Country-sector-year fixed effects are controlled.
Notes: Profit/Capital is the gross profit over real capital stock at constant 2005 dollars. Right hand side variables are lagged with respect to Profit/Capital. Total Debt, Trade Credit, Loans, Equity and Retained Earnings are short names for Total Liabilities/Total Assets, Trade Credit/Total Assets, Short-term Loans/Total Assets, Equity/Total Assets and Retained Earnings/Total Assets respectively. Sales Growth is logarithmic change in real sales. Size is log(Total Assets).
*p<0.10,**p<0.05,***p<0.001
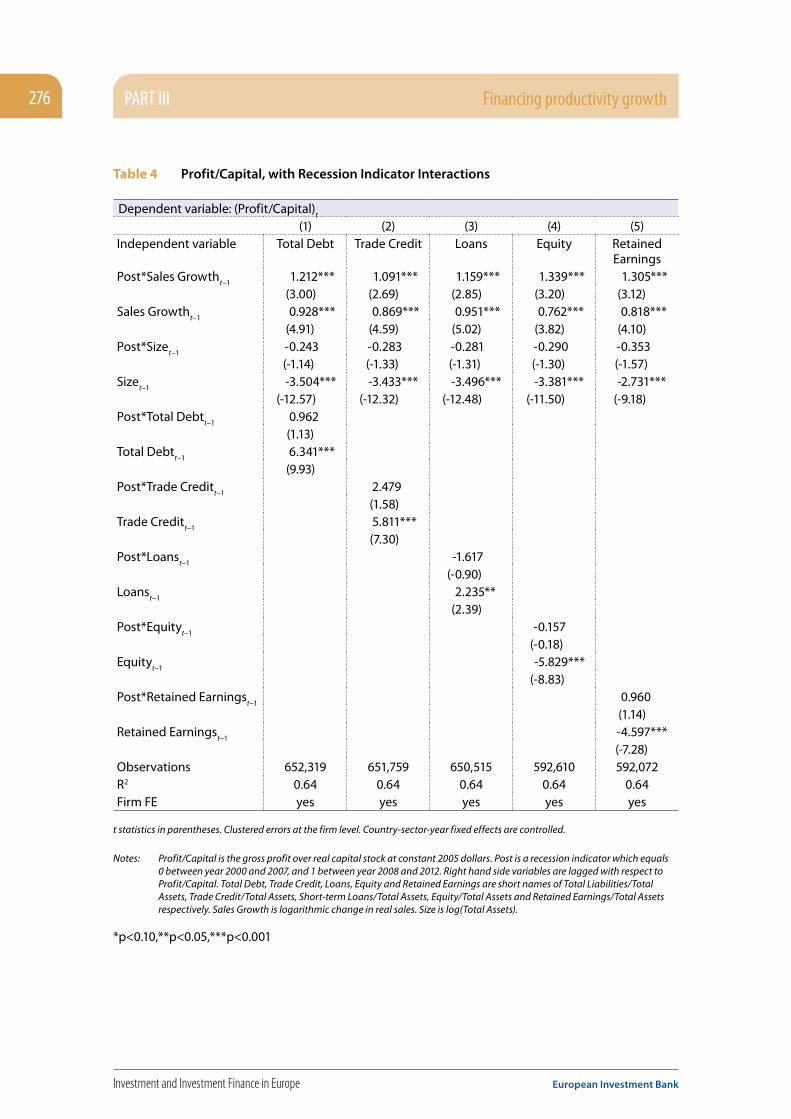
PART III Financing productivity growth276
Investment and Investment Finance in Europe European Investment Bank
Table 4 Profit/Capital, with Recession Indicator Interactions
Dependent variable: (Profit/Capital)t
(1) (2) (3) (4) (5)Independent variable Total Debt Trade Credit Loans Equity Retained
EarningsPost*Sales Growth
t−11.212*** 1.091*** 1.159*** 1.339*** 1.305***
(3.00) (2.69) (2.85) (3.20) (3.12)Sales Growth
t−10.928*** 0.869*** 0.951*** 0.762*** 0.818***
(4.91) (4.59) (5.02) (3.82) (4.10)Post*Size
t−1-0.243 -0.283 -0.281 -0.290 -0.353(-1.14) (-1.33) (-1.31) (-1.30) (-1.57)
Sizet−1
-3.504*** -3.433*** -3.496*** -3.381*** -2.731***(-12.57) (-12.32) (-12.48) (-11.50) (-9.18)
Post*Total Debtt−1
0.962(1.13)
Total Debtt−1
6.341***(9.93)
Post*Trade Creditt−1
2.479(1.58)
Trade Creditt−1
5.811***(7.30)
Post*Loanst−1
-1.617(-0.90)
Loanst−1
2.235**(2.39)
Post*Equityt−1
-0.157(-0.18)
Equityt−1
-5.829***(-8.83)
Post*Retained Earningst−1
0.960(1.14)
Retained Earningst−1
-4.597***(-7.28)
Observations 652,319 651,759 650,515 592,610 592,072R2 0.64 0.64 0.64 0.64 0.64Firm FE yes yes yes yes yes
t statistics in parentheses. Clustered errors at the firm level. Country-sector-year fixed effects are controlled.
Notes: Profit/Capital is the gross profit over real capital stock at constant 2005 dollars. Post is a recession indicator which equals 0 between year 2000 and 2007, and 1 between year 2008 and 2012. Right hand side variables are lagged with respect to Profit/Capital. Total Debt, Trade Credit, Loans, Equity and Retained Earnings are short names of Total Liabilities/Total Assets, Trade Credit/Total Assets, Short-term Loans/Total Assets, Equity/Total Assets and Retained Earnings/Total Assets respectively. Sales Growth is logarithmic change in real sales. Size is log(Total Assets).
*p<0.10,**p<0.05,***p<0.001

Financing productivity growth PART III 277
European Investment Bank Investment and Investment Finance in Europe
Finally, Table 5 and 6 repeat the same exercise for sales growth as the dependent variable. For normal times, the results mimic the investment regression, except that now the equity is negatively correlated with sales growth. For crisis times, the results are quite different from investment results. Now the partial crisis effects are big enough that when the sign reverts, the total effect also reverts. As shown in Table 6, only firms with enough equity, trade credit and retained earnings could have increased their sales growth during the crisis, since the total effects of these variables are positive. The partial effect of trade credit on sales growth is negative. This is probably due to the fact that a demand collapse affects sales and trade credit both negatively on impact. What is interesting is that the total effect of debt is negative, so firms with a lot of debt experience declining overall sales growth during the crisis.
Table 5 Sales Growth, All Firms Sample
Dependent variable: (Sales Growth)t
(1) (2) (3) (4) (5)
Independent variable Total Debt Trade Credit Loans Equity Retained Earnings
Sizet−1
0.134*** 0.135*** 0.135*** 0.138*** 0.136***(250.73) (252.72) (252.08) (242.80) (235.13)
Total Debtt−1
-0.0006(-0.65)
Trade Creditt−1
0.174***(122.88)
Loanst−1
-0.162***(-85.40)
Equityt−1
-0.0160***(-15.29)
Retained Earningst−1
0.0160***(15.45)
Observations 15,729,901 15,645,178 15,641,018 14,380,747 14,373,344R2 0.29 0.29 0.29 0.30 0.30Firm FE yes yes yes yes yes
t statistics in parentheses. Clustered errors at the firm level. Country-sector-year fixed effects are controlled.
Notes: Sales Growth is logarithmic change in real sales. Right hand side variables are lagged with respect to Sales/Capital. Total Debt, Trade Credit, Loans, Equity and Retained Earnings are short names for Total Liabilities/Total Assets, Trade Credit/Total Assets, Short-term Loans/Total Assets, Equity/Total Assets and Retained Earnings/Total Assets respectively. Size is log(Total Assets).
*p<0.10,**p<0.05,***p<0.001
{tc "10 Sales Growth, with Recession Indicator Interactions" \f t}

PART III Financing productivity growth278
Investment and Investment Finance in Europe European Investment Bank
Table 6 Sales Growth, with Recession Indicator Interactions
Dependent variable: (Sales Growth)t
(1) (2) (3) (4) (5)Independent variable Total Debt Trade Credit Loans Equity Retained
EarningsPost*Size
t−1-0.0017*** 0.0025*** 0.0007*** -0.0016*** -0.0016***
(-8.29) (12.16) (3.23) (-7.22) (-7.17)Size
t−10.134*** 0.134*** 0.135*** 0.138*** 0.136***
(245.21) (244.89) (245.57) (237.29) (230.98)Post*Total Debt
t−1-0.0727***
(-70.49)Total Debt
t−10.0403***
(35.64)Post*Trade Credit
t−1-0.0663***
(-35.69)Trade Credit
t−10.204***
(127.87)Post*Loans
t−1-0.0388***
(-13.84)Loans
t−1-0.144***
(-64.57)Post*Equity
t−10.0774***
(70.71)Equity
t−1-0.0622***
(-50.02)Post*Retained Earnings
t−10.0430***
(39.45)Retained Earnings
t−1-0.010***
(-8.24)Observations 15,729,901 15,645,178 15,641,018 14,380,747 14,373,344R2 0.29 0.29 0.29 0.30 0.30Firm FE yes yes yes yes yes
t statistics in parentheses. Clustered errors at the firm level. Country-sector-year fixed effects are controlled.
Notes: Sales Growth is logarithmic change in real sales. Post is a recession indicator which equals 0 between year 2000 and 2007, and 1 between year 2008 and 2012. Right hand side variables are lagged with respect to Sales/Capital. Total Debt, Trade Credit, Loans, Equity and Retained Earnings are short names for Total Liabilities/Total Assets, Trade Credit/Total Assets, Short-term Loans/Total Assets, Equity/Total Assets and Retained Earnings/Total Assets respectively. Size is log(Total Assets).
*p<0.10,**p<0.05,***p<0.001
Overall, our results indicate that financial constraints bind during crisis times more so for smaller firms, which have to use trade credit, equity and retained earnings if they want to continue operating and increase their investment and sales.
Financing productivity growth PART III 279
European Investment Bank Investment and Investment Finance in Europe
7.6. Conclusion and Policy RecommendationsI document the evolution of sources of financing for non-financial firms in Europe and the effects of changes in these financing sources on firms’ real outcome dynamics before and after the European crisis. Using unique pan-European firm-level data that encompasses balance sheets and income statements of privately held firms, including a large and representative number of small to medium-sized enterprises (SMEs), I find that firms in the euro area accumulated more financial debt than non-euro area firms during the 2000s. This result shows the importance of the increase in the foreign capital flows within the euro area countries as a result of the removal of currency risk with the introduction of the Euro.
The financial debt is debt due to financial institutions and hence it is a secured (by collateral) form of debt. I show that this debt is accumulated in the form of both short-term bank loans and long-term debt, whereas other forms of financing such as equity and retained earnings increased slightly only during the deleveraging process of the crisis years. These results show that for the euro area countries debt financing is pro-cyclical and equity financing is counter-cyclical to a certain extent.
The results are mainly driven by small and medium-sized firms (SMEs), as such firms financed themselves more with loans and trade credit, especially in the periphery countries. Long-term debt is accumulated relatively more by large firms, more so in the core countries. For both SMEs and large firms debt financing is pro-cyclical. Equity financing registers more mixed results across SMEs and large firms and also across the Euro and non-euro area country firms. In the non-euro area countries equity financing is largely pro-cyclical for SMEs, a result that has also been found for small firms in the US. In the US only very large firms are able to issue equity during the recession. The US results are based on listed firms though, and in this paper the use of non-listed firms implies many other forms of equity financing. The finding that SMEs are able to raise equity financing only in the euro area countries during the recession points to two facts. First, the euro area banks were in a bigger trouble due to their high exposure to periphery country sovereign debt, compared to non-euro area banks, and hence bank financing collapsed more; and second, firms in the euro area were in a better position to raise foreign equity financing (such as FDI) given the higher degree of capital market integration compared to non-euro area country firms.
In terms of investment, profits and sales, firms that accumulated more debt have experienced declining investment and sales both before and after the crisis, whereas firms that financed themselves with trade credit, equity and retained earnings have experienced the opposite outcome. Profits have a negative correlation with trade credit and a positive correlation with debt before the crisis but do not correlate with any form of financing during the crisis.
The existing explanations for the sluggish recovery in Europe so far have emphasised the role of low aggregate demand and financial frictions. Financial frictions can operate via banks, where banks’ balance sheet problems prevent them from lending to any borrower, or via firms, where firms with deteriorating balance sheets become risky borrowers. I show that the capital structure of firms’ balance sheets and how this structure changed over time in terms of different financing sources is key to explaining the financial frictions operating via firms’ balance sheets. Firm heterogeneity in terms of firm size and how firm size is correlated with firm financing behaviour over time has important implications in terms of explaining the performance of the aggregate economy.
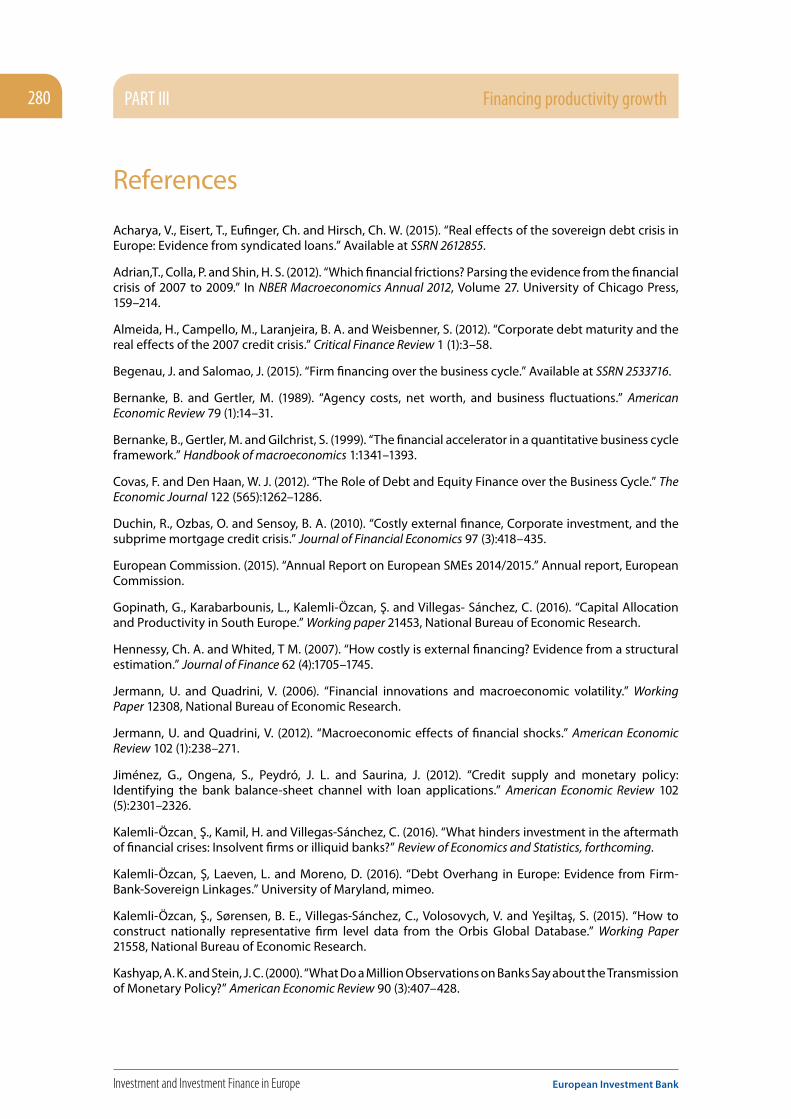
PART III Financing productivity growth280
Investment and Investment Finance in Europe European Investment Bank
References
Acharya, V., Eisert, T., Eufinger, Ch. and Hirsch, Ch. W. (2015). “Real effects of the sovereign debt crisis in Europe: Evidence from syndicated loans.” Available at SSRN 2612855.
Adrian,T., Colla, P. and Shin, H. S. (2012). “Which financial frictions? Parsing the evidence from the financial crisis of 2007 to 2009.” In NBER Macroeconomics Annual 2012, Volume 27. University of Chicago Press, 159–214.
Almeida, H., Campello, M., Laranjeira, B. A. and Weisbenner, S. (2012). “Corporate debt maturity and the real effects of the 2007 credit crisis.” Critical Finance Review 1 (1):3–58.
Begenau, J. and Salomao, J. (2015). “Firm financing over the business cycle.” Available at SSRN 2533716.
Bernanke, B. and Gertler, M. (1989). “Agency costs, net worth, and business fluctuations.” American Economic Review 79 (1):14–31.
Bernanke, B., Gertler, M. and Gilchrist, S. (1999). “The financial accelerator in a quantitative business cycle framework.” Handbook of macroeconomics 1:1341–1393.
Covas, F. and Den Haan, W. J. (2012). “The Role of Debt and Equity Finance over the Business Cycle.” The Economic Journal 122 (565):1262–1286.
Duchin, R., Ozbas, O. and Sensoy, B. A. (2010). “Costly external finance, Corporate investment, and the subprime mortgage credit crisis.” Journal of Financial Economics 97 (3):418–435.
European Commission. (2015). “Annual Report on European SMEs 2014/2015.” Annual report, European Commission.
Gopinath, G., Karabarbounis, L., Kalemli-Özcan, Ş. and Villegas- Sánchez, C. (2016). “Capital Allocation and Productivity in South Europe.” Working paper 21453, National Bureau of Economic Research.
Hennessy, Ch. A. and Whited, T M. (2007). “How costly is external financing? Evidence from a structural estimation.” Journal of Finance 62 (4):1705–1745.
Jermann, U. and Quadrini, V. (2006). “Financial innovations and macroeconomic volatility.” Working Paper 12308, National Bureau of Economic Research.
Jermann, U. and Quadrini, V. (2012). “Macroeconomic effects of financial shocks.” American Economic Review 102 (1):238–271.
Jiménez, G., Ongena, S., Peydró, J. L. and Saurina, J. (2012). “Credit supply and monetary policy: Identifying the bank balance-sheet channel with loan applications.” American Economic Review 102 (5):2301–2326.
Kalemli-Özcan¸ Ş., Kamil, H. and Villegas-Sánchez, C. (2016). “What hinders investment in the aftermath of financial crises: Insolvent firms or illiquid banks?” Review of Economics and Statistics, forthcoming.
Kalemli-Özcan, Ş, Laeven, L. and Moreno, D. (2016). “Debt Overhang in Europe: Evidence from Firm-Bank-Sovereign Linkages.” University of Maryland, mimeo.
Kalemli-Özcan, Ş., Sørensen, B. E., Villegas-Sánchez, C., Volosovych, V. and Yeşiltaş, S. (2015). “How to construct nationally representative firm level data from the Orbis Global Database.” Working Paper 21558, National Bureau of Economic Research.
Kashyap, A. K. and Stein, J. C. (2000). “What Do a Million Observations on Banks Say about the Transmission of Monetary Policy?” American Economic Review 90 (3):407–428.
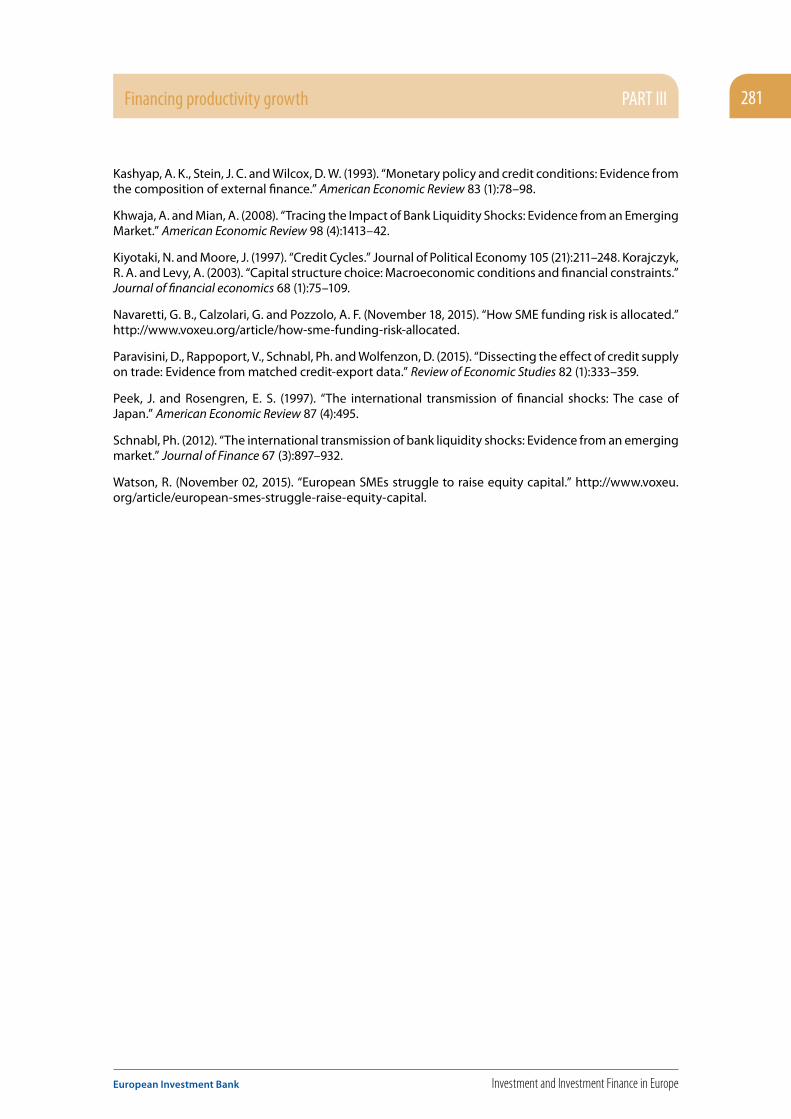
Financing productivity growth PART III 281
European Investment Bank Investment and Investment Finance in Europe
Kashyap, A. K., Stein, J. C. and Wilcox, D. W. (1993). “Monetary policy and credit conditions: Evidence from the composition of external finance.” American Economic Review 83 (1):78–98.
Khwaja, A. and Mian, A. (2008). “Tracing the Impact of Bank Liquidity Shocks: Evidence from an Emerging Market.” American Economic Review 98 (4):1413–42.
Kiyotaki, N. and Moore, J. (1997). “Credit Cycles.” Journal of Political Economy 105 (21):211–248. Korajczyk, R. A. and Levy, A. (2003). “Capital structure choice: Macroeconomic conditions and financial constraints.” Journal of financial economics 68 (1):75–109.
Navaretti, G. B., Calzolari, G. and Pozzolo, A. F. (November 18, 2015). “How SME funding risk is allocated.” http://www.voxeu.org/article/how-sme-funding-risk-allocated.
Paravisini, D., Rappoport, V., Schnabl, Ph. and Wolfenzon, D. (2015). “Dissecting the effect of credit supply on trade: Evidence from matched credit-export data.” Review of Economic Studies 82 (1):333–359.
Peek, J. and Rosengren, E. S. (1997). “The international transmission of financial shocks: The case of Japan.” American Economic Review 87 (4):495.
Schnabl, Ph. (2012). “The international transmission of bank liquidity shocks: Evidence from an emerging market.” Journal of Finance 67 (3):897–932.
Watson, R. (November 02, 2015). “European SMEs struggle to raise equity capital.” http://www.voxeu.org/article/european-smes-struggle-raise-equity-capital.
PART III Financing productivity growth282
Investment and Investment Finance in Europe European Investment Bank
Appendix: Charts and TablesFigure 6 Normalised Average Ratios by Country Group and by Firm Size
(SME: 1 ≤ employees ≤ 249; Large: employees≥250)
Trade Credit/Total Liabilities: euro areaShort-term Loans/Total Liabilities: euro area
0.5
0.6
0.7
0.8
0.9
1.0
1.1
1.2
1.3
1.4
1.5
2000
2001
2002
2003
2004
2005
2006
2007
2008
2009
2010
2011
2012
0.5
0.6
0.7
0.8
0.9
1.0
1.1
1.2
1.3
1.4
1.5
2000
2001
2002
2003
2004
2005
2006
2007
2008
2009
2010
2011
2012
SMELarge
SMELarge
Long-term Debt/Total Liabilities: euro areaOther Current Liabilities/Total Liabilities: euro area
0.4
0.6
0.8
1.0
1.2
1.4
2000
2001
2002
2003
2004
2005
2006
2007
2008
2009
2010
2011
2012
0.5
1.0
1.5
2.0
2.5
2000
2001
2002
2003
2004
2005
2006
2007
2008
2009
2010
2011
2012
SMELarge
SMELarge
Retained Earnings/Total Assets: euro areaEquity/Total Assets: euro area
0.5
0.6
0.7
0.8
0.9
1.0
1.1
1.2
1.3
1.4
1.5
2000
2001
2002
2003
2004
2005
2006
2007
2008
2009
2010
2011
2012
0.0
0.5
1.0
1.5
2000
2001
2002
2003
2004
2005
2006
2007
2008
2009
2010
2011
2012
SMELarge
SMELarge
Trade Credit/Total Liabilities: non-euro areaShort-term Loans/Total Liabilities: non-euro area
0.5
0.6
0.7
0.8
0.9
1.0
1.1
1.2
1.3
1.4
1.5
2000
2001
2002
2003
2004
2005
2006
2007
2008
2009
2010
2011
2012
0.5
0.6
0.7
0.8
0.9
1.0
1.1
1.2
1.3
1.4
1.5
2000
2001
2002
2003
2004
2005
2006
2007
2008
2009
2010
2011
2012
SMELarge
SMELarge
Long-term Debt/Total Liabilities: non-euro areaOther Current Liabilities/Total Liabilities: non-euro area
0.4
0.6
0.8
1.0
1.2
1.4
2000
2001
2002
2003
2004
2005
2006
2007
2008
2009
2010
2011
2012
0.5
1.0
1.5
2.0
2.5
2000
2001
2002
2003
2004
2005
2006
2007
2008
2009
2010
2011
2012
SMELarge
SMELarge
Retained Earnings/Total Assets: non-euro areaEquity/Total Assets: non-euro area
0.5
0.6
0.7
0.8
0.9
1.0
1.1
1.2
1.3
1.4
1.5
2000
2001
2002
2003
2004
2005
2006
2007
2008
2009
2010
2011
2012
0.0
0.5
1.0
1.5
2000
2001
2002
2003
2004
2005
2006
2007
2008
2009
2010
2011
2012
SMELarge
SMELarge
Financing productivity growth PART III 283
European Investment Bank Investment and Investment Finance in Europe
Figure 7 Normalised Average Ratios by Country Groups and by Firm Size (SME: 1 ≤ employees ≤ 249; Large: employees≥250)
Trade Credit/Total Liabilities: euro areaShort-term Loans/Total Liabilities: euro area
0.5
0.6
0.7
0.8
0.9
1.0
1.1
1.2
1.3
1.4
1.5
2000
2001
2002
2003
2004
2005
2006
2007
2008
2009
2010
2011
2012
0.5
0.6
0.7
0.8
0.9
1.0
1.1
1.2
1.3
1.4
1.5
2000
2001
2002
2003
2004
2005
2006
2007
2008
2009
2010
2011
2012
SMELarge
SMELarge
Long-term Debt/Total Liabilities: euro areaOther Current Liabilities/Total Liabilities: euro area
0.4
0.6
0.8
1.0
1.2
1.4
2000
2001
2002
2003
2004
2005
2006
2007
2008
2009
2010
2011
2012
0.5
1.0
1.5
2.0
2.5
2000
2001
2002
2003
2004
2005
2006
2007
2008
2009
2010
2011
2012
SMELarge
SMELarge
Retained Earnings/Total Assets: euro areaEquity/Total Assets: euro area
0.5
0.6
0.7
0.8
0.9
1.0
1.1
1.2
1.3
1.4
1.5
2000
2001
2002
2003
2004
2005
2006
2007
2008
2009
2010
2011
2012
0.0
0.5
1.0
1.5
2000
2001
2002
2003
2004
2005
2006
2007
2008
2009
2010
2011
2012
SMELarge
SMELarge
Trade Credit/Total Liabilities: non-euro areaShort-term Loans/Total Liabilities: non-euro area
0.5
0.6
0.7
0.8
0.9
1.0
1.1
1.2
1.3
1.4
1.5
2000
2001
2002
2003
2004
2005
2006
2007
2008
2009
2010
2011
2012
0.5
0.6
0.7
0.8
0.9
1.0
1.1
1.2
1.3
1.4
1.5
2000
2001
2002
2003
2004
2005
2006
2007
2008
2009
2010
2011
2012
SMELarge
SMELarge
Long-term Debt/Total Liabilities: non-euro areaOther Current Liabilities/Total Liabilities: non-euro area
0.4
0.6
0.8
1.0
1.2
1.4
2000
2001
2002
2003
2004
2005
2006
2007
2008
2009
2010
2011
2012
0.5
1.0
1.5
2.0
2.5
2000
2001
2002
2003
2004
2005
2006
2007
2008
2009
2010
2011
2012
SMELarge
SMELarge
Retained Earnings/Total Assets: non-euro areaEquity/Total Assets: non-euro area
0.5
0.6
0.7
0.8
0.9
1.0
1.1
1.2
1.3
1.4
1.5
2000
2001
2002
2003
2004
2005
2006
2007
2008
2009
2010
2011
2012
0.0
0.5
1.0
1.5
2000
2001
2002
2003
2004
2005
2006
2007
2008
2009
2010
2011
2012
SMELarge
SMELarge
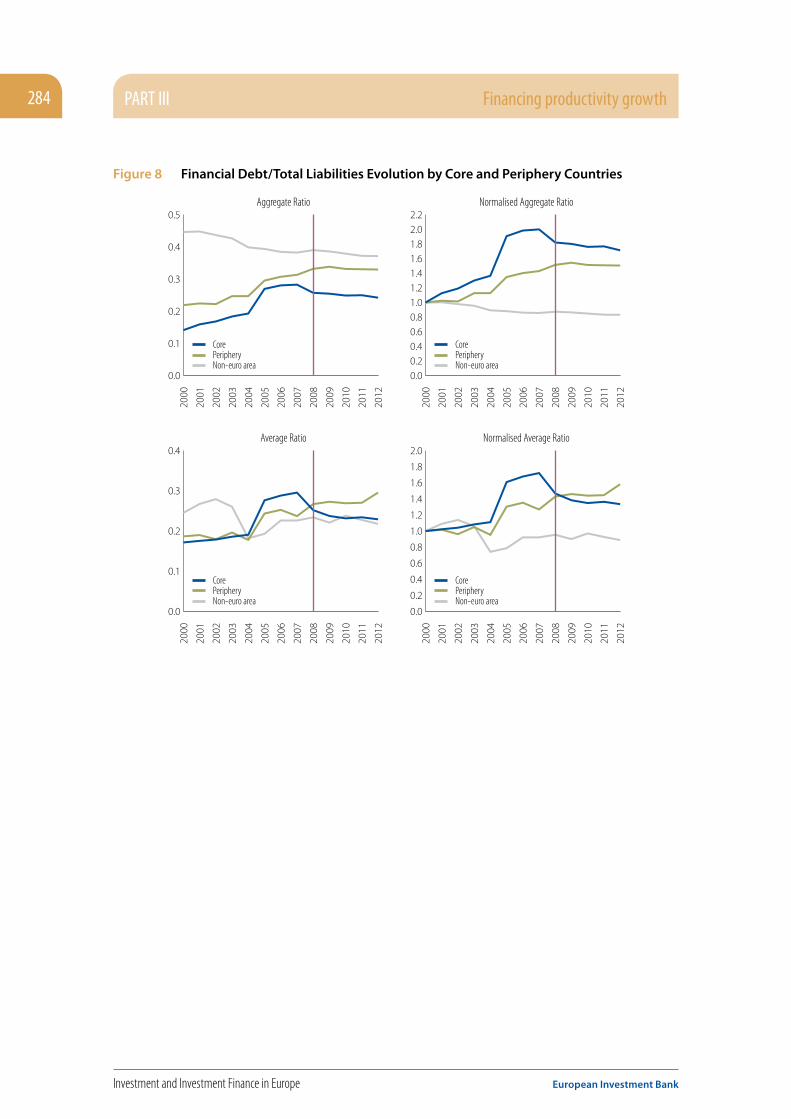
PART III Financing productivity growth284
Investment and Investment Finance in Europe European Investment Bank
Figure 8 Financial Debt/Total Liabilities Evolution by Core and Periphery Countries
Normalised Aggregate RatioAggregate Ratio
0.0
0.1
0.2
0.3
0.4
0.5
2000
2001
2002
2003
2004
2005
2006
2007
2008
2009
2010
2011
2012
0.00.20.40.60.81.01.21.41.61.82.02.2
2000
2001
2002
2003
2004
2005
2006
2007
2008
2009
2010
2011
2012
PeripheryCore
Non-euro areaPeripheryCore
Non-euro area
Normalised Average RatioAverage Ratio
0.0
0.1
0.2
0.3
0.4
2000
2001
2002
2003
2004
2005
2006
2007
2008
2009
2010
2011
2012
0.0
0.2
0.4
0.6
0.8
1.0
1.2
1.4
1.6
1.8
2.0
2000
2001
2002
2003
2004
2005
2006
2007
2008
2009
2010
2011
2012
PeripheryCore
Non-euro areaPeripheryCore
Non-euro area

Financing productivity growth PART III 285
European Investment Bank Investment and Investment Finance in Europe
Figure 9 Normalised Average Ratios by Core and Periphery Countries (averages of firm-level ratios and normalised at first year)
Trade Credit/Total LiabilitiesShort-term Loans/Total Liabilities
0.5
1.0
1.5
2.0
2.5
2000
2001
2002
2003
2004
2005
2006
2007
2008
2009
2010
2011
2012
0.5
1.0
1.5
2.0
2.5
2000
2001
2002
2003
2004
2005
2006
2007
2008
2009
2010
2011
2012
PeripheryCore
Non-euro areaPeripheryCore
Non-euro area
Long-term Debt/Total LiabilitiesOther Current Liabilities/Total Liabilities
0.4
0.6
0.8
1.0
1.2
1.4
2000
2001
2002
2003
2004
2005
2006
2007
2008
2009
2010
2011
2012
0.5
1.0
1.5
2.0
2.5
2000
2001
2002
2003
2004
2005
2006
2007
2008
2009
2010
2011
2012
PeripheryCore
Non-euro area
PeripheryCore
Non-euro area
Retained Earnings/Total AssetsEquity/Total Assets
0.5
0.6
0.7
0.8
0.9
1.0
1.1
1.2
1.3
2000
2001
2002
2003
2004
2005
2006
2007
2008
2009
2010
2011
2012
0.0
0.5
1.0
1.5
2000
2001
2002
2003
2004
2005
2006
2007
2008
2009
2010
2011
2012
PeripheryCore
Non-euro area
PeripheryCore
Non-euro area

PART III Financing productivity growth286
Investment and Investment Finance in Europe European Investment Bank
Figure 10 Normalised Average Ratios by Core and Periphery Countries and by Firm Size (SME: 1 ≤ employees ≤ 249; Large: employees≥250)
Short-term Loans/Total Liabilities: Core
0.5
1.0
1.5
2.0
2.5
2000
2001
2002
2003
2004
2005
2006
2007
2008
2009
2010
2011
2012
SMELarge
Trade Credit/Total Liabilities: Core
0.5
1.0
1.5
2.0
2.5
2000
2001
2002
2003
2004
2005
2006
2007
2008
2009
2010
2011
2012
SMELarge
Other Current Liabilities/Total Liabilities: Core
0.4
0.6
0.8
1.0
1.2
1.4
2000
2001
2002
2003
2004
2005
2006
2007
2008
2009
2010
2011
2012
SMELarge
Short-term Loans/Total Liabilities: Periphery
0.5
1.0
1.5
2.0
2.5
2000
2001
2002
2003
2004
2005
2006
2007
2008
2009
2010
2011
2012
SMELarge
Trade Credit/Total Liabilities: Periphery
0.5
1.0
1.5
2.0
2.5
2000
2001
2002
2003
2004
2005
2006
2007
2008
2009
2010
2011
2012
SMELarge
Other Current Liabilities/Total Liabilities: Periphery
0.4
0.6
0.8
1.0
1.2
1.4
2000
2001
2002
2003
2004
2005
2006
2007
2008
2009
2010
2011
2012
SMELarge
Short-term Loans/Total Liabilities: non-euro area
0.5
1.0
1.5
2.0
2.5
2000
2001
2002
2003
2004
2005
2006
2007
2008
2009
2010
2011
2012
SMELarge
Trade Credit/Total Liabilities: non-euro area
0.5
1.0
1.5
2.0
2.5
2000
2001
2002
2003
2004
2005
2006
2007
2008
2009
2010
2011
2012
SMELarge
Other Current Liabilities/Total Liabilities: non-euro area
0.4
0.6
0.8
1.0
1.2
1.4
2000
2001
2002
2003
2004
2005
2006
2007
2008
2009
2010
2011
2012
SMELarge

Financing productivity growth PART III 287
European Investment Bank Investment and Investment Finance in Europe
Figure 11 Normalised Average Ratios by Core and Periphery Countries and by Firm Size (SME: 1 ≤ employees ≤ 249; Large: employees≥250)
Long-term Debt/Total Liabilities: Core
1.0
1.5
2.0
2.5
3.0
3.5
2000
2001
2002
2003
2004
2005
2006
2007
2008
2009
2010
2011
2012
SMELarge
Equity/Total Assets: Core
0.5
0.6
0.7
0.8
0.9
1.0
1.1
1.2
1.3
1.4
1.5
2000
2001
2002
2003
2004
2005
2006
2007
2008
2009
2010
2011
2012
SMELarge
Retained Earnings/Total Assets: Core
0.0
0.5
1.0
1.5
2000
2001
2002
2003
2004
2005
2006
2007
2008
2009
2010
2011
2012
SMELarge
Long-term Debt/Total Liabilities: Periphery
0.5
1.0
1.5
2.0
2.5
3.0
3.5
2000
2001
2002
2003
2004
2005
2006
2007
2008
2009
2010
2011
2012
SMELarge
Equity/Total Assets: Periphery
0.5
0.6
0.7
0.8
0.9
1.0
1.1
1.2
1.3
1.4
1.5
2000
2001
2002
2003
2004
2005
2006
2007
2008
2009
2010
2011
2012
SMELarge
Retained Earnings/Total Assets: Periphery
0.0
0.5
1.0
1.5
2000
2001
2002
2003
2004
2005
2006
2007
2008
2009
2010
2011
2012
SMELarge
Long-term Debt/Total Liabilities: non-euro area
0.5
1.0
1.5
2.0
2.5
3.0
3.5
2000
2001
2002
2003
2004
2005
2006
2007
2008
2009
2010
2011
2012
SMELarge
Equity/Total Assets: non-euro area
0.5
0.6
0.7
0.8
0.9
1.0
1.1
1.2
1.3
1.4
1.5
2000
2001
2002
2003
2004
2005
2006
2007
2008
2009
2010
2011
2012
SMELarge
Retained Earnings/Total Assets: non-euro area
0.0
0.5
1.0
1.5
2000
2001
2002
2003
2004
2005
2006
2007
2008
2009
2010
2011
2012
SMELarge

PART III Financing productivity growth288
Investment and Investment Finance in Europe European Investment Bank
Table 7 Definition of Variables
Variable Definition
Equity Shareholders funds or total equity (capital + other shareholders funds)
Retained Earnings Other shareholders funds: all shareholders funds not linked with the issued capital such as reserve capital, undistributed profit, also include minority interests if any
Fixed Assets Total amount (after depreciation) of non-current assets (intangible assets + tangible assets + other fixed assets)
Current Assets Total amount of current assets (stocks + debtors + other current assets)
Total Assets Fixed assets + current assets
Short-term Loans Short-term financial debts (e.g. to credit institutions + part of long-term financial debts payable within the year, bonds, etc.)
Trade Credit Debts to suppliers and contractors (trade creditors)
Other Current Liabilities Other current liabilities such as pensions, personnel costs, taxes, intra-group debts, accounts received in advance, etc.
Short-term Debt Current liabilities of the company (loans + creditors + other current liabilities)
Long-term Debt Long-term financial debts (e.g. to credit institutions (loans and credits), bonds)
Total Debt Short-term debt + long-term debt
Current Liabilities Current liabilities of the company (loans + creditors + other current liabilities)
Non-Current Liabilities Long-term liabilities of the company (long-term financial debts + other long-term liabilities and provisions)
Total Liabilities Current liabilities + non-current Liabilities
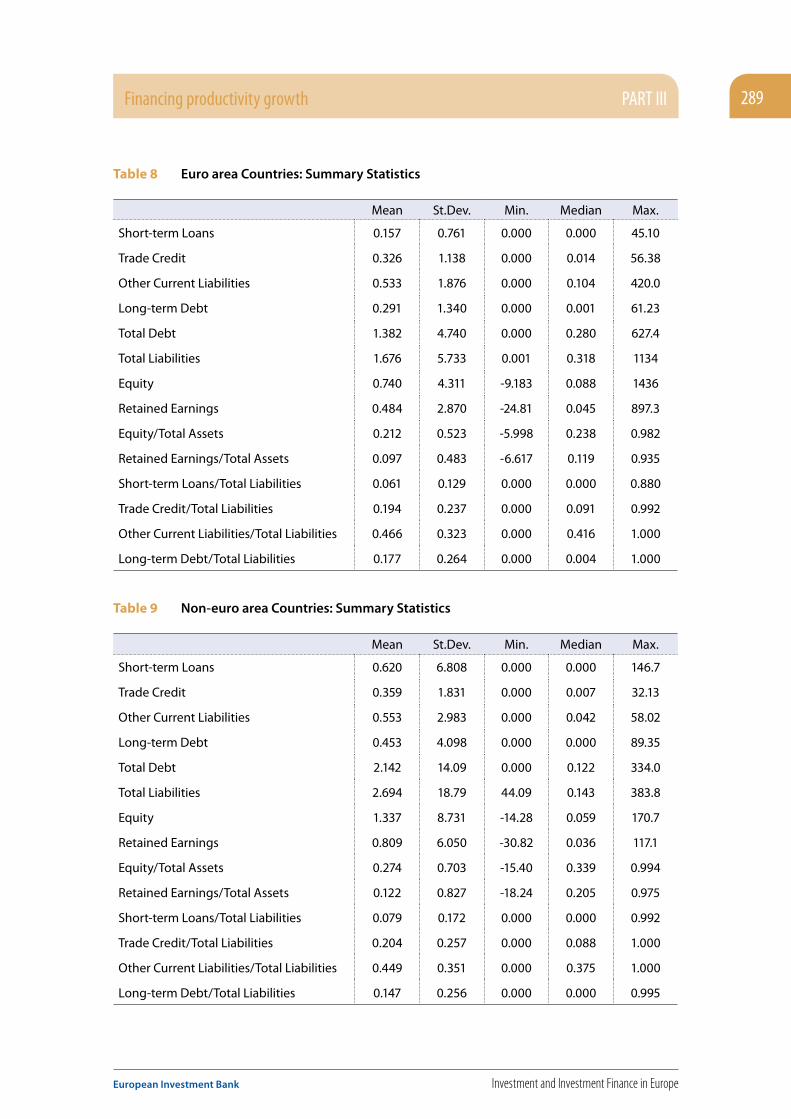
Financing productivity growth PART III 289
European Investment Bank Investment and Investment Finance in Europe
Table 8 Euro area Countries: Summary Statistics
Mean St.Dev. Min. Median Max.
Short-term Loans 0.157 0.761 0.000 0.000 45.10
Trade Credit 0.326 1.138 0.000 0.014 56.38
Other Current Liabilities 0.533 1.876 0.000 0.104 420.0
Long-term Debt 0.291 1.340 0.000 0.001 61.23
Total Debt 1.382 4.740 0.000 0.280 627.4
Total Liabilities 1.676 5.733 0.001 0.318 1134
Equity 0.740 4.311 -9.183 0.088 1436
Retained Earnings 0.484 2.870 -24.81 0.045 897.3
Equity/Total Assets 0.212 0.523 -5.998 0.238 0.982
Retained Earnings/Total Assets 0.097 0.483 -6.617 0.119 0.935
Short-term Loans/Total Liabilities 0.061 0.129 0.000 0.000 0.880
Trade Credit/Total Liabilities 0.194 0.237 0.000 0.091 0.992
Other Current Liabilities/Total Liabilities 0.466 0.323 0.000 0.416 1.000
Long-term Debt/Total Liabilities 0.177 0.264 0.000 0.004 1.000
Table 9 Non-euro area Countries: Summary Statistics
Mean St.Dev. Min. Median Max.
Short-term Loans 0.620 6.808 0.000 0.000 146.7
Trade Credit 0.359 1.831 0.000 0.007 32.13
Other Current Liabilities 0.553 2.983 0.000 0.042 58.02
Long-term Debt 0.453 4.098 0.000 0.000 89.35
Total Debt 2.142 14.09 0.000 0.122 334.0
Total Liabilities 2.694 18.79 44.09 0.143 383.8
Equity 1.337 8.731 -14.28 0.059 170.7
Retained Earnings 0.809 6.050 -30.82 0.036 117.1
Equity/Total Assets 0.274 0.703 -15.40 0.339 0.994
Retained Earnings/Total Assets 0.122 0.827 -18.24 0.205 0.975
Short-term Loans/Total Liabilities 0.079 0.172 0.000 0.000 0.992
Trade Credit/Total Liabilities 0.204 0.257 0.000 0.088 1.000
Other Current Liabilities/Total Liabilities 0.449 0.351 0.000 0.375 1.000
Long-term Debt/Total Liabilities 0.147 0.256 0.000 0.000 0.995

PART III Financing productivity growth290
Investment and Investment Finance in Europe European Investment Bank
Table 10 Summary Statistics for the Regression Variables
Obs. Mean St.Dev. Min. Median Max.
Net Investment/Capital1 26,083,665 0.368 6.808 2.235 0.000 146.7
Profit/Capital2 2,182,844 15.94 1.831 57.20 0.007 32.13
Sales Growth3 16,525,190 0.025 2.983 0.471 0.042 58.02
Total Assets4 25,992,176 13.16 4.098 1.753 0.000 89.35
Total Liabilities/Total Assets5 25,992,120 0.753 14.09 0.439 0.122 334.0
Trade Credit/Total Assets6 25,643,836 0.144 18.79 0.194 0.143 383.8
Short-term Loans/Total Assets7 25,637,015 0.051 8.731 0.114 0.059 170.7
Equity/Total Assets8 23,963,413 0.240 0.503 -15.40 0.258 0.994
Retained Earnings/Total Assets9 23,789,377 0.124 0.496 -18.24 0.138 0.975
Notes: Increase in real capital stock over lagged real capital stock. 2 Real gross profit over real capital stock. 3 Logarithmic change in real sales. 4 Logarithm of real total assets. 5 Total liabilities over real total assets. 6 Trade credit over real total assets. 7 Short-term loans over real total assets. 8 Equity over real total assets. 9 Retained earnings over real total assets.


European Investment Bank98 -100, boulevard Konrad AdenauerL-2950 Luxembourg3 (+352) 43 79 - 15 (+352) 43 77 04www.eib.org/economics U [email protected]
© EIB 02/2017 print: QH-04-16-976-EN-C ISBN 978-92-861-3007-6 doi:10.2867/013963 © EIB GraphicTeam © Shutterstock - Egorov Artemdigital: QH-04-16-976-EN-N ISBN 978-92-861-3008-3 doi:10.2867/745040
Inve
stm
ent a
nd In
vest
men
t Fin
ance
in E
urop
e
Fi
nanc
ing
prod
uctiv
ity g
row
th