investing in the sustainable development of the dominican ... · investing in the sustainable...
TRANSCRIPT

Investing in the Sustainable Development of the Dominican Republic:
Millennium Development Goals (MDGs)
Needs Assessment
Anexar Logos de
COPDES, ONU-RD, ONAPLAN, Proyecto del Milenio (tenemos que asegurar que los logos de COPDES y ONU-RD están en Inglés, logo de ONAPLAN solo existe en español y logo de Proyecto del Milenio solo existe en Inglés)

2
Copyright © 2005 Presidential Commission on the Millennium Development Goals and Sustainable Development (COPDES) and the United Nations Country Team in the Dominican Republic (UNCT) All Rights Reserved www.copdes.gov.do www.onu.org.do
3
Contents
Prologue – H.E. Dr. Leonel Fernandez, President of the Dominican Republic i Preface – Mr. Niky Fabiancic, United Nations Resident Coordinator in the Dominican Republic
ii
Presentation – Dr. Jeffrey Sachs, Director of the U.N. Millennium Project and Special Advisor to the U.N. Secretary-General for the Millennium Development Goals (MDGs)
iii
Millennium Development Goals and Targets iii I. Introduction 00 II. Working Methodology 00 III. National Situation 00 IV. Interventions and Investments for Achieving the Millennium Development Goals
00
1. Combating Hunger and Malnutrition 00 2. Education 00 3. Gender Equality and Women’s Empowerment 00 4. Health and HIV-AIDS 00 5. Environment 00 6. Infrastructure 00 V. Conclusion: The Millennium Development Goals and their viability in the Dominican Republic
33
___________________________________________________________________ Annexes Matrices of Interventions and Costs 1. Combating Hunger and Malnutrition 00 2. Education 00 3. Gender Equality and Women’s Empowerment 00 4. Health and HIV-AIDS 00 5. Environment 00 Methodological Estimation of Gross Domestic Product (GDP) and the Expenditures of the Dominican Government for the period 2006-2015
00
Participants by Working Group and Sub-Working Group 00 Bibliography 00
4
Prologue of H.E. Dr. Leonel Fernandez President of the Dominican Republic
I think that the people of the Dominican Republic are tired of political discourse, the promises, and the lack of results. They want a government and a society that is accountable and responsible to the people, which provides better opportunities for human development and ensures that globalization is a positive force for all. They want a development strategy that addresses the needs of women, children, and those who suffer from poverty as well as one that is sustainable for future generations. For these reasons, we have streamlined the Millennium Development Goals (MDGs) throughout Dominican society and created a Presidential Commission on the Millennium Development Goals and Sustainable Development (COPDES), which harnesses our full commitment to achieving the MDGs by the year 2015. The Millennium Development Goals (MDGs) are the world’s time-bound and quantified targets for addressing extreme poverty in its many dimensions—income poverty, hunger, disease, lack of adequate shelter and exclusion—while promoting gender equality, education, and environmental sustainability. The MDGs are an authority higher than myself as President of the Dominican Republic and higher than any political party or individual. They were born from the signatures of 147 Heads of State and Government at the U.N. Millennium Summit in September 2000, presenting us an international obligation to fulfill them, as well as a moral and national obligation to our citizens of the Dominican Republic. We could no longer afford to have: women dying in labor, babies that die before they even reach one week old; poor who die from starvation, dehydration, diarrhea and infectious diseases; children who do not finish primary school; and degradation of the Dominican Republic’s natural and environmental resources. In order to alter the trends stipulated in the 2004 Dominican Republic National Report on MDGs and actively fulfill the recommendations of the 2005 UNDP National Human Development Report for the Dominican Republic, we have completed, with the help of the U.N. Millennium Project, the U.N. Country Team in the Dominican Republic, the collaboration and leadership of our various ministries, government agencies, national planning office (ONAPLAN), civil society experts and private sector—our first MDG Needs Assessment, which I present to you in this summarized version. The MDG Needs Assessment was an innovative and highly inclusive planning process, new to both the Dominican Government and to the United Nations, which has provided us a much needed roadmap, helping us to effectively address the synergies between sectors while at the same time scaling-up public interventions that will altogether assist in ensuring our country's achievement of the MDGs by 2015. It takes into consideration where we are (2005), where we need to go (2015), and how we are going to get there by defining the needs, costs, and investments needed, year-by-year, scaled up to the 2015. We, as a Government and as a nation, understand the urgency for addressing the most challenging questions in the realm of development and have found key answers, particularly to systemic and institutional issues, important to the human development of the Dominican
5
Republic, all of which—during the normal course of events—would not be addressed within the 4 year term of a President of the Dominican Republic. The Millennium Development Goals have given us the opportunity to confront the long-term issue of the need for stronger institutions and more qualified human resources. We are addressing what many ministers have called “historically accumulated problems”. The MDG Needs Assessment and the work of the Presidential Commission has allowed us to look at the “larger development agenda”, including the need to address delinquency and gender-based domestic violence, the need to modernize the Dominican economy, the need to consolidate democracy, confront corruption head-on, promote transparency, as well as effectively address our transport, energy, electricity, and infrastructure needs and dilemmas. This innovative and inclusive process to date, has promoted an “integrated development agenda”, one in which we realize that no one government agency or ministry could effectively address poverty alone, where achieving one MDG hinges upon achieving the others as well, and the collaboration across sectors and political party lines is integral to achieving a better life and more sustainable environment for the Dominican people. Only together, with a common strategy, working cooperatively, could we effectively combat extreme poverty, social inequity, and exclusion in the Dominican Republic. The MDG Needs Assessment and the work of the Presidential Commission encompasses what has been commonly referred to in international circles as the “Dominican Model”. I have received many messages of appreciation and encouragement from other countries at the United Nations, congratulating the Dominican Republic for its work, making mention that others stand to learn from the process we have created. If we in the Dominican Republic could make this process work for human development, it would give us great honor that others would benefit from our experience. The “Dominican Model”, has converted itself into a system includes: Nine working groups, 20 sub-groups and several sub-sub-groups; multisectoral plenary meetings, technical meetings, joint government – U.N. Country team meetings, Cabinet meetings, small working groups, meetings with donors, etc.; A structure that permits the U.N. Country Team to designate a counterpart agency or agencies, which provides constant, local level technical assistance for ensuring our achievement of the MDGs; and a pro-women approach to achieving the MDGs where the Ministry of Women’s Affairs (SEM) has designated representatives to all Sectoral Working Groups in order to ensure that gender is mainstreamed throughout the poverty eradication planning process. Now that we have finished our MDG Needs Assessment, it is important to think beyond the first step and to integrate the required investments for achieving the MDGs into the various systemic processes of fiscal reform in order to ensure that the macroeconomic framework of the Dominican Republic takes into consideration the achievement of the long-term development goals. I support Professor Jeffrey Sachs’s statement when he visited the Dominican Republic in April 2005, with the purpose of reviewing the preliminary results of the MDG Needs Assessment, “the world has agreed that the MDGs take the priority and the Dominican Republic should figure out how to accomplish them in the context of macroeconomic stability rather than

6
macroeconomic stability being the base…if the resources are not there to achieve the Goals, you have to find them.”
In conclusion, I believe that this MDG Needs Assessment achieves three objectives at once. First, it provides the Government of the Dominican Republic with the first ever estimate of what it will take to achieve the MDGs. Thanks to the needs assessment, the Government now has a firm basis to negotiate increased investments in the MDGs, particularly by the social ministries, including the Ministry of the Education and the Ministry of Public Health and Social Assistance. Second, it allows us to improve the efficiency of public spending as recommended by the International Financial Institutions and other partners. As the needs assessment shows, in many areas progress is not constrained by a lack of resources, but rather their efficient use and effective management. And finally, I believe that the people of the Dominican Republic will benefit the most, especially the most marginalized population whom suffer from the ills of extreme poverty. It is them that will benefit from these scaled-up investments in the MDGs.
I would like to thank Professor Jeffrey Sachs and his staff at the U.N. Millennium Project, Mr. Niky Fabiancic and the U.N. Country Team in the Dominican Republic, Mr. John R. Gagain Jr. and his staff at the Presidential Commission and the Ministries, the National Planning Office (ONAPLAN), the World Bank and the many sectors, institutions, and individuals that contributed to this process. Because of your assistance and contribution, this MDG Needs Assessment will serve as a valuable tool on the roadmap to achieving human development in the Dominican Republic. More importantly, it will serve as a basis for planning our 2006 National Budget as well as those for years to come. I pledge to continue this process that we have created in the Dominican Republic and I would encourage other Presidents that succeed to do the same, for the benefit of the Dominican Republic. As I stated in the launch of the Presidential Commission on the Millennium Development Goals and Sustainable Development (COPDES) in October 2004, we are sure that with the collaboration and support of the Government and all sectors of society, that when the year 2015 approaches, we will be able to exhibit proudly, that the Dominican Republic has been one of the countries on the planet that has conquered the Millennium Development Goals.
Leonel Fernandez
7
Preface of Mr. Niky Fabiancic United Nations Resident Coordinator in the Dominican Republic
The Dominican Republic has decided to put words into action. At the U.N. Millennium Summit held in New York on September 2000, it made the commitment, together with 187 Member States, to assume the necessary measures to combat poverty and hunger, the lack of education, gender disparity, environmental degradation, and child and maternal mortality, as well as, to halt and begin to reverse the HIV/AIDS epidemic and other diseases such as malaria. In 2004, the Presidential Commission on the Millennium Development Goals and Sustainable Development (COPDES), together with the United Nations Country Team (UNCT) in the Dominican Republic, finished the country’s first National MDG Progress Report, where they realized the current status of the country’s progress towards achieving the MDGs. As a result, the Government immediately decided to establish the interventions necessary to achieve the MDGs as well as the related costs of implementation within the specified timeframe. This was complete with the support of the U.N. Millennium Project, due to the Dominican Republic having been selected as the only pilot country in Latin America and the Caribbean. Therefore, with the strong support of the President of the Dominican Republic and the invaluable collaboration of the U.N. Millennium Project in New York, we conducted an MDG Needs Assessment and Costing Analysis—the results of which are included in the following National Report. The report is structured around six focal areas. These focal areas address the 8 MDGs as well as 11 of the 18 Targets, where six Working Groups were created to conduct the needs assessment and costing analysis of each core issue, under the direct responsibility of a government line ministry. The participation of the Working Groups as well as their Sub-Groups included over 180 technical experts from sixteen government agencies, always accompanied by, different non-governmental organizations, and experts from the United Nations Country Team, working together in partnership. All of this work extended throughout the initial months of 2005. I would like to address beyond the actual contents of this Report, the result of a very broad consultation, in order to highlight a fundamental aspect of it. The Dominican Republic assumed ownership of the MDGs in the year 2000, and for that reason, the Dominican Government remains primarily responsible their achievement, however, what is truly significant is to see how the firm decision of the President of the Dominican Republic, Dr. Leonel Fernandez, turned promises into action. His firm commitment has driven a national team, which includes various Ministers under the coordination of a Presidential Commission, all of which have been fully committed to the work of preparing this MDG Needs Assessment Report. Therefore, the intervention outlined in this report, have received high-level political support. For these reasons, I am convinced that the actions needed to achieve the MDGs, will be brought to fruition almost immediately. The contents of the report are extremely valuable; however, the road followed to prepare it is of equal importance, due to the high rate of participation, which has provided us with many lessons learned. An important example to note, has been the fact that the process has
8
enabled the Dominican Government to reevaluate the National Budget planning processes and the involvement of the Ministries, which, for the first time, created a new model based upon what needs to be done to achieve results, and what the cost to achieve those results will be. Consequently, the information and conclusions contained in this National Report are destined to become the principle and fundamental policy for social investment, which the Dominican people have feverishly awaited in order to allow them to achieve a development that is more human and sustainable. In conclusion, I am pleased to present this National Report to Dominican society. It is a report that is the result of the political will and leadership of the President of the Dominican Republic, the impeccable coordination of the Presidential Commission on the Millennium Development Goals, and the great work of Ministers, government advisors, technical experts, and numerous civil society representatives. It enjoyed the support, advisement, and technical assistance of the U.N. Millennium Project and the United Nations Country Team. We must also give a special recognition to Mr. John R. Gagain Jr., Executive Director of the Presidential Commission and Mr. Fernando Ferrán, Project Coordinator for their perseverance and hard work. As I have previously said, the National Report clearly presents the top-priority interventions necessary to achieve the MDGs in the Dominican Republic. From this point forward and for the next 10 years, the Dominican Republic has a unique opportunity for even further improvement, especially now that it knows, through this National Report, what needs to be done, how much it costs, and especially that it does not need to depend upon others for support. The country possesses the sufficient resources to achieve the MDGs before the year 2015.
Niky Fabiancic

9
Presentation of Dr. Jeffrey Sachs Director of the U.N. Millennium Project and Special Advisor to the U.N.
Secretary-General for the Millennium Development Goals (MDGs)

10
Millennium Development Goals and Targets
Goal 1. Eradicate extreme poverty and hunger
Target 1. Halve, between 1990 and 2015, the proportion of people whose income is less than $1 a day
Target 2. Halve, between 1990 and 2015, the proportion of people who suffer from hunger
Goal 2. Achieve universal primary education
Target 3. Ensure that, by 2015, children everywhere, boys and girls alike, will be able to complete a full course of primary schooling
Goal 3. Promote gender equality and empower women
Target 4. Eliminate gender disparity in primary and secondary education, preferably by 2005, and in all levels of education no later than 2015.
Goal 4. Reduce child mortality
Target 5. Reduce by two-thirds, between 1990 and 2015, the under-five mortality rate
Goal 5. Improve maternal health
Target 6. Reduce by three-quarters, between 1990 and 2015, the maternal mortality ratio
Goal 6. Combat HIV/AIDS, malaria, and other diseases
Target 7. Have halted by 2015 and begun to reverse the spread of HIV/AIDS
Target 8. Have halted by 2015 and begun to reverse the incidence of malaria and other major diseases
Goal 7. Ensure environmental sustainability
Target 9. Integrate the principles of sustainable development into country policies and programs and reverse the loss of environmental resources
Target 10. Halve, by 2015, the proportion of people without sustainable access to safe drinking water and basic sanitation

11
Target 11. Have achieved by 2020 a significant improvement in the lives of at least 100 million slum dwellers
Goal 8. Develop a global partnership for development
Target 12. Develop further an open, rule-based, predictable, nondiscriminatory trading and financial system (includes a commitment to good governance, development, and poverty reduction both nationally and internationally)
Target 13. Address the special needs of the Least Developed Countries (includes tariff- and quota-free access for Least Developed Countries? exports, enhanced program of debt relief for heavily indebted poor countries [HIPCs] and cancellation of official bilateral debt, and more generous official development assistance for countries committed to poverty reduction)
Target 14. Address the special needs of landlocked developing countries and small island developing states (through the Program of Action for the Sustainable Development of Small Island Developing States and 22nd General Assembly provisions)
Target 15. Deal comprehensively with the debt problems of developing countries through national and international measures in order to make debt sustainable in the long term
Target 16. In cooperation with developing countries, develop and implement strategies for decent and productive work for youth
Target 17. In cooperation with pharmaceutical companies, provide access to affordable essential drugs in developing countries
Target 18. In cooperation with the private sector, make available the benefits of new technologies, especially information and communications technologies.

12
I. Introduction The next ten years provide us the opportunity to reduce extreme poverty by 50% in the Dominican Republic. In doing so, we have the opportunity to save tens of thousands of human lives, improve existing conditions in poor neighborhoods, ensure safe water supply for the population, promote the sustainable use of the environment and effectively manage the resources vital to our human development. The only thing required to achieve this is to take action and make the Millennium Development Goals (MDG) a reality for the Dominican Republic. The MDGs and their respective targets (See Annex) represent a global effort to quantify measurable goals to fight extreme poverty in its various dimensions (income poverty, hunger, disease, lack of adequate housing and social exclusion). At the same time, these eight goals, their 18 targets and 48 indicators work to promote gender equality, environmental sustainability, and a more equitable global society. They also represent the advancement of human rights related to education, health, housing, and security, as they appear in the Universal Declaration of Human Rights and the U.N. Millennium Declaration. This MDG Needs Assessment Report and its Costing Analysis specify a road map for achieving the MDGs, considering the country’s current status, by the year 2015. It details a list of specific interventions aimed at achieving each MDG and answering a vital question: “How much will it cost to achieve them?” Within this context, we highlight that the question of resources emerges as a final determinant, based upon the findings of the MDG Needs Assessment, but not as a starting point. This methodological approach gives us the unique opportunity to estimate the resources (i.e. financial, human, and infrastructure) necessary to address the complex institutional and systemic challenges to development in the Dominican public sector. The question is no longer, for example, “How many students can we serve with this budget?” instead it is “How much do we need to serve this many students?” It is also important to note that the MDG Needs Assessment Report does not propose additional development plans or new regulating instruments. For example, as in the health-related portion, the interventions have already been included in the national plans and programs for that sector. The Report, does, however, recommend that the implementation of the interventions is imperative to scaling-up efforts towards achieving the MDGs in the Dominican Republic. This approach and its subsequent scaling-up are based on the assumption that there needs to be significant improvement in management and human resource capacity as well as meaningful progress toward quality distribution and allocation of public finance. This progress and improvement are crucial, because the Dominican Republic is not confronted with a lack of funding as its primary challenge, but the institutional weakness of a lack of adequately skilled human resources across the board must be overcome in order to

13
effectively contribute to the country’s achievement of the MDGs and sustainable development. Therefore, taking into consideration the results that demonstrate that the Dominican Republic has the capacity to finance the MDGs with domestic resources, an ability that separates it from most other countries whose problem is the lack of investment resources, the Dominican Republic is envisioning a new era of international cooperation, pursuant to MDG 8 “Developing a global partnership for development” where, in collaboration with the developed world, could harness a more inclusive and equitable model for external assistance towards achieving the MDGs.
14
II. Working methodology
In order to conduct the MDG Needs Assessment and its respective Costing Analysis, the Presidential Commission on the Millennium Development Goals and Sustainable Development (COPDES) and the U.N. Country Team in the Dominican Republic (UNCT) established the following thematic areas of intervention that would be the cornerstone for national action.
1. Combating hunger and malnutrition (MDG 1, Target 2); 2. Education (MDG 2, Target 3); 3. Gender Equality and Women’s Empowerment (MDG 3, Target 4); 4. Health and HIV/AIDS (MDG 4, Target 5; MDG 5, Target 6; MDG 6, Targets 7 & 8;
MDG 8, Target 17); 5. Environment (MDG 7, Targets 9, 10, 11) 6. Infrastructure (addressing all the issues important to achieving all the MDGs)
To address and analyze each thematic area, the Presidential Commission and the UNCT created six Working Groups, one for each of the aforementioned areas. By direct mandate of the President of the Dominican Republic, a line ministry would be responsible for the work of each Working Group whose MDG corresponded with the respective portfolio of the ministry. In the case of the Working Group on Infrastructure, the Infrastructure Cabinet was the lead entity.
Each one of the six Working Groups was divided into sub-Groups, most of which were also divided into sub-sub-Groups. In operational terms, each sub-Group addressed one of the Targets related to the assigned MDG, in addition to the diagnostic issues related to the area. For example, the Working Group on Environment included three sub-Groups: environmental policies, water and sanitation, and slum dwellings, each representing one of the three Targets in MDG 7. However, in the case of the Working Group on Hunger and Malnutrition, although the duty of the group was to address only one of the two Targets of MDG 1, it divided itself into sub-Groups on nutrition, creation of rural and urban employment, production, and commercialization of agricultural products. The actions of these sub-Groups are all crucial to reduce malnutrition in the Dominican Republic. In each Group or Sub-Group, the work was performed by technocrats from one or more government agencies. They were always accompanied by experts from non-governmental organizations as well as U.N. agencies in the Dominican Republic. The list of participants for each Working Group is presented in the Annex. Throughout the first quarter of 2005, the participants interacted in technical meetings, workshops and used other forms of communication to conduct the necessary consultations and present their final conclusions to the ministry. Each Working Group Report was drafted by an analyst-consultant using the input provided by each of the Groups and sub-Groups as well as from the constant consultation with them. This Report of the Dominican Republic simply presents the main issues in the sectorial reports from each Working Group. It was drafted and edited by the Project Coordinator with the
15
collaboration of the Analysts-Consultants and the Coordinators and Sub-Coordinators of each Working Group, from the government sector as well as the U.N. Country Team. The U.N. Millennium Project staff, based in the offices of the U.N. Development Programme (UNDP) in New York provided technical assistance to the national team. They visited the Dominican Republic multiple times, trained national experts on the MDG Needs Assessment methodology and economic costing analysis models, and always remained available to provide technical assistance by way of e-mail, teleconferences and videoconferences. The methodology proposed by the U.N. Millennium Project for the MDG Needs Assessment process was adapted and tailored to the specific needs of each Working Group. It was not considered as static and instead became a guideline to organize the process of data collection and information analysis. The same method was applied to the economic models utilized for the costing analysis. Both the economic models and the methodology can be found on the U.N. Millennium Project’s website (www.unmillenniumproject.org). Since mid-January 2005 until the end of June 2005, the Working Groups and Sub-Groups followed these four steps: 1. Needs Assessment. The first step consisted in identifying and assessing the basic requirements to reduce the existing gaps between the country’s current situation and where the country should be in 2015. This assessment considered specific barriers to greater achievements in the fight against poverty and identified the combination of public investments that will allow the Dominican Republic to reach the targets by the year 2015. The Needs Assessment quantified the requirements in terms of goods, services, and infrastructure, as well as human and financial resources, and provided the information required for planning and budgeting public investments and expenditures, including, (i) full list of the proposed activities; (ii) annual coverage targets for each intervention until the year 2015; and (iii) detailed costs for each series of interventions, separating capital and recurrent expenditures. 2. Interventions. Based on the results of the Needs Assessment, every group developed a matrix of interventions for mid and long-term actions (generally 4 and 10 years, respectively.) The results at this stage have repeatedly indicated that the country has to align its long-term plans and policies with the MDGs. Among the range of possible actions, one the most significant steps in the working methodology was the prioritization of the specified interventions.
The common practice of the prioritization exercise, across all Groups, was to give priority to those interventions that addressed the synergies with other actions related to achieving the same or other MDGs. Similarly, priority treatment was applied to those that represented “quick wins”, where low cost interventions, may yield rapid results for the country, which could be scaled-up over the course of the next ten years in order to achieve the MDGs.

16
Additionally, the methodology has included a general framework for public sector management, development policies that would increase the quality of public spending and public service performance, and a financing strategy in order to ensure effective implementation. 3. Costing Analysis. The results of the two previous stages led to a Costing Analysis with subsequent year-by-year costs that would provide a guide for effective multi-year and medium-term budgetary planning.
During this third stage, the analyst-consultant for each Working Group compiled the information and drafted the sectoral Working Group report. Consequently, with the close cooperation and collaboration of the National Planning Office (ONAPLAN), the unit costs and total costs of the interventions were established. This third stage has provided a resourceful and invaluable contribution to the Needs Assessment process due to the connection it makes between strategic MDG planning and the national budgetary planning process. In general, both the Needs Assessment and Costing Analysis processes have been conducted simultaneously under the authority of the different government agencies. The Technical Secretariat of the President’s Office (STP) contributed significantly by formally requesting that the National Planning Office (ONAPLAN), a sub-division of the STP with mandate for planning the national budget, lead the Costing Analysis and draft a 2006 results-based national budget using the MDG Needs Assessment as a foundation, which is stipulated in the guidelines of the International Monetary Fund (IMF) Stand-By Agreement the Dominican Government signed in early 2005. 4. Sectoral Consultations. In order to enrich and legitimize the key findings and conclusions of each Working Group; the Presidential Commission, the line ministers and the U.N. Country Team held consultations just before the MDG Needs Assessment work was finished. The consultations were conducted with members of civil society, political organizations, multilateral institutions as well as individuals and government officials, from all 32 provinces in the Dominican Republic. Although these meetings were planned to take place in various locations around the country, due to time constraints, the six consultation sessions were held in the Presidential Palace in the capital city of Santo Domingo. In conclusion, it is important to signal a few illustrative caveats. First, the MDG Needs Assessment process in the Dominican Republic has adhered to the U.N. Millennium Project methodology, where the process will lead to a financial strategy based on: 1. Reallocating within the budget from low priority to high priority investment areas; 2. Mobilizing and reorganizing domestic resources; and 3. Re-conceptualizing external finance and assistance. Due to time constraints, this strategy has not yet been prepared. Second, some interventions and investments, including those defined to achieve gender equality in the Dominican Republic had a significant impact on our compliance with the other MDGs, due to their cross-sectoral nature, thereby requiring broad-based commitment from different sectors and government agencies to ensure achievement of the MDGs.
17
This National MDG Needs Assessment Report includes the main conclusions reached by the Working Groups for the country as a whole. The details presented in the Annexes and the Bibliography include what needs to be done as well as the costs for achieving the MDGs. The only remaining task at hand for the Dominican Republic is to continue the work and institutionalization of the MDG Needs Assessment and to ensure there is sufficient political support for the implementation of the its results in order to set the country on a course for achieving the Goals by 2015.
18
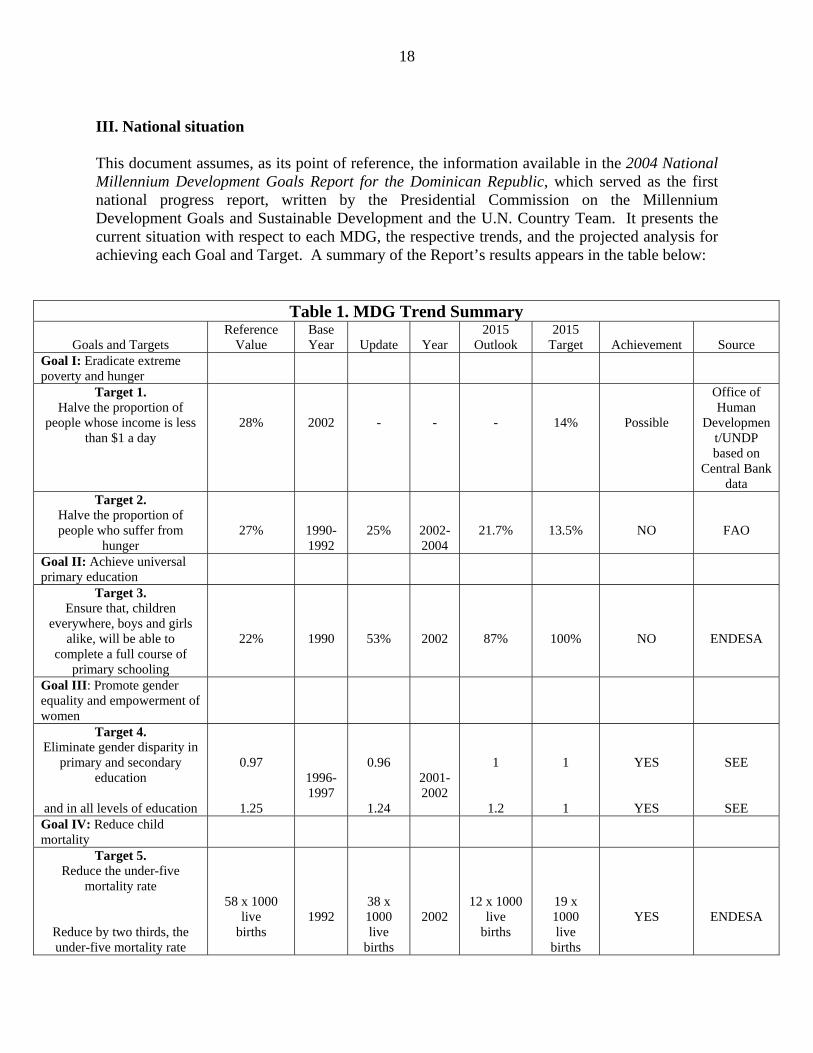
III. National situation This document assumes, as its point of reference, the information available in the 2004 National Millennium Development Goals Report for the Dominican Republic, which served as the first national progress report, written by the Presidential Commission on the Millennium Development Goals and Sustainable Development and the U.N. Country Team. It presents the current situation with respect to each MDG, the respective trends, and the projected analysis for achieving each Goal and Target. A summary of the Report’s results appears in the table below:
Table 1. MDG Trend Summary
Goals and Targets Reference
Value Base Year
Update
Year
2015 Outlook
2015 Target
Achievement
Source
Goal I: Eradicate extreme poverty and hunger
Target 1. Halve the proportion of
people whose income is less than $1 a day
28%
2002
-
-
-
14%
Possible
Office of Human
Development/UNDP based on
Central Bank data
Target 2. Halve the proportion of people who suffer from
hunger
27%
1990- 1992
25%
2002- 2004
21.7%
13.5%
NO
FAO
Goal II: Achieve universal primary education
Target 3. Ensure that, children
everywhere, boys and girls alike, will be able to
complete a full course of primary schooling
22%
1990
53%
2002
87%
100%
NO
ENDESA
Goal III: Promote gender equality and empowerment of women
Target 4. Eliminate gender disparity in
primary and secondary education
and in all levels of education
0.97
1.25
1996- 1997
0.96
1.24
2001- 2002
1
1.2
1
1
YES
YES
SEE
SEE Goal IV: Reduce child mortality
Target 5. Reduce the under-five
mortality rate
Reduce by two thirds, the under-five mortality rate
58 x 1000 live
births
1992
38 x 1000 live
births
2002
12 x 1000 live
births
19 x 1000 live
births
YES
ENDESA

19
Goal V: Improve maternal health
Target 6: Reduce by three- quarters, the maternal mortality ratio
229 x 100,000
live births
1996
178 x 100,000
live births
2002
67.5 x 100,000
live births
57 x 100,000
live births
NO
ENDESA
Goal VI: Combat HIV/AIDS, malaria and other diseases
Target 7. Have halted and begun to reverse the spread of HIV/
AIDS
1.0
2002
-
-
-
-1.0
Probable
ENDESA
Target 8. Have halted by 2015 and
begun to reverse the incidence of tuberculosis
Dengue Fever
Malaria
43 x 100,000 inhabitants
1938 cases
1414 cases
1992
1997
1996
44 x 100,000 inhabita
nts
6136 cases
1296 cases
2002
2003
2002
35 x 100,000
inhabitants -
648 cases
-43 x 100,000 inhabitan
ts
-1938 cases
-1414 cases
YES
Improbable
YES
PAHO/WHO
SESPAS
PAHO/WHO
Goal VII: Ensure environmental sustainability
Target 9. Integrate the principles of
sustainable development into country policies and
programs and reverse the loss of environmental resources
Vegetable coverage
Protected areas
CO2 Emissions per capita
14.1% 16.2%
/nat. terr. 1356 tons
1980 1998
1990
27.5% 19%
2813 tons
1996 2000
1998
--- ---
---
-14.1% +16.2%
-1356 tons
Improbable Yes
Improbable
USDA/MSU Law 64-00
UNDP/MAR
N Target 10.
Halve the proportion of people without sustainable
access to safe drinking water and basic sanitation
17.0% 60%
1990 1990
14.0% 90%
2002 2000
9.5%
8.5% 30%
NO YES
UNICEF PAHO/UNI
CEF Target 11.
Have achieved by 2020 a significant improvement in
the lives of at least 100 million slum dwellers
800,000 units
2003
700,000 units
Improbable
PRSP
*Objective VIII must be monitored based on the initiatives and policies of developed nations

20
According to the information available, the projections for achieving the Target areas are: • Goal I, Target 2: halving the proportion of people who suffer from hunger is highly
improbable, unless we can recover the growth rate achieved in the 1990´s, develop more concrete actions and policies in favor of the malnourished population, and link growth to a more equal distribution of resources.
• Goal II, Target 3: Ensuring that, by 2015, children everywhere, boys and girls alike,
in the entire country will be able to complete a full eight-year cycle of primary schooling appears to be very improbable due to the low levels of student retention. In this context, it is necessary to increase public investment and improve the efficiency of public management and performance in the education sector.
• Goal III, Target 4: Eliminating gender disparity in primary and secondary education,
preferably for the 2006-2007 school year and in all levels of education no later than 2015 will be possible if the country strengthens and reviews the mechanisms in place for the execution of laws, programs, and public policies aimed at obtaining gender equality.
• Goal IV, Target 5: Reducing by two thirds, between 1990 and 2015, the under-five
mortality rate, is attainable if the quality of health services improves and achievements in terms of the reduction of post neonatal mortality are maintained.
• Goal V, Target 6: Reducing the maternal mortality ratio by three-quarters, between
1990 and 2015, is not achievable unless there is a departure from the current trend. For this purpose, there must be an improvement in obstetric care, increase in effective monitoring of maternal deaths, and involvement of civil society in monitoring and evaluation, with particular inclusion of women’s groups.
• Goal VI, Target 7 and 8: the country has the probability of halting and beginning to
reverse the spread of HIV/AIDS by the year 2015 as well as for the incidence of malaria, tuberculosis and other major diseases, but not dengue. The main action to be taken is to implement monitoring, prevention, and control measures, as well as, facilitating access to medications.
• Goal VII, Targets 9, 10 and 11: In order to reverse the loss of environmental
resources, the incorporation of sustainable development principles into the national policies and programs needs to be increased. Halving, by 2015, the proportion of people without sustainable access to safe drinking water and basic sanitation is possible. It is highly improbable, however, to reverse the current trends and improve significantly the lives of at least 235,000 slum dwellers as well as preventing the formation of new slums. For all three Targets, it is necessary to incorporate sustainable growth into national planning and improve sustainable access to safe drinking water and basic sanitation services.

21
• Goal VIII, Target 17: In cooperation with pharmaceutical companies, providing access to affordable essential drugs in developing countries. There needs to be compliance with Law 20-00 and the Industrial Property Law provisions must be used as a means to facilitate technological transfer. The country needs to participate in the joint sub-regional drug procurement initiative while adopting a generic drugs policy.
Regardless of the prescriptions for fulfillment of each individual Millennium Development Goal and Target mentioned above, the following issues remain as challenges to the achievement of all MDGs:
• The lack of adequately trained and motivated human resource personnel that perform duties effectively and adequately enough for human development is in stark contrast with the growing number of individuals on the payrolls.
• The poor quality of distribution and allocation of public expenditures, the absence of national priorities, and excessively misused or misspent resources.
• The inequitable distribution of resources and unequal access of the population to the goods and services available.
• The lack of quality services, whether in the areas of health, education, infrastructure, housing, sanitation, and access to nutrition.
• Unemployment and discriminatory practices against women and their autonomy, notwithstanding the fact that they have good access to the educational system.
• Lack of nationwide policies and continuity in government, due to favoritism, nepotism, careless spending, high turnover ratio in public sector positions, and the loss of trained human resources at the change of administration.
• The increasing lack of social commitment, confusing investment in social services with investment in infrastructure and public works as well as continuous extemporaneous action in the fight against poverty.
• Lack of multisectoral interventions and poor synergies between the various sectors, due to the inability to fully comprehend multisectoral issues such as streamlining gender.
• The notable deficiencies in databases and updated information. • Limited availability of: monitoring and evaluation mechanisms, results-based
execution, accountability, institutional policies, and sufficient monitoring capability on behalf of civil society institutions.
In order to address these challenges, the Working Groups developed a series of interventions along with their estimated costs, all of which are summarized in this Report.
22
IV. Interventions and investments by target area 1. Combating hunger and malnutrition
Combating hunger and malnutrition begins with the assumption that the economic and social cost in preventing malnutrition is minimal compared to the economic impact of hunger, measured in terms of the burden of medical care for malnourished children and mothers; the problem of school attendance, which is lagging as evidenced in the country’s excessive rate of desertion, low labor force productivity, as well as losses resulting from frequent child and maternal mortality. The term “hunger” used here refers not only to the physical action of not eating, but also the state of malnourishment as well as the challenge of insufficient food quality, where nutritional contents do not satisfy the minimum daily energy requirements a person needs to perform his or her vital functions. Malnutrition is the most direct effect of hunger, diminishing the individual’s physical functions, to the point of not allowing his or her proper bodily functions and processes to occur, such as growth, pregnancy, child development, and physical labor. The long-term effects of chronic malnutrition at an early age can be seen in the alteration of the physiological development of cerebral mass, intellectual quotient, and school performance.
Both hunger and malnutrition occur within the context of food insecurity. In the Dominican Republic, food insecurity is related to a problem of insufficient food supply, the inability to satisfy domestic demand due to low productivity, a lack of technology and technical expertise in the agricultural sector, and the fact that certain population groups lack the purchasing power to obtain food as well as the capacity to access the right foods required to prevent hunger and malnutrition.
Therefore, in the face of food insecurity, the most viable and sustainable strategy to overcome hunger and malnutrition does not depend upon social assistance, but defining, organizing, and adopting a complete set of initiatives that include:
• Improving the nutritional state of children under five years of age, pregnant women,
and nursing mothers; and • Incorporating beneficiaries into productive projects and guaranteeing them the
necessary income to cover the cost of their daily food intake.
Consequently, five intervention categories are proposed to reduce by half the percentage of persons whose level of food energy consumption is below the required minimum—1,900 kilocalories/person/day for women whose weight is 60 kilograms or higher, and 2,350 kilocalories for men whose weight is 79 kilograms or higher. The intervention categories are as follows:
• Nutrition. This category deals with nutrition and food hygiene to facilitate access to
the principal nutrients and micro nutrients for the most vulnerable population. The
23
vulnerable population is comprised mainly of children under the age of 5, pregnant teenagers, and aging adults. This category includes raising awareness among the population on proper food handling and food safety.
• Small-scale agricultural production. Support for this level of production has been conceived with the dual purpose that beneficiaries, besides producing their own food, also generate income that will allow them to have access to other products for their daily intake.
• Distribution and commercialization of food products. The purpose of this category is to make primary food commodities more accessible by building warehouses and storage centers in strategic places at urban and rural levels.
• Employment. In order to generate income, this category of interventions proposes installing micro-enterprise units to process, assemble, and export agricultural products, as well as, arts and crafts, handmade goods, and agricultural and non agricultural services that may generate employment and fulfill the income needs of poor and hungry families.
• Services. This category is limited to support the interventions as a way to make the productive processes and other activities more feasible and efficient.
The Needs Assessment for MDG 1, Target 2 proposes that significant investment alone will not guarantee a reduction in hunger, malnutrition, and poverty. In order to tackle malnutrition, there must be a strong political commitment to:
1. Reduce vitamin A, iron, folic acid, and iodine deficiencies. 2. Promote investments that have proven to be effective: for instance, breast
feeding, iodization of salt, fortification of food with vitamin A, iron, and folic acid; better nutritional practices in the post-breast feeding stage, including zinc supplements during cases of diarrhea as well as the provision of micro nutrients for children, pregnant women, and breast feeding mothers.
In relation to production, storage, distribution, and commercialization of agricultural products, the leading policies promoted should confront:
1. The lack of competitiveness of sprayed crop producers that are not organized and face fierce competition when there is no government protection, technology, or appropriate sanitary conditions.
2. Poor participation of small scale farmers in trading of imports and exports.
3. Limited negotiating capacity of producers, which forces them to accept price conditions imposed by intermediaries who buy wholesale. 4. The vulnerability of producers who lack of credit and are therefore unable to participate effectively in the market. 5. Lack of extension and training programs for technicians and producers on trade.

24
6. Poor distribution of products due to the presence of too many trading agents.
7. Lack of proper storage infrastructure and transportation.
8. Institutional weakness of local enterprises, particularly in areas of performance, information, disclosure, oversight, evaluation, and accountability.
Due to the inherent connection between poverty and hunger, where households with chronic malnutrition invest 82% of their income in food purchases without receiving a balanced diet or better living conditions, the proposed interventions address geographical areas that have the largest concentration of extreme poverty.
The provinces with the worst poverty indexes are: Elías Piña, Bahoruco, San Cristóbal, Barahona, and María Trinidad Sánchez. The worst regional areas include El Valle, Enriquillo, “bateyes” (a series of cement shelters without electricity and running water for sugar cane workers), and the Haitian-Dominican border region. Additional poor areas include: El Seybo, Monte Plata, and the slums in the metropolitan areas of Santo Domingo and Santiago.
In demographic terms, the goal is to reduce the 27% of a total 6,810,000 Dominicans who suffered from malnutrition in 1990 to 13.5%, of an estimated total of 10,436,236 for the year 2015. Therefore, the fight against hunger and malnutrition will help, in absolute terms, the extremely poor that live in the aforementioned impoverished regions. The summary below presents the costs associated with achieving MDG 1, Target 2. These costs are detailed in the matrix of interventions shown in the Annex. The complete presentation of Combating Hunger and Malnutrition may be consulted in greater detail in the Report of the Working Group listed in the Bibliography.
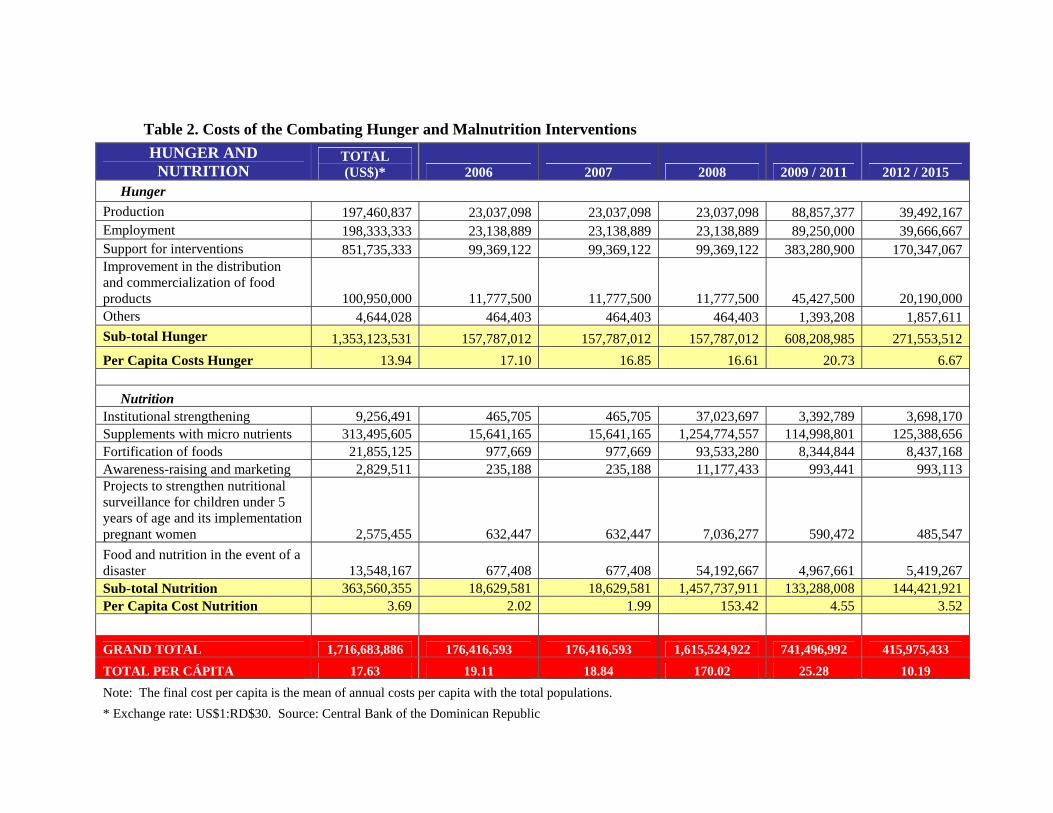
Table 2. Costs of the Combating Hunger and Malnutrition Interventions
HUNGER AND NUTRITION
TOTAL (US$)* 2006 2007 2008 2009 / 2011 2012 / 2015
Hunger Production 197,460,837 23,037,098 23,037,098 23,037,098 88,857,377 39,492,167Employment 198,333,333 23,138,889 23,138,889 23,138,889 89,250,000 39,666,667Support for interventions 851,735,333 99,369,122 99,369,122 99,369,122 383,280,900 170,347,067Improvement in the distribution and commercialization of food products 100,950,000 11,777,500 11,777,500 11,777,500 45,427,500 20,190,000Others 4,644,028 464,403 464,403 464,403 1,393,208 1,857,611Sub-total Hunger 1,353,123,531 157,787,012 157,787,012 157,787,012 608,208,985 271,553,512Per Capita Costs Hunger 13.94 17.10 16.85 16.61 20.73 6.67
Nutrition Institutional strengthening 9,256,491 465,705 465,705 37,023,697 3,392,789 3,698,170Supplements with micro nutrients 313,495,605 15,641,165 15,641,165 1,254,774,557 114,998,801 125,388,656Fortification of foods 21,855,125 977,669 977,669 93,533,280 8,344,844 8,437,168Awareness-raising and marketing 2,829,511 235,188 235,188 11,177,433 993,441 993,113Projects to strengthen nutritional surveillance for children under 5 years of age and its implementation pregnant women 2,575,455 632,447 632,447 7,036,277 590,472 485,547Food and nutrition in the event of a disaster 13,548,167 677,408 677,408 54,192,667 4,967,661 5,419,267Sub-total Nutrition 363,560,355 18,629,581 18,629,581 1,457,737,911 133,288,008 144,421,921Per Capita Cost Nutrition 3.69 2.02 1.99 153.42 4.55 3.52 GRAND TOTAL 1,716,683,886 176,416,593 176,416,593 1,615,524,922 741,496,992 415,975,433 TOTAL PER CÁPITA 17.63 19.11 18.84 170.02 25.28 10.19 Note: The final cost per capita is the mean of annual costs per capita with the total populations. * Exchange rate: US$1:RD$30. Source: Central Bank of the Dominican Republic
2. Education
The real objective of every educational process is that students learn. In the case of the MDGs, however, learning does not only mean that students attend school and graduate. It means that students attend school, graduate, and receive a quality education.
In the Dominican Republic, the education goal, within the context of MDG 2, is that, by 2015, all 15 year olds will have completed nine-years of quality primary education.
The “quality of education” is at the center of the Dominican approach to achieving MDG 2 which requires, at least:
• A full evaluation and re-designing of the education program; • Updating teacher training and relevant curriculum with global content that
unifies society and helps the country in its quest for sustainable and competitive global integration;
• Providing sufficient educational resources; • Hiring educators for 35 hours per week, distributed according to their teaching
responsibilities; • Setting a timetable and school calendar that will facilitate the learning process; • Implementation of a school infrastructure investment strategy that will reduce
the overuse and abuse of current educational infrastructure, and; • Elimination of the three primary challenges facing the Dominican education
system: repetition, overage students, and early desertion.
To achieve MDG 2, the Dominican Republic cannot afford to invest in assistance and coverage only, without focusing on quality and effective teaching that produces results. Achieving MDG 2 will require effective policies and interventions that address:
1. School year 2007-2008, must ensure 100% matriculation of 6 year-old children to quality first grade primary level education.
2. School year 2008-2009, must ensure that children under the age of 5 attend preschool.
3. Directly confront challenges that students face in terms of school registration (i.e. creation of the school identification card – I.D.) in order to monitor repetition, overage student indexes, and early desertion within the system, while establishing legal mechanisms to compel mothers, fathers, guardians, and/or tutors to register their children in school and ensure they remain until they complete a full cycle of primary education and/or reach 16 years old.
4. Improve the quality of secondary education as an incentive for completing primary education, while at the same time, responding to the demand for quality education.
5. Drastically reduce the rates of repetition, overage student indexes, and early desertion, in order to ensure that children complete primary education on time

27
without extending the years of their cycle, which would overload both primary and secondary education.
6. Strengthen adult education to: ensure that all citizens receive a basic primary education, promote educated parents that are committed to sending their children to school, and help overage students who have been asked to leave schools due to their age.
7. Organize and strengthen the educational system as an institution, simplifying it; and promoting the active participation of different social, municipal, and community sectors.
8. Define the innovative participation of universities in training teachers, as well as administrative and technical staff, in the fields of research and educational innovation.
9. Reduce social challenges affecting adequate school attendance and performance.
10. Raise awareness and mobilize Dominican society towards the importance of quality education.
11. Eliminate job instability for teachers and staff as a means of institutionalizing the teaching-learning process and guaranteeing a fair remuneration based on performance evaluations.
In addition to the quality of education, the efficiency of the services provided are affected by factors including political and social support, public education expenditures per student, and the socio-economic class of students. For these reasons, it is important to highlight the importance of promoting equality in the Dominican educational system in order to compensate for the disadvantages related to underprivileged students. In order to address the inherent inequality that exists, it is necessary to include additional interventions that require more political support as well as financial resources. Therefore, the matrix of interventions encompasses each area of the student body, from the preschool level to the secondary level; and details the requirements for the teacher staff training, curriculum development, infrastructure; technological resources needed for learning, support to low-income students, and evaluation of performance in the education sector. The summary below presents the costs associated with achieving MDG 2. These costs are detailed in the matrix of interventions shown in the Annex. The complete presentation of Education may be consulted in greater detail in the Report of the Working Group on Education listed in the Bibliography.
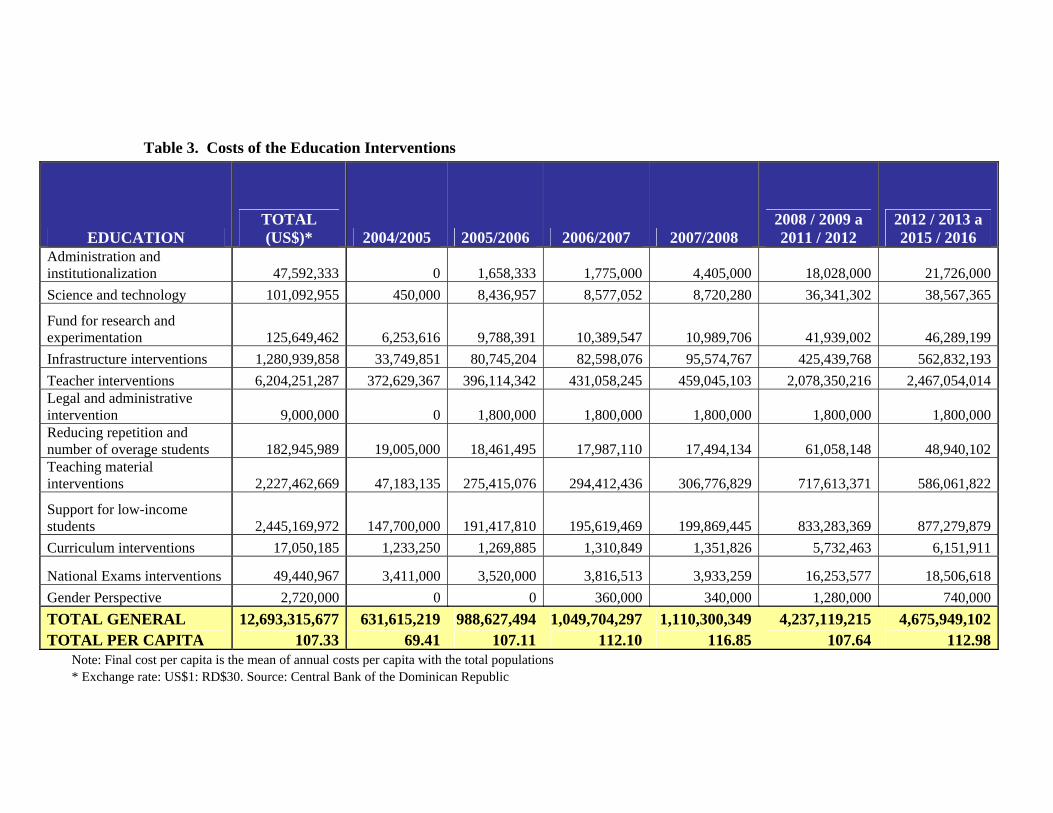
Table 3. Costs of the Education Interventions
EDUCATION TOTAL (US$)* 2004/2005 2005/2006 2006/2007 2007/2008
2008 / 2009 a 2011 / 2012
2012 / 2013 a 2015 / 2016
Administration and institutionalization 47,592,333 0 1,658,333 1,775,000 4,405,000 18,028,000 21,726,000 Science and technology 101,092,955 450,000 8,436,957 8,577,052 8,720,280 36,341,302 38,567,365
Fund for research and experimentation 125,649,462 6,253,616 9,788,391 10,389,547 10,989,706 41,939,002 46,289,199 Infrastructure interventions 1,280,939,858 33,749,851 80,745,204 82,598,076 95,574,767 425,439,768 562,832,193 Teacher interventions 6,204,251,287 372,629,367 396,114,342 431,058,245 459,045,103 2,078,350,216 2,467,054,014 Legal and administrative intervention 9,000,000 0 1,800,000 1,800,000 1,800,000 1,800,000 1,800,000 Reducing repetition and number of overage students 182,945,989 19,005,000 18,461,495 17,987,110 17,494,134 61,058,148 48,940,102 Teaching material interventions 2,227,462,669 47,183,135 275,415,076 294,412,436 306,776,829 717,613,371 586,061,822
Support for low-income students 2,445,169,972 147,700,000 191,417,810 195,619,469 199,869,445 833,283,369 877,279,879 Curriculum interventions 17,050,185 1,233,250 1,269,885 1,310,849 1,351,826 5,732,463 6,151,911
National Exams interventions 49,440,967 3,411,000 3,520,000 3,816,513 3,933,259 16,253,577 18,506,618 Gender Perspective 2,720,000 0 0 360,000 340,000 1,280,000 740,000 TOTAL GENERAL 12,693,315,677 631,615,219 988,627,494 1,049,704,297 1,110,300,349 4,237,119,215 4,675,949,102 TOTAL PER CAPITA 107.33 69.41 107.11 112.10 116.85 107.64 112.98
Note: Final cost per capita is the mean of annual costs per capita with the total populations * Exchange rate: US$1: RD$30. Source: Central Bank of the Dominican Republic

3. Gender Equality and Women’s Empowerment
Bridging the gender divide in the Dominican Republic in the education sector has not only encompassed the elimination of stereotypes or discriminatory practices towards girls, adolescents, and women in general. It has taken MDG 3 beyond Target 4 to include an approach that assumes a larger movement of demonstrating that gender equality is not only a women’s issue, but a systemic and cross-sectoral issue embedded in national culture and development. As a result of this greater approach to gender equality in the Dominican Republic, the main objectives of the interventions include:
• Eliminating existing gender gaps in the access and use of basic services, such as health, education, housing, water, and sanitation.
• Providing necessary conditions for equality in political participation and representation, and the workplace, as well as access to financing and the right to property and inheritance.
• Changing cultural values and behavioral patterns that induce discrimination and violence against women.
These three objectives depend upon the implementation of the following policies and measures:
1. Legal and regulatory changes: a) introduction, congressional
approval, and Presidential enactment of the Bill on Parity in Electoral and Administrative Positions in Government and the Political Parties Law; b) modification of the Civil Law and Family Code to align the rights relative to partition of assets in the different types of unions; c) modification of the Labor Code and its application of regulations to incorporate aspects of the Convention on the Elimination of Discrimination Against Women (CEDAW) and eliminate discriminatory elements in the workplace and in salaries; d) implementation of Law 55-97 through the promotion of policies and agrarian reform that increases the percentage of land assigned to women, according to the law.
2. Institutional policies: adoption of concrete national policy that
achieves women’s empowerment by strengthening the Ministry for Women’s Affairs (SEM) as the lead institution for the promotion of gender equality, which would work to collaborate with government agencies and institutions to promote gender policy and eliminate the various institutional spheres of gender inequality in administration, monitoring, and evaluation.

30
3. Reform of norms and cultural patterns: changes in the national educational system, beginning with its curricula and ending with training and teaching practices. At the same time, there is the need for broad consensus within society concerning the need to eliminate gender gaps and inequalities.
In keeping with the main objectives of gender equality and women’s empowerment as a cross-cutting issue, the interventions for this MDG are divided into two categories: a) interventions to be financed within the framework of MDG 3, and, as such, directly executed by the Ministry for Women’s Affairs (SEM); and b) interventions whose profile falls within the framework of other MDGs, and therefore, are included in the costing analysis, budget, and programs of other government agencies.
The Ministry for Women’s Affairs will be charged with implementing a total of 140 interventions in five critical areas:
• Raising awareness on sexual and reproductive health: 21
interventions to raise awareness in schools and communities; training members of Congress, decision-makers, and medical personnel on sexual and reproductive health; and research and data collection;
• Transition of girls and adolescent women from schools to the
workplace: 16 interventions to help the transition from school to the workplace as well as promotion of technical-vocational education and technology;
• Participation and political representation of women: 18 interventions
directed towards the use of quotas and other legal provisions relative to the participation and political representation of women, training and support of women candidates for political and governmental positions, and support for women elected to public office;
• Elimination of gender violence: 28 interventions aimed at
prevention, protection, attention, and punishment for violence against women, which include the importance of raising awareness and consciousness of the problem, conducting public campaigns, strengthening community support groups, and providing open telephone communications at community care centers. The actions aimed at providing protection and care for gender violence victims include temporary housing, medical and psychiatric care, legal assistance, and social services. In order to effectively penalize gender violence offenders there are interventions directed towards training the judicial system and the police force.

31
• Systemic matters: 57 interventions are directed towards systemic, institutional, and structural reforms; including mainstreaming gender, defending equal rights to property and inheritance, and promoting equal employment opportunities.
Twenty-four interventions will be executed by other government agencies and they fall under the following areas: education, health, environmental sustainability, nutrition, and development of urban and rural infrastructures.
The summary below presents the costs associated with achieving MDG 3. These costs are detailed in the matrix of interventions shown in the Annex. The complete presentation of gender equality may be consulted in greater detail in the Report of the Working Group on Gender Equality and Women’s Empowerment listed in the Bibliography.

Table 4. Costs of the Gender Equality and Women’s Empowerment Interventions GENDER
EQUALITY AND WOMEN’S
EMPOWERMENT TOTAL* 2005 2006 2007 2008 2009 / 2011 2012 / 2015 Awareness on sexual and reproductive health 13,100,000 72,000 820,000 1,218,000 1,458,000 4,290,000 5,242,000 Transition of adolescents and young women from schools to the workplace 4,146,000 - 79,000 490,000 450,000 1,329,000 1,798,000 Political participation 7,214,000 136,000 416,000 686,000 716,000 2,272,000 2,988,000 Elimination of violence against women 129,800,496 3,097,055 6,981,555 8,724,944 10,234,944 37,241,499 63,520,499 Systemic matters 42,944,000 103,000 5,715,000 5,670,000 5,756,000 11,020,000 14,680,000 Defense of equal rights to property and inheritance 1,687,000 - 355,000 161,000 145,000 446,000 580,000 Defend equal rights to employment 889,000 - 242,500 224,500 268,500 31,500 122,000 Total 199,780,496 3,408,055 14,609,055 17,174,444 19,028,444 56,629,999 88,930,499 Per Capita Cost 1.84 0.37 1.58 1.83 2.00 1.93 2.17 Note: Final cost per capita is the mean of annual costs per capita and the total populations. * Exchange rate: US$1:RD$30. Source: Central Bank of the Dominican Republic
4. Health
In the case of health, the Dominican Republic aims to achieve results beyond those enshrined in MDGs 4, 5, 6, and Target 17 of MDG 8. As early as the year 2002, apart from the national commitment to achieving the MDGs, an agreement had been reached regarding interventions with respect to basic healthcare offered to the Dominican population, without distinction between socioeconomic level or health-plans. Although the agreement, more formally referred to as the Basic Health Plan (Plan Básico de Salud), has faced challenges towards implementation, the Dominican Republic has maintained a strict agenda towards providing a benchmark for socially equitable health-care protection. For this reason, all efforts towards reducing child mortality, maternal mortality; the spread of HIV/AIDS, tuberculosis, and malaria, as well as improving access to essential medicines, are evaluated in the context of “MDG Plus”. The concept of “MDG Plus” in the Dominican health sector signifies that the fundamental components of the Basic Health Plan (BHP), supported by the Dominican General Health Law and the Dominican Social Security System, have become fundamental to the pursuit of achieving the health related MDGs in the Dominican Republic. With the partial integration of the BHP and the MDGs, the traditional health agenda, which has normally focused on infrastructure development, the promotion of medical technology, laws and norms, is now directed towards a “new agenda for health”. The new agenda is characterized by analysis, evidence, and a results-based approach that includes achievement of the health MDGs, the BHP; improving access, quality, and equality; and responsible fiscal policy in the health sector, which aims to guarantee financial stability for the plans and programs being executed. In general, prioritizing interventions for MDGs 4, 5, 6, and 8 (Target 17) requires strengthening public health policies that are related to the following essential functions:
1. Monitoring, evaluation and analysis of the health situation. 2. Monitoring public health, research, and damage control. 3. Health promotion. 4. Citizen participation in processes related to health services. 5. Development of institutional capacity for public health planning and
administration. 6. Strengthening the institutional capability for regulating and
controlling public health.
34
7. Evaluating and promoting equal access to basic primary services. 8. Human resource development and public health training. 9. Improve the quality of health services, both individually and
collectively. 10. Public health research.
The MDG Needs Assessment for the health sector in the Dominican Republic resulted in a series of interventions that were divided into four main components:
• Human resources. The quantity and quality of the personnel are
essential if the country is to significantly improve the current situation. Additionally, human resources should be distributed equally nationwide in order to ensure the equitable delivery of high quality services.
• Health systems. Addressed towards meeting the basic needs of the
population without distinction of social class, religion, race, and geographical location. The goal of the health system is to end gender and health (provision and prevention) inequality as well as overcome quality deficiencies, which produce high levels of maternal and child mortality.
• Direct interventions:
o Child health. Special significance is given to the neonatal
integrated set that should allow for a clean birth, with adequate measures for resuscitation of the newborn, prevention of hypothermia, direct mother-child contact, availability of antibiotics and tetanus vaccines, breastfeeding and general hygiene education. At the same time, neonatal and maternity services must be accredited and adequately equipped.
o Maternal health. Among the intervention packages suggested,
a high priority was given to emergency obstetric care to offer quick access to treatment and prevention of complications during pregnancy and birth, such as, eclampsia, hemorrhage, prolonged labor and septicemia; capacity-building for public health staff, the establishment of accountability for those who provide maternal care, and access to contraceptive methods, especially those that are non-permanent.
o HIV/AIDS. Intervention packages are based on actions
aimed at specific populations. The main challenge is to promote solidarity and progressively reduce the Dominican
35
Republic’s dependency on external aid, signifying a shift in priorities within the country agenda.
o Tuberculosis. In order to halt and reduce the incidence of
tuberculosis, actions must be undertaken to detect the illness as well as increase effective coverage of the DOTS strategy up to 100% of all detected cases, to cure 95% of the cases.
o Malaria. Interventions aim to confront this endemic disease
on the island of Hispaniola by having more efficient epidemiological & entomological oversight while implementing preventive measures and fast control of epidemic outbreaks.
• Infrastructure. The largest hospital in the Dominican Republic was
built in the late 1950’s and primary care units in rural areas in the 1980’s. Consequently, a major scaling-up of health infrastructure should focus on the development of primary care facilities, which would fulfill the needs of the country before the year 2010, as well as special ambulatory centers and a new regional network of hospitals.
The summary below presents the costs associated with achieving MDG 4, 5, 6, and 8 (Target 17). These costs are detailed in the matrix of interventions shown in the Annex. The complete presentation of health may be consulted in greater detail in the Report of the Working Group on Health and HIV/AIDS listed in the Bibliography.

Table 5. Costs of Health and HIV/AIDS Interventions
HEALTH & HIV/AIDS TOTAL (US$)* 2005 2006 2007 2008 2009-2011 2012-2015
Health system 2,232,149,094 138,013,359 160,457,831 162,270,838 184,282,101 602,875,692 984,249,273 Human resources 2,608,558,996 126,464,303 168,725,593 170,960,073 232,052,040 781,636,997 1,128,719,989 Infrastructure 2,942,733,550 133,853,841 136,734,414 152,274,152 172,147,580 951,400,833 1,396,322,731 Maternal health 110,629,348 7,916,647 8,528,861 8,869,706 9,284,975 30,272,005 45,757,154 Child health 248,880,448 16,599,371 18,087,132 19,241,903 20,382,541 69,136,731 105,432,770 HIV/AIDS 440,346,682 2,201,733 1,538,233 2,612,914 4,438,418 42,099,817 387,455,566 Tuberculosis 36,946,726 3,639,841 4,089,203 3,916,015 3,736,234 10,245,706 11,319,728 Malaria 3,587,731 324,720 324,805 324,805 324,805 979,112 1,309,485 GRAND TOTAL 8,623,832,576 429,013,814 498,486,071 520,470,407 626,648,695 2,488,646,893 4,060,566,695 PER CÁPITA COSTS 79.34 47.15 54.01 55.59 65.96 94.84 106.99
Note: Final cost per capita is the mean of annual per capita costs with the total population. * Exchange rate: US$1: RD$30. Source: Central Bank of the Dominican Republic.
5. Environment
In the Dominican Republic, integrated water management is the threat common to all three targets of MDG 7 where conservation of water reservoirs at high altitude water basins serve as the key element for promoting environmental policy and public intervention. As a result, Targets 10 and 11 of MDG 7, which focus on access to safe drinking water, sanitation, as well as improving the lives of 235,000 slum dwellers, cannot be achieved without equitable access and rational use of freshwater resources. Therefore, the Working Group has established that the sustainable development of water management is equally important to the achievement of Target 9, which presents the integration of sustainable development principles into country policies and programs. The adequate management of the water basins depends upon reversing the increasing deterioration of rivers and aquifers in the Dominican Republic as well as reducing the physical, social, and epidemiological vulnerabilities produced by a lack of adequate integrated water management in the country. Taking into consideration the adaptation of the three Targets to the realities of the Dominican Republic, the Working Group established a set of policy guidelines that include:
1. Reforming the legal and institutional framework for managing the
public water system in the Dominican Republic. To this end, the Dominican Republic must differentiate between the regulatory role (control), resource management, and provision of services; include water rights, a national Water Plan, a system for resource-measurement (metering water), and an integrated hydrological-resource information system (to aid in decision-making and serve as the basis for managing early-warning systems for droughts and flooding).
2. Setting quality standards for each one of our rivers and aquifers and
strengthening the monitoring systems of the Ministry of Environmental and Natural Resources (SEMARN) and other government agencies related to water management.
3. Develop a framework for environmental regulation and monitor the
ability to change agricultural practices in order to preserve the availability and quality of water.
4. Strengthen the Water Culture program as a strategy for conservation,
which should extend to all of Dominican society, with the

38
participation of key sectors, such as agriculture, tourism, local governments, among others.
5. Develop a national strategy for solid waste management, with
mechanisms for participation and consensus among key actors. This strategy should have an effect on the population’s health and water resource conservation.
In prioritizing the interventions, the main criterion used was to seek “quick-wins” as well as synergies with the other MDGs and Targets. The notion of water as the common thread for achieving the three targets of MDG 7 should have a favorable impact on Dominican citizens’ health, while creating cost-effective and sustainable methods for activities including farming, tourism, and household chores for women. Additionally, it would reduce the potential for conflict among users who compete for water in places where it is scarce, especially for safe water consumption. Given the decision to prioritize MDG 7 interventions, the Working Group decided to maintain water as the common thread throughout all three MDG 7 Targets, acknowledging that important environmental issues would remain pending for the near future, beyond the immediate publication of the MDG Needs Assessment, including: management of marine and costal resources; solid waste, and air pollution. The interventions were prioritized according to the health regions that display the highest levels of freshwater and sanitation deficiencies, due to high morbidity from diarrhea. This was the case in regions 4, 6, and 8, which presented lower levels of quality in the safe drinking water and sanitation services and also had the highest prevalence of diarrhea.
A total of 1,037,400 Dominican citizens live in the three regions, which include the provinces of Barahona, Bahoruco, Independencia, Pedernales, Dajabón, Montecristi, Santiago Rodríguez, Valverde, Elías Piña, and San Juan de la Maguana.
Due to the fact that the living conditions of slum dwellers include poor health and various dimensions of extreme poverty, the MDG Needs Assessment interventions for the urban areas were prioritized with the interest of improving the housing and living conditions of the urban population residing in the three mentioned regions, as well as the marginalized urban areas of the capital city Santo Domingo and Santiago. The interventions addressed:
• Provinces and towns with the highest rates of population growth and other urban zones with slum dwellings.

39
• Settlements on the Haitian-Dominican border or vulnerable coastal areas where large natural disasters have occurred in the 2001-2005 period.
• Towns and smaller population centers linked to strategic sectors: tourist resorts, free trade zones, or communication infrastructures including seaports and airports.
• Towns linked to farming agriculture—sugar cane, coffee, and rice producing areas—or sustainable economic and environmental resources—organic agriculture.
• Settlements with high indicators of social mobilization, urban violence, and/or criminality, according to the statistics made available.
The summary below presents the costs associated with achieving MDG 7. These costs are detailed in the matrix of interventions shown in the Annex. The complete presentation of environment may be consulted in greater detail in the Report of the MDG 7 Working Group listed in the Bibliography.

Table 6. Costs of Environment Interventions
ENSURE ENVIRONMENTAL SUSTAINABILITY
TARGET 9: ENVIRONMENT TOTAL (US$)* 2006 2007 2008 2009 / 2011 2012 / 2015
Forest cover 48,748,357 7,269,569 7,211,569 7,169,319 16,782,300 10,315,600 Protected areas 42,876,571 16,907,071 13,358,500 1,814,500 4,723,500 6,073,000 Use of renewable energy 1,369,239 186,667 1,115,906 66,667 - -Reduction of emissions 3,580,000 2,280,000 500,000 100,000 300,000 400,000 Reduction in the use of solid fuels 325,000 162,500 162,500 - - -Gender Perspective 4,601,361 534,660 534,660 80,925 1,331,703 1,719,412 GRAND TOTAL 101,500,528 27,340,467 22,883,135 9,631,411 23,137,503 18,508,012 COST PER CAPITA 1.06 2.96 2.44 1.01 2.37 1.81
TARGET 10: WATER AND SANITATION
TOTAL (US$)* 2006 2007 2008 2009 / 2011 2012 / 2015
Coverage of urban water 551,016,046 60,449,212 53,228,830 54,041,173 163,065,516 220,231,314 Coverage of rural water 225,735,101 24,826,398 22,365,720 21,603,496 66,072,987 90,866,501 Chlorination 4,100,000 1,775,000 775,000 775,000 775,000 - Sanitary control 250,000 250,000 - 0 - - Unaccounted water 48,440,000 5,438,000 5,438,000 5,438,000 15,026,000 17,100,000
Coverage urban sanitizing 807,778,166 80,355,981 81,008,784 82,859,344 244,401,491 319,152,566 Coverage rural sanitizing 42,825,240 $4,282,524 4,282,524 4,282,524 12,847,572 17,130,096
Operation of service agencies 1,430,639,309 123,989,137 128,155,899 132,263,966 422,324,736 623,905,570 GRAND TOTAL 3,110,783,863 301,366,252 295,254,757 301,263,503 924,513,303 1,288,386,048
COST PER CAPITA 31.62 32.65 31.53 31.71 31.51 31.43
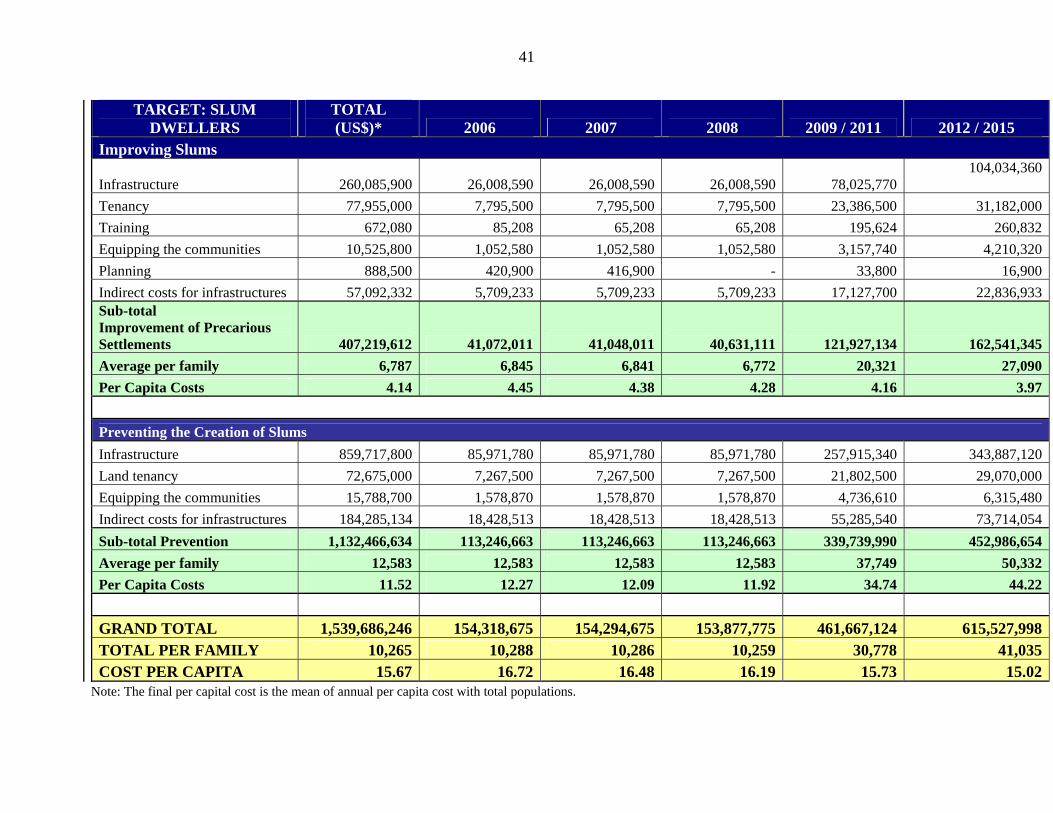
41
TARGET: SLUM DWELLERS
TOTAL (US$)* 2006 2007 2008 2009 / 2011 2012 / 2015
Improving Slums
Infrastructure 260,085,900 26,008,590 26,008,590 26,008,590 78,025,770 104,034,360
Tenancy 77,955,000 7,795,500 7,795,500 7,795,500 23,386,500 31,182,000 Training 672,080 85,208 65,208 65,208 195,624 260,832 Equipping the communities 10,525,800 1,052,580 1,052,580 1,052,580 3,157,740 4,210,320 Planning 888,500 420,900 416,900 - 33,800 16,900 Indirect costs for infrastructures 57,092,332 5,709,233 5,709,233 5,709,233 17,127,700 22,836,933 Sub-total Improvement of Precarious Settlements 407,219,612 41,072,011 41,048,011 40,631,111 121,927,134 162,541,345 Average per family 6,787 6,845 6,841 6,772 20,321 27,090 Per Capita Costs 4.14 4.45 4.38 4.28 4.16 3.97 Preventing the Creation of Slums Infrastructure 859,717,800 85,971,780 85,971,780 85,971,780 257,915,340 343,887,120 Land tenancy 72,675,000 7,267,500 7,267,500 7,267,500 21,802,500 29,070,000 Equipping the communities 15,788,700 1,578,870 1,578,870 1,578,870 4,736,610 6,315,480 Indirect costs for infrastructures 184,285,134 18,428,513 18,428,513 18,428,513 55,285,540 73,714,054 Sub-total Prevention 1,132,466,634 113,246,663 113,246,663 113,246,663 339,739,990 452,986,654 Average per family 12,583 12,583 12,583 12,583 37,749 50,332 Per Capita Costs 11.52 12.27 12.09 11.92 34.74 44.22 GRAND TOTAL 1,539,686,246 154,318,675 154,294,675 153,877,775 461,667,124 615,527,998 TOTAL PER FAMILY 10,265 10,288 10,286 10,259 30,778 41,035 COST PER CAPITA 15.67 16.72 16.48 16.19 15.73 15.02
Note: The final per capital cost is the mean of annual per capita cost with total populations.
6. Infrastructure
The fact that infrastructure is common to the achievement of all MDGs, the Working Group on Infrastructure, led by the Coordinator of the Dominican Government’s Environment and Physical Development Cabinet, collected all interventions of the MDG Needs Assessment dealing with infrastructure and in addition, evaluated the country’s needs concerning rural electrification and road maintenance. The purpose of the process was to positively influence the environmental sustainability and living conditions of the population that resides in marginalized areas.
There were four geographical areas analyzed for rural electrification: the Haitian-Dominican border; and the northern, southern, and eastern regions. Considering that 20% of the Dominican population lives without electricity, (equivalent to 342,000 families) interventions were grouped into two areas: extension and renovation of existing electrification network. The goal was to extend the national electrification index to 86%, during the period 2006-2010; and 91%, during the period 2011-2115.
In order to effectively improve living conditions in the rural areas of the Dominican Republic there is a need to extend the length of rural roads by no less than 10% of the current length of all existing roads and highways as well as rehabilitate 1,200km of the 17,000km. In order to ensure achievement of the MDGs, the Dominican Republic National Budget, the current projections, and investment in infrastructure will not exceed 8% of the current amount of resources the Government will manage over the course of the next ten years. The summary below presents the costs associated with bringing to fruition the infrastructure needs of all sectors in order to ensure the achievement of the MDGs. The costs are detailed below, but may be consulted in greater detail in the Report of the Working Group on Infrastructure listed in the Bibliography.

Table 7. Costs of the Infrastructure Interventions
INFRASTRUCTURE TOTAL (US$)* 2006 2007 2008 2009 / 2011 2012 / 2015
Road Maintenance
Road Maintenance 1,420,000,000 142,000,000 142,000,000 142,000,000 426,000,000 568,000,000
Sub-Total Road Maintenance 1,420,000,000 142,000,000 142,000,000 142,000,000 426,000,000 568,000,000
Cost Per Capita (Total Population) 14.45 15.38 15.17 14.94 14.52 13.86
Rural Electrification
Rural Electrification 75,600,000 9,520,000 9,520,000 9,520,000 24,640,000 22,400,000
Sub-Total Rural Electrification 75,600,000 9,520,000 9,520,000 9,520,000 24,640,000 22,400,000
Cost Per Capita (Total Population) 0.78 1.03 1.02 1.00 0.84 0.55
Gender Perspective Construction 30 Child Day Care Centers 8,010,000 801,000 801,000 801,000 2,403,000 3,204,000 Rehabilitation 43 Child Day Care Centers 731,000 68,000 68,000 85,000 221,000 289,000 Construction Shelters 1,135,000 227,000 454,000 454,000 - - Construction Emergency Centers 4,800,000 750,000 450,000 450,000 1,350,000 1,800,000 Furnishings Shelters 375,000 75,000 150,000 150,000 - - Furnishings Emergency Centers 480,000 75,000 45,000 45,000 135,000 180,000
Community Care Centers 720,000 40,000 240,000 60,000 180,000 200,000
Sub-Total Gender Perspective 16,251,000 2,036,000 2,208,000 2,045,000 4,289,000 5,673,000
Cost Per Capita (Total Population) 0.17 0.22 0.24 0.22 0.44 0.55
GRAND TOTAL 1,511,851,000 153,556,000 153,728,000 153,565,000 454,929,000 596,073,000 COST PER CAPITA 15.39 16.64 16.42 16.16 15.51 14.55
Note: The final per capital cost is the mean of annual per capita cost with total populations. * Exchange rate: US$1: RD$30. Source: Central Bank of the Dominican Republic

V. Conclusion: the Millennium Development Goals and their viability in the Dominican Republic
Achieving the MDGs in the Dominican Republic will cost the country US$29,297,434,271.00, or US$249.54 per capita for the next 10 years.
Table 8. Total cost per year and per MDG
INTERVENTION TOTAL (US$)* 2005 2006 2007 2008 2009 2010
Total annual population 9,100,183 9,229,855 9,363,652 9,501,724 9,644,227 9,791,320 HUNGER AND MALNUTRITION Grand Total 1,716,683,886 176,416,593 176,416,593 $206,378,275 251,327,592 251,327,592 Total Per Capita 17.63 19.11 18.84 $21.72 26.06 25.67 EDUCATION** 2004 / 2005*** 2005 / 2006 2006 / 2007 2007 / 2008 2008 / 2009 2009 / 2010 Grand Total 12,693,315,677 631,615,219 988,627,494 1,049,704,297 $1,110,300,349 1,157,897,586 991,877,552 Total Per Capita 107.33 69.41 107.11 112.10 116.85 120.06 101.30 GENDER EQUALITY Grand Total 199,780,496 3,408,055 14,609,055 17,174,444 19,028,444 17,710,833 19,035,333 Total Per Capita 1.84 0.37 1.58 1.83 2.00 1.84 1.94 HEALTH**** Grand Total 8,623,832,576 429,013,814 498,486,071 520,470,407 626,648,695 664,132,164 939,618,489 Total Per Capita 79.34 47.14 54.01 55.58 65.95 68.86 95.96 ENVIRONMENTAL SUSTAINABILITY Grand Total 4,751,970,636 483,025,394 472,432,566 464,772,688 469,395,390 475,817,857 Total Per Capita 48.34 52.33 50.45 48.91 48.67 48.60 INFRASTRUCTURE (electricity, roads and gender) Grand Total 1,511,851,000 153,556,000 153,728,000 153,565,000 152,961,000 152,944,000 Total Per Capita 15.39 16.64 16.42 16.16 15.86 15.62 GRAND TOTAL MDG 29,497,434,271 1,064,037,089 2,314,720,607 2,389,926,308 2,580,693,451 2,713,424,564 2,830,620,822 TOTAL PER CAPITA MDG 249.54 116.92 250.79 255.23 271.60 281.35 289.09
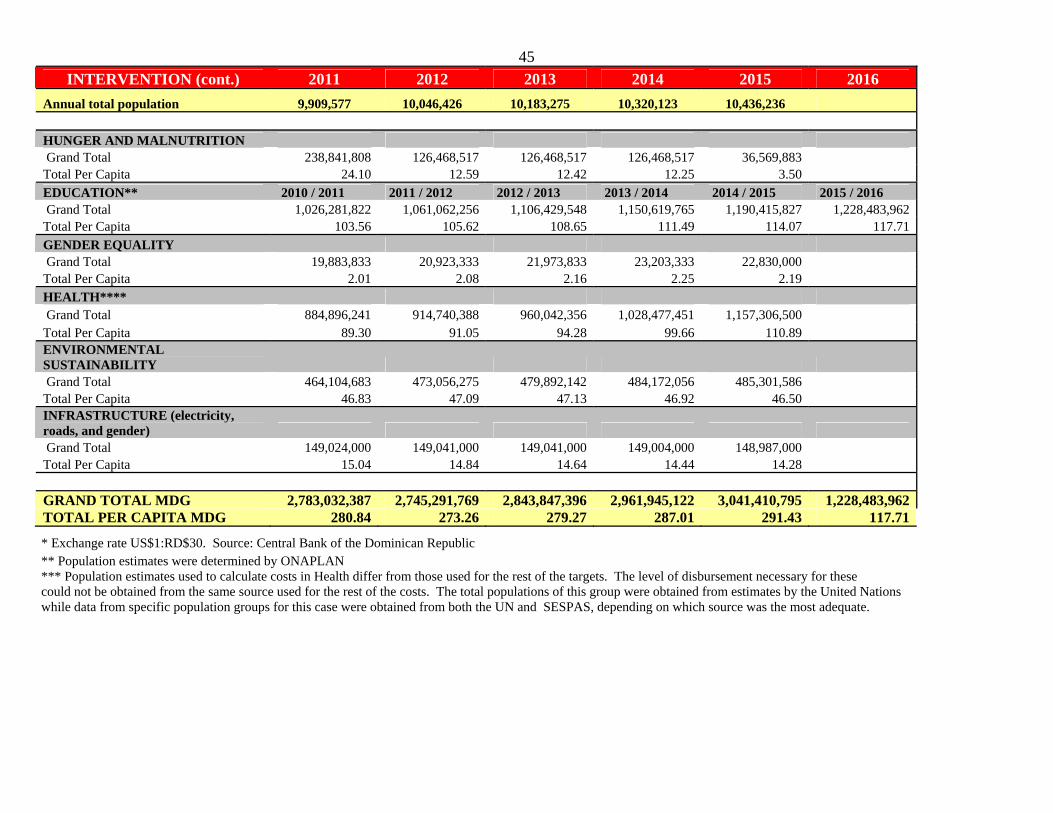
45
* Exchange rate US$1:RD$30. Source: Central Bank of the Dominican Republic ** Population estimates were determined by ONAPLAN *** Population estimates used to calculate costs in Health differ from those used for the rest of the targets. The level of disbursement necessary for these could not be obtained from the same source used for the rest of the costs. The total populations of this group were obtained from estimates by the United Nations while data from specific population groups for this case were obtained from both the UN and SESPAS, depending on which source was the most adequate.
INTERVENTION (cont.) 2011 2012 2013 2014 2015 2016 Annual total population 9,909,577 10,046,426 10,183,275 10,320,123 10,436,236 HUNGER AND MALNUTRITION Grand Total 238,841,808 126,468,517 126,468,517 126,468,517 36,569,883 Total Per Capita 24.10 12.59 12.42 12.25 3.50 EDUCATION** 2010 / 2011 2011 / 2012 2012 / 2013 2013 / 2014 2014 / 2015 2015 / 2016 Grand Total 1,026,281,822 1,061,062,256 1,106,429,548 1,150,619,765 1,190,415,827 1,228,483,962Total Per Capita 103.56 105.62 108.65 111.49 114.07 117.71GENDER EQUALITY Grand Total 19,883,833 20,923,333 21,973,833 23,203,333 22,830,000 Total Per Capita 2.01 2.08 2.16 2.25 2.19 HEALTH**** Grand Total 884,896,241 914,740,388 960,042,356 1,028,477,451 1,157,306,500 Total Per Capita 89.30 91.05 94.28 99.66 110.89 ENVIRONMENTAL SUSTAINABILITY Grand Total 464,104,683 473,056,275 479,892,142 484,172,056 485,301,586 Total Per Capita 46.83 47.09 47.13 46.92 46.50 INFRASTRUCTURE (electricity, roads, and gender) Grand Total 149,024,000 149,041,000 149,041,000 149,004,000 148,987,000 Total Per Capita 15.04 14.84 14.64 14.44 14.28 GRAND TOTAL MDG 2,783,032,387 2,745,291,769 2,843,847,396 2,961,945,122 3,041,410,795 1,228,483,962TOTAL PER CAPITA MDG 280.84 273.26 279.27 287.01 291.43 117.71
Now that it has been established, “what are the needs” and “what are the costs”, in order to achieve the MDGs, it is important to emphasize the following two recommendations:
1. Local Development Strategy: The prioritized interventions should follow a regional, provincial, and municipal strategy in order to avoid duplication or disproportionate concentration in certain areas, to the detriment of other areas.
2. Interventions and available resources: The Needs Assessment should
now embark on a plan that includes a connection between the prioritized interventions and the country’s National Budget, the community, and international cooperation. Due to the fact that annual resources do not always cover all needs, frustration can be avoided as well as the plagued notion of “all (everything has to be done) or nothing” (nothing can be done); with successful prioritization of budgetary resources.
At this point, we must reiterate that funding alone will not be sufficient to achieve the MDGs. The main obstacle to achieving the Goals, within the commitment assumed by the Dominican Republic at the 2000 U.N. Millennium Summit is not the lack of money. It is, however, the inadequate quality of expenditures and the shortage of human resources that possess the necessary technical and managerial skills.
As shown in Table 9 of this MDG Needs Assessment, the Dominican Republic possesses the necessary financial resources to execute the interventions presented herein. This signifies that the Dominican Republic is capable of financing the achievement of the MDGs with domestic resources, as long as it re-adjusts its priorities and receives sufficient political support. With this readjustment of priorities and political support, the Dominican Republic will focus its attention on the issues of technical and managerial skills of its human resources and the quality of expenditures, instead of being distracted with specific quantities of funds spent and non priority expenditures that, in the end, have a very marginal impact on the fight against poverty.

47
Table 9. Summary of results - Expenditures related with the MDGs (Exp-re-MDG) vs. MDG Needs Assessment Comparative Study
Total
Internal resources
External resources TOTAL
Expenses related to the MDGs 30,287,078,220 5,701,712,557 35,988,790,777
MDG Needs Assessment (US$)
29,497,434,271
MDG Needs Assessment / Expenses related to the MDGs 97% 82%
Average (2005-2015) 93% 78%
Note: Exchange rate US$1:RD$30. Source. Central Bank of the Dominican Republic In comparing Government expenditures related with the MDGs (Exp-re-MDG) with the total investment required to finance the interventions defined by the six working groups (MDG), we have determined the following:
1. In the 2005-2015 period, the estimated (Exp-re-MDG) accumulated is larger that the accumulated expenditures needed by the country to finance the interventions as defined by the MDG Needs Assessment within the framework of the MDGs. If this trend persists, the (Exp-re-MDG) accumulated will be US$35,988 millions as opposed to the U$$29,497 million representing expenditures in the accumulated interventions resulting in an absolute difference of 6,501 million.
2. The accumulated estimated expenditures required for the interventions
represent 80% of the estimated (Exp-re-MDG) and 97% of the estimated accumulated (Exp-re-MDG) financed with internal resources during the entire period.
3. The annual estimated expenditures on interventions for MDGs
represent, on average, 78% of the estimated annual total (Exp-re-
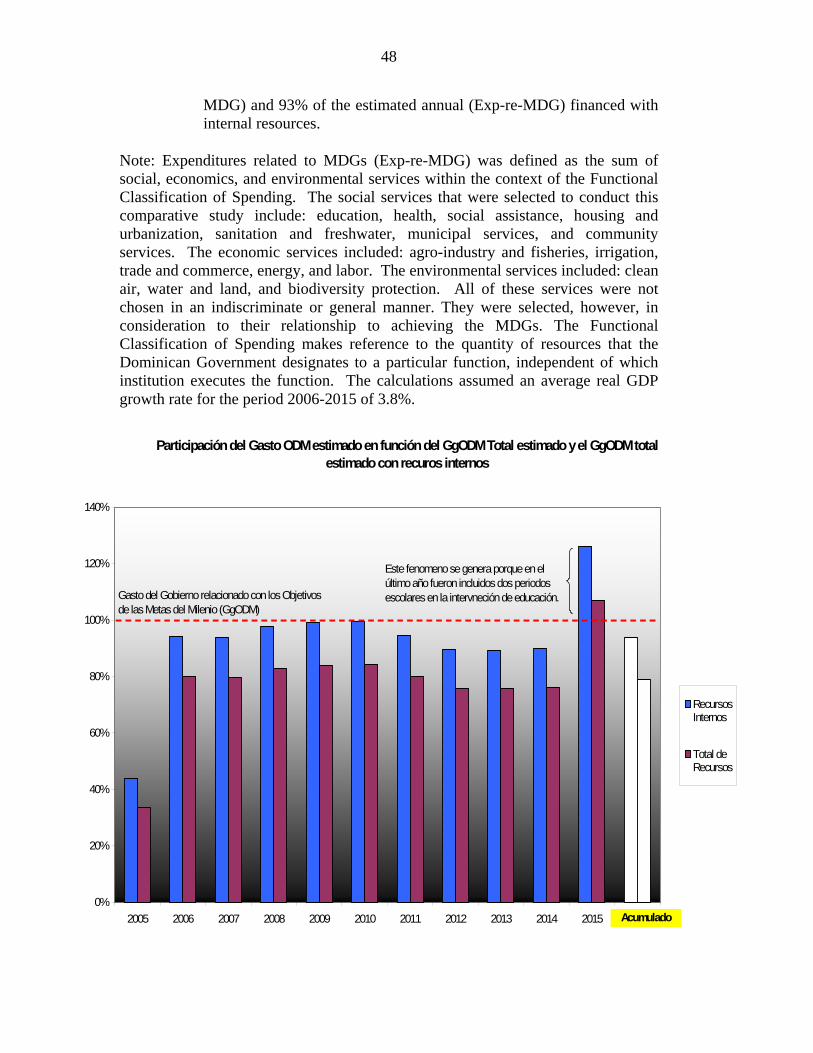
48
MDG) and 93% of the estimated annual (Exp-re-MDG) financed with internal resources.
Note: Expenditures related to MDGs (Exp-re-MDG) was defined as the sum of social, economics, and environmental services within the context of the Functional Classification of Spending. The social services that were selected to conduct this comparative study include: education, health, social assistance, housing and urbanization, sanitation and freshwater, municipal services, and community services. The economic services included: agro-industry and fisheries, irrigation, trade and commerce, energy, and labor. The environmental services included: clean air, water and land, and biodiversity protection. All of these services were not chosen in an indiscriminate or general manner. They were selected, however, in consideration to their relationship to achieving the MDGs. The Functional Classification of Spending makes reference to the quantity of resources that the Dominican Government designates to a particular function, independent of which institution executes the function. The calculations assumed an average real GDP growth rate for the period 2006-2015 of 3.8%.
Participación del Gasto ODM estimado en función del GgODM Total estimado y el GgODM total estimado con recuros internos
0%
20%
40%
60%
80%
100%
120%
140%
2005 2006 2007 2008 2009 2010 2011 2012 2013 2014 2015 2016
RecursosInternos
Total deRecursos
Este fenomeno se genera porque en el último año fueron incluidos dos periodos escolares en la intervneción de educación.
Acumulado
Gasto del Gobierno relacionado con los Objetivos de las Metas del Milenio (GgODM)
49
By redirecting expenditures and evaluating programs and their results, the country can easily achieve the MDGs by the year 2015 as well as free-up resources for other initiatives. Therefore, with the information available, this National MDG Needs Assessment Report assumes that the Dominican Republic could finance all investments pertinent to achieving the MDGs without having to resort indiscriminately to external financing, unless, of course, the weight of the external debt is increased and depletes the national finances.
The country can achieve the proposed Goals and Targets, if and when, it has access to trained and motivated human resource staff that has the ability to effectively manage financial resources while monitoring, in a transparent manner, the fair distribution, according to institutionally established regulatory parameters.
For these reasons, the allocation of investments must be accompanied by institutional reform, good policies, greater efforts to improve government accountability at all levels, and an active and participatory citizenry. Additionally, there must be a clear strategy for the decentralization of responsibilities within the public sector as well as a strategy for the private sector to promote enough economic growth in order to prepare the Dominican Republic for the gradual long-term reduction of international donor aid.
Finally, in order to bring the interventions detailed in this MDG Needs Assessment, target-by-target, to fruition, it will take time as well as the efforts of many sectors and interests. Nevertheless, with clear vision and sufficient political will of the Government as well as the interest of the Dominican people, we still have only 10 years left to reach these MDGs. It is more than enough time, only if we begin to work immediately.

Annex 1
Matrix of the interventions and costs of the Working Group on Combating Hunger and Malnutrition
HUNGER TOTAL (US$)* 2006 2007 2008 2009 / 2011 2012 / 2015
Production Horticultural production projects 34,733,333 4,052,222 4,052,222 4,052,222 15,630,000 6,946,667 Tree nursery facility 35,402,750 4,130,321 4,130,321 4,130,321 15,931,238 7,080,550 Farm animal module facility (Smaller animals – sheep and goat) 35,611,000 4,154,617 4,154,617 4,154,617 16,024,950 7,122,200
Small-scale rabbit production 2,139,200 249,573 249,573 249,573 962,640 427,840
Small pig module facility 11,000,000 1,283,333 1,283,333 1,283,333 4,950,000 2,200,000
Small layer-farm facility 37,680,000 4,396,000 4,396,000 4,396,000 16,956,000 7,536,000
Poultry production projects 31,218,000 3,642,100 3,642,100 3,642,100 14,048,100 6,243,600 Aquaculture projects 9,676,553 1,128,931 1,128,931 1,128,931 4,354,449 1,935,311 Sub-total production 197,460,837 23,037,098 23,037,098 23,037,098 88,857,377 39,492,167
Employment Micro businesses for processing, packaging and trading agricultural products 40,000,000 4,666,667 4,666,667 4,666,667 18,000,000 8,000,000 Micro businesses for processing, packaging and trading farm-animal products 38,333,333 4,472,222 4,472,222 4,472,222 17,250,000 7,666,667 Arts and crafts micro business facilities 40,833,333 4,763,889 4,763,889 4,763,889 18,375,000 8,166,667 Services and trade micro business facilities 79,166,667 9,236,111 9,236,111 9,236,111 35,625,000 15,833,333

51
51
Sub-total employment 198,333,333 23,138,889 23,138,889 23,138,889 89,250,000 39,666,667 Support for interventions Basic infrastructure for intervention support (cisterns, lagoons, pipe wells, irrigation, drainage grid, potable water and saline-soil recovery) 589,775,333 68,807,122 68,807,122 68,807,122 265,398,900 117,955,067 Building local roads 260,000,000 30,333,333 30,333,333 30,333,333 117,000,000 52,000,000
Training and technology transfer 1,960,000 228,667 $228,667 228,667 882,000 392,000
Sub-total Support for interventions 851,735,333 99,369,122 99,369,122 99,369,122 383,280,900 170,347,067 Improvement in the distribution and commercialization of food products Basic infrastructure for intervention support (cisterns, lagoons, pipe wells, irrigation, drainage grid, potable water and saline-soil recovery) 2,909,558,311 68,807,122 68,807,122 68,807,122 265,398,900 2,437,738,044
Training and technology transfer 9,669,333 228,667 228,667 228,667 882,000 8,101,333
Sub-total (intervention support services) 4,201,894,311 99,369,122 99,369,122 99,369,122 383,280,900 3,520,506,044
Building rural collection centers 226,933,333 5,366,667 5,366,667 5,366,667 20,700,000 190,133,333
Building neighborhood markets 255,300,000 6,037,500 6,037,500 6,037,500 23,287,500 213,900,000
Building rural warehouses 15,786,667 373,333 373,333 373,333 1,440,000 13,226,667
Sub-total improvements 100,950,000 11,777,500 11,777,500 11,777,500 45,427,500 20,190,000 Others
Follow-up/Monitoring interventions 1,357,500 135,750 135,750 135,750 407,250 543,000
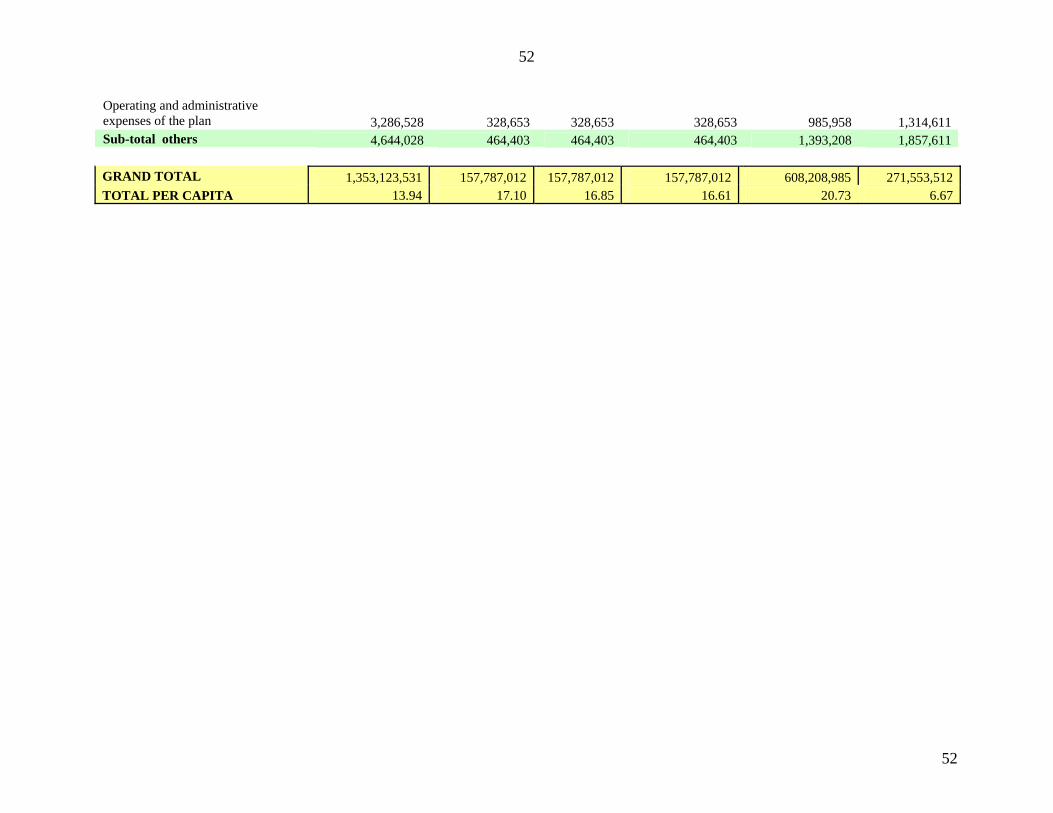
52
52
Operating and administrative expenses of the plan 3,286,528 328,653 328,653 328,653 985,958 1,314,611 Sub-total others 4,644,028 464,403 464,403 464,403 1,393,208 1,857,611 GRAND TOTAL 1,353,123,531 157,787,012 157,787,012 157,787,012 608,208,985 271,553,512TOTAL PER CAPITA 13.94 17.10 16.85 16.61 20.73 6.67

53
53
MALNUTRITION TOTAL (USD$)* 2006 2007 2008
2009 / 2011 2012 / 2015
Institutional strengthening Component A Ratification of the presidential decree
3 Meetings of the National Micronutrients Commission (RD$300.00 for 30 people – meals and materials)
9,000 450 450
1,200
3,300
3,600
3 Meetings of the fortified salt Sub-committee of the National Micronutrients Commission (RD$852.00 for 10 people – meals and materials)
8,520 426 426
1,136
3,124
3,408
2 Meetings for the round tables and agreements with salt producers (RD$560.00 for 15 people – travel expenses)
5,600 280 280
747
2,053
2,240
1 Event for signing the Cooperation Agreement between SESPAS and the SEE)
1,400 700 700
-
- -
10 Meetings for setting up the sentinel schools (RD$308.00 for 40 people – refreshments and materials)
41,067 2,053 2,053
5,476
15,058
16,427
2 Meetings with contributors and donor table (RD$350.00 for 10 people – office supplies and refreshments)
2,333 117 117
311
856
933
Coordination meetings with the NGOs, agencies, volunteer and community groups to prepare the food ratios (3 meetings per year at 12,000 per meeting) - Organizing the shelters
14,400 600 600
2,000
5,440
5,760
Support for the National Micronutrients Commission and the National CODEX Alimentations Committee
166,667 8,333 8,333
22,222
61,111
66,667
Technical advisors for food production based on nutritionally balanced agricultural menus
46,200 3,300 3,300
6,600
17,160
15,840
Technical and logistics advisors for food assistance programs (Eating is First, …)
19,733 2,367 2,367
2,222
6,111
6,667
Sub-total Component A
314,920 18,626 18,626
41,914
114,213
121,541
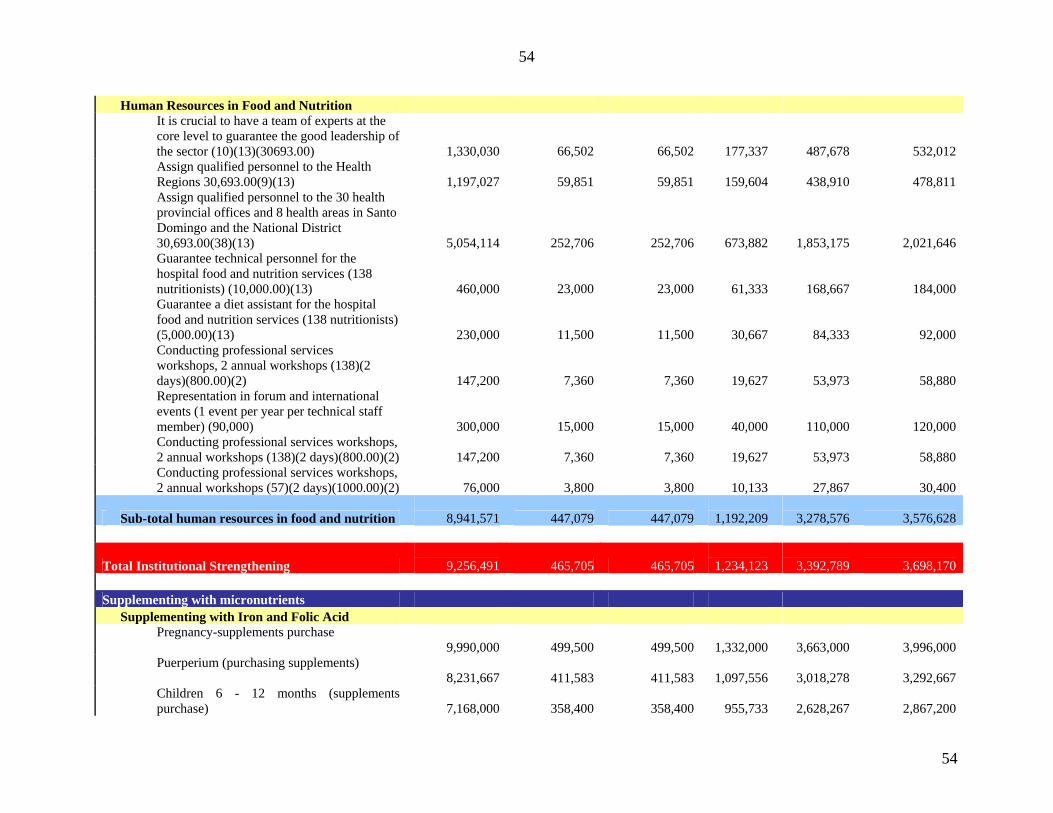
54
54
Human Resources in Food and Nutrition
It is crucial to have a team of experts at the core level to guarantee the good leadership of the sector (10)(13)(30693.00)
1,330,030 66,502 66,502
177,337
487,678
532,012
Assign qualified personnel to the Health Regions 30,693.00(9)(13)
1,197,027 59,851 59,851
159,604
438,910
478,811
Assign qualified personnel to the 30 health provincial offices and 8 health areas in Santo Domingo and the National District 30,693.00(38)(13)
5,054,114 252,706 252,706
673,882
1,853,175
2,021,646
Guarantee technical personnel for the hospital food and nutrition services (138 nutritionists) (10,000.00)(13)
460,000 23,000 23,000
61,333
168,667
184,000
Guarantee a diet assistant for the hospital food and nutrition services (138 nutritionists) (5,000.00)(13)
230,000 11,500 11,500
30,667
84,333
92,000
Conducting professional services workshops, 2 annual workshops (138)(2 days)(800.00)(2)
147,200 7,360 7,360
19,627
53,973
58,880
Representation in forum and international events (1 event per year per technical staff member) (90,000)
300,000 15,000 15,000
40,000
110,000
120,000
Conducting professional services workshops, 2 annual workshops (138)(2 days)(800.00)(2)
147,200 7,360 7,360
19,627
53,973
58,880
Conducting professional services workshops, 2 annual workshops (57)(2 days)(1000.00)(2)
76,000 3,800 3,800
10,133
27,867
30,400
Sub-total human resources in food and nutrition
8,941,571 447,079 447,079
1,192,209
3,278,576
3,576,628
Total Institutional Strengthening
9,256,491 465,705 465,705
1,234,123
3,392,789
3,698,170 Supplementing with micronutrients Supplementing with Iron and Folic Acid
Pregnancy-supplements purchase
9,990,000 499,500 499,500
1,332,000
3,663,000
3,996,000
Puerperium (purchasing supplements)
8,231,667 411,583 411,583
1,097,556
3,018,278
3,292,667
Children 6 - 12 months (supplements purchase)
7,168,000 358,400 358,400
955,733
2,628,267
2,867,200

55
55
Children 13-24 months (supplements purchase)
11,664,467 583,223 583,223
1,555,262
4,276,971
4,665,787
Students (supplements purchase)
6,084,000 304,200 304,200
811,200
2,230,800
2,433,600
40 Training workshops (18,975.00 per workshop)
25,300 12,650 12,650
-
- -
Professional workshops, 10 workshops per year at 40,000.00
108,000 - -
17,778
46,489
43,733
Office Supplies (11,000 per month)
44,000 2,200 2,200
5,867
16,133
17,600
Recording data, payment for data input and processing (12,692.30 annual)
55,000 2,750 2,750
7,333
20,167
22,000
5 and 10-year impact assessment
198,000 - -
33,000
85,800
79,200
Sub-total Supplementing with Iron and Folic Acid
43,568,433 2,174,507 2,174,507
5,815,729
15,985,904
17,417,787
Supplementing with Vitamin A
Children 6 - 11 months (supplements purchase) 112,000/500 for RD$168,00
12,544 627 627
1,673
4,599
5,018
Children 13-24 months (supplements purchase) 813,556/500 at RD$180.00
97,626 4,881 4,881
13,017
35,796
39,051
Puerperium (supplements purchase) 225,000/500 at RD$180,00
13,500 675 675
1,800
4,950
5,400
Monitoring and supervision (4 supervision visits per year, visits to the 32 provinces at 2,320.00 per trip)
99,000 4,950 4,950
13,200
36,300
39,600
5 and 10-year impact assessment
198,000 - -
33,000
85,800
79,200
Sub-total Supplementing with Vitamin A
420,670 11,133 11,133
62,689
167,446
168,268 Supplementing with Calcium
Pregnancy-supplements purchase
2,066,134 103,307 103,307
275,485
757,582
826,454
Monitoring and supervision (4 supervisory visits per year, visits to the 32 provinces at 2,320.00 per trip)
99,000 4,950 4,950
13,200
36,300
39,600
5 and 10-year impact assessment
198,000 - -
33,000
85,800
79,200
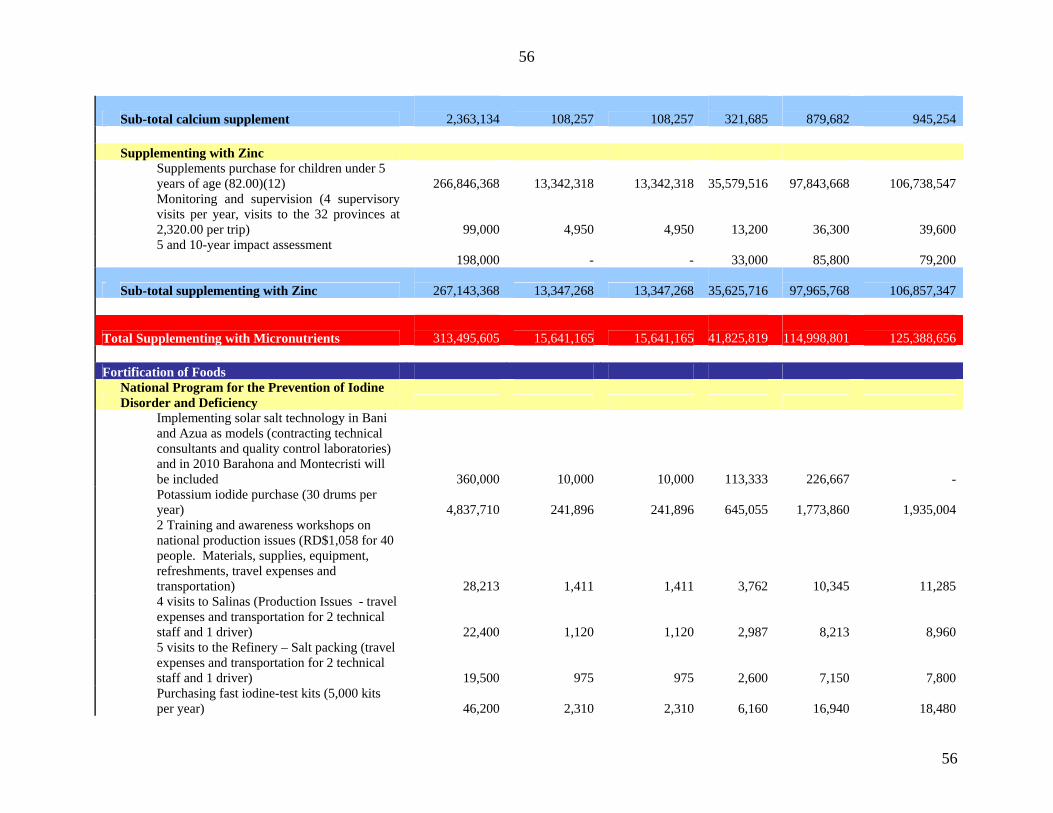
56
56
Sub-total calcium supplement
2,363,134 108,257 108,257
321,685
879,682
945,254 Supplementing with Zinc
Supplements purchase for children under 5 years of age (82.00)(12)
266,846,368 13,342,318 13,342,318
35,579,516
97,843,668
106,738,547
Monitoring and supervision (4 supervisory visits per year, visits to the 32 provinces at 2,320.00 per trip)
99,000 4,950 4,950
13,200
36,300
39,600
5 and 10-year impact assessment
198,000 - -
33,000
85,800
79,200
Sub-total supplementing with Zinc
267,143,368 13,347,268 13,347,268
35,625,716
97,965,768
106,857,347
Total Supplementing with Micronutrients
313,495,605 15,641,165 15,641,165
41,825,819
114,998,801
125,388,656 Fortification of Foods
National Program for the Prevention of Iodine Disorder and Deficiency
Implementing solar salt technology in Bani and Azua as models (contracting technical consultants and quality control laboratories) and in 2010 Barahona and Montecristi will be included
360,000 10,000 10,000
113,333
226,667 -
Potassium iodide purchase (30 drums per year)
4,837,710 241,896 241,896
645,055
1,773,860
1,935,004
2 Training and awareness workshops on national production issues (RD$1,058 for 40 people. Materials, supplies, equipment, refreshments, travel expenses and transportation)
28,213 1,411 1,411
3,762
10,345
11,285
4 visits to Salinas (Production Issues - travel expenses and transportation for 2 technical staff and 1 driver)
22,400 1,120 1,120
2,987
8,213
8,960
5 visits to the Refinery – Salt packing (travel expenses and transportation for 2 technical staff and 1 driver)
19,500 975 975
2,600
7,150
7,800
Purchasing fast iodine-test kits (5,000 kits per year)
46,200 2,310 2,310
6,160
16,940
18,480

57
57
Sub-total National Prevention Program
5,314,023 257,711 257,711
773,896
2,043,175
1,981,529 TOTAL 2006 2007 2008 2009 / 2011 2012 / 2015
Production and Fortification of Fortified Wheat Flour
Industrial implementation
Review of the new ready-mix composition (meeting with the sector) (1)
200 100 100
-
- -
Technical meeting with ready-mix suppliers (2)
200 100 100
-
- -
Stability testing and sensory analysis: 2 consultants at 6000; 2000 supplies; 1000 local transportation: 6000 for sample transportation
15,000 7,500 7,500
-
- -
Ready-mix purchase 240,000TM/año 3,990,000 199,500 199,500
532,000
1,463,000
1,596,000
Administrative costs: communication, office materials and supplies 7500/mill
14,000 700 700
1,867
5,133
5,600
Quote, purchase and installation of dosifying weights for micro differentials, packaging and labeling
150,000 75,000 75,000
-
- -
Operating expenses for equipment, spare parts and lubricants. 70,500/mill
70,500 3,525 3,525
9,400
25,850
28,200
Vehicle operation and maintenance 36,000/mill
36,000 1,800 1,800
4,800
13,200
14,400
Hiring technical staff at 3 mills 3,180,000 15,000 15,000
520,000
1,358,000
1,272,000
Training technical staff in the mills. Contracting, consultant, ticket, materials
5,000 2,500 2,500
-
- -
Acquisition of materials and supplies 36,000/mill
36,000 1,800 1,800
4,800
13,200
14,400
Quality control and assurance
- - -
-
- -
Drawing up protocols and forms for the system
2,500 1,250 1,250
-
- -
Supplies, reagents and laboratory testing materials
60,000 3,000 3,000
8,000
22,000
24,000
Hiring technical staff for three (3) mills 3,180,000 15,000 15,000
520,000
1,358,000
1,272,000
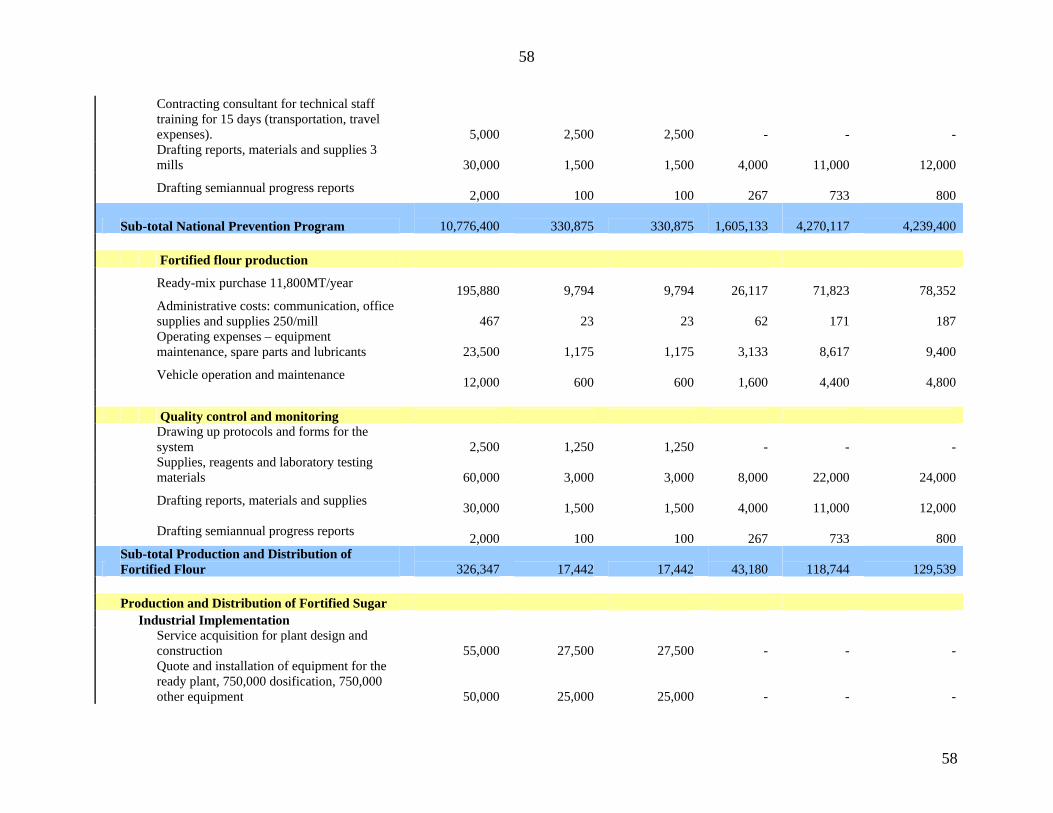
58
58
Contracting consultant for technical staff training for 15 days (transportation, travel expenses).
5,000 2,500 2,500
-
- -
Drafting reports, materials and supplies 3 mills
30,000 1,500 1,500
4,000
11,000
12,000
Drafting semiannual progress reports 2,000 100 100
267
733
800
Sub-total National Prevention Program
10,776,400 330,875 330,875
1,605,133
4,270,117
4,239,400 Fortified flour production
Ready-mix purchase 11,800MT/year 195,880 9,794 9,794
26,117
71,823
78,352
Administrative costs: communication, office supplies and supplies 250/mill
467 23 23
62
171
187
Operating expenses – equipment maintenance, spare parts and lubricants
23,500 1,175 1,175
3,133
8,617
9,400
Vehicle operation and maintenance 12,000 600 600
1,600
4,400
4,800
Quality control and monitoring
Drawing up protocols and forms for the system
2,500 1,250 1,250
-
- -
Supplies, reagents and laboratory testing materials
60,000 3,000 3,000
8,000
22,000
24,000
Drafting reports, materials and supplies 30,000 1,500 1,500
4,000
11,000
12,000
Drafting semiannual progress reports 2,000 100 100
267
733
800
Sub-total Production and Distribution of Fortified Flour
326,347 17,442 17,442
43,180
118,744
129,539
Production and Distribution of Fortified Sugar Industrial Implementation
Service acquisition for plant design and construction
55,000 27,500 27,500
-
- -
Quote and installation of equipment for the ready plant, 750,000 dosification, 750,000 other equipment
50,000 25,000 25,000
-
- -
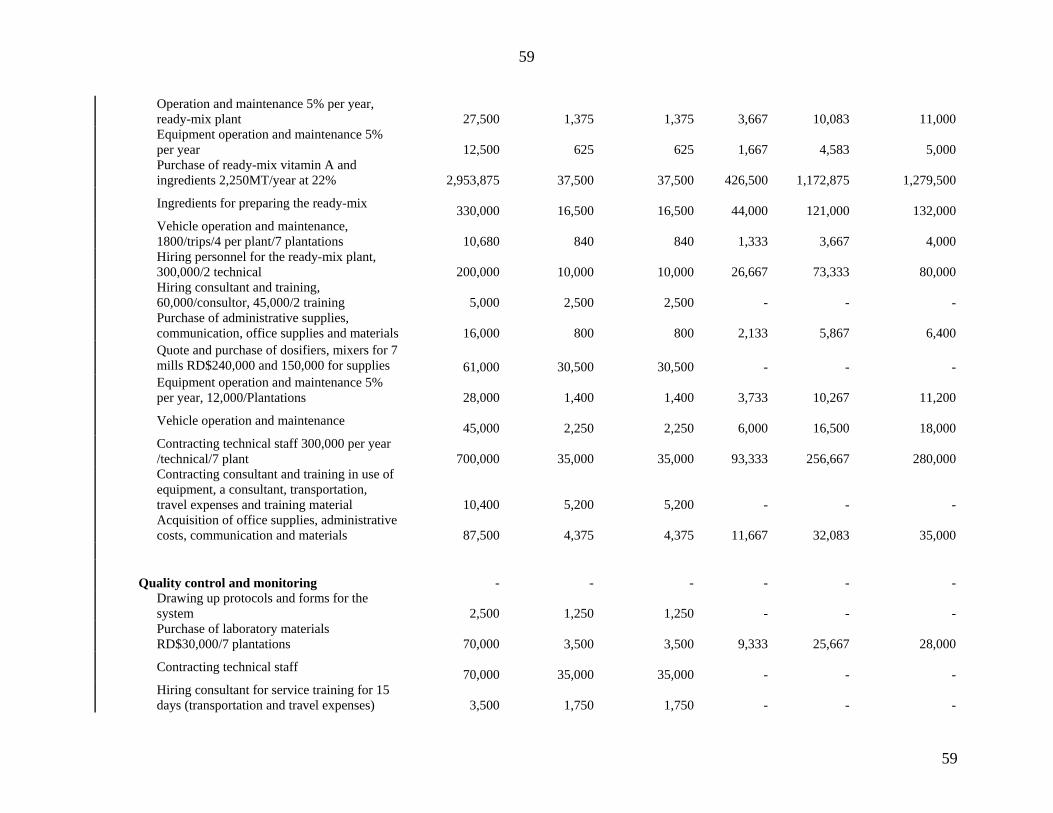
59
59
Operation and maintenance 5% per year, ready-mix plant
27,500 1,375 1,375
3,667
10,083
11,000
Equipment operation and maintenance 5% per year
12,500 625 625
1,667
4,583
5,000
Purchase of ready-mix vitamin A and ingredients 2,250MT/year at 22%
2,953,875 37,500 37,500
426,500
1,172,875
1,279,500
Ingredients for preparing the ready-mix 330,000 16,500 16,500
44,000
121,000
132,000
Vehicle operation and maintenance, 1800/trips/4 per plant/7 plantations
10,680 840 840
1,333
3,667
4,000
Hiring personnel for the ready-mix plant, 300,000/2 technical
200,000 10,000 10,000
26,667
73,333
80,000
Hiring consultant and training, 60,000/consultor, 45,000/2 training
5,000 2,500 2,500
-
- -
Purchase of administrative supplies, communication, office supplies and materials
16,000 800 800
2,133
5,867
6,400
Quote and purchase of dosifiers, mixers for 7 mills RD$240,000 and 150,000 for supplies
61,000 30,500 30,500
-
- -
Equipment operation and maintenance 5% per year, 12,000/Plantations
28,000 1,400 1,400
3,733
10,267
11,200
Vehicle operation and maintenance 45,000 2,250 2,250
6,000
16,500
18,000
Contracting technical staff 300,000 per year /technical/7 plant
700,000 35,000 35,000
93,333
256,667
280,000
Contracting consultant and training in use of equipment, a consultant, transportation, travel expenses and training material
10,400 5,200 5,200
-
- -
Acquisition of office supplies, administrative costs, communication and materials
87,500 4,375 4,375
11,667
32,083
35,000
Quality control and monitoring
- - -
-
- -
Drawing up protocols and forms for the system
2,500 1,250 1,250
-
- -
Purchase of laboratory materials RD$30,000/7 plantations
70,000 3,500 3,500
9,333
25,667
28,000
Contracting technical staff 70,000 35,000 35,000
-
- -
Hiring consultant for service training for 15 days (transportation and travel expenses)
3,500 1,750 1,750
-
- -

60
60
Conducting workshops for the personnel responsible for quality control in the industry on the semi-quantitative analytical methodologies (reagents and handouts for the program)
7,500 3,750 3,750
-
- -
Purchase of communication equipment, materials and office supplies and drafting the reports
52,500 2,625 2,625
7,000
19,250
21,000
Drafting semiannual progress reports 2,000 100 100
267
733
800
Sub-total Production and Distribution of Fortified Sugar
4,800,455 249,340 249,340
637,300
1,752,575
1,911,900
Food Control and Inspection Legislative process
Hiring a legislative process consultant for one month at RD$6,000/day
4,400 2,200 2,200
-
- -
Conducting activities for legislative process, 6 meetings per month at RD$30,000 ea. Handouts and transportation
6,000 3,000 3,000
-
- -
Printout standards and law 1,000 500 500
-
- -
Inspection and compliance
- - -
-
- -
Acquisition of vehicle for inspection
24,000 12,000 12,000
-
- -
Vehicle maintenance and operation
120,000 6,000 6,000
16,000
44,000
48,000
Hiring a consultant; one consultant /15 days at RD$9,000 for an inspection strategy
4,500 2,250 2,250
-
- -
Training inspection personnel, 3 workshops of 20 people each (Transportation, travel expenses and meals) and supplies
103,000 6,500 6,500
13,333
36,667
40,000
Acquisition of inspection materials (computer, sending samples and materials)
12,000 6,000 6,000
-
- -
Purchase of office supplies, communication, handouts and transportation
45,000 2,250 2,250
6,000
16,500
18,000
Acquisition of laboratory equipment, computers, handouts and handbooks
72,000 36,000 36,000
-
- -
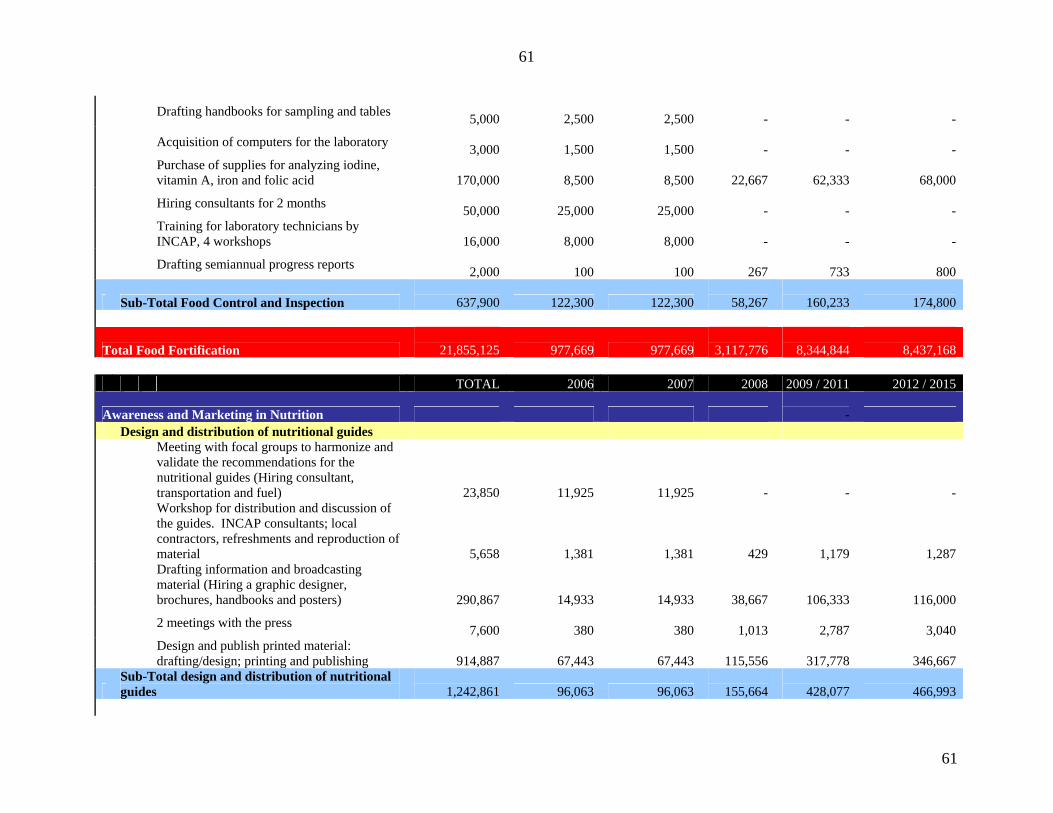
61
61
Drafting handbooks for sampling and tables 5,000 2,500 2,500
-
- -
Acquisition of computers for the laboratory 3,000 1,500 1,500
-
- -
Purchase of supplies for analyzing iodine, vitamin A, iron and folic acid
170,000 8,500 8,500
22,667
62,333
68,000
Hiring consultants for 2 months 50,000 25,000 25,000
-
- -
Training for laboratory technicians by INCAP, 4 workshops
16,000 8,000 8,000
-
- -
Drafting semiannual progress reports 2,000 100 100
267
733
800
Sub-Total Food Control and Inspection
637,900 122,300 122,300
58,267
160,233
174,800
Total Food Fortification
21,855,125 977,669 977,669
3,117,776
8,344,844
8,437,168 - TOTAL 2006 2007 2008 2009 / 2011 2012 / 2015
Awareness and Marketing in Nutrition
- Design and distribution of nutritional guides
Meeting with focal groups to harmonize and validate the recommendations for the nutritional guides (Hiring consultant, transportation and fuel)
23,850 11,925 11,925
-
- -
Workshop for distribution and discussion of the guides. INCAP consultants; local contractors, refreshments and reproduction of material
5,658 1,381 1,381
429
1,179
1,287
Drafting information and broadcasting material (Hiring a graphic designer, brochures, handbooks and posters)
290,867 14,933 14,933
38,667
106,333
116,000
2 meetings with the press 7,600 380 380
1,013
2,787
3,040
Design and publish printed material: drafting/design; printing and publishing
914,887 67,443 67,443
115,556
317,778
346,667
Sub-Total design and distribution of nutritional guides
1,242,861 96,063 96,063
155,664
428,077
466,993

62
62
Education and Communication of Fortified Foods
Advertising and promotion
Social-marketing specialists contracted by the National Micronutrient Commission, Specialist in social marketing, 1200 tickets, 1800 travel expenses, two months
11,000 5,500 5,500
-
- -
Hiring 4 researchers 2,000 - -
667
1,333 -
Conducting a study, salary for 4 researchers, one month study, RD$90,000/month
12,000 - -
4,000
8,000 -
Transportation assignment 2,000 - -
667
1,333 -
Purchase of office supplies and materials 750 125 125
83
217
200
Building a strategic partnership with the business sector to support education initiatives
- - -
-
- -
Monitoring marketing initiatives for fortified products in accordance with quality standards accredited by SESPAS
11,000 5,500 5,500
-
- -
Building a partnership with media owners to broadcast radio and television ads
10,000 5,000 5,000
-
- -
Design and print material, posters and brochures
177,500 15,000 15,000
24,167
63,333
60,000
Distributing information to the written press, TV and radio ads
200,000 10,000 10,000
26,667
73,333
80,000
Conducting research with marketing students (2 scholarships/RD$15,000 ea.)
1,000 - -
333
667 -
Providing office supplies, equipment, materials and communication equipment
20,000 1,000 1,000
2,667
7,333
8,000
Sub-total Advertising and Promotion
447,250 42,125 42,125
59,250
155,550
148,200 Public Awareness
Organizing awareness meetings, 20 training workshops, 15 educational sessions for 25 to 30 people
300,000 15,000 15,000
40,000
110,000
120,000
Organizing activities for consumer associations
190,000 15,000 15,000
28,333
71,667
60,000

63
63
Hiring local consultants 36,000 18,000 18,000
-
- -
Purchase of office supplies and materials 20,000 1,000 1,000
2,667
7,333
8,000
Sub-total Public Awareness
546,000 49,000 49,000
71,000
189,000
188,000 Communication among partners
Communication by telephone -fax/ Internet 20,000 1,000 1,000
2,667
7,333
8,000
Printing materials and information newsletters
30,000 1,500 1,500
4,000
11,000
12,000
Organizing quarterly meetings to: a)share experiences, b) draft 2 progress and assessment reports at the end of the second and fourth quarter RD$42,000 /meeting RD$6,000/report
40,000 2,000 2,000
5,333
14,667
16,000
Supervise the actions of the different components of the Micronutrients Commission. Transportation and travel expenses 10 trips RD$15,000/ trip
110,000 10,000 10,000
13,333
36,667
40,000
Sub-total Communication among partners
200,000 14,500 14,500
25,333
69,667
76,000 Advocacy and Public Relations
Hiring communications specialist 37,000 5,000 5,000
4,000
11,000
12,000
Office supplies for strategy development, promotion and advertising
15,000 750 750
2,000
5,500
6,000
Design 2 TV and radio ads per year 86,400 6,000 6,000
24,000
48,480
1,920
Request private sector support for launching the TV and radio ads
100,000 5,000 5,000
13,333
36,667
40,000
Organizing 3 meetings per year to strengthen communication among the agencies that make up the National Micronutrients Commission
15,000 750 750
2,000
5,500
6,000
Interagency organization and participation of periodic promotional events. 3 events per year
100,000 5,000 5,000
13,333
36,667
40,000
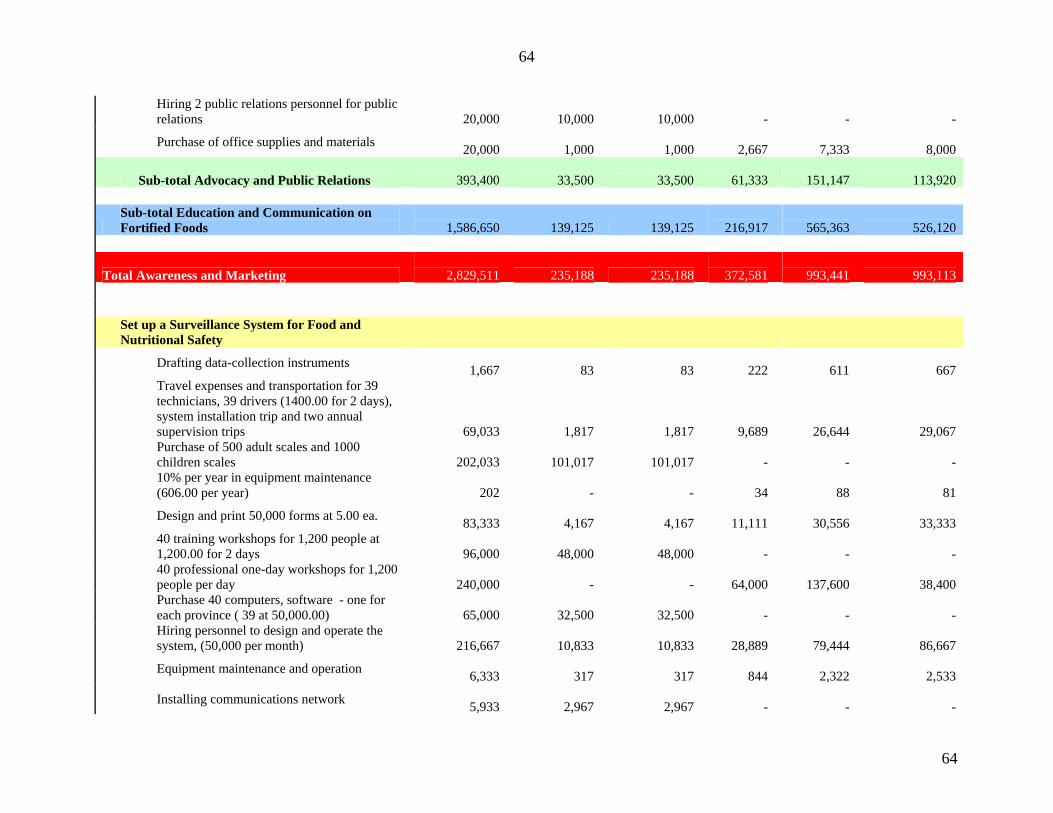
64
64
Hiring 2 public relations personnel for public relations
20,000 10,000 10,000
-
- -
Purchase of office supplies and materials 20,000 1,000 1,000
2,667
7,333
8,000
Sub-total Advocacy and Public Relations
393,400 33,500 33,500
61,333
151,147
113,920
Sub-total Education and Communication on Fortified Foods
1,586,650 139,125 139,125
216,917
565,363
526,120
Total Awareness and Marketing
2,829,511 235,188 235,188
372,581
993,441
993,113
Set up a Surveillance System for Food and Nutritional Safety
Drafting data-collection instruments 1,667 83 83
222
611
667
Travel expenses and transportation for 39 technicians, 39 drivers (1400.00 for 2 days), system installation trip and two annual supervision trips
69,033 1,817 1,817
9,689
26,644
29,067
Purchase of 500 adult scales and 1000 children scales
202,033 101,017 101,017
-
- -
10% per year in equipment maintenance (606.00 per year)
202 - -
34
88 81
Design and print 50,000 forms at 5.00 ea. 83,333 4,167 4,167
11,111
30,556
33,333
40 training workshops for 1,200 people at 1,200.00 for 2 days
96,000 48,000 48,000
-
- -
40 professional one-day workshops for 1,200 people per day
240,000 - -
64,000
137,600
38,400
Purchase 40 computers, software - one for each province ( 39 at 50,000.00)
65,000 32,500 32,500
-
- -
Hiring personnel to design and operate the system, (50,000 per month)
216,667 10,833 10,833
28,889
79,444
86,667
Equipment maintenance and operation 6,333 317 317
844
2,322
2,533
Installing communications network 5,933 2,967 2,967
-
- -

65
65
Payment for office supplies and communication
6,667 333 333
889
2,444
2,667
5 and 10-year monitoring and assessment program
24,167 - -
3,333
9,500
11,333
Hunger and malnutrition mapping and costing
600,000 300,000 300,000
-
- -
Sub-total Surveillance for Food and Nutritional Safety
1,617,035 502,033 502,033
119,011
289,210
204,747
Impact Monitoring and Assessment
Hiring a coordinator in the epidemiological field and research personnel for the base line
16,000 8,000 8,000
-
- -
Hiring a consultant with survey expertise, RD$90,000; transportation and travel expenses, RD$120,000; 5 sets of materials, RD$30,000
8,000 4,000 4,000
-
- -
Car rental for three months
16,000 - -
5,333
10,667 -
Purchase of supplies to conduct laboratory tests RD$18,000 duplicate samples
28,400 - -
9,467
18,933 -
Setting up the data base structure, development, validation, analysis and report
3,000 - -
1,000
2,000 -
Purchase of office supplies and supplies, administrative expenses
2,000 500 500
333
667 -
Monitoring and supervision (4 supervisory trips per year, visits to the 32 provinces at 2,320.00 per trip)
297,000 14,850 14,850
39,600
108,900
118,800
2 public ceremonies for launching the Sentinel School
2,800 1,400 1,400
-
- -
12 regional training workshops on the monitoring methodology of the sentinel school (RD$535.00 for 40 people. Materials, refreshments, transportation and travel expenses)
17,120 4,280 4,280
2,853
5,707 -
Base line (2,225 samples at a national level) 41,533 10,383 10,383
6,922
13,844 -
Acquisition of vehicle for inspection 24,000 12,000 12,000
-
- -
Vehicle operation and maintenance 120,000 6,000 6,000
16,000
44,000
48,000

66
66
Contracting consultancy; one consultant /15 days at RD$9,000 for the inspection strategy
4,500 2,250 2,250
-
- -
Inspection personnel training, 3 workshops for 20 people each (transportation, travel expenses and meals) and supplies
103,000 6,500 6,500
13,333
36,667
40,000
Purchase of inspection material (computer, sending samples and materials)
12,000 6,000 6,000
-
- -
Purchase of office supplies, communication, input and transportation
45,000 2,250 2,250
6,000
16,500
18,000
Hiring an epidemiologist, statistician, data base administrator for pilot hospitals
3,000 1,500 1,500
-
- -
Training in CIE-10 and expert in protocol management information system, case study handouts, 2 workshops
10,000 - -
3,333
6,667 -
Expert consultant on CIE-10 and SIG and staff: transportation and travel expenses, every 6 weeks
5,000 - -
1,667
3,333 -
CIE-10 data input on neural tube defect, perinatal clinical history, medical record input and prenatal care
1,000 - -
333
667 -
Connectivity, start-up costs for broadband installation. Telemedicina network, INDOTEL, provides uninterrupted broadband access
3,000 - -
1,000
2,000 -
Sub-total Surveillance for Food and Nutritional Safety
762,353 79,913 79,913
107,176
270,551
224,800
Post-fortification and Assessment Survey
HARDWARE and SOFTWARE purchase for IT network support, Nutritional Information and Surveillance System SIVIN, participating agencies: DIGENOR, 2PC, DIGESA 4PC, DIGEPI 2PC, National Laboratory 4PC.
20,000 10,000 10,000
-
- -
Contracting consultants and assessment of support needs, Telemedicina, INDOTEL; 3 people/2 weeks
49,067 4,000 4,000
356
8,711
32,000
Hiring a computer analyst and Website designers to develop a registry of hemoglobin, neural tube defect and
12,000 6,000 6,000
-
- -

67
67
nutritional data base
Purchase and installation of cables for annual internet service provider, LAN/WAN, HOSTIN management and e-mail services
15,000 7,500 7,500
-
- -
Purchase of hardware and software (2 SAN servers and communications equipment; W2003 server); SQL server
30,000 15,000 15,000
-
- -
Hardware and software acquisition. Multi-function printers, high-speed networks, laser and inkjet printer; mobile PC and global positioning systems and software for geographic mapping and supply
10,000 5,000 5,000
-
- -
Vehicle operation and maintenance 10,000 500 500
1,333
3,667
4,000
Partnering institutions conduct supervisory and technical assistance visits; transportation, travel expenses, handbooks and forms
50,000 2,500 2,500
6,667
18,333
20,000
Sub-total Surveillance for Food and Nutritional Safety
196,067 50,500 50,500
8,356
30,711
56,000
Total Strengthening Nutritional Surveillance
2,575,455 632,447 632,447
234,543
590,472
485,547
Food and Nutrition in the Event of a Disaster
- Food and Nutrition in the Event of a Disaster
Purchasing food rations (three daily rations for 4,500 children for 30 days)
8,950,000 447,500 447,500
1,193,333
3,281,667
3,580,000
Meeting with the people responsible for interagency coordination in the event of a disaster (3 meetings with 30 people at RD$50.00 ea.)
1,500 75 75
200
550
600
Meetings with the people in charge of planning, preparing and distributing the food (3 meetings with 30 people at RD$50.00 ea.)
1,500 75 75
200
550
600
Assess the quality and safety of the food assigned, stressing the vulnerable population (purchasing material and equipment for the assessment)
8,333 417 417
1,111
3,056
3,333
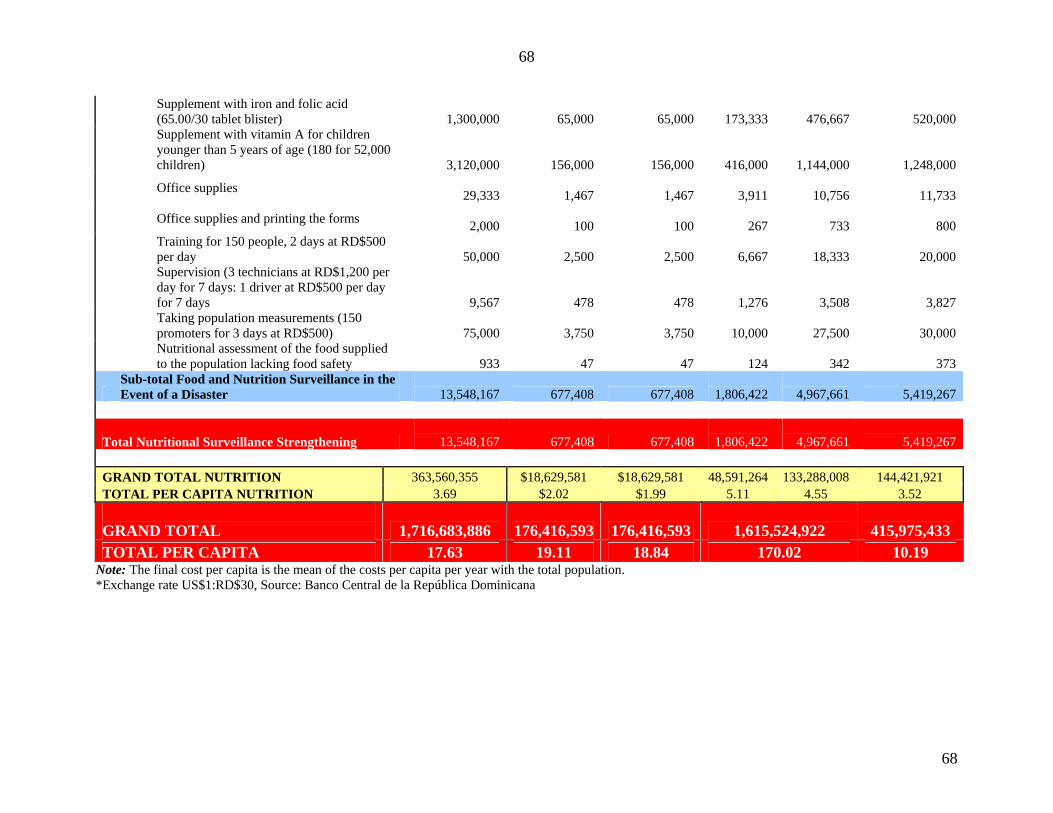
68
68
Supplement with iron and folic acid (65.00/30 tablet blister)
1,300,000 65,000 65,000
173,333
476,667
520,000
Supplement with vitamin A for children younger than 5 years of age (180 for 52,000 children)
3,120,000 156,000 156,000
416,000
1,144,000
1,248,000
Office supplies 29,333 1,467 1,467
3,911
10,756
11,733
Office supplies and printing the forms 2,000 100 100
267
733
800
Training for 150 people, 2 days at RD$500 per day
50,000 2,500 2,500
6,667
18,333
20,000
Supervision (3 technicians at RD$1,200 per day for 7 days: 1 driver at RD$500 per day for 7 days
9,567 478 478
1,276
3,508
3,827
Taking population measurements (150 promoters for 3 days at RD$500)
75,000 3,750 3,750
10,000
27,500
30,000
Nutritional assessment of the food supplied to the population lacking food safety
933 47 47
124
342
373
Sub-total Food and Nutrition Surveillance in the Event of a Disaster
13,548,167 677,408 677,408
1,806,422
4,967,661
5,419,267
Total Nutritional Surveillance Strengthening
13,548,167 677,408 677,408
1,806,422
4,967,661
5,419,267 GRAND TOTAL NUTRITION 363,560,355 $18,629,581 $18,629,581 48,591,264 133,288,008 144,421,921 TOTAL PER CAPITA NUTRITION 3.69 $2.02 $1.99 5.11 4.55 3.52 GRAND TOTAL 1,716,683,886 176,416,593 176,416,593 1,615,524,922 415,975,433 TOTAL PER CAPITA 17.63 19.11 18.84 170.02 10.19
Note: The final cost per capita is the mean of the costs per capita per year with the total population. *Exchange rate US$1:RD$30, Source: Banco Central de la República Dominicana

69
69
Annex 2
Matrix of the interventions and costs of the Working Group on Education
Management and institutionalization Interventions Total 2004/2005 2005/2006 2006/2007 2007 Operations and management
General structure of the SEE
50,000
-
50,000
-
Classified and attended schools
1,000,000
-
200,000
200,000
Classified and organized school districts
150,000
-
50,000
50,000
Classified and organized school regions
100,000
-
50,000
50,000
Creation of commission on staff certification
225,000
-
75,000
75,000
Certified professionals
1,033,333
-
33,333
100,000
Classified SEE positions
1,400,000
-
200,000
200,000
Newly established and applied salary system
200,000
-
-
100,000
System for budgetary planning and execution
300,000
-
100,000
100,000
Sub-total for operations and management
4,458,333
-
758,333
875,000
Scholarships
Scholarships for masters in administration of educational institutions
3,300,000
-
300,000
300,000
Scholarships for masters and doctorates
6,600,000
-
600,000
600,000

70
70
Sub-total for scholarships
9,900,000
-
900,000
900,000 Infrastructure
Regional offices
9,130,000
-
-
-
District offices
24,104,000
-
-
-
Sub-total infrastructure
33,234,000
-
-
-
Sub-total management and institutionalization
47,592,333
-
1,658,333
1,775,000
Pre-primary education level (initial) Total 2004/2005 2005/2006 2006/2007 2007 Infrastructure
Classrooms constructed and rehabilitated
55,694,309
-
8,475,402
9,169,923
Classrooms adequately maintained
44,666,253
2,312,925
2,651,931
3,018,716
Subtotal infrastructure
100,360,562
2,312,925
11,127,333
12,188,639 Teachers
Salary
342,551,537
19,479,167
23,227,597.68
25,759,622
Staff development
112,852,079
5,843,750
6,700,269
7,626,975
Staff Training
11,285,208
584,375
670,027
762,697
Subtotal teachers
466,688,824
25,907,292
30,597,893
34,149,294 Teaching materials
Classroom materials
5,502,588
389,583
446,685
476,324
Student materials
1,392,703,799
389,583
211,878,432
229,240,913 2
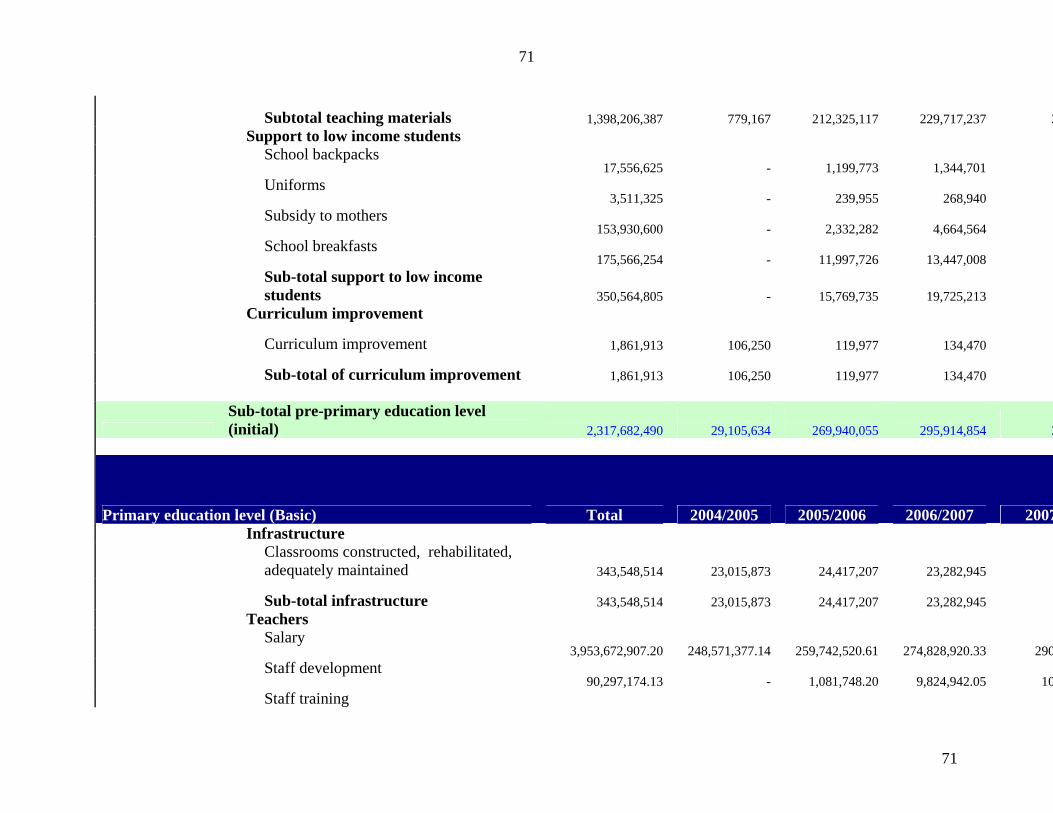
71
71
Subtotal teaching materials
1,398,206,387
779,167
212,325,117
229,717,237 2 Support to low income students
School backpacks
17,556,625
-
1,199,773
1,344,701
Uniforms
3,511,325
-
239,955
268,940
Subsidy to mothers
153,930,600
-
2,332,282
4,664,564
School breakfasts
175,566,254
-
11,997,726
13,447,008
Sub-total support to low income students
350,564,805
-
15,769,735
19,725,213
Curriculum improvement
Curriculum improvement
1,861,913
106,250
119,977
134,470
Sub-total of curriculum improvement
1,861,913
106,250
119,977
134,470
Sub-total pre-primary education level (initial)
2,317,682,490
29,105,634
269,940,055
295,914,854 3
Primary education level (Basic) Total 2004/2005 2005/2006 2006/2007 2007 Infrastructure
Classrooms constructed, rehabilitated, adequately maintained
343,548,514
23,015,873
24,417,207
23,282,945
Sub-total infrastructure
343,548,514
23,015,873
24,417,207
23,282,945 Teachers
Salary
3,953,672,907.20
248,571,377.14
259,742,520.61
274,828,920.33 290
Staff development
90,297,174.13
-
1,081,748.20
9,824,942.05 10 Staff training
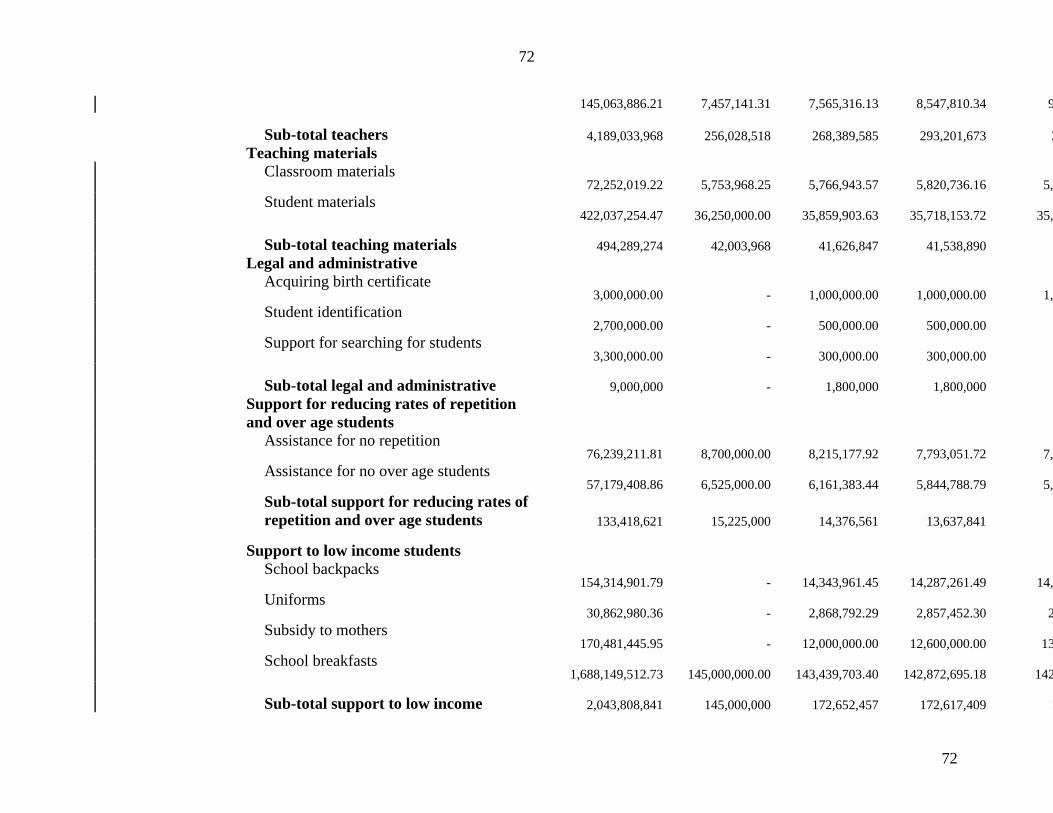
72
72
145,063,886.21 7,457,141.31 7,565,316.13 8,547,810.34 9
Sub-total teachers
4,189,033,968
256,028,518
268,389,585
293,201,673 3 Teaching materials
Classroom materials
72,252,019.22
5,753,968.25
5,766,943.57
5,820,736.16 5,
Student materials
422,037,254.47
36,250,000.00
35,859,903.63
35,718,153.72 35,
Sub-total teaching materials
494,289,274
42,003,968
41,626,847
41,538,890 Legal and administrative
Acquiring birth certificate
3,000,000.00
-
1,000,000.00
1,000,000.00 1,
Student identification
2,700,000.00
-
500,000.00
500,000.00
Support for searching for students
3,300,000.00
-
300,000.00
300,000.00
Sub-total legal and administrative
9,000,000
-
1,800,000
1,800,000
Support for reducing rates of repetition and over age students
Assistance for no repetition
76,239,211.81
8,700,000.00
8,215,177.92
7,793,051.72 7,
Assistance for no over age students
57,179,408.86
6,525,000.00
6,161,383.44
5,844,788.79 5,
Sub-total support for reducing rates of repetition and over age students
133,418,621
15,225,000
14,376,561
13,637,841
Support to low income students
School backpacks
154,314,901.79
-
14,343,961.45
14,287,261.49 14,
Uniforms
30,862,980.36
-
2,868,792.29
2,857,452.30 2
Subsidy to mothers
170,481,445.95
-
12,000,000.00
12,600,000.00 13
School breakfasts
1,688,149,512.73
145,000,000.00
143,439,703.40
142,872,695.18 142
Sub-total support to low income
2,043,808,841
145,000,000
172,652,457
172,617,409 1

73
73
students
Curriculum improvement
Curriculum improvement
8,440,745.09
725,000.00
717,198.07
714,363.07
Sub-total of curriculum improvement
8,440,745
725,000
717,198
714,363
Sub-total primary education level (basic)
7,221,539,962
481,998,360
523,979,856
546,793,120 5
Secondary education level Total 2004/2005 2005/2006 2006/2007 2007 Infrastructure
Classrooms constructed and rehabilitated
615,279,765
-
35,417,404
35,906,953
Classrooms adequately maintained
221,751,018
8,421,053
9,783,260
11,219,539
Subtotal infrastructure
837,030,782
8,421,053
45,200,664
47,126,492
Teachers
Salaries
2 – 5 hour session
324,208,178.66
47,145,000.00
44,573,454.55
41,720,753.45 38
6 hour session
546,951,447.17
-
6,783,818.51
13,974,666.13 21
Staff development
430,536,769.84
28,287,000.00
29,667,193.48
31,047,386.96 32
Staff training
43,053,676.98
2,828,700.00
2,966,719.35
3,104,738.70 3
Sub-total teachers
1,344,750,073
78,260,700
83,991,186
89,847,545
Teaching materials

74
74
Library and classroom materials
22,856,781.98
-
1,048,206.48
1,202,093.42 1
Student materials
256,513,738.24
-
15,976,630.31
17,476,517.65 18
Sub-total teaching materials
279,370,520
-
17,024,837
18,678,611
Support to low income students
School backpacks
8,466,054.32
450,000.00
499,269.70
546,141.18
Subsidy for food and transportation
42,330,271.60
2,250,000.00
2,496,348.49
2,730,705.88 2
Sub-total for support to low income students
50,796,326
2,700,000
2,995,618
3,276,847
Support for reducing rates of repetition and over age students
Assistance for no repetition
29,051,941.85
2,160,000.00
2,287,562.98
2,383,161.50 2
Assistance for no over age students
20,475,426.14
1,620,000.00
1,797,370.91
1,966,108.24 2
Sub-total support for reducing rates of repetition and over age students
49,527,368
3,780,000
4,084,934
4,349,270
Curriculum improvement
Curriculum improvement
5,079,632.59
270,000.00
299,561.82
327,684.71
Sub-total of curriculum improvement
5,079,633
270,000
299,562
327,685
Sub-total secondary education level
2,566,554,702
93,431,753
153,596,801
163,606,450 1
Adult public education Total 2004/2005 2005/2006 2006/2007 2007 Teachers
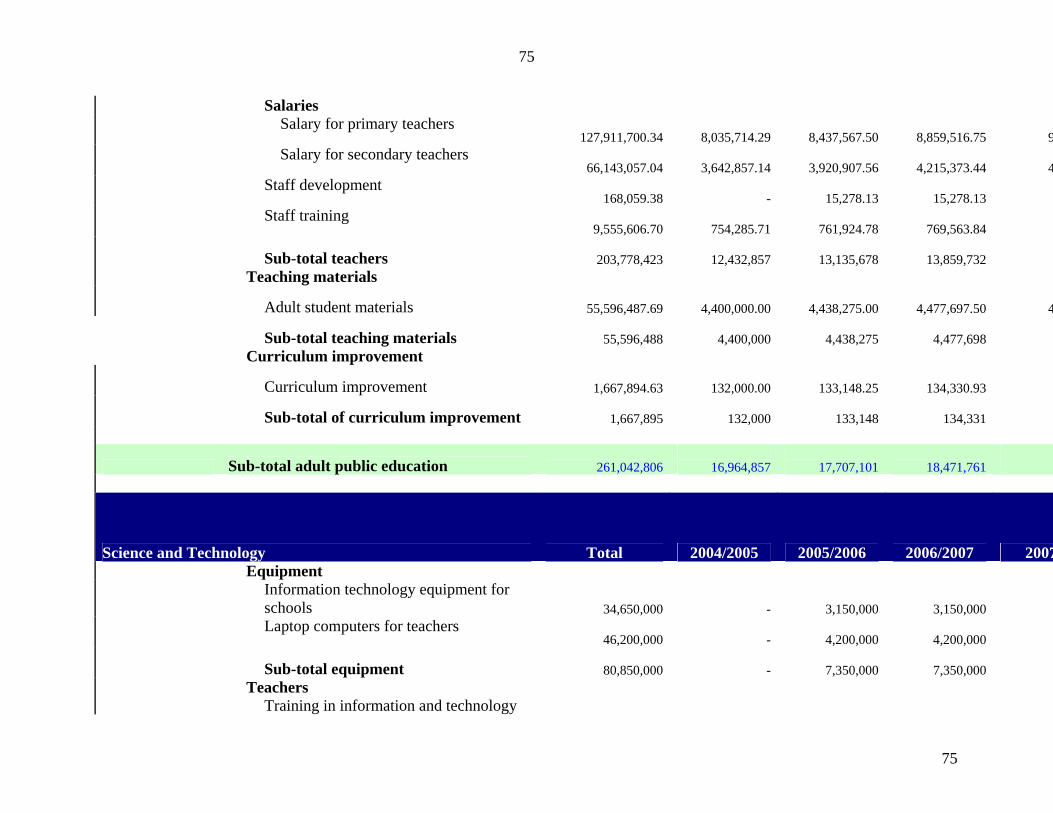
75
75
Salaries
Salary for primary teachers
127,911,700.34
8,035,714.29
8,437,567.50
8,859,516.75 9
Salary for secondary teachers
66,143,057.04
3,642,857.14
3,920,907.56
4,215,373.44 4
Staff development
168,059.38
-
15,278.13
15,278.13
Staff training
9,555,606.70
754,285.71
761,924.78
769,563.84
Sub-total teachers
203,778,423
12,432,857
13,135,678
13,859,732 Teaching materials
Adult student materials
55,596,487.69
4,400,000.00
4,438,275.00
4,477,697.50 4
Sub-total teaching materials
55,596,488
4,400,000
4,438,275
4,477,698 Curriculum improvement
Curriculum improvement
1,667,894.63
132,000.00
133,148.25
134,330.93
Sub-total of curriculum improvement
1,667,895
132,000
133,148
134,331
Sub-total adult public education
261,042,806
16,964,857
17,707,101
18,471,761
Science and Technology Total 2004/2005 2005/2006 2006/2007 2007 Equipment
Information technology equipment for schools
34,650,000
-
3,150,000
3,150,000
Laptop computers for teachers
46,200,000
-
4,200,000
4,200,000
Sub-total equipment
80,850,000
-
7,350,000
7,350,000 Teachers Training in information and technology

76
76
education 5,500,000.00 - 500,000.00 500,000.00
Science laboratories for teachers
900,000.00
75,000.00
75,000.00
75,000.00
Science camp for teachers
2,400,000.00
200,000.00
200,000.00
200,000.00
Sub-total teachers
8,800,000
275,000
775,000
775,000 Student services
Information services
9,342,955.08
-
136,956.87
277,052.46
Student science laboratories
900,000.00
75,000.00
75,000.00
75,000.00
Science camp for students
1,200,000.00
100,000.00
100,000.00
100,000.00
Sub-total student services
11,442,955
175,000
311,957
452,052
Sub-total Science and Technology
101,092,955
450,000
8,436,957
8,577,052
National Exams Total 2004/2005 2005/2006 2006/2007 2007 Institute for student evaluation (IEE)
Infrastructure and equipment
367,500
-
-
183,750
Administration
-
-
-
-
Sub-total for institute for student evaluation
367,500
-
-
183,750
Administration of Exams
Fourth grade
12,933,000.00
1,025,500.00
1,035,000.00
1,044,500.00 1
Eighth grade
17,670,000.00
1,280,000.00
1,315,000.00
1,350,000.00 1
Twelfth grade
18,470,467.04
1,105,500.00
1,170,000.00
1,238,263.23 1
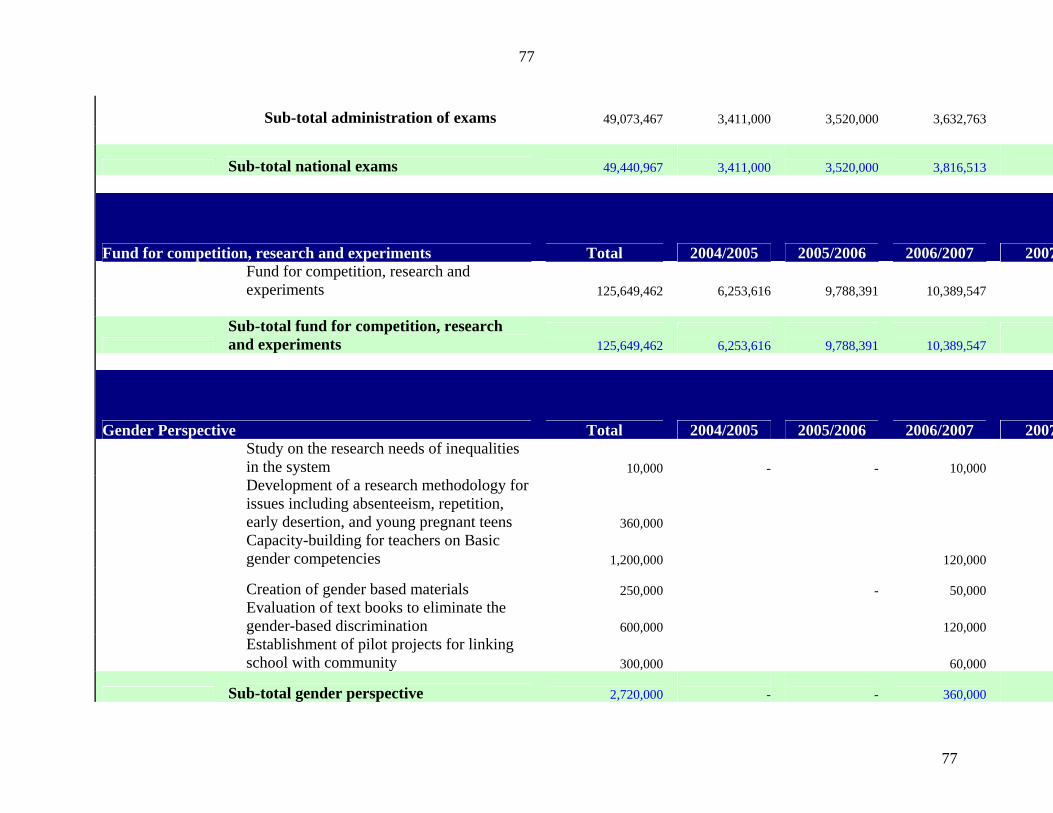
77
77
Sub-total administration of exams
49,073,467
3,411,000
3,520,000
3,632,763
Sub-total national exams
49,440,967
3,411,000
3,520,000
3,816,513
Fund for competition, research and experiments Total 2004/2005 2005/2006 2006/2007 2007
Fund for competition, research and experiments
125,649,462
6,253,616
9,788,391
10,389,547
Sub-total fund for competition, research and experiments
125,649,462
6,253,616
9,788,391
10,389,547
Gender Perspective Total 2004/2005 2005/2006 2006/2007 2007
Study on the research needs of inequalities in the system
10,000
-
-
10,000
Development of a research methodology for issues including absenteeism, repetition, early desertion, and young pregnant teens
360,000
Capacity-building for teachers on Basic gender competencies
1,200,000
120,000
Creation of gender based materials
250,000
-
50,000
Evaluation of text books to eliminate the gender-based discrimination
600,000
120,000
Establishment of pilot projects for linking school with community
300,000
60,000
Sub-total gender perspective
2,720,000
-
-
360,000

78
78
TOTAL GENERAL $12,693,315,677 $631,615,219 $988,627,494$1,049,704,29
7 $1,1 TOTAL PER CAPITA $107.33 $69.41 $107.11 $112.10
Note: The final cost per capita is the mean of the costs per capita per year with the total population.
Note: National Exchange Rate US $1.00 : RD $30 Source: Central Bank of the Dominican Republic

79
79
Annex 3
Matrix of the interventions and costs of the Working Group on Gender Equality and Women’s Empowerment
GENDER EQUALITY
Awareness on sexual and reproductive health
TOTAL (US$)* 2005 2006 2007 2008 2009 / 2011
2012 / 2015
Research and compilation of information
Subtotal research on sexual and reproductive health
1,190,000 110,000 120,000 120,000
360,000 480,000
Training and raising awareness campaign
-
Seminar for raising continuos awareness on human and economic costs
108,000
-
-
12,000
12,000
36,000 48,000
Workshop to raise awareness vis a vis legal reforn
18,000
-
-
-
18,000
-
Public campaign (posters, bulletins) in order to strengthen govermental programs to protect women’s sexual health
200,000
20,000
20,000
20,000
60,000 80,000
Workshop to confront problems and institutionalize public policy on girls who live under vulnerable conditions.
40,000
40,000
-
-
Workshop to evaluate and revise public policies regarding attention and protection to sexual and reproductive health
30,000
20,000
-
- 10,000
Preparation of healthy practices manual for medical attention for women
200,000
-
200,000
-
-
-
Human Rights seminar to raise awareness on gender
2,880,000
-
288,000
288,000
288,000
864,000 1,152,000
Awareness seminar on gender dimension within the prevention programs ITA HIV AIDS
2,592,000
-
-
288,000
288,000
864,000 1,152,000
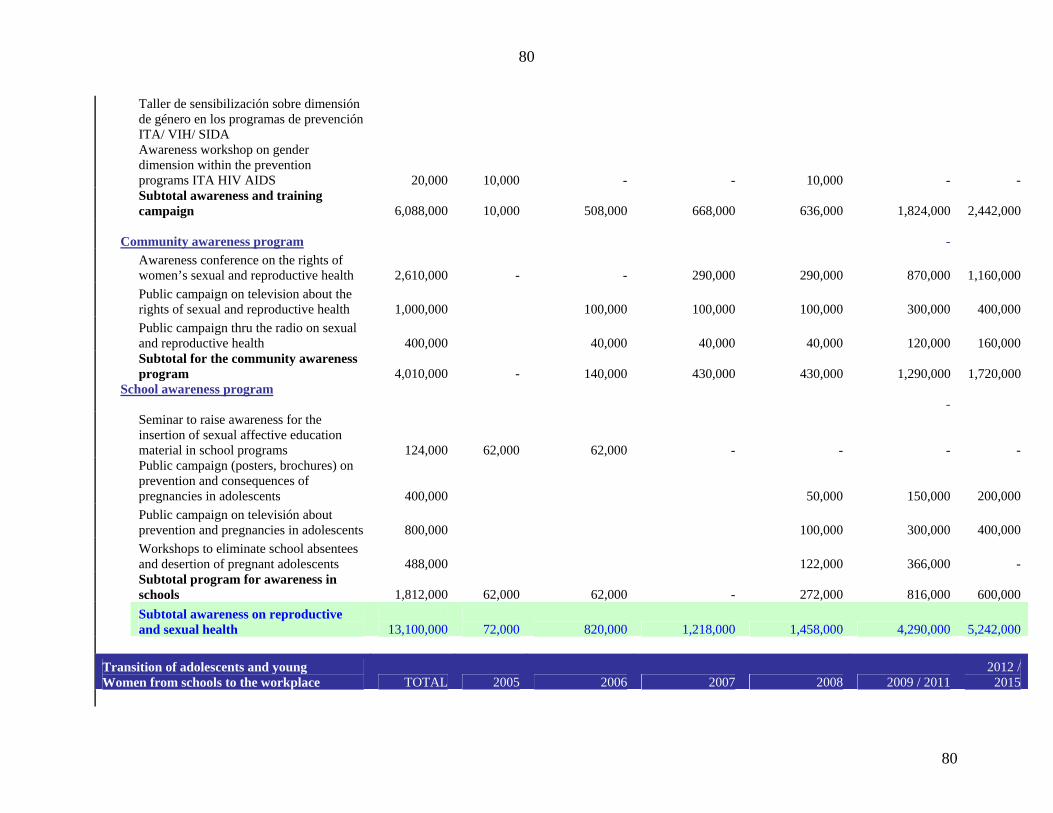
80
80
Taller de sensibilización sobre dimensión de género en los programas de prevención ITA/ VIH/ SIDA Awareness workshop on gender dimension within the prevention programs ITA HIV AIDS
20,000
10,000
-
-
10,000
- -
Subtotal awareness and training campaign
6,088,000
10,000 508,000 668,000 636,000 1,824,000 2,442,000
Community awareness program
-
Awareness conference on the rights of women’s sexual and reproductive health
2,610,000
-
-
290,000
290,000
870,000 1,160,000
Public campaign on television about the rights of sexual and reproductive health
1,000,000
100,000
100,000
100,000
300,000 400,000
Public campaign thru the radio on sexual and reproductive health
400,000
40,000
40,000
40,000
120,000 160,000
Subtotal for the community awareness program
4,010,000
- 140,000 430,000 430,000 1,290,000 1,720,000
School awareness program
-
Seminar to raise awareness for the insertion of sexual affective education material in school programs
124,000
62,000
62,000
-
-
- -
Public campaign (posters, brochures) on prevention and consequences of pregnancies in adolescents
400,000
50,000
150,000 200,000
Public campaign on televisión about prevention and pregnancies in adolescents
800,000
100,000
300,000 400,000
Workshops to eliminate school absentees and desertion of pregnant adolescents
488,000
122,000
366,000 -
Subtotal program for awareness in schools
1,812,000
62,000 62,000
- 272,000 816,000 600,000
Subtotal awareness on reproductive and sexual health
13,100,000
72,000 820,000 1,218,000 1,458,000 4,290,000 5,242,000
Transition of adolescents and young Women from schools to the workplace TOTAL 2005 2006 2007 2008 2009 / 2011
2012 / 2015

81
81
Vocational education
Awareness seminars to promote equal access of girls and adolescents to technical vocation programs
36,000
9,000
-
-
9,000 18,000
Public campaign (posters, brochures) on traditional gender stereotypes and potential for the professional development of boys and girls
200,000
20,000
20,000
20,000
60,000 80,000
Radio campaign to promote technical education for girls and adolescents
360,000
40,000
40,000
120,000 160,000
TV campaign to promote technical education for girls and adolescents
900,000
100,000
100,000
300,000 400,000
Training manual as backup for students within the process of career selection
50,000
50,000
Subtotal vocational education
1,546,000
- 79,000 160,000 160,000
489,000 658,000 Transition to the workplace
Identification of training programs that concentrate on the needs of the labor market
10,000 0 0
10,000 0 0
Signing of the agreement between SEM, INFOTEP, SEE, SET and professional associations in order to develop workplace training for women. n/a n/a n/a n/a n/a
Signing of Memorandum of Understanding between SEM, SET and SEE to develop a work program funded by the Government n/a n/a 0
Creation of mediator instances between universities and the labor sector within the SEM
1,980,000 0 0
220,000
220,000
660,000 880,000
TV campaign on preferential treatment for young women equally trained for vacant posts
360,000 0 0
40,000
40,000
120,000 160,000
Radio campaign about preferential treatment for young women equally trained for vacant posts
180,000 0 0
20,000
20,000
60,000 80,000

82
82
Preparation of good practices manual in order to improve access of women to jobs
30,000 0 0
30,000 0 0 0
Public campaign (posters, brochures) on the importance of ensuring and incrementing access to jobs for young women
40,000 0 0
10,000
10,000 0 20,000
Agreement between SEM, SEE, SET and the center for adult education to promote literacy in adult women n/a n/a 0
Subtotal programs to assist transition of adolescents and young women from schools to the workplace
2,600,000 0 0 330,000 290,000
840,000 1,140,000
Subtotal interventions on transition of adolescents from schools to the workplace
4,146,000 0
79,000 490,000 450,000
1,329,000 1,798,000
Political participation TOTAL 2005 2006 2007 2008 2009 / 2011 2012 /
2015
Changes/implementation of fee Changes/implementation of fees and other legal dispositions in order to ensure political participation/representation of women
Seminars to raise awareness in order to promote observance of the 33% quota for women participation in the House of Representatives 108000 36000 0 0 36000 36000
Working session to raise awareness to promote observance of the 33% quota for women participation in the House of Representatives 30000 10000 0 0 10000 10000
Seminars to raise awareness in the observance of the 33% quota for participation of women in the Senate 108000 36000 0 0 36000 36000
Working session to raise awareness in the promotion of the 33% quota for the participation of women in the Senate 30000 10000 0 0 10000 10000
Seminars to raise awareness to promote observance of the 33% quota for the participation of women in town councils 108000 36000 0 0 36000 36000

83
83
Working sessions to raise awareness in the promotion of the observance of the 33% quota for women in town councils 30000 10000 0 0 10000 10000
Public campaigns (posters, brochures) to redefine a 50% quota for the participation of women in the position of Mayor
20,000
0
20,000 0 0
0 0
Seminars to raise awareness in the promotion in the observance of the 33% quota for the participation of women in positions within the direction of the political parties 108000 36000 0 0 36000 36000
TV campaign on the need of legislative changes in the electoral sector in order to increase opportunities for the participation and representation of women
100,000
0
20,000 0
20,000
20,000 40,000
Seminars to raise awareness for the enactment of bills regarding equal share of elective positions and the Equality Law 40000 0 40000 0 0 0 0
Subtotal change of quotas and other legal dispositions
682,000 0
254,000 0 20,000 194,000 214,000
Training/support for women candidates to political positions
Public campaign (posters, brochures) to increase economic resources for electoral campaigns of women
60,000 0
20,000
0 0
20,000 20,000
Evaluation of laws and bills in order to improve opportunities and the political participation of women 10000
10,000 0 0 0 0 0
Training to strengthen leadership of women candidates to political positions 1320000 120000 120000 120000 120000 360000 480000
Training for women to develop and strengthen their leadership in the communities and in the political arena 1296000 0 144000 144000 432000 576000
Creation of a fund in order to provide financial support to organizations that work in the training and strengthening of women’s leadership 3600000 0 0 400000 400000 1200000 1600000

84
84
Subtotal training/support to women candidates to political positions
6,286,000
130,000
140,000
664,000 664,000
2,012,000 2,676,000
Support for women elected to political/public positions 0
Workshops regarding gender issues, methodologies and tools 66000 6000 6000 6000 6000 18000 24000
Public campaign (posters, brochures) in order to increase the Mininum Quota Law for the participation of women in government
20,000 0 0 0
10,000 0 10,000
Hiring for administrative support and strengthening of the operational capability of the SEM Articulation Council 160000 16000 16000 16000 48000 64000
Workshops regarding gender issues, methodologies and tools
246,000
6,000
22,000
22,000 32,000
66,000 98,000
Subtotal political participation
7,214,000
136,000
416,000
686,000 716,000
2,272,000 2,988,000 Eliminate violence against women TOTAL 2005 2006 2007 2008 2009 / 2011 2012 / 2015 A. Prevention Awareness/sensitizing programs
Develop a program on raising awareness about masculinity
10,000 0
10,000 0 0 0
Train people to teach about programs on awareness of masculinity and gender violence
81,000 0
27,000 0 0
27,000 27,000
Awareness program to implement the sensitizing program on masculinity
3,840,000
384,000
384,000
384,000
1,152,000 1,536,000
Awareness program on prevention and sanction of gender violence 3840000 0 384000 384000 384000 1152000 1536000
Programs to raise awareness on prevention and sanction of gender violence 3840000 384000 384000 384000 1152000 1536000
Subtotal programs on raising awareness/sensitizing
11,611,000 0
1,189,000
1,152,000 1,152,000
3,483,000 4,635,000
Public campaigns
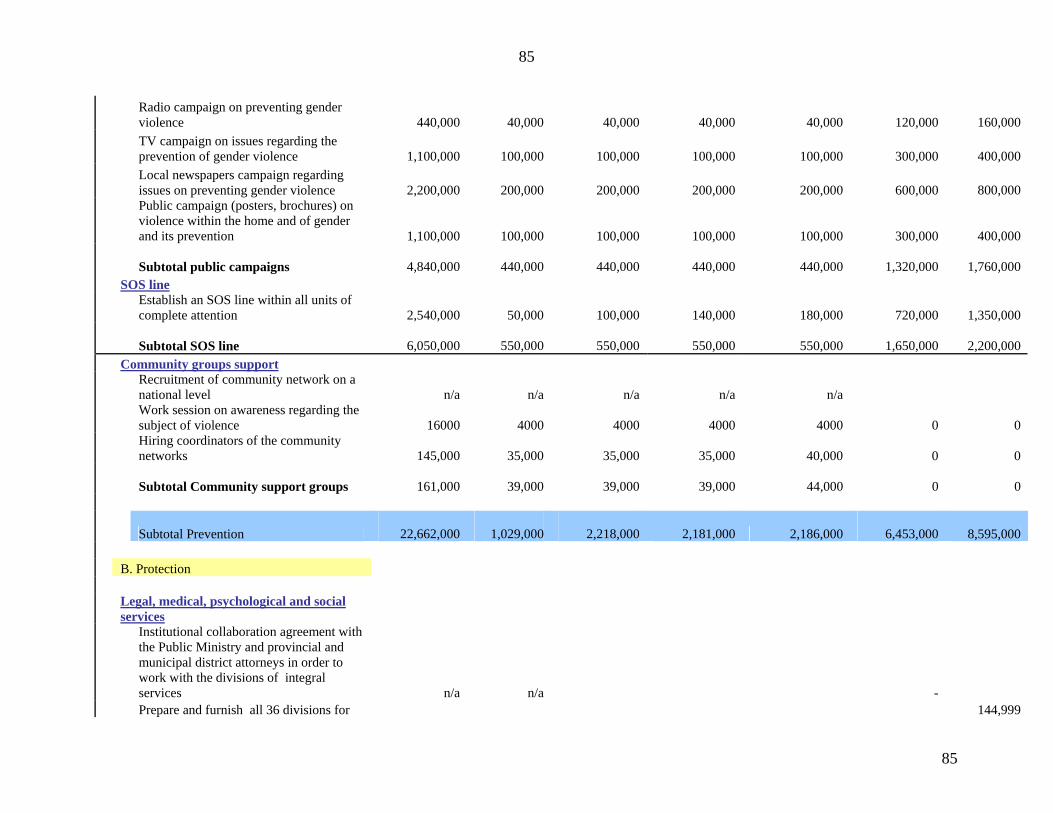
85
85
Radio campaign on preventing gender violence
440,000
40,000
40,000
40,000
40,000
120,000 160,000
TV campaign on issues regarding the prevention of gender violence
1,100,000
100,000
100,000
100,000
100,000
300,000 400,000
Local newspapers campaign regarding issues on preventing gender violence
2,200,000
200,000
200,000
200,000
200,000
600,000 800,000
Public campaign (posters, brochures) on violence within the home and of gender and its prevention
1,100,000
100,000
100,000
100,000
100,000
300,000 400,000
Subtotal public campaigns
4,840,000
440,000
440,000
440,000 440,000
1,320,000 1,760,000 SOS line
Establish an SOS line within all units of complete attention
2,540,000
50,000
100,000
140,000
180,000
720,000 1,350,000
Subtotal SOS line
6,050,000
550,000
550,000
550,000 550,000
1,650,000 2,200,000 Community groups support
Recruitment of community network on a national level n/a n/a n/a n/a n/a
Work session on awareness regarding the subject of violence 16000 4000 4000 4000 4000 0 0
Hiring coordinators of the community networks
145,000
35,000
35,000
35,000
40,000 0 0
Subtotal Community support groups
161,000
39,000
39,000
39,000 44,000 0 0
Subtotal Prevention
22,662,000
1,029,000
2,218,000
2,181,000 2,186,000
6,453,000 8,595,000 B. Protection
Legal, medical, psychological and social services
Institutional collaboration agreement with the Public Ministry and provincial and municipal district attorneys in order to work with the divisions of integral services n/a n/a
-
Prepare and furnish all 36 divisions for 144,999
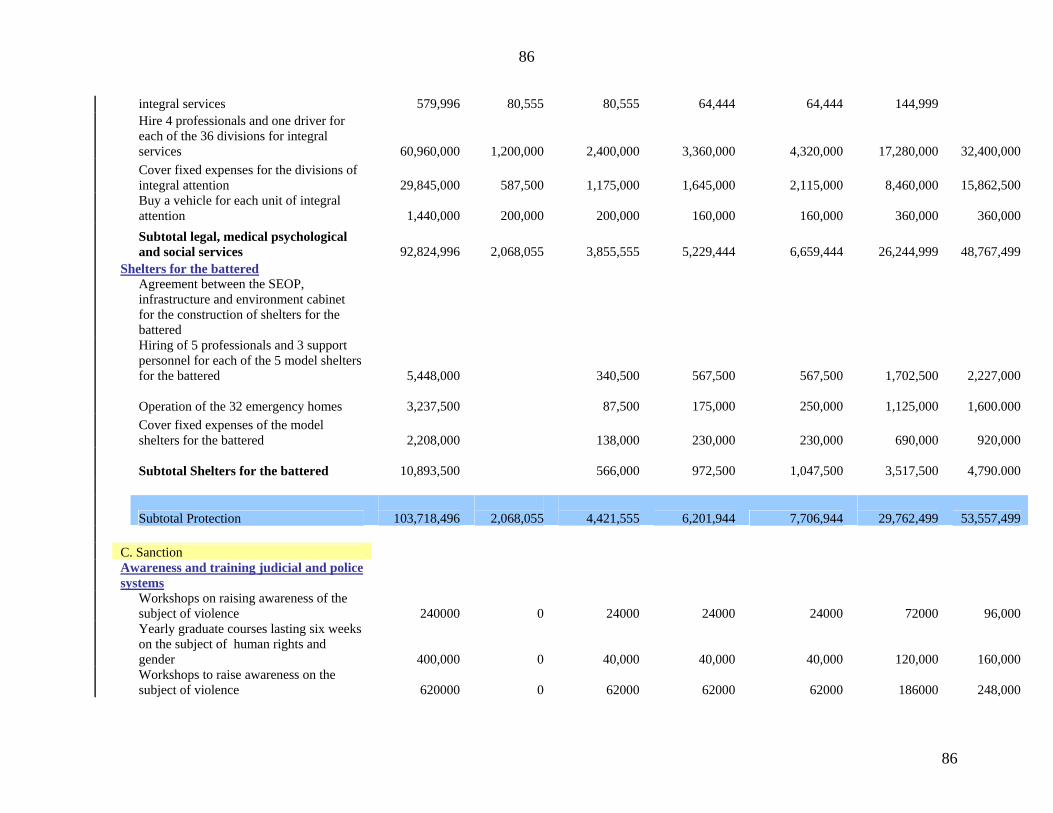
86
86
integral services 579,996 80,555 80,555 64,444 64,444 144,999
Hire 4 professionals and one driver for each of the 36 divisions for integral services
60,960,000
1,200,000
2,400,000
3,360,000
4,320,000
17,280,000 32,400,000
Cover fixed expenses for the divisions of integral attention
29,845,000
587,500
1,175,000
1,645,000
2,115,000
8,460,000 15,862,500
Buy a vehicle for each unit of integral attention
1,440,000
200,000
200,000
160,000
160,000
360,000 360,000
Subtotal legal, medical psychological and social services
92,824,996
2,068,055
3,855,555
5,229,444 6,659,444
26,244,999 48,767,499
Shelters for the battered
Agreement between the SEOP, infrastructure and environment cabinet for the construction of shelters for the battered
Hiring of 5 professionals and 3 support personnel for each of the 5 model shelters for the battered
5,448,000
340,500
567,500
567,500
1,702,500 2,227,000
Operation of the 32 emergency homes
3,237,500
87,500
175,000
250,000
1,125,000 1,600.000
Cover fixed expenses of the model shelters for the battered
2,208,000
138,000
230,000
230,000
690,000 920,000
Subtotal Shelters for the battered
10,893,500
566,000
972,500 1,047,500
3,517,500 4,790.000
Subtotal Protection
103,718,496
2,068,055
4,421,555
6,201,944 7,706,944
29,762,499 53,557,499 C. Sanction
Awareness and training judicial and police systems
Workshops on raising awareness of the subject of violence 240000 0 24000 24000 24000 72000 96,000
Yearly graduate courses lasting six weeks on the subject of human rights and gender
400,000 0
40,000
40,000
40,000
120,000 160,000
Workshops to raise awareness on the subject of violence 620000 0 62000 62000 62000 186000 248,000
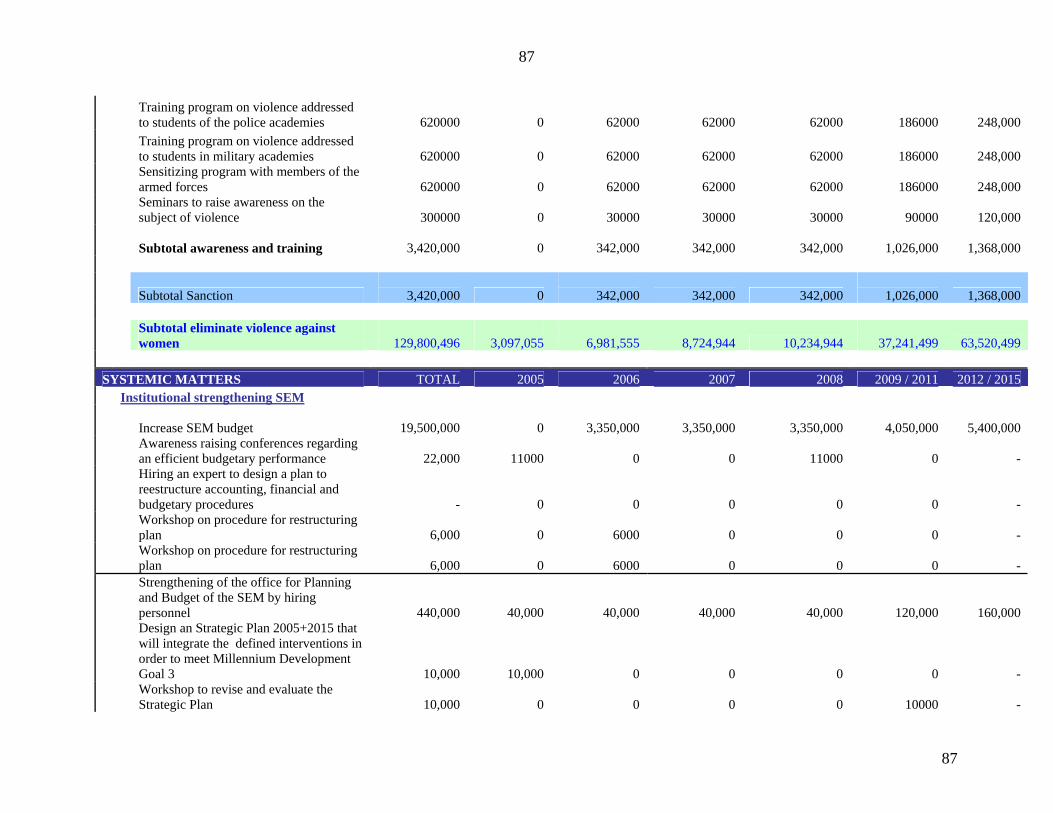
87
87
Training program on violence addressed to students of the police academies 620000 0 62000 62000 62000 186000 248,000
Training program on violence addressed to students in military academies 620000 0 62000 62000 62000 186000 248,000
Sensitizing program with members of the armed forces 620000 0 62000 62000 62000 186000 248,000
Seminars to raise awareness on the subject of violence 300000 0 30000 30000 30000 90000 120,000
Subtotal awareness and training
3,420,000 0
342,000
342,000 342,000
1,026,000 1,368,000
Subtotal Sanction
3,420,000 0
342,000
342,000 342,000
1,026,000 1,368,000
Subtotal eliminate violence against women
129,800,496
3,097,055
6,981,555
8,724,944 10,234,944
37,241,499 63,520,499
SYSTEMIC MATTERS TOTAL 2005 2006 2007 2008 2009 / 2011 2012 / 2015 Institutional strengthening SEM
Increase SEM budget
19,500,000 0
3,350,000
3,350,000
3,350,000
4,050,000 5,400,000
Awareness raising conferences regarding an efficient budgetary performance
22,000 11000 0 0 11000 0 -
Hiring an expert to design a plan to reestructure accounting, financial and budgetary procedures
- 0 0 0 0 0 -
Workshop on procedure for restructuring plan
6,000 0 6000 0 0 0 -
Workshop on procedure for restructuring plan
6,000 0 6000 0 0 0 -
Strengthening of the office for Planning and Budget of the SEM by hiring personnel
440,000
40,000
40,000
40,000
40,000
120,000 160,000
Design an Strategic Plan 2005+2015 that will integrate the defined interventions in order to meet Millennium Development Goal 3
10,000
10,000 0 0 0 0 -
Workshop to revise and evaluate the Strategic Plan
10,000 0 0 0 0 10000 -

88
88
Planning system from a gender perspective for coordination, control, monitoring and devolution between SEM. OPS OPM 0 0 0 0 0 0 -
Training workshops in order to develop a performance and articulate capacity
84,000 42000 0 0 42000 0 -
Strengthening the operational capability of CONAPLUVI by hiring two technicians by SEM
800,000 0
80,000
80,000
80,000
240,000 320,000
Establish an investigation and data base development unit
400,000 0
40,000
40,000
40,000
120,000 160,000
Strengthen the technical capability of the public policies directory by hiring two women technicians
800,000 0
80,000
80,000
80,000
240,000 320,000
Strengthen the technical capability of the directorate for the defense of women’s rights by hiring a woman technician
400,000 0
40,000
40,000
40,000
120,000 160,000
Increase budget for the OPMs in order to perform decentralized provincial work
20,000,000 0
2,000,000
2,000,000
2,000,000
6,000,000 8,000
Subtotal Institutional Strengthening SEM
42,478,000
103,000
5,642,000
5,630,000 5,683,000
10,900,000 14,520,000
Mainstreaming of gender/interinstitucional solutions
Negotiate the strengthening of the operational capability of the OEGD for the SEE in order to ensure a gender perspective n/a n/a 0 -
Strengthening the operational capability of the OEGD for the SEE in order to ensure a gender perspective in planning 12000 0 6000 0 6000 0 -
Strengthen the operational capability of the OEGD for the SEE to ensure the gender perspective in education
6,000 0
3,000 0
3,000 0 -
Negotiate the strengthening of the operational capability of the OEGD for SESPAS to ensure a gender perspective n/a n/a 0 -
Strengthen the operational capability of the OEGD for SESPAS in order to ensure a gender perspective in planning 12000 0 6000 0 6000 0 -
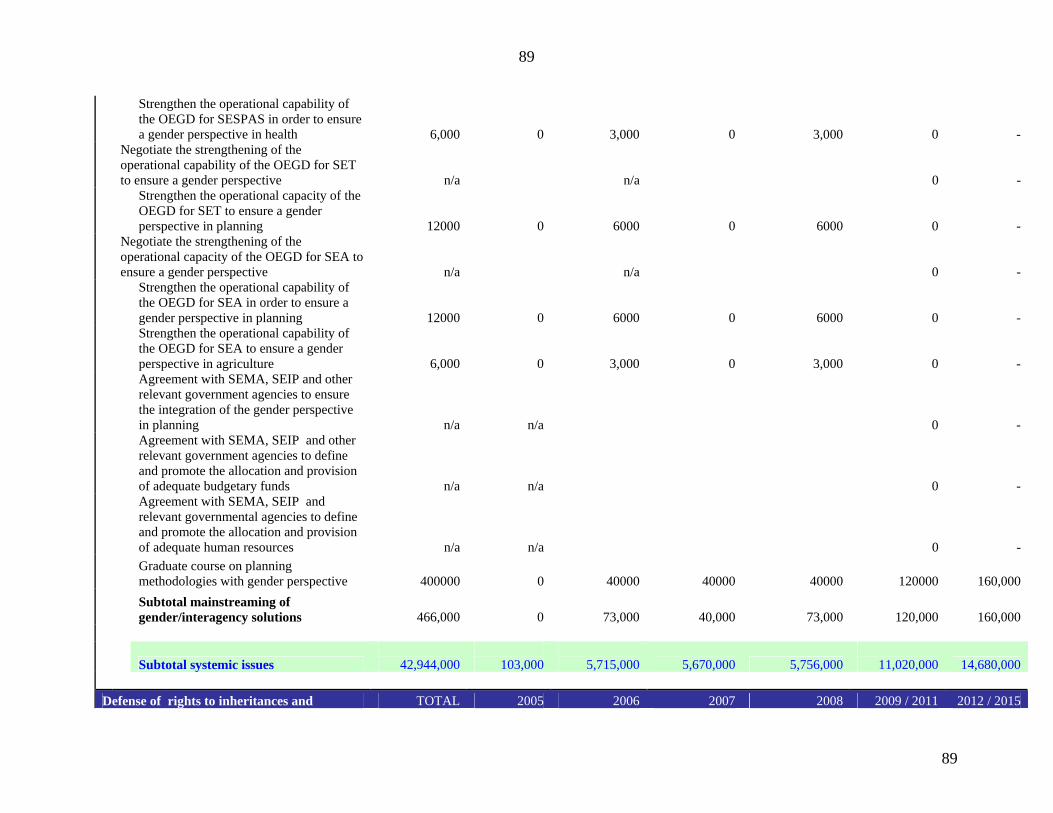
89
89
Strengthen the operational capability of the OEGD for SESPAS in order to ensure a gender perspective in health
6,000 0
3,000 0
3,000 0 -
Negotiate the strengthening of the operational capability of the OEGD for SET to ensure a gender perspective n/a n/a 0 -
Strengthen the operational capacity of the OEGD for SET to ensure a gender perspective in planning 12000 0 6000 0 6000 0 -
Negotiate the strengthening of the operational capacity of the OEGD for SEA to ensure a gender perspective n/a n/a 0 -
Strengthen the operational capability of the OEGD for SEA in order to ensure a gender perspective in planning 12000 0 6000 0 6000 0 -
Strengthen the operational capability of the OEGD for SEA to ensure a gender perspective in agriculture
6,000 0
3,000 0
3,000 0 -
Agreement with SEMA, SEIP and other relevant government agencies to ensure the integration of the gender perspective in planning n/a n/a 0 -
Agreement with SEMA, SEIP and other relevant government agencies to define and promote the allocation and provision of adequate budgetary funds n/a n/a 0 -
Agreement with SEMA, SEIP and relevant governmental agencies to define and promote the allocation and provision of adequate human resources n/a n/a 0 -
Graduate course on planning methodologies with gender perspective 400000 0 40000 40000 40000 120000 160,000
Subtotal mainstreaming of gender/interagency solutions
466,000 0
73,000
40,000 73,000
120,000 160,000
Subtotal systemic issues
42,944,000
103,000
5,715,000
5,670,000 5,756,000
11,020,000 14,680,000 Defense of rights to inheritances and TOTAL 2005 2006 2007 2008 2009 / 2011 2012 / 2015
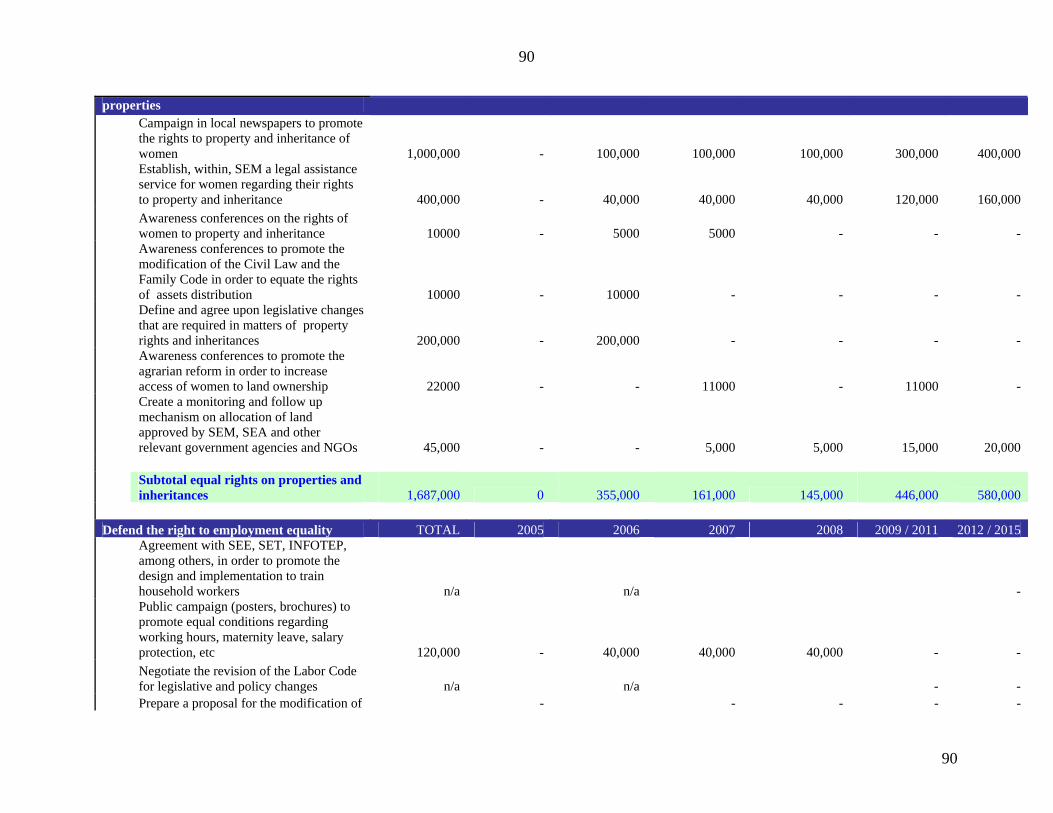
90
90
properties
Campaign in local newspapers to promote the rights to property and inheritance of women
1,000,000 -
100,000
100,000
100,000
300,000 400,000
Establish, within, SEM a legal assistance service for women regarding their rights to property and inheritance
400,000 -
40,000
40,000
40,000
120,000 160,000
Awareness conferences on the rights of women to property and inheritance 10000 - 5000 5000 - - -
Awareness conferences to promote the modification of the Civil Law and the Family Code in order to equate the rights of assets distribution 10000 - 10000 - - - -
Define and agree upon legislative changes that are required in matters of property rights and inheritances
200,000 -
200,000 - - - -
Awareness conferences to promote the agrarian reform in order to increase access of women to land ownership 22000 - - 11000 - 11000 -
Create a monitoring and follow up mechanism on allocation of land approved by SEM, SEA and other relevant government agencies and NGOs
45,000 - -
5,000
5,000
15,000 20,000
Subtotal equal rights on properties and inheritances
1,687,000 0
355,000
161,000 145,000
446,000 580,000
Defend the right to employment equality TOTAL 2005 2006 2007 2008 2009 / 2011 2012 / 2015
Agreement with SEE, SET, INFOTEP, among others, in order to promote the design and implementation to train household workers n/a n/a -
Public campaign (posters, brochures) to promote equal conditions regarding working hours, maternity leave, salary protection, etc
120,000 -
40,000
40,000
40,000 - -
Negotiate the revision of the Labor Code for legislative and policy changes n/a n/a - -
Prepare a proposal for the modification of - - - - -

91
91
the labor code 40,000 40,000
Keep permanent contacts in SEM and SET to ensure monitors, sanction and compensation n/a n/a n/a n/a n/a n/a n/a
Newspaper campaign on the importance of providing access to economic and financial assets for women
160,000 -
40,000
40,000 - - 80,000
Revise existing credit mechanisms to evaluate their capacity in ensuring an equal distribution
10,000 -
10,000 - - - -
Grant an award yearly for good performance in equal employment conditions for women
105,000 -
10,500
10,500
10,500
31,500 42,000
Determine gender needs in the workplace for revision of existing programs at SET
10,000 - -
10,000 - - -
Revise Social Security system to ensure equal opportunities among men and women
10,000 - -
10,000 - - -
Seminar to define strategy for divulging of matters related to social security 10000 - 10000 - - - -
Awareness conferences to sensitize women workers on Social Security matters 162000 - 54000 54000 54000 - -
Learn about the status of women who work in agriculture and their labor rights
10,000 - -
10,000 - - -
Awareness conferences to improve the ability of women to demand and negotiate the inclusion of their interests in SEMA policies and programs
54,000 - 18000 18000 18000 - -
Define the needs of women to have access the water supply
20,000 -
20,000 - - - -
Awareness workshop to promote quantification of non remunerated household work and its inclusion in the National Accounts
6,000 - - - 6000 - -
Radio campaign to make visible the non remunerated work performed by women
40,000 - - -
40,000 - -
TV campaign to make visible the value of the non remunerated work performed by
100,000 - - -
100,000 - -

92
92
women
Agreement with SEE, SET, INFOTEP, among others, to promote the design and implementation of training for household work n/a n/a - -
Workshop to raise awareness on the need to formalize household work
16,000 - - 16000 - - -
Workshop to raise awareness on the need to formalize household work in the Senate and Congress
16,000 0 0 16000 0 0 0
Subtotal equal rights in employment
889,000 0
242,500
224,500 268,500 31,500 122,000 TOTAL GENERAL 199,780,496 3,408,055 14,609,055 17,174,444 19,028,444 56,629,999 88,930,499 TOTAL PER CAPITA 1.84 0.37 1.58 1.83 2.00 1.93 2.17
Note: The final cost per capita is the mean of the costs per capita per year and the total populations. *Exchange rate US$1:RD$30. Source: Central Bank of the Dominican Republic

93
93
Annex 4
Matrix of the interventions and costs of the Working Group on Health and HIV-AIDS
INTERVENTION TOTAL 2005 2006 2007 2008 2009-2011 2012-2015
Total annual population 9,100,183 9,229,855 9,363,652
9,501,724 19,435,547 40,986,060 HEALTH SYSTEM TOTAL 2005 2006 2007 2008 2009 / 2011 2012 / 2015 IEC and consumer campaign programs (FESP3) 150,032,035 3,599,245 10,946,516 11,092,804 11,236,298 40,316,484 72,840,688 Developing policies, plans and management capacity-building for SESPAS (FESP5, FESP8) 632,693,189 28,639,007 36,584,902 37,462,123 48,971,475 169,768,004 311,267,676 Monitoring and assessment (FESP5), epidemiological surveillance, public health control measures, strengthened practices in public laboratories and blood banks (FESP2), information systems and capacity for Health Situation Analysis (FESP1), develop organizational structures for the regulatory frameworks (FESP9.) 474,519,891 21,479,256 27,438,677 28,096,593 36,728,606 127,326,003 233,450,757 Research and development: clinical and operational research, technological evaluation (FESP10) 63,269,319 2,863,901 3,658,490 3,746,212 4,897,148 16,976,800 31,126,768 Setting up a national pharmacological surveillance system, including processes for the approval and registration of new drugs, drug market surveillance, price-setting and distribution of drugs and the rational use of drugs ensuring distributors comply with the regulations. (FESP9) 31,634,659 1,431,950 1,829,245 1,873,106 2,448,574 8,488,400 15,563,384 Drug expense assumed by the government 880,000,000 80,000,000 80,000,000 80,000,000 80,000,000 240,000,000 320,000,000

94
94
Subtotal Health System 2,232,149,094 138,013,359 160,457,831 162,270,838 184,282,101 602,875,692 984,249,273 Health System Cost Per Capita 20.62 15.17 17.38 17.33 19.39 20.54 23.99 HUMAN RESOURCES TOTAL 2005 2006 2007 2008 2009 / 2011 2012 / 2015 On-the-job staff training 18,380,879 0 1,065,309 1,049,965 969,911 3,130,683 4,517,165 Per-service training 16,585,039 0 1,151,323 1,175,953 1,191,165 3,215,096 3,318,203 Staff salaries 3,989,279,416 112,512,725 148,139,645 150,119,356 204,529,328 689,760,870 997,228,311 Staff incentives 494,670,648 13,951,578 18,369,316 18,614,800 25,361,637 $85,530,348 123,656,311 Subtotal Human Resources 2,608,558,996 126,464,303 168,725,593 170,960,073 232,052,040 781,636,997 1,128,719,989 Human Resources Cost Per Capita 24.08 13.90 18.28 18.26 24.42 26.62 27.54 INFRASTRUCTURE TOTAL 2005 2006 2007 2008 2009 / 2011 2012 / 2015 Costs for construction and equipment of new centers 233,950,498 16,068,911 23,423,183 29,866,590 38,155,233 114,308,864 12,127,717 Strengthening existing services 45,015,164 11,635,171 0 0 0 15,816,649 17,563,343 Operation and maintenance 2,663,767,888 106,149,759 113,311,230 122,407,561 133,992,347 821,275,320 1,366,631,671 Subtotal Infrastructure 2,942,733,550 133,853,841 136,734,414 152,274,152 172,147,580 951,400,833 1,396,322,731 Infrastructure Cost Per Capita 27.02 14.71 14.81 16.26 18.12 32.35 34.06 MATERNAL HEALTH TOTAL 2005 2006 2007 2008 2009 / 2011 2012 / 2015 Family planning 24,422,341 1,372,606 1,683,247 1,738,291 1,881,242 6,566,869 11,180,087 Ante-natal Care (ANC) and during labor 33,890,132 3,024,887 3,049,982 3,069,825 3,085,154 9,302,516 12,357,768 Obstetrics complications 35,073,033 2,344,484 2,548,047 2,740,369 2,921,320 9,731,243 14,787,570 Other maternal conditions 6,318,763 195,811 262,295 330,610 402,470 1,674,042 3,453,535 Newborn interventions 7,796,917 699,172 701,127 703,073 705,009 2,126,554 2,861,982 Sexually transmitted diseases 3,128,163 279,688 284,162 287,540 289,779 870,782 1,116,212 Subtotal Maternal Health 110,629,348 7,916,647 8,528,861 8,869,706 9,284,975 30,272,005 45,757,154 Maternal Health Cost Per Capita 1.03 0.87 0.92 0.95 0.98 1.03 1.12 CHILD HEALTH TOTAL 2005 2006 2007 2008 2009 / 2011 2012 / 2015 Primary Care 0 0 Acute respiratory infection (ARI) $35,382 38,692 45,221 48,566 51,874 175,060 275,969 Diarrhea 14,792,026 969,459 1,047,556 1,125,046 1,201,692 4,055,342 6,392,931
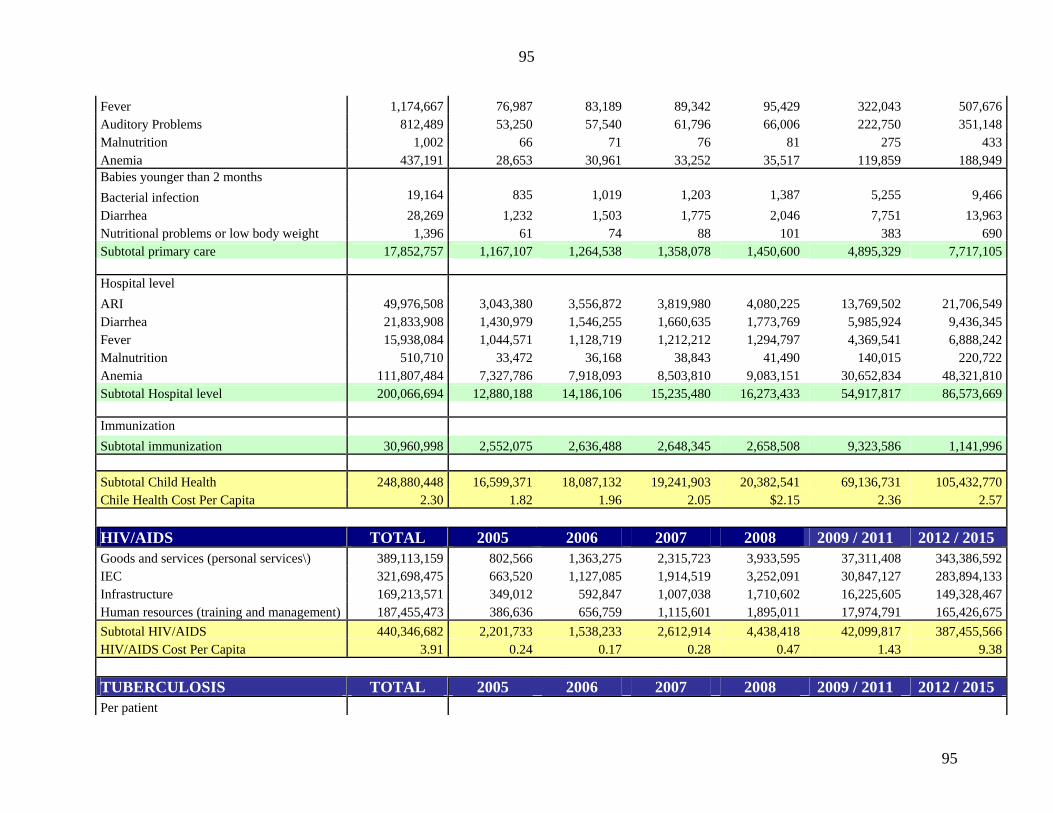
95
95
Fever 1,174,667 76,987 83,189 89,342 95,429 322,043 507,676 Auditory Problems 812,489 53,250 57,540 61,796 66,006 222,750 351,148 Malnutrition 1,002 66 71 76 81 275 433 Anemia 437,191 28,653 30,961 33,252 35,517 119,859 188,949 Babies younger than 2 months $0 $0 Bacterial infection 19,164 835 1,019 1,203 1,387 5,255 9,466 Diarrhea 28,269 1,232 1,503 1,775 2,046 7,751 13,963 Nutritional problems or low body weight 1,396 61 74 88 101 383 690 Subtotal primary care 17,852,757 1,167,107 1,264,538 1,358,078 1,450,600 4,895,329 7,717,105 Hospital level $0 $0 ARI 49,976,508 3,043,380 3,556,872 3,819,980 4,080,225 13,769,502 21,706,549 Diarrhea 21,833,908 1,430,979 1,546,255 1,660,635 1,773,769 5,985,924 9,436,345 Fever 15,938,084 1,044,571 1,128,719 1,212,212 1,294,797 4,369,541 6,888,242 Malnutrition 510,710 33,472 36,168 38,843 41,490 140,015 220,722 Anemia 111,807,484 7,327,786 7,918,093 8,503,810 9,083,151 30,652,834 48,321,810 Subtotal Hospital level 200,066,694 12,880,188 14,186,106 15,235,480 16,273,433 54,917,817 86,573,669 Immunization $0 $0 Subtotal immunization 30,960,998 2,552,075 2,636,488 2,648,345 2,658,508 9,323,586 1,141,996 Subtotal Child Health 248,880,448 16,599,371 18,087,132 19,241,903 20,382,541 69,136,731 105,432,770 Chile Health Cost Per Capita 2.30 1.82 1.96 2.05 $2.15 2.36 2.57 HIV/AIDS TOTAL 2005 2006 2007 2008 2009 / 2011 2012 / 2015 Goods and services (personal services\) 389,113,159 802,566 1,363,275 2,315,723 3,933,595 37,311,408 343,386,592 IEC 321,698,475 663,520 1,127,085 1,914,519 3,252,091 30,847,127 283,894,133 Infrastructure 169,213,571 349,012 592,847 1,007,038 1,710,602 16,225,605 149,328,467 Human resources (training and management) 187,455,473 386,636 656,759 1,115,601 1,895,011 17,974,791 165,426,675 Subtotal HIV/AIDS 440,346,682 2,201,733 1,538,233 2,612,914 4,438,418 42,099,817 387,455,566 HIV/AIDS Cost Per Capita 3.91 0.24 0.17 0.28 0.47 1.43 9.38 TUBERCULOSIS TOTAL 2005 2006 2007 2008 2009 / 2011 2012 / 2015 Per patient

96
96
Detection 1,967,495 1,671,708 1,695,499 1,719,202 1,742,792 178,951 249,240 Treatment 21,385,627 2,106,825 2,366,926 2,266,681 2,162,619 5,930,453 6,552,123 Programs Strengthening the laboratory management network 3,093,821 304,791 342,419 327,917 312,862 857,948 947,884 Strengthening PCT record system 1,538,534 151,570 170,282 163,071 155,584 426,651 471,376 Research 697,011 68,667 77,144 73,877 70,485 193,288 213,550 Evaluation 659,792 65,000 73,025 69,932 66,721 182,967 202,147 National management 3,809,310 375,278 421,608 403,752 385,216 1,056,361 1,167,095 Strengthening logistics 167,445 16,496 18,533 17,748 16,933 46,434 51,302 Training 2,976,075 293,191 329,387 315,437 300,955 825,296 911,809 Supervision 370,674 36,517 41,026 39,288 37,484 102,792 113,567 Information-education-communication 1,682,807 165,783 186,250 178,362 170,174 466,660 515,578 Total cost per patient 21,951,257 2,162,548 2,429,529 2,326,633 2,219,819 6,087,308 6,725,420 Total program cost 14,995,469 1,477,292 1,659,674 1,589,383 1,516,415 4,158,397 4,594,308 Subtotal Tuberculosis 36,946,726 3,639,841 4,089,203 3,916,015 3,736,234 10,245,706 11,319,728 Tuberculosis Cost Per Capita 0.35 0.40 0.44 0.42 0.39 10.48 8.30 MALARIA TOTAL 2005 2006 2007 2008 2009 / 2011 2012 / 2015 Falciparum 12,465 299 299 299 299 299 299 Non Falciparum $35 3 3 3 3 3 3 Severe 109,857 9,384 9,469 9,469 9,469 9,469 9,469 Total treatment 122,357 9,686 9,771 9,771 9,771 9,771 9,771 Tests Malaria test coverage (fever cases) 100% 100% 100% 100% 100% 100% 100% Ratio of fever cases per malaria cases 134 134 134 134 134 134 134 # of diagnostic tests performed 315,034 315,034 315,034 315,034 315,034 945,102 1,260,136 Scenario RDT test coverage 65% 0% 20% 50% 80% 80% 80% # of diagnostic tests performed (average) 203,340 0 63,007 157,517 252,027 756,082 1,008,109 Giemsa test coverage 100% 100% 100% 20% 60% 80% # of diagnostic tests performed (average) 131,741 315,034 315,034 315,034 63,007 189,020 252,027 RDT only 100% 100% 100% 100% 100% 300% 400% Unit cost per test (Giemsa) $0.02 0.02 0.02 0.02 0.02 0.02 0.02 Unit cost per test (RDT) $1.00 1.00 1.00 1.00 1.00 1.00 1.00

97
97
Test total 3,465,374 315,034 315,034 315,034 315,034 945,102 1,260,136 Subtotal Malaria 3,587,731 324,720 324,805 324,805 324,805 979,112 1,309,485 Cost Per Capita Malaria 0.03 0.04 0.04 0.04 0.03 0.03 0.03 GRAND TOTAL HEALTH 8,623,832,576 429,013,814 498,486,071 520,470,407 626,648,695 2,785,772,356 4,388,838,808 HEALTH COST PER CAPITA 79.34 47.14 54.01 55.58 65.95 94.84 106.99 Note: The final cost per capita is the mean of the costs per capita per year and the total populations. *Exchange rate US$1:RD$30. Source: Central Bank of the Dominican Republic
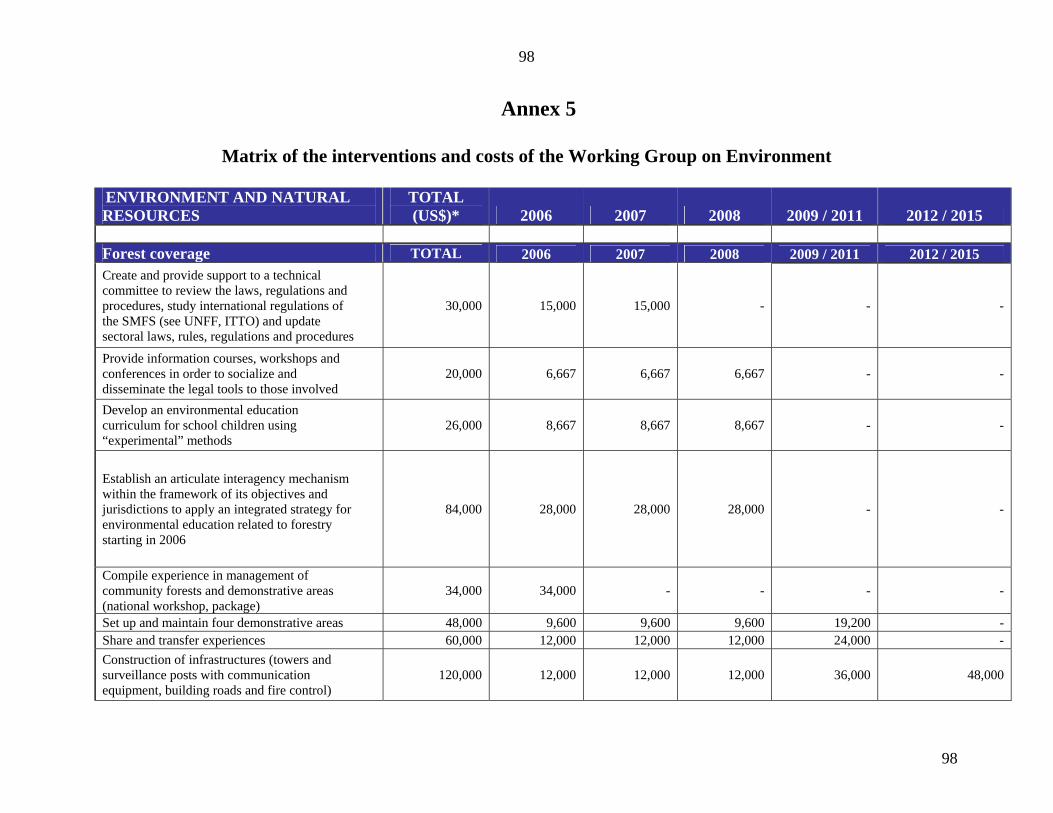
98
98
Annex 5
Matrix of the interventions and costs of the Working Group on Environment ENVIRONMENT AND NATURAL RESOURCES
TOTAL (US$)* 2006 2007 2008 2009 / 2011 2012 / 2015
Forest coverage TOTAL 2006 2007 2008 2009 / 2011 2012 / 2015 Create and provide support to a technical committee to review the laws, regulations and procedures, study international regulations of the SMFS (see UNFF, ITTO) and update sectoral laws, rules, regulations and procedures
30,000 15,000 15,000 - - -
Provide information courses, workshops and conferences in order to socialize and disseminate the legal tools to those involved
20,000 6,667 6,667 6,667 - -
Develop an environmental education curriculum for school children using “experimental” methods
26,000 8,667 8,667 8,667 - -
Establish an articulate interagency mechanism within the framework of its objectives and jurisdictions to apply an integrated strategy for environmental education related to forestry starting in 2006
84,000 28,000 28,000 28,000 - -
Compile experience in management of community forests and demonstrative areas (national workshop, package)
34,000 34,000 - - - -
Set up and maintain four demonstrative areas 48,000 9,600 9,600 9,600 19,200 - Share and transfer experiences 60,000 12,000 12,000 12,000 24,000 - Construction of infrastructures (towers and surveillance posts with communication equipment, building roads and fire control)
120,000 12,000 12,000 12,000 36,000 48,000

99
99
Create permanent and voluntary brigades with their equipment (equipment and tools for the prevention and control of forest fires, uniforms and other supplies to enhance efficiency)
12,857 4,286 4,286 4,286 - -
Complete the identification of defaced areas 60,000 20,000 20,000 20,000 - - Define a rehabilitation plan for each area and an implementation strategy 24,000 24,000 - - - -
Extend services to rural dwellers in order to promote agro-forestry and other sustainable uses using demonstrative activities and local experts
24,000 2,400 2,400 2,400 7,200 9,600
Technical study on the type of incentive 12,500 6,250 6,250 - - - Production of fiscal instrument 15,000 7,500 7,500 - - - Technical training for forestry production 27,000 13,500 13,500 - - - Complete information on the country’s capacity to meet national demand for wood for construction purposes (inventory)
100,000 10,000 10,000 10,000 30,000 40,000
Compile and complete a base line of different types of ecosystems; mountainous, fresh water life forms
50,000 5,000 5,000 5,000 15,000 20,000
Strengthen selection mechanism for forest and park rangers 900,000 90,000 90,000 90,000 270,000 360,000
Apply the Law for Civil and Administrative career 675,000 67,500 67,500 67,500 202,500 270,000
Increase mountain parks and forest rangers salaries by x% each year 23,920,000 2,392,000 2,392,000 2,392,000 7,176,000 9,568,000
Identify the needs and quantities of units: tools, transportation, uniforms, chain saws, computers, software, database, houses, etc
6,000 1,200 1,200 1,200 2,400 -
Buy equipment and train on its use 22,500,000 4,500,000 4,500,000 4,500,000 9,000,000 -
Sub-Total of forest coverage 48,748,357 7,269,569 7,211,569 7,169,319 16,782,300 10,315,600
Protected areas TOTAL 2006 2007 2008 2009 / 2011 2012 / 2015 Five workshops to define and formulate policies 17,500
17,500 - - - -
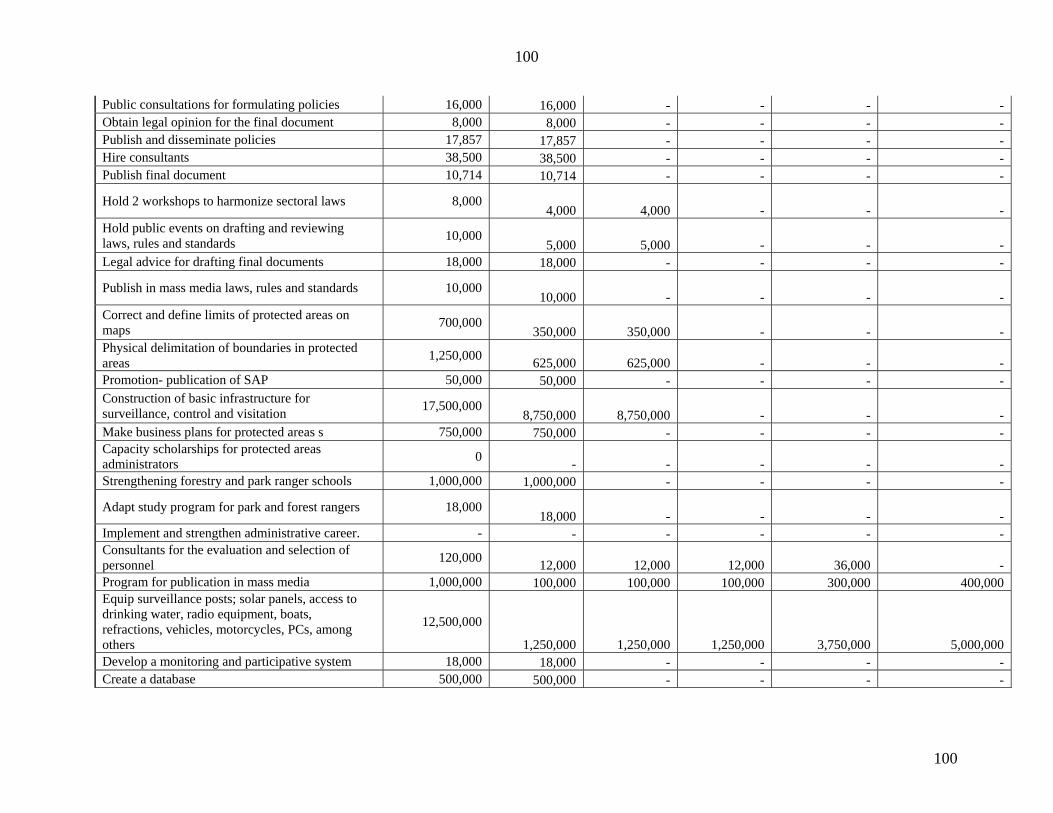
100
100
Public consultations for formulating policies 16,000 16,000 - - - - Obtain legal opinion for the final document 8,000 8,000 - - - - Publish and disseminate policies 17,857 17,857 - - - - Hire consultants 38,500 38,500 - - - - Publish final document 10,714 10,714 - - - -
Hold 2 workshops to harmonize sectoral laws 8,000 4,000 4,000 - - -
Hold public events on drafting and reviewing laws, rules and standards 10,000
5,000 5,000 - - - Legal advice for drafting final documents 18,000 18,000 - - - -
Publish in mass media laws, rules and standards 10,000 10,000 - - - -
Correct and define limits of protected areas on maps 700,000
350,000 350,000 - - - Physical delimitation of boundaries in protected areas 1,250,000 625,000 625,000 - - - Promotion- publication of SAP 50,000 50,000 - - - - Construction of basic infrastructure for surveillance, control and visitation 17,500,000
8,750,000 8,750,000 - - - Make business plans for protected areas s 750,000 750,000 - - - - Capacity scholarships for protected areas administrators 0 - - - - - Strengthening forestry and park ranger schools 1,000,000 1,000,000 - - - -
Adapt study program for park and forest rangers 18,000 18,000 - - - -
Implement and strengthen administrative career. - - - - - - Consultants for the evaluation and selection of personnel 120,000 12,000 12,000 12,000 36,000 - Program for publication in mass media 1,000,000 100,000 100,000 100,000 300,000 400,000 Equip surveillance posts; solar panels, access to drinking water, radio equipment, boats, refractions, vehicles, motorcycles, PCs, among others
12,500,000
1,250,000 1,250,000 1,250,000 3,750,000 5,000,000 Develop a monitoring and participative system 18,000 18,000 - - - - Create a database 500,000 500,000 - - - -
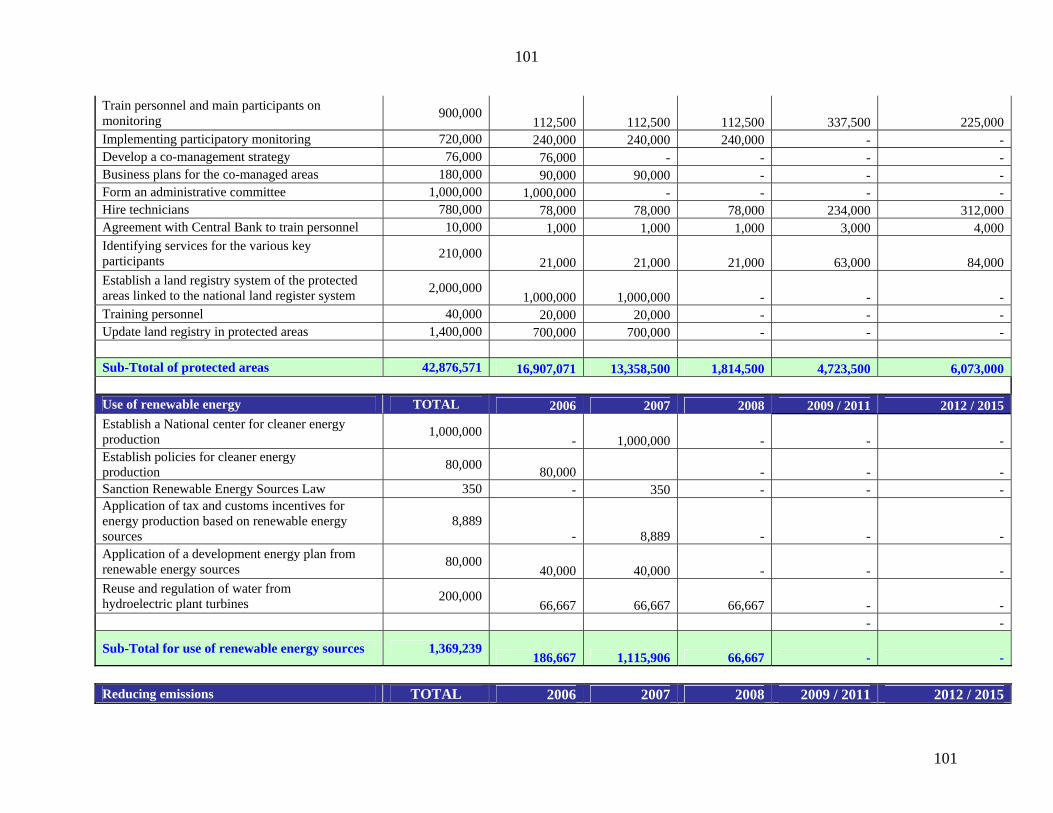
101
101
Train personnel and main participants on monitoring 900,000
112,500 112,500 112,500 337,500 225,000 Implementing participatory monitoring 720,000 240,000 240,000 240,000 - - Develop a co-management strategy 76,000 76,000 - - - - Business plans for the co-managed areas 180,000 90,000 90,000 - - - Form an administrative committee 1,000,000 1,000,000 - - - - Hire technicians 780,000 78,000 78,000 78,000 234,000 312,000 Agreement with Central Bank to train personnel 10,000 1,000 1,000 1,000 3,000 4,000 Identifying services for the various key participants 210,000
21,000 21,000 21,000 63,000 84,000 Establish a land registry system of the protected areas linked to the national land register system 2,000,000
1,000,000 1,000,000 - - - Training personnel 40,000 20,000 20,000 - - - Update land registry in protected areas 1,400,000 700,000 700,000 - - - Sub-Ttotal of protected areas 42,876,571 16,907,071 13,358,500 1,814,500 4,723,500 6,073,000
Use of renewable energy TOTAL 2006 2007 2008 2009 / 2011 2012 / 2015 Establish a National center for cleaner energy production 1,000,000
- 1,000,000 - - - Establish policies for cleaner energy production 80,000 80,000 - - - Sanction Renewable Energy Sources Law 350 - 350 - - - Application of tax and customs incentives for energy production based on renewable energy sources
8,889 - 8,889 - - -
Application of a development energy plan from renewable energy sources 80,000
40,000 40,000 - - - Reuse and regulation of water from hydroelectric plant turbines 200,000
66,667 66,667 66,667 - - - -
Sub-Total for use of renewable energy sources 1,369,239 186,667 1,115,906 66,667 - -
Reducing emissions TOTAL 2006 2007 2008 2009 / 2011 2012 / 2015
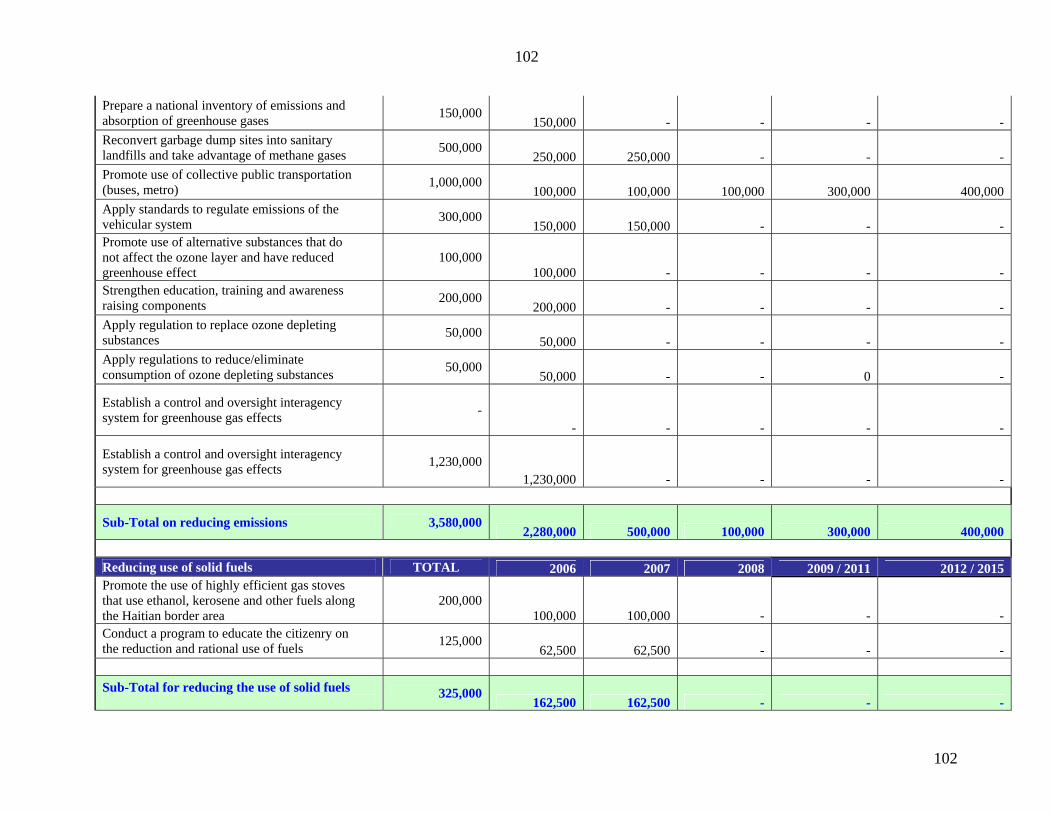
102
102
Prepare a national inventory of emissions and absorption of greenhouse gases 150,000
150,000 - - - - Reconvert garbage dump sites into sanitary landfills and take advantage of methane gases 500,000
250,000 250,000 - - - Promote use of collective public transportation (buses, metro) 1,000,000
100,000 100,000 100,000 300,000 400,000 Apply standards to regulate emissions of the vehicular system 300,000
150,000 150,000 - - - Promote use of alternative substances that do not affect the ozone layer and have reduced greenhouse effect
100,000 100,000 - - - -
Strengthen education, training and awareness raising components 200,000
200,000 - - - - Apply regulation to replace ozone depleting substances 50,000
50,000 - - - - Apply regulations to reduce/eliminate consumption of ozone depleting substances 50,000
50,000 - - 0 -
Establish a control and oversight interagency system for greenhouse gas effects -
- - - - -
Establish a control and oversight interagency system for greenhouse gas effects 1,230,000
1,230,000 - - - -
Sub-Total on reducing emissions 3,580,000 2,280,000 500,000 100,000 300,000 400,000
Reducing use of solid fuels TOTAL 2006 2007 2008 2009 / 2011 2012 / 2015 Promote the use of highly efficient gas stoves that use ethanol, kerosene and other fuels along the Haitian border area
200,000 100,000 100,000 - - -
Conduct a program to educate the citizenry on the reduction and rational use of fuels 125,000
62,500 62,500 - - - Sub-Total for reducing the use of solid fuels
325,000 162,500 162,500 - - -
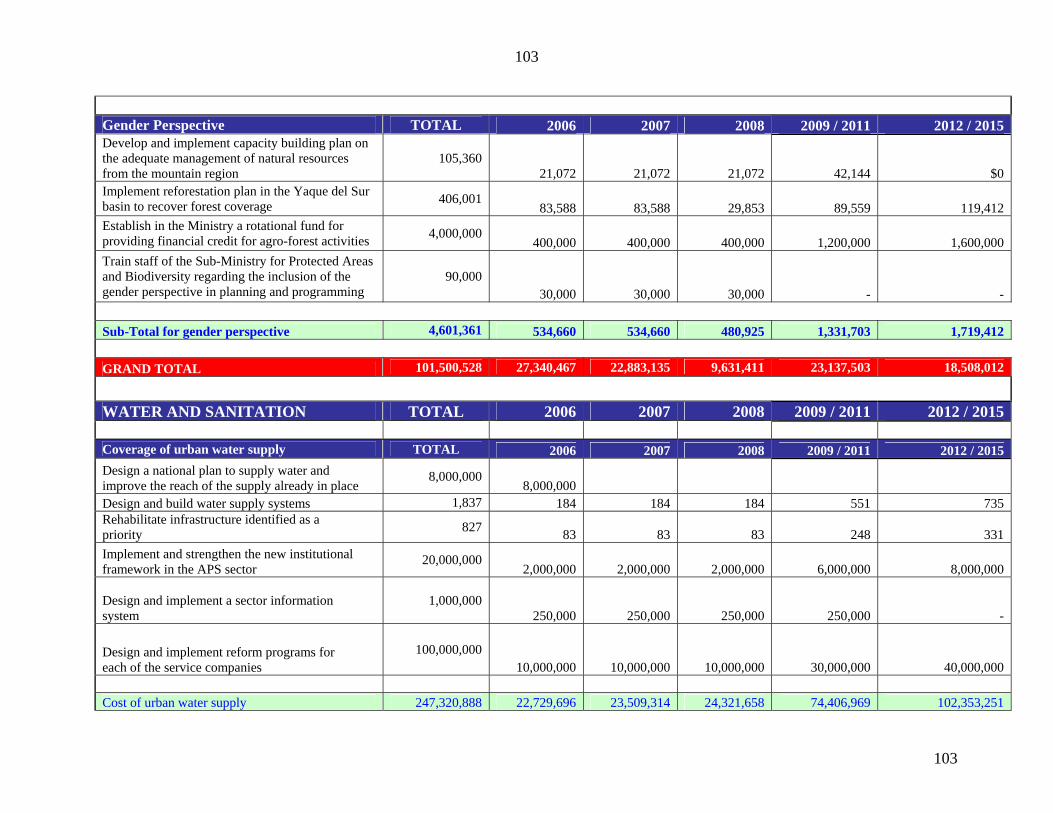
103
103
Gender Perspective TOTAL 2006 2007 2008 2009 / 2011 2012 / 2015 Develop and implement capacity building plan on the adequate management of natural resources from the mountain region
105,360 21,072 21,072 21,072 42,144 $0
Implement reforestation plan in the Yaque del Sur basin to recover forest coverage 406,001
83,588 83,588 29,853 89,559 119,412 Establish in the Ministry a rotational fund for providing financial credit for agro-forest activities 4,000,000
400,000 400,000 400,000 1,200,000 1,600,000 Train staff of the Sub-Ministry for Protected Areas and Biodiversity regarding the inclusion of the gender perspective in planning and programming
90,000 30,000 30,000 30,000 - -
Sub-Total for gender perspective 4,601,361 534,660 534,660 480,925 1,331,703 1,719,412
GRAND TOTAL 101,500,528 27,340,467 22,883,135 9,631,411 23,137,503 18,508,012
WATER AND SANITATION TOTAL 2006 2007 2008 2009 / 2011 2012 / 2015 Coverage of urban water supply TOTAL 2006 2007 2008 2009 / 2011 2012 / 2015 Design a national plan to supply water and improve the reach of the supply already in place
8,000,000 8,000,000
Design and build water supply systems 1,837 184 184 184 551 735 Rehabilitate infrastructure identified as a priority 827 83 83 83 248 331 Implement and strengthen the new institutional framework in the APS sector
20,000,000 2,000,000 2,000,000 2,000,000 6,000,000 8,000,000
Design and implement a sector information system
1,000,000 250,000 250,000 250,000 250,000 -
Design and implement reform programs for each of the service companies
100,000,000 10,000,000 10,000,000 10,000,000 30,000,000 40,000,000
Cost of urban water supply 247,320,888 22,729,696 23,509,314 24,321,658 74,406,969 102,353,251

104
104
Rehabilitation cost 174,695,158 17,469,516 17,469,516 17,469,516 52,408,547 69,878,063 Other costs 129,000,000 20,250,000 12,250,000 12,250,000 36,250,000 48,000,000 Sub-Total coverage of urban water supply 551,016,046 60,449,212 53,228,830 54,041,173 163,065,516 220,231,314
Coverage of rural water supply TOTAL 2006 2007 2008 2009 / 2011 2012 / 2015 Design a national plan for water supply in rural areas 5,000,000 5,000,000 - - - - Design and build water supply systems (connections within the homes) 1,710 171 171 171 513 684 Design and build water supply systems (other solutions) 430 43 43 43 129 172 Rehabilitate infrastructure identified as a priority 827 83 83 83 248 331 Strengthen and extend decentralization program for rural water supplies 25,000,000 2,500,000 2,500,000 2,500,000 7,500,000 10,000,000 Cost rural water supply 121,815,753 9,934,463 12,473,785 11,711,561 36,397,182 51,298,762 Rehabilitation cost 73,919,349 7,391,935 7,391,935 7,391,935 22,175,805 29,567,739 Other costs 30,000,000 7,500,000 2,500,000 2,500,000 7,500,000 10,000,000 Subtotal costs of coverage of rural water supply 225,735,101 24,826,398 22,365,720 21,603,496 66,072,987 90,866,501
Chlorination TOTAL 2006 2007 2008 2009 / 2011 2012 / 2015 Formulate a national plan for 100% disinfection 1,000,000 1,000,000 - - - -
Acquire, install and put in place 60 chlorination equipments within the urban water supply (24 in systems that lack them and the remaining 36 to replace those that are obsolete) 60,000 15,000 15,000 15,000 15,000 -
Acquire, install and put in place 220 chlorination equipments in the rural supply systems (185 in systems that lack them and the remaining 35 to replace those that are obsolete) 40,000 10,000 10,000 10,000 10,000 - Design and implement a national program to optimize the disinfection process * 4 - - - - -

105
105
Cost of urban chlorination 900,000 225,000 225,000 225,000 225,000 0 Cost of rural chlorination 2,200,000 550,000 550,000 550,000 550,000 0 Cost of national program to optimize disinfection process * - - - - - - Other costs 1,000,000 1,000,000 - - - - Sub-Total chlorination costs 4,100,000 1,775,000 775,000 775,000 775,000 -
Sanitary control TOTAL 2006 2007 2008 2009 / 2011 2012 / 2015 Design and implement an oversight system for the quality of water for human consumption en each of the firms 250,000 250,000 Update and universalize the urban coverage of the sanitary control system for the agencies 50,000 5,000 5,000 5,000 15,000 20,000 Update and universalize the rural coverage of the agencies´ sanitary control system * 6,500 650 650 650 1,950 2,600 0 Cost of urban sanitary control* - - - - - - Cost rural sanitary control - - - - - - Other costs 250,000 250,000 - - - - Sub-Total for sanitary control 250,000 250,000 - - - -
Water not metered (control of wasted water) TOTAL 2006 2007 2008 2009 / 2011 2012 / 2015 Install macro meters in at least 50 main urban water supplies 500,000 125,000 125,000 125,000 125,000 Increase coverage of micro meters to approximately 50% of the registered users in the urban areas 950 95 95 95 285 380 Design and implement institutional programs to strengthen businesses 5,000,000 1,000,000 1,000,000 1,000,000 2,000,000 - Design and implement an awareness-raising program for the citizenry on rational use of water 83,250 16,650 16,650 16,650 33,300 - Workshop on environmental sanitation 3,750 750 750 750 1,500 - Workshop on work methodology on environmental sanitation 4,250 850 850 850 1,700 0

106
106
Workshop on empowerment of community groups 4,250 850 850 850 1,700 - Advertising campaign on management, use and conservation of water 71,000 14,200 14,200 14,200 28,400 - Cost of coverage of micro meters 42,750,000 4,275,000 4,275,000 4,275,000 12,825,000 17,100,000 Awareness-raising cost 190,000 38,000 38,000 38,000 76,000 - Other costs 5,500,000 1,125,000 1,125,000 1,125,000 2,125,000 - Sub-Total control of wasted water 48,440,000 5,438,000 5,438,000 5,438,000 15,026,000 17,100,000
Urban sanitation TOTAL 2006 2007 2008 2009 / 2011 2012 / 2015 Design and build drainage systems 1,933 193 193 193 580 773 Build latrines in poor areas of the cities 570 57 57 57 171 228 Rehabilitate sanitary drainage infrastructure selected as top priority 785 79 79 79 236 314 Rehabilitate residual water treatment plants 23,400,000 4,680,000 4,680,000 4,680,000 9,360,000 -
Build new residual water treatment plants 471,000,000 47,100,000 47,100,000 47,100,000 141,300,000 188,400,000 0 Cost sanitation coverage 256,291,789 22,867,343 23,520,146 25,370,706 76,615,578 107,918,016 Cost sanitation rehabilitation 57,086,377 5,708,638 5,708,638 5,708,638 17,125,913 22,834,551 Cost residual water treatment plants (including rehabilitation 494,400,000 51,780,000 51,780,000 51,780,000 150,660,000 188,400,000 Sub-Total urban sanitation costs 807,778,166 80,355,981 81,008,784 82,859,344 244,401,491 319,152,566
Rural sanitation TOTAL 2006 2007 2008 2009 / 2011 2012 / 2015 Develop a latrine installation program for rural zones 570 57 57 57 171 228 Cost of rural latrine installation program 42,825,240 4,282,524 4,282,524 4,282,524 12,847,572 17,130,096 Sub-Total of rural sanitation 42,825,240 4,282,524 4,282,524 4,282,524 12,847,572 17,130,096
Operation of service agencies TOTAL 2006 2007 2008 2009 / 2011 2012 / 2015

107
107
Develop a latrine installation program for rural areas 0 0 0 0 0 0 Cost of rural latrine installation program 1,430,639,309 123,989,137 128,155,899 132,263,966 422,324,736 623,905,570 Sub-Total of latrine installation 1,430,639,309 123,989,137 128,155,899 132,263,966 422,324,736 623,905,570 GRAND TOTAL 3,110,783,863 301,366,252 295,254,757 301,263,503 924,513,303 1,288,386,048
SLUM DWELLERS IMPROVEMENT OF EXISTING SLUM DWELLINGS Infrastructure UNIT COSTS (US$) Carry out pre-investment studies in selected settlements 49 Promote urban design proposals for identified settlements 22 Provide each settlement with public areas and parks 2 Install pipelines for clean water in households in target groups 328 Provide a sanitary drainage system for families in target groups 366 Provide rain drainage systems in all settlements 121 Install electricity in household of selected settlements 114 Provide roads for all settlements 296 Establish garbage collection system 14 Tenancy Demarcation and registration 1,200 sites or lots 29 Buy 7,620,000 square meters 1,270 Capacity-Building Train 60,000 within target groups in environmental matters 4

108
108
Print 60,000 brochures for environmental training 5 Community Equipment Provide recreation areas at the settlements 36 Equip recreational facilities 50
Build = 240 classrooms for preschoolers 46
Equip = 270 classrooms for preschoolers 44 Total Cost 2,791 Relocate 6% of the targeted population 27 Build 6,600 new housing units 8,000 Home improvement for 53,400 houses 2,400 Design material to train dwellers in 5 construction matters and MA 4,000 Train representatives from 20% of targeted families 67 Design training material un urban planning for municipal technicians 4,000 Print 1,000 brochures to train government officials 5 Installation of 40 OPU in 2 years 20,000 Train technicians of installed OPU 4,000 Indirect costs 952 SUB-TOTAL TOTAL 2006 2007 2008 2009 / 2011 2012 / 2015 IMPROVEMENT OF EXISTING SLUM DWELLINGS Infrastructure 260,085,900 26,008,590 26,008,590 26,008,590 78,025,770 $104,034,360 Tenancy 77,955,000 7,795,500 7,795,500 7,795,500 23,386,500 $31,182,000 Training 672,080 85,208 65,208 65,208 195,624 $260,832 Equip communities 10,525,800 1,052,580 1,052,580 1,052,580 3,157,740 $4,210,320 Planning 888,500 420,900 416,900 - 33,800 $16,900 Indirect costs for infrastructures 57,092,332 5,709,233 5,709,233 5,709,233 17,127,700 $22,836,933

109
109
Sub-Total improvement of slum dwellings 407,219,612 41,072,011 41,048,011 40,631,111 121,927,134 $162,541,345
PREVENTION OF NEW SETTLEMENTS UNIT COSTS (US$)
Lots for housing 800 30% land for infrastructure and equipment 240 Infrastructure 930 Viability 296 Housing 8,000 Indirect costs (22%) 2,030 Pre investment studies 49 Urban design proposals 22 Collection of solid waste 14 Boundaries and registration of land $8 Equipment for recreational areas 86 Planting trees in public areas 2 Children’s areas 89 Indirect costs on constructions (22%) 18 SUB-TOTAL TOTAL 2006 2007 2008 2009 / 2011 2012 / 2015
PREVENTION OF NEW SETTLEMENTS Infrastructure 859,717,800 85,971,780 85,971,780 85,971,780 257,915,340 343,887,120 Tenancy 72,675,000 7,267,500 7,267,500 7,267,500 21,802,500 29,070,000 Equip communities 15,788,700 1,578,870 1,578,870 1,578,870 4,736,610 6,315,480 Indirect costs of infrastructures 184,285,134 18,428,513 18,428,513 18,428,513 55,285,540 73,714,054 Sub-Total prevention of slum dwellings 1,132,466,634 113,246,663 113,246,663 113,246,663 339,739,990 452,986,654 GRAND TOTAL 1,539,686,246 $154,318,675 154,294,675 153,877,775 461,667,124 615,527,998 GRAND TOTAL 4,751,970,636 483,025,394 472,432,566 464,772,688 1,409,317,929 1,922,422,058 COST PER CAPITA 48.34 52.33 50.45 48.91 49.61 48.26 *These costs are included in the Operation of Service Institutions. *Note: Final per capita cost is the mean of annual per capita costs with the total population. *Exchange rate: US$1= RD$30. Source: Central Bank of the Dominican Republic

110
110
Annex 6
Methodological Estimation of the Gross Domestic Product (GDP) and the Expenditures of the Dominican Government for the period 2006-2015
1.- An average annual growth of 3.8% of the real GDP is assumed for the 2006-2015 period.
This number is based on the average growth rate of the Dominican economy for 1980-2003 and the growth estimates made by the Swiss investment firm UBS for 2006-2009. In the former case, the result is an average annual growth of 4.1%, while the later shows an annual GDP variation of 3.5% until 2009.
Consider that said projections assume a satisfactory conclusion to the Stand-By Agreement between the Dominican Government and the International Monetary Fund (IMF).
2.- The 121.41 link ratio is used as a deflactor to calculate GDP in present Dominican pesos.
This value is the simple GDP deflactor (present GDP / real GDP) for the year 2005, considering the estimated present GDP of RD$911 million for the year and a real GDP growth of 4%. The reason the last year is used to calculate the deflactor is that an average based on previous years yields a very low coefficient which would result in a decrease of the GDP in the following years.
3. Finally, there is an assumption that there will be a constant inclusion of the expenses identified for the MDGs within the GDP.
Based on the functional classification of the expense (i.e. social services), their inclusion within the Gross Domestic Product is used as a trend for the last five years, and it is assumed that such trend will remain stable through time. This will allow us to estimate the total amount for each year.
1 In millions. It would be approximately 121,400,000.
Participants from the National Needs Assessment and Costing Analysis for the Millennium Development Goals in the Dominican Republic
Attached list of individuals have collaborated in an ongoing manner to complete the costing
analysis and interventions related to achieving the MDGs in the Dominican Republic
• Coordination
John R. Gagain Jr., Executive Director, Presidential Commission on the Millennium Development Goals and Sustainable Development (COPDES) Niky Fabiancic, U.N. Resident Coordinator in the Dominican Republic Fernando I. Ferrán, Coordinator and Report Writer
• Working Group on Combating Hunger and Malnutrition

Amilcar Romero, Minister of Agriculture, Lead Antonio Morales, Representative FAO Maria Paz Salas, Representative WFP Luis R. Rodriguez, Coordinator Leandro Mercedes, Coordinator Saturnino De Los Santos, Analyst-Consultant Sub-Group: Distribution and Marketing
Milton Paniagua, Sub-Coordinator
Hector Mata Luis R. Rodriguez Noesterling Diaz Sub-Group: Nutrition Matilde Vasquez Cabral, Sub-Coordinator Maria Consuelo Alonso Amarilis Then Angel Batista Leandro Garcia Luz Mercedes Victor Medina Sub-Group: Improving Employment and Income
Luz Adelma Guillen, Sub-Coordinator
Leandro Mercedes Ismael Cruz Manuel Fermin Sub-Group: Increasing Agricultural Production Fernando Fernandez,
Sub-Coordinator Andres Cedano Digna Pena Henry Guerrero Tamara Carmona Sub-Group: Support to Interventions Fresneda Novoa Marcelino Encarnacion Tomas Sandoval Other Participants: Rhaysa Martinez Miriam Rodriguez José Hamilton Coplin Alejandro Rojas Altagracia Paulino Angel Rodriguez Celeste Lora Ferdinand Rosario Migdalea Varona Victor Medina Yolanda Sosa
• Working Group on Education
Alejandrina German, Minister of Education, Lead Tad Palac, Representative UNICEF Minerva Vincent, Coordinator Ramon Flores, Analyst-Consultant Ancell Scheker, Analyst Yvonne Villanueva
Aida Consuelo Hernandez Carlos Aldemar Tejada Elias Lopez Magaly Pineda Walid Chami Hector Tobias Lockart Victor Sanchez Nadia Cordero Ramón Pérez Minaya Santa Mateo Susana Done Josefina Pimentel
114
114
Carmen Sanchez Mercedes Hernández Adalberto Martinez Susana Michel Dinorah de Lima
Cristina Molina Luisa Mateo Pedro Eduardo Julio Pena Augustin Espinosa
Christian Matias
• Working Group on Gender Equity and Women’s
Empowerment
Gladys Gutierrez, Minister of Women’s Affairs, Lead Carmen Moreno, Director INSTRAW Sonia Diaz, Coordinator Yildalina Taten, Coordinator Tatjana Sikoska, Analyst-Consultant Magali Caram Moira Fratta Sergia Galvan Altagracia Conception Carmen Perez Clarissa Valdez Elba Franco
Elva Mercedes Fatima Lorenzo Gabriela De Los Santos Gianna Sangiovanni Giselle Scanlon Josefina Arvelo Lourdes Contreras Lucero Quiroga Luz Adelma Guillen Magaly Pineda Maria Diaz Maria Cristina Feliz Noris Pimentel Rosa Rita Alvarez Rosa Beltran Santa Mateo
• Working Group on Health and HIV-AIDS
Sabino Baez, Minister of Public Health, Lead Socorro Gross, Representative PAHO/WHO
Reynaldo Peguero, Coordinator
Rafael Schiffino, Coordinator Fernando Rojas, Analyst-Consultant Elizabeth Gomez, Analyst-Consultant
Sub-Group on Maternal and Infant Health
Hector Eusebio, Sub-Coordinator
Oscar Suriel Boriana Maleeva Sara Menendez Consuelo Mendoza Donatilo Santos Hector Juan Cid Luz Herrera Marilu Esposito Mario Geraldino Marta Nina

115
115
Matilde Vasquez Silvia Caro Sonia Aquino HIV-AIDS Alberto Fiallo, Coordinator Ana Navarro Andres Guerrero Angel Almanzar Claudia Valdez Nassim Diaz Rosa Sanchez Sexual and Reproductive Health Magaly Caram, Sub-Coordinator Mariana Moreno, Sub-Coordinator Luz Mercedes Liliana Marty Sergia Galvan Susi Pola Essential Medicines Elena Fernández, Sub-Coordinator Dalia Castillo Adolfo Sagrado Giselle Vasquez Gustavo Rojas Maria Elena Tapia Miguel Urena Miriam Alburquerque Nelson Belisario Sandra Fermin Malaria Jose Manuel Puello, Sub-Coordinator Celia Riera Angel Solis David Joa
Gavino Guzman Health Systems Gerardo Alfaro Sub-Coordinator Gertrudies de Espinal Emilia Guzman Eneyda Almonte Hector Otero Ilda Natera Maria Santana Orlanda Fermin Pedro Ramirez Ramona Martinez Roberto Blondet Roberto Peguero Rosa Maria Suarez
Tuberculosis Belkis Marcelino Ivelisse Acosta Ivelisse Garras Juan José Cordero
Selma Zapata Other Participants: Bernardo Defillo Altagracia Guzman Bautista Rojas Betania Leger Debra Jones
Elva Mercedes Candelaria Araoz
• Working Group on the Environment
Maximiliano Puig, Minister of Environment Lead Olga Luciano, Coordinator
Miguel Expósito, Analyst-Consultant
Rosa Urania Abreu, Analyst-Consultant
Sina Del Rosario
116
116
Sub-Coordinator Omar Ramírez Sub-Coordinator Luis Eduardo Germán Sub-Coordinator Sixto Incháustegui Henry Hernández Alfredo Morillo Ana Terrero Antonia Marte Bienvenido Santana Carlos Hernández Carolina Noboa Cesarina Medina Daneris Santana David Arias Digna Fernandez Dilia Cruz Edwin Vargas Elias Gomez Elias Vargas Ernesto Reyna Giulio Marin Idalia Acevedo Jose Mateo Jose Peralta Jose Rodriguez Jose Ramon Rodriguez Juan Alcantara Juan Mancebo Kennida Polanco
Luis Espinosa Victor Vinas Lucas Vicens Marcia Beltre Marcos Marinez Maria Priscila Pena Mariana Perez Marina Hernández Marta Perez Miguel Abreu Moises Alvarez Noris Pimentel Otto Cordero Patricia Abreu Patricia Lamelas Patricio Devers Pedro Garcia Priscila Pena Rafael Lorenzo Ramona Checo Roberto Sanchez Rosa Lamelas Santa Rosario Teodoro Lara Teresa Disla Victor Garcia Virgilio Cepeda William Gutierrez Yennys Valdez Yvonne Arias Zoila Gonzalez
• Working Group on Rural and Urban Infrastructure
Mariano German Mejia, Minister and Coordinator of Environment and Infrastructure Cabinet, Lead
José Rodriguez Mercedes Sabater Francisco Gonzalez Eladio Duran
• National Planning Office (ONAPLAN)
Guarocuya Felix, Director of ONAPLAN, Lead Lourdes Meyreles Coordinator
Manuel Matos Catalina Michelle Tejada Miguel Ceara Asuad Hamlet Gutierrez Elva Mercedes

• U.N. Millennium Project, New York
Jeffrey Sachs, Director Guido Schmidt-Traub
Lead for Dominican Republic
Lenora Suki, Coordinator
Margaret Kruk Chandrika Bahadur Mariana Kastrinakis Nima Tabloei Maria Davalos Letty Gutierrez
118
Bibliography
Presidential Commission on the Millennium Development Goals and Sustainable Development (COPDES) and United Nations Country Team (UNCT). National Report on the Millennium Development Goals, Dominican Republic 2004. Santo Domingo. Amigos del Hogar Press, 2004. 83 p. Presidential Commission on the Millennium Development Goals and Sustainable Development (COPDES) and United Nations Country Team (UNCT). Hunger and Malnutrition Working Group Report: Needs Assessment and Costs Analysis to achieve Target 2 of MDG I. Santo Domingo, 2005. Presidential Commission on the Millennium Development Goals and Sustainable Development (COPDES) and United Nations Country Team (UNCT). Education Working Group Report: Needs Assessments and Costs Analysis to achieve MDG 2. Santo Domingo, 2005.
Presidential Commission on the Millennium Development Goals and Sustainable Development (COPDES) and United Nations Country Team (UNCT). Gender Equality and Empowerment of Women Working Group Report: Needs Assessment and Costs Analysis to achieve MDG 3. Santo Domingo, 2005. Presidential Commission on the Millennium Development Goals and Sustainable Development (COPDES) and United Nations Country Team (UNCT). Health Working Group Report: Needs Assessment and Costs Analysis to achieve MDGs 4, 5, 6 and Target 17 of MDG 8. Santo Domingo, 2005. Presidential Commission on the Millennium Development Goals and Sustainable Development (COPDES) and United Nations Country Team (UNCT). Environment Working Group Report: Needs Assessment and Costs Analysis to achieve MDG 7. Santo Domingo, 2005. Presidential Commission on the Millennium Development Goals and Sustainable Development (COPDES) and United Nations Country Team (UNCT). Working Group on Infrastructure Report. Santo Domingo, 2005.
U.N. Millennium Project. Investing in Development: A Practical Plan to Achieve the Millennium Development Goals. United Kingdom, Earthscan. 2005.