investing in growth – capital markets day 2011
DESCRIPTION
Presentation from Modern Times Group's 2011 Capital Markets Day on 26 May 2011 at the Emirates Stadium in North London.TRANSCRIPT

1
2
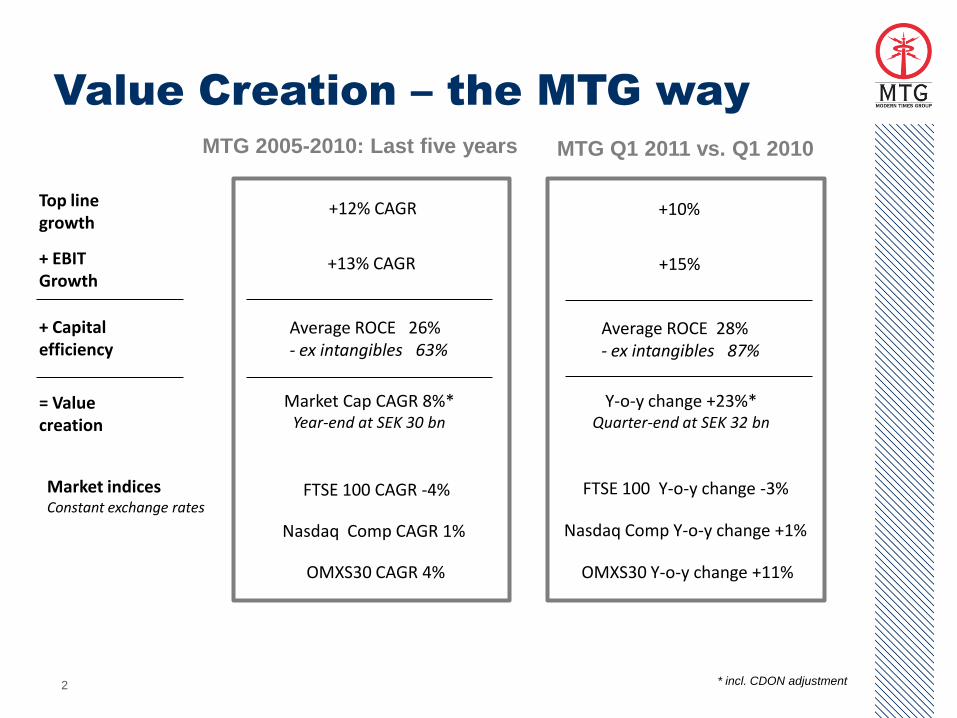
Value Creation – the MTG way
Top line growth
+ EBIT Growth
+ Capital efficiency
= Value creation
+12% CAGR
+13% CAGR
Average ROCE 26%- ex intangibles 63%
+10%
+15%
Average ROCE 28%- ex intangibles 87%
MTG Q1 2011 vs. Q1 2010MTG 2005-2010: Last five years
Market indicesConstant exchange rates
FTSE 100 CAGR -4% FTSE 100 Y-o-y change -3%
Market Cap CAGR 8%*Year-end at SEK 30 bn
Y-o-y change +23%*Quarter-end at SEK 32 bn
Nasdaq Comp CAGR 1% Nasdaq Comp Y-o-y change +1%
OMXS30 CAGR 4% OMXS30 Y-o-y change +11%
* incl. CDON adjustment

3
The Power of MTG
• Power of Centralisation
• Power of Cross-promotion
• Power of Integrated Broadcasting

44
Power of Centralisation
Example: Minipay CEE
19 channels, 28 countries 160 versions
80 employees in playout, scheduling, programming etc.
20 employees in local sales forces

5
Power of Cross-promotion
Example: Scandinavia
In 2010 MTG’s Scandinavian Pay-TV and Viaplay businesses
received cross-promotion worth more than SEK 50 million
Free-TV & Radio Pay-TV & Play TV

6
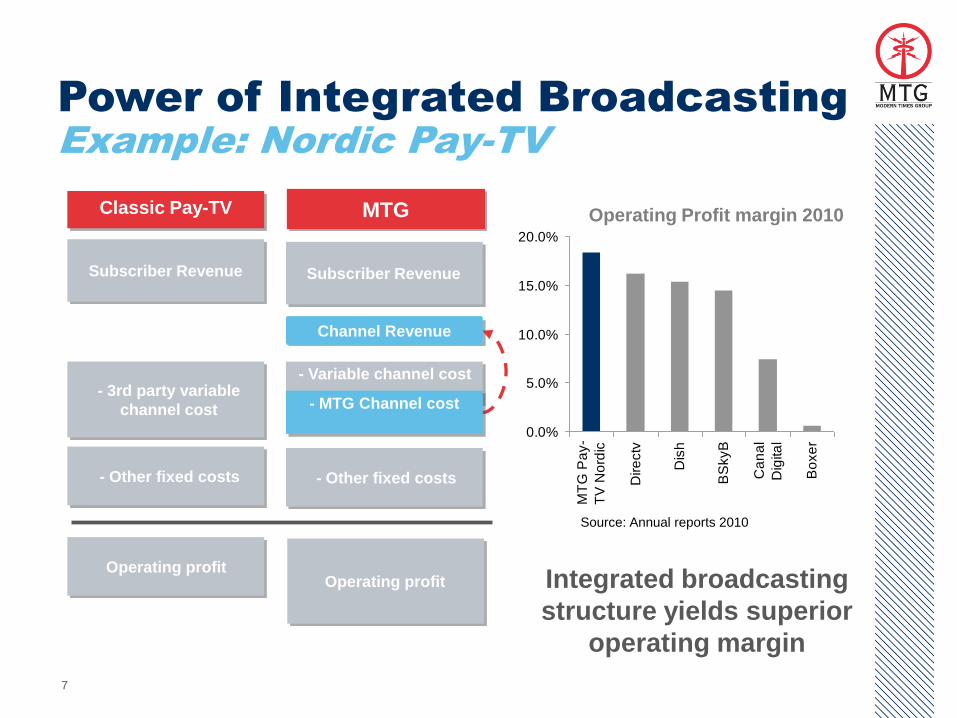
Power of Integrated Broadcasting
Example: Nordic Pay-TV
7
Power of Integrated Broadcasting
Example: Nordic Pay-TV
0.0%
5.0%
10.0%
15.0%
20.0%
MT
G P
ay-
TV
No
rdic
Dire
ctv
Dis
h
BS
kyB
Ca
na
l
Dig
ita
l
Bo
xe
r
Integrated broadcasting
structure yields superior
operating margin
Classic Pay-TV
Subscriber Revenue Subscriber Revenue
Channel Revenue
- 3rd party variable
channel cost
- Variable channel cost
- MTG Channel cost
- Other fixed costs - Other fixed costs
Operating profitOperating profit
Operating Profit margin 2010MTG
Source: Annual reports 2010

8
0.0%
2.5%
5.0%
7.5%
10.0%
20
01
20
02
20
03
20
04
20
05
20
06
20
07
20
08
20
09
20
10
% of revenues
Strict focus on Working Capital
management
Working capital development • Strong improvements in pre-paid revenues
and improved payment terms from content
providers
• Free TV ties up most cash, Pay TV balanced
through subscriber payments
• Inventory (incl programming) up 19% per
year last 5 years
• Working Capital as % of revenues increased
during 2010 mainly following pre-payment of
exlusive rights for Premier League in
Sweden as well as the seasonally low
balance at the beginning of the year
Sales and Working capital is excluding CDON Group

9
Continued high cash conversion
0.00
5.00
10.00
15.00
20.00
25.00
30.00
35.00
40.00
45.00
2006 2007 2008 2009 2010
Net cash flow per share Dividend per share
SE
K m
illio
n
Note: 2006-2010 adjusted for CDON Group
SE
K
Extraordinary dividend per share CDON Spin-off
Share buy-back (value per total no of shares)
0
200
400
600
800
1 000
1 200
1 400
1 600
1 800
2 000
2006 2007 2008 2009 2010
0%
10%
20%
30%
40%
50%
60%
70%
80%
90%
100%
Operating cash flow % of EBITDA converted

10
• SEK 5.1 bn cash from operations generated in
the last 3 years
• Investments in growth
• SEK 4.9 bn of net acquisitions
• SEK 0.6 bn in new start-ups and other
loss-making businesses
• SEK 0.5 bn in Capex (1.2% of revenue)
• Return to shareholders
• SEK 1.7 bn in dividend during last 3 years
• Share buy-back SEK 0.3 bn
• Added value delivered through distribution
of CDON Group (SEK 2.0 bn)
Cash allocation

11
Capital structure - Leverage
• Leverage level decreased during last 12 months due to both lower net debt and higher EBITDA
• Revolving credit facility of SEK 6.5 bn maturity in 2015
• SEK 4.1 bn unutilized at Q1 2011
• Strong financial position in the mid range of peers
• Depending on target and de-levering profile, comfortable with significantly higher leverage temporarily if needed
maintained fire power for
future growth
0.0
0.2
0.4
0.6
0.8
1.0
1.2
1.4
1.6
Q4
20
08
Q1
20
09
Q2
20
09
Q3
20
09
Q4
20
09
Q1
20
10
Q2
20
10
Q3
20
10
Q4
20
10
Q1
20
11
ND/EBITDA
Leverage development
Source: Broker research and MTG
Company ND / EBITDA
M6 -1.1
TF1 -0.0
Telenico 0.1
ITV 0.4
Antena 3 0.6
MTG 0.8
Mediaset 1.6
SES 2.9
Eutelsat 2.8
Prosieben 3.3
Market mean 1.1

12
• Unique operational set-up to continue to benefit performance
• Highly cash generative operations
• Continued low CAPEX of <2%
• Expected CTC cash dividend of USD 130 million during 2011, where MTG
is to receive 38%
• Commitment to continue to invest in future growth
• Re-investment in current businesses
• Expansion to new territories
• Exploring consolidation opportunities
• Commitment to deliver ordinary shareholder returns
• Ambition to increasing dividends over long-term
• Buy back mandate in place for up to 10% of shares
What next?

13