investing for higher after-tax returns · investing for higher after-tax returns: lessons for...
TRANSCRIPT
TWEEDY,BROWNECOMPANY LLCInvestment AdvisersEstablished in 1920
Managing Directors
Christopher H. Browne
William H. Browne
John D. Spears
Thomas H. Shrager
Robert Q. Wyckoff, Jr.
Investing for HigherAfter-Tax Returns:
Lessons for Tax-Paying Investorsfrom Warren Buffett,
Index Funds,the Best-Performing Stocks
over an 18-year Period,and Our Own Experience

Past performance is not a guarantee of future investment results. Investment return and principalvalue of an investment will fluctuate so that an investor’s shares, when redeemed, may be worthmore or less than original cost. Mutual Fund investors should refer to the accompanying prospectusfor description of risk factors associated with investments in securities held by both Funds.Additionally, investing in foreign securities involves economic and political considerations nottypically found in U.S. markets, including currency fluctuations, political uncertainty anddifferences in financial standards.
Tweedy, Browne Global Value Fund and Tweedy, Browne American Value Fund are distributed byTweedy, Browne Company LLC, a member of the NASD.

c
TABLE OF CONTENTSPage
Introduction ...................................................................................... 1
Pre-tax and After-tax Investment Return Arithmetic:How delaying taxes as long as possible may dramatically increaseyour wealth at any given pre-tax rate of return ....................................... 5
Why Do Professional Money Managers And Investment AnalystsEngage in So Much Buying And Selling? ................................................ 11
Quantitative and Qualitative Examination of three of Warren Buffett’slong-term Winners:
GEICO, The Washington Post Company and The Coca Cola Companyand two apparent Losers (at least so far):
World Book, Inc. and Berkshire Hathaway’s Shoe Group.......................... 12
Connoisseurs of Competitive Advantage:Mimicking the Master: Buffett 101........................................................ 22
Characteristics of the Best and Worst Performing Stocksin the S&P 500 Index over an 18-Year Period ......................................... 26
Earnings Per Share Growth over the 18-Year,December 31, 1980 - December 31, 1998 Periodfor Companies that were in the S&P 500 as of December 31, 1980 ............... 30
Perfect Together: High Returns from Stocksthat Combine Value and Growth; Buy Cheap and Keep ............................. 31
The Intrinsic Value of a Growing Business:How Warren Buffett Values Businesses.................................................. 31
When to Sell: A Framework for Tax-Paying Investors;Thinking and Acting Like an Owner of a Business.................................... 37
Predicting the Future of Businesses ......................................................... 39
Diversification and the Mathematical Magic of Skewness .............................. 43
Just in case........................................................................................ 47
An example of skewness and unplanned, accidental concentration .................. 48
Our Advice to You............................................................................... 48

d
PageAPPENDIX A After-Tax Return on Stocks assuming 20% and 15%
Yearly Returns and Various Turnover Rates ............... 50
APPENDIX B State Income Tax Rates as of 12/31/98 .......................... 62
APPENDIX C 17 Standard Earnings Outlook/Value QuestionsChecklist ............................................................ 63
APPENDIX D Buffett 101: Questions/Checklist Concerning Assessing a Company’s Growth Prospects, Competitive Position and Economics..................................................... 65

INVESTING FOR HIGHER AFTER-TAX RETURNS: Lessons for Tax-paying Investors from Warren Buffett, Index Funds, the Best Performing Stocks over an 18-year Period, and Our Own Experience
INTRODUCTION
This report will describe what we have learned about investing for higher after-tax returns, and ourinvestment strategy for tax-paying investors. The Managing Directors of Tweedy, Browne Company LLChave become increasingly aware of taxes over the last ten years as their own wealth and clients’wealth has increased. We presently have nearly our entire liquid net worths, approximately $400million of our own money that has been accumulated over the years, invested in portfolios that arejointly owned with clients, including Tweedy, Browne Global Value Fund and Tweedy, BrowneAmerican Value Fund, and in separate portfolios whose equity holdings are similar to the holdingsof clients’ portfolios.
Nearly all of our own money, and probably more than 50% of the money that we manage forclients, is subject to income taxes and capital gains taxes. Capital gains taxes only occur when astock is sold at a gain above cost, and, hence, are somewhat unique in that they are elective: Youcan decide if and when you want to sell a stock at a gain, and thereby incur capital gains taxes.Alternatively, you can decide to not sell a stock at a gain and, therefore, not pay capital gains taxes.It has been said that “the only sure thing is death and taxes”, but the second part of this statementdoes not hold true for capital gains taxes.
Our thinking and exploration of the impact and importance of taxes on investment returns has beenaided greatly by Warren Buffett, one of the world’s most successful investors, and by John Bogle,former Senior Chairman and Founder of The Vanguard Group of mutual funds. Warren Buffett hasat times invested nearly 40% of his net worth in one stock, and owns operating businesses throughhis holding company, Berkshire Hathaway. Warren Buffett is the epitome of an active investor.John Bogle, on the other hand, advocates passive, do-nothing investing in index funds, which do nothave portfolio managers and investment analysts engaged in analyzing individual stocks, andattempting to beat the market. Index funds that mimic the investment performance of the Standard & Poor’s 500 Index simply buy each and every one of the 500 stocks that are in the S&P 500, and then continue to hold them. Mr. Buffett and Mr. Bogle seem bi-polar in investmentapproach, but they are completely joined in understanding and advocating the huge advantage ofavoidance and deferral of taxes over very long periods of time. Mr. Bogle calls it, “Buy right andhold tight.”
At Tweedy, Browne, we consider index funds to be our biggest, toughest long-term competitor. The S&P 500 outperformed 91% of all surviving equity mutual funds over the
1

December 31, 1981 - December 31, 1997 16-year period.* Index funds that mimic the S&P 500probably beat close to 91% of equity mutual funds over this period. Anyone in the investmentmanagement business who does not respect the challenge of low-fee index funds that rarely sellstocks and, therefore, rarely realize capital gains, is, as psychologists would say, in denial.
Fortunately, the investment approach that our firm has practiced for more than 25 years has servedus and our clients well. We have to admit that we might be a little bit tempted to at least considerinvesting some of our own money and clients’ money in an index fund if the valuation wasn’t sohigh: The S&P 500 is now about 35x reported earnings, with no downward adjustment of thesereported earnings figures for “one-time, non-recurring writedowns and special charges” that, infact, seem to be very recurring expenses that would reduce reported earnings if the companies’accounting practices were more conservative. The S&P 500’s earnings are also not adjusteddownward for the hidden expense of large stock options. In addition, the S&P 500 is priced at over6x tangible book value. Both the price-to-earnings ratio, 35x, and the price-to-book value ratio, 6x,are all-time high valuations. In 1980, the S&P 500 was selling at 9.2x earnings. It seems veryunlikely to us that future gains for the S&P 500 from a starting point of 35x earnings in 1999 willcome at all close to generating the 16.94% per year gains that occurred over the 18-year periodfrom December 31, 1980 through December 31, 1998 from a starting point in 1980 of 9.2x earnings.
At Tweedy, Browne, we are well aware that our investment management services are not the onlyshow in town, and that we, the Managing Directors, and clients of the firm always have thealternative of investing in a very low-fee index fund that avoids taxes - because stocks are seldomsold. We do not know for sure if the investment approach that we practice will add value aboveindex returns in the future, as it has in the past, but we are hopeful. We only really have controlover investment strategy and its implementation, and the future returns will be substantiallydetermined by what other human beings will pay in the future for stocks that we own. We do knowfor sure that we can invest our own money and clients’ money in stocks that are significantlycheaper in relation to earnings, book value and estimated intrinsic value than the S&P 500. Thisinvestment approach, the value approach of getting more for your money, appeals to our common-sense, and has worked well in the past.
At Tweedy, Browne, we continue to seek to earn both pre-tax and after-tax returns in excess ofindex fund returns for our own money and our clients’ money. This study and report are part ofthat effort, and represent our first extensive examination of investing for higher after-tax returns, atopic that we believe is extremely important for tax-paying investors.
2
* This study, which was completed in 2000, used readily available historical data from CDA Investnet’sCadence Performance Software Group, which is now a division of Weisenberger Group, a provider ofinformation concerning mutual funds.
The S&P 500 Stock Index is an unmanaged index which assumes the reinvestment of dividends and whichis generally considered representative of U.S. large capitalization stocks.

In the first section of this report entitled, Pre-Tax and After-Tax Investment Return Arithmetic:How Delaying Taxes As Long As Possible May Dramatically Increase Your Wealth at Any GivenPre-Tax Rate of Return, we will describe the impact of taxes on investment returns.
Then, in the next two sections of this report, we will look backward in time to study thecharacteristics of stocks that have provided high investment rates of return over very long holdingperiods. At Tweedy, Browne, we are able to describe the characteristics of a fairly small sample ofstocks within our own portfolios that have provided high rates of pre-tax and after-tax return overlong holding periods in the past. This report describes our first systematic examination of successfullong-run stocks as a category.
The goal of studying highly successful long-term investments of the past is to develop a frameworkfor trying to identify stocks that, hopefully, will have similar characteristics when we buy them, andafter we have bought them. As Warren Buffett has said, “The investor of today does not profit fromthe growth of the past.” As Mr. Buffett has also observed, if this were not the case, the averagelibrarian would be rich from the stock market. We also want to try to avoid stocks that will have thefuture characteristics of the worst performing stocks of the past. It is always easier to find (oravoid) something if you know what to look for.
First, we will attempt to learn about long-run value stocks from the Master: We will examine five ofWarren Buffett’s long-term holdings: Three winners: GEICO, The Washington Post Company, andThe Coca-Cola Company, and two apparent losers (at least so far), World Book, Inc. and BerkshireHathaway’s Shoe Group. These five case studies will focus on what we believe is a key ingredient insuccessful long-run investing: the qualitative assessment of a company’s future competitive positionand economics. Warren Buffett and his partner, Charles Munger, are brilliant analysts ofcompetitive strengths and weaknesses in businesses, and highly discerning in their selection ofbusinesses. We will try to think along with them, and learn. They want huge, sustainablecompetitive advantages: advantages that will last for decades, if not “forever”.
Then, in the next section, Characteristics of the Best and Worst Performing Stocks in the S&P 500over an 18 Year Period, we will examine the best and worst performing stocks in the S&P 500 overan 18-year holding period beginning on December 31, 1980 and ending on December 31, 1998.*
Warren Buffett’s method of computing the intrinsic value of a business is described in the section,The Intrinsic Value of a Growing Business: How Warren Buffett Values Businesses.
3
* This study, which was completed in 1999, used readily available backtesting data from the Zacks andCompustat databases. The availability of historical financial data in a machine readable form determinedthe length of the study.

We will describe Tweedy, Browne’s framework for selling stocks on behalf of our tax- paying clientsin When to Sell: A Framework for Tax-Paying Investors; Thinking and Acting Like an Owner of aBusiness.
In the section entitled, Predicting the Future of Businesses, this report will also discuss the generaldifficulty of predicting businesses’ future financial results, and how we handle this inherentproblem in managing portfolios at Tweedy, Browne. Our empirical research indicates that futurecorporate financial success cannot be predicted solely by simple extrapolation of past financialtrends. An educated best-guess about the future financial statements and value of a business hingesupon a qualitative assessment of the sustainability of a particular company’s competitive advantage,standing, or “franchise”. In the second section of the report, we will describe how even WarrenBuffett has appeared to have misjudged the future prospects of two companies that he has acquiredin recent years: World Book, Inc. and Berkshire Hathaway’s Shoe Group. As Samuel Goldwynsaid, “Forecasts are difficult to make, especially about the future”.
The next to last section of this report, Diversification and the Mathematical Magic of Skewness,will describe the return-enhancing and risk-reducing advantages of diversification. We will alsodescribe the wonderful mathematics of “skewness” in a diversified portfolio, which effortlesslyserves to “cut your losses, and let your profits run”.
In the final section of this report, Our Advice to You, we will provide some advice, which we plan tofollow ourselves in managing money at Tweedy, Browne. We hope this report will be useful to you.There can be a very large payoff from even seemingly small improvements in after-tax returnscompounded over a long period of time. If this report serves to provide some understanding andlong-run perspective, and aids you in your pursuit of higher after-tax returns, then we, at Tweedy,Browne, will have served you well.*
4
* During the time periods discussed in the article, Tweedy, Browne American Value Fund and Tweedy,Browne Global Value Fund held the following securities mentioned in the article: American Express,Freddie Mac, Wells Fargo, and Nestle. As of December 31, 1998, these securities represented 11.51% and7.69% of the net assets of Tweedy, Browne American Value Fund and Tweedy, Browne Global Value Fund,respectively, and may not be representative of the Funds’ current or future holdings.

PRE-TAX AND AFTER-TAX INVESTMENT RETURN ARITHMETIC: How delaying taxes as long as possible may dramatically increase your wealth at any given pre-tax rate of return
“Inactivity strikes us as intelligent behavior” - Warren Buffett
In the 1993 Berkshire Hathaway annual report, Warren Buffett, the world’s most successfulinvestor, provided this example to illustrate the enormous impact of taxes on investment results:
“Through my favorite comic strip, Li’l Abner, I got the chance during my youth to see thebenefits of delayed taxes, though I missed the lesson at the time. Making his readers feelsuperior, Li’l Abner bungled happily, but moronically, through life in Dogpatch. At one pointhe became infatuated with a New York temptress, Appassionatta van Climax, but despairedof marrying her because he had only a single silver dollar and she was interested solely inmillionaires. Dejected, Abner took his problem to Old Man Mose, the font of all knowledge inDogpatch. Said the sage: “Double your money 20 times and Appassionatta will be yours(1,2,4,8 ....1,048,576).”
My last memory of the strip is Abner entering a roadhouse, dropping his dollar into a slotmachine, and hitting a jackpot that spilled money all over the floor. Meticulously followingMose’s advice, Abner picked up two dollars and went off to find his next double. Whereupon Idumped Abner and began reading Ben Graham.
Mose clearly was overrated as a guru: Besides failing to anticipate Abner’s slavish obedienceto instructions, he also forgot about taxes. Had Abner been subject, say, to the 35% federaltax rate that Berkshire pays, and had he managed one double annually, he would after 20years only have accumulated $22,370. Indeed, had he kept on both getting his annual doublesand paying a 35% tax on each, he would have needed 7 1/2 more years to reach the $1 millionrequired to win Appassionatta.
But what if Abner had instead put his dollar in a single investment and held it until it doubledthe same 27 1/2 times? In that case, he would have realized about $200 million pre-tax or, afterpaying a $70 million tax in the final year, about $130 million after-tax. For thatAppassionatta would have crawled to Dogpatch. Of course, with 27 1/2 years having passed,how Appassionatta would have looked to a fellow sitting on $130 million is another question..
What this little tale tells us is that tax-paying investors will realize a far, far greater sum froma single investment that compounds internally at a given rate than from a succession ofinvestments compounding at the same rate.”
5

We thought that it would be instructive to examine the pre-tax and after-tax investment arithmeticof two investment return assumptions that are more modest and, hopefully, more attainable thanLi’l Abner’s doubling of money each year: 15% and 20% per year. These returns represent ourbest-guess expectation, based on past investment results, of a range of future equity investmentresults for successful investment management. The 15% and 20% annual investment returns arecomputed over periods ranging from one year to 20 years, with the following six assumptions about“turnover”, the percentage of the portfolio that is sold and then re-invested each year:
1. Zero turnover No stocks are sold each year. Consequently, no gains are realized. There are notaxes paid, and the pre-tax return, therefore, is the same as the after-tax return. Zero turnoverassumes that all of the stocks in a portfolio are held, in effect, “forever”. Individuals who havesubstantially all of their wealth invested in one business have zero turnover if they continue toown their business throughout their lives. Warren Buffett, for example, has substantially all ofhis net worth invested in the shares of Berkshire Hathaway, whose value has compounded at a32.8% rate over the last 19 years ended December 31, 1998. Because Warren Buffett has not, tothe best of our knowledge, sold a share of Berkshire Hathaway, and therefore has not paid anytaxes on realized gains, his after-tax return has been the same as his pre-tax return from owningshares of Berkshire. Many of the wealthiest families in America became wealthy by owning abusiness that increased in value over the years: The compounded returns from owning thebusiness, and the amount of money that was invested and working on behalf of the owners, werenot diminished by tax payments—because no shares were sold and, consequently, no taxablegains were realized.
2. 3% Turnover For each $1,000,000 of portfolio value, 3%, or $30,000 worth of stocks, are soldeach year, taxes are paid on the gain, and the after-tax proceeds are reinvested in the portfolio.A turnover of 3% equates to holding stocks for an average of 33 1/3 years. Very few, if any,portfolios that are managed by professional investment managers have turnover that is this low.In fact, according to Morningstar, professional managers of equity mutual funds, on average,sell $850,000 worth of stocks each year out of each $1,000,000 of portfolio assets, which is an85% turnover ratio. Index mutual funds that mechanically invest in all 500 stocks that are in theS&P 500, and then continue to hold the stocks in the Index, have turnover from mergers,acquisitions and deletions from the S&P 500 that has averaged only about 3%.
3. 10% Turnover For each $1,000,000 of portfolio value, 10%, or $100,000 worth of stocks, aresold each year, taxes are paid on the gain, and the after-tax proceeds are reinvested in theportfolio. Annual turnover of 10% equates to holding stocks for an average of 10 years.
4. 30% Turnover For each $1,000,000 of portfolio value, 30%, or $300,000 worth of stocks, aresold each year, taxes are paid on the gain, and the after-tax proceeds are reinvested in theportfolio. A 30% annual turnover equates to holding stocks for an average of 3 1/3 years.
6

5. 85% Turnover For each $1,000,000 of portfolio value, 85%, or $850,000 worth of stocks, aresold each year, taxes are paid on the gain, and the after-tax proceeds are reinvested in theportfolio. An 85% turnover equates to holding stocks for an average of one year and twomonths. According to Morningstar, the average turnover of professionally managed equitymutual funds is 85%.
6. 100% Turnover For each $1,000,000 of portfolio value, 100%, or $1,000,000 of stocks are soldeach year, taxes are paid on the gain, and the after-tax proceeds are reinvested in the portfolio.Stocks are held, on average, for one year when the turnover is 100%.
In the various 15% and 20% investment return and turnover scenarios, we assume that 100% ofthe realized gain is taxed at a combined federal and state long-term gains rate of 27%. Thecombined federal and state long-term capital gains tax rate, of course, varies from individual toindividual, and depends both on an individual’s tax bracket and state of residence. The highestfederal tax bracket for long-term capital gains is 20%.
In Appendix B, we have listed the top bracket income tax rate of each state. In most, but not all,states that have income taxes, realized long-term capital gains are taxed at the income tax rate. New Jersey and New York residents in the top tax bracket pay long-term capital gains taxes atabout a 27% rate: a 20% long-term capital gains federal tax rate plus a state tax rate of about 7%.For a New York City resident, the top bracket combined federal, state and city tax rate is 33% onlong-term capital gains. California residents in the top tax bracket pay long-term capital gains taxesat about a 29% rate: 20% federal plus 9% state.
In the 100% turnover scenarios, the 27% combined long-term capital gains tax rate assumption thatwe use is probably too low. To qualify for long-term capital gains, an investment must be held forone year plus one day. Portfolios with, say, 85% to 100% turnover, are likely to have short-termcapital gains from investments that have been held for less than one year and a day. The top federaltax rate on short-term capital gains is the top ordinary income tax rate, 39.6%. In addition, short-term capital gains are taxed at the state income tax rate. For California residents, the top taxbracket for short-term capital gains is 39.6% federal plus 9% state, or about a 49% total tax rate.(The 15% return and 20% investment return scenarios do not assume any return from dividends orinterest income, which are taxed at ordinary income tax rates.)
The 15% return and 20% return investment scenarios also do not assume that 100% of theportfolio is sold at the end of the 20-year period. Under the current tax rules, if your estate, yourspouse, or charity inherit stocks that you own, capital gains taxes are eliminated on the unrealizedgains. When we die, our stocks, at least, will be reborn with a new tax cost basis, the market valueat date of death.
7

The detailed year-by-year figures for the various 15% and 20% return/turnover scenarios areshown in Appendix A. Tables 1 and 2 below are summaries of the various scenarios:
Table 1:$1,000,000 Initial Investment Compounded at a 15% Pre-Tax Annual Rate of Return over a 20-Year Period, assuming a 27% Tax Rate on all Realized Gains
Value of $1,000,000
Pre-Tax Initial Investment After-Tax
Rate of Return Annual Turnover at the end of 20 Years Rate of Return
15% - 0 - $16,366,500 15.0%
15 3% 14,780,800 14.4
15 10 12,386,300 13.4
15 30 9,694,000 12.0
15 85 8,136,600 11.1
15 100 7,990,800 10.95
Table 2:$1,000,000 Initial Investment Compounded at a 20% Pre-Tax Annual Rate of Return over a 20-Year Period, assuming a 27% Tax Rate on all Realized Gains
Value of $1,000,000
Pre-Tax Initial Investment After-Tax
Rate of Return Annual Turnover at the end of 20 Years Rate of Return
20% - 0 - $38,337,600 20.0%
20 3% 34,211,200 19.3
20 10 27,808,500 18.1
20 30 20,250,200 16.2
20 85 15,695,500 14.8
20 100 15,264,800 14.6
As Tables 1 and 2 indicate, turnover; i.e., the sale of securities, with the consequent realization oftaxable long-term capital gains, can have an enormous impact on after-tax wealth for a high tax-bracket individual at 15% and 20% assumed pre-tax rates of return. As turnover increases,realized taxable gains increase, which means that an individual’s taxes increase, and therefore theamount of money that is invested and working on behalf of the tax-paying investor in the form ofdeferred taxes declines. For any given rate of pre-tax return, the end result of a higher turnoverratio is lower after-tax returns, which means less wealth at the end of any given period of time.
Table 1 and Table 2 also illustrate the extent to which high-turnover investments have tooutperform low-turnover investments on a pre-tax basis in order to equal the after-tax returns of a
8

low-turnover investment. For example, to equal the 15% pre-tax and 14.4% after-tax return, andthe $14,780,000 ending wealth accumulated by the portfolio with 3% turnover, an investor with100% annual turnover would have to earn a pre-tax return of close to 20%, which is nearly 33%more pre-tax return than the 15% return of the low turnover portfolio.
Warren Buffett and his partner, Charles Munger, have long understood the arithmetic of turnoverand taxes, and the compounding effect of the deferral of taxes on after-tax returns and wealth.
Charles Munger has said “Understanding both the power of compound return and thedifficulty of getting it is the heart and soul of understanding a lot of things.” Mr. Munger alsoenjoys quoting Benjamin Franklin on the subject of compounding investment returns: “...’tisthe stone that will turn all your lead into gold....Remember that money is of a prolificgenerating nature. Money can beget money, and its offspring can beget more.”
—————— • ——————
The Managing Directors of Tweedy, Browne have become increasingly aware of the importance oftaxes over the years as their own wealth and their clients’ wealth has increased. We have observedthat very large contributions to our own wealth, and our tax-paying and tax-free clients’ wealth,have come from stocks that had two characteristics; i.e., they were ( 1) bought at a significantdiscount to the underlying value of the company’s business, and (2) the underlying value of theparticular company’s business increased at an above-average rate during an ownership/holdingperiod of many years. These successful stocks combined the investment concepts of “value” and“growth”.
An increasing proportion of portfolios managed by Tweedy, Browne has been invested in stocks ofthis type, which have provided long-running, multi-year, double dips of investment returnsgenerated from both a narrowing of the discount from underlying value as the stock price rosetoward underlying value, and an above-average compounded increase in the underlying value of thebusiness itself. The increases in underlying business value were driven by increases in thecompanies’ earnings. The narrowing of the discount from underlying value was driven by anincrease in the valuation of earnings, as the price to earnings ratio rose during the multi-yearperiods that we have owned these stocks.
As larger proportions of portfolios managed by Tweedy, Browne have been invested in “double dip”stocks whose underlying values have grown at above-average rates, our target prices for sellingthese stocks have increased in tandem, and we have had less occasion to sell investments and realizegains. Consequently, the average turnover ratio of portfolios under our management has declined inrecent years, and untaxed, unrealized gains have increased.
9

For our tax-paying clients who have invested with us through Tweedy, Browne Global Value Fund,Tweedy, Browne American Value Fund, or a separately managed portfolio, the bite from taxpayments has been relatively low in comparison to most mutual funds, according to data fromMorningstar. Over the five years ended March 31, 1999, the average portfolio turnover ratios forTweedy, Browne Global Value Fund and Tweedy, Browne American Value Fund were 18.4% and10.2%, respectively, versus an 85% turnover ratio for the average equity mutual fund.*
The very high average portfolio turnover ratios of professional mutual fund managers lead us tobelieve that very few professional investment managers carefully consider the effect of taxes oninvestment returns for tax-paying individuals. How else could equity mutual fund portfolioturnover average 85%, unless portfolio managers were oblivious to tax effects in managing theirportfolios? An 85% turnover ratio, which means that the average stock is only owned for a periodof one year and two months, suggests that the typical money manager is not oriented toward owningbusinesses over any multi-year length of time through the stock market. Imagine owning a differentbusiness every one year and two months over your adult life. Today’s average money manager istrading in and out of stocks, not owning businesses through long-term ownership of stocks.
In addition to tax costs, high turnover also generates costs—both from commissions on purchaseand sale transactions and from “market impact”, which is the effect that orders to buy or sellshares can have on stock prices. A recent study by Barra Inc., an investment consulting firm,estimated that the average mutual fund with $500 million of assets that specializes in small or mid-capitalization stocks will incur annual costs of three to five percentage points of net asset valuewhen turnover is 80% to 100%.
10
* COMMON SENSE ON MUTUAL FUNDS, John C. Bogle

Why do Professional Money Managers and Investment Analysts Engage in So Much Buying and Selling?
Investment managers and analysts tend to be energetic, intelligent, well-educated, highly paid andself-confident individuals. Great traits in most lines of work! However, it appears that it is verydifficult for people with these traits to do very little, to not make lots of buy and sell decisions, eventhough a detached view of the empirical data concerning both pre-tax and after-tax investmentperformance, and the effect of trading and tax costs, may suggest that the best course, the mostrational decision, would be to sit tight and do nothing.
Investment managers (including ourselves) wake up each day believing that their work will addvalue. However, over the 16-year period between December 31, 1981 and December 31, 1997, 91%of all surviving equity mutual funds had pre-tax investment returns below the pre-tax investmentreturn of the S&P 500. Only 9% of the surviving equity mutual funds were able to add any valueabove the S&P 500’s returns. Given the average equity mutual fund’s 85% turnover ratio versus3% turnover for index funds that simply mimic the S&P 500, an even larger percentage of equitymutual funds lagged the S&P 500 on an after-tax basis over the 16-year, December 31, 1981 toDecember 31, 1997 period. The high tax and transaction cost of turnover accounted for some of thelong-term underperformance.
Warren Buffett’s partner, Charles Munger, has described the irrational and often lemming-likehuman and cultural tendencies of people in business organizations as the “InstitutionalImperative”. Even though it may not make sense at certain times for bank loan officers to write newloans, or for a chief executive officer to acquire another company, or for investment managers tobuy and sell securities with such frequency, the institutional imperative has ingrained in humanbeings a tendency to be busy and active, to “take charge” and be “in control”. You can observesimilar behavior on the part of drivers on the turnpike who weave in and out of lanes. In theinvestment management field, behavioral psychologists have called this ingrained tendency to weavein and out of stocks the “illusion of control”. Why would investment management firms want to payhigh salaries to people who do not appear to be doing very much, and who do not appear to havemuch control over what they are doing? Investment management firms, in general, must believe thatlots of activity is useful because they are willing to pay for it, and high compensation ensures thatlots of activity will be provided. Everyone involved must believe that it all makes sense. The illusionof control is shared. The words of Blaise Pascal come to mind: “All men’s miseries come from theirinability to sit quiet and alone.”
Of course, the only thing that any investor really controls is strategy and its implementation, notwhat every investor really wants — future investment returns. Your future investment returns arelargely determined by what other human beings, who, in most cases, will be unknown to you, arewilling to pay in the future for stocks that you own. No investor is in control of future investment
11

returns. When you own a stock, its price only matters when you plan to sell. Until that time, thestock’s price movements are really just entertainment.
Another reason why investment managers have such high turnover is that most investmentmanagement clients, both those that pay taxes and those whose portfolios are tax-free, have gaugedtheir investment managers solely on pre-tax, not after-tax, investment returns. What is measuredwill be managed. We do not recall ever reading an article about an acclaimed hedge fund or mutualfund manager that described the taxable short-term gain and long-term gain portion of themanager’s historical investment returns.
—————— • ——————
It has been estimated that approximately 30% to 40% of the money invested in publicly tradedstocks is tax-free money, and 60% to 70% of the money is owned by tax-paying individuals andcorporations. While it is appropriate to ignore taxes in managing tax-free portfolios, the powerfulnumbers in Tables 1 and 2 tell us that it makes little sense to ignore turnover and taxes in managingportfolios on behalf of taxpayers - especially in managing money on behalf of high tax-bracketindividuals who “share” up to 50% of any short-term realized gain, and up to 33% of any long-termrealized gain, with various tax authorities. In seeking to build wealth, taxes are of majorimportance to investors.
Quantitative and Qualitative Examination of three of Warren Buffett’s long-term Winners:GEICO, The Washington Post Company and The Coca Cola Company and two apparent Losers(at least so far): World Book, Inc. and Berkshire Hathaway’s Shoe Group
GEICO
In 1976, Warren Buffett’s holding company, Berkshire Hathaway, accumulated 1,294,308 shares ofGEICO, an automobile insurance company, at an average price of $3.18 per share. At that time,GEICO was a financially distressed company which had just hired as its new President, JohnByrne, an actuary and former executive from Travelers Insurance Company. Warren Buffettbelieved that GEICO’s business of providing automobile insurance sold directly to the customer,without incurring the cost of an insurance agent’s or broker’s commission, provided GEICO with arelatively unique and sustainable competitive advantage in the form of lower costs per insurancepolicy. With a lower cost per insurance policy, because there were no sales commissions, GEICOcould afford to offer automobile insurance at a lower price than competitors could afford to charge,and still earn a healthy profit.
A competitor, such as Travelers Insurance Company, would be reluctant to adopt GEICO’s lower-cost, direct-to-the-customer, no-agent method of operation for fear of having its independent sales
12

agents switch to selling Aetna’s auto policies instead of Travelers’. Why would a Travelers agentwant to sell a Travelers auto insurance policy if Travelers was offering the same auto insurancecoverage direct to the agent’s customers at a lower price, and thereby cutting the agent out ofcommissions on the business? An understanding of the great reluctance by competitors to competewith, and cannibalize, their own existing business, we believe, was a key qualitative insight aboutthe sustainability of GEICO’s earning power, and about the company’s potential to increase salesand earnings in the future.
Over time, it appeared likely that GEICO’s lower-priced auto policies would attract more and morecustomers away from the higher-priced policies that higher-cost insurance companies sold throughcommission-earning agents and brokers. GEICO simply offered its existing and prospectivecustomers a better deal, one that competitors could not afford to offer by matching or droppingbelow the price that GEICO charged for auto insurance coverage.
In addition, it seemed difficult for a brand new competitor, without an established business toprotect, to enter the direct-to-the-customer auto insurance business and compete with GEICO:First, GEICO, as the originator of the direct-to-the-customer method of providing auto insurance,had already attracted the kind of customers who valued a lower price for their auto insurance morethan they valued the human touch of dealing with an insurance agent. A new entrant would eitherhave to encourage satisfied customers to switch from GEICO to the new entrant by offering autoinsurance at an even lower price than GEICO’s, or locate new customers who had not alreadyswitched to GEICO from a higher-cost insurance company, such as Travelers. To attract newcustomers, who had not yet begun doing business with GEICO, a new entrant would probablydetermine that it would have to offer its auto insurance product at an even lower price thanGEICO’s. After all, why would a customer endure the hassle of filling out various new policyapplication forms unless the competing company’s auto insurance was less expensive? Would therebe enough profit per policy at the lower price to make competing with GEICO in the auto insurancebusiness a worthwhile venture? Would GEICO perhaps respond to the new entrant’s lower price bymatching those prices, or dropping them below the new entrant’s auto insurance prices, in order tokeep the new entrant from making any progress? Would GEICO be motivated to send a signal toany prospective new entrant that GEICO would not permit a new entrant to easily enter thebusiness?
Warren Buffett thought that it would be difficult for a new entrant to dent GEICO’s long-term, low-cost competitive advantage. In fact, very few insurance companies provide auto insurance direct tothe consumer. We believe that this is so, not because GEICO’s superior returns on equity and salesand earnings growth have gone unnoticed, but because the competitive economics are so tough thatprospective competitors have determined that they would not be able to make any money at it, andhave stayed away.
13

In 1976, when Warren Buffett was accumulating GEICO shares at an average price of $3.18 pershare, the company reported a loss of $1.51 per share. In 1975, GEICO had reported a loss of $7.13 per share, and common stockholders’ equity per share had declined from $8.13 at December 31, 1974 to $2.08 at December 31, 1975. Insurance companies with sales in excess ofthree times stockholders’ equity are generally considered to be financially “unsafe” and“overextended” by state insurance company regulators. GEICO’s insurance sales, $34.00 per sharein 1975, were running at 15x - 16x stockholders equity, and GEICO was teetering on bankruptcy.GEICO’s investment income from its investments was approximately $.98 per share. In many prioryears, GEICO’s insurance underwriting had been profitable, and the company had earned morethan its investment income. If GEICO could restore its prior insurance underwriting skills and atleast break even on underwriting, it would earn close to $.98 per share. If this happened, stock thatWarren Buffett had purchased at $3.18 per share would have been acquired at a bargain valuationof only about 3x earnings.
GEICO’s capital was shored up in 1976 with $76 million of new money added to the company’sstockholders’ equity from an issue of convertible preferred stock. Between 1976 and 1995, the lastyear of GEICO’s public-company existence, sales increased from $575 million to $2,787 million, and sales per share increased from $16.84 (adjusted for the dilutive effect of the convertiblepreferred stock) to $206.44 (before adjusting for the 5 for 1 stock split in 1992). The compoundedannual growth rate of sales was 9.2%, and sales per share increased at a 14.1% rate over the December 31, 1976 to December 31, 1995 19-year period. Net income increased from a loss in 1975to $17.40 per share in 1995 (before adjusting for the 5-for-1 stock split in 1992.).
In early 1996, all of GEICO’s publicly traded shares were acquired by Berkshire Hathaway in acash tender offer at a price of $350 per share (before adjusting for the 5-for-1 stock split in 1992).This price valued shares of GEICO at 20.1x earnings. From 1976, when Warren Buffett made hisinitial investment in GEICO, at $3.18 per share, to early 1996, when GEICO was acquired at $350per share, the compounded annual increase in the stock price was approximately 27.2%. GEICOprovided a double dip from: (1) rising per share value, as earnings per share increased from a lossof $7.13 per share in 1975 to a profit of $17.40 per share in 1995, while sales per share grew at a14.1% compounded annual rate; and (2) rising valuation, as the price of GEICO’s stock increasedfrom about 3x recovery earnings per share in 1976 to 20.1x earnings per share when GEICO wasacquired in 1996.
THE WASHINGTON POST COMPANY
By June of 1973, Warren Buffett had acquired shares of The Washington Post Company at anaverage price of $4.00 per share. The Washington Post Company is the publisher of The WashingtonPost newspaper, the dominant newspaper in Washington, D.C., and Newsweek magazine. In addition,The Washington Post Company owned three television studios and one radio station in 1973.
14

Warren Buffett believed that a newspaper business, located in a geographic area where there is noother competing newspaper, has a sustainable competitive advantage. Consider the competitiveeconomics: Readers of newspapers are largely creatures of habit who tend to become accustomed toa particular newspaper. A newspaper reader does not have to read two newspapers to learn abouttoday’s news: one paper is usually enough. Consider the difficulty of starting up a new newspaper tocompete with a newspaper in a one-newspaper town. How do you get enough people to switch from anewspaper that people habitually like to read to your brand new newspaper? Can you lure readersaway by offering your new newspaper at a price that is 5¢ less than the competition? Is 5¢ enough ofa savings to cause a typical reader to switch? You have to find a way to lure away enough readers inorder to generate sales and profits from advertisements. Why would anyone pay money to advertisein a newspaper that has no readers? No readers, no advertisements. Without advertising sales, yougenerally can’t make a profit in the newspaper business because the newsstand or subscription pricedoes not cover the cost of reporters, paper, printing, circulation, etc. In addition, what would bethe established newspaper’s competitive response? Might it lower its cover price or decrease its adprices to make it difficult for a new competitor to become established?
The competitive economics appear daunting for a new competitor to the established newspaper in aone-newspaper town. Consequently, the newspaper in a one-newspaper town has usually been avery profitable business that has been able to increase ad prices at rates above the inflation rate.For example, if you want to advertise in the classifieds that your old Chevy is for sale, you will haveto pay whatever price the newspaper charges in order to reach prospective Chevy buyers in yourarea, if there is only one newspaper. Will you really care much if the ad costs $25, not $15? If thead costs 1¢ per reader, would there be any cheaper way to advertise your Chevy to 2,500 readers?If the ad rate increases from $25 to $27, will you not advertise?
In 1973, when Warren Buffett was accumulating shares of The Washington Post Company at anaverage price of $4 per share, he estimated that the company’s businesses would be worth $21 pershare in a corporate acquisition transaction, based upon valuations of similar newspaper, magazine,television and radio businesses that had recently occurred in actual acquisition transactions. At aprice of $4 per share, The Washington Post Company stock was a clear-cut bargain, withconsiderable potential for higher valuation. In addition, Mr. Buffett saw the potential for earnings-driven value growth. Between 1972 and 1998, sales and sales per share compounded at 9.1% and11.8%, and earnings per share increased from $0.52 to $21.90, a 15.5% compounded annualgrowth rate. The valuation of The Washington Post Company’s shares increased from 7.7x 1972e.p.s. to 26.4x 1998 e.p.s., as the stock increased from $4 per share in 1973 to $578 per share onDecember 31, 1998. The double dip of rising, earnings-driven value, and rising valuation from ahigher price-to-earnings ratio generated the 22% compounded annual increase in the stock priceover the last 25 years.
15
THE COCA-COLA COMPANY
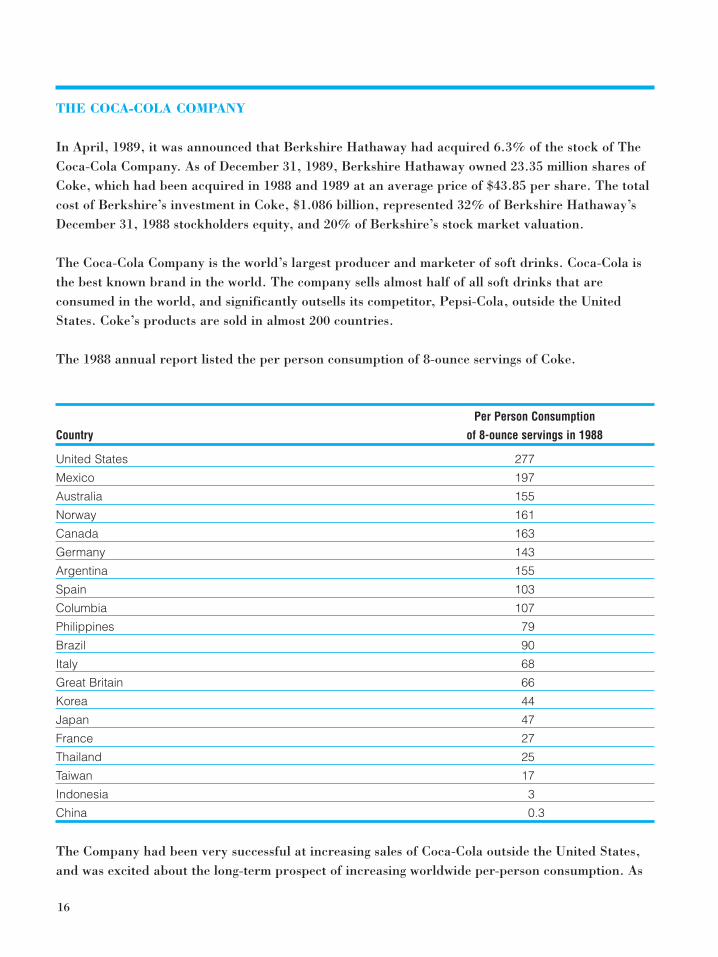
In April, 1989, it was announced that Berkshire Hathaway had acquired 6.3% of the stock of TheCoca-Cola Company. As of December 31, 1989, Berkshire Hathaway owned 23.35 million shares ofCoke, which had been acquired in 1988 and 1989 at an average price of $43.85 per share. The totalcost of Berkshire’s investment in Coke, $1.086 billion, represented 32% of Berkshire Hathaway’sDecember 31, 1988 stockholders equity, and 20% of Berkshire’s stock market valuation.
The Coca-Cola Company is the world’s largest producer and marketer of soft drinks. Coca-Cola isthe best known brand in the world. The company sells almost half of all soft drinks that areconsumed in the world, and significantly outsells its competitor, Pepsi-Cola, outside the UnitedStates. Coke’s products are sold in almost 200 countries.
The 1988 annual report listed the per person consumption of 8-ounce servings of Coke.
Per Person Consumption
Country of 8-ounce servings in 1988
United States 277
Mexico 197
Australia 155
Norway 161
Canada 163
Germany 143
Argentina 155
Spain 103
Columbia 107
Philippines 79
Brazil 90
Italy 68
Great Britain 66
Korea 44
Japan 47
France 27
Thailand 25
Taiwan 17
Indonesia 3
China 0.3
The Company had been very successful at increasing sales of Coca-Cola outside the United States,and was excited about the long-term prospect of increasing worldwide per-person consumption. As
16

Andrew Kilpatrick noted, in his book, Of Permanent Value, “Half of the world’s population drinksless than two servings per person per year!” If the worldwide level of consumption could approachthe U.S. average of 277 servings per year, enormous growth would occur.
In 1989, Warren Buffett described his investment in The Coca Cola Company: “Let’s say you weregoing away for 10 years and you wanted to make one investment and you know everything you knownow, and you couldn’t change it while you’re gone, what would you think about?
“If I came up with anything in terms of certainty, where I know the market was going to continue togrow, where I knew the leader was going to continue to be the leader - I mean worldwide - andwhere I knew there would be big unit growth, I just don’t know anything like Coke. I’d be relativelysure that when I came back they’d be doing a hell of a lot more business than they are doing now.”
In the 1995 Coca-Cola Company’s annual report, the company described its growth prospects andgoals:
“What is our most underdeveloped market? The human body. People can do without things for anentire day. But every day, every one of the 5.7 billion people on this planet must consume roughly64 ounces of fluid to live. We currently account for less than two of those ounces”.
Consider how difficult it would be to compete with Coca-Cola. The company’s 1997 after-tax profitsper serving were less than one-half cent, or just three cents profit from a six-pack of Coke. Wouldyou drink Brand X Cola because its price is a few cents less per can or bottle than Coke? WouldBrand X Cola be able to make any money by selling its cola at a discounted price when Coca-Colaearns only one-half cent per serving? Could Brand X compete with the hundreds of millions thatCoke spends on advertising and marketing? Could Brand X get its cola product distributed in about200 countries through millions of stores, vending machines and restaurants? We know that Pepsi-Cola, no slouch, has had a tough time competing with Coca-Cola. How would The Coca-ColaCompany respond to any new competition?
The 1989 Coca-Cola Company Annual Report stated: “The Coca-Cola Company began to transformitself into a global enterprise in the early 1920s. For more than 60 years, we have been developingbusiness relationships and investing in a system that today carries an estimated replacement cost ofmore than $100 billion.”
Warren Buffett said, “If you gave me $100 billion and said take away the soft drink leadership ofCoca-Cola in the world, I’d give it back to you and say it can’t be done.”
Berkshire Hathaway’s acquisition price of $43.85 per share for the Coca-Cola stock that it acquiredin 1988 and early 1989 was 15.2x 1988 earnings per share of $2.88. On December 31, 1998,
17

Coca-Cola’s stock price, $536 (before three 2-for-1 stock splits over the 10-year period), was 47.2x1998 earnings per share of $11.36. The double-dip combination of rising earnings-driven corporatevalue, as earnings per share increased from $2.88 in 1988 to $11.36 in 1998, and rising valuation,as the price-to-earnings ratio increased from 15.2x in 1988 to 47.2x in 1998, generated about a28.4% compounded annual return from Coca-Cola stock (excluding the relatively small return fromcash dividends) for Berkshire Hathaway over the 1988 - 1998 10-year holding period.
Between 1988 and 1998, Coke’s sales increased from $8.337 billion to $18.813 billion, which was anannual growth rate of 8.5%. Sales per share increased at a higher rate, 10%, as a result of theshrinkage of shares outstanding from stock repurchase programs over the 10-year period. Earningsper share increased from $2.88 in 1988 to $11.36 (before three 2-for-1 stock splits), which iscompounded earnings per share growth of 14.7%. Net income grew at a 13% annual rate from$1,044 million in 1988 to $3,533 million in 1998.
A cautionary note: Warren Buffett makes long-term investing appear easy. Just pay cheap prices forstocks whose per share earnings will grow at a 15% plus rate over the next 10 to 20 years, sit back,and get rich. In 1998, Warren Buffett owned only seven major holdings that had met his investmentcriteria. We have listed these holdings below, along with the year in which the shares were firstacquired:
Year that stock Number of
Stock was first acquired years owned
American Express 1991 7
Coca-Cola 1988 10
Walt Disney 1985 13
Freddie Mac 1988 10
Gillette 1989 9
Washington Post 1973 25
Wells Fargo 1989 9
Note the initial year that each stock was acquired. Over a long period of time, Warren Buffett hasbeen able to invest in very, very few companies that have met his criteria. He has indicated thatthere are very few businesses whose futures can be predicted with any degree of certainty. The keyis certainty: Mr. Buffett wants to invest in businesses that he is certain will have significantcompetitive advantages 10, 20, 30 years from now. This is a very high threshold , and eliminatesmost companies from consideration. By knowing what he cannot do, that is, knowing that he cannotpredict earning power in 10, 20, 30 years for most businesses, Mr. Buffett wastes no analytical timeand effort studying the “unknowables” and focuses on businesses that he considers knowable.
There is an elegant simplicity in this. Many investors, with sufficient time and effort, can probably
18

know and understand the business and competitive economics of, for example, Nestle’s Cocoa,French’s mustard, Listerine, or a water utility, and make a pretty good rough guess about thefuture earning power of those businesses. You can know Listerine. By comparison, how certaincould any investor be of the future earning power of Laura Ashley dresses, Ralph Lauren’s line offashion items and paint, or Martha Stewart’s various products? There are, it seems to us,distinctions in the degree of inherent knowability and certainty among businesses. As WarrenBuffett has said, “. . . there’s a continuum from the bulletproof franchise to the very weak business.It’s not totally an on/off switch. There are very few that I would call bulletproof franchises.”
The rub for all investment analysts (including all of us strivers at Tweedy, Browne) is discernment:being able to distinguish between being familiar with a company and truly knowing what isimportant, and, also, between what can and cannot be known. With GEICO, for example, it wasvery important to know and understand that competitors such as Travelers, Aetna, State FarmInsurance, etc. would not adopt GEICO’s simple no-agent, no-commission business model, andmatch GEICO’s low prices for automobile insurance coverage. These competitors had too much tolose. Many psychological studies have shown that familiarity with information causes human beings to believe, with high degrees of confidence, that they know much more than they actually doknow. We, at Tweedy, Browne, could add a few cases from our own experience to the variouspsychological studies along this vein.
It is interesting to compare Berkshire Hathaway’s investment research and portfolio managementdepartment to a well-known mutual fund complex (which shall remain nameless) with over onehundred investment analysts and portfolio managers. This mutual fund complex has dozens anddozens of funds, which collectively engage in hundreds and hundreds of investment buy and selldecisions. Scads of activity. Berkshire Hathaway’s entire research and portfolio managementdepartment consists of two people, Warren Buffett and Charles Munger, who only occasionally doanything — in the way of buying or selling stocks. Mr. Buffett and Mr. Munger have spoken of theinvestment advantages of sloth.
It is worth noting that even the most successful investor in the world has apparently misjudged thesustainability of competitive advantage in some (albeit very few) of the businesses that he hasacquired. Two businesses that were acquired by Berkshire Hathaway in recent years, World Book,Inc., which was acquired in early 1986 as part of the acquisition of The Scott & Fetzer Company,and the companies that comprise The Shoe Group, appear to have experienced competitive-relatedreversals.
Here is Mr. Buffett’s description of World Book in Berkshire Hathaway’s 1985 annual report:
“World Book, Inc. — accounting for about 40% of Scott Fetzer’s sales and a bit more of itsincome — is by far the company’s largest operation. It also is by far the leader in its industry,
19

selling more than twice as many encyclopedia sets annually as its nearest competitor. In fact,it sells more sets in the U.S. than its four biggest competitors combined.
Charlie and I have a particular interest in the World Book operation because we regard itsencyclopedia as something special. I’ve been a fan (and user) for 25 years, and now havegrandchildren consulting the sets just as my children did. World Book is regularly rated themost useful encyclopedia by teachers, librarians and consumer buying guides. Yet it sells forless than any of its major competitors. Childcraft, another World Book, Inc. product, offerssimilar value. This combination of exceptional products and modest prices at World Book,Inc. helped to make us willing to pay the price demanded for Scott & Fetzer, despite decliningresults for many companies in the direct-selling industry.”
In 1986, World Book’s sales and pre-tax operating income were $285 million and $21.9 million. In1996, the last year that World Book’s financial results were reported separately in the BerkshireHathaway annual report, sales and pre-tax operating income were $119 million and $12.6 million,respectively. In the 1986 to 1996 10-year period, sales had declined by 58% and operating incomehad declined 43%. What happened? New technology and new competitors brought about a dramaticchange in pricing and, therefore, in the economics of the encyclopedia business for establishedplayers such as World Book and Encyclopedia Britannica, both of which sold their encyclopediasthrough direct sales forces. The World Book Encyclopedia’s price was $650 to $850 for a set ofvolumes when the dramatic change in competing prices occurred. An excellent book aboutcompetition and economics in information businesses, Information Rules*, by Carl Shapiro andHal Varian, described the changes in the encyclopedia business, particularly as they applied to oneof World Book’s largest competitors, Encyclopedia Britannica:
The Encyclopedia Britannica has been regarded as a classic reference work for more thantwo hundred years. And, as a classic, it has commanded a premium price: a few years ago ahardback set of the thirty-two volumes of the Britannica cost $1,600.
In 1992 Microsoft decided to get into the encyclopedia business. The company bought rights toFunk & Wagnalls, a second-tier encyclopedia that had been reduced to supermarket sales bythe time of the purchase. Microsoft used the Funk & Wagnalls content to create a CD withsome multimedia bells and whistles and a user friendly front end and sold it to end users for$49.95. Microsoft sold Encarta to computer original equipment manufacturers (OEMs) oneven more attractive terms, and many computer manufacturers offered the CD as a freebie.
Britannica started to see its market erode and soon realized that it needed to develop anelectronic publishing strategy. The company’s first move was to offer on-line access tolibraries at a subscription rate of $2,000 per year. Large libraries bought this service–after all
20
* Harvard Business School Press, 1999

it was the Britannica...but smaller school libraries, offices, and homes found CDencyclopedias adequate for their needs and much more affordable. Britannica continued tolose market share and revenue to its electronic competition. By 1996, its estimated sales werearound $325 million, about half of 1990 sales.
In 1995 Britannica made an attempt to go after the home market. It offered an on-linesubscription for $120 per year, but this attracted very few customers. In 1996, the companyoffered a CD version for $200, still significantly higher than Encarta.
Unfortunately for Britannica, consumers were not willing to pay four times as much for itsproduct as for Microsoft’s, and Britannica was soon on the ropes. In early 1996, Jacob Safra,a Swiss financier, bought the company, disbanded its sales network of 110 agents and 300independent contractors, and started aggressive price cutting. He slashed the yearlysubscription to $85 and experimented with a direct mail campaign offering CDs at differentprices in an attempt to estimate demand. Everyone agrees that the quality of the product ishigh; PC Magazine gave it the top rating in its comparison of multimedia encyclopedias. Butthese efforts yielded only 11,000 paid subscribers. The big question Britannica now faces iswhether it can sell to a large enough market to recover its costs.
Meanwhile, prices for CD versions of encyclopedias continue to erode. Britannica now sells aCD for $89.99 that has the same content as the thirty-two-volume print version that recentlysold for $1,600. In a flyer we received recently from a computer store, Microsoft’s Encartamatched Britannica’s $89.99 price...and threw in a mail-in rebate for an additional $20.00off.
The Britannica example illustrates some of the classic problems of information pricing. One ofthe most fundamental features of information goods is that their cost of production isdominated by the “first-copy costs.” Once the first copy of a book has been printed, the cost ofprinting another one is only a few dollars. The cost of stamping out an additional CD is lessthan a dollar.
The Shoe Group
The Shoe Group is comprised of three companies that manufacture and distribute footwear: DexterShoe Companies, H.H. Brown Shoe Company, and Lowell Shoe, Inc. These companies wereacquired by Berkshire Hathaway between 1991 and 1993. Between 1994 and 1998, The ShoeGroup’s sales declined 18% from $609.4 million to $500 million and pre-tax earnings declined 61%from $85.5 million to $33 million as the companies faced increased competition from importedshoes.
21

The 1998 Berkshire Hathaway annual report had these comments about The Shoe Group:
“Manufacturers such as Brown, Lowell and Dexter are facing reduced demand for theirproducts. Additionally, major retailers are offering promotions to generate sales which isresulting in an ongoing margin squeeze.”
Connoisseurs of Competitive Advantage; Mimicking the Master: Buffett 101
In the preceding descriptions of GEICO, The Washington Post Company, The Coca- Cola Company,World Book Inc. and Berkshire Hathaway’s Shoe Group, we have attempted to mimic the Master,and think like Warren Buffett about the competitive strengths and weaknesses of these businesses.Warren Buffett describes this kind of thinking as analyzing the “economics” of a business. WarrenBuffett has said “When investing, we view ourselves as business analysts — not as market analysts,not as macroeconomic analysts, and not even as security analysts”. In their discerning selection ofbusinesses, we have seen that Warren Buffett and Charles Munger are connoisseurs of competitiveadvantage. When they describe the competitive advantages of a “wonderful business”, you canalmost see their mouths watering.
In essence, studying the “economics” of a business means competitive analysis: analyzing acompany’s current earnings and prospective future earnings in light of possible threats to currentand future earning power from the products and actions of competitors. It is watching and studyingthe whole playing field, not just one company by itself in its own little bubble, and analyzing acompany in the context of what Competitor A, Competitor B, or new Competitor D could do thatwould adversely affect the future earnings of that company.
Warren Buffett has described the ability of some companies to withstand competition as having a“protective moat around their economic castles”. Competitive analysis, analysis of the “economics”,tries to assess how a competitor(s) could cross the moat and damage the economic castle. It is asearch for what psychologists describe as “disconfirming evidence”, which is information thatchallenges a current view or belief about the competitive position (and earning power) of a business.
With the examples of GEICO, The Washington Post Company and The Coca-Cola Company, wetried to think about how a current competitor or new entrant could compete with these companies.We mentally attempted to find disconfirming evidence that might help us to understand how acompetitor could “cross the moat” and damage the “economic castle”. At the time that WarrenBuffett originally made these investments, it was hard to find disconfirming evidence concerningthese businesses. It seemed very tough to cross the moat. (We are currently studying the Internet’seffect on the newspaper business, especially on classified advertising revenues from help wanted andreal estate ads. There may be some cracks in the economic castle.)
22

It appears that two big models of economic advantage in businesses, the two “economic castles” are:(1) a long-run cost advantage that is very hard for competitors to duplicate, and (2) a unique, ordifferentiated product or service that is hard for competitors to duplicate. For example, GEICO is acompany with a sustainable cost advantage over its competitors. There is nothing unique about autoinsurance. The Washington Post newspaper and Coca-Cola are unique. Sometimes a business willhave a competitive moat from both unique products and a tough-to-duplicate cost position.
In many businesses, a differentiation advantage or cost advantage can be very short-lived. Forexample, the first department store in Miami, Florida to have air conditioning would have had agreat differentiated shopping experience advantage until its competitors installed air conditioning intheir stores. We know that because air conditioning became available to all of the department storecompetitors in Miami, instead of becoming a competitive advantage, having air conditioning becamea required capital investment and cost that each competitor had to incur in order to just stay evenwith the other competitors. Similarly, a producer of commodity textiles that buys a more productivepiece of manufacturing equipment may enjoy a cost advantage until competitors buy the sameequipment to reduce their costs to about the same level.
World Book and Encyclopedia Britannica seem like pretty unique products, but they were notunique enough, at $650 to $1600 a set, to withstand damage to their economic castles from theEncarta encyclopedia CD, which cost less than $1.00 to stamp out and was given away as a freebieby computer manufacturers.
Competitive analysis may often require study, examination and thinking beyond easily available,familiar information. For example, in the banking industry, we are starting to examine thecompetitive threat from Internet banks such as Telebank, which has no branches, to the earningpower of established banks, which operate with a branch system of attracting deposits. Telebankoffers their customers interest rates on deposits that are 2x the average for the banking industry.Like GEICO, a highly automated Internet bank—without the required capital investment andrelated costs of “bricks and mortar” branches—may have a sustainable cost advantage over most“bricks and mortar” banks. This cost advantage could permit more value to be provided to depositcustomers through above-average rates paid on customers’ deposits, or to loan customers throughlower interest rates on the money that they have borrowed.
The durability of, say, Telebank’s cost advantage, and resulting economics, would depend on theextent to which existing banks and new “Internet only” banks decided to mimic its business model,duplicate its low cost position, and compete head-on by offering the same high rates on deposits,and charging the same low rates on loans. Competitive analysis gets into the details of all of this andtries to assess where the players will move on the playing field, and the effect on future earningpower. We have not seen any banking industry reports that lay all of this out for us. There is a lotof information out there, but the information that we need for meaningful insights is not on a silver
23

platter. We have to traipse around a bit to get it, and we have to draw our own road map.
To study an existing bricks and mortar bank, according to “Buffett Investment Analysis 101”, youstudy and think about not just the company itself, but all of the competitive threats, such asInternet banks, money market mutual funds, mutual funds that invest in corporate loans, directborrowing by corporations from investors instead of banks, etc.
Another example of “Buffett 101” type competitive analysis is Tweedy, Browne’s investment inAmerican Express Company. When Tweedy, Browne bought shares of American Express Companyseveral years ago (a year or two before Warren Buffett bought shares), it was during a time when wecould open The New York Times or another publication and see a Visa ad with a picture of theowner of a chic restaurant who had just stopped accepting American Express cards. The newsabout American Express was terrible, and the stock price had dropped to about 9x or 10x near-term earning power, if earnings did not decline. In order to make a best-guess estimate of earningpower, we needed to assess the competitive position of the American Express card.
American Express has a circular spiral, reinforcing sort of economic system in its credit cardbusiness. Upward spiral: If more businesses accept charges on The Card, the convenience and easeof use of The Card increases, and more people will want to use The Card, and will charge moreoften, and more habitually. Greater card usage, in turn, leads to increased acceptance of The Cardby a wider array of businesses who want sales from holders of The Card. Downward spiral: Reduceacceptance of The Card by businesses, and there will be less opportunity for people to use TheCard, and fewer businesses will be inclined to accept The Card - because they don’t get muchbusiness from it.
We wanted to assess whether more and more restaurants and other business establishments wouldstop accepting charges on The Card, and thus reduce The Card’s usefulness to its holders. To dothis, we did a little telephone survey of some of the restaurants frequented by one of Tweedy,Browne’s Managing Directors. One restaurant in Lambertville, New Jersey that had stoppedaccepting The Card had noticed a decline in business related dinners.
We knew that a $100 dinner tab may cost a restaurant, say, $10 for the cost of food ingredients,yielding a $90 gross profit before deducting the fairly fixed costs of chefs, waiters, rent, etc.American Express was charging restaurants about 3.2% of the tab, or $3.20, and Visa was onlycharging 1.75%, or $1.75, to process a charge. By not accepting The Card, this restaurant ownerthought that he was losing the $90 gross profit on the $100 business dinner tab to competingrestaurants which accepted The Card. He thought that business-dinner customers were avoiding hisrestaurant in order to avoid the inconvenience and hassle of obtaining expense reimbursementsfrom their companies. It was easier for the business-dinner customer to simply choose a restaurantthat accepted The Card.
24

While many individual American Express card holders also had Visa cards for their personalpurchases, very few businesses had Visa corporate cards for their employees’ business-relatedpurchases. American Express was dominant in credit cards used to pay business expenses, with a70% market share. For personal purchases, it was relatively easy for individuals to charge withtheir Visa card instead of their American Express card if the restaurant, hotel or airline preferredthe Visa card. However, for charges of business-related expenses, most people would not be able touse a corporate Visa or MasterCard. The only corporate card in most persons’ wallets was theAmerican Express corporate card.
We did not believe that business establishments would create the annoyance and confusion of onlyaccepting the corporate American Express card, while declining a charge on an American Express cardheld by an individual. American Express also required the business owner to accept charges on alltypes of cards issued by American Express if the business was to be part of the American Express system.
It also seemed to us that Visa and MasterCard, which are issued by thousands of separate bankswho compete with each other, would be somewhat reluctant competitors in the business credit cardfield because of the economics of Visa and MasterCard. The profits that banks earn on Visa andMasterCard largely come from charging above-average interest rates on loan balances. Customerswho pay off their balance each month, and, therefore, do not borrow on their Visa or MasterCard,generate unprofitable to marginally profitable business for the banks. Most businesses, we believed,would be fairly unprofitable Visa or MasterCard customers because most businesses would not allowa high interest rate loan balance to develop. Thus, it seemed to us that American Express’sdominant corporate card position was a linchpin, a big moat that ensured acceptance of The Cardby business establishments, and thereby protected American Express’s economic castle.
The owner of the restaurant in Lambertville, New Jersey, who had stopped accepting The Card, told usthat he had changed his mind and was going to accept The Card again so that, hopefully, he could recoupthe gross profit on the business-related dinners that had been lost to competitors who accepted The Card.
We heard the same kind of thing in talking to other business owners. In additon, we learned twothings about how The Card is perceived by individual card members: (1) it still seemed to havemore cache or status in some holders’ minds than Visa or MasterCard, and (2) some holders had afunny mental accounting discipline, or system, in their heads: American Express was the “virtuous”card, where the balance had to be paid off each month, and there would be no high interest chargesto pay. Visa and MasterCard were what you used if you had to. Even though an individual can payoff his or her Visa or MasterCard balance each month and never incur interest charges, severalindividuals we spoke with did not think of it this way. Here was more moat. We also believed thatAmerican Express would develop a Frequent Flier awards program to be at competitive parity withthe programs offered by Visa and MasterCard. In addition, we learned that corporations thoughtthat the statements that American Express issued to corporate accounting departments were very
25

easy to work with and understand. Corporations had no reason or incentive to switch to havingtheir employees use a corporate card issued by Visa or MasterCard. There were also some tie-inswith American Express’s travel agent business, which provides certain benefits to corporations such as discounts on airline travel expenses. More moat.
Key qualitative insights concerning American Express were obtained by doing “Buffett 101”-typeinvestment research and thinking. Buffett 101 is a very wide frame, a very broad set of information.It is trying to see the whole picture, all of the moving parts and how they interact and affect eachother, not just one piece of the puzzle.
Characteristics of the Best and Worst Performing Stocks in the S&P 500 Index over an 18-Year Period
In the previous section, we have examined three of Warren Buffett’s long-term holdings, GEICO,The Washington Post Company and The Coca-Cola Company, in an effort to identify the numericaland qualitative characteristics of a successful long-term investment. We thought that it would alsobe instructive to examine the characteristics of a larger sample of long-term winners. In contrast,we thought that perhaps we could also learn something by examining the characteristics of the worstperforming long-term investments. It could be useful to have some information concerning what thelosers look like so that we can try to avoid them.
We selected the 500 companies that comprised the S&P 500 Stock Index as of December 31, 1980 asour universe, and ranked these companies on total investment return over the December 31, 1980through December 31, 1998 18-year period, and sorted the companies into five equal number groups,or quintiles. Of the original 500 companies in the S&P 500 on December 31, 1980, 230 companieshad been merged, acquired or deleted from the Index by December 31, 1998. Therefore, the remaining270 of the original 500 companies could be tracked over the entire 18-year December 31, 1980through December 31, 1998 period. Each quintile, therefore, was comprised of 54 stocks.
The “Winners”
One hundred dollars invested in each of the 54 best performing stocks, or $5,400 total, becameworth $238,330 on December 31, 1998, which is a compounded annual return of 23.4% over the 18-year period. The mean average compounded annual return of the 54 stocks was 22.75%.*
26
* (Mathematical note: For readers wondering why the preceding compounded annual return of the portfolioof 54 stocks, 23.4%, was not the same figure as the average compounded annual return of the 54 stocks,22.75%: The mean average compounded annual rate of return of a list of stocks will not be the same figureas the compounded annual rate of return of an equal-weighted portfolio of the same stocks due to the effectof compounding over more than one period. For example, if $100 is invested in Stock A, which compoundsat a 20% per year rate over a 20-year period, and $100 is invested in Stock B, which compounds at a 10%rate over the same period, the mean average return of the two stocks is 15% (20% + 10%/2 = 15%). Thevalue of the initial $200 portfolio that was comprised of stocks A & B, however, grew to $4,506.50 over the20-year period, which is a compounded annual return of 16.85% on the initial $200 investment. We will beexploring this math in greater detail in the section of this report entitled “Diversification and theMathematical Magic of Skewness”.)
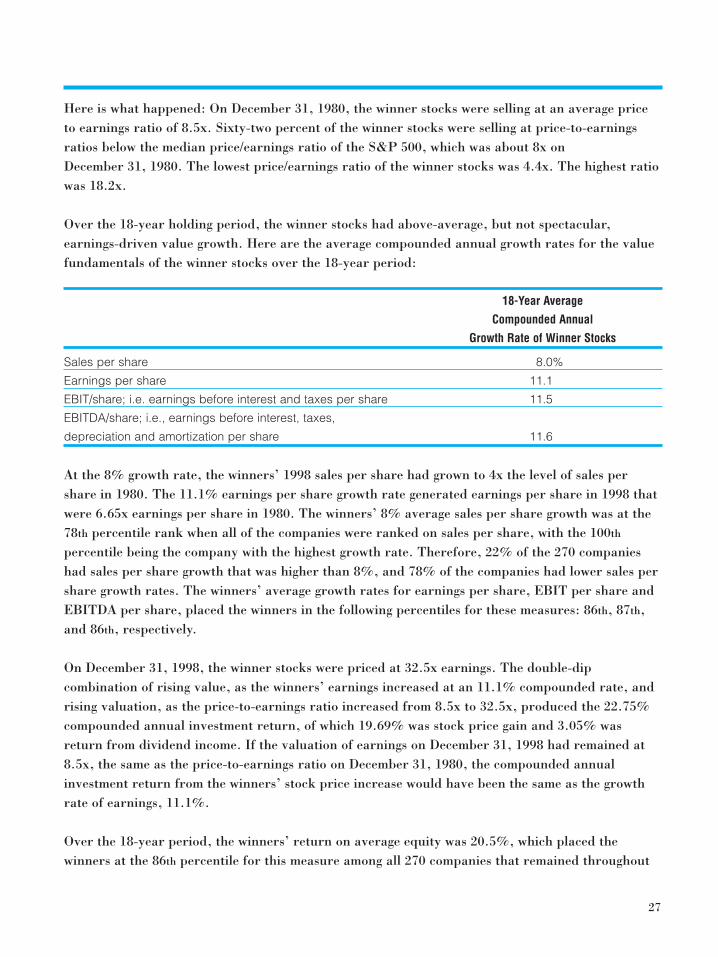
Here is what happened: On December 31, 1980, the winner stocks were selling at an average priceto earnings ratio of 8.5x. Sixty-two percent of the winner stocks were selling at price-to-earningsratios below the median price/earnings ratio of the S&P 500, which was about 8x on December 31, 1980. The lowest price/earnings ratio of the winner stocks was 4.4x. The highest ratiowas 18.2x.
Over the 18-year holding period, the winner stocks had above-average, but not spectacular,earnings-driven value growth. Here are the average compounded annual growth rates for the valuefundamentals of the winner stocks over the 18-year period:
18-Year Average
Compounded Annual
Growth Rate of Winner Stocks
Sales per share 8.0%
Earnings per share 11.1
EBIT/share; i.e. earnings before interest and taxes per share 11.5
EBITDA/share; i.e., earnings before interest, taxes,
depreciation and amortization per share 11.6
At the 8% growth rate, the winners’ 1998 sales per share had grown to 4x the level of sales pershare in 1980. The 11.1% earnings per share growth rate generated earnings per share in 1998 thatwere 6.65x earnings per share in 1980. The winners’ 8% average sales per share growth was at the78th percentile rank when all of the companies were ranked on sales per share, with the 100th
percentile being the company with the highest growth rate. Therefore, 22% of the 270 companieshad sales per share growth that was higher than 8%, and 78% of the companies had lower sales pershare growth rates. The winners’ average growth rates for earnings per share, EBIT per share andEBITDA per share, placed the winners in the following percentiles for these measures: 86th, 87th,and 86th, respectively.
On December 31, 1998, the winner stocks were priced at 32.5x earnings. The double-dipcombination of rising value, as the winners’ earnings increased at an 11.1% compounded rate, andrising valuation, as the price-to-earnings ratio increased from 8.5x to 32.5x, produced the 22.75%compounded annual investment return, of which 19.69% was stock price gain and 3.05% wasreturn from dividend income. If the valuation of earnings on December 31, 1998 had remained at8.5x, the same as the price-to-earnings ratio on December 31, 1980, the compounded annualinvestment return from the winners’ stock price increase would have been the same as the growthrate of earnings, 11.1%.
Over the 18-year period, the winners’ return on average equity was 20.5%, which placed thewinners at the 86th percentile for this measure among all 270 companies that remained throughout
27

the 18-year period. In the initial year, 1980, the winners’ return on average equity was 17.5%,which placed the winners in the 65th percentile on this measure among all 500 companies in theS&P 500.
Over the same 18-year period, the compounded annual total return of the S&P 500 was 16.94%.The S&P 500’s returns were also generated by a double dip of value and valuation increase. Theearnings per share of the S&P 500 rose from $14.82 in 1980 to $38.23 in 1998, a 5.4% compoundedrate of increase in earnings-driven value, while the price-to-earnings ratio increased from 9.2x onDecember 31, 1980 to 32.2x on December 31, 1998, providing an enormous increase in valuation.
Each $1,000,000 invested in the S&P 500 at the beginning of the period was worth $16,723,800 onDecember 31, 1998. The winners’ 22.75% average annual return exceeded the S&P 500’s 16.94%return by 5.81%. Each $1,000,000 invested in the winners at the beginning of the period grew to$44,135,200 on December 31, 1998.
At the 5.4% compounded rate of earnings growth, each $1.00 of the S&P 500’s earnings per shareincreased to $2.58 in 1998. Over the same 18-year period, the 11.1% rate of earnings growth of thewinners, which was 5.7% above the S&P 500’s 5.4% earnings growth rate, resulted in each $1.00 ofearnings in 1980 growing to $6.65 in 1998.
The “Losers”
The 54 worst-performing stocks over the 18-year period, the losers, had an average compoundedannual investment return of 0.3%. Eighteen of the 54 loser stocks had negative compounded annualinvestment returns. $100 invested in each of the 54 losers on December 31, 1980, or $5,400 total,grew to $8,969.25, a 2.86% compounded annual return.
In 1980, the 54 loser companies did not appear particularly unattractive: Return on average equityin 1980 was 15.3%, which was the 53rd percentile for this measure. However, on December 31, 1980,the average price-to-earnings ratio was 12.1x, which was the 78th percentile for the price-to-earningsratio. These stocks were relatively expensive in relation to earnings: Only 22% of the companies inthe S&P 500 had higher price-to-earnings ratios. The price-to-book value was 1.74x on December 31, 1980, which was the 75th percentile for this ratio.
28

The loser companies, as you might expect, experienced very hard times over the 18 yearssubsequent to December 31, 1980. Sales per share declined by an average of 3.7% per year.Seventy-nine percent of the losers reported either a loss in 1998 or lower earnings per share in 1998than in 1980. We could not calculate a meaningful average price-to-earnings ratio for the losers as agroup in 1998 because so many companies had reported losses, resulting in negative price-to-earnings ratios.
Many of the companies also had extremely high price-to-earnings ratios that resulted from break-even earnings per share, for example, of $.01 per share in 1998. The average price-to-book valueratio on December 31, 1998, 1.84x, was not much higher than the 1.74x ratio of price-to-book valueon December 31, 1980.
29

Earnings Per Share Growth over the 18-Year,December 31, 1980 - December 31, 1998 Periodfor Companies that were in the S&P 500 as of December 31, 1980
When we ranked the 270 S&P 500 companies on earnings per share growth over the 18-year,December 31, 1980 - December 31, 1998 period, we were surprised to learn how difficult it was formost companies to obtain significant long-run earnings growth. Of the 270 companies that could betracked over the 18-year period, a total of 239 had data that enabled a compounded growth rate inearnings per share to be calculated (a compounded e.p.s. growth rate could not be calculated whenthe starting e.p.s. as of December 31, 1980 was a negative number). Here is what we found: Only6% of the companies had e.p.s. growth rates over the 18-year period of 15% or greater. WarrenBuffett’s goal is earnings per share growth of at least 15%. In the following table are somepercentiles and compounded annual growth rates over the same 18-year period for the S&P 500companies that could be tracked over the entire period.
EPS Growth Rates of S&P 500 Companies for the 18-Year Periodended December 31, 1998
Compounded Annual E.P.S. Growth Rate
Percentile Over 18-Year 12/31/80 -12/31/98 Period
100th 35.8%
95th 15.7
90th 12.8
80th 10.2
70th 8.1
60th 5.8
50th 3.8
40th 2.2
30th 0.5
20th (2.3)
10th (6.3)
Fifty percent of the companies had e.p.s. growth rates of 3.8% or less, and 28% of the companieshad lower e.p.s. in 1998 than in 1980.
30

Perfect Together: High Returns From Stocks that Combine Value and Growth; Buy Cheap and Keep
Our research has indicated that long-term investment returns are driven by changes in bothearnings and in the valuation of earnings. It seems clear from both our study of three of WarrenBuffett’s long-run winners, and also from our examination of the best performing stocks in the S&P 500 over the 18-year period ended December 31, 1998, that we want to identify stocks that arelikely to have above-average future sales and earnings growth, and that are also cheap in relation toa likely future valuation of earnings. We want both earnings and the price-to-earnings multiple toincrease over time so that we can generate high, long-run, tax-deferred returns. This is aninvestment approach that melds the Value idea of buying cheap, with the Growth idea of owningstocks you can keep: Buy Cheap and Keep.
The Intrinsic Value of a Growing Business: How Warren Buffett Values Businesses
In Berkshire Hathaway’s 1992 annual report, Warren Buffett revealed how he values any stock,bond or business:
The value of any stock, bond or business today is determined by the cash inflows and outflows- discounted at an appropriate interest rate - that can be expected to occur during theremaining life of the asset.
In the Berkshire Hathaway Owners Manual, Warren Buffett provides this description of intrinsicvalue:
Let’s start with intrinsic value, an all-important concept that offers the only logical approachto evaluating the relative attractiveness of investments and businesses. Intrinsic value can bedefined simply: It is the discounted value of the cash that can be taken out of a businessduring its remaining life.
The calculation of intrinsic value, though, is not so simple. As our definition suggests,intrinsic value is an estimate rather than a precise figure, and it is additionally an estimatethat must be changed if interest rates move or forecasts of future cash flows are revised. Twopeople looking at the same set of facts, moreover - and this would apply even to Charlie andme - will almost inevitably come up with at least slightly different intrinsic value figures.
At the 1993 shareholders meeting for Berkshire Hathaway, Mr. Buffett elaborated on the definitionof intrinsic value that he had provided in the 1992 Berkshire Hathaway annual report:
31

I have a section in Berkshire’s annual report related to the appraisal of common stocks whichis almost a tautology. I refer to taking all of a future stream of cash in and out–not just theflow in one direction — and discounting that at the appropriate rate.
If you had the foresight and could see the number of cash inflows and outflows between nowand judgment day for every company, you could arrive at a value today for every businessthat was rational in relation to the value of every other business.
When you buy stocks or bonds or economic assets, you do so by placing cash in now to receivecash later. And obviously, you’re looking for the highest interest rate. That theory wasoriginally propounded in its most elaborate form over 50 years ago in The Theory ofInvestment Value that I mention in Berkshire’s annual report.
And once you’ve estimated future cash inflows and outflows, what interest rate do you use todiscount that number back to arrive at a present value? My own feeling is that the long-termgovernment rate is probably the most appropriate figure for most assets.
And when Charlie and I felt subjectively that interest rates were on the low side — we’dprobably be less inclined to be willing to sign up for that long-term government rate. We mightadd a point or two just generally. But the logic would drive you to use the long-termgovernment rate.
If you do that, there is no difference in economic reality between a stock and a bond. Thedifference is that the bond may tell you what the cash flows are going to be in the future —whereas with a stock, you have to estimate it. That’s a harder job, but it’s potentially a muchmore rewarding job.
Logically, if you leave out psychic income, that should be the way you evaluate a farm, anapartment house or whatever. And in a general way, Charlie and I do that.
In the 1991 Berkshire Hathaway annual report, Mr. Buffett explained that the intrinsic value of aperpetual annuity cash payment of $1.00, discounted at an annual interest rate of 10%, is $10.00.He further explained that the intrinsic value of a perpetual annuity that pays $1.00 in the first year,and then increases by 6% in each subsequent year (i.e., to $1.06 in Year 2, $1.12 in Year 3, $1.19 inYear 4, etc.), discounted at the same 10% annual interest rate, is worth significantly more: $25.00.The big lesson: future growth has a significant impact on intrinsic value as calculated according tothe discounted cash flow method of determining intrinsic value that is used by Warren Buffett. InWarren Buffett’s example, to earn a 10% return on your money from a perpetual annuity, youcould pay 2.5x more for the perpetual annuity whose payment increases 6% per year than for theperpetual annuity whose payment is constant.
32

The discounted cash flow method of valuation that Mr. Buffett described in the 1991 and 1992Berkshire Hathaway annual reports is also variously referred to in financial text books as presentvalue, net present value, dividend discount model, the Gordon growth model or the perpetualgrowth model.
It is interesting to consider the mathematics of Warren Buffett’s method of computing intrinsicvalue: how the numbers work. Let’s start with two simple examples: (1) What would you pay todayto receive a cash payment of $1.00 in 12 months if you wanted to earn 10% on your investment?Answer: You would pay 90.9¢ today in order to earn a 10% return on your money ($.909 x 10% =$.091; $.909 + $.091 = $1.00); (2)What would you pay today in order to receive a cash payment of$1.00 in two years if you wanted to earn a 10% compounded rate of return on your investment overthe two-year period? Answer: You would pay 82.65¢ today to earn a 10% compounded annualreturn on your money over the two-year period from the $1.00 payment that you would receive twoyears after today. (Year 1: $.8265 x 10% = $.08265; $.8265 + $.08265 = $.909; Year 2: $.909 x 10%= $.091; $.909 + $.091 = $1.00.)
Extending these two examples, the intrinsic value of an annuity that paid a total of $2.00 in twoannual payments, or, in other words, what you would pay today for $1.00 that you would receiveone year from today, and $1.00 that you would receive two years from today, is 90.9¢ (for the $1.00that you would receive one year from today) plus 82.65¢ (for the $1.00 that you would receive twoyears from today), which is a total intrinsic value of $1.7353 ($.909 + $.8265 = $1.7353). Notice thatto earn a 10% return on your money, the longer you have to wait for each future annuity payment,the less you would pay for it today. You would only pay one cent today in order to earn a 10%compounded annual return on your money from $1.00 that you would receive 49 years from today.
Warren Buffett’s intrinsic value example in the 1991 Berkshire Hathaway annual report simplyadds up all of the separate amounts that you would pay today to earn 10% from each of the futureannual payments that you would receive in perpetuity. Common stocks are assumed to have aperpetual life. If you run the numbers, and calculate what you would pay today to earn a 10%compounded annual return from $1.00 received each year for 50 years, and added up the 50amounts that you had calculated for each of the 50 years of $1.00 receipts, you would get close tothe figure that Warren Buffett calculated as “intrinsic value”: $10.00. (The $1.00 received 50 yearsfrom today only adds 8/100ths of a cent to intrinsic value). Similarly, if you assume that you were toreceive $1.00 12 months from today, and then receive annual receipts in each subsequent year for49 years that grew at a 6% compounded annual rate (i.e., $1.06 two years from today, $1.1236three years from today, $1.191 four years from today, etc.), and calculated today’s value (in orderto earn a 10% compounded annual return) of each one of the 50 cash receipts, then added them allup, you would come close to Warren Buffett’s calculation of intrinsic value: $25.00. (The $1.00initial receipt after 12 months would have grown to an $18.42 receipt in the fiftieth year, but youwould only pay about 16¢ today for this $18.42 receipt in order to earn a 10% compounded annual
33

return over the 50-year period from the $18.42 receipt.)
There is a simple mathematical formula for making the discounted cash flow intrinsic valuecalculation used by Warren Buffett, assuming a constant rate of growth in cash receipts.
That formula is set forth below:
Intrinsic Value = Initial cash that you would receive 12 months from today,which will grow at some assumed compounded rate of increaseto infinity
�Assumed rate of return that you are using to value all of thefuture cash receipts, minus the assumed annual compoundedgrowth rate of the cash receipts
Intrinsic Value Example 1:
Intrinsic value today of an annual amount of cash = $1.00 (the initial cash receipt)�that you and your estate would receive forever
0.10 (the discount rate, or that grows at a 6% compounded rate and that youreturn you will earn)value to earn a 10% compounded annual return.minus
Assume a $1.00 initial cash payment the growth rate of 0.06
= $1.00 = $1.00 = $25.00_____________ ________0.10 - 0.06 0.04
Intrinsic Value = $25.00
Intrinsic Value Example 2:
Assume:
$1.00 initial cash receipt 12 months from todaythat does not grow and is received annually forever
10% rate of return, or discount rate
Intrinsic Value = $1.00________________________0.10 - 0 (growth rate)
Intrinsic Value = $1.00 = $10.00______________0.10
34

Let’s use Warren Buffett’s discounted cash flow method of calculating intrinsic value to value theearnings of a company whose earnings are 100% distributable as cash, and that grow at a 5% rate“forever”. We will use Warren Buffett’s preferred discount rate to value companies, the U.S.government long-term bond rate, which is now about 6%.
Here is the intrinsic value of each $1.00 of earnings (12 months from today) for this company:
Intrinsic Value = $1.00________________________0.06 discount rateminus 0.05 growth rate
= $1.00 = $1.00 = $100_____________ ________0.06 - 0.05 0.01
To earn a 6% return “forever”, you could pay $100 for each $1.00 of current earnings generated bythis company. The intrinsic value price-to-earnings multiple for a company whose cash earningsgrow at only 5% per year “forever” is an eye-popping 100x using Warren Buffett’s discounted cashflow method of valuation. Clearly, long-run earnings growth has a dramatic impact on valuation.(The annual growth rate of the S&P 500’s earnings over the last 70 years has been about 6%, andits price-to-earnings ratio has been 14x, on average.)
If you try to value a company whose cash earnings are expected to grow at a high rate, say 15% peryear, over a long period of time, the valuation in relation to current earnings can be extremely high,almost absurdly high. For example, if Coca-Cola’s cash earnings were to grow at a 15% annual rateover the next 50 years, each $1.00 of current earnings would grow to $1,083.65 50 years fromtoday. The current intrinsic value, assuming a 6% discount rate for just the cash receipt in only oneof the 50 years, say, year 50, is $58.82 (about 59x current earnings), and we haven’t yet done theintrinsic value calculation for each of the 49 remaining years up to year 50. In fact, the way themath works, if the rate of earnings growth is higher than the discount rate, and you assume aperpetual life, the intrinsic value of earnings is an infinite price-to-earnings multiple because thediscounted value today of each future year’s cash receipts increases with time. For example, in thepreceding Coca-Cola example, if cash earnings in year 51 increased 15% over cash earnings in year50, earnings would rise to $1,246.20, and the current discounted value (at 6%) of this future receiptis $63.82, as compared to a discounted value today of $58.82 for the cash receipt in year 50. IfCoke’s cash earnings grew at 15% “forever”, its intrinsic value, assuming a 6% discount rate, isinfinite.
Warren Buffett has continued to own Coca-Cola stock at valuations as high as 65x current earnings,which is a very high multiple of earnings in relation to most stocks. If Coca-Cola’s future earningsincrease long enough at a 15% rate, then an apparently very expensive 65x price-to-current
35

earnings multiple for Coke may turn out to have been a bargain. That’s what the math of thediscounted cash flow method of determining intrinsic value tells us. The key, of course, is getting thefuture right.
At Tweedy, Browne, we consider the discounted cash flow method of computing intrinsic value to bea useful conceptual framework for thinking about the valuation of a growing business. Weunderstand the math. It makes sense to us. However, we do not make precise, to-the-pennyestimates of cash earnings going out 50 years. That strikes us as a bit silly. We never want to confuseprecision with accuracy. However, the discounted cash flow method of valuation does point youtoward companies where qualitative research suggests greater certainty, greater ability to predict:Companies where this valuation method could be roughly accurate, such as Coca-Cola or Listerine,not a total wild guess, such as, say, Laura Ashley’s dress business. The math also tells you that ifyou own an interest in a business that you confidently expect will grow in value at an above averagerate over a long period of time, you should be willing to ride a little loose in the saddle of valuation,and tolerate an above-average price-to-current earnings ratio. The math tells you that long-runearnings growth is worth a lot. To gain the benefits of tax deferred investment returns, as WarrenBuffett and index funds have, a tax-paying investor has to stick with the winners in his or herportfolio. As John Bogle, of the Vanguard Funds, has said, “Buy right and hold tight.” The Tweedy,Browne version of the same idea is “Buy cheap and keep.”
At Tweedy, Browne, our primary framework and method of valuing most businesses is acquisitioncomparables - what companies have actually paid to buy similar businesses in relation to sales,earnings, EBIT (i.e., earnings before deducting interest and taxes), EBITDA (i.e., earnings beforededucting interest, taxes, depreciation and amortization), etc. We learn how people who areactually buying companies value them, and then we apply those valuation methods in appraisingbusinesses in the same field. An actual acquisition valuation incorporates assessments of futuregrowth prospects of the particular business by both the buyer and the seller of the business.Acquisition valuations also incorporate real-world rate of return or discount rates, which areusually higher than the U.S. government long-term bond rate. That said, the discounted cash flowmath tells us that the relatively rare business that can compound in value over a long period of timeat above-average rates can be quite cheap in the long-run, even at typical corporate acquisitionvaluation standards, which today are about 10x - 12x EBIT, or 17x - 20x after-tax earnings, for adebt-free company. To have paid a typical corporate acquisition valuation fifty years ago for abusiness such as The Coca-Cola Company, obviously, would have been a steal. Average valuationstandards that apply to average businesses may be a mistake to apply to businesses with above-average long run prospects. One size does not necessarily fit all.
36

When to Sell: A Framework for Tax-Paying Investors;Thinking and Acting Like an Owner of a Business
“Investigate before your divest” - John Bogle, Chairman, The Vanguard Group, Inc.
At Tweedy, Browne, we generally sell a stock when its price reaches our estimate of intrinsic value,or sooner if we have a better investment to replace the investment that we have decided to sell. Inconsidering the possible sale of a stock, we calculate the effect of capital gains taxes that would bepaid if the stock were sold, and consider the net valuation that would be received for the stock afterthe payment of capital gains taxes. This net-of-tax valuation for the stock that we are thinking ofselling is compared to the valuation of the prospective new investment that may replace it.
The following example shows how we analyze a possible sale of a stock that is already owned, Bank A, and compare it to a possible replacement, Bank B:
WE MIGHT SELL BANK A:Bank A’s stock price: $100.00Less Cost of Bank A Stock (5.00)Equals unrealized capital gains 95.00
Less 27% federal and state capital gains tax if the stock were sold (25.65)Equals realized gains, net of taxes 69.35
Net of tax proceeds if the stock were sold 69.35 + 5.00 cost 74.35
Gain required to get back to having $100 per share working for the investor $100.00 - $74.35 = $25.65 35%
$ 25.65�$74.35 = 35%
37
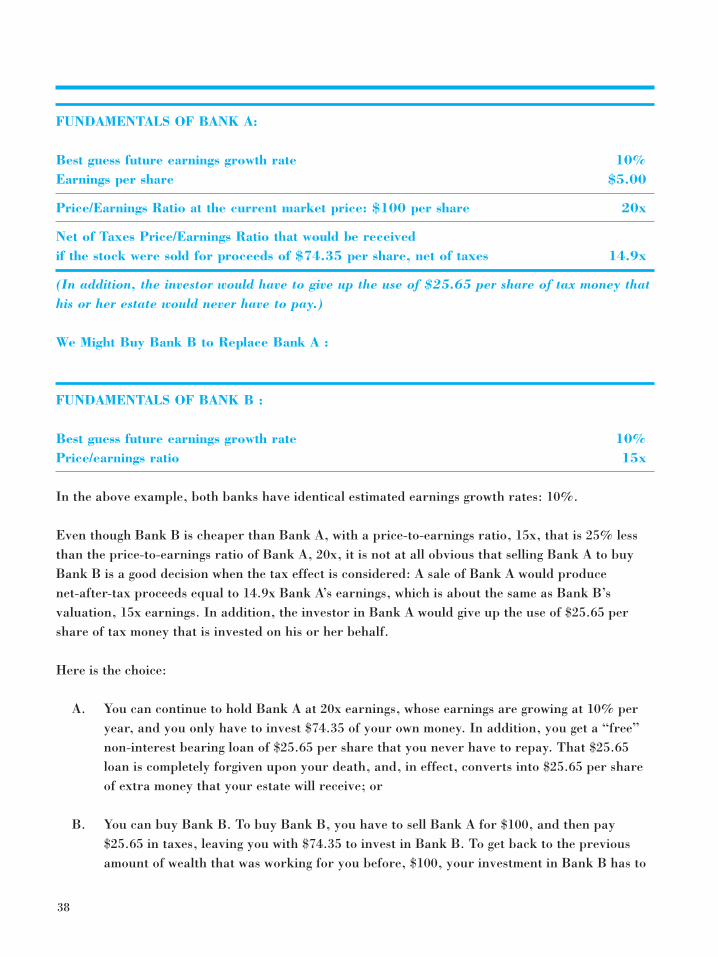
FUNDAMENTALS OF BANK A:
Best guess future earnings growth rate 10%Earnings per share $5.00
Price/Earnings Ratio at the current market price: $100 per share 20x
Net of Taxes Price/Earnings Ratio that would be receivedif the stock were sold for proceeds of $74.35 per share, net of taxes 14.9x
(In addition, the investor would have to give up the use of $25.65 per share of tax money thathis or her estate would never have to pay.)
We Might Buy Bank B to Replace Bank A :
FUNDAMENTALS OF BANK B :
Best guess future earnings growth rate 10%Price/earnings ratio 15x
In the above example, both banks have identical estimated earnings growth rates: 10%.
Even though Bank B is cheaper than Bank A, with a price-to-earnings ratio, 15x, that is 25% lessthan the price-to-earnings ratio of Bank A, 20x, it is not at all obvious that selling Bank A to buyBank B is a good decision when the tax effect is considered: A sale of Bank A would produce net-after-tax proceeds equal to 14.9x Bank A’s earnings, which is about the same as Bank B’svaluation, 15x earnings. In addition, the investor in Bank A would give up the use of $25.65 pershare of tax money that is invested on his or her behalf.
Here is the choice:
A. You can continue to hold Bank A at 20x earnings, whose earnings are growing at 10% peryear, and you only have to invest $74.35 of your own money. In addition, you get a “free”non-interest bearing loan of $25.65 per share that you never have to repay. That $25.65loan is completely forgiven upon your death, and, in effect, converts into $25.65 per shareof extra money that your estate will receive; or
B. You can buy Bank B. To buy Bank B, you have to sell Bank A for $100, and then pay$25.65 in taxes, leaving you with $74.35 to invest in Bank B. To get back to the previousamount of wealth that was working for you before, $100, your investment in Bank B has to
38

increase from $74.35 to $100, an increase of 35%. If this were to happen immediately, theprice-to-earnings ratio of Bank B would have risen from 15x to 20x. And if you sold Bank Bat $100, there would be another tax to pay, $6.93 (assuming it was eligible for long-termcapital gains treatment), so you would have $93.07 net of taxes ($100 - $75.35 = $25.65 gainx 27% tax = $6.93; $100 - $6.93 = $93.07).
If another bank, Bank C, was priced at 8x earnings, and our best guess about its future earningsgrowth rate was 15%, then a switch from Bank A to Bank C would be more compelling.
In considering the sale of a stock, which is, of course, an interest in a business, we try to think theway an owner of a company would think when considering a sale of the entire company: What arethe future prospects of the business? Would it be better to hold onto the company, given its futureprospects, or sell it today at the current valuation? If it appears that the future value of thecompany is likely to increase at a high rate, a business owner would probably choose to forgo a saleto an acquirer, and hold onto the company. In effect, an owner who made this choice not to sellwould have decided that the “intrinsic value” of the company, as determined by the company’sacquisition value, was not high enough in relation to the future potential, and value, of thebusiness. Most fortunes have been made by owning a business that greatly increased in value overtime.
In many instances, the decision to sell is a very easy one: There is a cash tender offer for all of thecompany’s shares, and we have no choice but to sell. It is also usually a fairly easy decision to sell acompany with average to below average future earnings growth prospects at an appraisal ofintrinsic value that has been based on valuations of similar businesses in recent acquisitions. If itlooks like we have a winning business, our inclination is to act like an owner and stick with it.Warren would.
Predicting the Future of Businesses
At Tweedy, Browne, we believe that it is not difficult to determine the cheapness of stocks based onmultiples of current earnings, sales, EBIT (i.e., earnings before deducting interest and taxes) andEBITDA (i.e, earnings before deducting interest, taxes, depreciation and amortization). We havecomputers that do these calculations for us. If the current numbers hold up in the future, the stockis cheap. Obviously, a stock selling at a low ratio of price-to-current reported earnings is notnecessarily a bargain if future earnings collapse. Our empirical research indicates that the earningsof most businesses are highly volatile from year to year. After all, earnings are what is left overafter all costs have been subtracted, and earnings, depending on the particular business, can oftenamount to just 1%, 2% or 10% of sales. If the earnings margin on sales is 10%, total costs, 90% of
39

sales, would only have to increase by five percentage points to 95% of sales in order to causeearnings to drop by 50% (from 10% of sales to 5% of sales). This sort of thing happens all the time,including sometimes to us.
Additionally, if the value of the company’s business does not increase much with the passage oftime, a stock is not likely to be a very good investment over a long holding period, such as 10 yearsor 18 years. For example, if a stock is purchased at 50% of its underlying value of $100 per share,$50, and sold 10 years later at an unchanged underlying value of $100 per share, the investmentwould have gained 100%, which is a pre-tax compounded annual increase of 7.17%. Bycomparison, if a stock is purchased at 50% of underlying value of $100 per share, $50, and thatvalue increases at a 10% rate over 10 years to $259.37, and then the stock is sold at this value, thegain is 419%, a pre-tax compounded annual increase of 17.9%.
The difficult part of our work is predicting the future of specific companies with some degree ofrough accuracy. As Warren Buffett has said, “The investor of today does not profit from the growthof the past.” Expectations about the future are an inherent part of owning any business throughownership of its stock. The future will happen.
Our confidence in our own forecasting ability is tempered by both our own experiences and byempirical research. In our own experience, we can point to several companies in our portfolioswhose sales and earnings growth over the years have far exceeded our expectations. We boughtcheap, and were surprised to learn that we owned a growing business. We sometimes refer to this as“random growth”. We have also had some duds. Generally, future corporate performance has beenat about the level we had roughly expected.
Our empirical research indicates that observation of past sales and earnings trends and patterns,taken alone, without any input from qualitative information, is essentially useless in predictingfuture sales and earnings. A computer cannot take a company’s 10-year historical financial resultsor other historical financial numbers, and then, with the numbers alone, predict the futurefinancial results of a company over the next 10 years with any degree of accuracy. A computercannot understand why certain businesses are inherently more stable and predictable than others.It cannot weigh and assess qualitative information and explain why, for example, a newspaperbusiness in a town without a competing newspaper is likely to be a more stable business, withinherently better long-run earnings growth potential, than a copper mining business whose cost ofextracting copper from the ground is higher than its competitors. Simple, common sense qualitativeinsights like this are not rocket science, but they are key to making educated best guesses about thefuture value of a business.
In one of our empirical studies, we selected the most successful companies over a 10-year periodfrom 1980 to 1990, as measured by average return on equity, and then tracked the financial
40

performance of these companies over the subsequent 1990 through 1997 seven-year period. Thesehighly successful companies over the 1980 - 1990 period experienced, on average, significantdeterioration of financial results over the subsequent seven-year period, in a pattern that could bestbe described as “reversion to the mean.” We urge you to read our report, Great 10-Year Record =Great Future, Right? How Well Did Companies with Great 10-Year Records as of 12/31/90Perform in the Next 7 Years? A Study of the Predictability of Long-Term Earnings and IntrinsicValue Growth, which describes this study and several other studies of the predictability of futurefinancial results from past financial data and analysts’ forecasts. If you would like a copy of thisreport, kindly call us at 888-893-3395. This report is also available on our website,www.tweedy.com.
In our view, future sales and earnings, the financial numbers that drive intrinsic value in the longrun, can only be roughly predicted for certain companies in conjunction with qualitativeinformation gleaned from reading documents such as a company’s and its competitors’ annualreports, 10-Ks and proxy statements, and by asking questions of management, customers,competitors and other industry experts.
Qualitative information, the written and spoken words, illuminate and give meaning to the currentand prospective numbers. We encourage you to read 17 Standard Earnings Outlook/ValueQuestions Checklist “PUCCI”: “Pricing, Units, Costs, Competition and Insiders, which lists 17typical questions concerning the future of a business, and Buffett 101: Questions / ChecklistConcerning Assessing a Company’s Growth Prospects, Competitive Position and Economics.These checklists are included in Appendix C and Appendix D. Most of our work as investmentanalysts is gathering, assessing and weighing qualitative information that sheds light on a company’shistorical and prospective financial numbers. We attempt to gain some understanding of the natureof a company’s business and its competitive advantages/disadvantages and prospects. As BenjaminGraham states in Security Analysis, “Quantitative data are useful only to the extent that they aresupported by a qualitative survey of the enterprise.”
It is a bit of a paradox that so little has been written in various investment texts and periodicalsabout the qualitative side of investment research and analysis, when so much of most professionalinvestment analysts’ time is spent on it. If you read the Financial Analysts Journal, it’s mostlynumbers, numbers, numbers: Lots of big equations with Greek letters. We have never seen anythingthere about knowing Listerine.
In our view, Warren Buffett and Charles Munger are great teachers of qualitative investmentresearch. Here are some favorite quotes from Warren Buffett, and one favorite quote from CharlesMunger, concerning qualitative investment research:
“Do a lot of reading.”
41

“I read annual reports of the company I’m looking at and I read the annual reports of thecompetitors — that is the main source of material.”
“We don’t buy that many securities. But among the securities that we buy, we often havemade [our decision] just by reading annual reports — not by visiting management. Weusually do that afterwards. And some reports have been terribly helpful to us.”
Here is Warren Buffett’s description of his initial examination of GEICO: “I read a lot. I was overat the library ... I started with Best’s (insurance rating service) looking at a lot of companies,reading some books about it, reading annual reports, talking to (insurance specialists), talking tomanagements when I could.”
Robert Woodward, The Washington Post reporter, asked Warren Buffett how he analyzed stocks:
“Investing is reporting. I told him to imagine an in-depth article about his own paper. He’dask a lot of questions and dig up a lot of facts. He’d know The Washington Post. And that’sall there is to it.”
“You need a moat in business to protect you from the guy who is going to come along andoffer it (your product) for a penny cheaper.”
“If (you go into a store and) they say ‘I don’t have a Hershey bar, but I have this unmarkedchocolate bar that the owner of the place recommends,’ if you’ll walk across the street to buya Hershey bar or if you’ll pay a nickel more for the (Hershey) bar than the unmarked bar orsomething like that, that’s franchise value.”
“How much more fruitful it is for us to think about whether the product is likely to sustainitself and its economics than to try to be questioning whether to jump in and out of the stock.”
“If I’m thinking about investing in a specific company, I try to size up their business and thepeople running it. And as I read annual reports, I’m trying to understand generally what’sgoing on in all kinds of businesses. If we own stock in one company and there are eight othersin the industry, I want to be on the mailing list for the annual reports of the other eightbecause I can’t understand how my company is doing unless I understand what the othereight are doing. I want perspective on market share, margins, the trend in margins – allkinds of things…”
“It’s amazing how well you can do in investing with what I’d call “outside” information. I’mnot sure how useful inside information is. But there’s all kinds of “outside” informationaround as to businesses. And you don’t have to understand all of them. You just have to
42

understand the ones you’re thinking about investing in. And you can. But no one can do it foryou.”
“In my view, you can’t read Wall Street reports and get anything out of them. You’ve got toget your arms around it yourself. I don’t think we’ve ever gotten an idea from a Wall Streetreport. However, we’ve gotten a lot of ideas from annual reports. Charlie?”
Charles Munger:
“It takes a long time to read an annual report – even if the business is a comparativelysimple one. If you’re really trying to understand it, it’s not a bit easy.”
* Sources for the preceding quotations: Warren Buffett Speaks by Janet Lowe, and Outstanding Investor Digest.
Diversification and the Mathematical Magic of Skewness
“Diversification is a protection against ignorance” ....Warren Buffett
At Tweedy, Browne, we have some confidence in our ability to very roughly, very imprecisely,forecast, on average, the financial futures of the kinds of companies that we invest in, but notenough confidence to significantly concentrate our own net worth and clients’ net worth in only ahandful of stocks, as one of our heroes, Warren Buffett, has. It only seems prudent to concentrateheavily in a few stocks if: (1) you are very, very certain about their future growth prospects, (2) youare also very certain that those prospects are far better than those of most companies, and (3) theprice is right. If those three conditions are not met, we do not see the advantage of significantconcentration, which increases your risk of loss if only a few stocks perform poorly. Warren Buffettconcentrates when he is extremely certain. He would invest up to 40% of his investmentpartnership, Buffett Partnership Ltd. (where most of his personal wealth was invested), in onestock. We are never that certain. Things can sometimes very unexpectedly go wrong for even thebest thought out, most carefully analyzed and attractive appearing investments: Consider howpoorly Warren Buffett’s investment in World Book Inc. appears to have performed. Might it be ourluck that if we decided to invest, say, 40% of our net worth in one stock, it would turn out to be a“World Book”?
Some of Benjamin Graham’s cautious words in Security Analysis still resonate :
“Any estimate of earning power over future years may easily fall wide of the mark, since themajor factors of volume, price and cost are all largely unpredictable. Assuming that profits
43

develop as anticipated, there remains similar doubt as to whether the multiple, orcapitalization rate, will prove correctly chosen.”
“....it must be remembered that the normal economic forces militate against the indefinitecontinuance of a given trend. Competition, regulation, the law of diminishing returns, etc.,are powerful foes to unlimited expansion, and in smaller degrees, opposite elements mayoperate to check a continued decline. Hence, instead of taking the maintenance of apronounced trend for granted - as the stock market is often inclined to do - the analyst mustapproach the matter with caution, seeking to determine the causes of the superior showingand to weigh the specific elements of strength in the company’s position against the generalobstacles in the way of continued growth.”
At Tweedy, Browne, we like diversification. Not only does diversification have the potential toreduce risk, it also increases the probability, through the law of large numbers, that an investmentstrategy will work. In making educated best guesses about the future prospects of businesses thatare owned in portfolios managed by Tweedy, Browne, we believe it is more likely that our rough,approximate, future growth assessments will prove closer to the mark for a diversified portfolio asan aggregate whole than for any one stock that we own. Mistakes in assessing the prospects of anyone company, which are often referred to as “negative surprises”, are likely to be offset by the“positive surprise” of another company in a diversified portfolio.
Diversification also provides protection against the very human tendency, shared by investmentanalysts and portfolio managers (perhaps even at Tweedy, Browne), to overestimate one’s ownabilities and what one knows. Behavioral psychologists call this overconfidence. Behavioralpsychologists have many examples of overconfidence. In one study, an average of 68% of triallawyers (both plaintiff’s and defendant’s lawyers) in surveys before trial, believed that their sidewould win. Of course, only the plaintiff or the defendant can win; the losing lawyer suffered fromoverconfidence. The odds are 50-50. In another study, 90% of all drivers believe that their drivingability is above average. Most money managers believe that their portfolios can beat the S&P 500,yet very few have over any extended period of time. We have all heard stories about investors whobet most of their money on a “sure thing” and lost. Diversification is very forgiving.
Kenneth Fisher illustrated the investment return advantages of diversification in an article, Whythe Rich Get (relatively) Poorer that appeared in the October 14, 1996 issue of Forbes magazine:
“Rich Americans have, in general, been terrible investors. Compare the first, fifth and this,the fifteenth, annual editions of The Forbes Four Hundred. Initially it took $100 million tomake the bottom of The Forbes Four Hundred. Now it takes $415 million.
In theory, it shouldn’t have been all that hard to stay on The Four Hundred list. A person on
44

the bottom of the first list could have remained there to this day by simply compounding hiswealth at 10%. Seemingly not so difficult. After all, that is less than two-thirds of the S&P500’s 15.6% average annual return during the same period.
Yet how many of the original names remain on The Forbes Four Hundred? Precious few, evenallowing for deaths. Not one of the original ten richest remains in the top ten now. Folks likethe Hunt brothers and sisters, who have seen their assets stall or fall.
Of 1986’s top ten, only two remain there, John Kluge and Warren Buffett. Even the greatKluge, who has done far better than most of The Forbes Four Hundred, hasn’t kept pace withthe S&P 500 in the last ten years — 11.2% versus 13.8%.
Lester Crown in 1986 was number eight on the list, worth more than $1.3 billion. But he wasin real estate and is now worth only $2 billion - a compound ten-year return of only 4.4%.The names go on and on with similar results. The conclusion is inescapable. The super richhave done poorly as investors.
You can see this in any time period as long as it is fairly long. Recall that to remain low manon The Forbes Four Hundred totem pole for 15 years meant you didn’t keep up with themarket- you did less than two-thirds as well as the S&P 500. But the same was true for eachof the 5-year periods within those 15 years. In any of them the guy starting last on the list felloff if he did worse than 63% as well as the S&P 500 and rose nicely on the list if he beat themarket. Most folks fall.
You make big money in a business when it is hot; when it turns cold, you can’t just get out anddo something else.”
The super rich individuals in the Forbes 400 list tend to have their wealth concentrated in a few largeholdings. If those concentrated holdings are not performing well, there are not other holdings with“positive surprises” to offset the poor results of the concentrated holdings that have turned cold.
The S&P 500, which outdistanced the investment results of many of the Forbes 400 members, is adiversified portfolio of 500 stocks. A list of 500 issues is very likely to include some very largewinners whose investment results, mathematically, will overwhelm the investment results of stocksthat perform poorly. A poorly performing stock can lose, for example 50%, to as much as 100% ofits value, while the investment returns from a winner can be unlimited. The tendency of a relativelyfew winners to dominate the investment results of a portfolio comprised of many issues is referred toby mathematicians as “skewness.” According to Kenneth Fisher’s study, the lack of diversification,and lack of its companion advantage, skewness, caused the concentrated investors of the Forbes 400to have relatively poor investment results.
45

Here is an example of skewness :
Assume that (1) you invest a total of $100 in each of three stocks, or a total of $300, (2) you hold the three stocks for 20 years, (3) Stock A, the winner, compounds at 20% per year, (4) Stock B, an average stock, compounds at 10%, and(5) Stock C, the loser, loses 100% of its value
Here are the investment results :
20-Year Initial Value of Investment
Stock Investment Return Investment at the end of 20-Year Period
A 20% $100 $3,833.76
B 10% 100 672.75
C 100% decline 100 - 0 -
Total $300 $4,596.51
As you can see from this example, the investment returns of Stock A, the winner, whose 20% annualreturn resulted in a $100 initial investment becoming worth $3,833.76, propelled the overallinvestment results of the entire three-stock portfolio. The gain on this winner stock, $3,733.76, faroutdistanced the $100 loss of the loser stock.
By owning many stocks, not just a few, a diversified portfolio will tend to own some winners, which,through skewness, can greatly offset the effect of losers, and potentially enhance overall portfolioresults. The potentially risk-reducing and return-enhancing advantages of diversification and itssidekick, skewness, are another lesson provided by index funds, such as those based on the S&P 500, which outperformed 91% of all equity mutual funds over the 16-year period endedDecember 31, 1997.
Our empirical research, described in our report, Great 10-Year Record = Great Future, Right?How Well Did Companies with Great 10-Year Records as of 12/31/90 Perform in the Next 7Years? A Study of the Predictability of Long-Term Earnings and Intrinsic Value Growth, whichwe urge you to read, indicates that historical financial information, such as a company’s incomestatement record over the last 10 years, or its average return on equity over the last 10 years, isuseless as a predictor of earnings growth over the next seven years. According to our studies,earnings growth is random across all companies in relation to past financial results. Pick 50companies with great historical track records, and 50 companies with lousy track records, and 50companies with average records, and the future average earnings growth rates of each group islikely to be similar. That is what the empirical data suggests.
46

JUST IN CASE
If, despite all of our own best efforts, through extensive qualitative research, to emphasize andselect cheap stocks with above-average earnings growth prospects, we find that earnings growthreally has turned out to be random for our own holdings as well (which, thankfully, has not beenour experience in the past), then the diversification and skewness of our portfolios provide us withsome assurance that, hopefully, we will have at least our share of the future random earningsgrowth. And our emphasis on stocks with extreme characteristics in terms of cheapness — stocksthat are typically cheaper than 80% to 90% of all public companies when ranked on ratios of price-to-earnings, price-to-book value, price-to-sales, or price-to-estimated-acquisition value (and oftenpossessing other cheapness clues, such as insider buying and buybacks of the company’s ownshares) — would enable us to obtain this random earnings growth at a cheap price.
If earnings growth is, in fact, random across all companies, then a diverse group of cheap stockspossesses, in effect, a free option on its share of random future earnings growth. In contrast, with adiverse group of expensive stocks, excellent future earnings growth (not random future earningsgrowth) is expected, and reflected in the stocks’ prices. The empirical data concerning historicalfinancial information suggests that the excellent future earnings growth that is implied by anexcellent corporate track record, and, hence, expected, will actually turn out to be average, notexcellent. The shift from excellent to average financial results, which is unexpected, disappointsinvestors, and has often led to poor investment results for expensive stocks as a group.
Of course, we do not believe at all that future earnings growth is entirely random and unpredictablefor every company when the information that is available includes qualitative information, not justnumbers. You do not have to be a genius to know that Coca-Cola Company has much better growthprospects than a producer of lead additives for gasoline. We have made many qualitativedistinctions between companies in the past that have turned out to be roughly accurate, on average.We hope to be approximately right, not precisely wrong.
In support of diversification, we also note that The Magellan Fund, which was the best performingmutual fund in the United States under Peter Lynch’s tenure, owned over 1,000 issues. MutualShares, under Michael Price’s management, owned over 200 issues. The S&P 500 is comprised of500 issues, and only 9% of equity mutual funds were able to beat it over the 16-year period endedDecember 31, 1997. Diversification and excellent investment returns can go hand in hand. It is amyth that diversification necessarily causes a portfolio’s investment results to be just average.Portfolios managed by Tweedy, Browne, which have added value above index returns over the last25 years, have always been diversified. We know concentrators and diversifiers who have hadexcellent investment results. As Warren Buffett has said “Happily, there’s more than one way to getto financial heaven.”
47

At Tweedy, Browne, we generally invest, at cost, no more than 3% to 4% of a portfolio in one stock.Each of the Managing Directors has nearly his entire liquid net worth in portfolios managed byTweedy, Browne, and we think in terms of investing 3% to 4% of our liquid net worths, or clients’net worths, in one stock. Many of our clients have nearly all of their net worths invested inportfolios that we manage.
With appreciation, certain investments have occasionally represented 6% to 8% of long-standingclients’ portfolios. To our surprise, one investment consultant has described Tweedy, Browne as aconcentrated investor. According to John Bogle, former Senior Chairman and Founder of VanguardFunds, the largest ten holdings of most mutual funds do not normally total more than 10% of themarket value of the particular fund. By this yardstick, portfolios at Tweedy, Browne do tend to bemore concentrated than average.
A middle ground between extreme concentration, which requires extreme certainty about the fewinvestments that are made, and the extreme diversification of an index fund with 500 issues, which,in essence, assumes that a thinking, enterprising investor cannot gain any benefit from insightsabout a company’s valuation and future prospects, seems about right to us.
An example of skewness and unplanned, accidental concentration
Ironically, truthfulness requires us to admit that the Managing Directors of Tweedy, Browne had,and, following a partial sale of their holdings, continue to have, a significant interest in onebusiness, Tweedy, Browne Company LLC, which, through sustained earnings growth over the years,has become a very large portion of their personal net worths – far larger than any other holding.Their best performing stock, Tweedy, Browne Company LLC, grew somewhat unexpectedly tobecome a very large holding. It was unplanned, fortuitous, accidental concentration resulting froma large gain, not a well thought out decision to concentrate. It brings to mind the words “I’d ratherbe lucky than smart.”
—————— • ——————
For our own money and our clients’ money, we like the portfolio concentration that comes fromlarge, long-run, tax-deferred gains. Becoming concentrated (and rich) from long-run winners is thekind of high-class problem that we seek for all portfolios managed by Tweedy, Browne.
Our Advice to You
We urge you to invest with a value approach, where we think you will have a pretty good chance ofbeating the Index, both before and after taxes, over a long period. With about $400 million of ourown money that we have accumulated, and with our clients’ money, we plan to stick with the value
48

approach that we have practiced for more than 20 years. It makes sense to us and has worked wellon average.
This report has attempted to describe what we have learned about investing for higher after-taxreturns, and how we plan to seek higher after-tax returns for our own money and clients’ money inthe future. We are grateful to Warren Buffett and Charles Munger for sharing their knowledge sofreely over the years, and for being such good teachers, just as we are incredibly grateful for whatwe have learned from Benjamin Graham. How many other Forbes 400 members have attempted toshare what they have learned about business and investing? Warren Buffett and Charles Mungerare truly amazing.
For a more complete understanding of our strategy and practice of value investing, we encourageyou to read our two booklets. (1) What Has Worked In Investing, which describes more than 40independent studies, primarily from academia, of investment characteristics that have beenassociated with exceptional investment returns in stock markets throughout the world, and (2) 10Ways to Beat An Index: How Tweedy, Browne Strives to Provide Value Above the Index Return.We also encourage you to read the current and back copies of the shareholder reports for our twomutual funds, Tweedy, Browne Global Value Fund and Tweedy, Browne American Value Fund. Allof the above material is available on the Tweedy, Browne website, www.tweedy.com, or we would bedelighted to send it to you or a friend. Just call 888-893-3395 if you would like to receive any of thisinformation.
If you think our strategy and practice of value investing are right for you, then we invite andwelcome your business as a client through our two mutual funds or a similarly managed privateaccount. We hope this report has been useful to you, and wish you many happy returns.
49
Copyright 2000 Tweedy, Browne Company LLC

APPENDIX AASSUMPTIONS
Yearly Return: 20%
Turnover Rate: 0%
Federal and State Income Taxes: 27%
Years: 20
CASE 1
AFTER-TAX RETURN ON STOCKS
Ending Pre-tax
Beg. Market Beg. Realized Capital Ending Ending
Market Value Tax Pre-Tax Capital Gains NAT Tax Market
Year Value (pre-tax) Cost Gain Gains Tax Gain Cost Value
1 100.00 120.00 100.00 20.00 0.00 0.00 0.00 100.00 120.00
2 120.00 144.00 100.00 44.00 0.00 0.00 0.00 100.00 144.00
3 144.00 172.80 100.00 72.80 0.00 0.00 0.00 100.00 172.80
4 172.80 207.36 100.00 107.36 0.00 0.00 0.00 100.00 207.36
5 207.36 248.83 100.00 148.83 0.00 0.00 0.00 100.00 248.83
6 248.83 298.60 100.00 198.60 0.00 0.00 0.00 100.00 298.60
7 298.60 358.32 100.00 258.32 0.00 0.00 0.00 100.00 358.32
8 358.32 429.98 100.00 329.98 0.00 0.00 0.00 100.00 429.98
9 429.98 515.98 100.00 415.98 0.00 0.00 0.00 100.00 515.98
10 515.98 619.17 100.00 519.17 0.00 0.00 0.00 100.00 619.17
11 619.17 743.01 100.00 643.01 0.00 0.00 0.00 100.00 743.01
12 743.01 891.61 100.00 791.61 0.00 0.00 0.00 100.00 891.61
13 891.61 1069.93 100.00 969.93 0.00 0.00 0.00 100.00 1069.93
14 1069.93 1283.92 100.00 1183.92 0.00 0.00 0.00 100.00 1283.92
15 1283.92 1540.70 100.00 1440.70 0.00 0.00 0.00 100.00 1540.70
16 1540.70 1848.84 100.00 1748.84 0.00 0.00 0.00 100.00 1848.84
17 1848.84 2218.61 100.00 2118.61 0.00 0.00 0.00 100.00 2218.61
18 2218.61 2662.33 100.00 2562.33 0.00 0.00 0.00 100.00 2662.33
19 2662.33 3194.80 100.00 3094.80 0.00 0.00 0.00 100.00 3194.80
20 3194.80 3833.76 100.00 3733.76 0.00 0.00 0.00 100.00 3833.76
50

APPENDIX AASSUMPTIONS
Yearly Return: 20%
Turnover Rate: 3%
Federal and State Income Taxes: 27%
Years: 20
CASE 2
AFTER-TAX RETURN ON STOCKS
Ending Pre-tax
Beg. Market Beg. Realized Capital Ending Ending
Market Value Tax Pre-Tax Capital Gains NAT Tax Market
Year Value (pre-tax) Cost Gain Gains Tax Gain Cost Value
1 100.00 120.00 100.00 20.00 0.60 0.16 0.44 100.44 119.84
2 119.84 143.81 100.44 43.37 1.30 0.35 0.95 101.39 143.45
3 143.45 172.15 101.39 70.76 2.12 0.57 1.55 102.94 171.57
4 171.57 205.89 102.94 102.95 3.09 0.83 2.25 105.19 205.05
5 205.05 246.06 105.19 140.87 4.23 1.14 3.09 108.28 244.92
6 244.92 293.91 108.28 185.63 5.57 1.50 4.07 112.34 292.40
7 292.40 350.88 112.34 238.54 7.16 1.93 5.22 117.57 348.95
8 348.95 418.74 117.57 301.18 9.04 2.44 6.60 124.16 416.30
9 416.30 499.56 124.16 375.40 11.26 3.04 8.22 132.38 496.52
10 496.52 595.83 132.38 463.44 13.90 3.75 10.15 142.53 592.07
11 592.07 710.49 142.53 567.95 17.04 4.60 12.44 154.97 705.89
12 705.89 847.06 154.97 692.09 20.76 5.61 15.16 170.13 841.46
13 841.46 1009.75 170.13 839.62 25.19 6.80 18.39 188.52 1002.95
14 1002.95 1203.54 188.52 1015.02 30.45 8.22 22.23 210.74 1195.32
15 1195.32 1434.38 210.74 1223.63 36.71 9.91 26.80 237.54 1424.47
16 1424.47 1709.36 237.54 1471.82 44.15 11.92 32.23 269.77 1697.44
17 1697.44 2036.93 269.77 1767.15 53.01 14.31 38.70 308.48 2022.61
18 2022.61 2427.14 308.48 2118.66 63.56 17.16 46.40 354.87 2409.97
19 2409.97 2891.97 354.87 2537.10 76.11 20.55 55.56 410.44 2871.42
20 2871.42 3445.70 410.44 3035.27 91.06 24.59 66.47 476.91 3421.12
51

APPENDIX AASSUMPTIONS
Yearly Return: 20%
Turnover Rate: 10%
Federal and State Income Taxes: 27%
Years: 20
CASE 3
AFTER-TAX RETURN ON STOCKS
Ending Pre-tax
Beg. Market Beg. Realized Capital Ending Ending
Market Value Tax Pre-Tax Capital Gains NAT Tax Market
Year Value (pre-tax) Cost Gain Gains Tax Gain Cost Value
1 100.00 120.00 100.00 20.00 2.00 0.54 1.46 101.46 119.46
2 119.46 143.35 101.46 41.89 4.19 1.13 3.06 104.52 142.22
3 142.22 170.67 104.52 66.15 6.61 1.79 4.83 109.35 168.88
4 168.88 202.65 109.35 93.31 9.33 2.52 6.81 116.16 200.14
5 200.14 240.16 116.16 124.00 12.40 3.35 9.05 125.21 236.81
6 236.81 284.18 125.21 158.97 15.90 4.29 11.60 136.82 279.89
7 279.89 335.86 136.82 199.05 19.90 5.37 14.53 151.35 330.49
8 330.49 396.59 151.35 245.24 24.52 6.62 17.90 169.25 389.96
9 389.96 467.96 169.25 298.71 29.87 8.07 21.81 191.05 459.89
10 459.89 551.87 191.05 360.82 36.08 9.74 26.34 217.39 542.13
11 542.13 650.55 217.39 433.16 43.32 11.70 31.62 249.01 638.86
12 638.86 766.63 249.01 517.62 51.76 13.98 37.79 286.80 752.66
13 752.66 903.19 286.80 616.39 61.64 16.64 45.00 331.80 886.54
14 886.54 1063.85 331.80 732.06 73.21 19.77 53.44 385.24 1044.09
15 1044.09 1252.90 385.24 867.67 86.77 23.43 63.34 448.58 1229.48
16 1229.48 1475.37 448.58 1026.80 102.68 27.72 74.96 523.53 1447.65
17 1447.65 1737.18 523.53 1213.65 121.36 32.77 88.60 612.13 1704.41
18 1704.41 2045.29 612.13 1433.16 143.32 38.70 104.62 716.75 2006.60
19 2006.60 2407.92 716.75 1691.17 199.45 45.66 123.46 840.20 2362.26
20 2362.26 2834.71 840.20 1994.50 169.12 53.85 145.60 985.80 2780.85
52
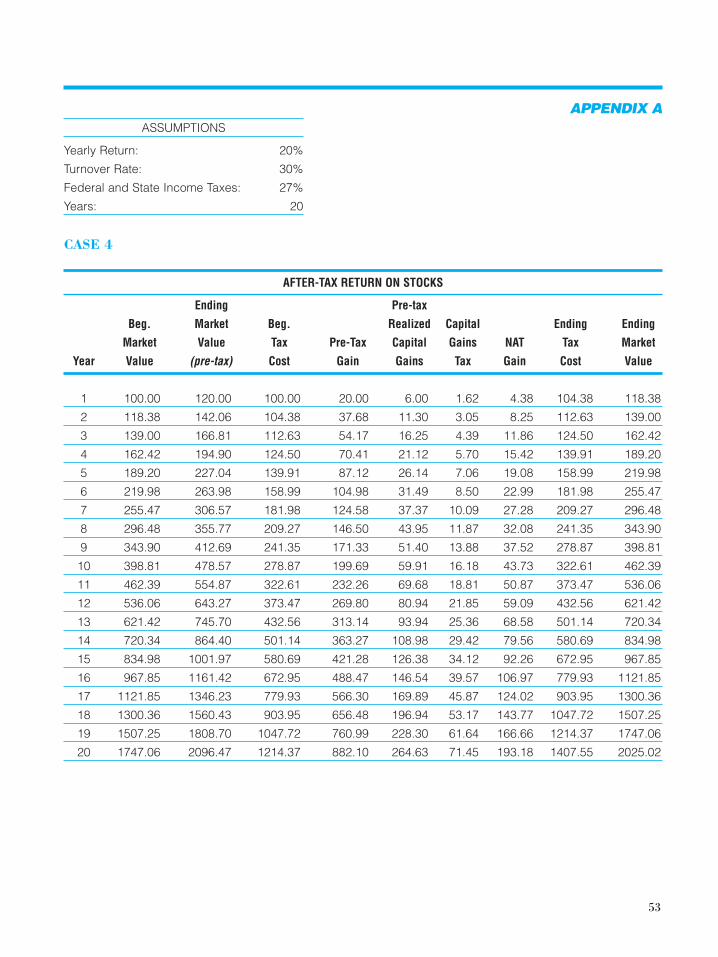
APPENDIX AASSUMPTIONS
Yearly Return: 20%
Turnover Rate: 30%
Federal and State Income Taxes: 27%
Years: 20
CASE 4
AFTER-TAX RETURN ON STOCKS
Ending Pre-tax
Beg. Market Beg. Realized Capital Ending Ending
Market Value Tax Pre-Tax Capital Gains NAT Tax Market
Year Value (pre-tax) Cost Gain Gains Tax Gain Cost Value
1 100.00 120.00 100.00 20.00 6.00 1.62 4.38 104.38 118.38
2 118.38 142.06 104.38 37.68 11.30 3.05 8.25 112.63 139.00
3 139.00 166.81 112.63 54.17 16.25 4.39 11.86 124.50 162.42
4 162.42 194.90 124.50 70.41 21.12 5.70 15.42 139.91 189.20
5 189.20 227.04 139.91 87.12 26.14 7.06 19.08 158.99 219.98
6 219.98 263.98 158.99 104.98 31.49 8.50 22.99 181.98 255.47
7 255.47 306.57 181.98 124.58 37.37 10.09 27.28 209.27 296.48
8 296.48 355.77 209.27 146.50 43.95 11.87 32.08 241.35 343.90
9 343.90 412.69 241.35 171.33 51.40 13.88 37.52 278.87 398.81
10 398.81 478.57 278.87 199.69 59.91 16.18 43.73 322.61 462.39
11 462.39 554.87 322.61 232.26 69.68 18.81 50.87 373.47 536.06
12 536.06 643.27 373.47 269.80 80.94 21.85 59.09 432.56 621.42
13 621.42 745.70 432.56 313.14 93.94 25.36 68.58 501.14 720.34
14 720.34 864.40 501.14 363.27 108.98 29.42 79.56 580.69 834.98
15 834.98 1001.97 580.69 421.28 126.38 34.12 92.26 672.95 967.85
16 967.85 1161.42 672.95 488.47 146.54 39.57 106.97 779.93 1121.85
17 1121.85 1346.23 779.93 566.30 169.89 45.87 124.02 903.95 1300.36
18 1300.36 1560.43 903.95 656.48 196.94 53.17 143.77 1047.72 1507.25
19 1507.25 1808.70 1047.72 760.99 228.30 61.64 166.66 1214.37 1747.06
20 1747.06 2096.47 1214.37 882.10 264.63 71.45 193.18 1407.55 2025.02
53

APPENDIX AASSUMPTIONS
Yearly Return: 20%
Turnover Rate: 85%
Federal and State Income Taxes: 27%
Years: 20
CASE 5
AFTER-TAX RETURN ON STOCKS
Ending Pre-tax
Beg. Market Beg. Realized Capital Ending Ending
Market Value Tax Pre-Tax Capital Gains NAT Tax Market
Year Value (pre-tax) Cost Gain Gains Tax Gain Cost Value
1 100.00 120.00 100.00 20.00 17.00 4.59 12.41 112.41 115.41
2 115.41 138.49 112.41 26.08 22.17 5.99 16.18 128.59 132.51
3 132.51 159.01 128.59 30.41 25.85 6.98 18.87 147.47 152.03
4 152.03 182.43 147.47 34.97 29.72 8.03 21.70 169.16 174.41
5 174.41 209.29 169.16 40.13 34.11 9.21 24.90 194.06 200.08
6 200.08 240.10 194.06 46.04 39.13 10.57 28.56 222.63 229.53
7 229.53 275.44 222.63 52.81 44.89 12.12 32.77 255.40 263.32
8 263.32 315.98 255.40 60.59 51.50 13.90 37.59 292.99 302.08
9 302.08 362.49 292.99 69.50 59.08 15.95 43.13 336.12 346.54
10 346.54 415.85 336.12 79.73 67.77 18.30 49.47 385.59 397.55
11 397.55 477.06 385.59 91.47 77.75 20.99 56.76 442.35 456.07
12 456.07 547.28 442.35 104.93 89.19 24.08 65.11 507.46 523.20
13 523.20 627.84 507.46 120.38 102.32 27.63 74.70 582.16 600.21
14 600.21 720.25 582.16 138.10 117.38 31.69 85.69 667.85 688.56
15 688.56 826.27 667.85 158.43 134.66 36.36 98.30 766.15 789.91
16 789.91 947.90 766.15 181.75 154.48 41.71 112.77 878.92 906.19
17 906.19 1087.42 878.92 208.50 177.22 47.85 129.37 1008.30 1039.57
18 1039.57 1247.49 1008.30 239.19 203.31 54.89 148.42 1156.71 1192.59
19 1192.59 1431.11 1156.71 274.40 233.24 62.97 170.26 1326.98 1368.14
20 1368.14 1641.76 1326.98 314.79 267.57 72.24 195.33 1522.30 1569.52
54

APPENDIX AASSUMPTIONS
Yearly Return: 20%
Turnover Rate: 100%
Federal and State Income Taxes: 27%
Years: 20
CASE 6
AFTER-TAX RETURN ON STOCKS
Ending Pre-tax
Beg. Market Beg. Realized Capital Ending Ending
Market Value Tax Pre-Tax Capital Gains NAT Tax Market
Year Value (pre-tax) Cost Gain Gains Tax Gain Cost Value
1 100.00 120.00 100.00 20.00 20.00 5.40 14.60 114.60 114.60
2 114.60 137.52 114.60 22.92 22.92 6.19 16.73 131.33 131.33
3 131.33 157.60 131.33 26.27 26.27 7.09 19.17 150.51 150.51
4 150.51 180.61 150.51 30.10 30.10 8.13 21.97 172.48 172.48
5 172.48 237.19 172.48 34.50 34.50 9.31 25.18 197.66 197.66
6 197.66 271.82 197.66 39.53 39.53 10.67 28.86 226.52 226.52
7 226.52 237.19 226.52 45.30 45.30 12.23 33.07 259.59 259.59
8 259.59 311.51 259.59 51.92 51.92 14.02 37.90 297.49 297.49
9 297.49 356.99 297.49 59.50 59.50 16.06 43.43 340.93 340.93
10 340.93 409.11 340.93 68.19 68.19 18.41 49.78 390.70 390.70
11 390.70 468.84 390.70 78.14 78.14 21.10 57.04 447.75 447.75
12 447.75 537.29 447.75 89.55 89.55 24.18 65.37 513.12 513.12
13 513.12 615.74 513.12 102.62 102.62 27.71 74.91 588.03 588.03
14 588.03 705.64 588.03 117.61 117.61 31.75 85.85 673.88 673.88
15 673.88 808.66 673.88 134.78 134.78 36.39 98.39 772.27 772.27
16 772.27 926.72 772.27 154.45 154.45 41.70 112.75 885.02 885.02
17 885.02 1062.03 885.02 177.00 177.00 47.79 129.21 1014.23 1014.23
18 1014.23 1217.08 1014.23 202.85 202.85 54.77 148.08 1162.31 1162.31
19 1162.31 1394.78 1162.31 232.46 232.46 62.76 169.70 1332.01 1332.01
20 1332.01 1598.41 1332.01 266.40 266.40 71.93 194.47 1526.48 1526.48
55

APPENDIX AASSUMPTIONS
Yearly Return: 15%
Turnover Rate: 0%
Federal and State Income Taxes: 27%
Years: 20
CASE 7
AFTER-TAX RETURN ON STOCKS
Ending Pre-tax
Beg. Market Beg. Realized Capital Ending Ending
Market Value Tax Pre-Tax Capital Gains NAT Tax Market
Year Value (pre-tax) Cost Gain Gains Tax Gain Cost Value
1 100.00 115.00 100.00 15.00 0.00 0.00 0.00 100.00 115.00
2 115.00 132.25 100.00 32.25 0.00 0.00 0.00 100.00 132.25
3 132.25 152.09 100.00 52.09 0.00 0.00 0.00 100.00 152.09
4 152.09 174.90 100.00 74.90 0.00 0.00 0.00 100.00 174.90
5 174.90 201.14 100.00 101.14 0.00 0.00 0.00 100.00 201.14
6 201.14 231.31 100.00 131.31 0.00 0.00 0.00 100.00 231.31
7 231.31 266.00 100.00 166.00 0.00 0.00 0.00 100.00 266.00
8 266.00 305.90 100.00 205.90 0.00 0.00 0.00 100.00 305.90
9 305.90 351.79 100.00 251.79 0.00 0.00 0.00 100.00 351.79
10 351.79 404.56 100.00 304.56 0.00 0.00 0.00 100.00 404.56
11 404.56 465.24 100.00 365.24 0.00 0.00 0.00 100.00 465.24
12 465.24 535.03 100.00 435.03 0.00 0.00 0.00 100.00 535.03
13 535.03 615.28 100.00 515.28 0.00 0.00 0.00 100.00 615.28
14 615.28 707.57 100.00 607.57 0.00 0.00 0.00 100.00 707.57
15 707.57 813.71 100.00 713.71 0.00 0.00 0.00 100.00 813.71
16 813.71 935.76 100.00 835.76 0.00 0.00 0.00 100.00 935.76
17 935.76 1076.13 100.00 976.13 0.00 0.00 0.00 100.00 1076.13
18 1076.13 1237.55 100.00 1137.55 0.00 0.00 0.00 100.00 1237.55
19 1237.55 1423.18 100.00 1323.18 0.00 0.00 0.00 100.00 1423.18
20 1423.18 1636.65 100.00 1536.65 0.00 0.00 0.00 100.00 1636.65
56

APPENDIX AASSUMPTIONS
Yearly Return: 15%
Turnover Rate: 3%
Federal and State Income Taxes: 27%
Years: 20
CASE 8
AFTER-TAX RETURN ON STOCKS
Ending Pre-tax
Beg. Market Beg. Realized Capital Ending Ending
Market Value Tax Pre-Tax Capital Gains NAT Tax Market
Year Value (pre-tax) Cost Gain Gains Tax Gain Cost Value
1 100.00 115.00 100.00 15.00 0.45 0.12 0.33 100.33 114.88
2 114.88 132.11 100.33 31.78 0.95 0.26 0.70 101.02 131.85
3 131.85 151.63 101.02 50.61 1.52 0.41 1.11 102.13 151.22
4 151.22 173.90 102.13 71.77 2.15 0.58 1.57 103.70 173.32
5 173.32 199.32 103.70 95.62 2.87 0.77 2.09 105.80 198.55
6 198.55 228.33 105.80 122.53 3.68 0.99 2.68 108.48 227.34
7 227.34 261.44 108.48 152.95 4.59 1.24 3.35 111.83 260.20
8 260.20 299.23 111.83 187.40 5.62 1.52 4.10 115.94 297.71
9 297.71 342.37 115.94 226.43 6.79 1.83 4.96 120.89 340.53
10 340.53 391.61 120.89 270.72 8.12 2.19 5.93 126.82 389.42
11 389.42 447.83 126.82 321.01 9.63 2.60 7.03 133.85 445.23
12 445.23 512.02 133.85 378.16 11.34 3.06 8.28 142.14 508.95
13 508.95 585.30 142.14 443.16 13.29 3.59 9.71 151.84 581.71
14 581.71 668.96 151.84 517.12 15.51 4.19 11.32 163.17 664.77
15 664.77 764.49 163.17 601.32 18.04 4.87 13.17 176.33 759.62
16 759.62 873.56 176.33 697.23 20.92 5.65 15.27 191.60 867.91
17 867.91 998.10 191.60 806.50 24.19 6.53 17.66 209.27 991.57
18 991.57 1140.30 209.27 931.04 27.93 7.54 20.39 229.66 1132.76
19 1132.76 1302.68 229.66 1073.02 32.19 8.69 23.50 253.15 1293.98
20 1293.98 1488.08 253.15 1234.93 37.05 10.00 27.04 280.20 1478.08
57
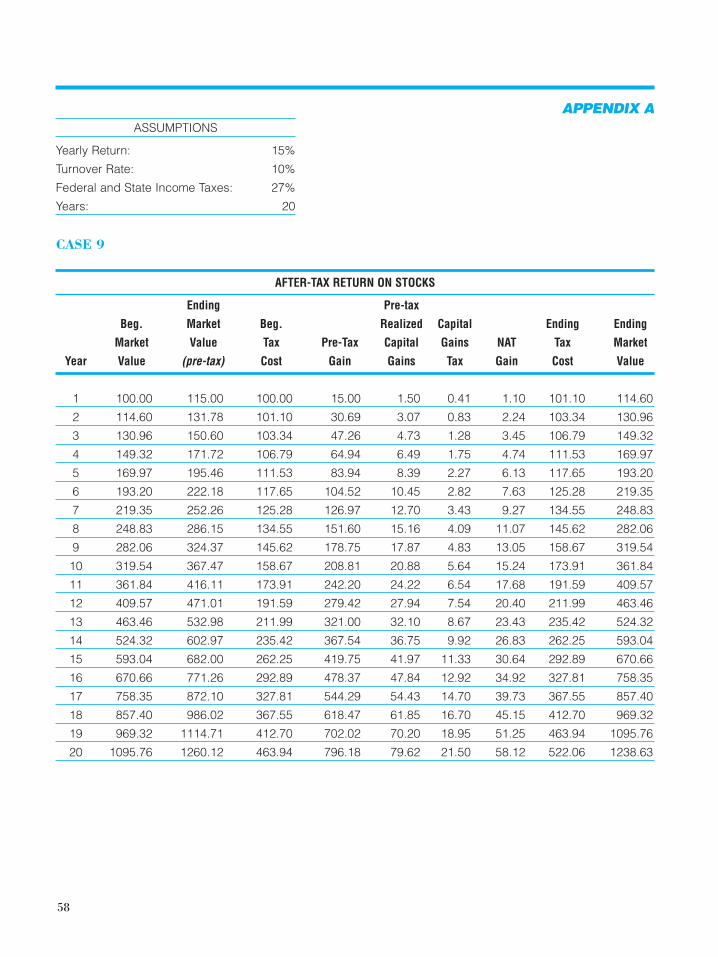
APPENDIX AASSUMPTIONS
Yearly Return: 15%
Turnover Rate: 10%
Federal and State Income Taxes: 27%
Years: 20
CASE 9
AFTER-TAX RETURN ON STOCKS
Ending Pre-tax
Beg. Market Beg. Realized Capital Ending Ending
Market Value Tax Pre-Tax Capital Gains NAT Tax Market
Year Value (pre-tax) Cost Gain Gains Tax Gain Cost Value
1 100.00 115.00 100.00 15.00 1.50 0.41 1.10 101.10 114.60
2 114.60 131.78 101.10 30.69 3.07 0.83 2.24 103.34 130.96
3 130.96 150.60 103.34 47.26 4.73 1.28 3.45 106.79 149.32
4 149.32 171.72 106.79 64.94 6.49 1.75 4.74 111.53 169.97
5 169.97 195.46 111.53 83.94 8.39 2.27 6.13 117.65 193.20
6 193.20 222.18 117.65 104.52 10.45 2.82 7.63 125.28 219.35
7 219.35 252.26 125.28 126.97 12.70 3.43 9.27 134.55 248.83
8 248.83 286.15 134.55 151.60 15.16 4.09 11.07 145.62 282.06
9 282.06 324.37 145.62 178.75 17.87 4.83 13.05 158.67 319.54
10 319.54 367.47 158.67 208.81 20.88 5.64 15.24 173.91 361.84
11 361.84 416.11 173.91 242.20 24.22 6.54 17.68 191.59 409.57
12 409.57 471.01 191.59 279.42 27.94 7.54 20.40 211.99 463.46
13 463.46 532.98 211.99 321.00 32.10 8.67 23.43 235.42 524.32
14 524.32 602.97 235.42 367.54 36.75 9.92 26.83 262.25 593.04
15 593.04 682.00 262.25 419.75 41.97 11.33 30.64 292.89 670.66
16 670.66 771.26 292.89 478.37 47.84 12.92 34.92 327.81 758.35
17 758.35 872.10 327.81 544.29 54.43 14.70 39.73 367.55 857.40
18 857.40 986.02 367.55 618.47 61.85 16.70 45.15 412.70 969.32
19 969.32 1114.71 412.70 702.02 70.20 18.95 51.25 463.94 1095.76
20 1095.76 1260.12 463.94 796.18 79.62 21.50 58.12 522.06 1238.63
58

APPENDIX AASSUMPTIONS
Yearly Return: 15%
Turnover Rate: 30%
Federal and State Income Taxes: 27%
Years: 20
CASE 10
AFTER-TAX RETURN ON STOCKS
Ending Pre-tax
Beg. Market Beg. Realized Capital Ending Ending
Market Value Tax Pre-Tax Capital Gains NAT Tax Market
Year Value (pre-tax) Cost Gain Gains Tax Gain Cost Value
1 100.00 115.00 100.00 15.00 4.50 1.22 3.29 103.29 113.79
2 113.79 130.85 103.29 27.57 8.27 2.23 6.04 109.32 128.62
3 128.62 147.91 109.32 38.59 11.58 3.13 8.45 117.77 144.79
4 144.79 166.50 117.77 48.73 14.62 3.95 10.67 128.45 162.56
5 162.56 186.94 128.45 58.50 17.55 4.74 12.81 141.26 182.20
6 182.20 209.53 141.26 68.28 20.48 5.53 14.95 156.21 204.00
7 204.00 234.60 156.21 78.39 23.52 6.35 17.17 173.38 228.25
8 228.25 262.49 173.38 89.11 26.73 7.22 19.52 192.89 255.27
9 255.27 293.56 192.89 100.67 30.20 8.15 22.05 214.94 285.41
10 285.41 328.22 214.94 113.28 33.98 9.18 24.81 239.75 319.05
11 319.05 366.90 239.75 127.15 38.15 10.30 27.85 267.60 356.60
12 356.60 410.09 267.60 142.50 42.75 11.54 31.21 298.80 398.55
13 398.55 458.33 298.80 159.53 47.86 12.92 34.94 333.74 445.41
14 445.41 512.22 333.74 178.48 53.55 14.46 39.09 372.83 497.77
15 497.77 572.43 372.83 199.60 59.88 16.17 43.71 416.54 556.26
16 556.26 639.70 416.54 223.16 66.95 18.08 48.87 465.41 621.63
17 621.63 714.87 465.41 249.46 74.84 20.21 54.63 520.05 694.67
18 694.67 798.87 520.05 278.82 83.65 22.58 61.06 581.11 776.28
19 776.28 892.72 581.11 311.62 93.48 25.24 68.24 649.35 867.48
20 867.48 997.60 649.35 348.25 104.48 28.21 76.27 725.62 969.40
59

APPENDIX AASSUMPTIONS
Yearly Return: 15%
Turnover Rate: 85%
Federal and State Income Taxes: 27%
Years: 20
CASE 11
AFTER-TAX RETURN ON STOCKS
Ending Pre-tax
Beg. Market Beg. Realized Capital Ending Ending
Market Value Tax Pre-Tax Capital Gains NAT Tax Market
Year Value (pre-tax) Cost Gain Gains Tax Gain Cost Value
1 100.00 115.00 100.00 15.00 12.75 3.44 9.31 109.31 111.56
2 111.56 128.29 109.31 18.98 16.14 4.36 11.78 121.09 123.93
3 123.93 142.52 121.09 21.44 18.22 4.92 13.30 134.39 137.60
4 137.60 158.25 134.39 23.86 20.28 5.48 14.80 149.19 152.77
5 152.77 175.69 149.19 26.49 22.52 6.08 16.44 165.63 169.61
6 169.61 195.05 165.63 29.41 25.00 6.75 18.25 183.88 188.30
7 188.30 216.54 183.88 32.66 27.76 7.49 20.26 204.15 209.05
8 209.05 240.40 204.15 36.26 30.82 8.32 22.50 226.64 232.08
9 232.08 266.89 226.64 40.25 34.21 9.24 24.98 251.62 257.66
10 257.66 296.30 251.62 44.69 37.98 10.26 27.73 279.35 286.05
11 286.05 328.96 279.35 49.61 42.17 11.39 30.78 310.13 317.57
12 317.57 365.21 310.13 55.08 46.82 12.64 34.18 344.30 352.57
13 352.57 405.45 344.30 61.15 51.97 14.03 37.94 382.25 391.42
14 391.42 450.13 382.25 67.88 57.70 15.58 42.12 424.37 434.55
15 434.55 499.73 424.37 75.37 64.06 17.30 46.76 471.13 482.44
16 482.44 554.80 471.13 83.67 71.12 19.20 51.92 523.05 535.60
17 535.60 615.94 523.05 92.89 78.96 21.32 57.64 580.69 594.62
18 594.62 683.82 580.69 103.13 87.66 23.67 63.99 644.68 660.15
19 660.15 759.17 644.68 114.49 97.32 26.28 71.04 715.72 732.89
20 732.89 842.83 715.72 127.11 108.04 29.17 78.87 794.59 813.66
60

APPENDIX AASSUMPTIONS
Yearly Return: 15%
Turnover Rate: 100%
Federal and State Income Taxes: 27%
Years: 20
CASE 12
AFTER-TAX RETURN ON STOCKS
Ending Pre-tax
Beg. Market Beg. Realized Capital Ending Ending
Market Value Tax Pre-Tax Capital Gains NAT Tax Market
Year Value (pre-tax) Cost Gain Gains Tax Gain Cost Value
1 100.00 115.00 100.00 15.00 15.00 4.05 10.95 110.95 110.95
2 110.95 127.59 110.95 16.64 16.64 4.49 12.15 123.10 123.10
3 123.10 141.56 123.10 18.46 18.46 4.99 13.48 136.58 136.58
4 136.58 157.07 136.58 20.49 20.49 5.53 14.96 151.53 151.53
5 151.53 174.26 151.53 22.73 22.73 6.14 16.59 168.13 168.13
6 168.13 193.35 168.13 25.22 25.22 6.81 18.41 186.54 186.54
7 186.54 214.52 186.54 27.98 27.98 7.55 20.43 206.96 206.96
8 206.96 238.01 206.96 31.04 31.04 8.38 22.66 229.62 229.62
9 229.62 264.07 229.62 34.44 34.44 9.30 25.14 254.77 254.77
10 254.77 292.98 254.77 38.22 38.22 10.32 27.90 282.67 282.67
11 282.67 325.07 282.67 42.40 42.40 11.45 30.95 313.62 313.62
12 313.62 360.66 313.62 47.04 47.04 12.70 34.34 347.96 347.96
13 347.96 400.15 347.96 52.19 52.19 14.09 38.10 386.06 386.06
14 386.06 443.97 386.06 57.91 57.91 15.64 42.27 428.33 428.33
15 428.33 492.58 428.33 64.25 64.25 17.35 46.90 475.24 475.24
16 475.24 546.52 475.24 71.29 71.29 19.25 52.04 527.27 527.27
17 527.27 606.37 527.27 79.09 79.09 21.35 57.74 585.01 585.01
18 585.01 672.76 585.01 87.75 87.75 23.69 64.06 649.07 649.07
19 649.07 746.43 649.07 97.36 97.36 26.29 71.07 720.14 720.14
20 720.14 828.16 720.14 108.02 108.02 29.17 78.86 799.00 799.00
61

APPENDIX B
State Income Tax Rates as of 12/31/98State Top Income Tax Rate (%)Alabama 5.00%Alaska -0-Arizona 5.10Arkansas 7.00California 9.30Colorado 5.00Connecticut 4.50Delaware 6.90District of Columbia 9.50Florida -0-Georgia 6.00Hawaii 10.00Idaho 8.20Illinois 8.98Kansas 6.45Kentucky 6.00Louisiana 6.00Maine 4.50Maryland 4.878Massachusetts 5.95Michigan 4.40Minnesota 8.50Mississippi 5.00Montana 11.00Nebraska 6.99Nevada -0-New Hampshire 10.00New Jersey 6.37New Mexico 8.20New York 6.85North Carolina 7.75North Dakota 12.00Ohio 7.50Oklahoma 7.00Oregon 9.00Pennsylvania 2.80Rhode Island Tax liability is equal to 27% of federal tax liabilitySouth Carolina 7.00South Dakota -0-Tennessee -0-Texas -0-Utah 7.00Vermont Tax liability is equal to 25% of federal tax liabilityVirginia 6.50Wisconsin 6.77Wyoming -0-
Source: 1996 - 1999 Tax Management Inc.
62

APPENDIX C
17 Standard Earnings Outlook/Value Questions Checklist
“PUCCI”: Pricing, Units, Costs, Competition and Insiders
1. Outlook for pricing? (Each dollar of price increase will increase pre-tax income by $1.00 if othercosts do not increase.)
2. Outlook for units? (A 10% increase in units will increase gross profits by 10% if the gross profitmargin does not change. Pre-tax income will increase by this amount if other costs do notincrease.)
3. Outlook for the gross profit margin as a percentage of sales? How much is the gross profit marginexpected to increase/decrease as a result of changes in price, mix of business, and (or) specificcosts that make up cost of goods sold?
4. Outlook for selling, general and administrative costs/margin as a percentage of sales? Descriptionof any significant selling, general and administrative cost changes.
5. Operating leverage: If sales increase by, say, $10 million, how much will drop to pre-tax income?
6. Outlook for the pre tax profit margin? Can the pre tax margin get back to the prior peak marginof_____% attained in_______year? Can the pre tax margin get to_____% that yourcompetitor,_________________________ , earns?
7. Amount of non recurring, or investment/expansion type expenses included in costs? Net assetstied up in these non-core activities? Core recurring profits?
8. Segment or product line losses included in the consolidated income statement? Net assets tied upin the loss-producing or break-even activities? Core recurring profits? (For example, if thebusiness is a retail chain with 100 stores, what are the total losses of all the stores that lose moneyand the total profits of all the stores that make money and the net assets tied up in the losers?)
9. After-tax goodwill amortization? (i.e., what is the amount of the tax deductible goodwillamortization and the amount of non-tax deductible goodwill amortization?)
10. Are you comfortable with the consensus e.p.s. estimates for the current year of and next yearof________ ?
63

11. Outlook for growth in e.p.s. over the next five years? How will you get the growth/whatspecifically will you do to get the growth? Return on equity/return on capital goal/outlook overthe next five years? How will you get there?
12 Over the next five years, what do you plan to do with the cash that will be generated from earningsand not paid out as a dividend? What investments do you plan to make; such as, new factories,additional stores, acquisitions, share buybacks? What return do you expect to earn on plannedinvestments? (Think of a business like a savings account that reinvests the cash earnings that arekept in the business and not paid out as a dividend. The new cash that is invested can earn a newreturn that can add to the overall earnings of the business.)
13 Competitive conditions? Expected changes/actions taken by competitors (such as price changes,new products, new capacity, new marketing programs, etc.) and the expected impact on thesubject company’s pricing, units, margins?
14. Amount of costs/expenses that would disappear if the company was consolidated with acompetitor (such as corporate expense, overlapping duplicate sales outlets or salespersons,manufacturing costs that would disappear if the company’s sales volume was folded into acompetitor’s factory)? If the separate businesses owned by the subject company were sold, howmuch of the subject company’s corporate expense would disappear? (In other words, would theacquirer’s income go up by the amount of segment EBIT that was acquired, or would it have tokeep the functions provided by the subject company’s “corporate” activity and the relatedexpense?)
15. Rules of thumb/valuation standards such as Price/EBIT (Earnings Before Interest and Taxes),Price/EBITDA (Earnings Before Interest, Taxes, Depreciation and Amortization), Price/Sales,Price/Acre, Price/Board Foot of Timber, Price/Ton of Capacity, Price/Salesperson, Price/Dollarof Deposits, etc. for similar businesses? What does the company itself think it is worth?
16. Company plans to buy back stock?
17. Have insiders bought or sold stock recently? Describe. Why did he or she buy? Why did he orshe sell (if the sale was significant)?
64

APPENDIX D
Buffett 101: Questions / Checklist Concerning Assessing a Company’s Growth Prospects,Competitive Position and Economics
“The key to investing is not assessing how much an industry is going to affect society, or howmuch it will grow, but rather determining the competitive advantage of any given companyand, above all, the durability of that advantage. The products or services that have wide,sustainable moats around them are the ones that deliver rewards to investors.” - Warren Buffett
1.* What does your global competition look like over the next several years?
2.* What have your competitors done in the last three years to upset these global dynamics?
3.* What have you done to them in the last three years to affect those dynamics?
4.* How might your competitor attack you in the future?
5.* What are your plans to leapfrog the competition?
6.* Expected rates of overall same-store internal revenue growth for the industry/product area thatthe company operates in over the next 5 to 10 years? Expected rate of overall unit growth andprice increases/decreases over the next 5 to 10 years for the company’s product area?
7.* Study the company’s competitors: Compare their balance sheets and income statements: Grossmargins, SG&A and profit percentages, return on equity, return on capital, ratio of sales tovarious asset categories and capital, etc. Compare growth rates of sales over the last five yearsand recently. Describe market share percentages. Compare growth in assets, such as property,plant and equipment.
8.* Who is growing fastest and gaining market share? Why?
9.* Who is the toughest competitor? Why?
10.* What has occurred and what is expected to occur in the overall industry with respect toadditions to capacity, additions to inventory? Has the overall industry been adding to assets oris it expected to add to assets such as property, plant and equipment, or inventory at a fasterrate than expected growth of overall industry unit demand? (For example, over expansion of the
65

inventory of manufactured homes in relation to unit demand led to very crummy unit pricingfor manufactured homes as dealers cleared out bloated inventories.)
11.* Describe pricing behavior in the company’s industry: Which competitor, if any, typicallyincreases prices first? What has happened next? Who cuts prices? What happens next? Haspricing behavior been rational/“statesmanlike” in the company’s field of business? Describepricing “signaling” behavior in the company’s field of business. Describe recent pricing moves.
12.* Who is the lowest cost competitor? Why? How sustainable is the competitor’s cost advantage?How easy would it be for another company, perhaps doing business in a way that is differentfrom the way that most competitors do business now, to operate with much lower costs than mostof the competitors. (For example, Charles Schwab, a stock brokerage firm that does not paysales commissions to brokers, can transact share trades at a lower cost per share than MerrillLynch, which pays brokers commissions on the stock transactions of its customers.)
13.* Could new technology have a dramatic impact on the company’s business model, earning powerand growth prospects? (For example, when CD rom technology enabled Microsoft to put anencyclopedia on a CD rom that cost less than $1.00 to stamp out, this encyclopedia was sold for$49.00, as compared to prices of $650 - $850 for a printed World Book set and $1600 for anEncyclopedia Britannica set. In some instances, Microsoft’s Encarta encyclopedia was givenaway as a freebie to purchasers of personal computers. Microsoft’s Encarta took significant unitsales away from World Book and Encyclopedia Britannica and ruined the pricing structures andearning power of these two previously dominant encyclopedia publishers.) How is the Internetaffecting, or could it affect, the company and competitors in its field of business? Describe how,if applicable, the Internet has enabled new entrants to compete in the company’s field ofbusiness. Describe the new Internet competitors, and the advantage/disadvantages of theirbusiness models.
14.* Describe the expansion plans and strategies of competitors, including new entrants. Read theannual reports and analysts’ reports concerning competitors to gain a better understanding oftheir plans.
15.* Consider whether the company’s products’ prices are so high that they encourage lower pricedproduct offerings from competitors. In other words, is product pricing so high that competitionfrom lower priced products cause doubt about the sustainability of future earning power andcause doubt about growth prospects over the next 5 to 10 years. (For example, Eastman Kodakhad wonderful earnings growth from its U.S. photographic film business until Fuji Photo wasable to offer similar quality film at retail prices that were one third less than Kodak’s prices.Kodak’s retail film prices were high enough to permit Fuji to enter the film business in the U.S.,and this competition has negatively impacted Kodak’s profitability and earnings growth.
66
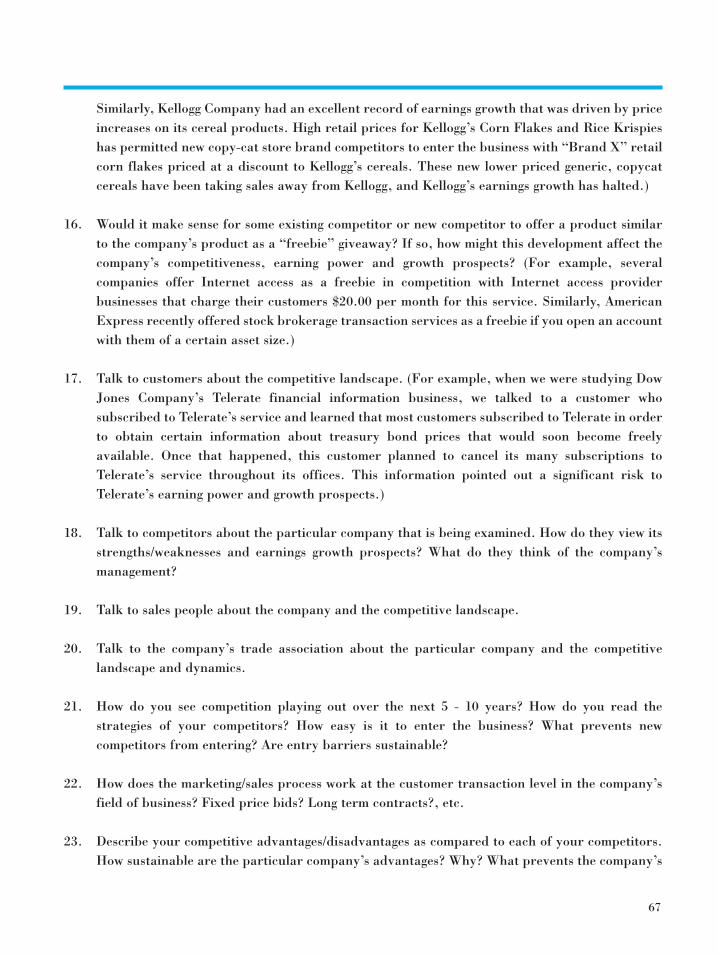
Similarly, Kellogg Company had an excellent record of earnings growth that was driven by priceincreases on its cereal products. High retail prices for Kellogg’s Corn Flakes and Rice Krispieshas permitted new copy-cat store brand competitors to enter the business with “Brand X” retailcorn flakes priced at a discount to Kellogg’s cereals. These new lower priced generic, copycatcereals have been taking sales away from Kellogg, and Kellogg’s earnings growth has halted.)
16.* Would it make sense for some existing competitor or new competitor to offer a product similarto the company’s product as a “freebie” giveaway? If so, how might this development affect thecompany’s competitiveness, earning power and growth prospects? (For example, severalcompanies offer Internet access as a freebie in competition with Internet access providerbusinesses that charge their customers $20.00 per month for this service. Similarly, AmericanExpress recently offered stock brokerage transaction services as a freebie if you open an accountwith them of a certain asset size.)
17.* Talk to customers about the competitive landscape. (For example, when we were studying DowJones Company’s Telerate financial information business, we talked to a customer whosubscribed to Telerate’s service and learned that most customers subscribed to Telerate in orderto obtain certain information about treasury bond prices that would soon become freelyavailable. Once that happened, this customer planned to cancel its many subscriptions toTelerate’s service throughout its offices. This information pointed out a significant risk toTelerate’s earning power and growth prospects.)
18.* Talk to competitors about the particular company that is being examined. How do they view itsstrengths/weaknesses and earnings growth prospects? What do they think of the company’smanagement?
19.* Talk to sales people about the company and the competitive landscape.
20.* Talk to the company’s trade association about the particular company and the competitivelandscape and dynamics.
21.* How do you see competition playing out over the next 5 - 10 years? How do you read thestrategies of your competitors? How easy is it to enter the business? What prevents newcompetitors from entering? Are entry barriers sustainable?
22.* How does the marketing/sales process work at the customer transaction level in the company’sfield of business? Fixed price bids? Long term contracts?, etc.
23.* Describe your competitive advantages/disadvantages as compared to each of your competitors.How sustainable are the particular company’s advantages? Why? What prevents the company’s
67

earnings power and growth prospects from getting wrecked by competition? If it seems hard towreck, then the company probably has sustainable economic advantage.
24.* What worries management about the company and competitors’ moves and potential moves?
25.* Looking out five years, what is the company’s best guess concerning the growth rate of revenues,and e.p.s.?
26.* Looking out 5 to 10 years, how does the company plan to invest cash that is retained in thebusiness? Expected return on equity on incremental investment?
27.* What new investments, new ventures, new experiments, that the company is working on (orenvisions) could have a significant positive impact on the value of the company in the future?What exciting stuff does the company have up its sleeve? (Several of our best long term holdings,such as Jefferies Group and Fingerhut, generated significant shareholder wealth from newinvestments/ventures that were only a “gleam in the eye” of management when we initiallybought these stocks. Jefferies Group’s investment in Investment Technology Group andFingerhut’s investment in Metris Corp. were both highly successful new ventures that weobtained for free when we acquired shares of Jefferies Group and Fingerhut.)
28.* What is the company’s philosophy/strategy with respect to using free cash flow for stockbuybacks when it is not required to support same-store growth?
29.* How is management paid/incentivized?
30.* How are personnel who make risk decisions, such as insurance underwriters, security traders,bank loan officers, etc. paid? Do they have “one-way” incentives which encourage risk but donot punish loss such as bonuses based on insurance sales, loan volume or trading gains withoutthe particular individual sharing in the losses from unprofitable insurance policies, loans thathave gone sour or trading losses? Does management have a history of enhancing shareholdervalue?
31.* Company’s acquisition plans? When the company’s stock is cheap, how does it view buying backstock versus acquiring companies at full value?
32.* What are the company’s plans concerning its capital structure over the next five years:Debt/equity, leasing assets, spinning off capital intensive assets such as bottling facilities or hotelassets, off-balance sheet financing?
68

33.* Who makes pricing decisions for the company’s products? How are pricing decisions made?
34.* What else is important? What should we ask about, but didn’t?
35.* What information does management monitor and consider to be important in managing itsbusiness? How does the company’s information compare to competitors’ information? Does thecompany have an edge that is sustainable?
36.* Are there substitutes for the company’s products that are gaining or likely to gain ground? (Forexample, Kellogg Company has faced substitute competition to its cereal products from bagelsas a breakfast food. Producers of checks, such as Deluxe and John Harland, face increasedsubstitution competition from Paypal, CheckFree and other electronic forms of payment as wellas (in Finland right now) cell phones that can make wireless payments including even for thepurchase of a Coke from a vending machine. )
37.* In light of what we have learned about the particular company and the competitive game inwhich it is a player, do the historical financial statements of the company seem to berepresentative of the nature of the company, or has there been or is there likely to be such achange in the competitive game that the future financial statements are unlikely to look like thehistorical record? (We know that, on average, most companies with great 10-year e.p.s. growthand return on equity records tend to perform poorly or in a very average way over the nextseven years. Only about one-fifth of the companies continue to be top performers over the nextseven years. These companies had sustainable competitive advantages. They were able tomaintain or enhance their positions in the competitive games in which they operate.)
38.* Does the information cross-check? Warren Buffett has often mentioned how much he haslearned and benefitted form Philip Fisher’s book, Common Stocks and Uncommon Profits.The Philip Fisher method of researching a company, which Mr. Fisher refers to as the“scuttlebutt” method, is to interview several sources, piecing together an information mosaicabout a company and its field of business. It is easier to have greater confidence in informationand insights when several sources confirm the same insight or the same murkiness anduncertainty (which, in itself, is also an insight) about a company and its competitive position andeconomics. The facts may be so simple and obvious and make so much sense that questioningother sources to seek additional confirmation of an insight may be unnecessary.
* First five favorite questions from Jack Welch, CEO of General Electric Source: Jack Welch Speaks by Janet Lowe
69

Tweedy, Browne Company LLC350 Park AvenueNew York, New York 10022
Telephone: 212-916-0600Facsimile: 212-916-0649Website: www.tweedy.com