investigations of the chymotrypsin-catalyzed hydrolysis of ... · kinetic investigations of the...
TRANSCRIPT
THE JOURNAL OE BIOLOGICAL CHEMISTRY Vol.244, No.13,Is.mofJuly 10,~~.3483-3493, IQ69
Printed in U.S.A.
Investigations of the Chymotrypsin-catalyzed
Hydrolysis of Specific Substrates
IV. PRE-STEADY STATE KINETIC APPROACHES TO THE INVESTIGATION OF THE CATALYTIC HYDROLYSIS OF ESTERS*
(Received for publication, November 12, 1968)
ALBERTHIMOE,$KARLG.BRANDT,§RICHARD J.DESA, ANDGEORGE P. HESS~
From the Section of Biochemistry and Molecular Biology, Division of Biological Sciences, Cornell University, Ithaca, New York 14850
SUMMARY
Pre-steady state kinetic parameters pertaining to chymo- trppsin-catalyzed hydrolysis of specific substrate esters can be obtained from measurements of the displacement of the competitive inhibitor proflavin from enzyme by substrate. This method, which was previously used in experiments with specific substrate amides, has now been applied to the in- vestigation of N-acetyl-L-phenylalanine methyl ester, N- acetyl-L-tryptophan ethyl ester, and N-furylacryloyl-L-tyro- sine ethyl ester. Results were found to be in agreement with data obtained by established procedures including measurement of spectral changes of the enzyme upon forma- tion of complexes with substrate and direct measurement of product formation. All available data on chymotrypsin- catalyzed hydrolysis of specific substrate esters are consistent with the previously proposed mechanism
PI KS’
E+S \ ES ---& kzr
EPz - E+Pz k 34
in which PI represents an alcohol and PZ an acid.
Chymotrypsin-catalyzed reactions have been considered in terms of the equation:
PI K&G
E+S e ES 7,
ha EP2 -
ka4 E + P2 (1)
* This work was supported by Grant GM-04842 from the Na- tional Institutes of Health and Grant GB-7126 from the National Science Foundation.
f United States Public Health Service Postdoctoral Trainee. Prjksent address, Department of Biochemistrg, Baylor University College of Medicine, Houston, Texas 77025.- -
& National Institutes of Health Postdoctoral Fellow. Present ad&ress, Department of Biochemistry, Purdue University, Lafay- ette, Indiana 47907.
7 To whom reprint requests should be addressed at 210 Savage Hall? Cornell University, Ithaca, New York 14850.
where S represents substrate ester or amide, ES an enzyme- substrate complex, EP2 an enzyme-substrate compound, P1 an alcohol or amine, and Pz a free acid. This equation is based on kinetic investigations of the chymotrypsin-catalyzed hydrolysis of p-nitrophenyl acetate (1, 2), although in this particular reac- tion there is no evidence for an enzyme-substrate complex (3). In the p-nitrophenyl acetate reaction, EP2 in Equation 1 has been identified as a chymotrypsin molecule in which a single serine hydroxyl group has been acetylated (4).
Kinetic investigations of the chymotrypsin-catalyzed hydroly- sis of specific substrates-ester and amide derivatives of aromatic amino acids-have mainly consisted of steady state measure- ments (5), which yield, for the simple mechanism shown in Equation 1, only combinations of rate and equilibrium con- stants (2) :
V max -= EO
k kasksr
cat = - kza + ks4
(2)
where the subscript zero denotes initial concentration;
and thus:
ka4 Km (am) = KA -
ha + ka4 (3)
k cat ha -=- Km (app) Ki,
Recently we have started to investigate (6-12) the pre-steady state kinetics of the chymotrypsin-catalyzed hydrolyses of both amides and esters of aromatic amino acids, the specific sub- strates of the enzyme. A variety of methods has been used. These include measurement of spectral changes of the enzyme upon formation of complexes with substrates, direct measure- ment of product formation, and measurement of the displace- ment of the competitive inhibitor proflavin from enzyme by substrate. Spectrophotometric and stopped flow techniques permit the evaluation of pre-steady state rate and equilibrium constants in addition to the over-all constants obtainable by conventional steady state methods. Our results, although show- ing differences between amide and ester substrates in the relative rates of different reaction steps, have so far proved to be con- sistent with the mechanism of Equation 1.
3483
by guest on January 6, 2020http://w
ww
.jbc.org/D
ownloaded from
3484 Chymotrypsin-catalyzed Hydrolysis of SpeciJic Substrates. IV Vol. 244, No. 13
Recently, however, the possibility that there are additional intermediates (between ES and EP2 in Equation 1) was sug- gested by the results of experiments of Barman and Gutfreund (13) on the chymotrypsin-catalyzed hydrolysis of Fa-Tyr-0Et.l These authors inferred that liberation of ethanol (P, in Equation 1) is slower than the formation of the enzyme-substrate com- pound (EPJ. The possibility that proflavin may not be a competitive inhibitor has also been raised (14), bringing into question the usefulness of the proflavin displacement method for determination of pre-steady state rate and equilibrium constants. It is important to know about the applicability of the proflavin displacement method, since it is the only method so far found that can be used with all chymotrypsin substrates.
The experiments reported here were designed to evaluate further the usefulness of the proflavin displacement method in investigations of chymotrypsin-catalyzed hydrolyses. Compari- sons were made of results obtained by this and other methods. We investigated the pre-steady state kinetics of the chymo- trypsin-catalyzed hydrolysis of Ac-Phe-OMe, following the reaction not only by the proflavin displacement technique (6, 9, 10, 14-17) but also by an independent method based on spectral changes of the enzyme at 290 rnp (18-21). We also made com- parative measurements of Ac-Trp-ONp at three pH levels, measuring both p-nitrophenol release and proflavin displace- ment. Finally, we investigated the pre-steady state kinetics of the cr-chymotrypsin-catalyzed hydrolysis of Fa-Tyr-OEt, in order to assess the suggestion of Barman and Gutfreund that in this reaction alcohol (P1 in Equation 1) is not released concomi- tantly with the formation of EPQ.
EXPERIMENTAL PROCEDURE
Materials and Apparatus
Three times crystallized, salt-free cu-chymotrypsin (Lots CDI-6164, CDI-6168-9, and CDI-6KB) was obtained from Worthington. Enzyme concentration was determined spec- trophotometrically at 280 rnp with the use of a molar extinction coefficient of 50,000 M+ cm+ (22). A molecular weight of 25,000 (23) was assumed.
Fa-Tyr-OEt, Lot K-5621, with melting point of 134-137“ and a molar extinction coefficient at 304 rnp of 26,500 I@ cm-l, was obtained from Cycle. Ac-Phe-OEt, Lot G 2441, with melting point of 8Q-QO”, Ac-Phe-OMe, Lot K-4778, and proflavin sulfate, Lot M 2200, with a molar extinction coefficient at 444 rnp of 37,900 M+ cm+, were obtained from Mann. Ac-Trp- ONp was prepared as described below. All other reagents were reagent grade, obtained from Mallinckrodt.
A Cary model 14 recording spectrophotometer with l-cm silica cells and 0 to 2.0 or 0 to 0.2 slide wires was used for the spectrophotometric measurements. Determinations of pH were made on a Radiometer pH meter, type TTTlc, with reference to Beckman pH 7.0 and pH 4.0 standard buffers. For the stopped flow experiments, a Gibson-Durrum stopped flow spec- trophotometer was used. This instrument has cells with 2-cm light path or 5-mm light path and a tungsten-iodide light source with grating monochromator. Time-dependent change in light transmission of the experimental solutions was recorded on a
1 The abbreviations used are: Fa-Tyr-OEt, furylacryloyl-n- tyrosine ethyl ester; Ac-Phe-OMe, N-acetyl-n-phenylalanine methyl ester; Ac-Trp-ONp, N-acetyl-n-tryptophan p-nitrophenyl ester; Ac-Phe-OEt, N-acetyl-n-phenylalanine ethyl ester.
Tektronix 564 storage oscilloscope or on a Tektronix 545B oscilloscope. A Radiometer pH-stat was used for some steady state kinetic measurements of ester hydrolysis. An analogue computer, model EAl-TR-48, of Electronics Associates, was used in processing some of the data.
Preparation of AC-Trp-ONp-A 1.03 g (0.0022 mole) of benzyl- oxycarbonyl-n-tryptophan p-nitrophenyl ester, obtained from Cycle (Lot K-5082, with melting point of 9598”), was dissolved in 10 ml of glacial acetic acid saturated with HBr, and the mix- ture was allowed to stand at room temperature for 30 min. After precipitation of the product by the addition of 100 ml of anhydrous ether in small portions, the supernatant liquid was decanted and the precipitate was washed with small portions of anhydrous ether (twice) and cold water (once). The precipitate was dried under reduced pressure to yield 0.56 g (62% yield) of crystalline n-tryptophan p-nitrophenyl ester hydrobromide with melting point of 185190”. This material was used without further purification in the subsequent step. In a mixture of 0.75 ml (0.007 mole) of acetic anhydride in 10 ml of ethyl acetate and 15 ml of 0.1 M phosphate buffer (pH 7.0), there was sus- pended 2.3 g (0.006 mole) of the n-tryptophan p-nitrophenyl ester hydrobromide. The reaction mixture was stirred for 30 min at room temperature, and then the organic layer was re- moved, dried over drierite, and filtered. Solvent was then removed under reduced pressure, and the residue was dissolved in a small amount of benzene. Addition of hexane yielded an oil which crystallized on standing to 0.6 g (29% yield) of N-acetyl-n-tryptophan p-nitrophenyl ester (Ac-Trp-ONp), with melting point of 127-132” and [ar]z4 -41” (c, 1, chloroform). This material was recrystallized from hexane-benzene before use in the experiments; it was at least 95% optically pure, as judged by the liberation of p-nitrophenol in the or-chymotrypsin-cata- lyzed hydrolysis. An additional recrystallization of this com- pound from acetone-ether yielded an analytically pure material of melt.ing point 131-133”.
Calculated: C 62.13%, H 4.66%, N 11.44% Found2: C 62.04’%, H 4.657& N 11.35y0
A recent report (24) gives a value of [a]:’ -46.3” (c, 1, chloro- form) for this compound, and a melting point of 130-131.5’.
Methods
Spectrophotometric Experiments with Ac-Phe-OMe-Measure- ments of proflavin displacement and of spectral changes of chymotrypsin near 290 rnp (ADzso) as a function of time were made at pH 3.1 or 3.2 and 25.0”.
For the ADzso measurements, the procedure was as follows. Two milliliters of a solution of substrate (20 mM to 3 mM: in mM HCl) with ionic strength of 0.4 with KC1 were pipetted into the thermostated quartz spectrophotometer cell. The reaction was initiated by addition, with a plastic plunger device, of 0.1 ml of 0.8 InM cr-chymotrypsin in InM HCl. Concentrations in the final solutions were therefore 37 PM ac-chymotrypsin and 19 nnbd to 2.9 mM Ac-Phe-OMe. As soon as the addition was completed and the sample cell cover was closed, recording of the optical density at 288.5 rnp was begun; time between addition of enzyme and the start of recording was about 5 sec. A neutral density filter was in place in the reference beam at all times, and the 0 to
2 Performed by Scandinavian Microanalytical Laboratory.
by guest on January 6, 2020http://w
ww
.jbc.org/D
ownloaded from
Issue of July 10, 1969 A. Himoe, K. G. Bran&, R. J. DeSa, and G. P. Hess 3485
0.2 slide wire was used. In some of the runs, a buffer 0.1 M in glycine-HCl and 0.3 M in KC1 was used to maintain the pH; in all cases, exact pH levels were established by measurement of duplicate solutions on the pH meter.
The experiments in which the displacement of proflavin was measured were carried out in exactly the same way as the ADsso experiments, except that observations were made at 465 my, and the reaction was initiated by the addition of 0.1 ml of a mixture containing mM proflavin and 0.2 lllM cr-chymotrypsin. Concentrations in the final solutions were therefore 9.5 pry cr-chymotrypsin, 47.5 pM proflavin, and 19 mu to 2.9 mM Ac- Phe-OMe. In the calculations, a value of 0.1 mu was used for KBPR, the dissociation constant of the enzyme-proflavin complex: this value was obtained by interpolation of values measured at pH 2.5 (KEF = 0.14 mM) and pH 4.0 (KBF = 0.08 KIM) (10).
Stopped Flow Experiment with Ac-Phe-OMe-Proflavin dis- placement during the a-chymotrypsin-catalyzed hydrolysis of Ac-Phe-OMe in the presence of proflavin was measured by the stopped flow technique at pH 6.0. A solution containing en- zyme and proflavin was mixed in the apparatus with a solution of equal volume containing substrate and measured in the cell with a 5-mm light path. Initial concentrations in the reactant solution were 10 PM tr-chymotrypsin, 2.0 mu Ac-Phe-OMe, and 50 p~ proflavin. The solution contained 0.1 M phosphate buffer and had an ionic strength of 0.4. The temperature was 25.2 & 0.5”. The time-dependent change in concentration of the enzyme-proflavin complex was followed at 465 rnp and recorded on a storage oscilloscope.
Steady State Kinetic Measurements with Ac-Phe-OEt-These measurements were performed at pH 5.0 and 25.5” in 0.4 M KC1 by continuous titration of the liberated acid on a Radiometer pH-stat (25). Initial rates were determined at an enzyme con- centration of about 1 pM and at several substrate concentrations in the range 0.2 to 7.0 mu. The kinetic constants lCeat and K, (app) were calculated by means of a digital computer program written for the Lineweaver-Burk form of the Michaelis-Menten rate equation (26).
Stopped Flow Experiments with Ac-Trp-ONp-Measurements of proflavin displacement and of p-nitrophenol release were made at pH levels 2.5, 3.5, and 4.3 at 26.5 f 0.5”. Solutions con- taining a-chymotrypsin and proflavin, or just the enzyme, were mixed according to a standard stopped flow procedure (in the 2-cm cells) with solutions of equal volume containing substrate. For the experiments at pH 2.5, the solutions were 0.05 M in KC1 and the pH was adjusted with M HCl; for the experiments at pH levels 3.5 and 4.3, 0.05 M potassium acetate buffer was used in both reactant solutions. All solutions contained 1.6% aceto- nitrile and had an ionic strength of 0.05. Experiments were con- ducted under initial conditions E. >> So in the absence of pro- flavin, and also So >> Ee in either the presence or the absence of proflavin. The initial concentrations of these components are given in Table II.
The t.ime-dependent change in concentration of the enzyme- proflavin complex was followed at 480 rnp, and the p-nitrophenol release at 348 rnp (AQJ = 5450 ~-1 cm-l). Under the most unfavorable conditions, the contribution of the change in enzyme- proflavin complex to the total signal change at 348 rnp was less than 10%. The p-nitrophenol release made no detectable con- tribution to the signal change at 480 mp.
Steady State Kinetic Measurements with AC-Trp-ONp at pH S.5-The reaction was measured by following the release of
p-nitrophenol at 320 rnp (Ae = 9750 M-l cm-l) in the Cary spectrophotometer (0 to 2.0 slide wire) with cells thermostatted at 25”. Distilled water was used as a reference. The reaction was started by mixing 0.05 ml of an acetonitrile solution of substrate with 3 ml of a buffered enzyme solution. Initial enzyme concentration (EO) in the experimental solutions was 0.2 pM and initial substrate concentrations (S,) were 1.5, 2.5, and 4.0 pM in the various experiments. All solutions were 0.1 M
in potassium acetate buffer and contained 1.6% acetonitrile. Measurements at each substrate concentration were made both in the presence and in the absence of 50 PM proflavin. Values of kolLt and K, (app) were calculated as discussed under “Re- suits.”
Stopped Flow Experiments with Fa-Tyr-OEt-The a-chymo- trypsin-catalyzed hydrolysis of Fa-Tyr-OEt in the presence of proflavin was followed by standard stopped flow procedure at 480 rnp in a 2-cm light path cell at pH 5.0 and 24.5 f 0.5”. Final solution concentrations were 47.5 pM or-chymotrypsin, and 305 PM to 51 PM Fa-Tyr-OEt. All solutions were 3% in acetonitrile and 0.1 M in potassium acetate to give an ionic strength of 0.1.
Steady State Kinetic Measurements with Fa-Tyr-OEt-The reaction was followed at pH 5.0 and at pH 6.6 in the Cary spec- trophotometer (0 to 2.0 slide wire) at 25.0 f 0.5” and at 325 mp, where the difference spectrum between Fa-Tyr-OEt and the free acid is largest (Ae, = 1525 MY’ cm-r). Substrate stock solution, 2 ml in volume, was pipetted into the sample cell, and the reac- tion was initiated by addition of 0.1 ml (for pH 5.0 reaction) or 0.01 ml (for pH 6.6 reaction) of cu-chymotrypsin in mu HCl by means of a plastic plunger mixing device. The final solu- tions at pH 5.0 were buffered with 0.1 M sodium acetate and contained 3% acetonitrile and sufficient NaCl to bring the ionic strength to 0.1. The final solutions at pH 6.6 were buffered with 0.08 M potassium phosphate, and measurements were made both in the presence and absence of 3% acetonitrile. Initial concentrations in the final solutions were therefore: a-chymo- trypsin, 0.50 FM at pH 5.0 and 0.052 pM at pH 6.6; Fa-Tyr-OEt, 31.5 PM to 118 PM at pH 5.0,25 pM to 140 PM at pH 6.6 when 3% acetonitrile was present, and 26 pM to 104 pM at pH 6.6 in the absence of acetonitrile. It was assumed that the carboxyl group of N-furylacryloyl-L-tyrosine is completely ionized at the pH levels used. Kinetic parameters were calculated from the meas- ured initial rates according to a digital computer program based on the Lineweaver-Burk form of the Michaelis-Menten rate equation (26).
Evaluation of i&3, k34, and K’s for Mechanism Shown in Equa- tion I-The calculation of rate constants and K’s values for the chymotrypsin-catalyzed hydrolysis of ester substrates from stopped flow or time-dependent spectrophotometric measure- ments of enzyme-substrate and enzyme-substrate-proflavin systems has been discussed (6, 10). As previously shown (lo), the observed rate constant for the attainment of a steady state, k obs, is obtained from experiments such as shown in Fig. 1; kobs can be evaluated as the slope of a line plotted according to the relation
In [(ALA - (A)$,1 = C - kobst (5)
where A is absorbance of the solution at time t and at the time when steady state, ss, is reached, and X is the wave length at which the absorbance is measured. In the experiments reported here, X = 288.5 rnp in the spectral change measurements, X = 465 rnp in the proflavin displacement experiments, and X = 320
by guest on January 6, 2020http://w
ww
.jbc.org/D
ownloaded from
3486 Chymotrypsin-catalyzed Hydrolysis of Xpecijic Substrates. IV Vol. 244, No. 13
in i %
d
Time -9
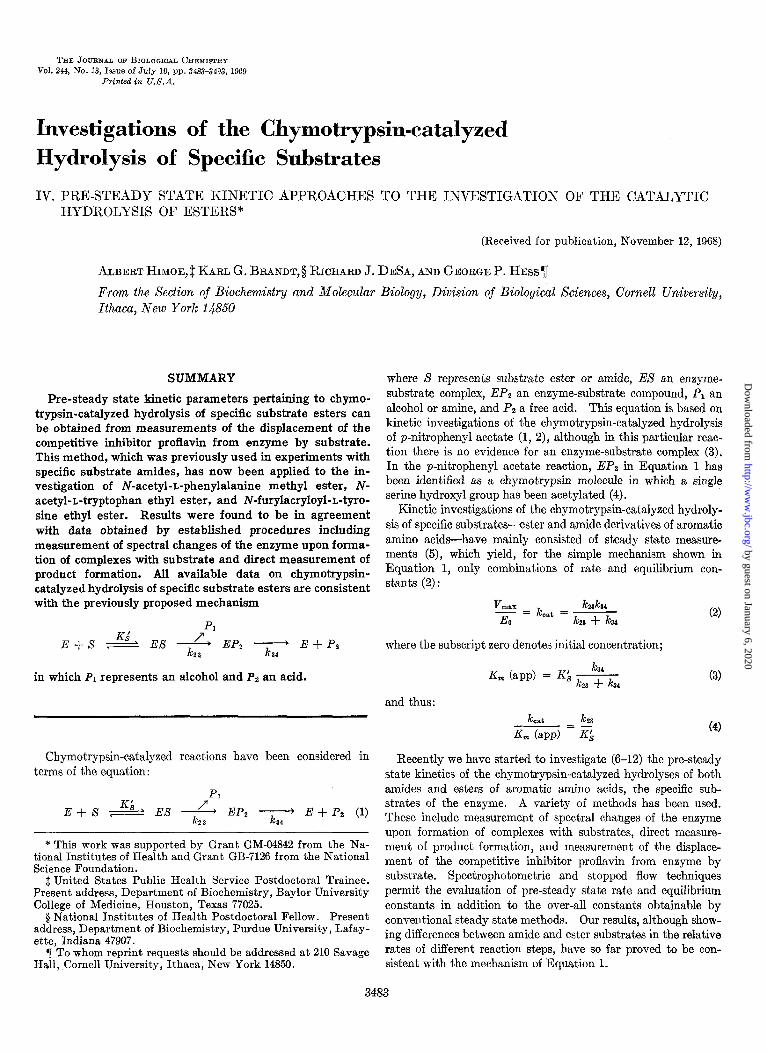
FIG. 1. A, photographs of oscilloscope traces in a stopped flow experiment with Ac-Phe-OMe at pH 6.0 and 25.2”. Initial solu- tion concentrations were 2.0 mM Ac-Phe-OMe, 10 PM cu-chymotryp- sin, and 50 FM proflavin in 0.1 M phosphate buffer; ionic strength = 0.4 (with KCl). Measurements were made in the Gibson-Durrum stopped flow apparatus. The upper trace shows the second sweep of the oscilloscope. B, trace of the spectrophotometric measure- ment of the catalyzed hydrolysis of Ac-Phe-OMe as a function of time. Measurements were made at 288.5 rnp in the Cary spectro- photometer (0 to 0.2 slide wire). At a specific time during the interval in which the absorbance exhibits a constant value, the initial pH of 3.2 was changed to pH 5.7 by the addition of a small amount of base. Initial solution concentrations were 17.2 mM Ac-Phe-OMe and 37 pM cu-chymotrypsin. Ionic strength was 0.4 and temperature was 25”.
rnp in the p-nitrophenol release measurements. A minimum of five different experiments, such as shown in Fig. 1, were run in order to establish the slope of the line.
It has been shown (10) that the parameters pertaining to Equation l-JG23, k~, and K’-can be obtained from the k&s values, provided that substrate or enzyme concentrations suffi- ciently greater than K’e can be obtained experimentally; other- wise, only an apparent second order rate constant, kzz/K’S, can be obtained. Implicit in the evaluation of these constants are the following assumptions. (a) Equation 1 is the simplest equation which describes the observed progress curves of specific substrate esters. (b) The enzyme-substrate complex (EX) and, when proflavin is present, the enzyme-proflavin complex (EF) are formed in a rapid pre-equilibrium phase of the reaction. (c) Initial concentrations of substrate (X), enzyme (E), and proflavin (F) have the relative magnitudes of either So >> E. < FO or EO >> SO. These conditions allow the concentrations of the materials in excess to be considered constant during the period of observations and equal to their initial analytical values. Calculations indicate that, under the most unfavorable condi- tions used in the experiments reported here, the concentration of F changes by less than 8% during the development of the steady
state. (cl) h4 < ks3. This assumption is warranted when the presence of a steady state intermediate can be detected in traces such as those shown in Fig. 1. When the steady st.ate kinetic parameter kost is small compared to the experimentally observed rate constant (J&e) for the formation of EP2, kcat is considered a measure of &. (e) Proflavin is a competitive inhibitor of the enzyme and does not perturb the system in some unknown way.
The equations used for evaluating the pre-steady state kinetic parameters from k&s values are given under “Appendix.” Data weighting and the calculation of the standard errors of the kinetic constants were performed as discussed by Wilkinson (27).
Calculation of Progress Curves-Progress curves for inter- mediates and products in the oL-chymotrypsin-catalyzed hy- drolysis of Fa-Tyr-OEt at pH 6.6 were generated by means of an analogue computer. Conditions taken for the reaction were approximately equal initial concent.rations of enzyme and sub- strate (EO = 0.27 mM and So = 0.22 mM). Required values of K’s, k23, and i&4 (taken as equivalent to k& were obtained ex- perimentally under the conditions So > E,, and are listed in Table III. The complex ES was considered to be formed in a rapid pre-equilibrium phase of the reaction.
RESULTS
Pre-Steady state Kinetic Experiments with oc-Chymotrypsin and Ester Xubstrates-Comparable determinations of K’s and k23 (Equation 1) were obtained from temporal measurements made either with the spectrophotometric Gibson-Durrum stopped flow apparatus or a Cary spectrophotometer, and with use of methods based on the displacement of proflavin from the enzyme by substrate, or on spectral changes of the enzyme near 290 rnp, or on release of alcohol (P1 in Equation 1).
A typical oscilloscope trace obtained when excess ester sub- strate is mixed with enzyme and proflavin in the spectrophoto- metric stopped flow apparatus is shown in Fig. 1A. This trace was obtained at pH 6.0 and 465 rnp with Ac-Phe-OMe as sub- strate. Interpretation of a trace such as this is made on the basis of the following observations. The formation of a chymo- trypsin-proflavin complex results in a perturbation, with a maximum at 465 rnp, of the proflavin absorption spectrum (14). Introduction of substrate into a system of enzyme and proflavin results in competition between proflavin and substrate for the enzyme; consequently, less proflavin is bound by the enzyme, and the absorption due to complex is decreased. Interpretation of the observable reaction steps (Fig. 1A) is therefore as follows. (a) The initial change is a rapid decrease in concentration of the enzyme-proflavin complex, EF. This change is usually too fast to be measured and is not shown; representation of it would have required a third time scale in Fig. 1A. This initial decrease is considered to reflect the formation of an enzyme-substrate complex (EX in Equation 1). (b) The second step is a second decrease in the concentration of EF, considered to occur as a result of the formation of another intermediate, such as EP2 in Equation 1. This step has an observed rate which is dependent on both pH and initial substrate concentration. (c) Subsequent to this rapid but measurable decrease in EF concentration, there is a period during which essentially no change in EF occurs. The length of this period also depends on substrate concentra- tion, and is considered to reflect the time during which there is maintained a steady state concentration of the intermediate such as EP2 in Equation 1. (d) Finally, an increase in the concentra-
by guest on January 6, 2020http://w
ww
.jbc.org/D
ownloaded from
Issue of July 10, 1969 A. Himoe, K. G. Brand& R. J. DeSa, and G. P. Hess
tion of EF occurs. This is considered to be due to the decomposi- tion of EP2.
The same reaction phases can be seen in experiments in which enzyme is mixed with excess substrate and the resulting absorp- tion changes near 290 rnp are recorded as a function of time on the Cary spectrophotometer. Results of a typical experiment with a-chymotrypsin and Ac-Phe-OMe are represented in Fig. 1B. In this particular experiment, the reaction was begun at pH 3.2, and the steady state part of the reaction was shortened by the addition of a small amount of base to bring the pH to 5.7.
When experiments such as those show in Fig. 1 are performed at various initial substrate or initial enzyme concentrations, the parameters pertaining to Equation 1 (&, k34, and K’s) can be evaluated (see “Experimental Procedure”).
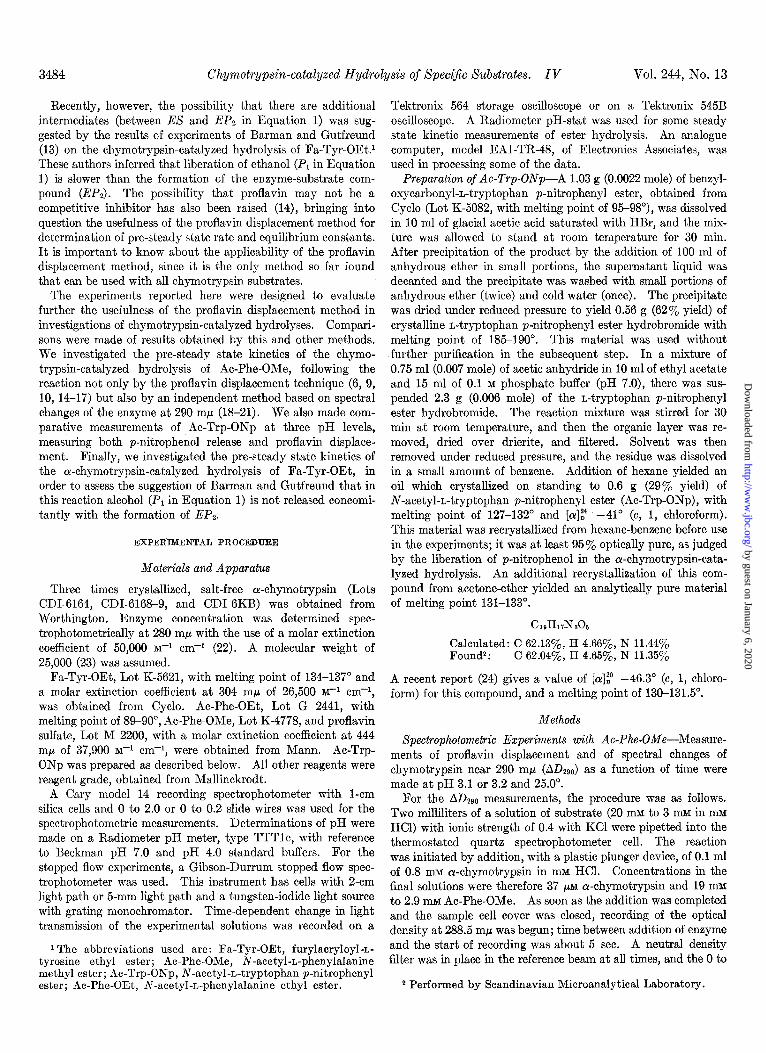
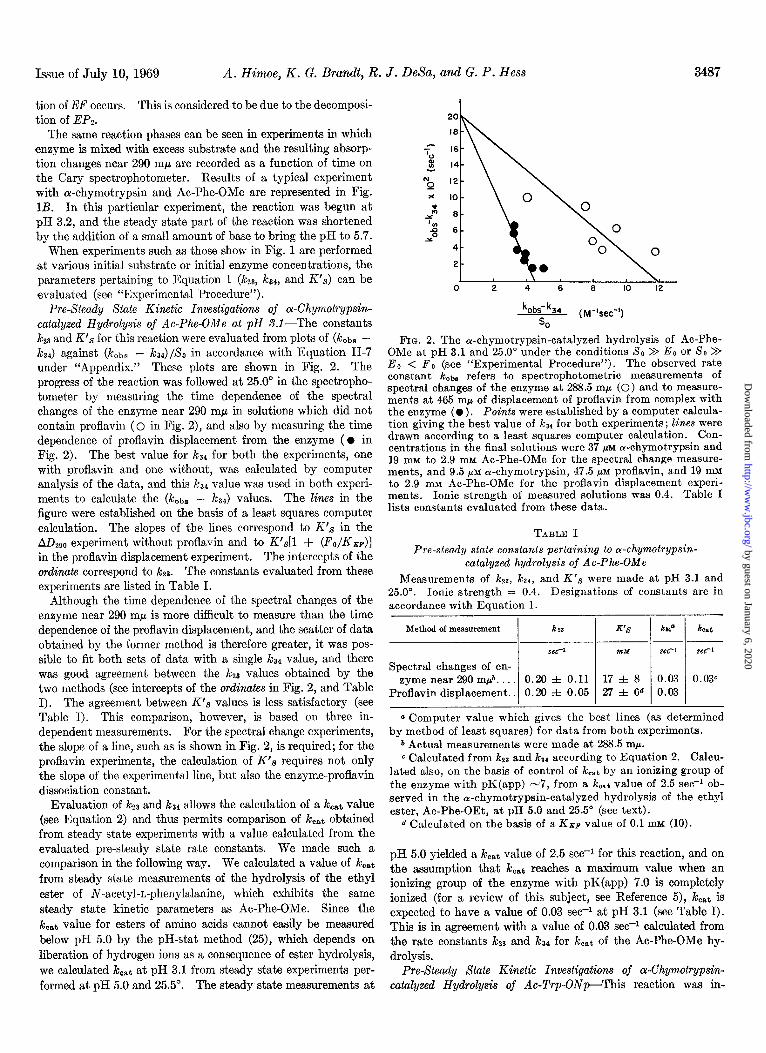
Pre-Steady State Kinetic Investigations of a-Chymotrypsin- catalyzed Hydrolysis of Ac-Phe-OMe at pH S.l-The constants k23 and K’s for this reaction were evaluated from plots of (k&s - k34) against (kobs - &4)/&, in accordance with Equa,tion II-7 under “ilppendix.” These plots are shown in Fig. 2. The progress of the reaction was followed at 25.0” in the spectropho- tometer by measuring the time dependence of the spectral changes of the enzyme near 290 rnp in solutions which did not contain proflavin (0 in Fig. 2), and also by measuring the time dependence of proflavin displacement from the enzyme ( l in Fig. 2). The best value for kS4 for both the experiments, one with proflavin and one without, was calculated by computer analysis of the data, and this ks4 value was used in both experi- ments to calculate the (kOsS - kZ4) values. The lines in the figure were est,ablished on the basis of a least squares computer calculation. The slopes of the lines correspond to K’s in the ADZgo experiment without proflavin and to K’,s[l + (FO/KB~)] in the proflavin displacement experiment. The intercepts of the ordinate correspond to i&z. The constants evaluated from these experiments are listed in Table I.
Although the time dependence of the spectral changes of the enzyme near 290 rnp is more difficult to measure than the time dependence of the proflavin displacement, and the scatter of data obtained by the former method is therefore greater, it was pos- sible to fit both sets of data with a single t& value, and there was good agreement between the JcZ3 values obtained by the two methods (see intercepts of the ordinutes in Fig. 2, and Table I). The agreement between K’s values is less satisfactory (see Table I). This comparison, however, is based on three in- dependent measurements. For the spectral change experiments, the slope of a line, such as is shown in Fig. 2, is required; for the proflavin experiments, the calculation of K’s requires not only the slope of the experimental line, but also the enzyme-proflavin dissociation constant.
Evaluation of kzs and kZ4 allows the calculation of a keat value (see Equation 2) and thus permits comparison of i&t obtained from steady state experiments with a value calculated from the evaluated pre-steady state rate constants. We made such a comparison in the following way. We calculated a value of lcost from steady state measurements of the hydrolysis of the ethyl ester of N-acetyl-r.-phenylalanine, which exhibits the same steady state kinetic parameters as Ac-Phe-OMe. Since the kcat value for esters of amino acids cannot easily be measured below pH 5.0 by the pH-stat method (25), which depends on liberation of hydrogen ions as a consequence of ester hydrolysis, we calculated k,,t at pH 3.1 from steady state experiments per- formed at pH 5.0 and 25.5”. The steady state measurements at
3487
20
18
- 16 B
- I\\
I 14
“Q ‘2
0 2 4 6 8 IO 12
kobs- ks, e (M%ec-‘) =0
FIG. 2. The oc-chymotrypsin-catalyzed hydrolysis of Ac-Phe- OMe at nH 3.1 and 25.0” under the conditions SO > Eo or SO > Eo < F; (see “Experimental Procedure”). The observed rate constant kobs refers to spectrophotometric measurements of spectral changes of the enzyme at 288.5 rnp (0) and to measure- ments at 465 rnp of displacement of proflavin from complex with the enzyme ( l ) . Points were established by a computer calcula- tion giving the best value of ka4 for both experiments; lines were drawn according to a least squares computer calculation. Con- centrations in the final solutions were 37 MM or-chymotrypsin and 19 loll to 2.9 mrvr Ac-Phe-OMe for the spectral change measure- ments, and 9.5 pM a-chymotrypsin, 47.5 pM proflavin, and 19 mM to 2.9 mu Ac-Phe-OMe for the proflavin displacement experi- ments . Ionic strength of measured solutions was 0.4. Table I lists const.ants evaluated from these data.
TABLE I Pre-steady state constants pertaining to wchymotqpsin-
catalyzed hydrolysis of Ac-Phe-OMe Measurements of k23, ka,, and K’s were made at pH 3.1 and
25.0”. Ionic strength = 0.4. Designations of constants are in accordance with Equation 1.
Method of measurement km
xc-’
Spectral changes of en- zyme near 290 m$. . 0.20 f 0.11
Proflavin displacement.. 0.20 f 0.05
-
.-
-
K’s kd’ ~-
ntY set-
17 f. 8 0.03 27 f 6d 0.03
-
.-
-
kcat
see-1
0.03”
0 Computer value which gives the best lines (as determined by method of least squares) for data from both experiments.
b Actual measurements were made at 288.5 m/r. c Calculated from k23 and ka( according to Equation 2. Calcu-
lated also, on the basis of control of keat by an ionizing group of the enzyme with pK(app) -7, from a koat value of 2.5 se@ ob- served in the cr-chymotrypsin-catalyzed hydrolysis of the ethyl ester, Ac-Phe-OEt, at pH 5.0 and 25.5“ (see text).
d Calculated on the basis of a KBP value of 0.1 mM (10).
pH 5.0 yielded a kcat value of 2.5 see-l for this reaction, and on the assumption that kcat reaches a maximum value when an ionizing group of the enzyme with pK(app) 7.0 is completely ionized (for a review of this subject, see Reference 5), kcaf is expected to have a value of 0.03 see-l at pH 3.1 (see Table I). This is in agreement with a value of 0.03 see+ calculated from the rate constants i&y and k34 for koat of the Ac-Phe-OMe hy- drolysis.
Pre-Steady State Kinetic Investigations of ar-Chymotrypsin- catalyzed Hydrolysis of Ac-Trp-ONp-This reaction was in-
by guest on January 6, 2020http://w
ww
.jbc.org/D
ownloaded from
3488 Chymotrypsin-catalyzed Hydrolysis of Specific Substrates. IV Vol. 244, No. 13
TABLE II
Rate and equilibrium constants pertaining to a-chymotrypsin-catalyzed hydrolysis of AC-Trp-ONp
Stopped flow measurements were made at 26.5 f 0.5’ and steady state kinetic measurements at 25.0”. Eo, 80, and Fo refer to initial concentrations of enzyme, substrate and proflavin. All solutions contained 1.6% acetonitrile and had an ionic strength of 0.05. The solutions at pH levels 3.5 and 4.3 were buffered with potassium acetate.
PH
2.5 PM
E, = 4 or 8 So = 25-100 Fo = 50
Eo = 29-132 so = 2.0
Eo = 5 so = 25-100 Fo = 50
Eo = 5 so = 25-100
Eo = U-180 so = 2
E,, = 5 So = 25-100 Fo = 50
Proflavin
2.3-1 WC M-1 SW-
0.07 f 0.1
p-Nitrophenol 0.10 f 0.1
3.5 p-Nitrophenol 1.2 f 0.1 Proflavin 1.1 f 0.1
p-Nitrophenol 1.0 f 0.1 1.0
p-Nitrophenol 24 i 2b 1.3 f 0.1
4.3 p-Nitrophenol 9&l Proflavin 10 f 1
- 0 In presence of proflavin, the values reported are k~a/K’g [l + (Fo/KEP)I.
b These values are not considered valid. Apparent Michaelis-Menten kinetics is thought to arise due to a nonlinear relationship between kobs and enzyme concentration at constant SO (31) (see text).
dl
39 f 4b
18 f lb
- -
Concentrations
Stopped flow measurements
Observed release K’s X 106 kna/K’# X 10-e
Steady state measurements:
koat/Km @PP) X 10-s
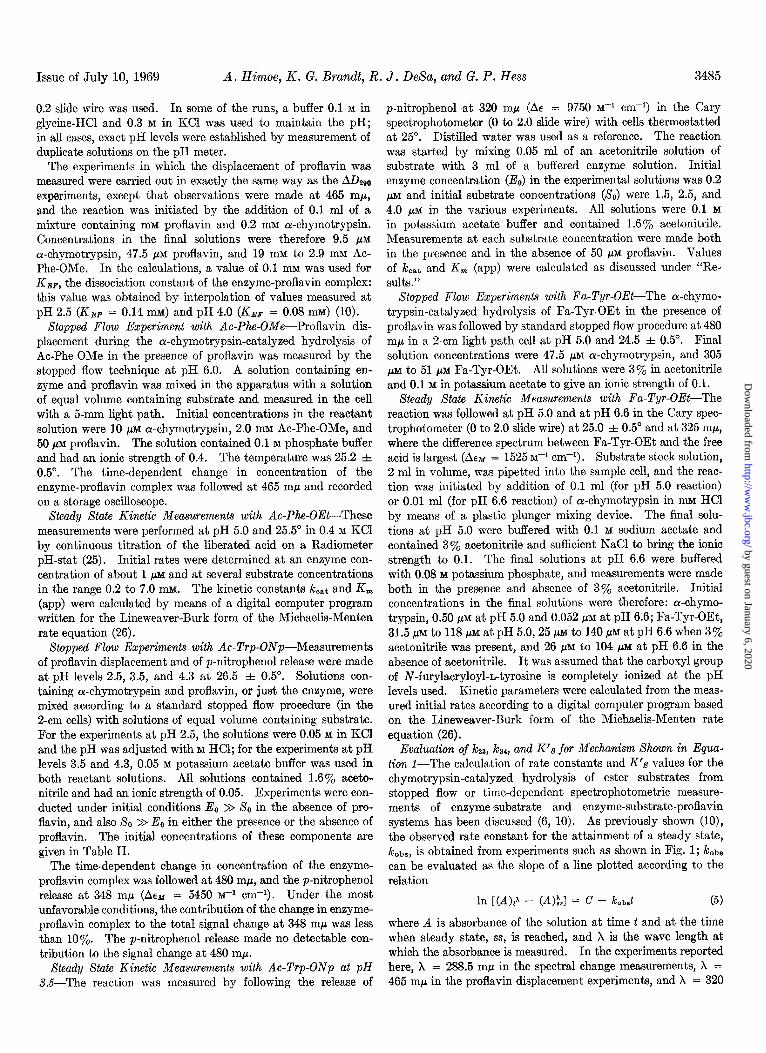
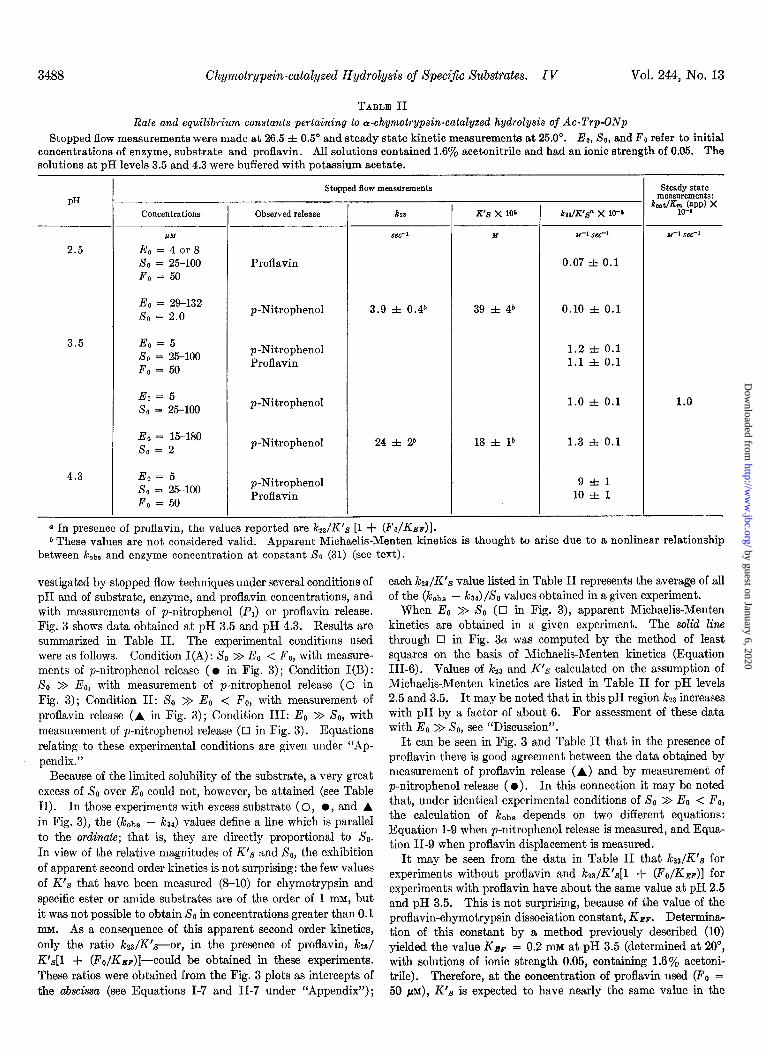
vestigated by stopped flow techniques under several conditions of pH and of substrate, enzyme, and proflavin concentrations, and with measurements of p-nitrophenol (Pi) or proflavin release. Fig. 3 shows data obtained at pH 3.5 and pH 4.3. Results are summarized in Table II. The experimental conditions used were as follows. Condition I(A): So >> E0 < Fo, with measure- ments of p-nitrophenol release ( l in Fig. 3) ; Condition I(B) : 80 > EO, with measurement of p-nitrophenol release (0 in Fig. 3) ; Condition II: So >> E. < F,, with measurement of proflavin release (A in Fig. 3); Condition III: E. >> X0, with measurement of p-nitrophenol release (~1 in Fig. 3). Equations relating to these experimental conditions are given under “Ap- pendix.”
Because of the limited solubility of the substrate, a very great excess of So over E. could not, however, be attained (see Table II). In those experiments with excess substrate ( 0, l , and A in Fig. 3), the (k& - ka4) values define a line which is parallel to the ordinate; that is, they are directly proportional to So. In view of the relative magnitudes of K’s and So, the exhibition of apparent second order kinetics is not surprising: the few values of K’s that have been measured (S-10) for chymotrypsin and specific ester or amide substrates are of the order of 1 InM, but it was not possible to obtain So in concentrations greater than 0.1 MM. As a consequence of this apparent second order kinetics, only the ratio k23/K’s--or, in the presence of proflavin, kzs/ K’s[l + (Fo/Kkp)]--could be obtained in these experiments. These ratios were obtained from the Fig. 3 plots as intercepts of the abscissa (see Equations I-7 and II-7 under “‘Appendix”);
each i&/K’s value listed in Table II represents the average of all of the (!&be - k~) /& values obtained in a given experiment.
When E. >> X0 (0 in Fig. 3), apparent Michaelis-Menten kinetics are obtained in a given experiment. The solid line through q in Fig. 3a was computed by the method of least squares on the basis of Michaelis-Menten kinetics (Equation 111-B). Values of i&3 and K’s calculated on the assumption of Michaelis-Menten kinetics are listed in Table II for pH levels 2.5 and 3.5. It. may be noted that in this pH region k23 increases with pH by a factor of about 6. For assessment of these data with E. > So, see “Discussion”.
It can be seen in Fig. 3 and Table II that in the presence of proflavin there is good agreement between the data obtained by measurement of proflavin release (A) and by measurement of p-nitrophenol release ( 0). In this connection it may be noted that, under identical experimental conditions of SO > EO < Fo, the calculation of k&s depends on two different equations: Equation I-9 when p-nitrophenol release is measured, and Equa- tion II-9 when proflavin displacement is measured.
It may be seen from the data in Table II that kz,/K’,g for experiments without proflavin and k&K’s[l + (FO/KBF)] for experiments with proflavin have about the same value at pH 2.5 and pH 3.5. This is not surprising, because of the value of the proflavin-chymotrypsin dissociation constant, KBF. Determina- tion of this constant by a method previously described (10) yielded the value Ksr = 0.2 mu at pH 3.5 (determined at 20”, with solutions of ionic strength 0.05, containing 1.6% acetoni- trile). Therefore, at the concentration of proflavin used (Fo = 50 PM), K’s is expected to have nearly the same value in the
by guest on January 6, 2020http://w
ww
.jbc.org/D
ownloaded from
Issue of July 10, 1969 A. Himoe, K. G. Brand, R. J. DeXa, and G. P. Hess 3489
16
l
r3 l 4 4f
21 ‘L-!-uL 0 2 4 6 8 IO 12 14
b)
0
4 0
6
ro O l
A 0 l
c 0 I 0
l A
k +A, (PM-kec-‘)
FIG. 3. The or-chymotrypsin-catalyzed hydrolysis of Ac-Trp- ONp as measured by the stopped flow technique at 26.5” at (a) pH 3.5 and (5) pH 4.3. Measurements were of the time-dependent change in concentration of the enzyme-proflavin complex as followed at 480 rnp or the p-nitrophenol release as followed at 348 m/l. Experimental conditions (see “Experimental Proce- dure”) are represented as: l , SO >> Eo < Fo, with measurement of p-nitrophenol release; 0, XO >> Ee, with measurement of p- nitrophenol release; A, SO >> Eo < Fo, with measurement of proflavin release; q , Eo >> So, with measurement of p-nitrophenol release (the line in a is drawn through these points). For experi- ments in which SO >> Eo, k represents (kobs - k& and Ao is SO; for experiments in which Eo >> SO, k represents koba and Ao is Eo. Solutions contained 0.05 M potassium acetate buffer and 1.6% acetonitrile, and had ionic strength of 0.05.
m 0 K 2 L
4, I I “I It
I f 0 IO 20
‘@I WS) x 104 (set-i)
t
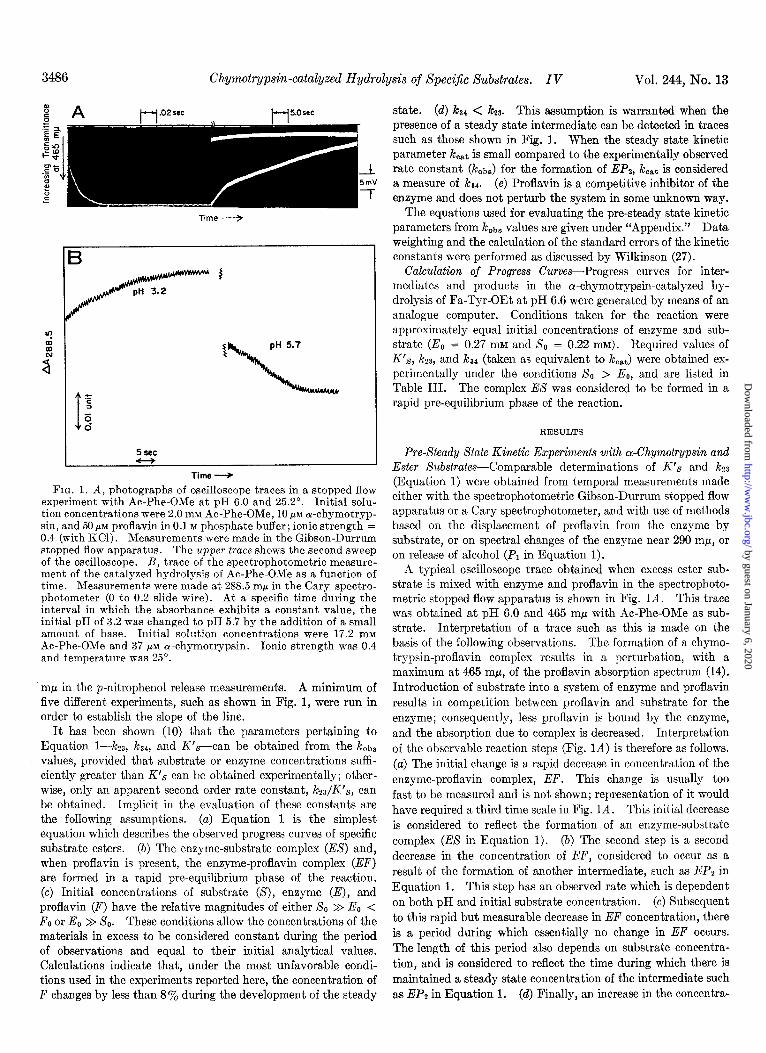
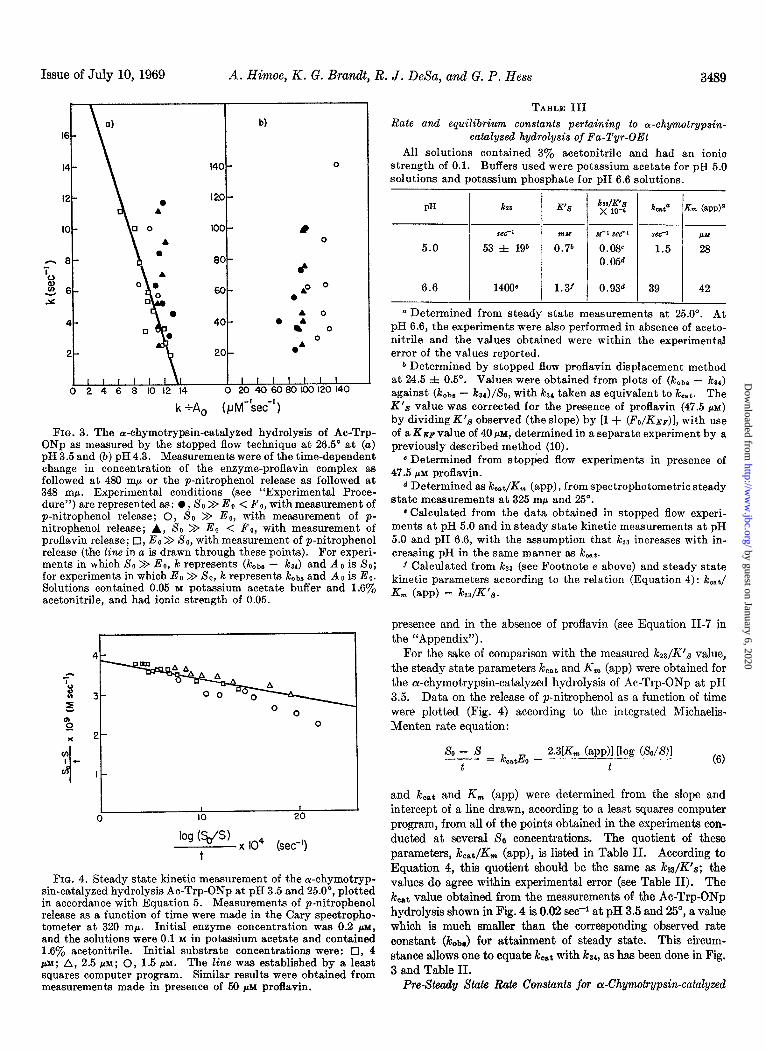
FIG. 4. Steady state kinetic measurement of the or-chymotryp- sin-catalyzed hydrolysis Ac-Trp-ONp at pH 3.5 and 25.0’, plotted in accordance with Equation 5. Measurements of p-nitrophenol release as a function of time were made in the Cary spectropho- tometer at 320 rnp. Initial enzyme concentration was 0.2 PM, and the solutions were 0.1 M in potassium acetate and contained 1.6% acetonitrile. Initial substrate concentrations were: 0, 4 PM; A, 2.5 PM; 0, 1.5 PM. The line was established by a least squares computer program. Similar results were obtained from measurements made in presence of 50 JIM proflavin.
TABLE III Rate and equilibrium constants pertaining to cr-chymotrypsin-
catalyzed hydrolysis of Pa-Tyr-OEt
All solutions contained 370 acetonitrile and had an ionic strength of 0.1. Buffers used were potassium acetate for pH 5.0 solutions and potassium phosphate for pH 6.6 solutions.
PH
5.0
kna K’S kdKps x 10-e kcaf Km (~PP)”
set ___ ~ ~-
0:; u-1 .wc- se-: PM
53 zk 19b 0.08” 1.5 28
6.6 1 1400 / 1.3f 1 1::: / 39 / 42 1 I I I
a Determined from steady state measurements at 25.0”. At pH 6.6, the experiments were also performed in absence of aceto- nitrile and the values obtained were within the experimental error of the values reported.
b Determined by stopped flow proflavin displacement method at 24.5 f 0.5’. Values were obtained from plots of (kobs - ka,) against (k&s - k&/L& with ksl taken as equivalent to kCat. The K’s value was corrected for the presence of proflavin (47.5 PM) by dividing K’s observed (the slope) by 11 + (Fo/KEP)], with use of a KEF value of 40 PM, determined in a separate experiment by a previously described method (10).
c Determined from stopped flow experiments in presence of 47.5 j&M proflavin.
d Determined as k,,t/K, (app), from spectrophotometric steady state measurements at 325 rnp and 25’.
8 Calculated from the data obtained in stopped flow experi- ments at pH 5.0 and in steady state kinetic measurements at pH 5.0 and pH 6.6, with the assumption that k23 increases with in- creasing pH in the same manner as k,,t.
f Calculated from 7~28 (see Footnote e above) and steady state kinetic parameters according to the relation (Equation 4): k,,J K, (app) = WK'S.
presence and in the absence of proflavin (see Equation II-7 in the “Appendix”).
For the sake of comparison with the measured i&s/K’s value, the steady state parameters koat and K, (app) were obtained for the ar-chymotrypsin-catalyzed hydrolysis of hc-Trp-ONp at pH 3.5. Data on the release of p-nitrophenol as a function of time were plotted (Fig. 4) according to the integrated Michaelis- Menten rate equation:
so - s - = kcatEo -
2.3L (app)l [log (&/S)l t t (6)
and kcat and K, (app) were determined from the slope and intercept of a line drawn, according to a least squares computer program, from all of the points obtained in the experiments con- ducted at several So concentrations. The quotient of these parameters, koat/K,,, (app), is listed in Table II. According to Equation 4, this quotient should be the same as kz/K’s; the values do agree within experimental error (see Table II). The kcat value obtained from the measurements of the Ac-Trp-ONp hydrolysis shown in Fig. 4 is 0.02 se@ at pH 3.5 and 25”, a value which is much smaller than the corresponding observed rate constant (Icob,,) for attainment of steady state. This circum- stance allows one to equate k,,t with k34, as has been done in Fig. 3 and Table II.
Pre-Steady State Rate Constants for cu-Chymotrypsin-catalyzed
by guest on January 6, 2020http://w
ww
.jbc.org/D
ownloaded from
3490 Chymotrypsin-catalyzed Hydrolysis of Specific Substrates. IV Vol. 244, No. 13
k Ob3 -k34 x 10-4 (M-' set-') so
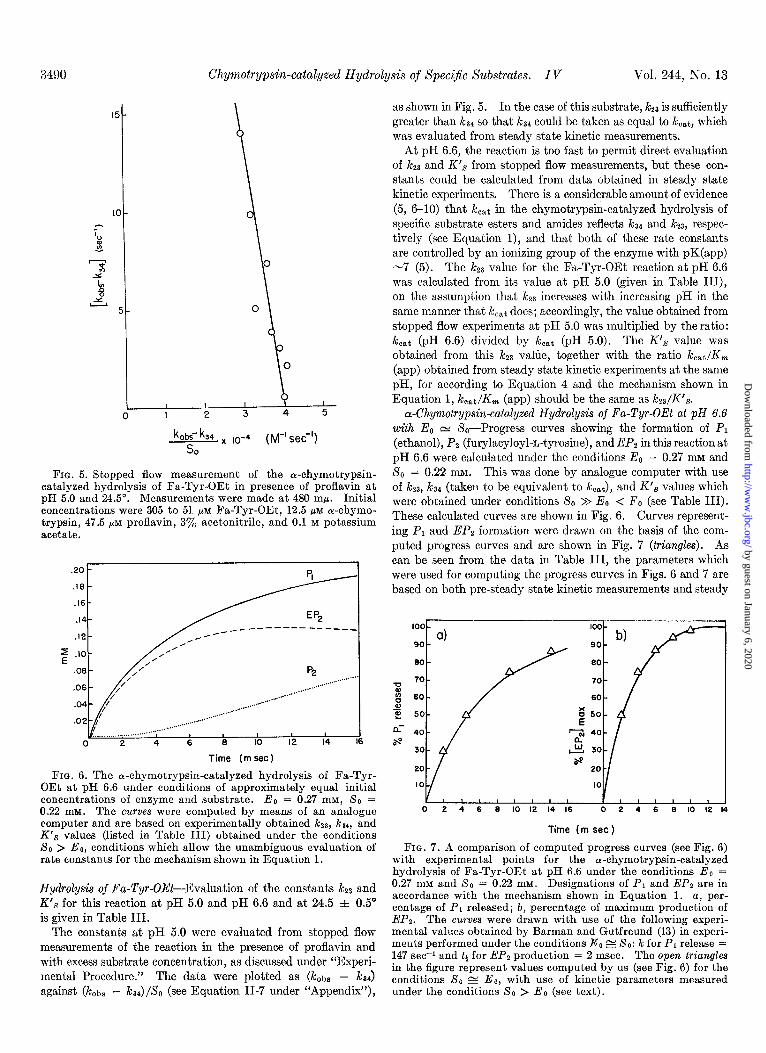
FIG. 5. Stopped flow measurement of the ol-chymotrypsin- catalyzed hydrolysis of Fa-Tyr-OEt in presence of proflavin at pH 5.0 and 24.5”. Measurements were made at 480 mp. Initial concentrations were 305 to 51 PM Fa-Tyr-OEt, 12.5 pM a-chymo- trypsin, 47.5 PM proflavin, 3’% acetonitrile, and 0.1 M potassium acetate.
.20 t PI-
.I8 .I6
J$ &---------T!---
9 ~,,,,,,...,...... ."".'
. . . . . . . . .
..' ,....... '.' .__.-
,....... ... /.....
.. ,.....-
I I I I I 6 8 IO 12 14
Time (m set)
FIG. 6. The ol-chymotrypsin-catalyzed hydrolysis of Fa-Tyr- OEt at pH 6.6 under conditions of approximately equal initial concentrations of enzyme and substrate. Eo = 0.27 mM, SO = 0.22 mM. The curves were computed by means of an analogue computer and are based on experimentally obtained kza, kar, and K’s values (listed in Table III) obtained under the conditions SO > Eo, conditions which allow the unambiguous evaluation of rate constants for the mechanism shown in Equation 1.
Hydrolysis of Fa-Tyr-OEt-Evaluation of the constants k23 and iYs for this reaction at pH 5.0 and pH 6.6 and at 24.5 f 0.5” is given in Table III.
The constants at pH 5.0 were evaluated from stopped flow measurements of the reaction in the presence of proflavin and with excess substrate concentration, as discussed under “Experi- mental Procedure.” The data were plotted as (k&s - i&4) against (JCobs - ,&)/SO (see Equation II-7 under “Appendix”),
as shown in Fig. 5. In the case of this substrate, k2s is sufficiently greater than kz4 so that i&4 could be taken as equal to kcat, which was evaluated from steady state kinetic measurements.
At pH 6.6, the reaction is too fast to permit direct evaluation of i&3 and K’s from stopped flow measurements, but these con- stants could be calculated from data obtained in steady state kinetic experiments. There is a considerable amount of evidence (5, 6-10) that kcat in the chymotrypsin-catalyzed hydrolysis of specific substrate esters and amides reflects ks4 and k23, respec- tively (see Equation I), and that both of these rate constants are controlled by an ionizing group of the enzyme with pK(app) -7 (5). The kZ3 value for the Fa-Tyr-OEt reaction at pH 6.6 was calculated from its value at pH 5.0 (given in Table III), on the assumption that kZ3 increases with increasing pH in the same manner that ,& does; accordingly, the value obtained from stopped flow experiments at pH 5.0 was multiplied by the ratio: koat (pH 6.6) divided by kcat (pH 5.0). The K’s value was obtained from this k23 vahie, together with the ratio kc&Km (app) obtained from steady state kinetic experiments at the same pH, for according to Equation 4 and the mechanism shown in Equation 1, i&/Km (app) should be the same as k&K’s.
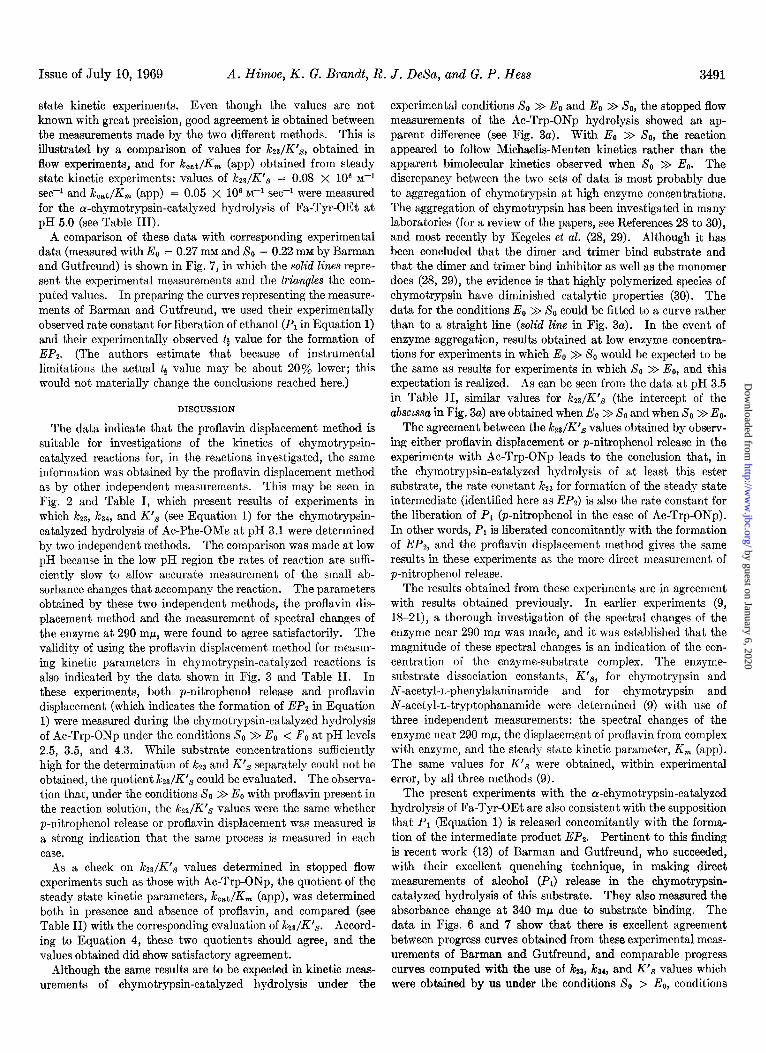
a-Chymotrypsin-catalyzed Hydrolysis of Fa-Tyr-OEt at pH 6.6 with E. N &-Progress curves showing the formation of PI (ethanol), Pz (furylacyloyl-L-tyrosine), and EP2 in this reaction at pH 6.6 were calculated under the conditions Eo = 0.27 mM and So = 0.22 mu. This was done by analogue computer with use of k23, ks4 (taken to be equivalent to k,,t), and K’s values which were obtained under conditions So >> E. < F. (see Table III). These calculated curves are shown in Fig. 6. Curves represent- ing PI and EP2 formation were drawn on the basis of the com- puted progress curves and are shown in Fig. 7 (triangles). As can be seen from the data in Table III, the parameters which were used for computing the progress curves in Figs. 6 and 7 are based on both pre-steady state kinetic measurements and steady
I I I I I I I I I I I I I
0 2 4 6 6 IO 12 14 16 0 2 4 6 6 IO 12
Time (m set )
FIG. 7. A comparison of computed progress curves (see Fig. 6) with experimental points for the a-chymotrypsin-catalyzed hydrolysis of Fa-Tyr-OEt at pH 6.6 under the conditions Ea = 0.27 mM and SO = 0.22 mM. Designations of PI and EP2 are in accordance with the mechanism shown in Equation 1. a, per- centage of PI released; b, percentage of maximum production of EPt. The curves were drawn with use of the following experi- mental values obtained by Barman and Gutfreund (13) in experi- ments performed under the conditions Eo s SO: k for PI release = 147 set+ and tt for EPt production = 2 msec. The open triangles in the figure represent values computed by us (see Fig. 6) for the conditions SO z Eo, with use of kinetic parameters measured under the conditions SO > EO (see text).
by guest on January 6, 2020http://w
ww
.jbc.org/D
ownloaded from
Issue of July 10, 1969 A. Himoe, K. G. Bran&, R. J. DeSa, and G. P. Hess 3491
state kinetic experiments. Even though the values are not known with great precision, good agreement is obtained between the measurements made by the two different methods. This is illustrated by a comparison of values for ~s/K’~, obtained in flow experiments, and for i&/Km (app) obtained from steady state kinetic experiments: values of k2s/K’, = 0.08 X lo6 Me’
set-1 and kc&Km (app) = 0.05 x lo6 M+ set-1 were measured for the cr-chymotrypsin-catalyzed hydrolysis of Fa-Tyr-OEt at pH 5.0 (see Table III).
A comparison of these data with corresponding experimental data (measured with E0 = 0.27 mu and So = 0.22 mu by Barman and Gutfreund) is shown in Fig. 7, in which the solid lines repre- sent the experimental measurements and the triangles the com- puted values. In preparing the curves representing the measure- ments of Barman and Gutfreund, we used their experimentally observed rate constant for liberation of ethanol (P, in Equation 1) and their experimentally observed 4 value for the formation of EP2. (The authors estimate that because of instrumental limitations the actual tt value may be about 20% lower; this would not materially change the conclusions reached here.)
DISCUSSION
The data indicate that the proflavin displacement method is suitable for investigations of the kinetics of chymotrypsin- catalyzed reactions for, in the reactions investigated, the same information was obtained by the proflavin displacement method as by other independent measurements. This may be seen in Fig. 2 and Table I, which present results of experiments in which kz, i&a, and K’s (see Equation 1) for the chymotrypsin- catalyzed hydrolysis of Ac-Phe-OMe at pH 3.1 were determined by two independent methods. The comparison was made at low pH because in the low pH region the rates of reaction are suffi- ciently slow to allow accurate measurement of the small ab- sorbance changes that accompany the reaction. The parameters obtained by these two independent methods, the proflavin dis- placement method and the measurement of spectral changes of the enzyme at 290 m/l, were found to agree satisfactorily. The validity of using the proflavin displacement method for measur- ing kinetic parameters in chymotrypsin-catalyzed reactions is also indicated by the data shown in Fig. 3 and Table II. In these experiments, both p-nitrophenol release and proflavin displacement (which indicates the formation of EP2 in Equation 1) were measured during the chymotrypsin-catalyzed hydrolysis of Ac-Trp-ONp under the conditions So >> E0 < F. at pH levels 2.5, 3.5, and 4.3. While substrate concentrations sufficiently high for the determination of Jc23 and K’, separately could not be obtained, the quotient ,&+3/K’s could be evaluated. The observa- tion that, under the conditions So >> EO with proflavin present in the reaction solution, the &S/K’8 values were the same whether p-nitrophenol release or proflavin displacement was measured is a strong indication that the same process is measured in each case.
As a check on h~ts/K’~ values determined in stopped flow experiments such as those with Ac-Trp-ONp, the quotient of the steady state kinetic parameters, k&K, (app), was determined both in presence and absence of proflavin, and compared (see Table II) with the corresponding evaluation of kta/K’,. Accord- ing to Equation 4, these two quotients should agree, and the values obtained did show satisfactory agreement.
Although the same results are to be expected in kinetic meas- urements of chymotrypsin-catalyzed hydrolysis under the
experimental conditions So >> EO and Eo >> So, the stopped flow measurements of the Ac-Trp-ONp hydrolysis showed an ap- parent difference (see Fig. 3~). With EO >> So, the reaction appeared to follow Michaelis-Menten kinetics rather than the apparent bimolecular kinetics observed when So >> E,. The discrepancy between the two sets of data is most probably due to aggregation of chymotrypsin at high enzyme concentrations. The aggregation of chymotrypsin has been investigated in many laboratories (for a review of the papers, see References 28 to 30), and most recently by Kegeles et al. (28, 29). Although it has been concluded that the dimer and trimer bind substrate and that the dimer and trimer bind inhibitor as well as the monomer does (28, 29), the evidence is that highly polymerized species of chymotrypsin have diminished catalytic properties (30). The data for the conditions E, >> So could be fitted to a curve rather than to a straight line (solid line in Fig. 3a). In the event of enzyme aggregation, results obtained at low enzyme concentra- tions for experiments in which EO >> So would be expected to be the same as results for experiments in which So >> E,,, and this expectation is realized. As can be seen from the data at pH 3.5 in Table II, similar values for k23/Kt8 (the intercept of the abscbssa in Fig. 3a) are obtained when E. >> SC and when So > E,,.
The agreement between the ?c~~/K’~ values obtained by observ- ing either proflavin displacement or p-nitrophenol release in the experiments with Ac-Trp-ONp leads to the conclusion that, in the chymotrypsin-catalyzed hydrolysis of at least this ester substrate, the rate constant JG23 for formation of the steady state intermediate (identified here as EP2) is also the rate constant for the liberation of PI (p-nitrophenol in the case of Ac-Trp-ONp). In other words, PI is liberated concomitantly with the formation of EP2, and the proflavin displacement method gives the same results in these experiments as the more direct measurement of p-nitrophenol release.
The results obtained from these experiments are in agreement with results obtained previously. In earlier experiments (9, l&21), a thorough investigation of the spectral changes of the enzyme near 290 rnp was made, and it was established that the magnitude of these spectral changes is an indication of the con- centration of the enzyme-substrate complex. The enzyme- substrate dissociation constants, K’,, for chymotrypsin and N-acetyl-n-phenylalaninamide and for chymotrypsin and N-acetyl-n-tryptophanamide were determined (9) with use of three independent measurements: the spectral changes of the enzyme near 290 mp, the displacement of proflavin from complex with enzyme, and the steady state kinetic parameter, K, (app). The same values for K’, were obtained, within experimental error, by all three methods (9).
The present experiments with the cu-chymotrypsin-catalyzed hydrolysis of Fa-Tyr-OEt are also consistent with the supposition that PI (Equation 1) is released concomitantly with the forma- tion of the intermediate product EP2. Pertinent to this finding is recent work (13) of Barman and Gutfreund, who succeeded, with their excellent quenching technique, in making direct measurements of alcohol (PJ release in the chymotrypsin- catalyzed hydrolysis of this substrate. They also measured the absorbance change at 340 rnp due to substrate binding. The data in Figs. 6 and 7 show that there is excellent agreement between progress curves obtained from these experimental meas- urements of Barman and Gutfreund, and comparable progress curves computed with the use of i&s, ka+ and KIS values which were obtained by us under the conditions So > EO, conditions
by guest on January 6, 2020http://w
ww
.jbc.org/D
ownloaded from
3492 Chymotrypsin-catalyzed Hydrolysis of Specific Substrates. IV Vol. 244, No. 13
which allow unambiguous evaluation of rate constants for the mechanism shown in Equation 1.
It should be noted that, even though the experiments reported here provide no evidence for the existence of additional inter- mediates on the pathway between ES and EP2 in Equation 1,
these experiments do not, of course, prove that such intermediates do not exist.
In conclusion, the data presented here are consistent with the mechanism shown in Equation 1 for the chymotrypsin-catalyzed hydrolysis of specific substrate esters, which shows alcohol (PI) released concomitantly with the formation of the intermediate EPs. The results also indicate that the proflavin displacement method is suitable for measuring the kinetics of the chymo- trypsin-catalyzed hydrolysis of specific substrates. The deter- mination of the rate constants I& and i&4 and the dissociation constant K’s for a series of ch.ymotrypsin-specific substrate esters and the pH and temperature dependence of these parameters will be reported in a subsequent publication.
APPENDIX
Equations for Evaluation of Pre-Steady State Kinetic Parameters of cr-Chymotrypsin-catalyxed Hydrolysis of Specific
Substrate Esters
In the equations below, E, F, S, PI, EF, SF, and EP2 refer to molar concentrations as defined in Equation 1 of the text and the subscript zero indicates initial analytical concentration (total concentration of the substance in all its forms). K’S and KBp are the enzyme-substrate and enzyme-proflavin dissociation constants; k&s is the experimentally observed rate constant for the reaction; and K’s, &a, and i&4 are as defined by Equation 1 of the text.
Condition I(A): SO >> E. < Fo, with Jleasurement of PI Re- lease-
Also:
Eo = E + ES + EF + EP2 (1-l)
K’ _ Q-m%) ; K (E) (Fo) S-ES EF = 7
Therefore
E = 2 (ES) = Ke (EF) (I-2)
and
EF = F (ES) K$p or ES = (EF) Ke u-31 0
Substitution of Equations I-2 and I-3 into Equation I-l yields
E,, = ES 1 +K$ +EP2 ( >
where Z = 1 + (Fo/K&F). Therefore
EPa = Eo - (ES) So + K$Z
So
dE(EPz)
(I-4)
d E,, - (ES) So +SoKgz 1 at (I-5)
= kzr(ES) - kar Eo - (ES) So + K&Z
So 1 Integration of Equation I-5 gives the concentration of ES at time t:
tESlt = EoSo
Sotkta + kd + IdW
-[ ka4 + (so yfbz) e-+obst] (I-@
k kaa&
Ohs = So + K$Z + 7Q4 (I-7)
d(p1) = k (EfJ kzaEoSo = dt
23 SoCksa + Jc34) + 44KbZ
Integration of Equation I-8 gives the concentration of PI at time t:
ma = kzaks4EooSot
So(kza + kad + kaKJ
+ Eo e--kobst)
(I-9)
When P1 is determined as a function of time, k&s can be evalu- ated by use of a modified Guggenheim plot, used previously by Gutfreund and Sturtevant (2). Then when, Z and k34 are known, Equation I-7 can be used to evalua,te ksr and K’s from the kobs values determined at various substrate concentrations.
Condition I(B): 80 >> Eo, with Measurement of Pl Release-The pertinent equations are those given above, without terms in- volving proflavin (Fo, EF, KBP). Equations I-4 through I-Q, with 2 = 1, are applicable.
Condition II: SO >> Eo < Fo, with Measurement of ProJlavin Release-Equations I-2 and I-3 (above) are applicable. Sub- stitution of Equations I-2 and I-3 into Equation I-l yields:
Eo = EF KEF So
K$ + 7 K’ + 1 + EPz 0 s
Therefore:
EPz = Eo - (EF)@
where
.++ Kg+1
Then, since
4-W - = kla(ES) - kaJ(EP)
dt
Therefore: it follows that
by guest on January 6, 2020http://w
ww
.jbc.org/D
ownloaded from
Issue of July 10, 1969 A. Himoe, K. G. Brandt, R. J. DeSa, and G. P. Hess 3493
d[Eo - (EF)@‘j = k 23
(EF) KEPsO - - k&fo - FOK:,
(EF)@] (11-5) dt
Integration of Equation II-5 gives the concentration of EF at time t:
[EFII = EoFo
S,,(kza + kd + k&3
where
k kd’o
Ohs = So + K$Z + ka (11-7)
The steady state concentration of EF is obtained from a combina- tion of Equations I-l, I-2, and I-3, and the relation lc23 (EX) = k34 W’S .
karEoFo
[EF1’8 = So(kza + k& -I- k34K$Z (11-S)
Then
K&So(kas + kd + ks4K$zl e-‘oba* I
(11-9) K$Fo
Here (A465)t is the absorbance of the solution in the stopped flow apparatus at 465 mp at a time t, and (A4&s is the absorbance when a steady state concentration of material absorbing at 465 mp (F and EF) has been reached (see Fig. 1). The kobs value can be evaluated from
In [C&O& - L&&l = C - &bat (11-10)
With such determinations of kobs at various substrate concentra- tions, lc~ and K’s can be evaluated according to Equation 11-7, provided that Z and ks4 are known.
Condition III: E. >> SO, with Measurement of PI Release-
So = S + ES + PI (III-l)
K, = C-730) (8 9
ES ; or S = 2 (EX) (111-2)
Substitution of Equation III-2 into Equation III-1 yields
Therefore
(III-B EoSo
ES=K;3’+Eo- AEo
K;, + Eo
‘0 = k&ES) = kzs EoSo Eo
at K;3 + Eo - PI K; + Eo 1 (111-4)
Integration of Equation III-4 gives the concentration of PI at time t:
[P& = SO (1 - ewkobst) (111-5)
where
k kzsEo
Ohs = K:, + Eo (111-6)
When PI is determined as a function of time, k&s can be evalu- ated from
In - So - [“” = -kkobst SO
(111-7)
Then, with the determination of k at various initial enzyme con- centrations, i&a and K’s can be determined by the use of Equa- tion 111-6.
REFERENCES
1. HARTLEY, B. S., AND KILBY, B. A., Biochem. J., 66,288 (1954). 2. GUTFREUND, H., AND STURTEVANT, J. M., Biochem. J., 63,
666 (1956). 3. FALLER. L., AND STURTEVANT, J. M., J. Biol. Chem., 241,
4825 (1968). 4. OOSTERBAAN. R. A.. AND VAN ADRICHEM. M. E.. Biochim.
5.
6.
7.
8.
9.
10.
11.
12.
13.
14.
15.
16. 17.
18.
19.
20.
21.
22.
23.
24.
25.
26.
27. 28.
29. 30.
Biophys. Acta, 27, h23 (1958). BENDER, M. L., AND KJ~ZDY, F. J., Annu. Rev. Biochem., 34,
49 (1965). BRANDT, K. G., AND HESS, G. P., Biochem. Biophys. Res.
Commun., 22, 447 (1966). HIMOE, A., AND HESS, G. P., Biochem. Biophys. Res. Commun.,
23, 234 (1966). HIMOE, A., PARKS, P. C., AND HESS, G. P., J. Biol. Chem.,
242, 919 (1967). HIMOE, A., BRANDT, K. G., AND HESS, G. P., J. Biol. Chem,,
242, 3963 (1967). BRANDT, K. G., HIMOE, A., AND HESS, G. P., J. Biol. Chem.,
242,3973 (1967). LABOUESSE, B., OPPENHEIMER, H. L., AND HESS, G. P.,
Biochem. .Biophys. Res. Commkn., 14, $18 (1964). OPPENHEIMER. H. L.. LABOUESSE. B.. AND HESS, G. P., J.
Biol. Chem.,‘241, 2i20 (1966). ’ ’ BARMAN, T. E., AND GUTFREUND, H., Biochem. J., 101, 411
(1966). BERNHARD, S. A., LEE, B. F., AND TASHJIAN, Z. H., J. Mol.
Biol., 18, 405 (1966). WEINER, H., WHITE, W. N., HOARE, D. G., AND KOSHLAND,
D. E.. JR., J. Amer. Chem. Sot., 88, 3851 (1966). GLAIER; A. k., Proc. Nat. Acad. S&. U. S. A., 64; 171 (1966). BERNHARD. S. A.. AND GUTFREUND. H.. Proc. Nat. Acad. Sci.
U. S. A.; 63, li38 (1965). ’ ’ WOOTTON, J. F., AND HESS, G. P., J. Amer. Chem. Sot., 84,
440 (1962). HAVSTEEN, B. H., AND HESS, G. P., J. Amer. Chem. Sot., 84,
448 (196i). MOON. A. Y.. MERCOUROFF. J.. AND HESS. G. P.. J. Biol.
Chem., 240, ?‘17 (1966). ’ ’ MOON, A. Y., STURTEVANT, J. M., AND HESS, G. P., J. Biol.
Chem., 240, 4204 (1965). DIXON, G. H., AND NEURATH, H., J. Biol. Chem., 226, 1049
(1957). WILCOX, P. E., KRAUT, J., WADE, R. D., AND NEURATH, H.,
Biochim. Biophys. Acta, 24, 72 (1957). INGLES, D. W., AND KNOWLES, J. R., Biochem. J., 104, 369
(1967). SCHWERT, G. W., NEURATH, H., KAUFMAN, S., AND SNOKE,
J. E., J. Biol. Chem., 172, 221 (1948). LINEWEAVER, H., AND BURK, D., J. Amer. Chem. Sot., 66,
658 (1934). WILKINSON, G. N., Biochem. J., 80, 324 (1961). SARFARE, P. S., KEGELES, G., AND KWON-RHEE, S. J., Bio-
chemistry, 6, 1389 (1966). MORIMOTO, K., AND KEC)ELES, G., Biochemistry, 6,3007 (1967). INAGAMI, T., AND STURTEVANT, J. M., Biochemistry, 4, 1330
(1965).
by guest on January 6, 2020http://w
ww
.jbc.org/D
ownloaded from
Albert Himoe, Karl G. Brandt, Richard J. DeSa and George P. HessINVESTIGATION OF THE CATALYTIC HYDROLYSIS OF ESTERS
IV. PRE-STEADY STATE KINETIC APPROACHES TO THE Investigations of the Chymotrypsin-catalyzed Hydrolysis of Specific Substrates:
1969, 244:3483-3493.J. Biol. Chem.
http://www.jbc.org/content/244/13/3483Access the most updated version of this article at
Alerts:
When a correction for this article is posted•
When this article is cited•
to choose from all of JBC's e-mail alertsClick here
http://www.jbc.org/content/244/13/3483.full.html#ref-list-1
This article cites 0 references, 0 of which can be accessed free at
by guest on January 6, 2020http://w
ww
.jbc.org/D
ownloaded from