investigations of historical objects utilizing spectroscopy and other optical methods
TRANSCRIPT

Investigations of Historical Objects UtilizingSpectroscopy and Other Optical Methods
Jacqueline S. Olin, Maurice E. Salmon, and Charles H. Olin
Historical investigations employing spectroscopy and other optical methods frequently date from thetime the instrument was first introduced into the field of analysis or physical examination. The use ofoptical emission spectrography in the study of ancient metals dates from 1931 when an extensive investi-gation on the metallurgy of central Europe was first begun. This investigation has been continued intothe present. Analyses, which must be performed on a microscale, were done, and frequently still are,by observing reactions of the sample and reagents under a light microscope: chemical microscopy. Asthe usefulness of methods such as the electron microprobe, ir spectrophotometry, and powder x-ray dif-fraction techniques has become more evident, these and others have been used in the identification ofpigments and other inorganic samples as well as of organic materials.
Introduction
The instruments and techniques of modern sciencecan be used in the study of works of art and historicallyimportant objects in a way that can reinforce the sty-listic methods that have existed for a long time. Someof the evidence obtained can be evaluated strictly asscientific data, as in dating techniques involving radio-active isotopes. Generally, however, the technicalhistory of the object and the materials from which it ismade plays an important part in understanding thescientific results. Some of the techniques are merelyextensions of the purely visual examination that is themeans of collecting stylistic evidence. These would in-clude the use of visual microscopy and photography us-ing uv or ir transmittance or reflectance. Other pro-cedures involve taking samples and analyzing them, fre-quently using micro or semimicro techniques.
In a general paper such as this one, it is not possibleeither to cover the whole range of the subject or to givea truly comprehensive or detailed account of any onepart. What we have chosen to do, therefore, is tointroduce the reader to a number of examples. Theseare examples of the use of optical and spectroscopicmethods in the study of historical objects and works ofart.
The first two authors are with the Conservation-AnalyticalLaboratory, U.S. National Museum, Smithsonian Institution,Washington, D.C. 20560; the last named author is with the Con-servation Laboratory, National Portrait Gallery-National Col-lection of Fine Arts, Smithsonian Institution, Washington, D.C.20560.
Received 21 May 1968.
The scope of the work being done in laboratories inmany parts of the world is fairly extensive. A numberof projects are under way that involve the accumulationof results of analysis from a large number of samples.Examples of these include the use of ir spectrophotom-etry for the analysis and classification of fossil resinsamples and artifacts made from them' and the analysisof ceramics or glasses by methods such as optical emis-sion spectrography or neutron activation analysis.2' 3
Fossil resins such as amber were used in antiquity tomake many kinds of objects; also there are accounts ofthe trade of amber. As a result, the question of theorigins of the fossil resins has been raised. Chemistshave analyzed samples to try to find some characteristiccomposition that could be used to relate these fossilresins to particular geographic sources of origin, but noreal success was made until the recent application of irspectrophotometry to the problem.
In addition to the study of samples and artifacts fromknown geographic locations, the investigators, using irspectrophotometry, have analyzed recent and fossilresin samples from known botanical sources.4 Theyhave concluded that the ir spectrum of a resin does notchange markedly as it ages, and they have also been ableto assign characteristic spectra to the resins of givenbotanical sources.
Pressed pellets can be prepared by mixing milligramsamples of the resin sample with KBr and a usefulspectrum can be easily prepared. The work beingdone by Beck and his co-workers at Vassar Collegein establishing reference spectra will eventually be usefulin identifying the spectrum obtained from a sample offossil resin in terms of its geographic or botanical origin.
Neutron activation analysis is being used as themeans of trace analysis to determine quantitatively the
January 1969 / Vol. 8, No. 1 / APPLIED OPTICS 29

1.4 1.6 1.8
Fig. 1. Gamma spectrum resulting from neutronment of 200-mg sample of ceramic material showing
elements present. (Reprinted by courtesy of E.Brookhaven National Laboratory.)
bombard-five of theV. Sayre,
differences in composition in samples of ceramics fromdifferent pottery sources.5-7 One of the authors (JSO)is studying English and American pottery of theAmerican Colonial Period using this technique.
The development of high resolution, solid state de-tectors enables one to analyze nondestructively a sam-ple of 200 mg or less for as many as eleven elements.Figure 1 shows a gamma spectrum showing five of theseelements.
Many of the materials used in objects of historicalimportance are no longer the subject of general investi-gation.
Ancient Dyes
One particularly interesting material, and one thathas recently been investigated using electron spinresonance spectroscopy, is the famous shellfish dye ofantiquity, Tyrian purple. Tyrian purple was firstinvestigated in 1908 by Paul Friedlander (discoverer,among others, of the well-known bright red thio-indigodyestuff). In order to collect enough sample, Fried-lander had to use 12,000 shellfish of the species Murexbrandaris which is found in the Mediterranean nearTrieste. From these he extracted about 1.5 g of thedyestuff. He began the investigation in the belief thatthe purple was a red dye and he suspected it might beidentical with his dye, thio-indigo. His experimentsrevealed, however, that the dyestuff from the Murexbrandaris is not the same as the red thio-indigo, butrather more like a violet dyestuff 6,6'-dibromo-indigowhich had been prepared a few years earlier by theGerman chemists Sachs and Kempf.
Bruin and co-workers8 in 1961 identified 6,6'-dibromo-indigo in the dyestuff from the species M1'Iurex trunculus.Their work was done using electron spin resonancespectroscopy and required only a few of the shellfish inorder to provide enough sample. The species, Murextrunculus, was used by the Phoenicians. The people inthe towns Tyre and Sidon, in the south of Lebanon,
were very skillful in extracting the dye and in dyeingthe wool. The substance present in the gland of theshellfish has been identified as 6-bromo-indolyl sulfuricacid. When this compound comes into contact withthe oxygen of the air, the dye itself is formed. Theformulas of 6-bromo-indolyl sulfuric acid and of Tyrianpurple are:
OSO3H
Br): CHH
02
Mttany other species of shellfish were used by the dyersof antiquity to obtain a dye. A species, Purpurapatula pansa, is still being used on the western coast ofSouth America. The dye from this species was re-cently investigated using visible spectrophotometry. 9
Examples of pre-Columbian textiles which were dyedwith unknown dyes prompted the investigation.
Metal ObjectsThe history of analytical methods in archaeological
research is deeply rooted in the analysis of metallicartifacts. As early as 1842, Gobel10 recognized brassas an alloy peculiar to the Romans. There were anumber of papers reporting the results of analyses ofarchaeological materials that preceded Gbbel's, but thiswas the first attempt at any correlation between compo-sition and source. There were several interveningpapers reporting the analyses of archaeological artifacts,but the next important milestone was the publication oftwo papers by Wbcel'1 that, in addition to reportingthe results of some original analyses, gave a criticalsummary of many previously reported analyses andsuggested the possibility of correlating the compositionof ancient bronzes with the time and place of theirorigin. Fellenberg, one of the most prolific analysts,published a dozen papers in the period 1860 to 186612devoted to the analysis of prehistoric bronze artifacts.However, von Bibra's book Die Bronzen und Kupfer-legierunqen der alien and ditesten Vilker mit Riicksicht-nahme auf jene der Neuzeit, published at Erlangen in1869, remains as the monumental work of this period.
A very good review of this early work was given byCaley"3 at the Symposium on Archaeological Chemistryduring the 117th Meeting of the American ChemicalSociety in Philadelphia in 1950.
The early work was done by wet chemical methods,and relatively large samples were required. The size ofthe sample required for wet chemical analysis has, inmany cases, been a severe limitation on the numbers andtypes of objects available for analysis. The archaeolo-gists and curators are, understandably, reticent aboutallowing relatively large samples to be taken fromunique or well preserved objects.
The advent of instrumental and microchemicalmethods of analysis and the attendant capability ofworking with minimal sample is opening the collectionsto the work of the museum analyst. Curators and
30 APPLIED OPTICS / Vol. 8, No. 1 / January 1969
20
C',
ZH
z
'3Hr
cM
Z3
z~f
HU,
15
I0
5
Sc4 6
I I I I Il
Sc4 6
FN59
,1 N.24 Na,24
l I I I I I I I
0.4 0.6 0.8 1.0 1.2ENERGY IN MeV
archaeologists are much more willing to submit theirfiner objects for analysis when they are assured that theanalytical technique will be either nondestructive orrequire, at most, only a few milligrams of sample.
One of the first instrumental techniques to come intowidespread use in the museum field for the analysis ofmetallic artifacts was optical emission spectrography.In 1931, Otto and Witter,' 4 working in connection withthe Landesmuseum of Halle/Saale, had already startedan extensive, systematic research on the metallurgy ofcentral Europe. These workers were attempting toestablish a rationale for the distinction of age and prov-enance by examination of the trace and major elementcompositional patterns found through the analyses ofgroups of well-dated objects. They published the re-sults of about 1500 analyses in 1952. They studiedboth the sequence of metals used in alloying and thepossible sources, but they also recognized the need formore information on the sources of raw materials.
In Austria, in about 1935, Pittioni'5 embarked on asystematic program of investigating not only the arti-facts, but also the ore bodies that were the probablesources of raw materials. He limited his efforts to theregions of early exploitation in the Tyrol and Salzburg.By 1952 about 3400 samples had been analyzed and re-ported. From this body of information, Pittioni wasable to draw conclusions as to the provenance of mate-rials for several groups of objects that he studied.
Junghans et al., 6 working in Stuttgart since 1949,are continuing a very extensive survey of copper andbronze metallurgy. They are covering the samechronological span as Otto and Witter but they haveextended their geographical coverage to include thesources of metallurgy in the Near East and throughoutEurope. The results of 2300 analyses covering theareas of Central and Western Europe were publishedin 1960. Junghans et al. are aiming at two basic typesof information: the first is to shed some light on theorigin of systematic metallurgy-the beginning of in-tentional alloying such as tin-bronze-and the secondis the correlation of trace element patterns with prov-enance of materials.
It is from these roots that the field of archaeologicalanalysis of metallic artifacts has grown. It now em-braces almost every instrumental technique presentlyin use.
In practice, the first, and most obvious, actionupon receipt of an object for analysis is to perform adetailed visual examination, and photograph pertinentdetails.
In the course of simple visual examination, detailsof the method of manufacture are often revealed. Anexample of this occurred during the recent examinationof some George III Peace Medals which were struckin England between 1770 and 1780.
The George III medals were struck in silver withhigh relief. They are 79 mm in diameter, and the re-lief is as much as 3 mm above the field. A medal ofthis size and high relief was difficult to raise in a singlestriking and it would have been necessary to use multi-ple strikings with intermediate anneals. It was neces-
sary to produce these medals in relatively large quan-tity and it was necessary to shortcut the productionmethods.
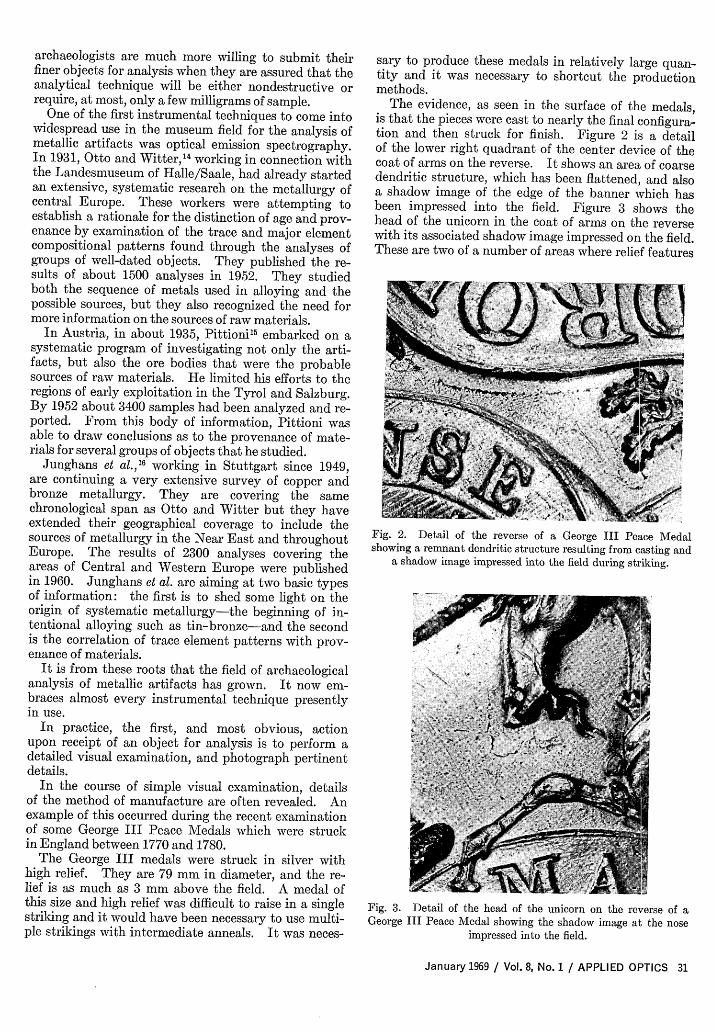
The evidence, as seen in the surface of the medals,is that the pieces were cast to nearly the final configura-tion and then struck for finish. Figure 2 is a detailof the lower right quadrant of the center device of thecoat of arms on the reverse. It shows an area of coarsedendritic structure, which has been flattened, and alsoa shadow image of the edge of the banner which hasbeen impressed into the field. Figure 3 shows thehead of the unicorn in the coat of arms on the reversewith its associated shadow image impressed on the field.These are two of a number of areas where relief features
Fig. 2. Detail of the reverse of a George III Peace Medalshowing a remnant dendritic structure resulting from casting and
a shadow image impressed into the field during striking.
Fig. 3. Detail of the head of the unicorn on the reverse of aGeorge III Peace Medal showing the shadow image at the nose
impressed into the field.
January 1969 / Vol. 8, No. 1 / APPLIED OPTICS 31
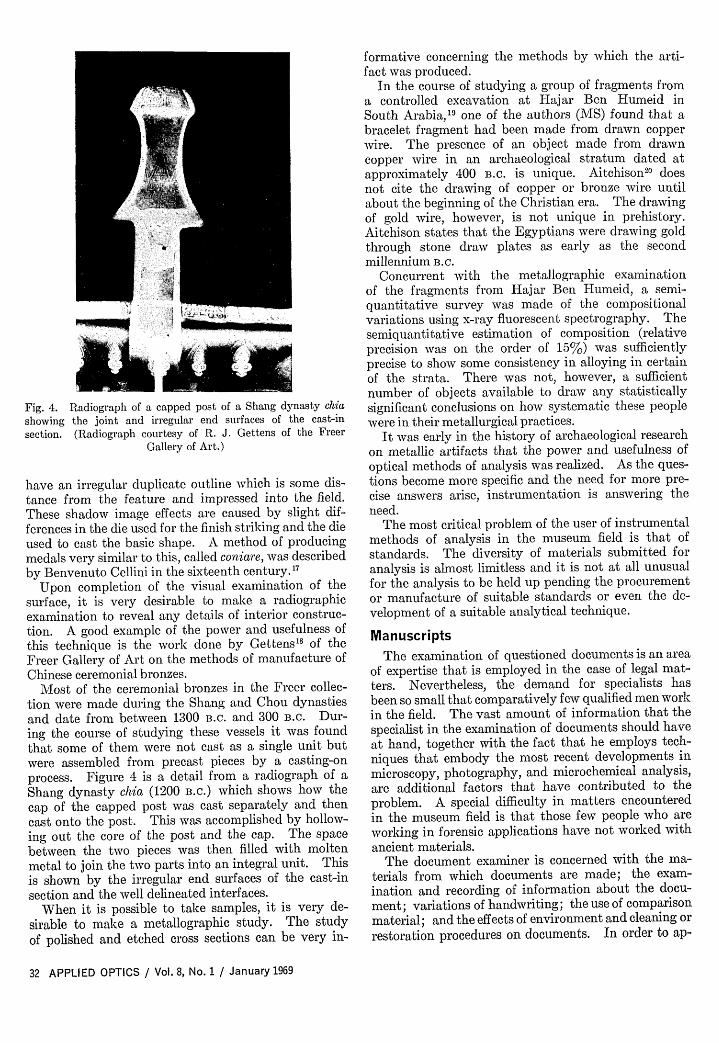
Fig. 4.showingsection.
Radiograph of a capped post of a Shang dynasty chiathe joint and irregular end surfaces of the cast-in(Radiograph courtesy of R. J. Gettens of the Freer
Gallery of Art.)
have an irregular duplicate outline which is some dis-tance from the feature and impressed into the field.These shadow image effects are caused by slight dif-ferences in the die used for the finish striking and the dieused to cast the basic shape. A method of producingmedals very similar to this, called coniare, was describedby Benvenuto Cellini in the sixteenth century. 17
Upon completion of the visual examination of thesurface, it is very desirable to make a radiographicexamination to reveal any details of interior construc-tion. A good example of the power and usefulness ofthis technique is the work done by Gettens' 8 of theFreer Gallery of Art on the methods of manufacture ofChinese ceremonial bronzes.
Most of the ceremonial bronzes in the Freer collec-tion were made during the Shang and Chou dynastiesand date from between 1300 B.c. and 300 B.C. Dur-ing the course of studying these vessels it was foundthat some of them were not cast as a single unit butwere assembled from precast pieces by a casting-onprocess. Figure 4 is a detail from a radiograph of aShang dynasty chia (1200 B.C.) which shows how thecap of the capped post was cast separately and thencast onto the post. This was accomplished by hollow-ing out the core of the post and the cap. The spacebetween the two pieces was then filled with moltenmetal to join the two parts into an integral unit. Thisis shown by the irregular end surfaces of the cast-insection and the well delineated interfaces.
When it is possible to take samples, it is very de-sirable to make a metallographic study. The studyof polished and etched cross sections can be very in-
formative concerning the methods by which the arti-fact was produced.
In the course of studying a group of fragments froma controlled excavation at Hajar Ben Humeid inSouth Arabia,' 9 one of the authors (MS) found that abracelet fragment had been made from drawn copperwire. The presence of an object made from drawncopper wire in an archaeological stratum dated atapproximately 400 .C. is unique. Aitchison' 0 doesnot cite the drawing of copper or bronze wire untilabout the beginning of the Christian era. The drawingof gold wire, however, is not unique in prehistory.Aitchison states that the Egyptians were drawing goldthrough stone draw plates as early as the secondmillennium B.C.
Concurrent with the metallographic examinationof the fragments from Hajar Ben Humeid, a semi-quantitative survey was made of the compositionalvariations using x-ray fluorescent spectrography. Thesemiquantitative estimation of composition (relativeprecision was on the order of 15%) was sufficientlyprecise to show some consistency in alloying in certainof the strata. There was not, however, a sufficientnumber of objects available to draw any statisticallysignificant conclusions on how systematic these peoplewere in their metallurgical practices.
It was early in the history of archaeological researchon metallic artifacts that the power and usefulness ofoptical methods of analysis was realized. As the ques-tions become more specific and the need for more pre-cise answers arise, instrumentation is answering theneed.
The most critical problem of the user of instrumentalmethods of analysis in the museum field is that ofstandards. The diversity of materials submitted foranalysis is almost limitless and it is not at all unusualfor the analysis to be held up pending the procurementor manufacture of suitable standards or even the de-velopment of a suitable analytical technique.
ManuscriptsThe examination of questioned documents is an area
of expertise that is employed in the case of legal mat-ters. Nevertheless, the demand for specialists hasbeen so small that comparatively few qualified men workin the field. The vast amount of information that thespecialist in the examination of documents should haveat hand, together with the fact that he employs tech-niques that embody the most recent developments inmicroscopy, photography, and microchemical analysis,are additional factors that have contributed to theproblem. A special difficulty in matters encounteredin the museum field is that those few people who areworking in forensic applications have not worked withancient materials.
The document examiner is concerned with the ma-terials from which documents are made; the exam-ination and recording of information about the docu-ment; variations of handwriting; the use of comparisonmaterial; and the effects of environment and cleaning orrestoration procedures on documents. In order to ap-
32 APPLIED OPTICS / Vol. 8, No. 1 / January 1969

preciate fully the materials, one must know somethingof the history as well as the properties of paper, parch-ment, ink, adhesives, etc.
On the subject of papermaking alone there exists avery substantial bibliography. The ancient forerunnerof paper was papyrus, and the oldest papyrus nowpreserved is Egyptian and has on it the accounts ofKing Asa (3580-3536 B.C.). The Chinese made paperin the second century A.D., and they may have startedthe practice even before the Christian era.
The usefulness of uv radiation for the identificationof parchment and leather fragments was tested inconjunction with the study of the Dead Sea scrolls.According to information given by Grasser,2 ' vegetabletanned leathers do not fluoresce under uv radiation,but untanned pelt gives a violet-blue fluorescence.Since parchment is, in essence, untanned, dried pelt,it would be expected to fluoresce. The techniqueproved to be useful when materials under examinationare of recent origin, or, if old, are in good preservationand have not been subjected to considerable handling,since hand grease interfered with the test on compara-tively recent parchments.
Further investigation of methods appropriate to thematerials found in the Qumran caves was considerednecessary by workers at the University of Leeds.
The phenolic structure of vegetable tannins used inpreparing leather suggests that this aromatic charactermight be utilized as a means of detecting them in thepresence of nonaromatic materials, e.g., by their ab-sorption in the 250-280-miu wavelength range. How-ever, other aromatic residues such as tyrosine andphenylalamine are liberated by the breakdown of skinprotein. Thus, it would be necessary to find a reagentthat would react with either the tannin or the proteinmaterial to give an entity absorbing at a new wave-length. No reagent which would selectively react inthis manner to give satisfactory results was readily
Fig. 5. Electron micrograph of large fiber formed from singlecollagen fibrils in English sheepskin parachment-A. D. 1502.
(Reprinted by courtesy of R. Reed, University of Leeds.)
available to the authors; they therefore selected toseparate chromatographically the components whichwere extracted from samples of the scrolls and leatherfragments.
Using chromatography for separation and identifyingthe constituents by comparison with chromatogramsof known materials or by elution of the chromatogramsand identification by spectrophotometric methods, theauthors were able to identify positively the presence oftannic acid and ellagic acid, in the scroll samples.They also analyzed extracts from modern Israeli parch-ment and a Canterbury parchment of 1692 and foundthat ellagic acid was absent.
Previous evidence had suggested that the method ofpreparation of the Dead Sea scrolls had been largelydiscarded both in Western Europe and in Israel. Thepresence of a tannic material constituent on theseparchmentlike scroll fragments and the absence of it onlater parchment samples serves to confirm this.
Further work was done on the scroll materials whichinvolved examination with the electron microscope.Their technique was to prepare the samples for exam-ination by soaking small pieces in distilled water.Then the pieces were placed on clean glass slides andteased with needles; droplets of fine suspensionswhich resulted were mounted on carbon-coated grids,allowed to dry, shadowed with chromium, and ex-amined in an Elmiskop II at a magnification of 8.200 X.
The main feature of sixteenth century and modernparchments was the presence of large dense fibers(see Fig. 5). These were usually greater than 40 in length; they varied in width from 1 to 5 A and werebuilt from single collagen fibrils, the latter being recog-nized by their characteristic cross-banded appearance.Other details and dimensions of structure have alsobeen reported.
The fragments from the Qumran caves showed thesame over-all features, together with certain distinctivepoints of detail. Thus, although the large fibers wereseen, they were shorter and somewhat thinner (seeFigs. 6 and 7). A dense material which was observedas a coating on the large fibers of the newer parchmentwas less in evidence, making the collagen fibrils moreclearly visible. Though in some cases the collagenfibrils were straight and aligned parallel to each otherin the larger fibers (see, for example, Fig. 6), the ma-jority were not cylindrical in form, being flattened andtending to follow a wavy course. More debris waspresent in these fragment materials (see Fig. 7) andin addition to the smaller type, seen in the modern andmediaeval parchments, were larger and ill-defined par-ticles of size range 0.25-2 u. All of these character-istics are indicative of a weakened and degeneratefiber structure.
In addition to the methods of examination that havealready been described, the fragments were examinedvisually and with the light microscope. Many inter-esting conclusions were drawn by the investigators re-lating their observations to what had been uncoveredin the rabbinic literature. They concluded, for ex-ample, that mainly the skins of sheep and goat were
January 1969 / Vol. 8, No. 1 / APPLIED OPTICS 33
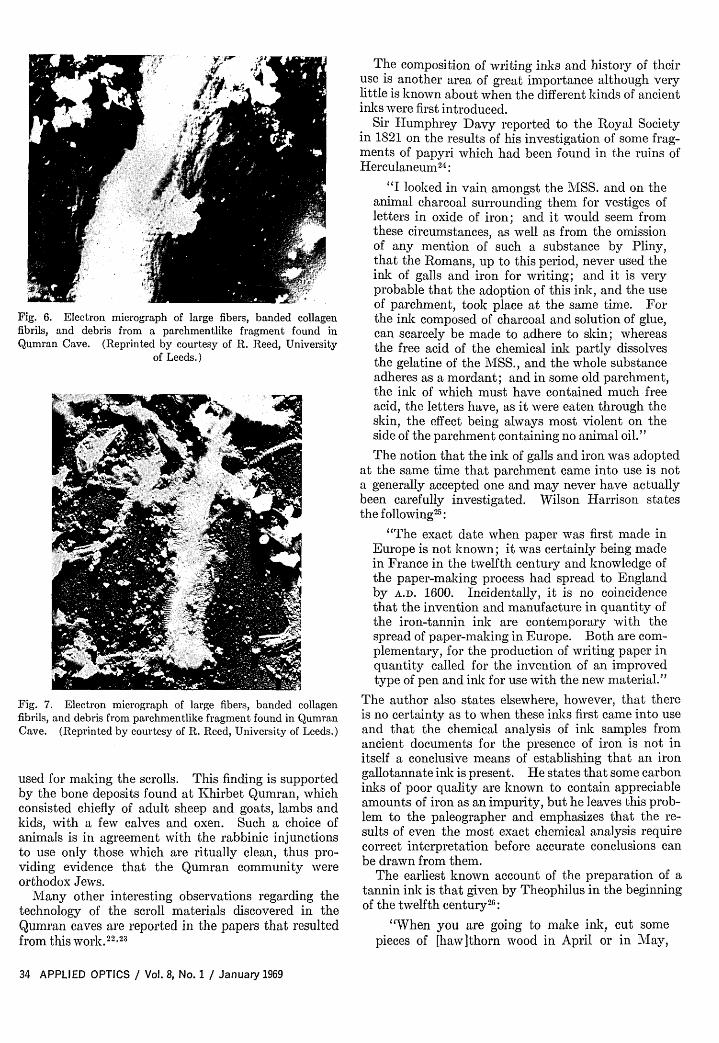
Fig. 6. Electron micrograph of large fibers, banded collagenfibrils, and debris from a parchmentlike fragment found inQumran Cave. (Reprinted by courtesy of R. Reed, University
of Leeds.)
Fig. 7. Electron micrograph of large fibers, banded collagenfibrils, and debris from parchmentlike fragment found in QumranCave. (Reprinted by courtesy of R. Reed, University of Leeds.)
used for making the scrolls. This finding is supportedby the bone deposits found at Khirbet Qumran, whichconsisted chiefly of adult sheep and goats, lambs andkids, with a few calves and oxen. Such a choice ofanimals is in agreement with the rabbinic injunctionsto use only those which are ritually clean, thus pro-viding evidence that the Qumran community wereorthodox Jews.
Many other interesting observations regarding thetechnology of the scroll materials discovered in theQumran caves are reported in the papers that resultedfrom this work.2 2 23
The composition of writing inks and history of theiruse is another area of great importance although verylittle is known about when the different kinds of ancientinks were first introduced.
Sir Humphrey Davy reported to the Royal Societyin 1821 on the results of his investigation of some frag-ments of papyri which had been found in the ruins ofHerculaneum24:
"I looked in vain amongst the MSS. and on theanimal charcoal surrounding them for vestiges ofletters in oxide of iron; and it would seem fromthese circumstances, as well as from the omissionof any mention of such a substance by Pliny,that the Romans, up to this period, never used theink of galls and iron for writing; and it is veryprobable that the adoption of this ink, and the useof parchment, took place at the same time. Forthe ink composed of charcoal and solution of glue,can scarcely be made to adhere to skin; whereasthe free acid of the chemical ink partly dissolvesthe gelatine of the MSS., and the whole substanceadheres as a mordant; and in some old parchment,the ink of which must have contained much freeacid, the letters have, as it were eaten through theskin, the effect being always most violent on theside of the parchment containing no animal oil."
The notion that the ink of galls and iron was adoptedat the same time that parchment came into use is nota generally accepted one and may never have actuallybeen carefully investigated. Wilson Harrison statesthe following25 :
"The exact date when paper was first made inEurope is not known; it was certainly being madein France in the twelfth century and knowledge ofthe paper-making process had spread to Englandby A.D. 1600. Incidentally, it is no coincidencethat the invention and manufacture in quantity ofthe iron-tannin ink are contemporary with thespread of paper-making in Europe. Both are com-plementary, for the production of writing paper inquantity called for the invention of an improvedtype of pen and ink for use with the new material."
The author also states elsewhere, however, that thereis no certainty as to when these inks first came into useand that the chemical analysis of ink samples fromancient documents for the presence of iron is not initself a conclusive means of establishing that an irongallotannate ink is present. He states that some carboninks of poor quality are known to contain appreciableamounts of iron as an impurity, but he leaves this prob-lem to the paleographer and emphasizes that the re-sults of even the most exact chemical analysis requirecorrect interpretation before accurate conclusions canbe drawn from them.
The earliest known account of the preparation of atannin ink is that given by Theophilus in the beginningof the twelfth century26 :
"When you are going to make ink, cut somepieces of [haw]thorn wood in April or in May,
34 APPLIED OPTICS / Vol. 8, No. 1 / January 1969

before they grow blossoms or leaves. Make littlebundles of them and let them lie in the shade fortwo, three, or four weeks, until they are dried outa little. Then you should have wooden malletswith which you should pound the thorn on anotherhard piece of wood until you have completely re-moved the bark. Put this immediately into a bar-rel full of water. Fill two, three, four, or fivebarrels with bark and water and so let them standfor eight days, until the water absorbs all the sapof the bark into itself. Next, pour this water intoa very clean pan or cauldron, put fire under it andboil. From time to time also put some of the barkitself into the pan, so that if any sap has remainedin it, it will be boiled out. After boiling it a little,take out the bark and again put more in. Afterthis is done, boil the remaining water down to athird, take it out of that pan and put it into asmaller one. Boil it until it grows black and isbeginning to thicken, being absolutely careful notto add any water except that which is mixed withsap. When you see it begin to thicken, add a thirdpart of pure wine, put it into two or three new pots,and continue boiling it until you see that it forms asort of skin on top.
"Take the pots off the fire and put them in thesun until the black ink purges itself from the reddregs. Next, take some small, carefully sewnparchment bags with bladders inside, pour the pureink into them, and hang them in the sun until [theink] is completely dry. Whenever you want, takesome of the dry material, temper it with wine overthe fire, add a little green vitriol and write. If ithappens through carelessness that the ink is notblack enough, take a piece of iron a finger thick, putit into the fire, let it get red-hot, and immediatelythrow it into the ink."
On a storage of the iron-tannin inks a sludge tendedto develop and a little gum arabic was added to preventthis deposit. Another method of preventing sludgewas to make the ink slightly acid, but this unfortu-nately makes it almost colorless. This difficulty wasovercome by Stephens in 1836 by adding the blue dyeindigo to give the immediate color to the ink.
The chemistry of the constituents of the iron -tannininks is itself an extensive field and the natural tanninshave been the subject of investigation since the eigh-teenth century. 27
This background material, still very much lackingin any complete history of the technology of ink-making and of the modern chemical description of thematerials used in ink-making, is, nevertheless, essentialto the usefulness of analytical techniques in the docu-mentation of ancient materials.
It is evident that the information on where and whendifferent kinds of inks were introduced is only availableon inks newly introduced in the nineteenth andtwentieth centuries.
Nevertheless, questions of authenticity of ancienthandwritten or hand-drawn materials do arise, and
it is likely that something'can be learned by a study ofthe ink. The suggestion that this should be the casehas been made repeatedly.
During the years following the discovery of the DeadSea scrolls, it was hoped that something could belearned. The following is a statement made in thisregard 2 8 :
"We must also hope to receive further reports byother kinds of experts on the condition and age ofthe writing materials and ink, for the issues atstake are so important that the genuineness anddate of these documents must be established asthoroughly as possible."
A problem has existed in the past with regard to theamount of sample required for analysis. This nolonger presents any difficulty. Modern inks are beinginvestigated using the techniques of chromatog-
Fig. . Land grant toPeter Stuyvesant and
lands located on Long Island signed bydated 1656. (Smithsonian Institutionphoto 64988.)
Fig. 9. Detail of document shown in Fig. 8; the sample wastaken in the lightened area on the broad part of the letter at the
right.
January 1969 / Vol. 8, No. 1 / APPLIED OPTICS 35

Fig. 10. The ultrasonic jackhammer is positioned over thesurface of a painting for taking samples.
raphy,2 9 "3' as well as other techniques which can beapplied on a microbasis.
The time of introduction of iron inks in any part ofthe world has not been established. The earlierreferences given here point out some of the discrepanciesin interpretation regarding the introduction of ironinks.
One useful step is to analyze samples of inks fromdocuments prepared at various times and places inorder to establish whether or not the ink used was aniron ink.
We have begun an investigation of this nature usingthe electron microprobe and analyzing samples of inksfrom documents belonging to the collections of theMuseum of History and Technology.
Figures 8 and 9 show one of the documents sampledand the area from which the sample was taken. Thesamples are weighed and then placed in a speciallyconstructed microsample holder for analysis with theelectron microprobe. The samples weigh 50 g orless. These samples can be analyzed in a fairly rapidfashion to give a semiquantitative analysis for Fe andC and qualitative survey of the other elements detected.Devices for the handling of microsamples are em-ployed.
PaintingsIn the study of a group of paintings or of a single
painting it is just as relevant to ask the question whatpigment or mixture of pigments did the artist use as it isto ask to what can one attribute his selection of a certainpose or costume for a figure in the painting. To thisend, samples of pigments from paintings have beentaken and analyzed. Furthermore, analysis of pig-ments has been useful for the authentication of paint-ings and, for this reason as well, samples of pigmenthave been taken from paintings of known authenticityand from questioned paintings.
Figure 10 shows a sampling apparatus from the Con-servation Laboratory of the National Portrait Gallery
and National Collection of Fine Arts. The instrumenthas a vibrating stylus (shown in Fig. 11) which enablesone to remove sample from an area of 10-/i minimumdiameter.
A glass hood of a special design may be placed overthe area of sampling. This hood is provided with anopening through which the stylus can be placed. An-other opening in the chamber permits an inert gas,such as purified argon, to be passed into the systemduring operation. This can be used in cases where thematerial of interest may be oxidized during the courseof sampling.
The sample which has been taken from the paintingwill include organic and inorganic constituents. Theorganic constituents might include an organic mediasuch as tempera or oil and an organic pigment such asnatural madder and the inorganic constituents will bepigments and perhaps some of the ground material.
Although the inorganic pigments are the constituentsof paintings which have received the most attention,most of the analytical work has been done by micros-copy and by wet methods of microchemical analysis.Nevertheless, spectroscopic methods are very wellsuited to the analysis of pigment samples from oil ortempera paintings.
The amount of sample required for analysis by x-raydiffraction, ir spectrophotometry, and optical emissionor electron microprobe analysis is in the 1-100-/sgrange; generally this amount of sample is availablefrom a painting.
The value of combining a method of elemental analy-sis such as optical emission spectrography or electronmicroprobe analysis with x-ray diffraction and irspectrophotometry was discussed by Miller andWilkins.3 ' They took a set of unknown mixtures ofinorganic compounds, as shown in Table I and per-formed a qualitative analysis by combining threeinstrumental techniques. They concluded that noone of the techniques by itself is powerful enough togive a complete analysis of even these eight idealized
Fig. 11. The tip of the ultrasonic jackhammer in position tosample a painting as viewed through the microscope during
operation.
36 APPLIED OPTICS / Vol. 8, No. 1 / January 1969

Table I. Combined Use of Emission and Infrared Spectroscopy and X-ray Diffraction in Qualitative Analysis of EightInorganic Mixturesa
Independent analysesFinal combined Actual
No. Emission Infrared X-ray analysis compositi on
I Na NaHCO3 NaHCO NaHCO, NaHCO,
Al
3 NaYellow K
CrSulfide odorPb?
4 CdYellow Bi
BNa?C??
5 AsPbNaB?
6 MoCaKNa?Sr??
7 SbSiPCaC??
8 BaNaVAl?Sr??
CaCO 3 ?KNO?NH 4NO 3Very poor patterr
NothingVery poor patterr
Na 2B40 7.10H 20CdS
K2Cr2,7NaSCN or NH 4SCNMg(Cl0 4 )2
Na2 B4 07
Na2SO3PbCO3?BaCO3?MgSO4?K2S2 05CaCO3Na3PO4?Na2SO3?
CaioO(PO 4 )6CaSiO3??
NaVO3A nitrate; probably Ba(NO3)2, possibly NaNO3
Ba(NO3)2PbSO4?
Other component(s)Possibilities: Another nitrate, NaBrO3, Na2WO4
or K2WO4, NaMoO 4 or KMoO 4
CaCO 3KNO3NH 4 NO3
SO4Silica gel
BPbAlK2Cr2O
n NaSCNMg(C10 4 )2?Pb?
Na2B 407.10O10CdSNaBiO3?
Na2SO3NaAsO2PbCO3
KS20 5CaCO3Na2SO3Mo in some form
Ca3(PO 4)2CaSiO3Sb
NaVO3Ba(NO3)2Another component
CaCO3KNO3NH 4NO3CaSO 485% SiO2-
15% A1203Pb(BO2)
K2Cr2O.NaSCNKSCNCaSO 4 -2H20
Na2B 407*10H20CdSO,NaBiO3
Na2SO3NaAsO,Pb(BO2)2-H2
K2S20CaCO3
Na 2M0O4-2H2O
Ca3(PO0Y2
Sb2ŽO
NaVO3-4H 2 0Ba(NO3)2Na2WO 4H20
a Reprinted by courtesy of F. A. Miller and C. H. Wilkins, Carnegie-Mellon University.
unknowns where the components were present inroughly equal amounts by bulk.
Samples from paintings frequently contain a com-bination of pigments put together by the artist in orderto achieve a particular color.
Since the publication of the work illustrated by TableI, ir spectrophotometers have become available com-mercially that have a grating which enables one toscan to as far as 50 ,u or 200 cm-'. This region below600 cm-' can provide some additional information oninorganics. For example, the NaBiO3 in sample 4 inTable I does have strong, but broad, bands at 453 cm-'and -542 cm-'. These would have been present inthe absence of any other strong bands from that sam-ple, since CdS and Na2B4 07-10H 20 do not have strongbands below 600 cm-'.
In a paper by Afremow and Vandeberg,'2 seventy-eight pigments were analyzed in the ir region between1500 cm-' and 200 cm-'. The spectra were obtainedfrom CsI pressed pellets. Much new information wasobtained such as the differentiation between anataseand rutile titanium dioxide. Equally significant is theidentification of mixtures of silicates, such as talc,china clay, mica, pumice, etc.
The proper sequence in using these three techniquesis emission or microprobe analysis, ir, and then x-raydiffraction. The first two present certain possibilitiesfor the x-ray analysis that greatly simplify its inter-pretation.
With samples containing only one or two crystallinecomponents, x-ray diffraction is usually adequate byitself. This technique has been used on samples from
January 1969 / Vol. 8, No. 1 / APPLIED OPTICS 37
KCa
2 SiBPb
NH 4+NO3-S04
Silica gel
Na2SO3NaAsO2
K2S20CaCO3PbCrO 4Na2SO3?
Ca3(PO4 )2
L
00 4000 3500 3000 200
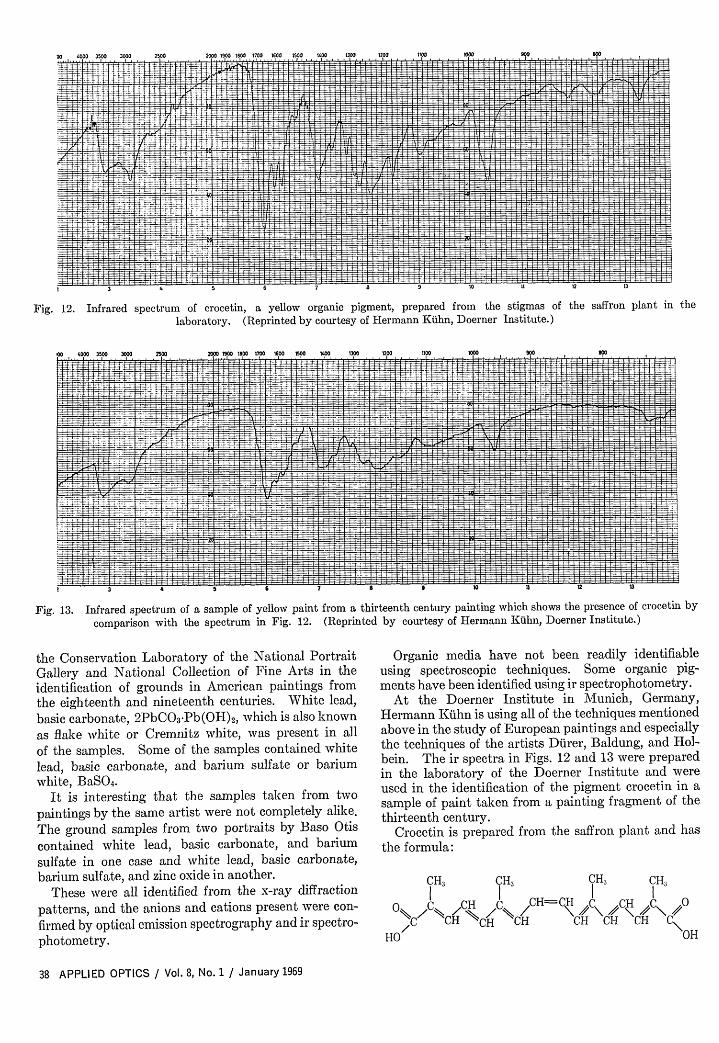
Fig. 12. Infrared spectrum of crocetin, a yellow organic pigment, prepared from the stigmas of the saffron plant in the
laboratory. (Reprinted by courtesy of Hermann Kuhn, Doerner Institute.)
Fig. 13. Infrared spectrum of a sample of yellow paint from a thirteenth century painting which shows the presence of crocetin by
comparison with the spectrum in Fig. 12. (Reprinted by courtesy of Hermann Kuhn, Doerner Institute.)
the Conservation Laboratory of the National PortraitGallery and National Collection of Fine Arts in theidentification of grounds in American paintings fromthe eighteenth and nineteenth centuries. White lead,basic carbonate, 2PbCO3-Pb(OH)2 , which is also known
as flake white or Cremnitz white, was present in all
of the samples. Some of the samples contained whitelead, basic carbonate, and barium sulfate or bariumwhite, BaSO4.
It is interesting that the samples taken from twopaintings by the same artist were not completely alike.The ground samples from two portraits by Baso Otis
contained white lead, basic carbonate, and bariumsulfate in one case and white lead, basic carbonate,barium sulfate, and zinc oxide in another.
These were all identified from the x-ray diffraction
patterns, and the anions and cations present were con-
firmed by optical emission spectrography and ir spectro-photometry.
Organic media have not been readily identifiableusing spectroscopic techniques. Some organic pig-ments have been identified using ir spectrophotometry.
At the Doerner Institute in Munich, Germany,Hermann Kuhn is using all of the techniques mentionedabove in the study of European paintings and especiallythe techniques of the artists Dtirer, Baldung, and Hol-bein. The ir spectra in Figs. 12 and 13 were preparedin the laboratory of the Doerner Institute and wereused in the identification of the pigment crocetin in asample of paint taken from a painting fragment of thethirteenth century.
Crocetin is prepared from the saffron plant and hasthe formula:
CH, CH, CH3 CH3
HO/ XC/ / CH C \C \ /C\ /HO OH
38 APPLIED OPTICS / Vol. 8, No. 1 / January 1969
_0 - - - - - - - - - HE
- - - - - - - - - -
Va N
I--- ",- - 177 . . . . . . . .. 7. . . . . . . . , -I-- - , - - . . . . I I I . I
I I
ttoN loon 9oo soon Mann lrlm Dana land sand urn 13o0 Ann,W RY, "Y. OU DU
5 b

The spectrum of the sample from the painting wasrun from a micropellet which was prepared usingapproximately 100 Mg of sample and 15 mg of KBr.
The peak at 3450 cm-' is assigned to OH stretchvibration; the band at 3060-2860 cm-' to the C-Hstretching vibrations; the peaks in the region from1720 cm-' to 1580 cm-' to the C==O and C=C groups;the 1460-1370-cm-' band to the CH3 asymmetricaldeformation and the symmetric CH3 umbrella deforma-tion; the peaks in the 1320-1180-cm-' region to theCH wagging vibrations in the hydrocarbon chain whichmay even include the peak at 1110 cm-' as the com-plexity of the band system increases with chain lengthin solid state spectra; the peak at 965 cm-' to theolefinic CH wag of a trans disubstituted ethylene andthe one at 750 cm-' to cis substitution.
This investigation has extended the knowledge ofthe use of saffron in early paintings. Equally importantwork remains to be done on pigments from otherEuropean painting as well as paintings of AmericanColonial and Meso-American origin and others.
The present knowledge of artists' pigments as wellas other materials, is well summarized in PaintingMaterials-A Short Encyclopedia by R. J. Gettens andG. S. Stout. A new edition of this was published byDover in 1966.
The authors are grateful to Rutherford J. Gettensof the Freer Gallery of Art for reading the manuscriptand offering constructive criticism.
References1. C. W. Beck, E. Wilbur, S. Meret, M. Kossave, and K. Ker-
mani, Archaeometry 8, 96 (1965).2. A. E. Blin-Stoyle and E. E. Richards, Archaeometry 4, 33
(1961).3. E. V. Sayre and R. W. Smith, Science 133, 1824 (1961).4. J. H. Langenheim and C. W. Beck, Science 149, 52 (1965).5. E. V. Sayre and R. W. Dodson, Am. J. Archaeol. 61, 35
(1957).6. E. V. Sayre, A. Murrenhoff, and C. F. Weick, BNL Labora-
tory Rep. 508 (1958).7. J. A. Bennyhoff and R. F. Heizer, Amer. Antiquity 30, 348
(1965).8. R. Bruin, F. W. Heineken, and M. Bruin, J. Org. Chem. 28,
562 (1963).
9. M. Saltzman, A. M. Keay, and J. Christensen, Dyestuffs 44,241 (1963).
10. F. Gbel, (}ber den Einfluss der Chemie auf die Ermittelungder Volker der Vorzeit (Erlangen, 1842).
11. J. Wbcel, Sitzungsberichte der Kaiserlichen Akademie derWissenschaften (Wien), Philosophisch-Historische Klasse 11,716 (1853); 16, 169 (1855).
12. L. R. von Fellenberg, Mitteilungen der naturforschendenGesellschaft in Bern, 43, 65, 153 (1861); 41, 173 (1862); 43,135 (1863); 122 (1864); 1 (1865); 261 (1866).
13. E. R. Caley, J. Chem. Educ. 28, 64 (1951).14. H. Otto and W. Witter, Handbuch der altesten vorgeschicht-
lichen Metalurgie in Mitteleuropa (Leipzig, 1952).15. R. Pittioni, Archaeolog. Austriaca 26, 67 (1959).16. S. Junghans, E. Sangmeister, and M. Schroder, Metallan-
alysen Kupferzeitlicher und frfthbronzezeitlicher Bodenfundeaus Europa (Berlin, 1960).
17. B. Cellini, Treatises on Goldsmithing and Sculpture (trans-lated from the Mareian Codex by C. R. Ashbee, published byEdward Arnold, London, 1898).
18. R. J. Gettens, The Freer Chinese Bronzes, Vol. II, TechnicalStudies (Smithsonian Institution, Freer Gallery of ArtOriental Studies No. 7, Smithsonian Institution Press, Wash-ington, D.C., 1968).
19. (M. E. Salmon, Appendix I) G. W. Van Beek, Hajar BenHumeid: Investigations at a Pre-Islamic Site in South Arabia(Johns Hopkins Press, Baltimore, 1968).
20. L. Aitchison, A History of Metals (Interscience Publishers,Inc., New York, 1960), Vol. 1, pp. 213.
21. G. Grasser, Cuir. Tech. 141 (1931).22. R. Reed and J. B. Poole, Proc. Leeds Philosoph. Literary
Soc. 9, Pt. 1, 1 (1962).23. R. Reed and J. B. Poole, Proc. Leeds Philosoph. Literary
Soc. 9, Pt. 6, 171 (1964).24. J. Davy, Phil. Trans. (1821).25. W. R. Harrison, Suspect Documents (Frederick A. Praeger,
New York, 1958) pp. 6.26. J. G. Hawthorne and C. S. Smith, translation of On Divers
Arts (The Treatise of Theophilus) (University of ChicagoPress, Chicago, 1963), pp. 42.
27. T. Thomson, A System of Chemistry (Edinburgh, 1810), pp.383.
28. F. F. Bruce, J. Victoria Inst. 82, 143 (1950).29. C. Brown and P. L. Kirk, J. Criminal Law, Criminol, Police
Sci. 45, 334 (1954).30. D. A. Crown, "A Chromatographic Study of the Drying of
Iron Gallotannic Inks," (unpublished thesis).31. F. A. Miller and C. H. Wilkins, Anal. Chem. 24, 1253 (1952).32. L. C. Afremow and J. T. Vandeberg, J. Paint Technol. 38, 169
(1966).
A Guide to Graduate Programs
The American Institute of Physics has published, and offers atthe modest cost of $5, a new book entitled Graduate Programs inPhysics and Astronomy, containing 435 pages of detailed infor-mation on doctoral and master's programs in 284 institutions.This book will be an invaluable handbook for prospective doctoraland master's students and their advisors. It represents muchcareful work on the part of the university departments supplyingthe information and by the staff of the Education and ManpowerDivision of the American Institute of Physics, who assembled andedited the material. Inquiries to the Optical Society with regard
to graduate education in optics come from undergraduate stu-dents and their professors and sometimes from industrial membersof the Society in search of trained manpower. It is suggested,therefore, that this new book may be useful to many directors ofresearch or employment officers in industrial and governmentallaboratories who wish to know where they can turn to seek em-ployees educated in various advanced phases of optical physics.
The book does not list new programs in optics in engineeringdepartments or other departments. For example, neither theOptical Sciences Center at the University of Arizona nor the Insti-tute of Optics at the University of Rochester received detailed de-scriptions, for they are not in departments of physics. These and
January 1969 / Vol. 8, No. 1 / APPLIED OPTICS 39