introduction to proteomics and protein structure modeling bmi 705 kun huang department of biomedical...
Post on 22-Dec-2015
220 views
TRANSCRIPT

Introduction to Proteomics and Protein Structure
ModelingBMI 705 Kun Huang
Department of Biomedical InformaticsOhio State University
Review of Protein Structure (5 min)
Introduction to Proteomics (10 min)
Protein Structure Database and Classification (15 min)
Protein Structure Prediction (15 min)
3-D Alignment (left for next lab session)
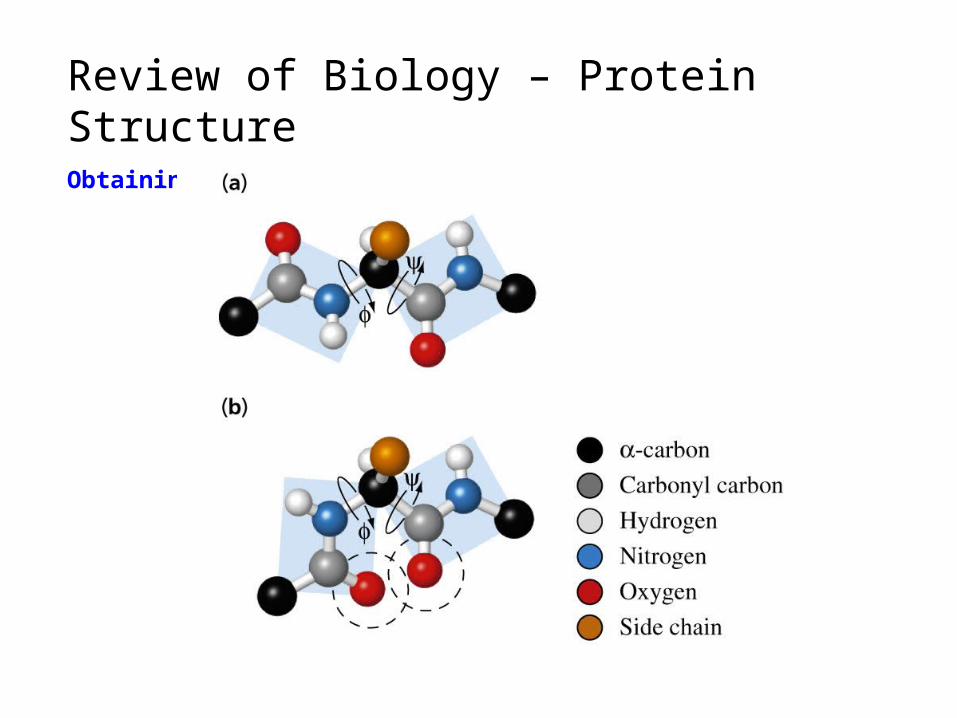
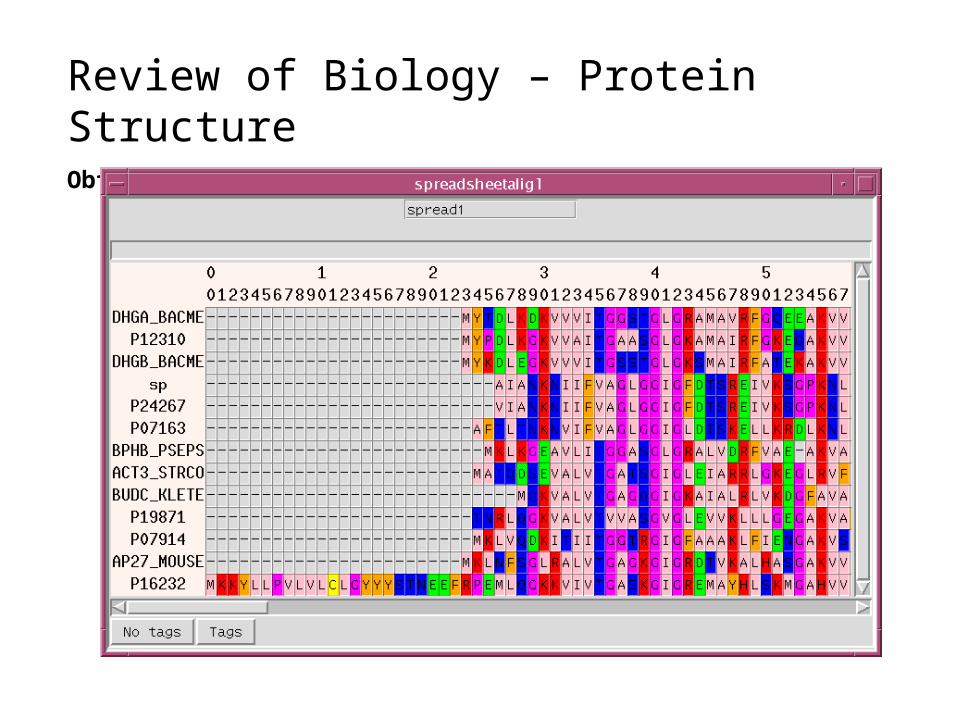
Review of Biology – Protein StructureObtaining 3-D structure (Computation)

Review of Biology – Protein StructureLevels of structure
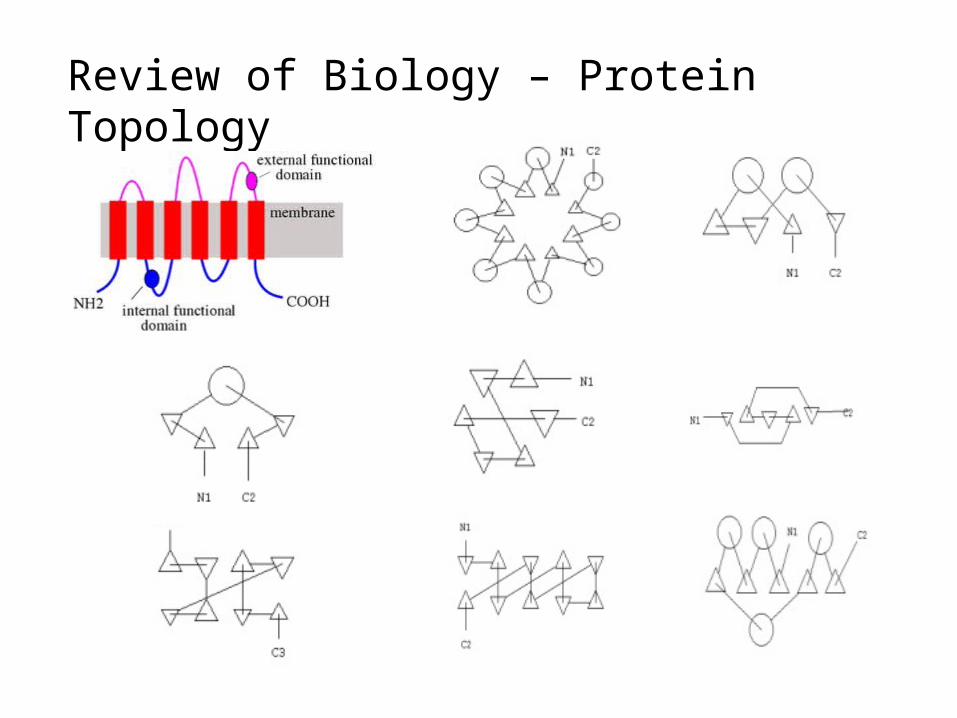
Review of Biology – Protein Topology

Review of Biology – Protein StructureObtaining 3-D structure
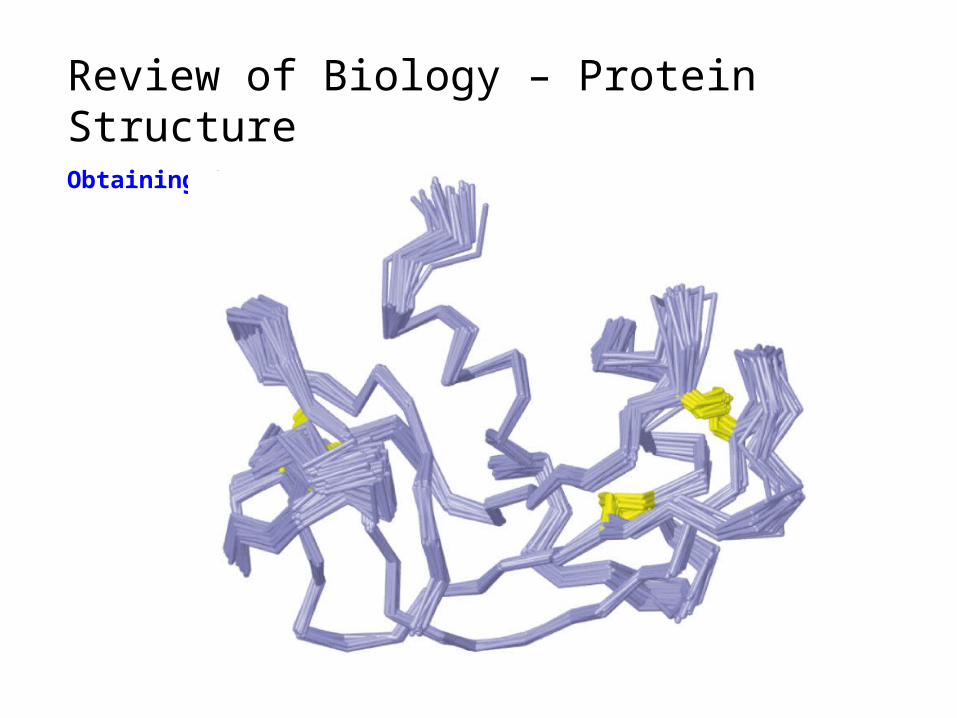
Review of Biology – Protein StructureObtaining 3-D structure (NMR)
Review of Biology – Protein StructureObtaining 3-D structure (Bioinformatics)
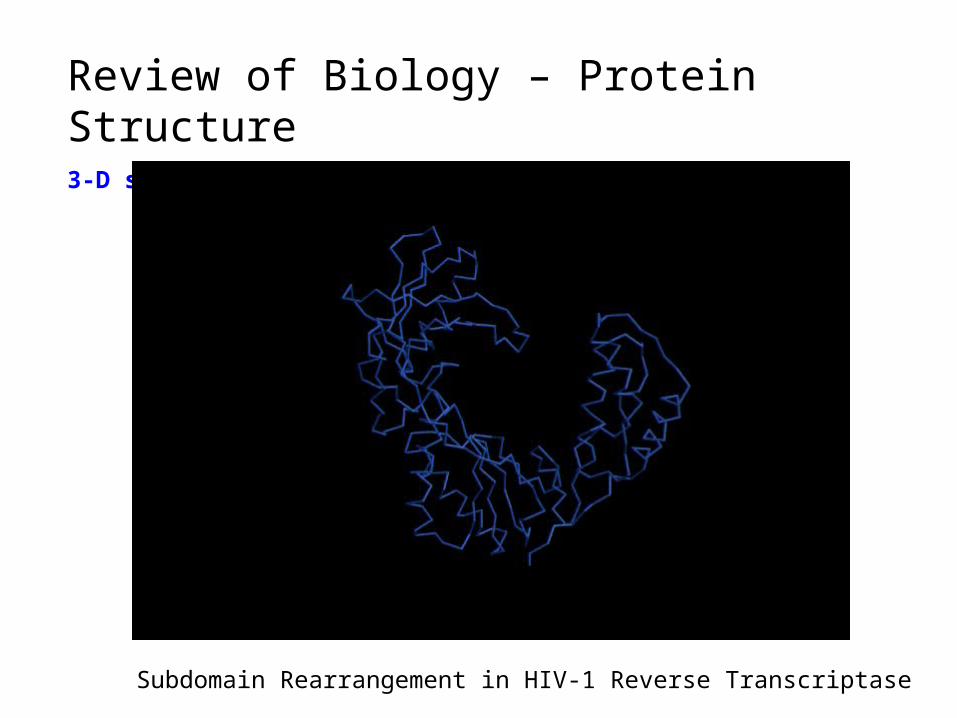
Review of Biology – Protein Structure3-D structure (dynamics / computation)
Subdomain Rearrangement in HIV-1 Reverse Transcriptase

Review of Biology – Protein Structure
3-D structure (modulation)
Binding with ligand
Methylation
Phorsphorylation
Glycosylation, ubiquintinization, etc.
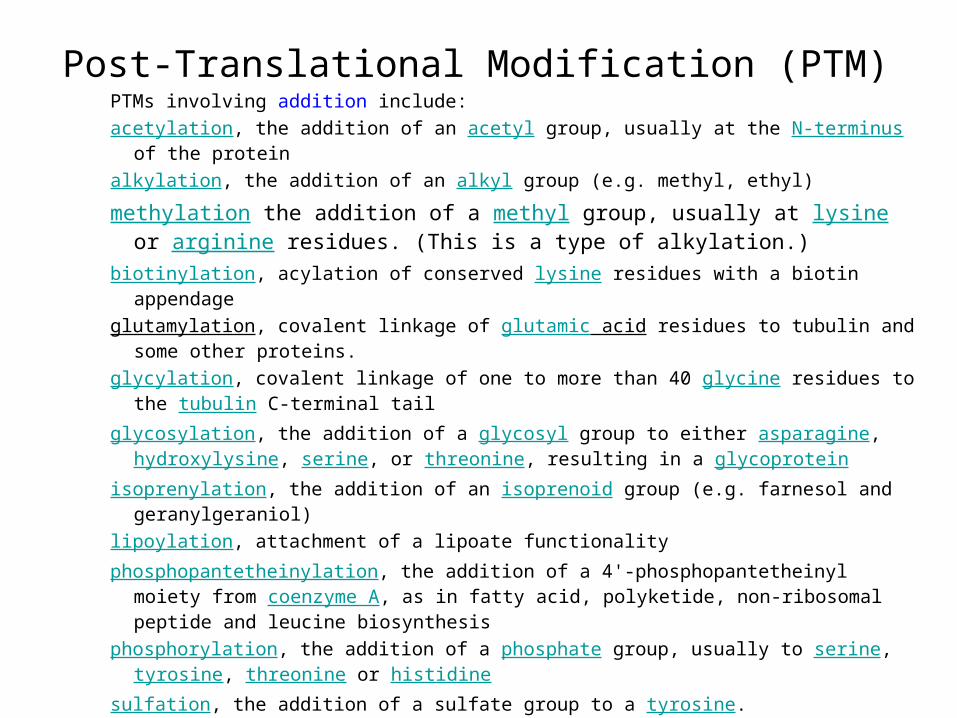
Post-Translational Modification (PTM)PTMs involving addition include:acetylation, the addition of an acetyl group, usually at the N-terminus of the protein alkylation, the addition of an alkyl group (e.g. methyl, ethyl)
methylation the addition of a methyl group, usually at lysine or arginine residues. (This is a type of alkylation.)
biotinylation, acylation of conserved lysine residues with a biotin appendage glutamylation, covalent linkage of glutamic acid residues to tubulin and some other
proteins. glycylation, covalent linkage of one to more than 40 glycine residues to the tubulin C-
terminal tail glycosylation, the addition of a glycosyl group to either asparagine, hydroxylysine,
serine, or threonine, resulting in a glycoprotein isoprenylation, the addition of an isoprenoid group (e.g. farnesol and geranylgeraniol) lipoylation, attachment of a lipoate functionality phosphopantetheinylation, the addition of a 4'-phosphopantetheinyl moiety from
coenzyme A, as in fatty acid, polyketide, non-ribosomal peptide and leucine biosynthesis
phosphorylation, the addition of a phosphate group, usually to serine, tyrosine, threonine or histidine
sulfation, the addition of a sulfate group to a tyrosine. Selenation C-terminal amidation
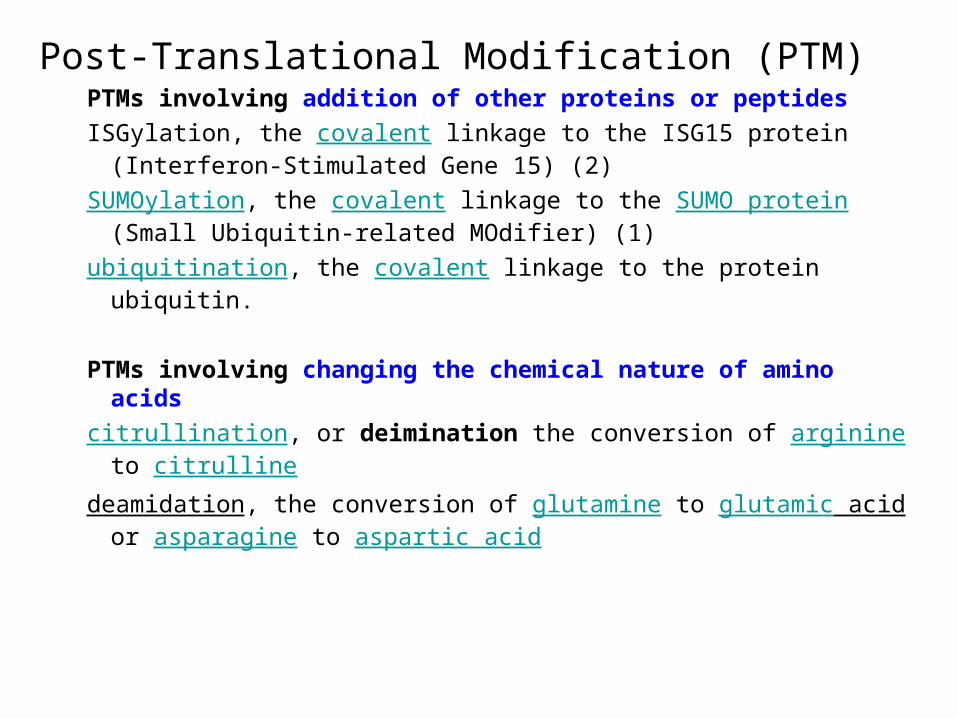
Post-Translational Modification (PTM)PTMs involving addition of other proteins or peptidesISGylation, the covalent linkage to the ISG15 protein (Interferon-
Stimulated Gene 15) (2) SUMOylation, the covalent linkage to the SUMO protein (Small
Ubiquitin-related MOdifier) (1) ubiquitination, the covalent linkage to the protein ubiquitin.
PTMs involving changing the chemical nature of amino acidscitrullination, or deimination the conversion of arginine to
citrulline deamidation, the conversion of glutamine to glutamic acid or
asparagine to aspartic acid
Review of Protein Structure (5 min)
Introduction to Proteomics (10 min)
Protein Structure Database and Classification (15 min)
Protein Structure Prediction (15 min)
3-D Alignment (10 min)
Proteomics
The term proteome was coined by Mark Wilkins in 1995 and is used to describe the entire complement of proteins in a given biological organism or system at a given time, i.e. the protein products of the genome. The term has been applied to several different types of biological systems. A cellular proteome is the collection of proteins found in a particular cell type under a particular set of environmental conditions such as exposure to hormone stimulation.
Proteomics vs. Genomics
The proteome is larger than the genome, especially in eukaryotes, in the sense that there are more proteins than genes. This is due to alternative Splicing_(genetics) splicing of genes and post-translational modifications like glycosylation or phosphorylation.
The proteome has at least two levels of complexity lacking in the genome. When the genome is defined by the sequence of nucleotides, the proteome cannot be limited to the sum of the sequences of the proteins present. Knowledge of the proteome requires knowledge of (1) the structure of the proteins in the proteome and (2) the functional interaction between the proteins.
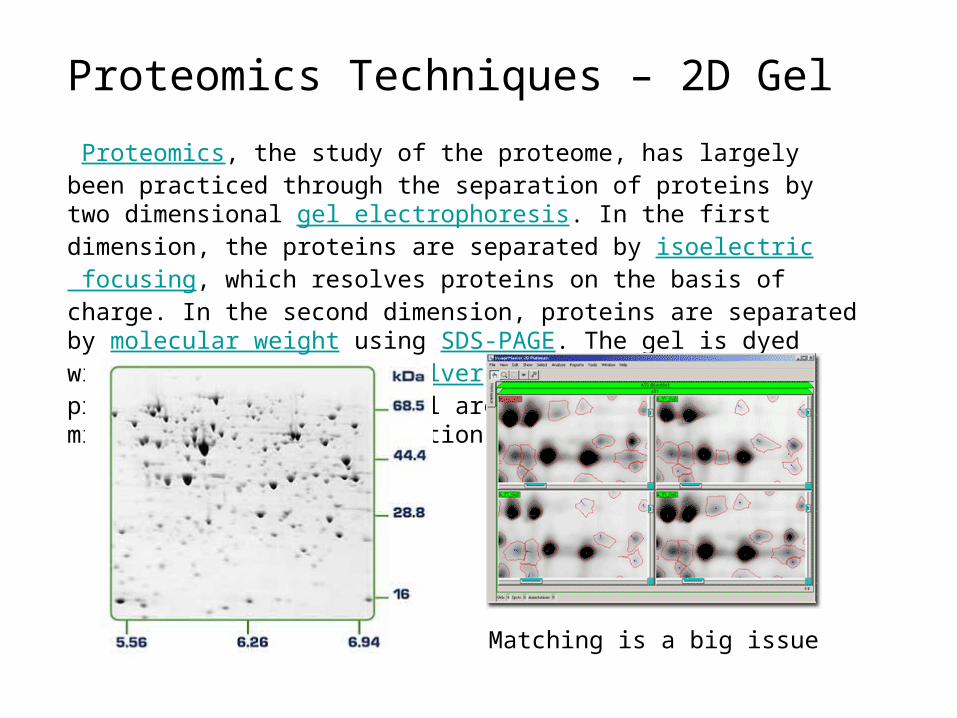
Proteomics Techniques – 2D Gel
Proteomics, the study of the proteome, has largely been practiced through the separation of proteins by two dimensional gel electrophoresis. In the first dimension, the proteins are separated by isoelectric focusing, which resolves proteins on the basis of charge. In the second dimension, proteins are separated by molecular weight using SDS-PAGE. The gel is dyed with Coomassie Blue or silver to visualize the proteins. Spots on the gel are proteins that have migrated to specific locations.
Matching is a big issue
Proteomics Techniques – Mass Spec
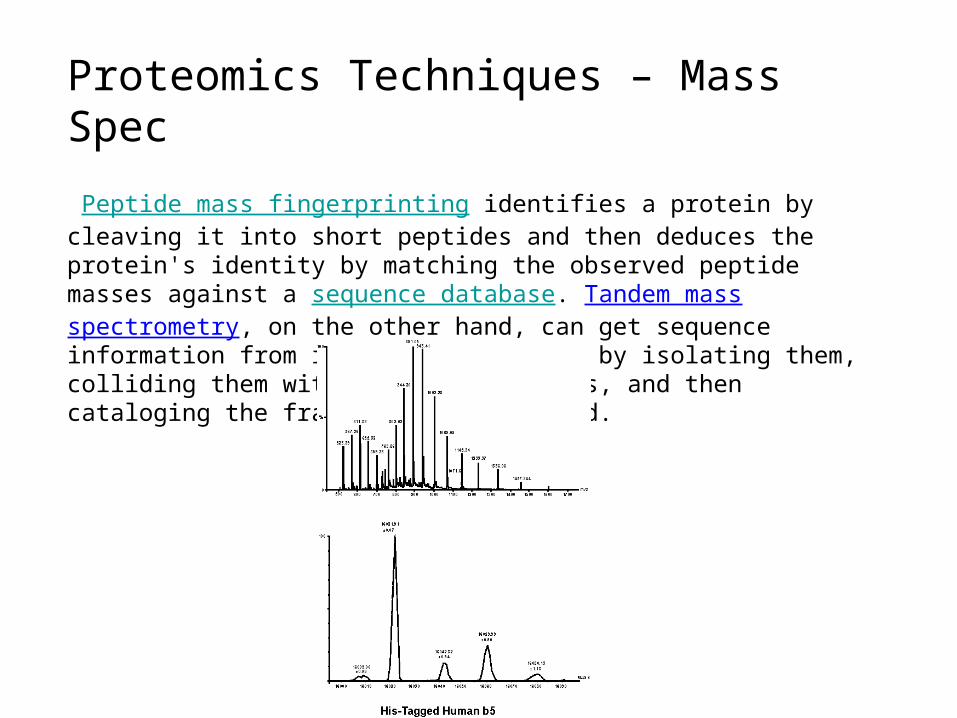
Peptide mass fingerprinting identifies a protein by cleaving it into short peptides and then deduces the protein's identity by matching the observed peptide masses against a sequence database. Tandem mass spectrometry, on the other hand, can get sequence information from individual peptides by isolating them, colliding them with a nonreactive gas, and then cataloging the fragment ions produced.
Proteomics Techniques – Mass Spec
Proteomics Techniques – Mass Spec
Proteomics Techniques – Microarray
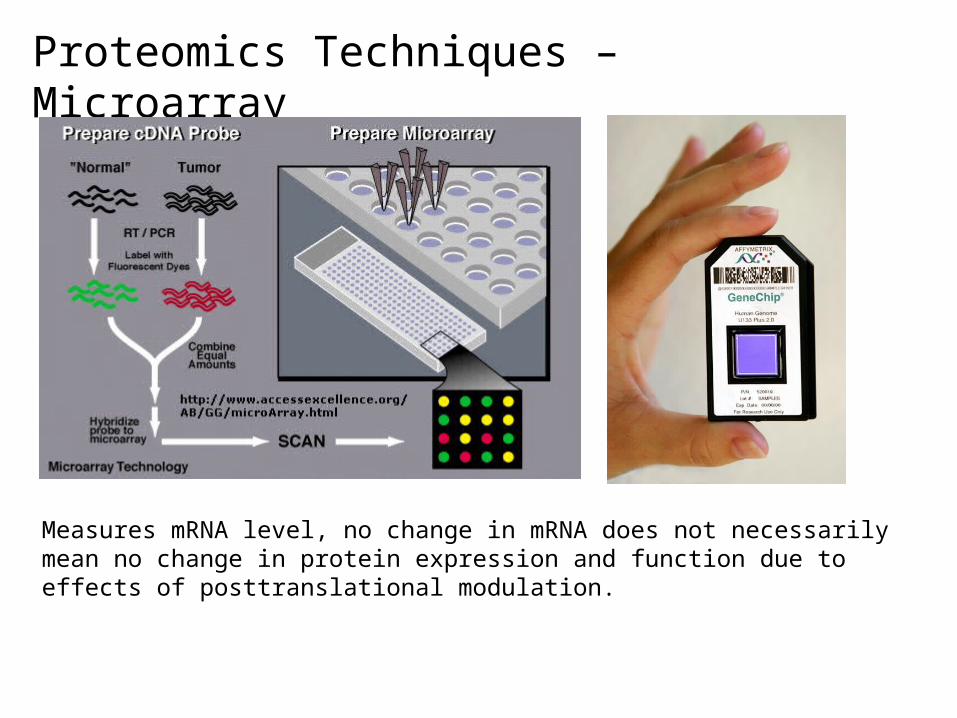
Measures mRNA level, no change in mRNA does not necessarily mean no change in protein expression and function due to effects of posttranslational modulation.
Review of Protein Structure (5 min)
Introduction to Proteomics (10 min)
Protein Structure Database and Classification (15 min)
Protein Structure Prediction (15 min)
3-D Alignment (left for next lab)
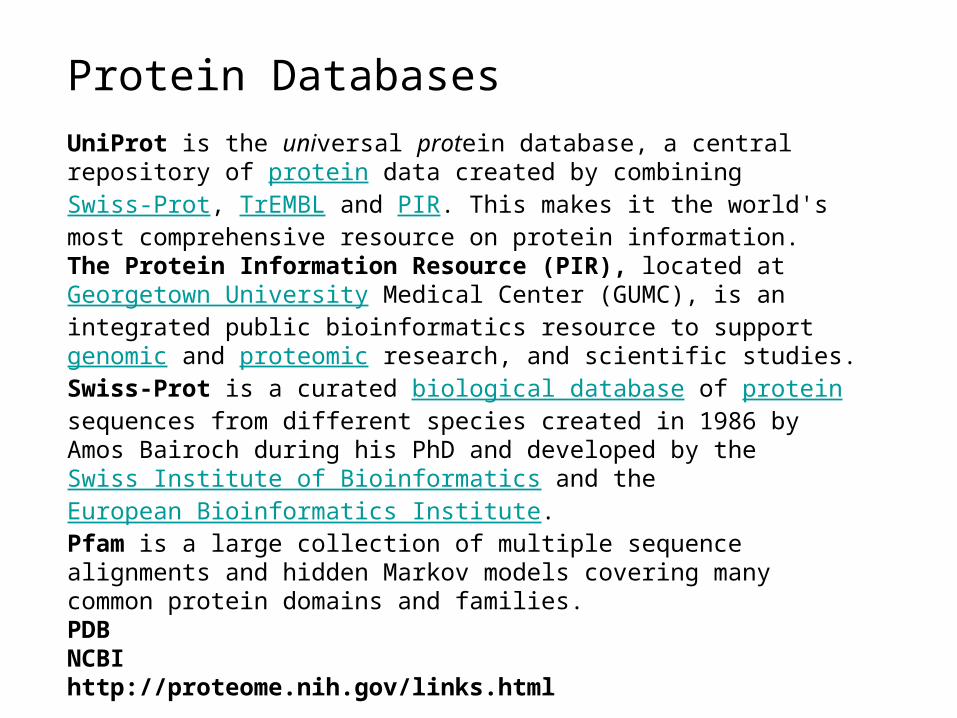
Protein Databases
UniProt is the universal protein database, a central repository of protein data created by combining Swiss-Prot, TrEMBL and PIR. This makes it the world's most comprehensive resource on protein information.The Protein Information Resource (PIR), located at Georgetown University Medical Center (GUMC), is an integrated public bioinformatics resource to support genomic and proteomic research, and scientific studies. Swiss-Prot is a curated biological database of protein sequences from different species created in 1986 by Amos Bairoch during his PhD and developed by the Swiss Institute of Bioinformatics and the European Bioinformatics Institute. Pfam is a large collection of multiple sequence alignments and hidden Markov models covering many common protein domains and families. PDBNCBIhttp://proteome.nih.gov/links.html

PubMed – Protein Databases
The Protein database contains sequence data from the translated coding regions from DNA sequences in GenBank, EMBL, and DDBJ as well as protein sequences submitted to Protein Information Resource (PIR), SWISS-PROT, Protein Research Foundation (PRF), and Protein Data Bank (PDB) (sequences from solved structures).
The Structure database or Molecular Modeling Database (MMDB) contains experimental data from crystallographic and NMR structure determinations. The data for MMDB are obtained from the Protein Data Bank (PDB). The NCBI has cross-linked structural data to bibliographic information, to the sequence databases, and to the NCBI taxonomy. Use Cn3D, the NCBI 3D structure viewer, for easy interactive visualization of molecular structures from Entrez.
Tutorial: http://www.pdb.org/pdbstatic/tutorials/tutorial.html
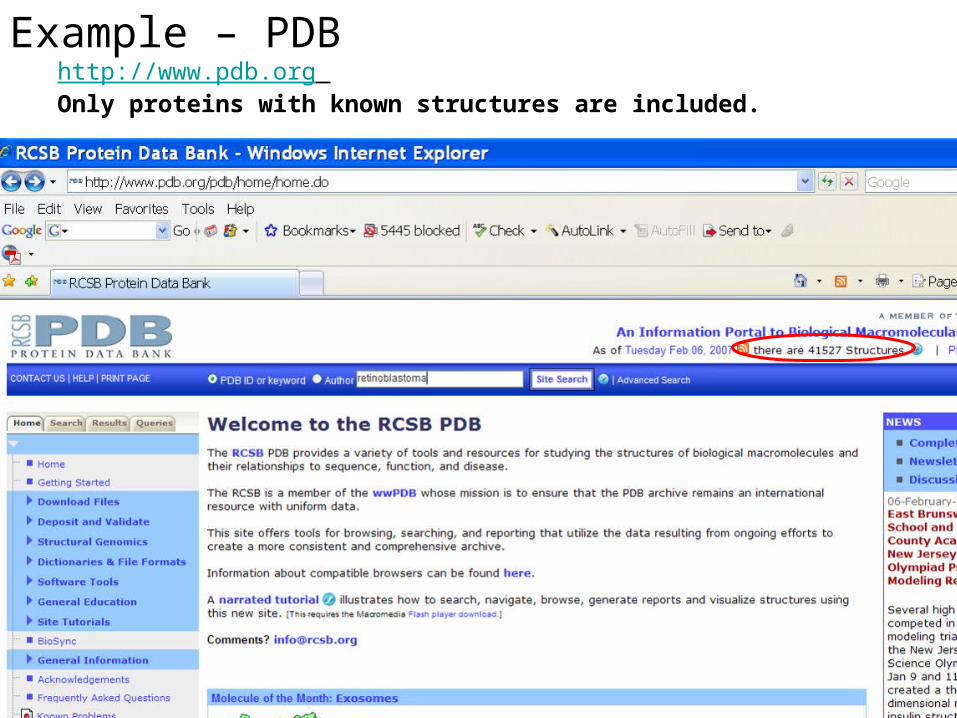
Example – PDBhttp://www.pdb.org Only proteins with known structures are included.
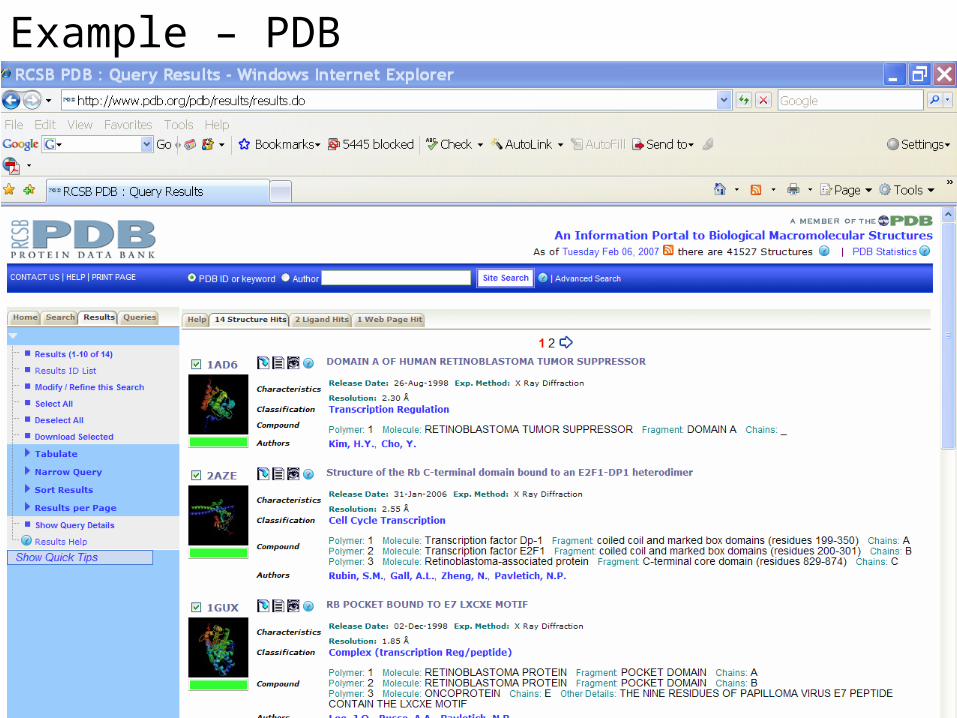
Example – PDB
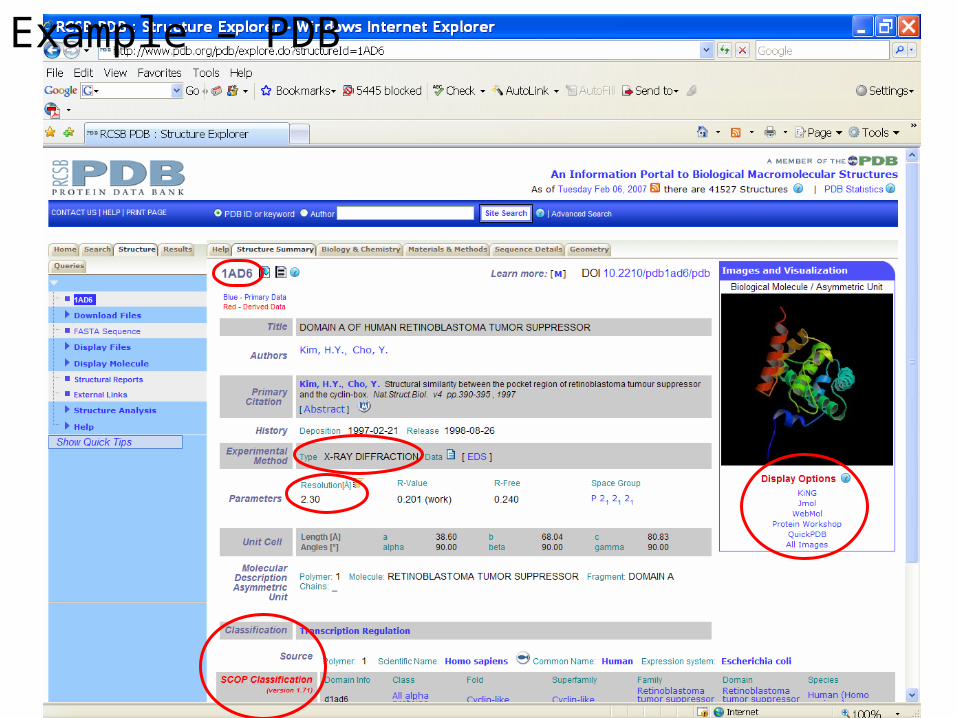
Example – PDB
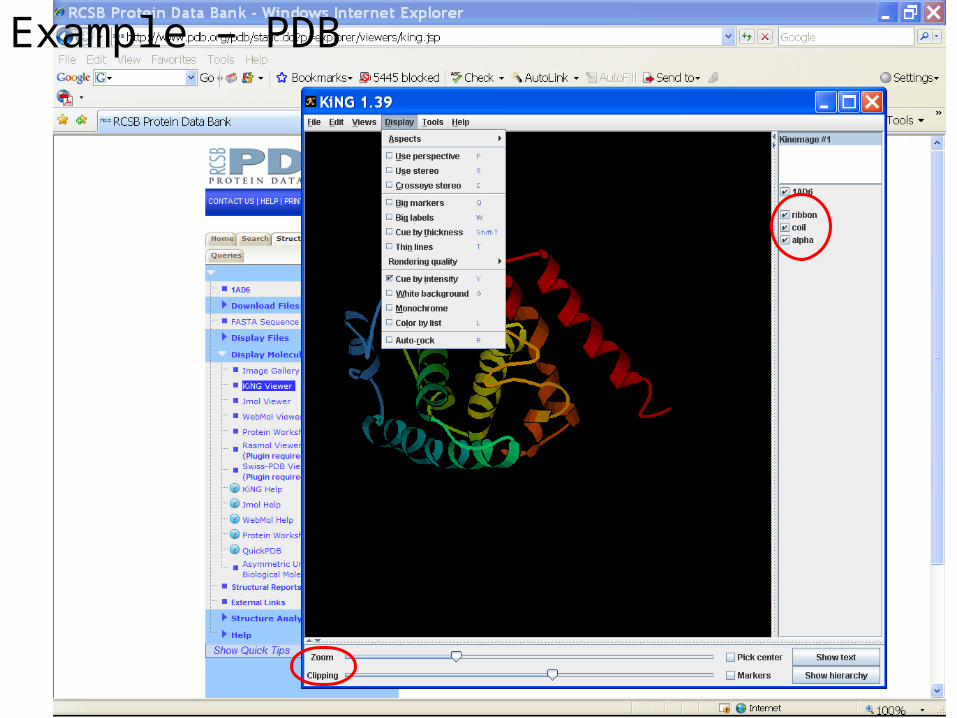
Example – PDB
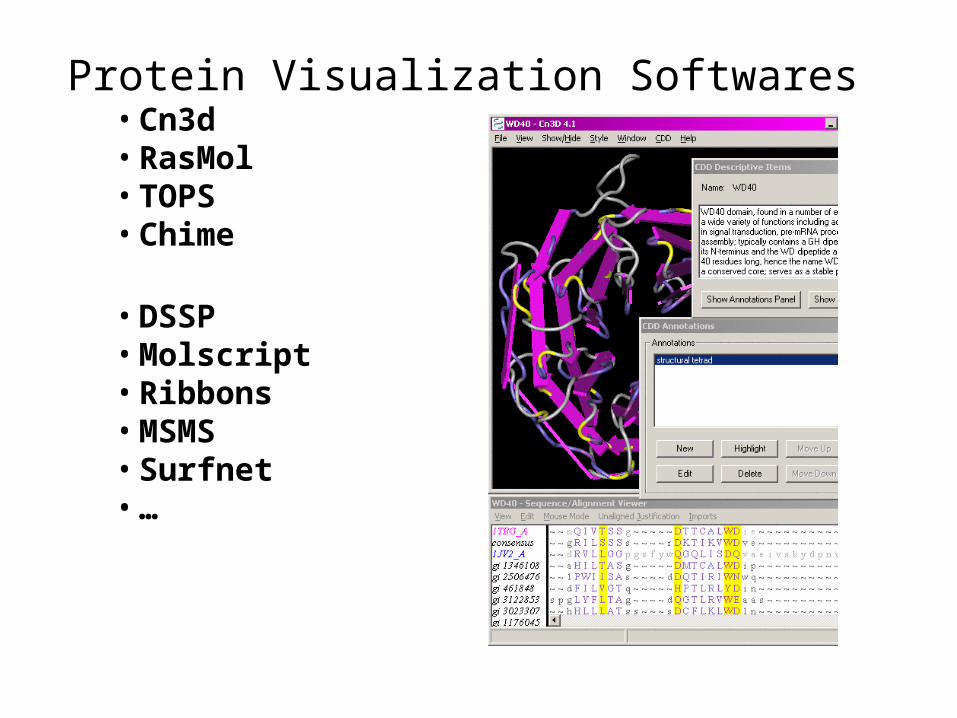
Protein Visualization Softwares• Cn3d• RasMol• TOPS• Chime
• DSSP• Molscript• Ribbons• MSMS• Surfnet• …

PubMed Structure Database
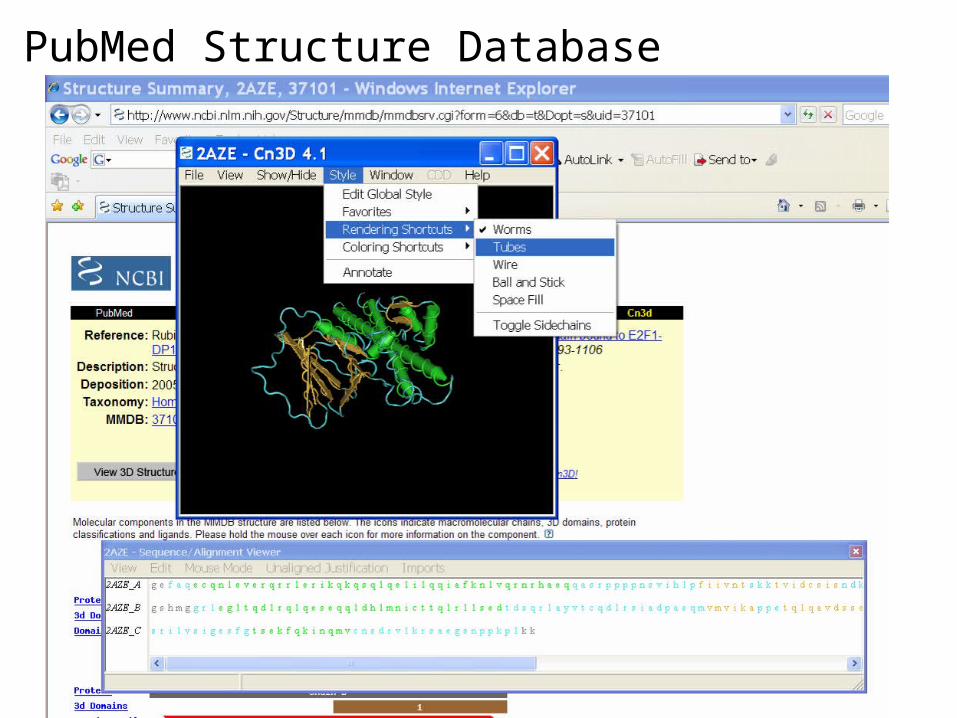
PubMed Structure Database
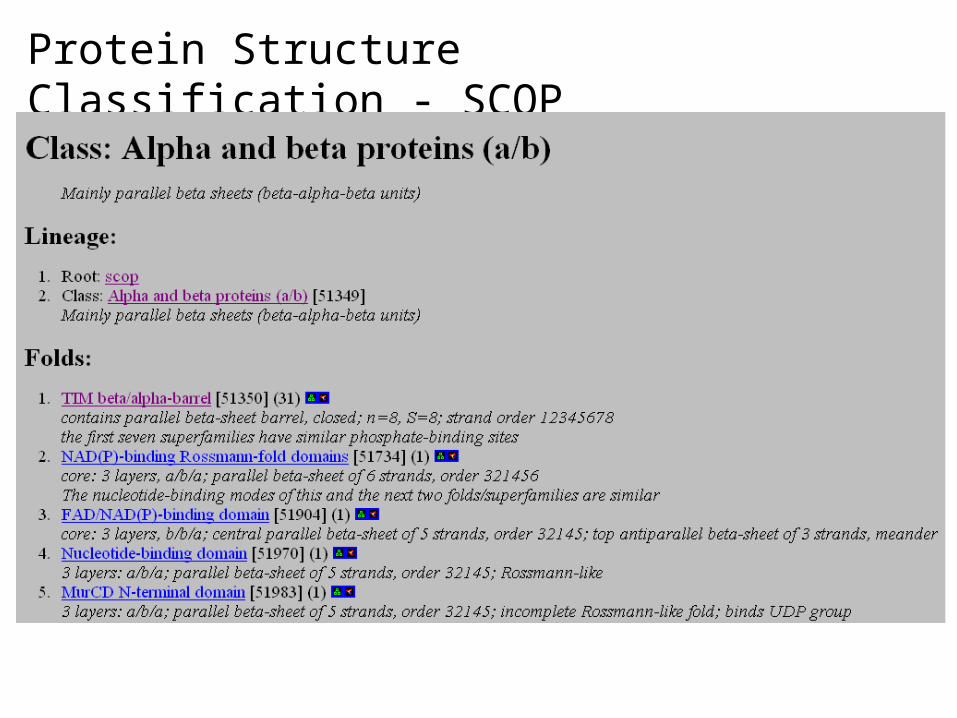
Protein Structure Classification - SCOP
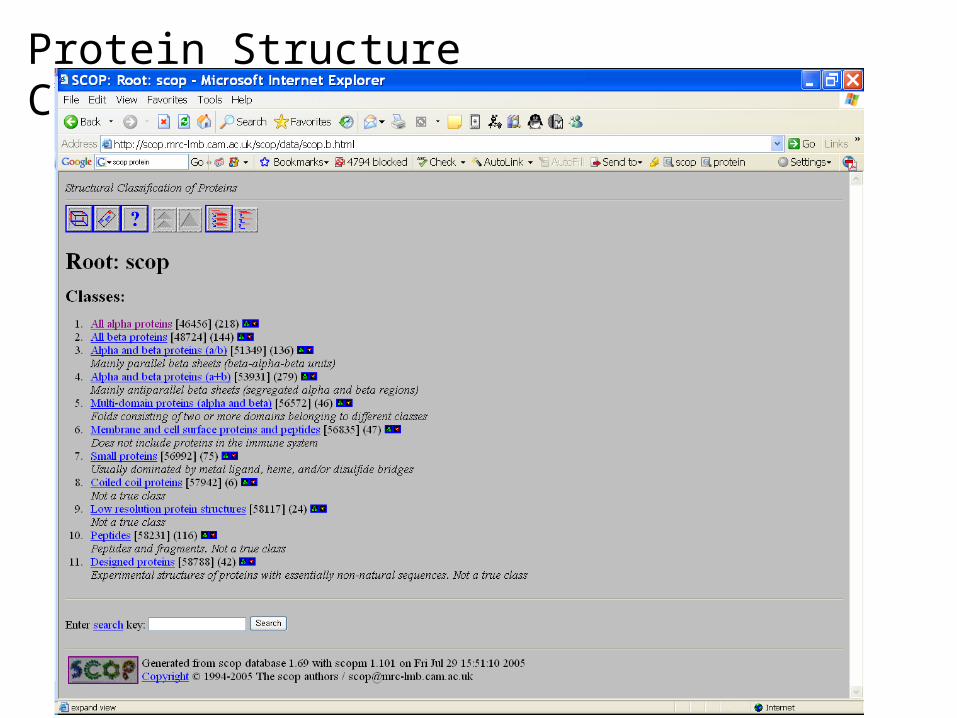
• Structure Classification Of Proteins database • http://scop.mrc-lmb.cam.ac.uk/scop/
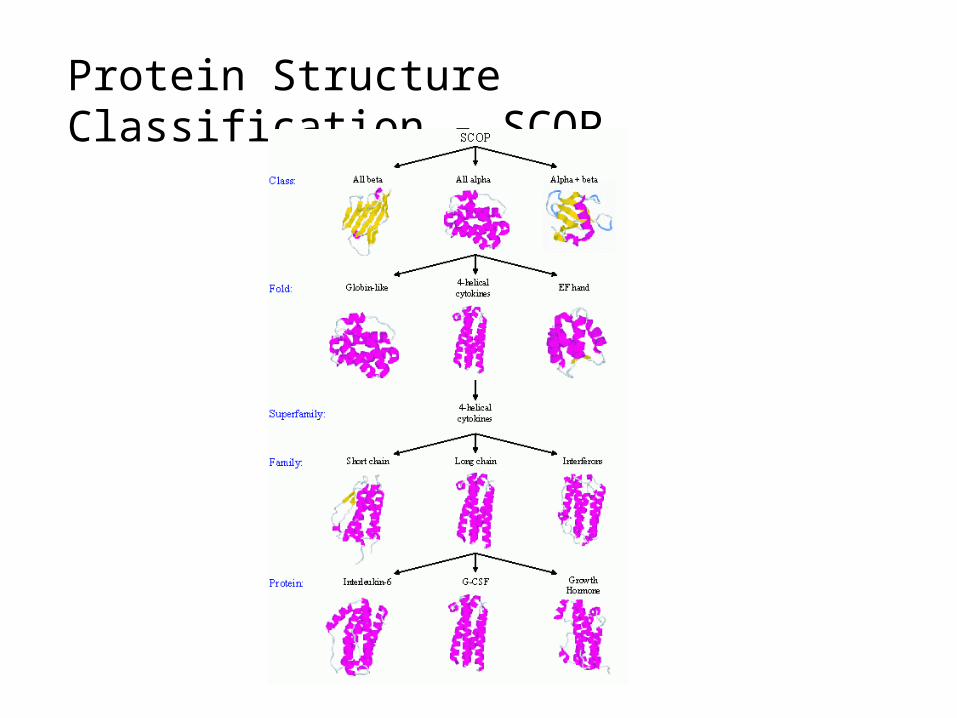
• Hierarchical Clustering• Family – clear evolutionarily relationship• Superfamily – probable common evolutionary origin• Fold – major structural similarity
• Boundaries between levels are more or less subjective
• Conservative evolutionary classification leads to many new divisions at the family and superfamily levels, therefore it is recommended to first focus on higher levels in the classification tree.
Protein Structure Classification - SCOP
Protein Structure Classification - SCOP
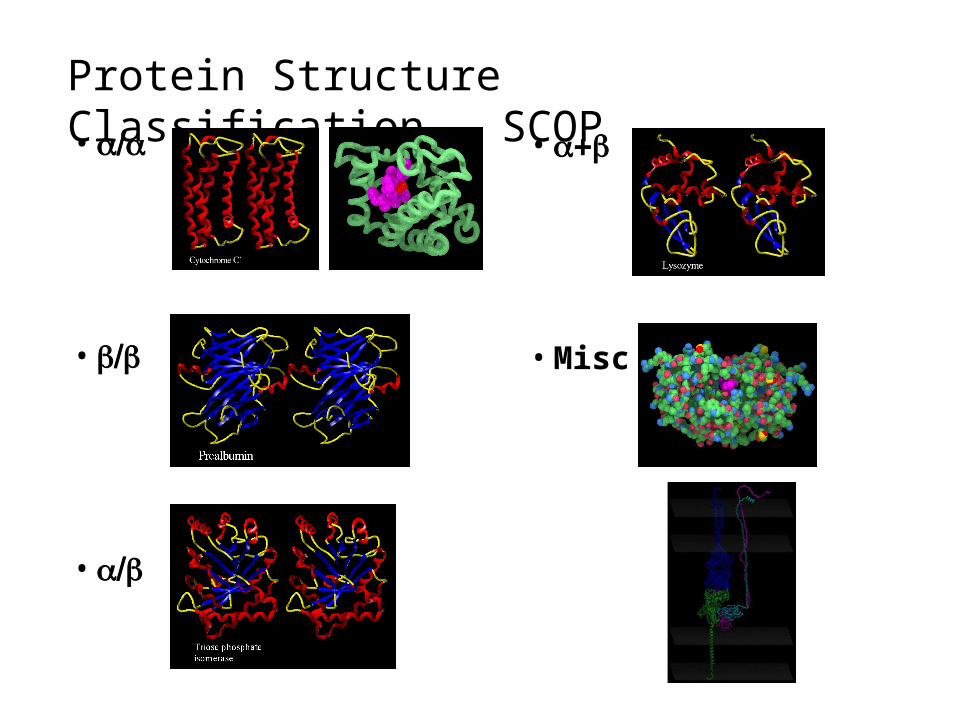
•
•
•
•
• Misc

Protein Structure Classification - SCOP
Class Number of foldsNumber of superfamilies
Number of families
All alpha proteins 218 376 608
All beta proteins 144 290 560
Alpha and beta proteins ()
136 222 629
Alpha and beta proteins ()
279 409 717
Multi-domain proteins 46 46 61
Membrane and cell surface proteins
47 88 99
Small proteins 75 108 171
Total 945 1539 2845
Scop Classification StatisticsSCOP: Structural Classification of Proteins. 1.69 release
25973 PDB Entries (1 Oct 2004). 70859 Domains. 1 Literature Reference(excluding nucleic acids and theoretical models)
Protein Structure Classification - SCOP
Protein Structure Classification - SCOP

Protein Structure Classification - SCOP

Protein Structure Classification - SCOP

Protein Structure Classification - SCOP

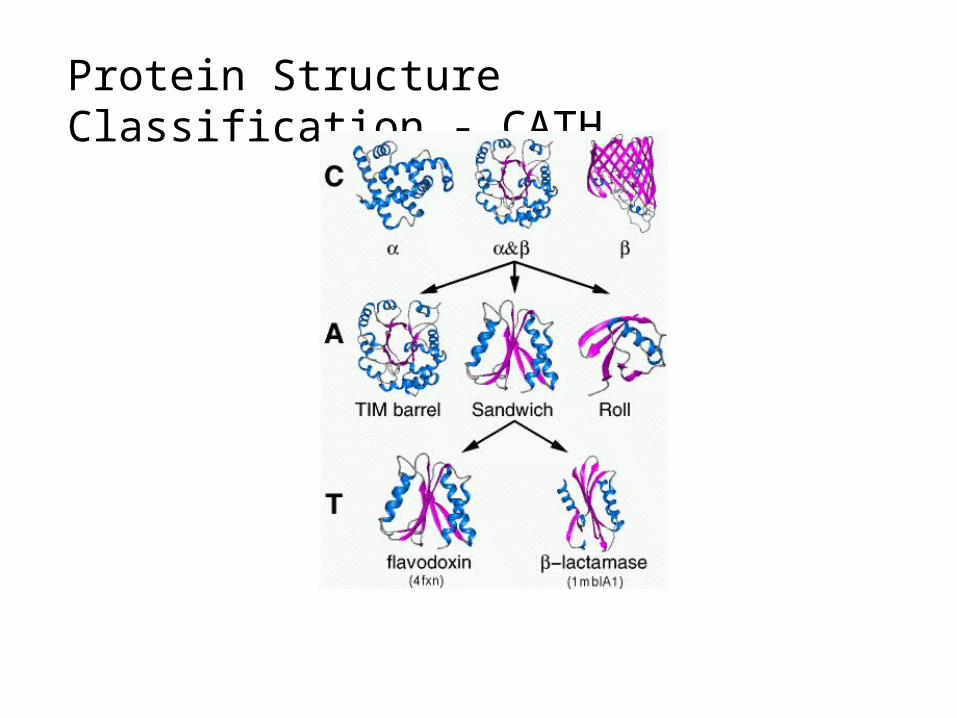
Protein Structure Classification - CATH
• CATH Protein Structure Classification• http://www.cathdb.info/latest/index.html
• CATH is a hierarchical classification of protein domain structures, which clusters proteins at four major levels, Class(C), Architecture(A), Topology(T) and Homologous superfamily (H).
• Class, derived from secondary structure content, is assigned for more than 90% of protein structures automatically.
• Architecture, which describes the gross orientation of secondary structures, independent of connectivities, is currently assigned manually.
• The topology level clusters structures into fold groups according to their topological connections and numbers of secondary structures.
• The homologous superfamilies cluster proteins with highly similar structures and functions. The assignments of structures to fold groups and homologous superfamilies are made by sequence and structure comparisons.
Protein Structure Classification - CATH
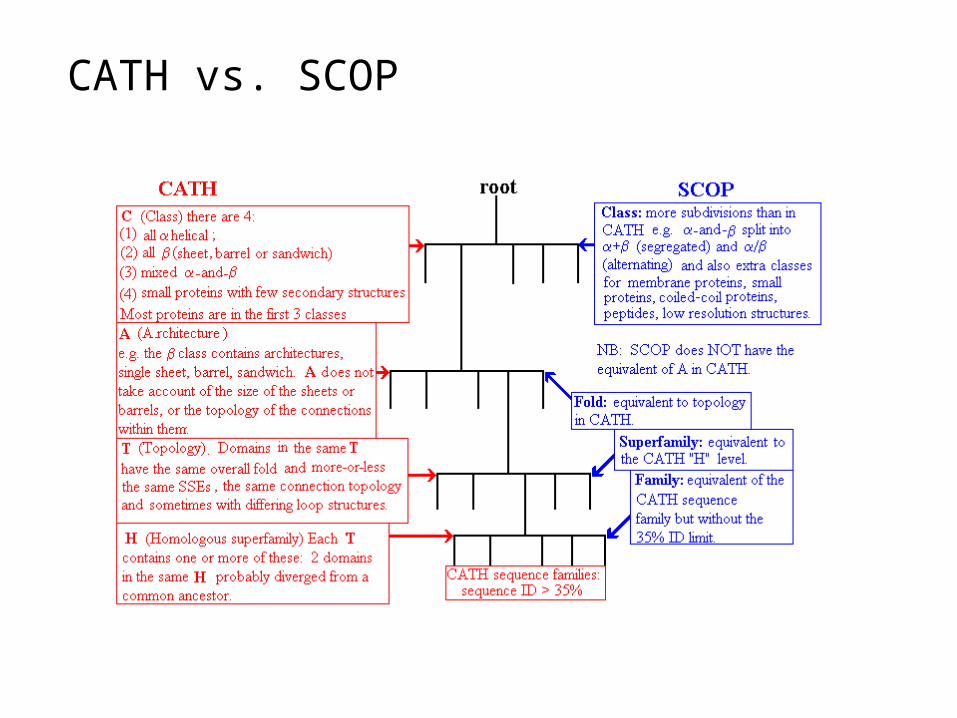
CATH vs. SCOP
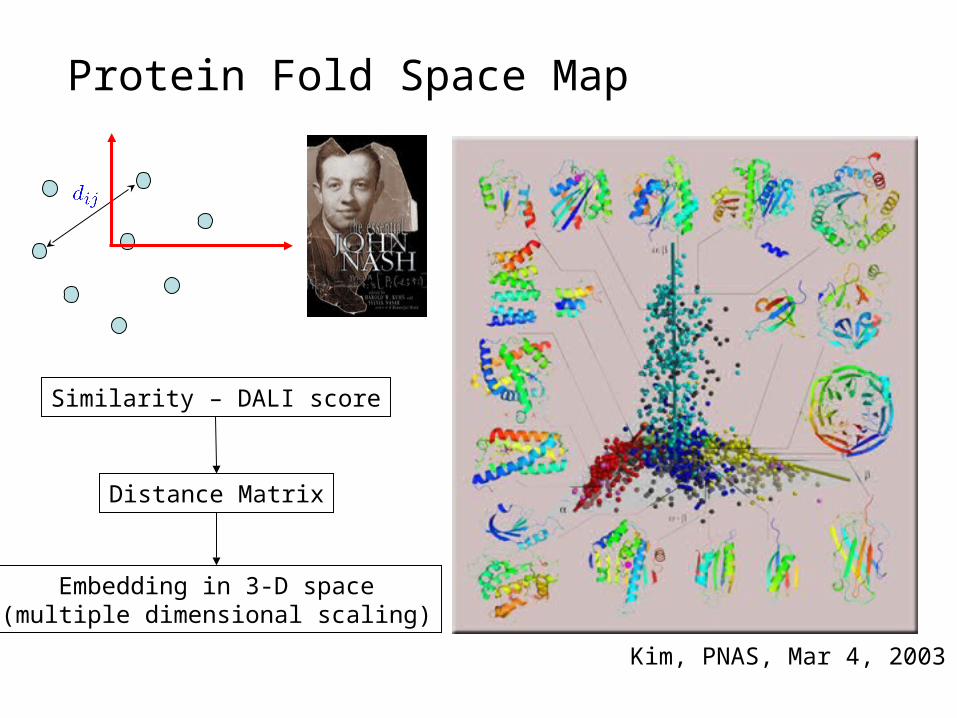
Protein Fold Space Map
Kim, PNAS, Mar 4, 2003
Similarity – DALI score
Distance Matrix
Embedding in 3-D space(multiple dimensional scaling)
Review of Protein Structure (5 min)
Introduction to Proteomics (10 min)
Protein Structure Database and Classification (15 min)
Protein Structure Prediction (15 min)
3-D Alignment (Left for next lab)
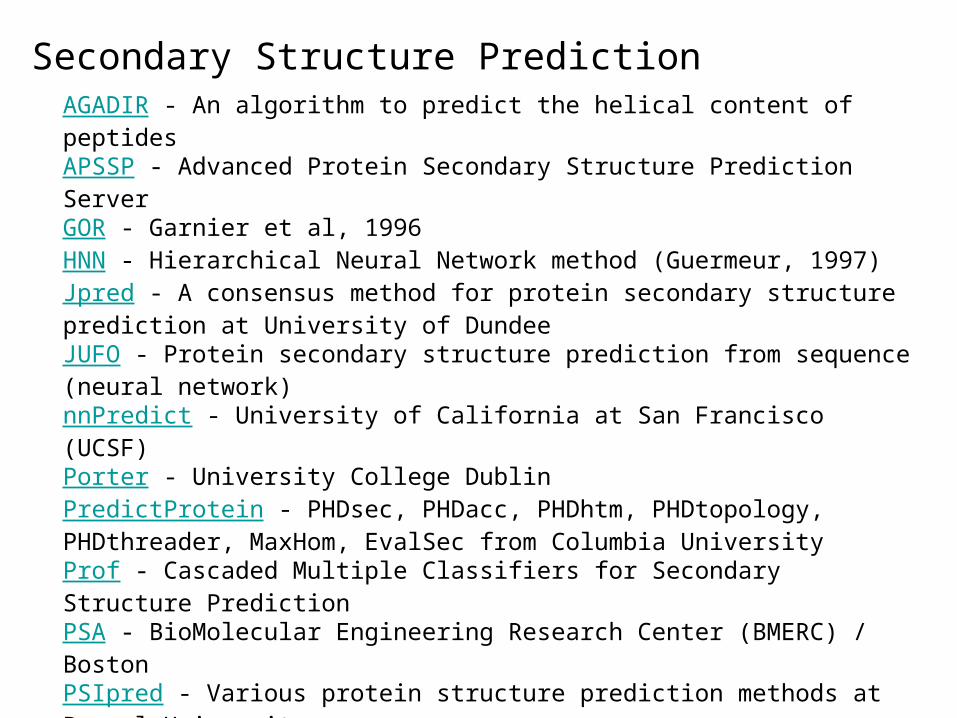
Secondary Structure PredictionAGADIR - An algorithm to predict the helical content of peptides APSSP - Advanced Protein Secondary Structure Prediction Server GOR - Garnier et al, 1996 HNN - Hierarchical Neural Network method (Guermeur, 1997) Jpred - A consensus method for protein secondary structure prediction at University of Dundee JUFO - Protein secondary structure prediction from sequence (neural network) nnPredict - University of California at San Francisco (UCSF) Porter - University College Dublin PredictProtein - PHDsec, PHDacc, PHDhtm, PHDtopology, PHDthreader, MaxHom, EvalSec from Columbia University Prof - Cascaded Multiple Classifiers for Secondary Structure Prediction PSA - BioMolecular Engineering Research Center (BMERC) / Boston PSIpred - Various protein structure prediction methods at Brunel University SOPMA - Geourjon and Deléage, 1995 SSpro - Secondary structure prediction using bidirectional recurrent neural networks at University of California DLP - Domain linker prediction at RIKEN
http://us.expasy.org/tools/#secondary
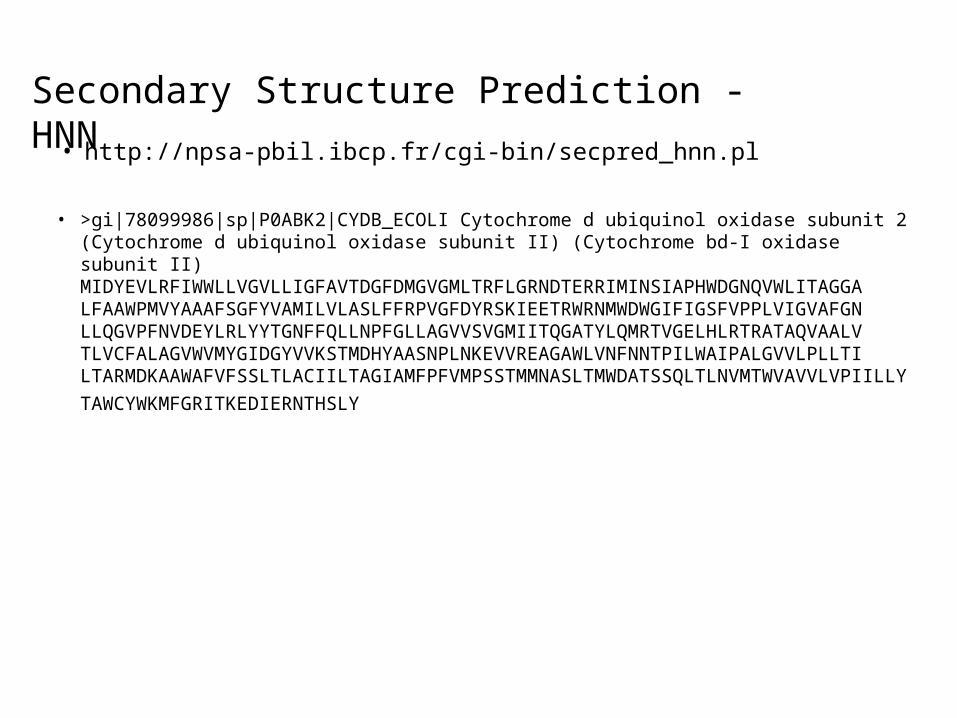
Secondary Structure Prediction - HNN
• >gi|78099986|sp|P0ABK2|CYDB_ECOLI Cytochrome d ubiquinol oxidase subunit 2 (Cytochrome d ubiquinol oxidase subunit II) (Cytochrome bd-I oxidase subunit II) MIDYEVLRFIWWLLVGVLLIGFAVTDGFDMGVGMLTRFLGRNDTERRIMINSIAPHWDGNQVWLITAGGA LFAAWPMVYAAAFSGFYVAMILVLASLFFRPVGFDYRSKIEETRWRNMWDWGIFIGSFVPPLVIGVAFGN LLQGVPFNVDEYLRLYYTGNFFQLLNPFGLLAGVVSVGMIITQGATYLQMRTVGELHLRTRATAQVAALV TLVCFALAGVWVMYGIDGYVVKSTMDHYAASNPLNKEVVREAGAWLVNFNNTPILWAIPALGVVLPLLTI LTARMDKAAWAFVFSSLTLACIILTAGIAMFPFVMPSSTMMNASLTMWDATSSQLTLNVMTWVAVVLVPIILLY
TAWCYWKMFGRITKEDIERNTHSLY
• http://npsa-pbil.ibcp.fr/cgi-bin/secpred_hnn.pl
Secondary Structure Prediction - HNN
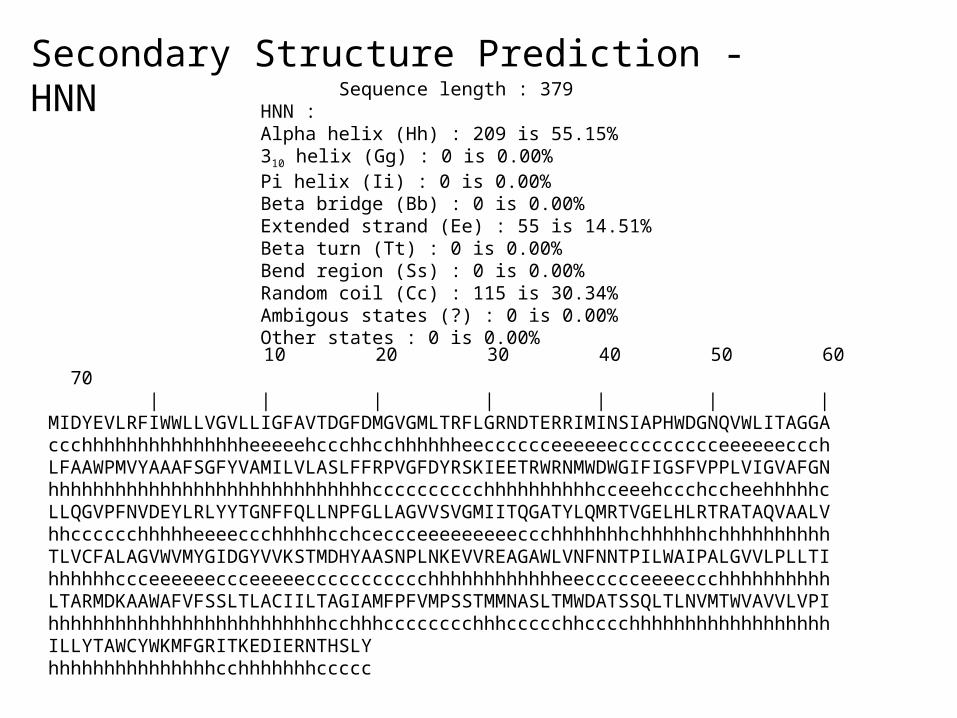
10 20 30 40 50 60 70 | | | | | | | MIDYEVLRFIWWLLVGVLLIGFAVTDGFDMGVGMLTRFLGRNDTERRIMINSIAPHWDGNQVWLITAGGA ccchhhhhhhhhhhhhhheeeeehccchhcchhhhhheecccccceeeeeeccccccccceeeeeeccch LFAAWPMVYAAAFSGFYVAMILVLASLFFRPVGFDYRSKIEETRWRNMWDWGIFIGSFVPPLVIGVAFGN hhhhhhhhhhhhhhhhhhhhhhhhhhhhhcccccccccchhhhhhhhhhcceeehccchccheehhhhhc LLQGVPFNVDEYLRLYYTGNFFQLLNPFGLLAGVVSVGMIITQGATYLQMRTVGELHLRTRATAQVAALV hhcccccchhhhheeeeccchhhhhcchceccceeeeeeeeeccchhhhhhhchhhhhhchhhhhhhhhh TLVCFALAGVWVMYGIDGYVVKSTMDHYAASNPLNKEVVREAGAWLVNFNNTPILWAIPALGVVLPLLTI hhhhhhccceeeeeeccceeeeeccccccccccchhhhhhhhhhhheeccccceeeeccchhhhhhhhhh LTARMDKAAWAFVFSSLTLACIILTAGIAMFPFVMPSSTMMNASLTMWDATSSQLTLNVMTWVAVVLVPI hhhhhhhhhhhhhhhhhhhhhhhhhcchhhcccccccchhhccccchhcccchhhhhhhhhhhhhhhhhh ILLYTAWCYWKMFGRITKEDIERNTHSLY hhhhhhhhhhhhhhhcchhhhhhhccccc
Sequence length : 379 HNN : Alpha helix (Hh) : 209 is 55.15% 310 helix (Gg) : 0 is 0.00% Pi helix (Ii) : 0 is 0.00% Beta bridge (Bb) : 0 is 0.00% Extended strand (Ee) : 55 is 14.51% Beta turn (Tt) : 0 is 0.00% Bend region (Ss) : 0 is 0.00% Random coil (Cc) : 115 is 30.34% Ambigous states (?) : 0 is 0.00% Other states : 0 is 0.00%

Secondary Structure Prediction - HNN
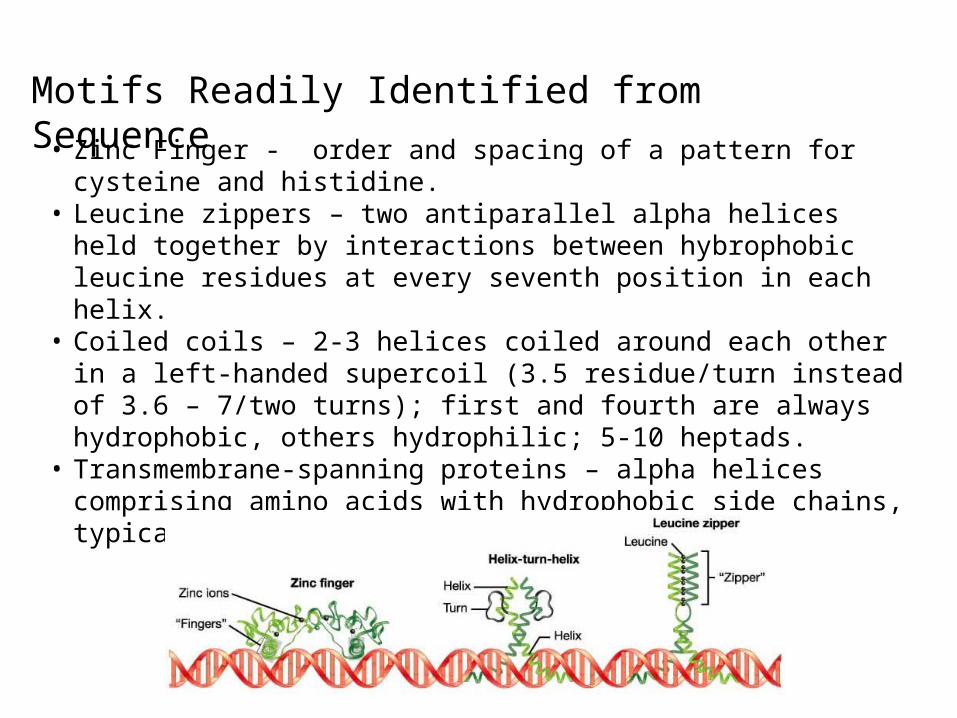
Motifs Readily Identified from Sequence
• Zinc Finger - order and spacing of a pattern for cysteine and histidine.
• Leucine zippers – two antiparallel alpha helices held together by interactions between hybrophobic leucine residues at every seventh position in each helix.
• Coiled coils – 2-3 helices coiled around each other in a left-handed supercoil (3.5 residue/turn instead of 3.6 – 7/two turns); first and fourth are always hydrophobic, others hydrophilic; 5-10 heptads.
• Transmembrane-spanning proteins – alpha helices comprising amino acids with hydrophobic side chains, typically 20-30 residues.
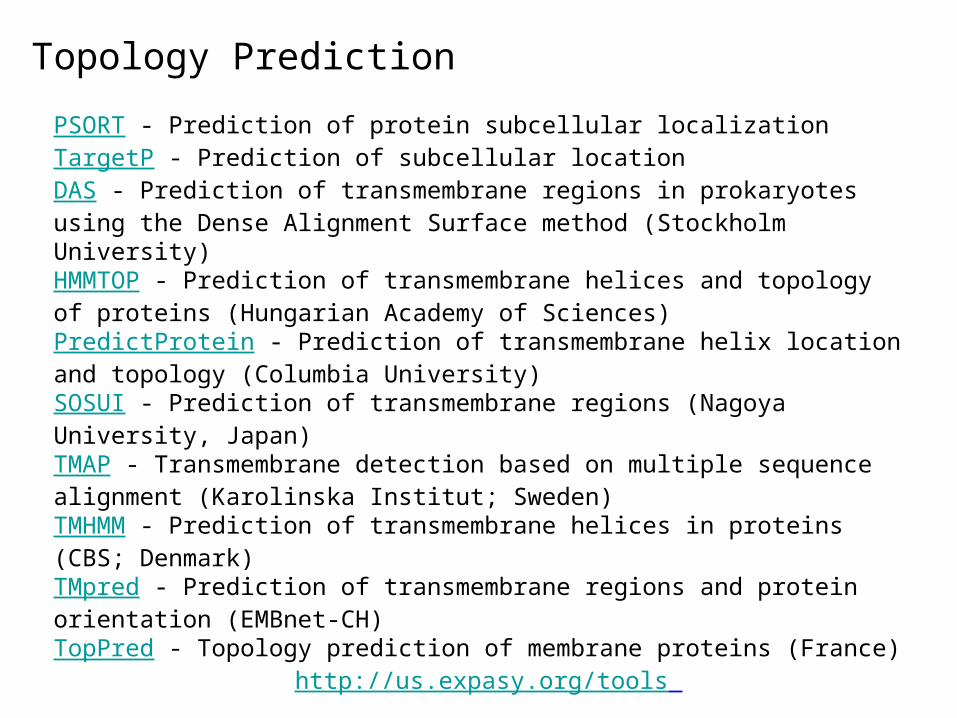
Topology Prediction
PSORT - Prediction of protein subcellular localization TargetP - Prediction of subcellular location DAS - Prediction of transmembrane regions in prokaryotes using the Dense Alignment Surface method (Stockholm University) HMMTOP - Prediction of transmembrane helices and topology of proteins (Hungarian Academy of Sciences) PredictProtein - Prediction of transmembrane helix location and topology (Columbia University) SOSUI - Prediction of transmembrane regions (Nagoya University, Japan) TMAP - Transmembrane detection based on multiple sequence alignment (Karolinska Institut; Sweden) TMHMM - Prediction of transmembrane helices in proteins (CBS; Denmark) TMpred - Prediction of transmembrane regions and protein orientation (EMBnet-CH) TopPred - Topology prediction of membrane proteins (France)
http://us.expasy.org/tools
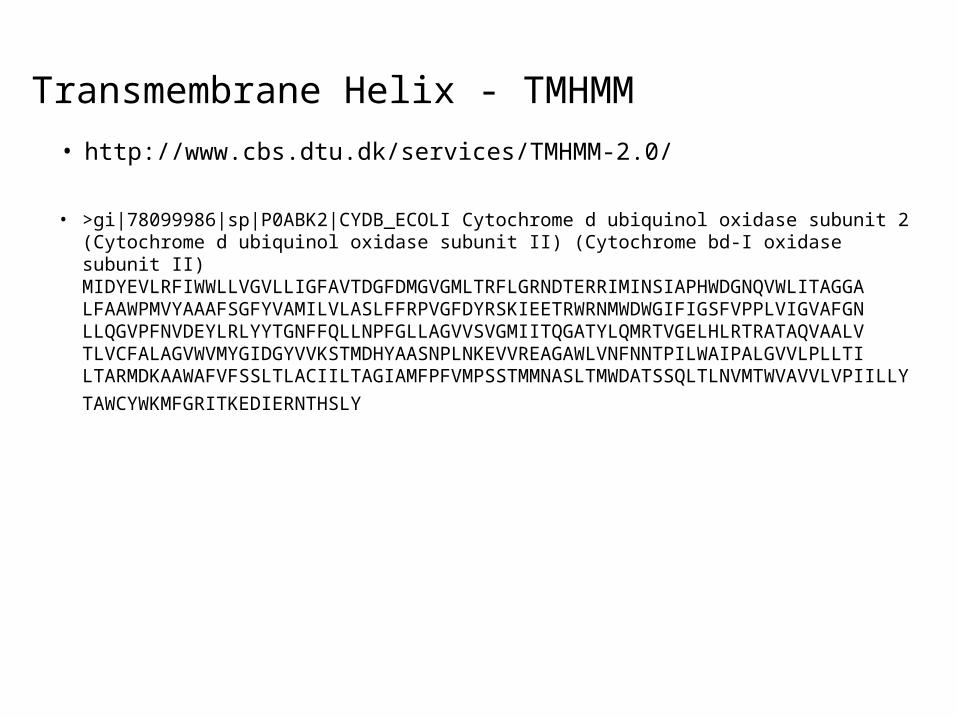
Transmembrane Helix - TMHMM
• >gi|78099986|sp|P0ABK2|CYDB_ECOLI Cytochrome d ubiquinol oxidase subunit 2 (Cytochrome d ubiquinol oxidase subunit II) (Cytochrome bd-I oxidase subunit II) MIDYEVLRFIWWLLVGVLLIGFAVTDGFDMGVGMLTRFLGRNDTERRIMINSIAPHWDGNQVWLITAGGA LFAAWPMVYAAAFSGFYVAMILVLASLFFRPVGFDYRSKIEETRWRNMWDWGIFIGSFVPPLVIGVAFGN LLQGVPFNVDEYLRLYYTGNFFQLLNPFGLLAGVVSVGMIITQGATYLQMRTVGELHLRTRATAQVAALV TLVCFALAGVWVMYGIDGYVVKSTMDHYAASNPLNKEVVREAGAWLVNFNNTPILWAIPALGVVLPLLTI LTARMDKAAWAFVFSSLTLACIILTAGIAMFPFVMPSSTMMNASLTMWDATSSQLTLNVMTWVAVVLVPIILLY
TAWCYWKMFGRITKEDIERNTHSLY
• http://www.cbs.dtu.dk/services/TMHMM-2.0/
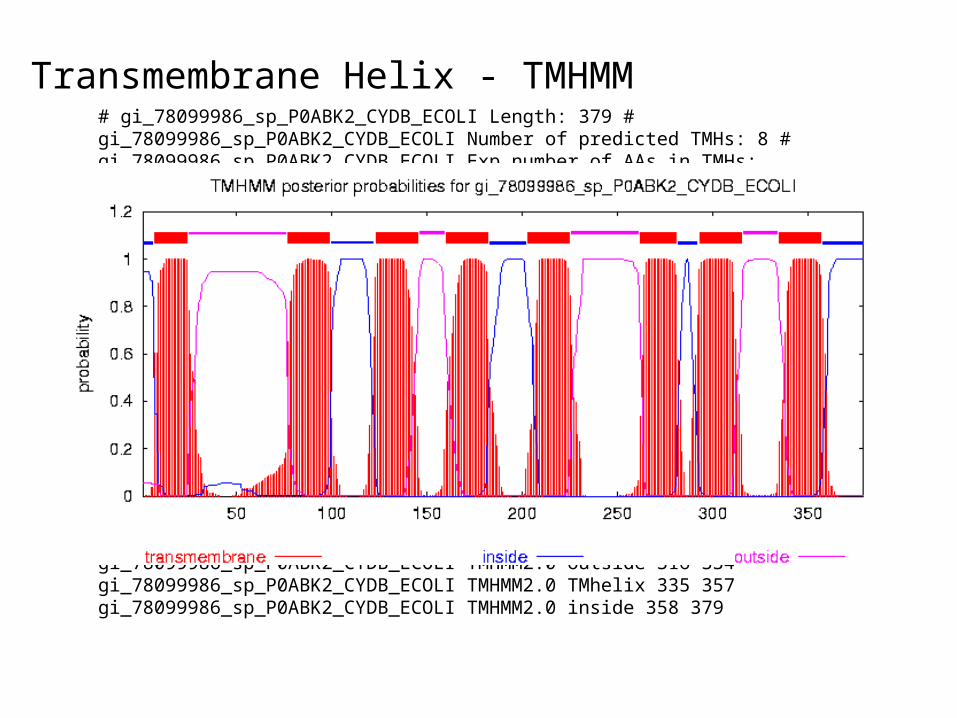
Transmembrane Helix - TMHMM# gi_78099986_sp_P0ABK2_CYDB_ECOLI Length: 379 # gi_78099986_sp_P0ABK2_CYDB_ECOLI Number of predicted TMHs: 8 # gi_78099986_sp_P0ABK2_CYDB_ECOLI Exp number of AAs in TMHs: 177.07249 # gi_78099986_sp_P0ABK2_CYDB_ECOLI Exp number, first 60 AAs: 20.62396 # gi_78099986_sp_P0ABK2_CYDB_ECOLI Total prob of N-in: 0.94585 # gi_78099986_sp_P0ABK2_CYDB_ECOLI POSSIBLE N-term signal sequence gi_78099986_sp_P0ABK2_CYDB_ECOLI TMHMM2.0 inside 1 6 gi_78099986_sp_P0ABK2_CYDB_ECOLI TMHMM2.0 TMhelix 7 24 gi_78099986_sp_P0ABK2_CYDB_ECOLI TMHMM2.0 outside 25 76 gi_78099986_sp_P0ABK2_CYDB_ECOLI TMHMM2.0 TMhelix 77 99 gi_78099986_sp_P0ABK2_CYDB_ECOLI TMHMM2.0 inside 100 122 gi_78099986_sp_P0ABK2_CYDB_ECOLI TMHMM2.0 TMhelix 123 145 gi_78099986_sp_P0ABK2_CYDB_ECOLI TMHMM2.0 outside 146 159 gi_78099986_sp_P0ABK2_CYDB_ECOLI TMHMM2.0 TMhelix 160 182 gi_78099986_sp_P0ABK2_CYDB_ECOLI TMHMM2.0 inside 183 202 gi_78099986_sp_P0ABK2_CYDB_ECOLI TMHMM2.0 TMhelix 203 225 gi_78099986_sp_P0ABK2_CYDB_ECOLI TMHMM2.0 outside 226 261 gi_78099986_sp_P0ABK2_CYDB_ECOLI TMHMM2.0 TMhelix 262 281 gi_78099986_sp_P0ABK2_CYDB_ECOLI TMHMM2.0 inside 282 292 gi_78099986_sp_P0ABK2_CYDB_ECOLI TMHMM2.0 TMhelix 293 315 gi_78099986_sp_P0ABK2_CYDB_ECOLI TMHMM2.0 outside 316 334 gi_78099986_sp_P0ABK2_CYDB_ECOLI TMHMM2.0 TMhelix 335 357 gi_78099986_sp_P0ABK2_CYDB_ECOLI TMHMM2.0 inside 358 379
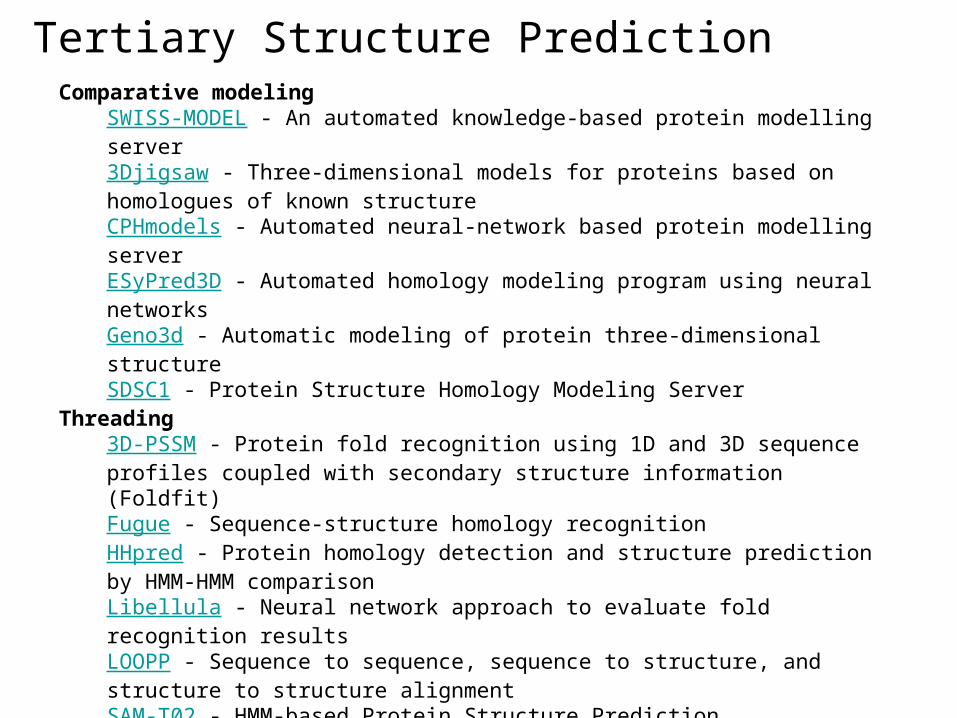
Tertiary Structure PredictionComparative modeling
SWISS-MODEL - An automated knowledge-based protein modelling server 3Djigsaw - Three-dimensional models for proteins based on homologues of known structure CPHmodels - Automated neural-network based protein modelling server ESyPred3D - Automated homology modeling program using neural networks Geno3d - Automatic modeling of protein three-dimensional structure SDSC1 - Protein Structure Homology Modeling Server
Threading 3D-PSSM - Protein fold recognition using 1D and 3D sequence profiles coupled with secondary structure information (Foldfit) Fugue - Sequence-structure homology recognition HHpred - Protein homology detection and structure prediction by HMM-HMM comparison Libellula - Neural network approach to evaluate fold recognition results LOOPP - Sequence to sequence, sequence to structure, and structure to structure alignment SAM-T02 - HMM-based Protein Structure Prediction Threader - Protein fold recognition ProSup - Protein structure superimposition SWEET - Constructing 3D models of saccharides from their sequences
Ab initio HMMSTR/Rosetta - Prediction of protein structure from sequence
http://us.expasy.org/tools
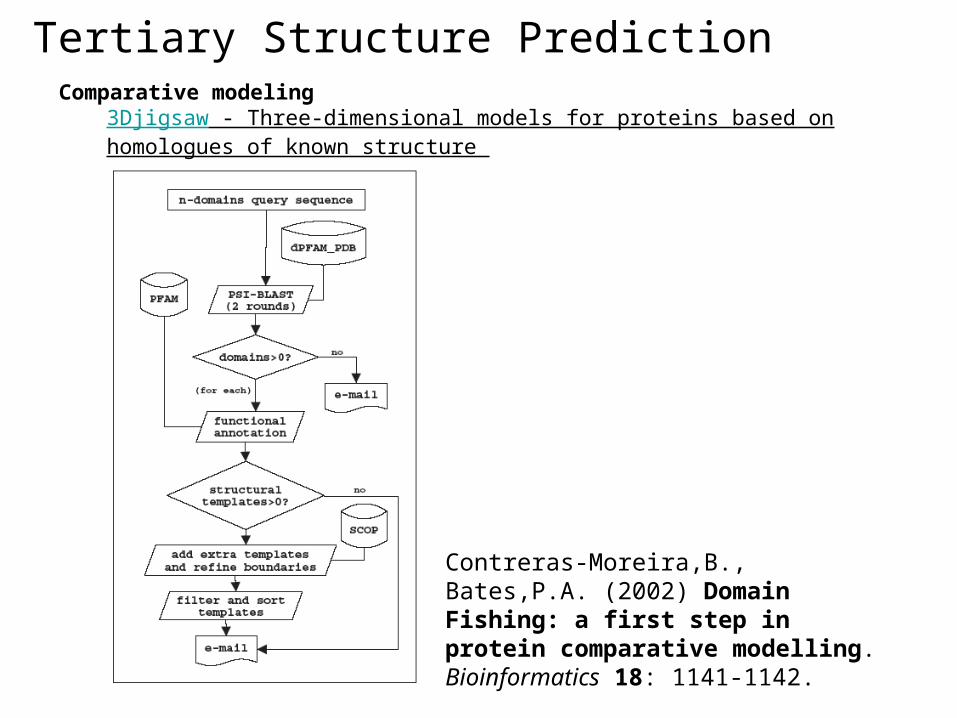
Tertiary Structure PredictionComparative modeling
3Djigsaw - Three-dimensional models for proteins based on homologues of known structure
Contreras-Moreira,B., Bates,P.A. (2002) Domain Fishing: a first step in protein comparative modelling. Bioinformatics 18: 1141-1142.
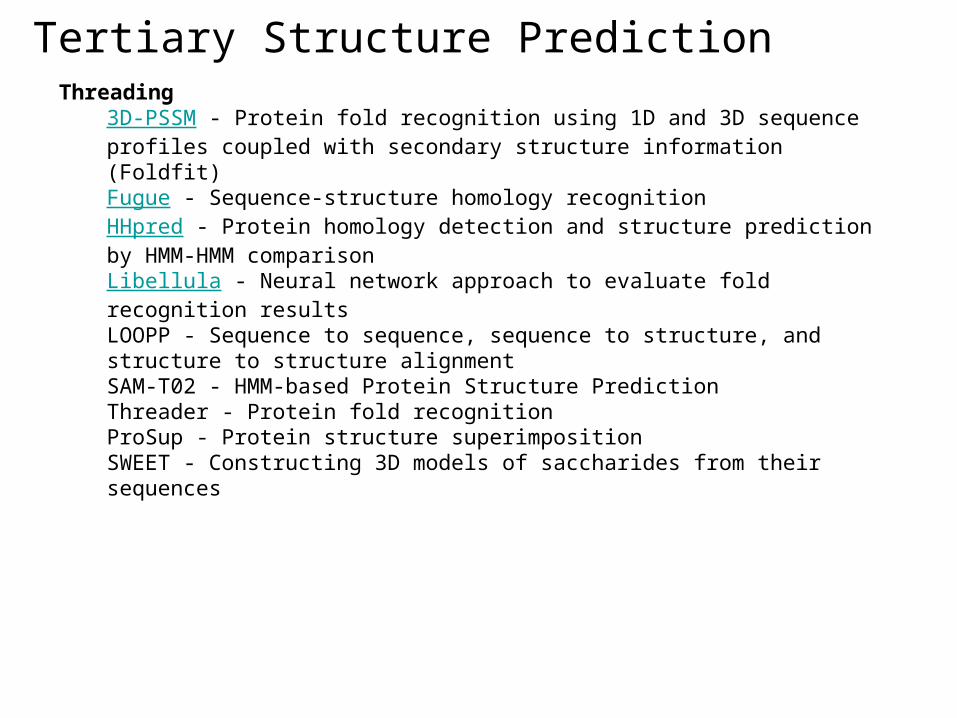
Tertiary Structure PredictionThreading
3D-PSSM - Protein fold recognition using 1D and 3D sequence profiles coupled with secondary structure information (Foldfit) Fugue - Sequence-structure homology recognition HHpred - Protein homology detection and structure prediction by HMM-HMM comparison Libellula - Neural network approach to evaluate fold recognition results LOOPP - Sequence to sequence, sequence to structure, and structure to structure alignment SAM-T02 - HMM-based Protein Structure Prediction Threader - Protein fold recognition ProSup - Protein structure superimposition SWEET - Constructing 3D models of saccharides from their sequences
Tertiary Structure PredictionThreading
The term threading was first coined by Jones, Taylor and Thornton in 1992, and originally referred specifically to the use of a full 3-D structure atomic representation of the protein template in fold recognition. Today, the terms threading and fold recognition are frequently (though somewhat incorrectly) used interchangeably.
The basic idea is that the target sequence (the protein sequence for which the structure is being predicted) is threaded through the backbone structures of a collection of template proteins (known as the fold library) and a “goodness of fit” score calculated for each sequence-structure alignment. This goodness of fit is often derived in terms of an empirical energy function, based on statistics derived from known protein structures, but many other scoring functions have been proposed and tried over the years.
Threading methods share some of the characteristics of both comparative modelling methods (the sequence alignment aspect) and ab initio prediction methods (predicting structure based on identifying low-energy conformations of the target protein).
http://en.wikipedia.org/wiki/Threading_%28protein_sequence%29
Tertiary Structure Prediction
Ab initio (de novo)
• From scratch – using physical property instead of known structures
• Mimic folding process – minimize certain energy function, stochastic modeling (e.g., simulated annealing)
• Computationally expensive – requires large clusters, large machines (e.g., IBM BlueGene) or distributed computing, currently only work for small peptides
• Big potential in the future – understand the dynamics, accuracy, and applications in drug development
Tertiary Structure PredictionAb initio (de novo)
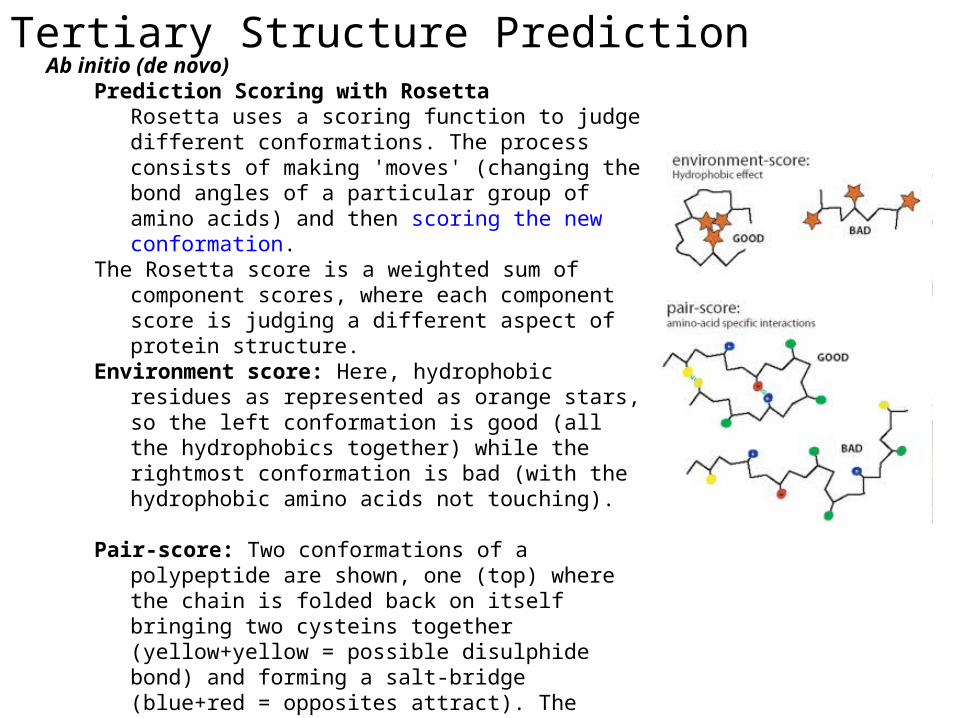
Prediction Scoring with RosettaRosetta uses a scoring function to judge different conformations. The process consists of making 'moves' (changing the bond angles of a particular group of amino acids) and then scoring the new conformation.
The Rosetta score is a weighted sum of component scores, where each component score is judging a different aspect of protein structure.
Environment score: Here, hydrophobic residues as represented as orange stars, so the left conformation is good (all the hydrophobics together) while the rightmost conformation is bad (with the hydrophobic amino acids not touching).
Pair-score: Two conformations of a polypeptide are shown, one (top) where the chain is folded back on itself bringing two cysteins together (yellow+yellow = possible disulphide bond) and forming a salt-bridge (blue+red = opposites attract). The conformation at bottom does not make these pairings and the pair-score would, thus, favor the top conformation.
http://www.grid.org/projects/hpf/howitworks_scoring.htm
Evaluation - CASPCASP - Critical Assessment of Techniques for Protein Structure
Prediction, is a community-wide experiment (though it is commonly referred to as a competition) for protein structure prediction taking place every two years since 1994. (http://predictioncenter.org/)
The main goal of CASP is to obtain an in-depth and objective assessment of our current abilities and inabilities in the area of protein structure prediction. To this end, participants will predict as much as possible about a set of soon to be known structures. These will be true predictions, not ‘post-dictions’ made on already known structures. CASP7 will particularly address the following questions:
1. Are the models produced similar to the corresponding experimental structure?
2. Is the mapping of the target sequence onto the proposed structure (i.e. the alignment) correct?
3. Have similar structures that a model can be based on been identified? 4. Are comparative models more accurate than can be obtained by simply
copying the best template? 5. Has there been progress from the earlier CASPs? 6. What methods are most effective? 7. Where can future effort be most productively focused?
Evaluation - CASPEvaluation of the results is carried out in the following prediction categories:• tertiary structure prediction (all CASPs) • secondary structure prediction (dropped after CASP5) • prediction of structure complexes (CASP2 only; a separate experiment -
CAPRI - carries on this subject) • residue-residue contact prediction (starting CASP4) • disordered regions prediction (starting CASP5) • domain boundary prediction (starting CASP6) • function prediction (starting CASP6) • model quality assessment (starting CASP7) • model refinement (starting CASP7)
Tertiary structure prediction category was further subdivided into• homology modelling • fold recognition (also called protein threading; Note, this is incorrect as
threading is a method) • de novo structure prediction Now referred to as 'New Fold' as many
methods apply evaluation, or scoring, functions that are biased by knowledge of native protein structures, such an example would be an artificial neural network.
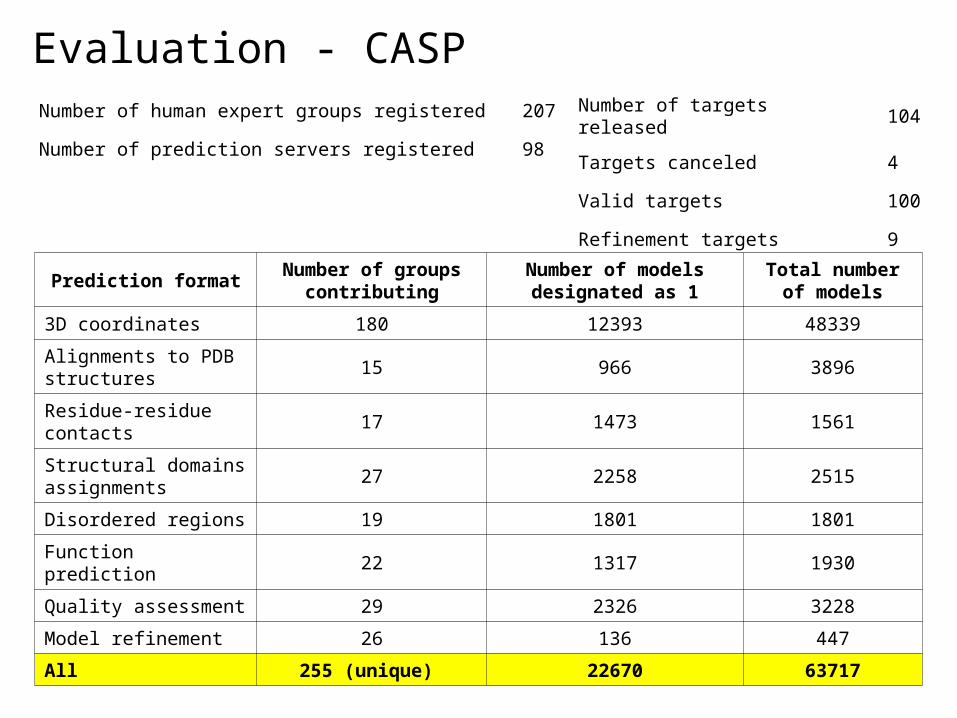
Evaluation - CASPNumber of human expert groups registered 207
Number of prediction servers registered 98
Number of targets released 104
Targets canceled 4
Valid targets 100
Refinement targets 9
Prediction formatNumber of groups
contributingNumber of models designated as 1
Total number of models
3D coordinates 180 12393 48339
Alignments to PDB structures
15 966 3896
Residue-residue contacts
17 1473 1561
Structural domains assignments
27 2258 2515
Disordered regions 19 1801 1801
Function prediction 22 1317 1930
Quality assessment 29 2326 3228
Model refinement 26 136 447
All 255 (unique) 22670 63717
Review of Protein Structure (5 min)
Introduction to Proteomics (10 min)
Protein Structure Database and Classification (15 min)
Protein Structure Prediction (15 min)
3-D Alignment (Left for next lab)
Why Align Structures
1. For homologous proteins (similar ancestry), this provides the “gold standard” for sequence alignment – elucidates the common ancestry of the proteins.
2. For nonhomologous proteins, allows us to identify common substructures of interest.
3. Allows us to classify proteins into clusters, based on structural similarity.
• The existence of large numbers of remote homologs shows us that true structural similarity is hard to see in the primary amino acid sequence
• Structural conservation is stronger than sequence conservation
Sequence/Structure Homology

Remote Homology
• Remote homologs sometimes conserve function (all SH3-like domains bind peptides), and often conserve active site locations (TIM barrels active sites are at the ends of the barrels).
• Remote homologs probably are evolutionarily related and fold using the same folding pathway.
Example of Structural Homologs
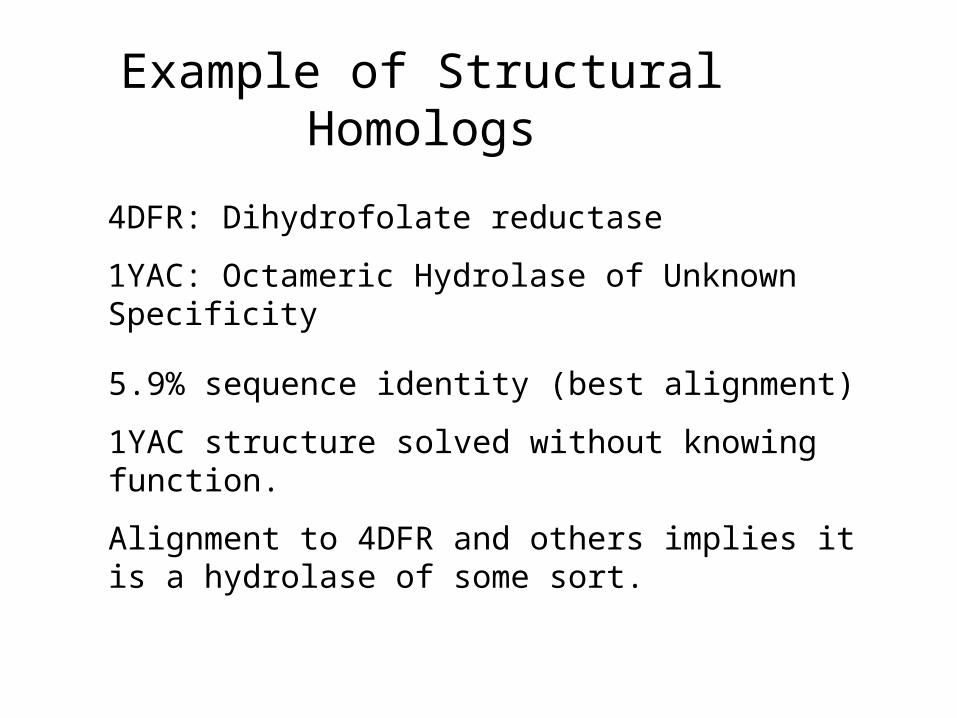
4DFR: Dihydrofolate reductase
1YAC: Octameric Hydrolase of Unknown Specificity
5.9% sequence identity (best alignment)
1YAC structure solved without knowing function.
Alignment to 4DFR and others implies it is a hydrolase of some sort.
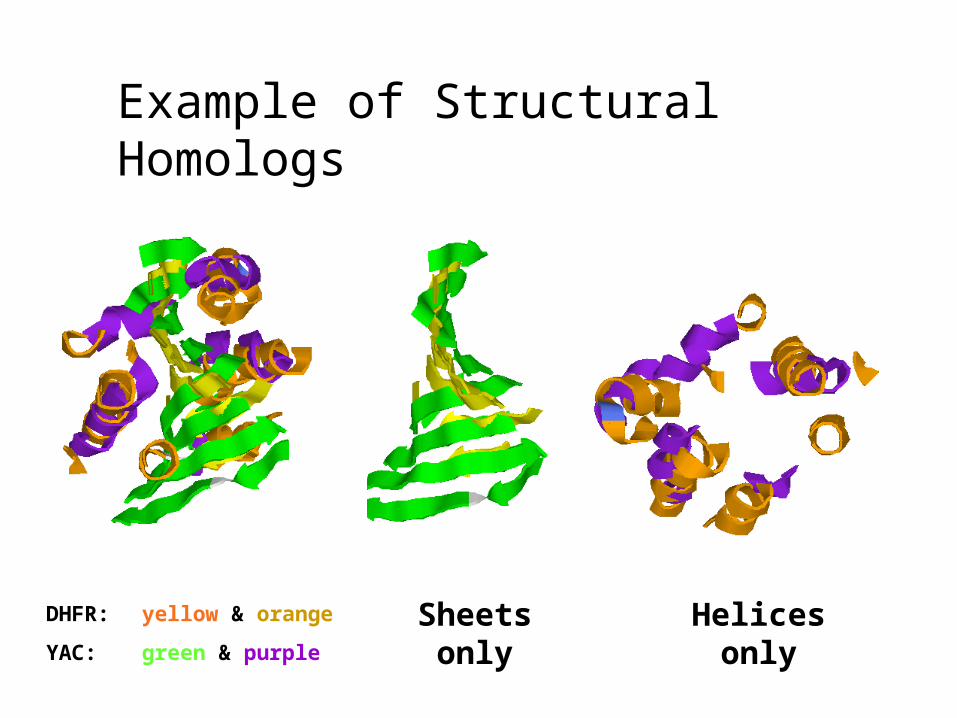
Example of Structural Homologs
DHFR: yellow & orange
YAC: green & purple
Sheets only
Helices only
Example of Structural Homologs
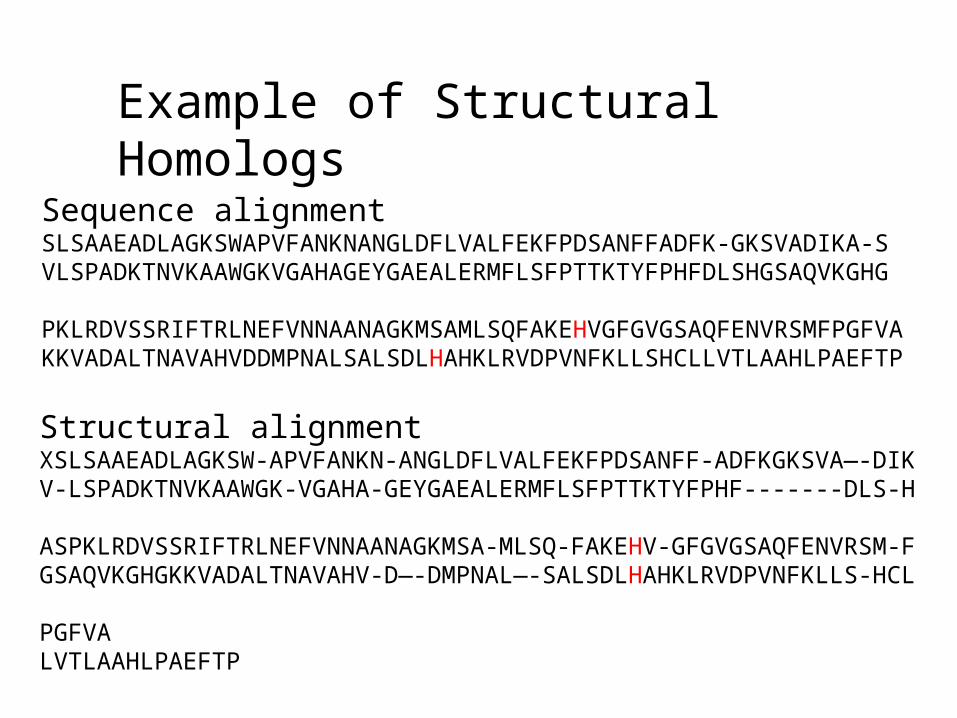
Sequence alignmentSLSAAEADLAGKSWAPVFANKNANGLDFLVALFEKFPDSANFFADFK-GKSVADIKA-SVLSPADKTNVKAAWGKVGAHAGEYGAEALERMFLSFPTTKTYFPHFDLSHGSAQVKGHG
PKLRDVSSRIFTRLNEFVNNAANAGKMSAMLSQFAKEHVGFGVGSAQFENVRSMFPGFVAKKVADALTNAVAHVDDMPNALSALSDLHAHKLRVDPVNFKLLSHCLLVTLAAHLPAEFTP
Structural alignmentXSLSAAEADLAGKSW-APVFANKN-ANGLDFLVALFEKFPDSANFF-ADFKGKSVA—-DIK V-LSPADKTNVKAAWGK-VGAHA-GEYGAEALERMFLSFPTTKTYFPHF-------DLS-H
ASPKLRDVSSRIFTRLNEFVNNAANAGKMSA-MLSQ-FAKEHV-GFGVGSAQFENVRSM-FGSAQVKGHGKKVADALTNAVAHV-D—-DMPNAL—-SALSDLHAHKLRVDPVNFKLLS-HCL
PGFVALVTLAAHLPAEFTP

How to Align Structures
1. Visual inspection (by eye)
2. Computational approach• Point-based methods using point distances and
other properties to establish correspondences• Secondary structure-based methods use vectors
representing secondary structures to establish correspondences.
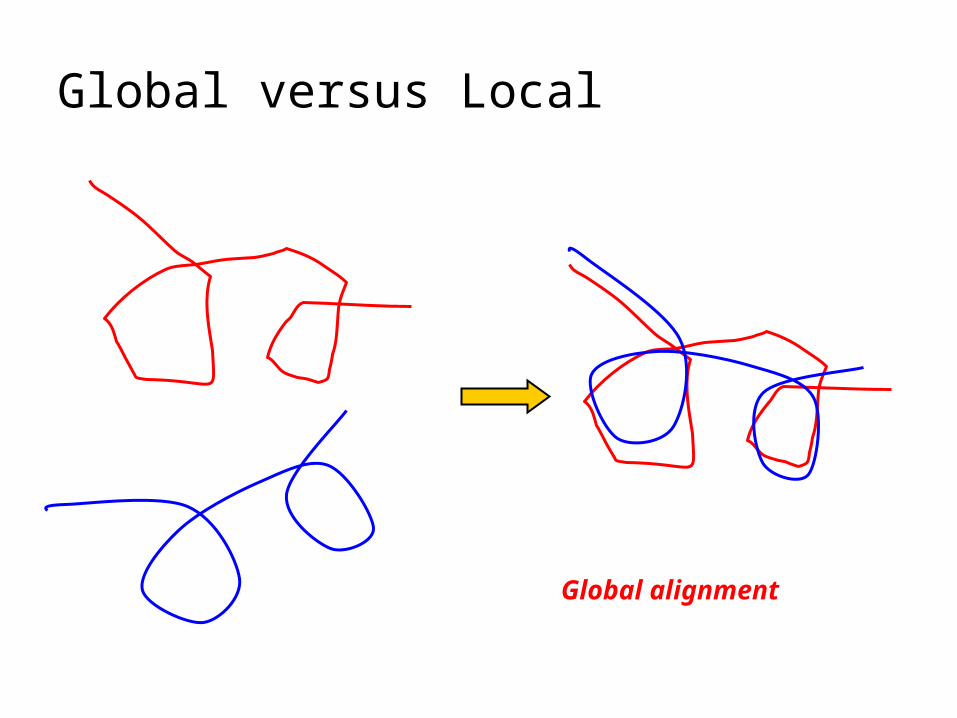
Global versus Local
Global alignment
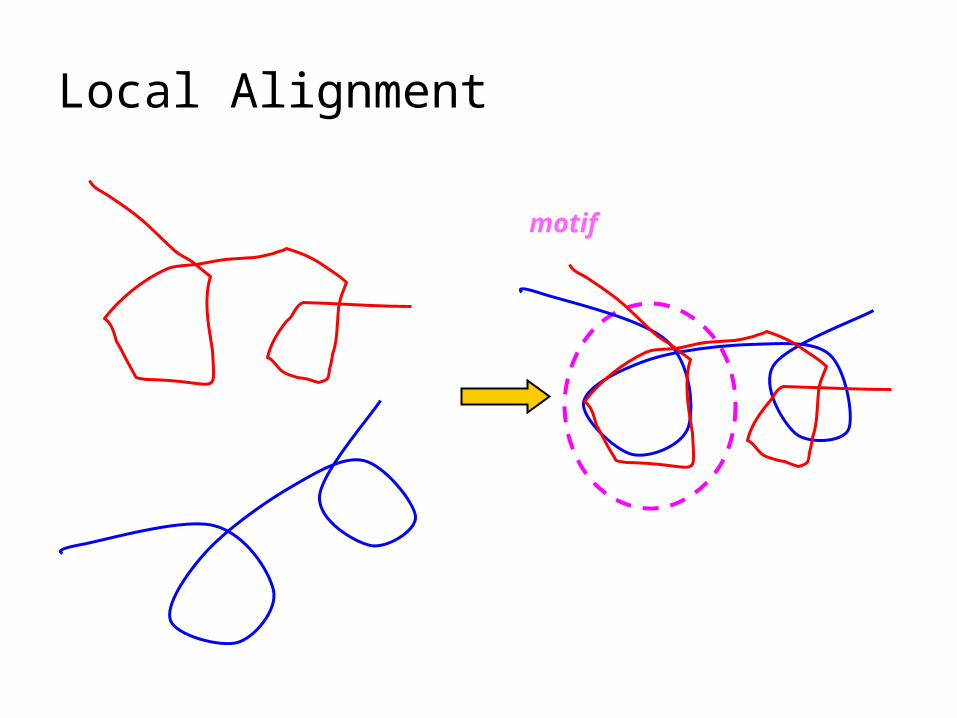
Local Alignment
motif
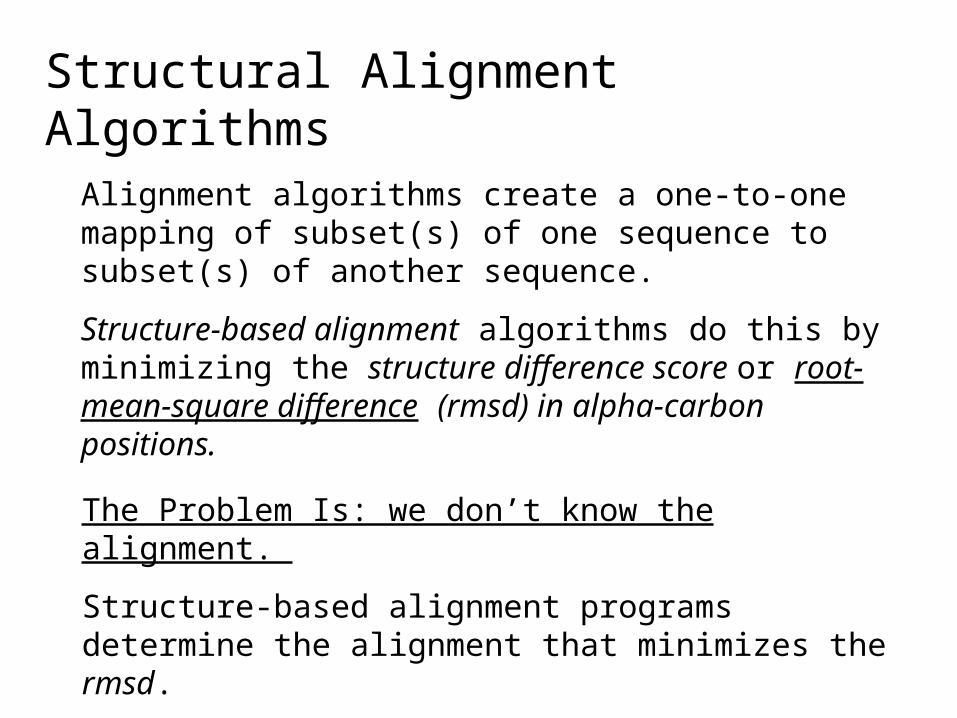
Structural Alignment Algorithms
Alignment algorithms create a one-to-one mapping of subset(s) of one sequence to subset(s) of another sequence.
Structure-based alignment algorithms do this by minimizing the structure difference score or root-mean-square difference (rmsd) in alpha-carbon positions.
The Problem Is: we don’t know the alignment.
Structure-based alignment programs determine the alignment that minimizes the rmsd.

Evaluating Structural Alignments
• # of aligned residues• Percent identity in aligned residues• # of gaps• Size of two proteins• Conservation of known active site environments • RMSD (root mean square deviation) of
corresponding residues• Dihedral angle difference …
• No universal criterion• Application dependent
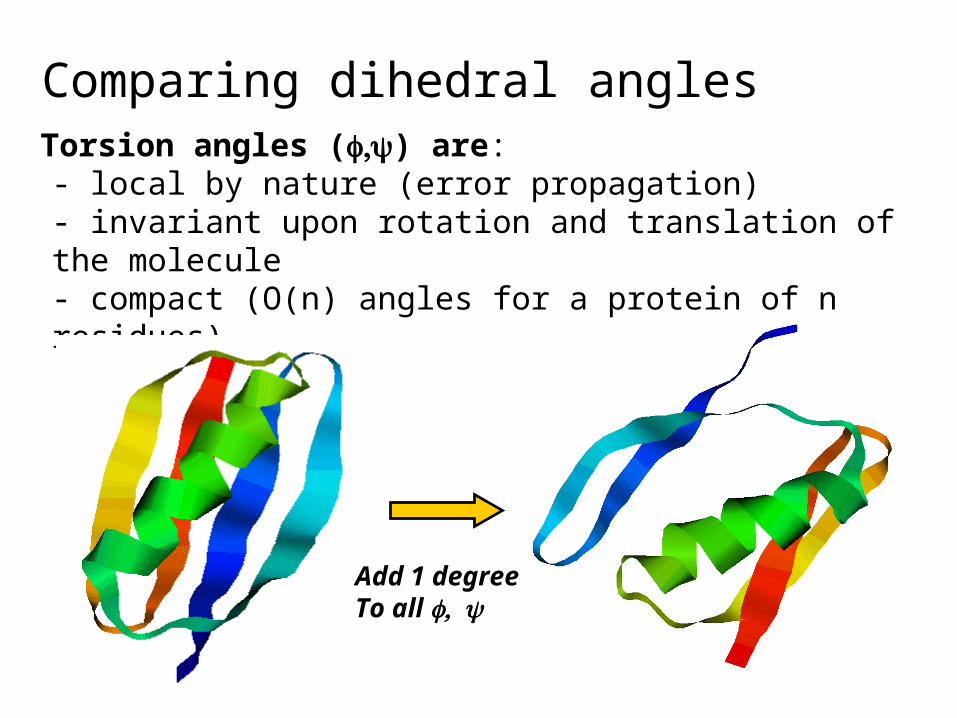
Comparing dihedral anglesTorsion angles () are:- local by nature (error propagation)- invariant upon rotation and translation of the molecule- compact (O(n) angles for a protein of n residues)
Add 1 degreeTo all
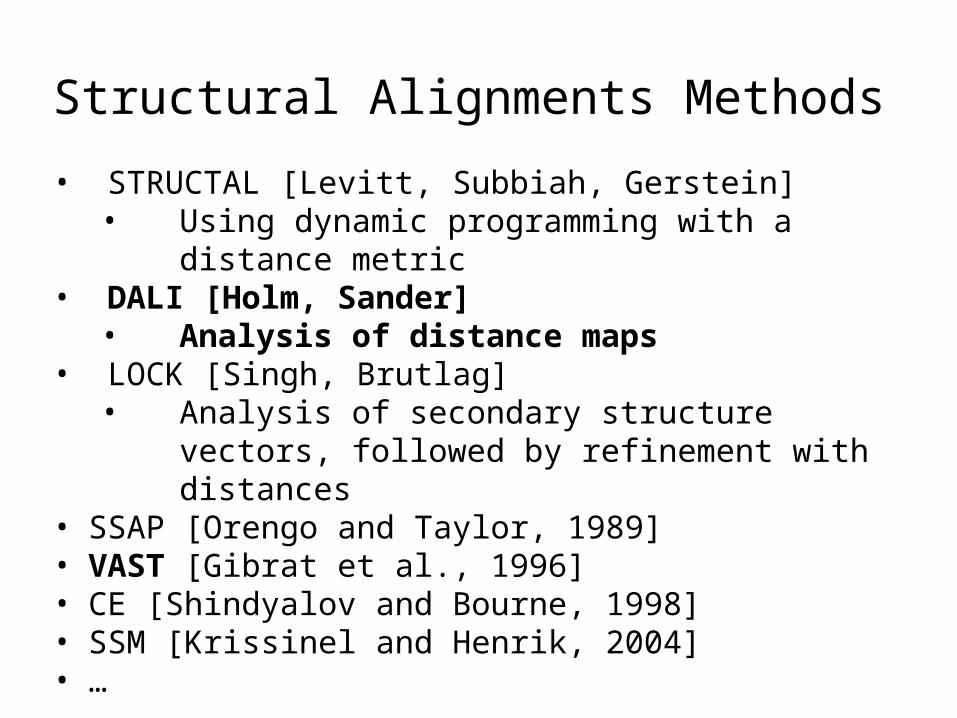
Structural Alignments Methods
• STRUCTAL [Levitt, Subbiah, Gerstein]• Using dynamic programming with a distance
metric• DALI [Holm, Sander]
• Analysis of distance maps• LOCK [Singh, Brutlag]
• Analysis of secondary structure vectors, followed by refinement with distances
• SSAP [Orengo and Taylor, 1989]• VAST [Gibrat et al., 1996]• CE [Shindyalov and Bourne, 1998]• SSM [Krissinel and Henrik, 2004]• …
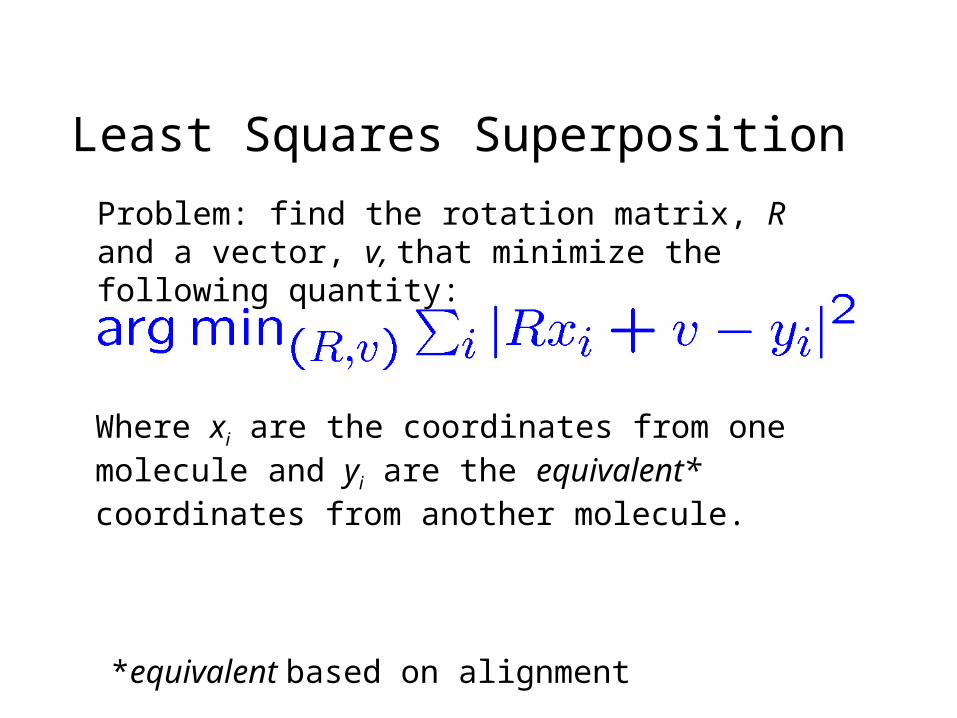
Least Squares Superposition
Problem: find the rotation matrix, R and a vector, v, that minimize the following quantity:
Where xi are the coordinates from one molecule and yi are the equivalent* coordinates from another molecule.
*equivalent based on alignment

Two Subproblems• Find correspondence set
• Find alignment transform(protein superposition problem)
• Chicken-and-egg
DALI (Distance ALIgnment)
• DALI has been used to do an ALL vs. ALL comparison of proteins in the PDB, and to create a hierarchical clustering of families.
• http://www.ebi.ac.uk/dali/
• FSSP = fold classification based on structure-structure alignment of proteins
• http://ekhidna.biocenter.helsinki.fi/dali/start

VAST (Vector Alignment Search Tool)
• It places great emphasis on the definition of the threshold of significant structural similarity. By focusing on similarities that are surprising in the statistical sense, one does not waste time examining many similarities of small substructures that occur by chance in protein structure comparison. Very many of the remaining similarities are examples of remote homology, often undetectable by sequence comparison. As such they may provide a broader view of the structure, function and evolution of a protein family.
• At the heart of VAST's significance calculation is definition of the "unit" of tertiary structure similarity as pairs of secondary structure elements (SSE's) that have similar type, relative orientation, and connectivity. In comparing two protein domains the most surprising substructure similarity is that where the sum of superposition scores across these "units" is greatest. The likelihood that this similarity would be seen by chance is then given as a simple product: the probability that one would obtain this score in drawing so many "units" at random, times the number of alternative SSE-pair combinations possible in the domain comparison, from which one has chosen the best.
• http://www.ncbi.nlm.nih.gov/Structure/RESEARCH/iucrabs.html#Ref_6