introduction to meteorology philip bedient civil and environmental eng rice university
TRANSCRIPT
Introduction to METEOROLOGY
Philip BedientCivil and Environmental Eng
Rice University

Severe Storms
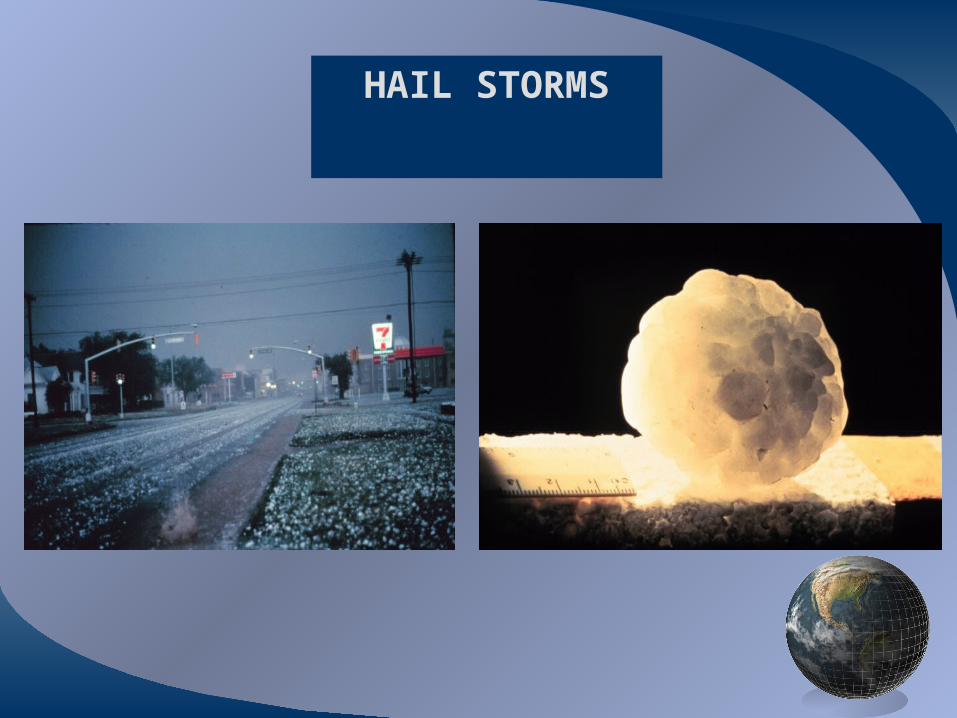
HAIL STORMS
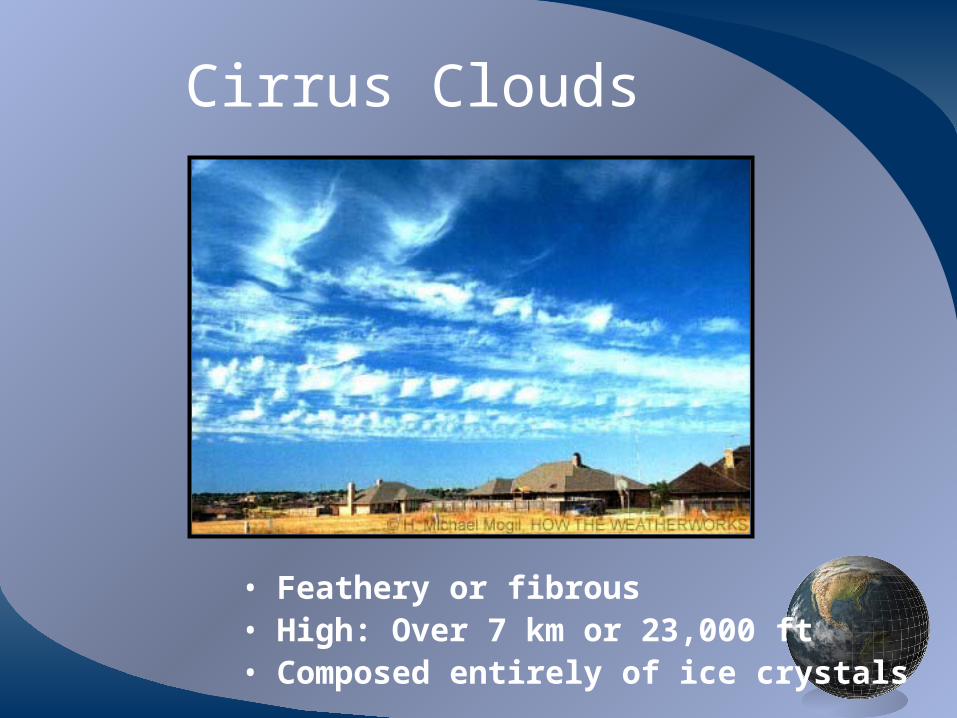
Cirrus Clouds
• Feathery or fibrous• High: Over 7 km or 23,000 ft• Composed entirely of ice crystals
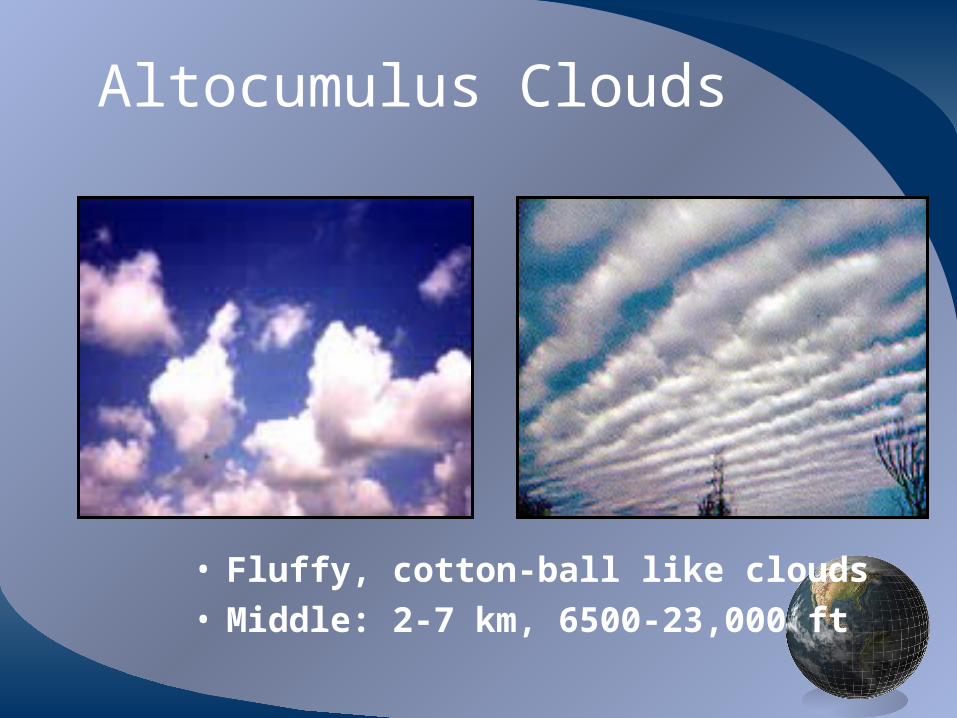
Altocumulus Clouds
• Fluffy, cotton-ball like clouds• Middle: 2-7 km, 6500-23,000 ft
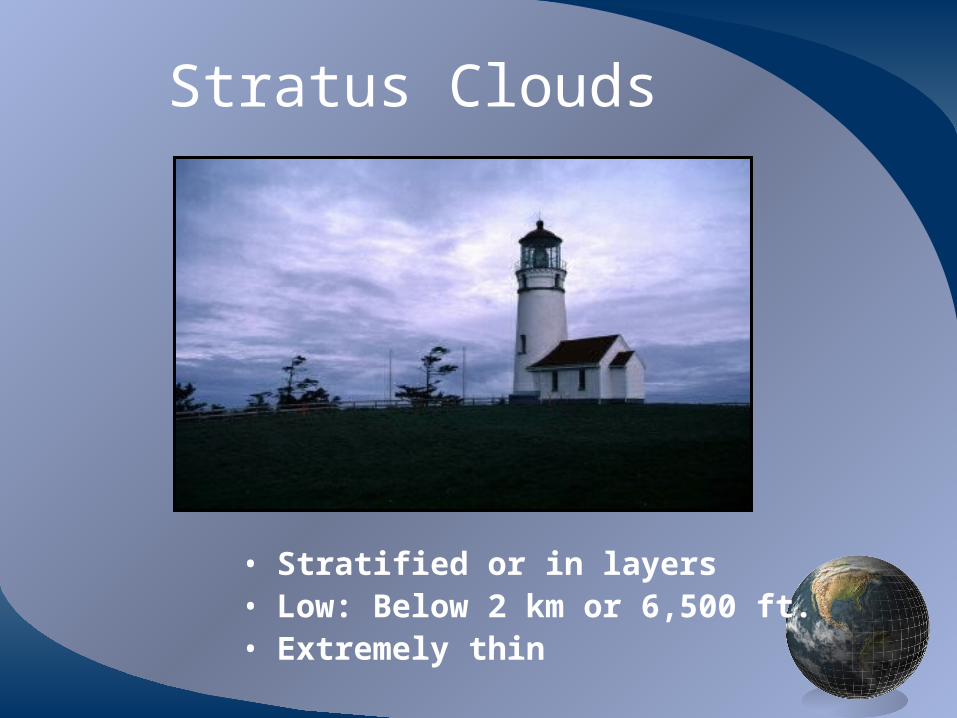
Stratus Clouds
• Stratified or in layers• Low: Below 2 km or 6,500 ft.• Extremely thin
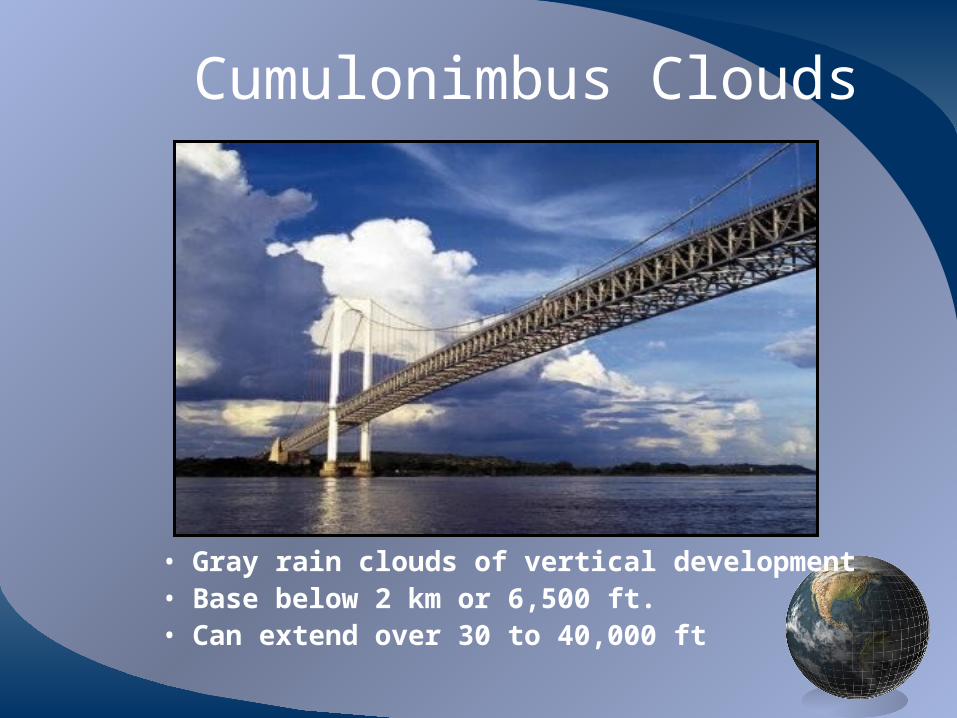
Cumulonimbus Clouds
• Gray rain clouds of vertical development• Base below 2 km or 6,500 ft.• Can extend over 30 to 40,000 ft
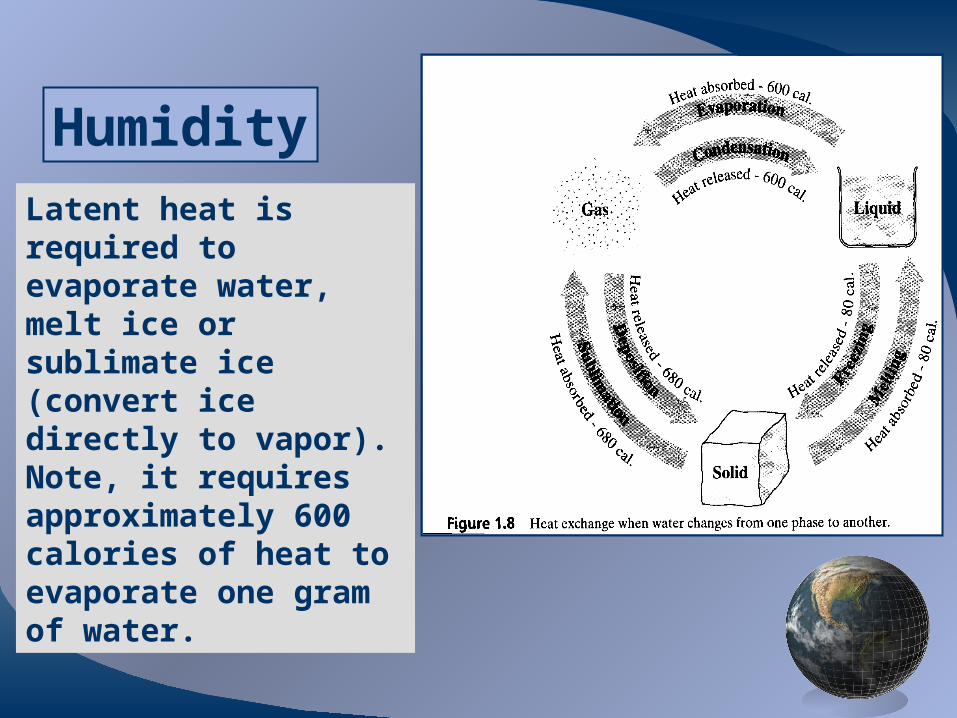
Latent heat is required to evaporate water, melt ice or sublimate ice (convert ice directly to vapor). Note, it requires approximately 600 calories of heat to evaporate one gram of water.
Humidity
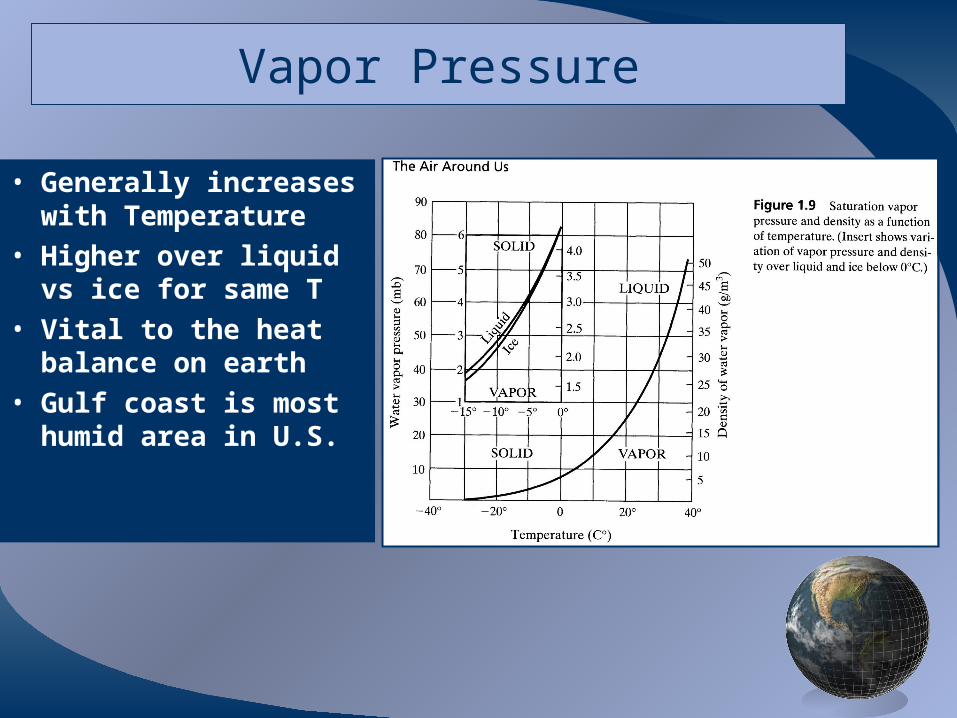
Vapor Pressure
• Generally increases with Temperature
• Higher over liquid vs ice for same T
• Vital to the heat balance on earth
• Gulf coast is most humid area in U.S.

Temperature Distribution in the Vertical
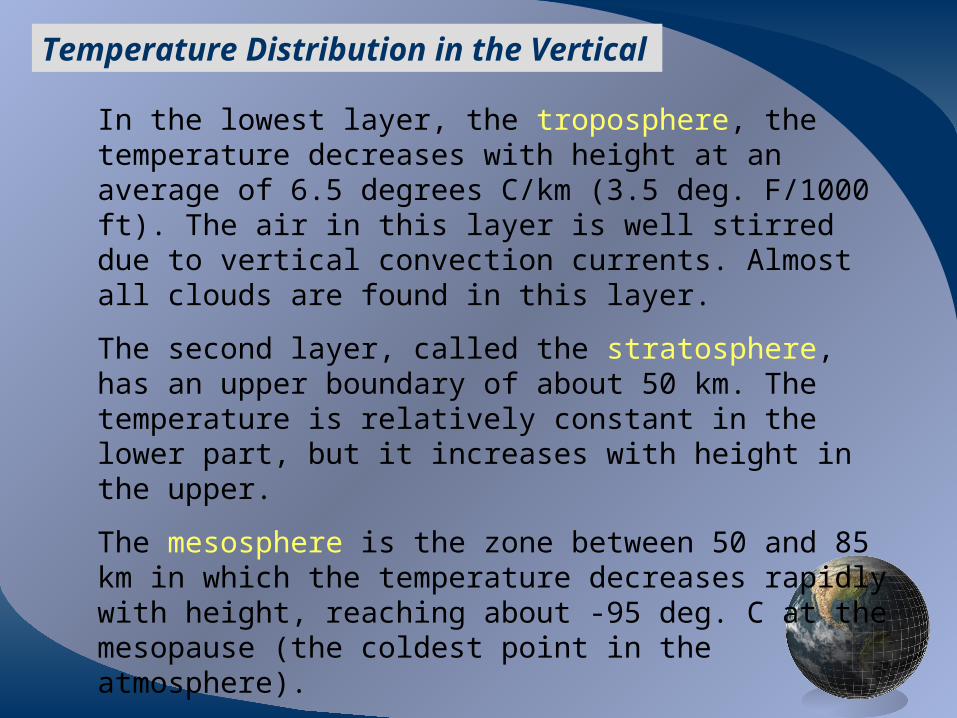
In the lowest layer, the troposphere, the temperature decreases with height at an average of 6.5 degrees C/km (3.5 deg. F/1000 ft). The air in this layer is well stirred due to vertical convection currents. Almost all clouds are found in this layer.
The second layer, called the stratosphere, has an upper boundary of about 50 km. The temperature is relatively constant in the lower part, but it increases with height in the upper.
The mesosphere is the zone between 50 and 85 km in which the temperature decreases rapidly with height, reaching about -95 deg. C at the mesopause (the coldest point in the atmosphere).
In the thermosphere the temperature increases with height.
SOLAR ENERGY
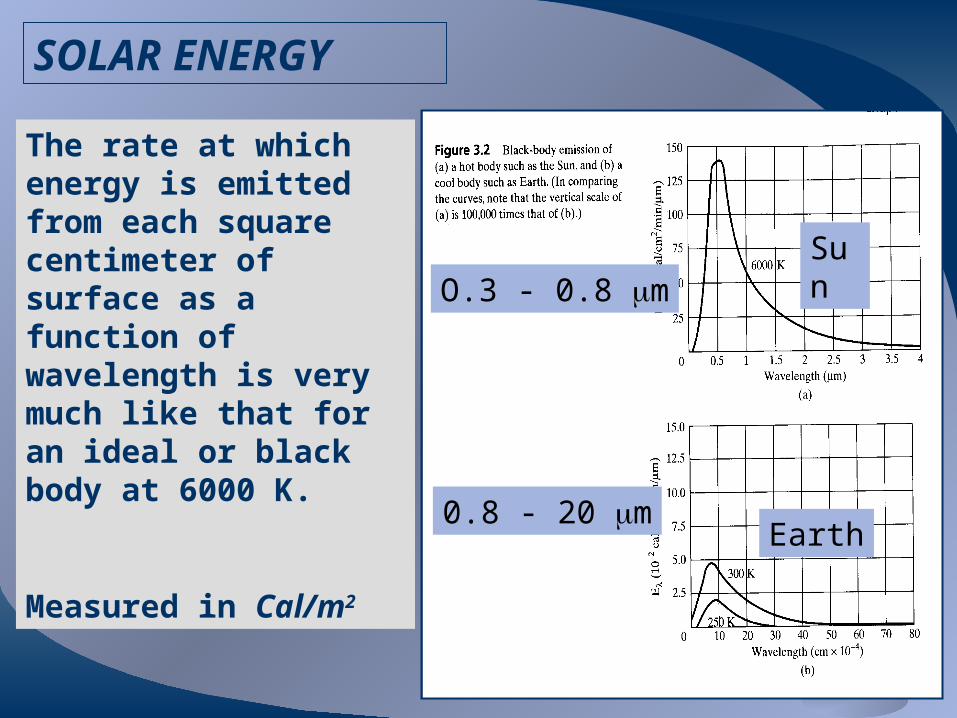
The rate at which energy is emitted from each square centimeter of surface as a function of wavelength is very much like that for an ideal or black body at 6000 K.
Measured in Cal/m2
O.3 - 0.8 m
0.8 - 20 m
Sun
Earth
Absorption of Radiation
UV Infrared
Ozone Hole
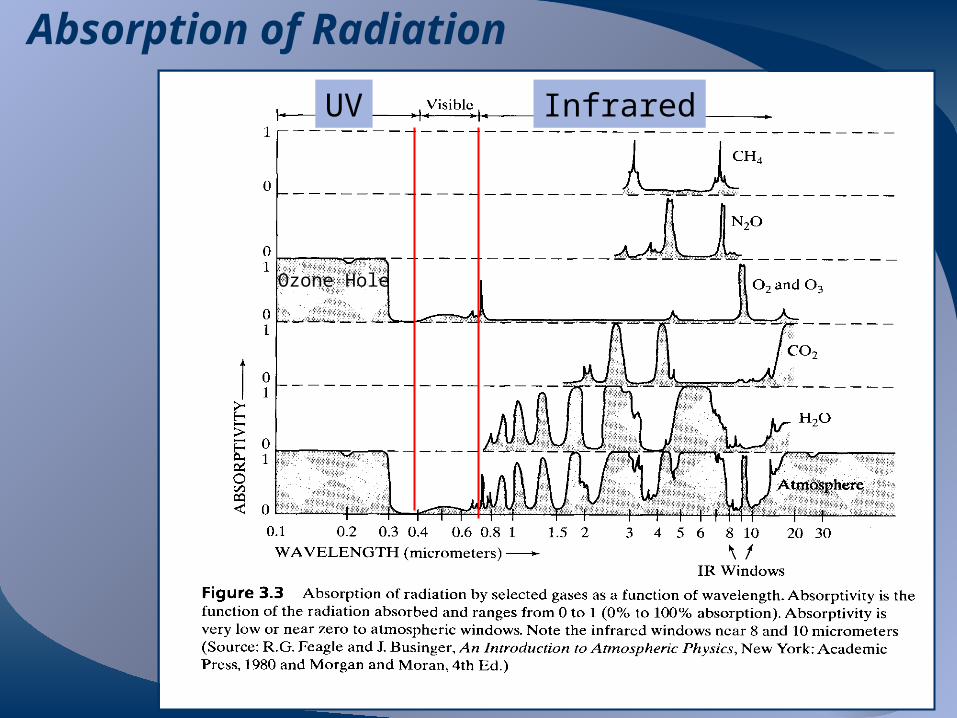
The clear atmosphere is essentially transparent between 0.3 and 0.8 um, where most of the solar (short wave) radiation occurs.
Between 0.8 and 20 um, where much of the terrestrial (long wave) radiation is emitted, there are several bands of moderate absorptivity by water vapor, carbon dioxide, and other trace gases.
SOLAR ENERGY IN THE ATMOSPHERE
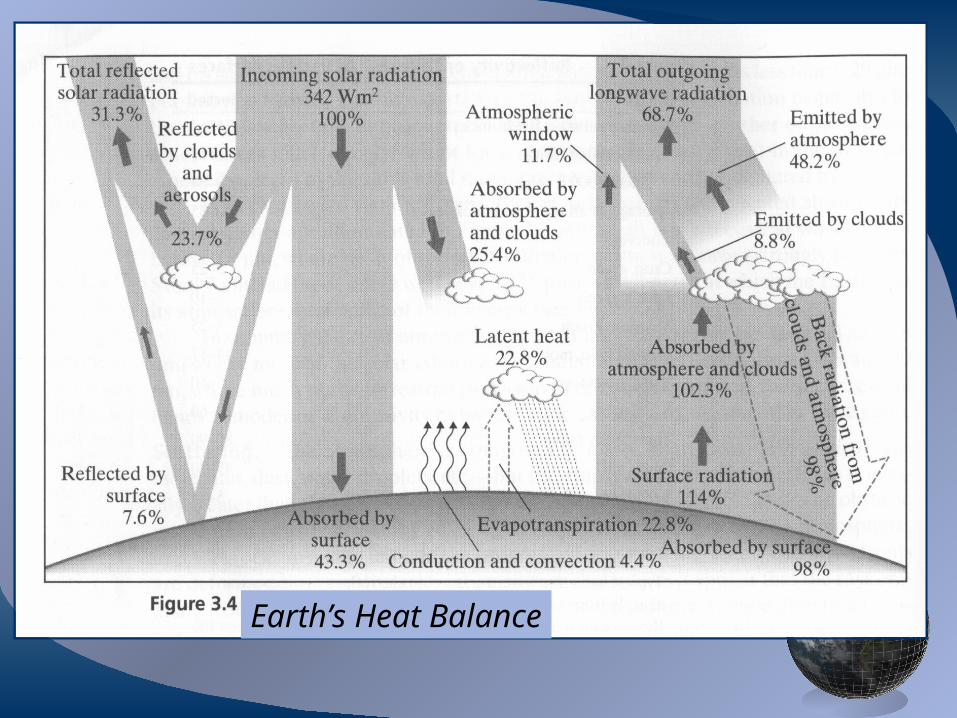
Earth’s Heat Balance
Figure 3.4 shows what happens to the earths energy. 69% is lost by the earth and its atmosphere to space. Although there is a heat balance for the planet as a whole, all parts of the earth and its atmosphere are not in radiative balance.
It is the imbalance between incoming and outgoing energy over the earth that leads to the creation of wind systems and ocean currents that act to alleviate the surpluses and deficits of heat.
THE EARTH’S HEAT BALANCE
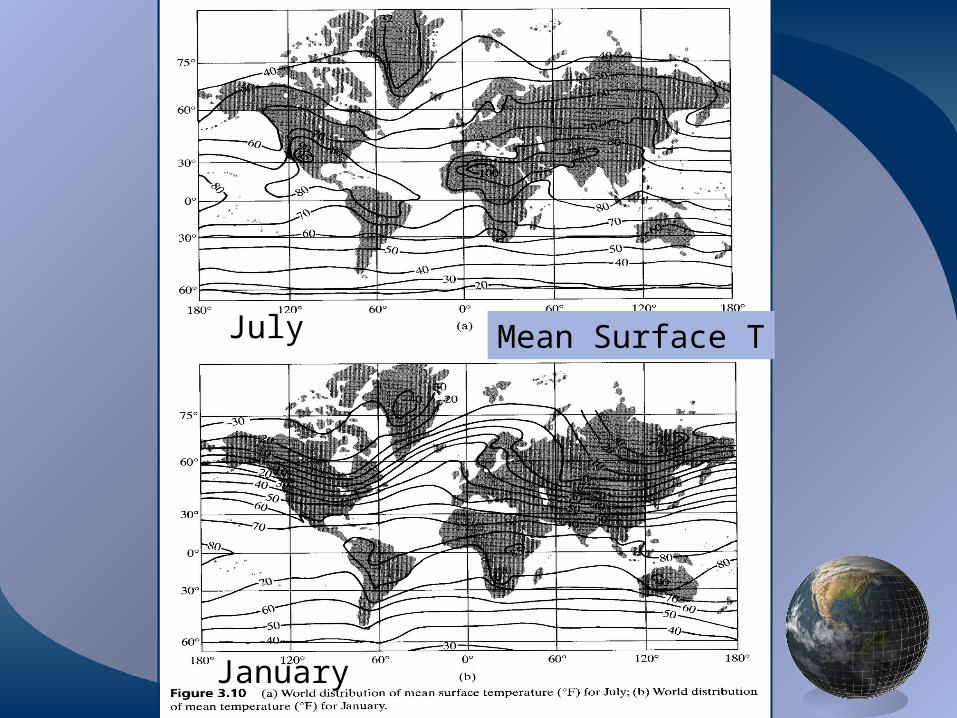
July
January
Mean Surface T
Seasonal Variation of the Earth’s Energy
The fact that the oceans act as heat reservoirs is illustrated by the January and July mean air temperature maps seen in the previous figure.
There is a greater variation in the temperature between seasons in middle and high latitudes over the continents than over the ocean.
Also note how the isotherms dip equatorward over the oceans in summer and poleward in the winter, indicating that the ocean is cooler than the land in summer and warmer than the land in winter.
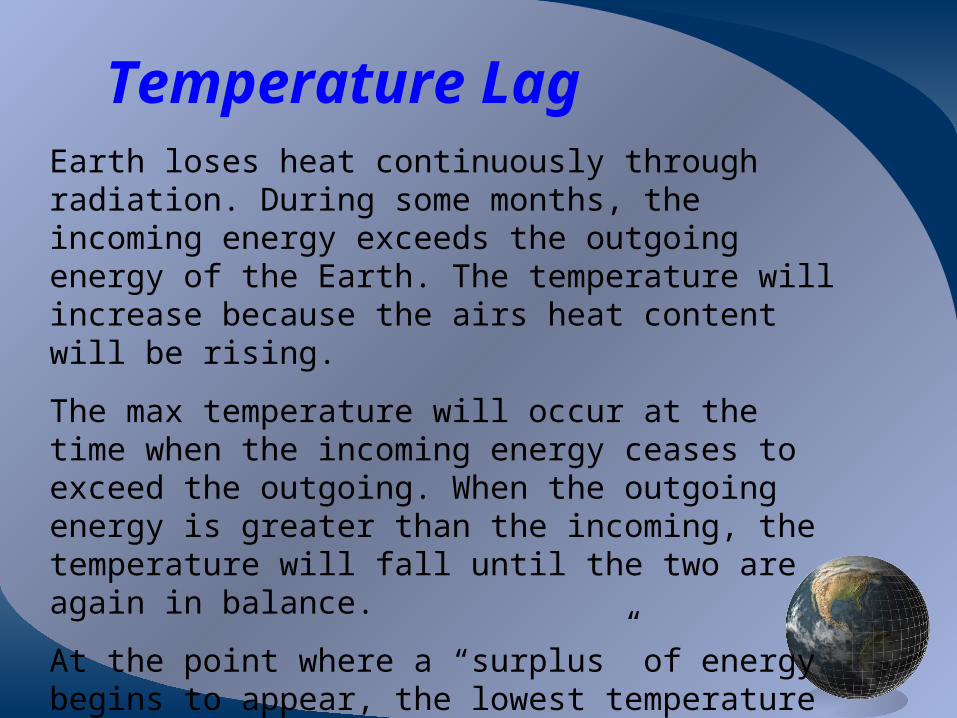
Temperature LagEarth loses heat continuously through radiation. During some months, the incoming energy exceeds the outgoing energy of the Earth. The temperature will increase because the airs heat content will be rising.
The max temperature will occur at the time when the incoming energy ceases to exceed the outgoing. When the outgoing energy is greater than the incoming, the temperature will fall until the two are again in balance.
At the point where a “surplus” of energy begins to appear, the lowest temperature will have occurred.
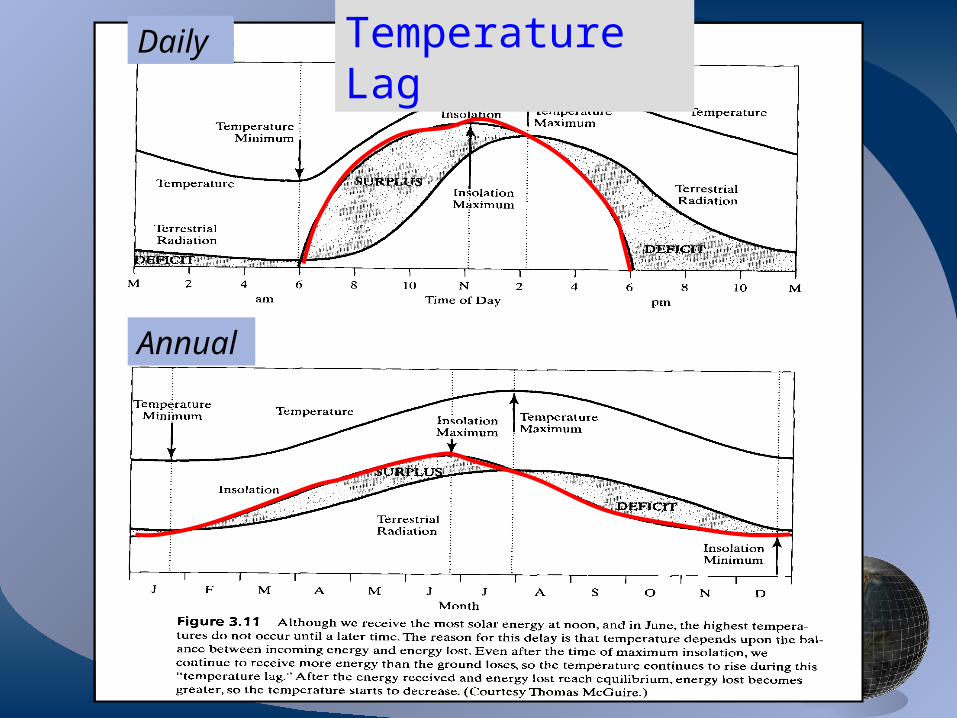
Temperature LagDaily
Annual
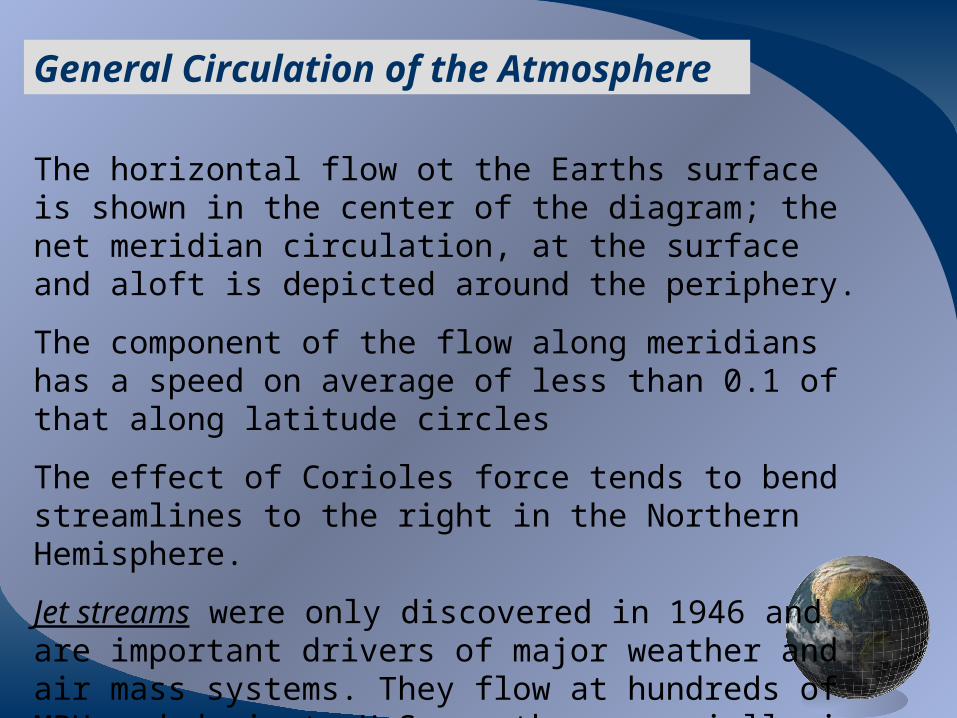
General Circulation of the Atmosphere
The horizontal flow ot the Earths surface is shown in the center of the diagram; the net meridian circulation, at the surface and aloft is depicted around the periphery.
The component of the flow along meridians has a speed on average of less than 0.1 of that along latitude circles
The effect of Corioles force tends to bend streamlines to the right in the Northern Hemisphere.
Jet streams were only discovered in 1946 and are important drivers of major weather and air mass systems. They flow at hundreds of MPH and dominate U.S. weather especially in the winter.
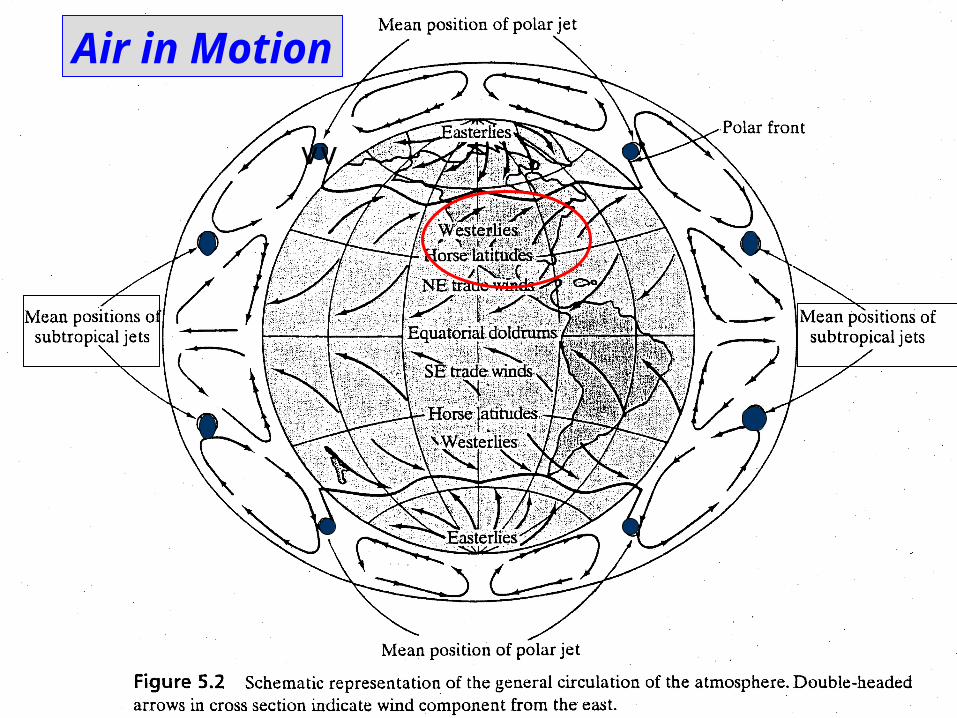
Air in Motion
vv
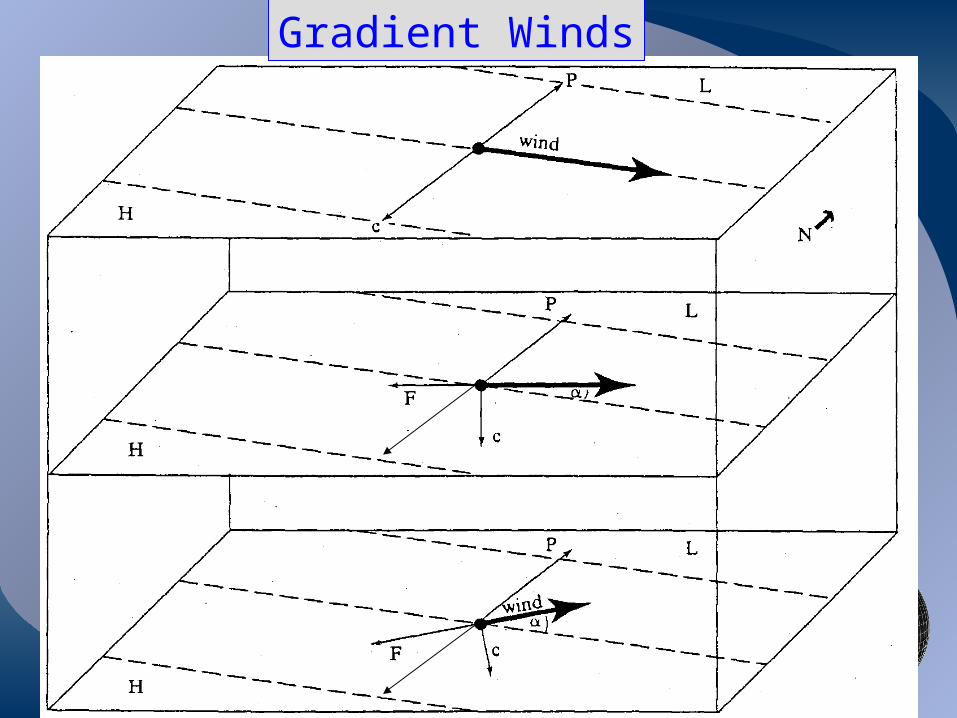
Gradient Winds
Vertical Motion and its Relation to Clouds
An important cause of vertical motion is the divergence and convergence of air currents circulating around the great anticyclones and cyclonic spins of the atmosphere.
Air currents spiraling inward at low levels of cyclones converge, in other words, they move toward the center.
Since the horizontal area occupied by a volume of air must decrease with time, the vertical depth must increase.
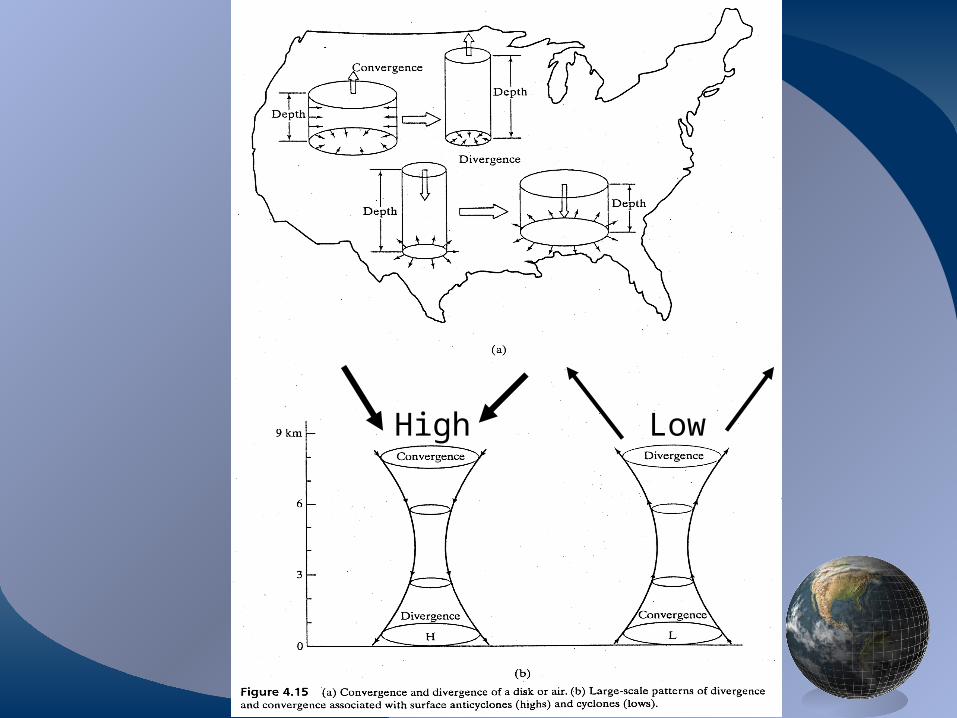
High Low
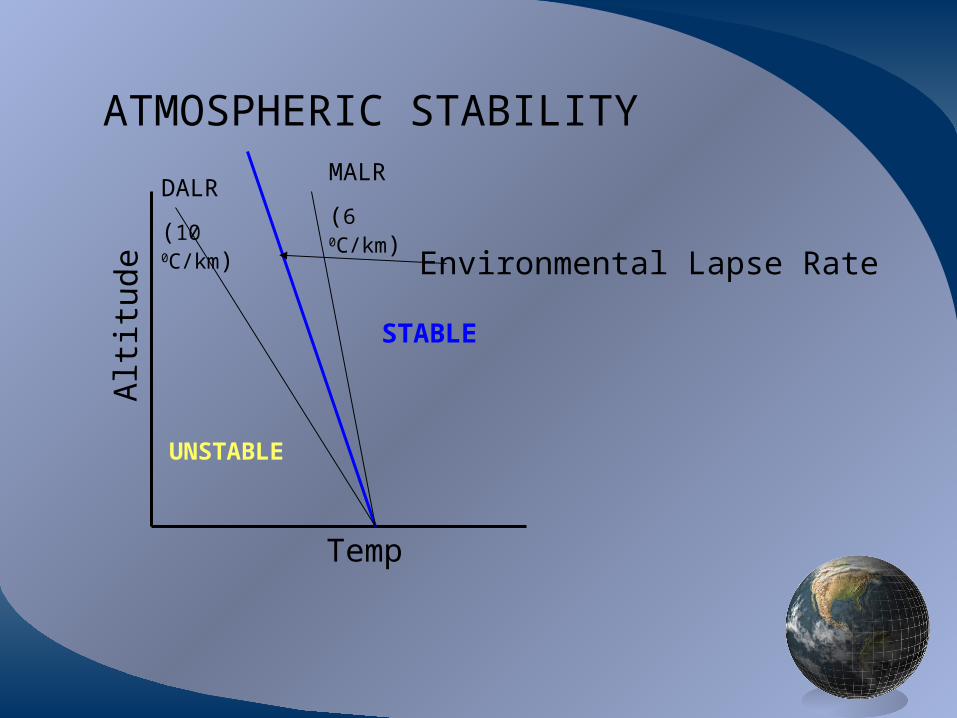
ATMOSPHERIC STABILITY
Temp
Alt
itud
e
DALR
(10 0C/km)
MALR
(6 0C/km)
STABLE
UNSTABLE
Environmental Lapse Rate
Development of a Wave Cyclone in the Northern Hemisphere
The genesis stage of the wave cyclone normally takes between 12 and 24 hours. Subsequent development of the wave, shown in the figures, takes an additional two or three days across the U.S.
As the wave breaks, the cold front begins to overtake the warm front. This process is called occlusion and the resulting boundary is call an occluded front.
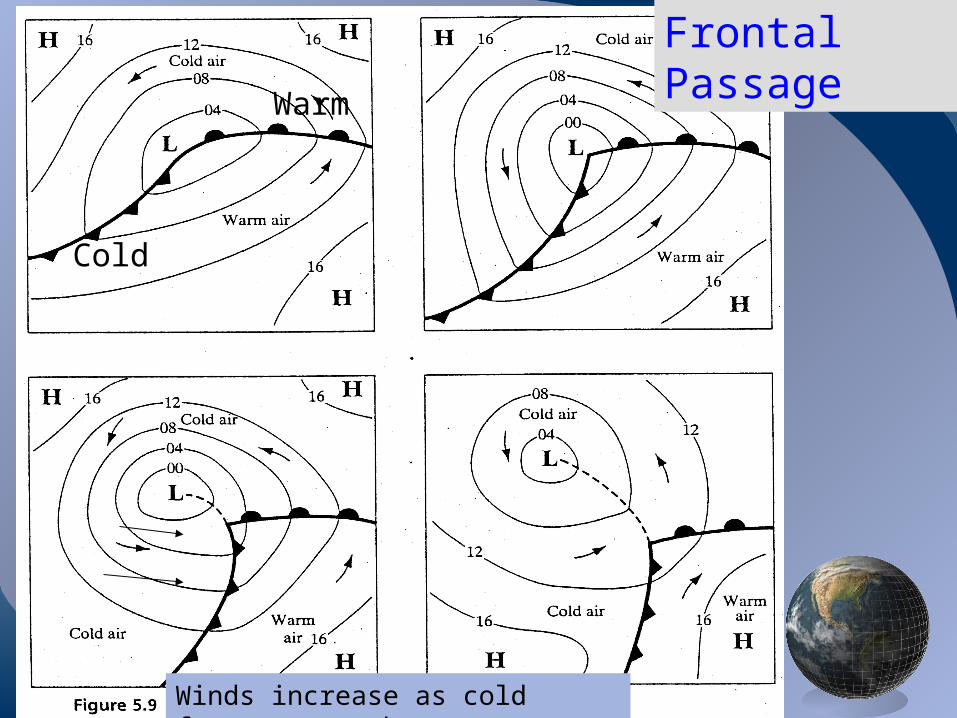
Frontal Passage
Cold
Warm
Winds increase as cold front approaches
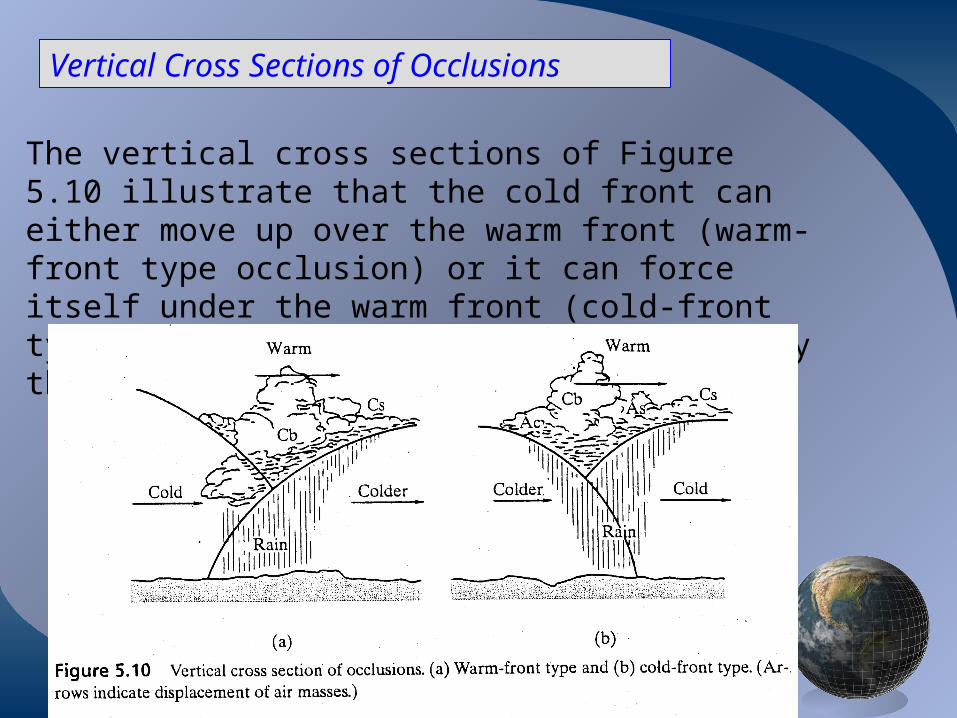
Vertical Cross Sections of Occlusions
The vertical cross sections of Figure 5.10 illustrate that the cold front can either move up over the warm front (warm-front type occlusion) or it can force itself under the warm front (cold-front type). The occluded front is the boundary that separates the two cold air masses.
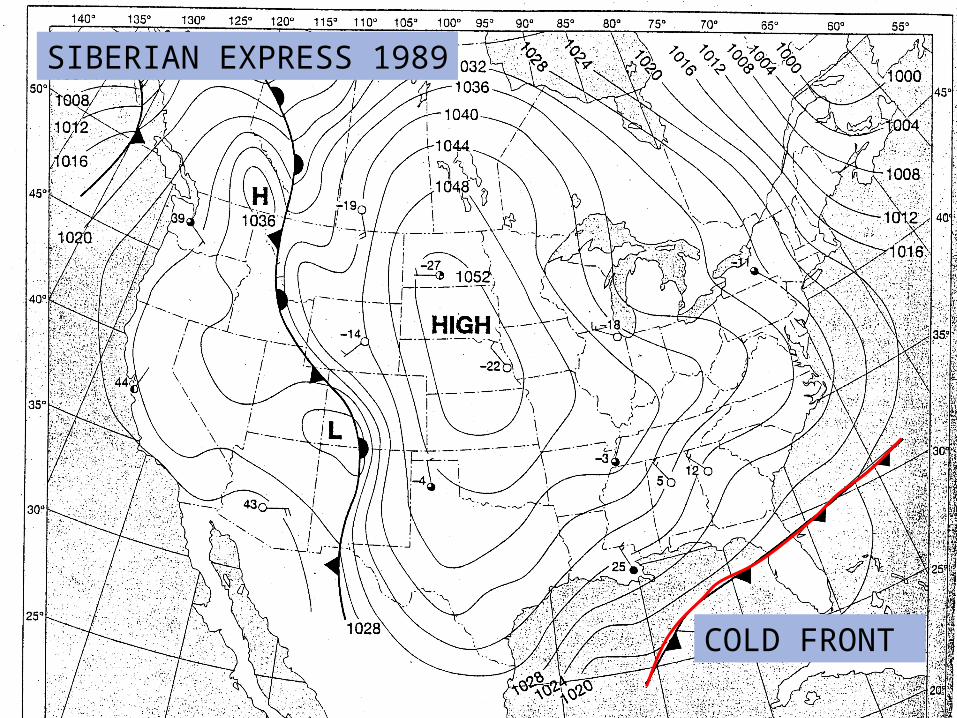
The simplified National Weather Service map shows an intense winter cold wave caused by an outbreak of frigid continental arctic air. This event brought subfreezing temperatures as far south as the Gulf of Mexico. Temperatures on NWS maps are in degrees Fahrenheit.
Houston temperature dropped to 8 degrees F for more than 8 hours and caused massive damage to plumbing systems in 1989.
THE SIBERIAN EXPRESS
COLD FRONT
SIBERIAN EXPRESS 1989
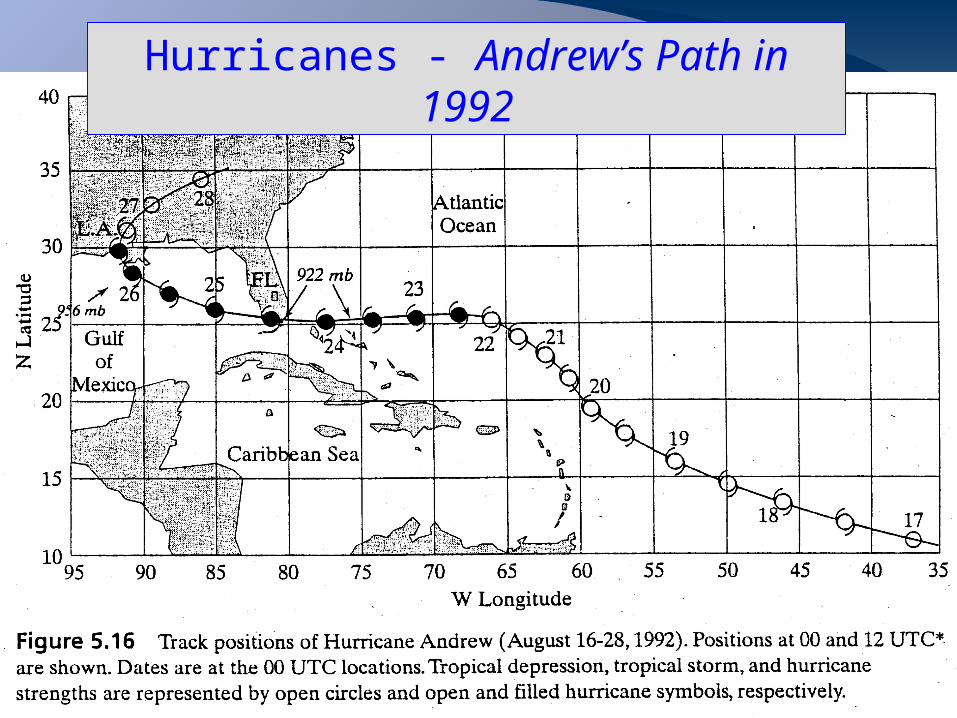
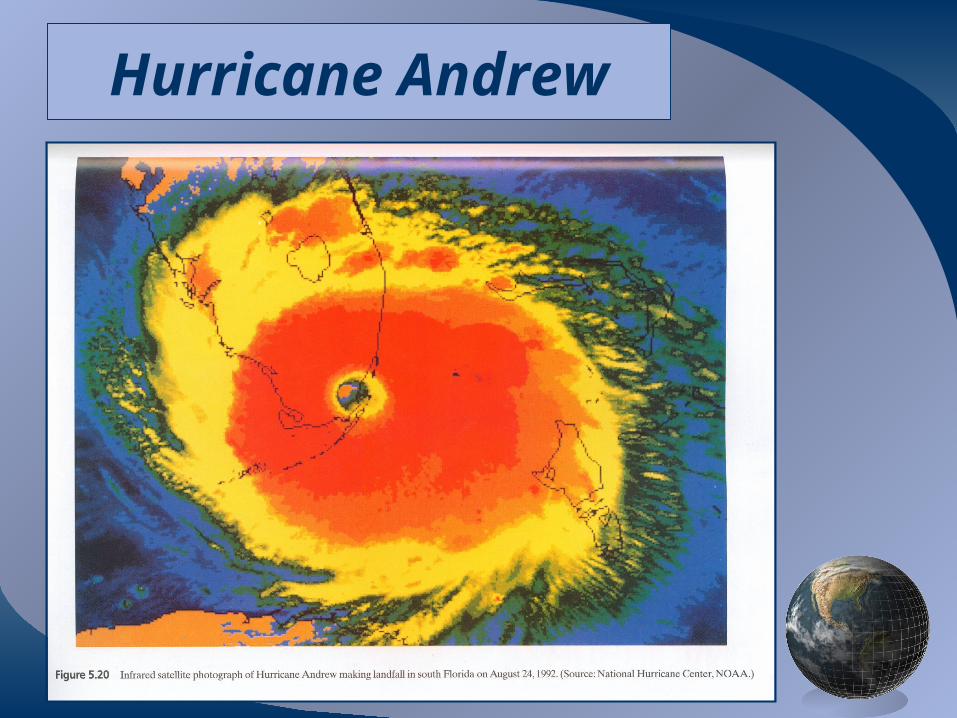
Hurricanes - Andrew’s Path in 1992
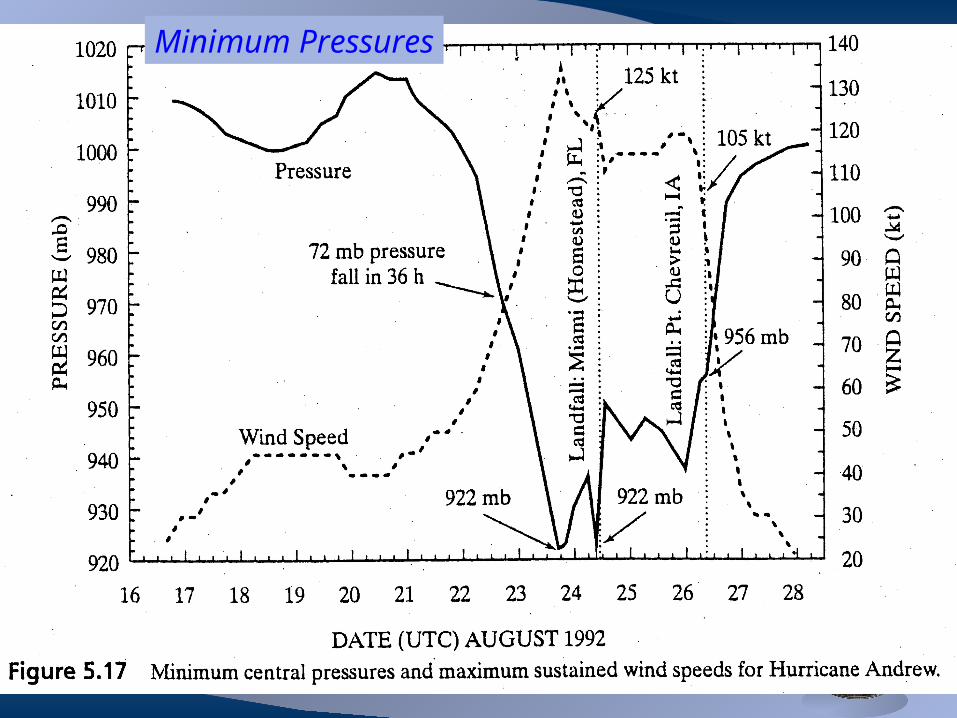
Figure 5.17 shows the variation with time of the minimum pressure and maximum sustained wind speeds for Andrew. Unfortunately, Andrew was close to its greatest intensity when it made landfall on the 24th.
The minimum pressure of 922 mb was the third lowest central pressure this century for a hurricane making landfall in the United States.
The sustained winds of 125 knots created a storm tide along the coast ranging up to nearly 17 feet.
Hurricane Andrew
Minimum Pressures
Hurricane Andrew
Life Cycle of a Typical Cumulonimbus Cell
The initial cumulus stages usually lasts for about 15 minutes. During this period, the cell grows laterally from 2 or 4 km in diameter to 10 or 15 km, and vertically to 8 or 10 km.
The mature stage begins when rain reaches the ground and usually lasts for 15 to 30 minutes. During this stage, the drops and ice crystals in the clouds grow so large that the updrafts can no longer support them, and they begin to fall as large drops or hail.
The mature stage is the most intense part of the thunderstorm.
The final or dissipating stage begins when the downdraft has spread over the entire cell. With the updraft cut off, the rate of precipitation eventually diminishes and so the downdrafts are also gradually subdued.
Finally, the last flashes of lightning fade and the cloud begins to dissolve, perhaps persisting for a while in a stratified form.
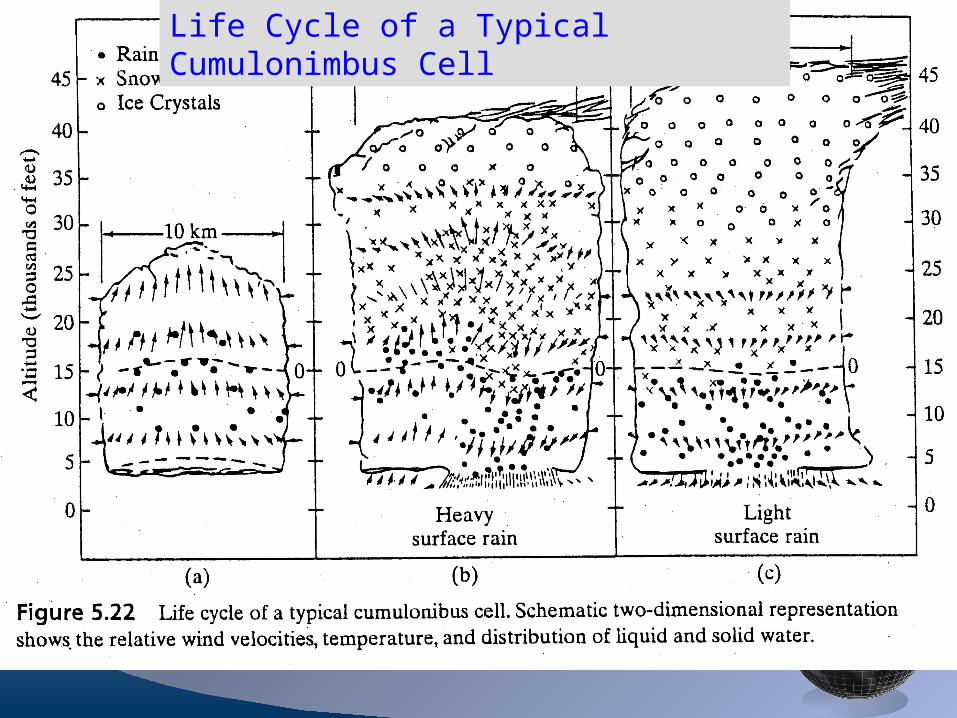
Life Cycle of a Typical Cumulonimbus Cell
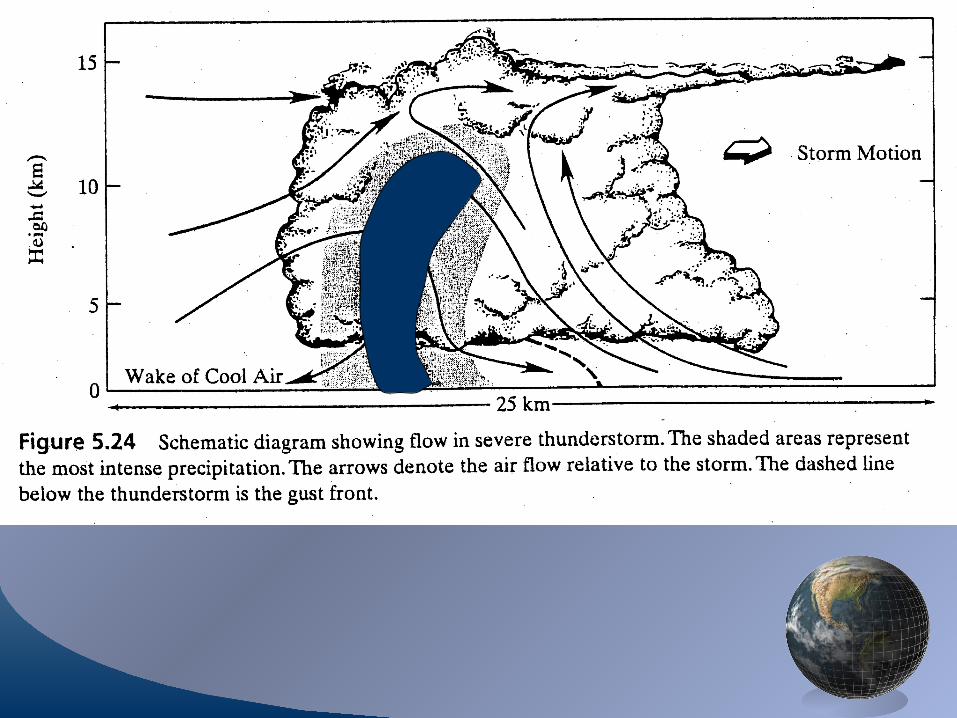
Flow in Severe Thunderstorm
In Figure 5.24 a storm is moving toward the right and is being continually supplied with warm, moist, low-level air at its leading edge. In the updraft fed by this inflow, condensation produces rain below the freezing level and ice at higher levels. To the rear of the storm, dry middle-level air is incorporated into the storm. As evaporation of rain cools this air, it becomes negatively buoyant and sinks. When the resulting downdraft reaches the ground, it spread out and forms the gust front.
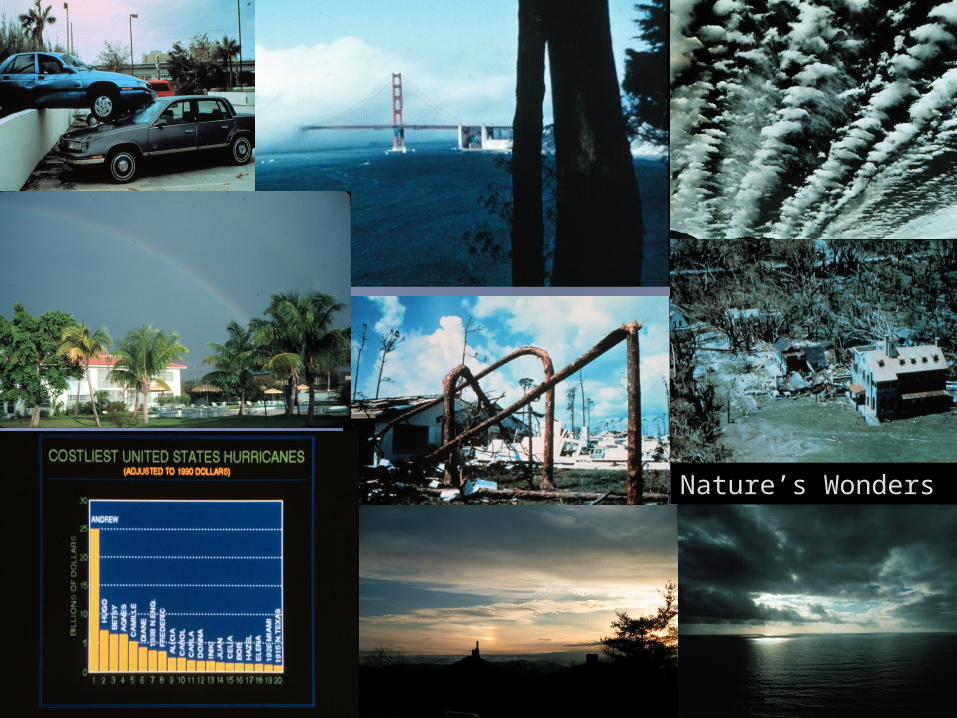
Nature’s Wonders