introduction to incas feedback - curriculum · information for primary principals incas feedback...
TRANSCRIPT

Information for Primary Principals
InCAS Feedback
Introduction to InCAS FeedbackAs each InCAS assessment is completed, it is automatically stored in the school’s server until teachers are ready to upload it to the InCAS + website for marking and analysis. (The instructions for this procedure are on the laminated card Transferring and Uploading: Using InCAS 6a in the previous section of this folder).
The InCAS + website produces a wide variety of different types of tables and charts that show each pupil’s profile in detail.
Feedback is also available at class, year group and school level giving an overview of results. This is useful from a management perspective for comparing groups of pupils and monitoring standards over time.
The following tables provide results as age equivalent scores:
• StandardFeedbackTables.• ScoresTables.• DifferenceTables.
The following charts present the same information but in a more visual way:
• ScoresCharts.• LongitudeCharts.• AgeComparisonCharts.
Age-standardised scores are also available for Reading, General Maths, Mental Arithmetic andDevelopedAbility.
Resource Cards: InCAS Feedback
The following laminated cards are designed to support the continuing professional development of your staff in understanding InCAS assessment data.
Accessing provides step-by-step instructions on how to access the tables and charts.
Understanding illustrates the key features of the tables and charts.


Information for Primary Principals
InCAS Feedback
Accessing Standard Feedback
This gives you access to age equivalent scores for all the pupils in your school who have been assessed.
These tables will download separated by Year Group and then by Class. Children in each class will listed in alphabetic order.
To summarise, the steps are:
1. Log-ontotheInCASwebsitewww.incasproject.org2. Click InCAS+ Login.3. Enter your unique User Name and Password and click Submit.4. Click Results/Analysis.5. Click Feedback Form.6. Choose the version (year) that you require from the drop down menu. 7. Click Standard Feedback.
Once downloaded the tables can be saved or printed.
Accessing: 1a

Information for Primary Principals
InCAS Feedback
Accessing Custom Feedback for a Pupil
This gives you access to information for individual pupils.
To summarise, the steps are:
1. Log-ontotheInCASwebsitewww.incasproject.org2. Click InCAS+ Login.3. Enter your unique User Name and Password and click Submit.4. Click Results/Analysis.5. Click Feedback Form.6. Click Custom Feedback.7. Choose Pupil from the Level drop down menu.8. Click Go.9. Choose the version (year) that you require from the Version drop down menu.10. Click Go.11. Choose a class from the Class drop down menu.12. Click Go.13. Choose a pupil from the Pupil drop down menu.
You can now choose a Pupil Scores Chart, a Pupil Longitude Chart or a Pupil Scores Table.
Once downloaded the tables and charts can be saved or printed.
Accessing: 1b

Information for Primary Principals
InCAS Feedback
Accessing Custom Feedback for a Class
This gives you access to information for a class.
To summarise, the steps are:
1. Log-ontotheInCASwebsitewww.incasproject.org2. Click InCAS+ Login.3. Enter your unique User Name and Password and click Submit.4. Click Results/Analysis.5. Click Feedback Form.6. Click Custom Feedback.7. Choose Class from the Level drop down menu.8. Click Go.9. Choose the version (year) that you require from the Version drop down menu,10. Click Go.11. Choose a class from the Class drop down menu.12. Click Go.13. Choose an assessment from the Assessment drop down menu,
You can now choose a Class Scores Chart, a Class Longitude Chart, Class Scores Table or a Class Difference Table.
Once downloaded the tables can be saved or printed.
Accessing: 2a

Information for Primary Principals
InCAS Feedback
Accessing Custom Feedback for a Year Group
This gives you access to information for individual pupils.
To summarise, the steps are:
1. Log-ontotheInCASwebsitewww.incasproject.org2. Click InCAS+ Login.3. Enter your unique User Name and Password and click Submit.4. Click Results/Analysis.5. Click Feedback Form.6. Click Custom Feedback.7. Choose Yeargroup from the Level drop down menu.8. Click Go.9. Choose the version (year) that you require from the Yeargroup drop down menu.10. Click Go.11. Choose a class from the Class drop down menu.12. Click Go.13. Choose a pupil from the Assessment drop down menu.
You can now choose a Yeargroup Scores Chart, a Yeargroup Longitude Chart or a Yeargroup Difference Table.
Once downloaded the tables and charts can be saved or printed.
Accessing: 2b

Information for Primary Principals
InCAS Feedback
Accessing Custom Feedback for a School
This gives you access to information for a class.
To summarise, the steps are:
1. Log-ontotheInCASwebsitewww.incasproject.org2. Click InCAS+ Login.3. Enter your unique User Name and Password and click Submit.4. Click Results/Analysis.5. Click Feedback Form.6. Click Custom Feedback.7. Choose Class from the Level drop down menu.8. Click Go.9. Choose the version (year) that you require from the Version drop down menu,10. Click Go.11. Choose an assessment from the Assessment drop down menu,
You can now choose a School Scores Chart, a School Longitude Chart, School Scores Table or a School Difference Table.
Once downloaded the tables can be saved or printed.
Accessing: 3a
Information for Primary Principals
InCAS Feedback
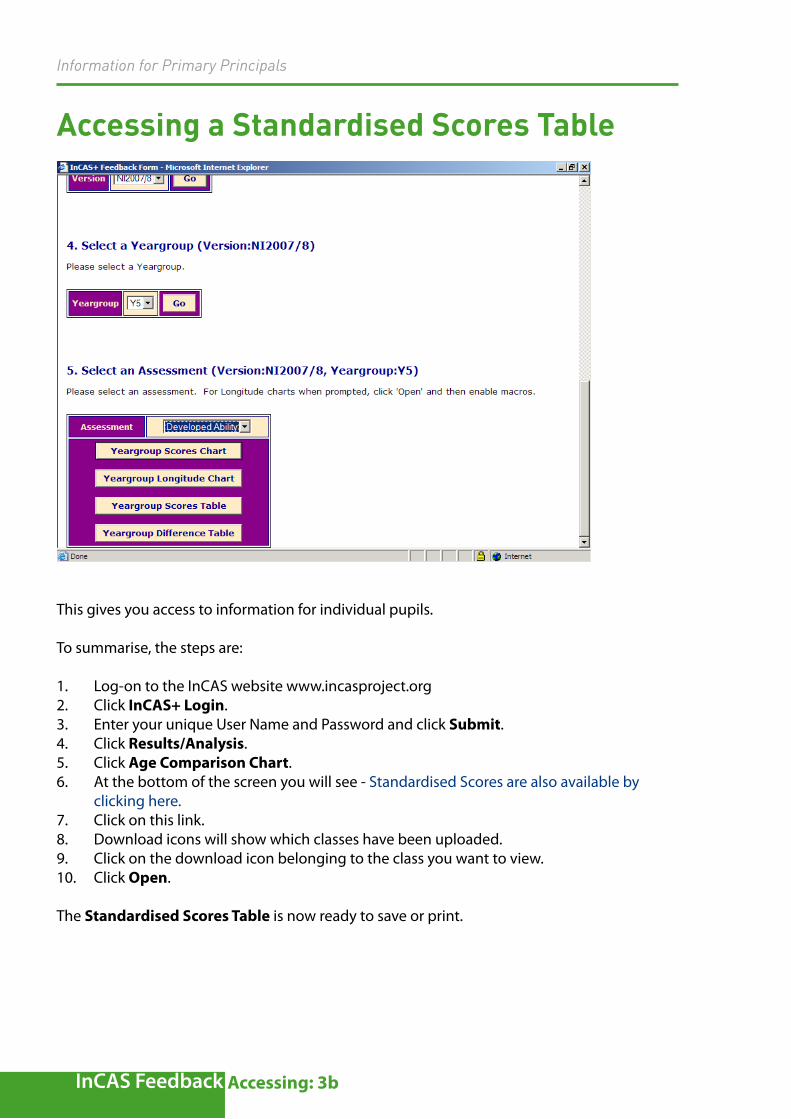
Accessing a Standardised Scores Table
This gives you access to information for individual pupils.
To summarise, the steps are:
1. Log-ontotheInCASwebsitewww.incasproject.org2. Click InCAS+ Login.3. Enter your unique User Name and Password and click Submit.4. Click Results/Analysis.5. Click Age Comparison Chart.6. At the bottom of the screen you will see - Standardised Scores are also available by clicking here.7. Click on this link.8. Downloadiconswillshowwhichclasseshavebeenuploaded.9. Click on the download icon belonging to the class you want to view.10. Click Open.
The Standardised Scores Table is now ready to save or print.
Accessing: 3b

Information for Primary Principals
InCAS Feedback
Accessing Age Comparison Charts
To summarise, the steps are:
1. Log-ontotheInCASwebsitewww.incasproject.org2. Click InCAS+ Login.3. Enter your unique User Name and Password and click Submit.4. Click on Results/Analysis.5. Click on Age Comparison Chart.6. When you click on the download icon beside the appropriate version, an Excel file is downloaded to your computer.7. A box will appear on screen asking if you want to save or open an Excel file.8. Click Open.
If a message appears saying that Macros are disabled, click OK.Click Tools, then Macro, Security, Medium and OKRepeat steps 1-8
9. Click in the blue box beside Assessment. A drop down arrow will appear.10. Choose the assessment you want from the drop down menu.11. Click in the blue box beside Cohort. A drop down arrow will appear.12. Choose All Pupils, or the Yeargroup or Class that you require from the drop down menu.
The Age Comparison Chart is now ready to save or print.
Accessing: 4a

Information for Primary Principals
InCAS Feedback

Information for Primary Principals
InCAS Feedback
Standard Feedback TableStandard Feedback Tables are produced for:
• Achievement(MathsGeneralandReading)• MentalArithmetic• DevelopedAbility• ReadingModules(WordRecognition,WordDecoding,ComprehensionandSpelling)• DevelopedAbilityModules(PictureVocabularyandNon-VerbalAbility)• MentalArithmetic(+-x÷)(Addition,Subtraction,MultiplicationandDivision)• Attitudes(AttitudetoMaths,AttitudetoReadingandAttitudetoSchool)
This is a Standard Feedback Table.
4
3
2
1
6
5
1. Pupil’s name2. Age at the time of assessment, which is often referred to as the chronological age3. Age equivalent scores showing the age at which the pupil is performing.4. The minimum age equivalent score for Maths General is 3 years.5. The minimum age equivalent score for Reading is 4 years.6. If a pupil has not completed a particular module or unit, an asterisk will appear in the table.
The maximum age equivalent score for any assessment is 16 years.Attitude scores will be reported on a 5-point scale with 1 being very negative and 5 being very positive
Understanding: 5a

Information for Primary Principals
InCAS Feedback
Scores TablesScores Tables are produced for:
• Achievement(MathsGeneralandReading)• MentalArithmetic• DevelopedAbility• ReadingModules(WordRecognition,WordDecoding,ComprehensionandSpelling)• DevelopedAbilityModules(PictureVocabularyandNon-VerbalAbility)• MentalArithmetic(+-x÷)(Addition,Subtraction,MultiplicationandDivision)• ScoresTablesarealsoavailableforAttitudes.
At the class, year group and school levels, the Scores Tables are the same as the ones given for Standard Feedback.
This is a Pupil Scores Table.
4
32
1
5
1. Pupil’s name2. Age at the time of assessment3. Age equivalent scores showing the age at which the pupil is performing.4. AgeDifferenceshowingthedifferencebetweenthechronologicalageandtheage equivalent score for each pupil.5. When a pupil’s age equivalent score is in line with their chronological age the age difference will appear as 0:0.
When a pupil’s age equivalent score is >16 or <3 yrs for Maths General or <4yrs for Reading, it is not possible to calculate a defi nite age difference. When this happens you will see < or > before the age difference.
6
Understanding: 5b

Information for Primary Principals
InCAS Feedback
Difference TablesDifferenceTablesareproducedfor:
• Achievement(MathsGeneralandReading)• MentalArithmetic• DevelopedAbility• ReadingModules(WordRecognition,WordDecoding,ComprehensionandSpelling)• DevelopedAbilityModules(PictureVocabularyandNon-VerbalAbility)• MentalArithmetic(+-x÷)(Addition,Subtraction,MultiplicationandDivision)
PupilScoresTablesincludeDifferenceScores.Therefore,DifferenceTablesarenotproducedatpupil level.
ThisisaDifferenceTable.
4
32
1
5
1. Pupil’s name2. Age at the time of assessment3. AgeDifferenceshowingthedifferencebetweenthechronologicalageandtheage equivalent score for each pupil.4. When a pupil’s age equivalent score is in line with their chronological age the age difference will appear as 0:0.5. When a pupil’s age equivalent score is >16 or <3 yrs for Maths General or <4yrs for Reading, it is not possible to calculate a defi nite age difference. When this happens you will see < or > before the age difference.
Understanding: 6a
Information for Primary Principals
InCAS Feedback
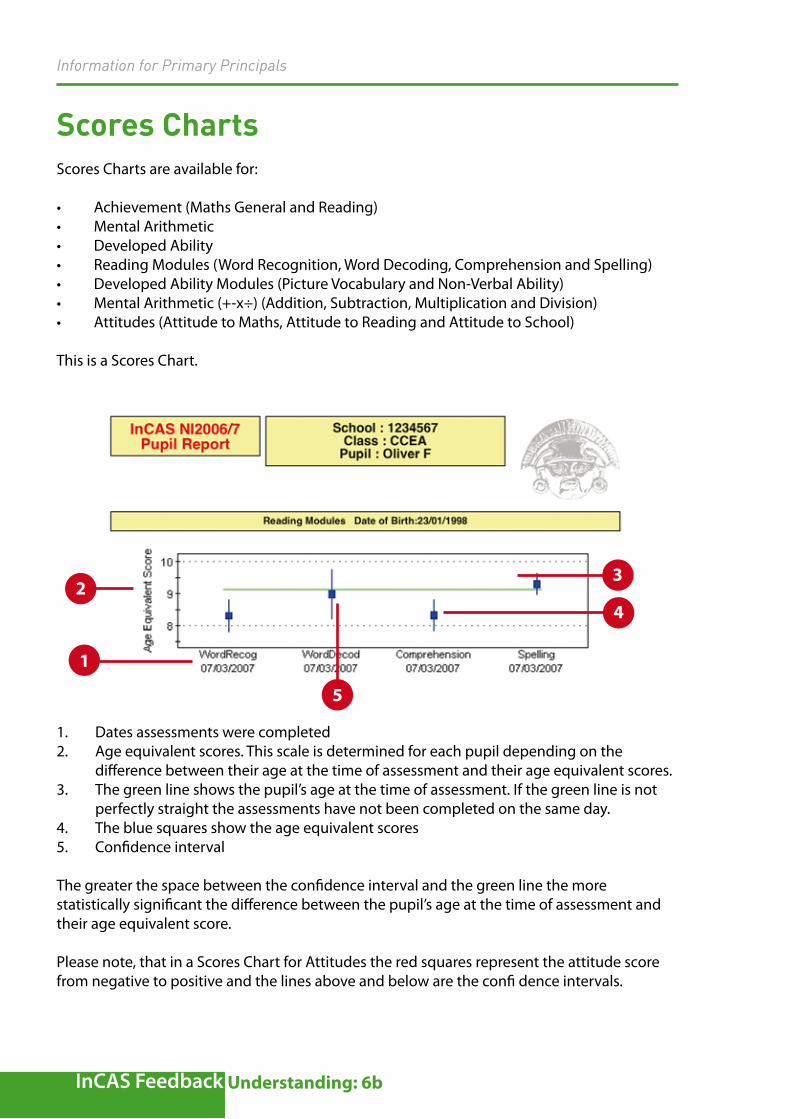
Scores ChartsScores Charts are available for:
• Achievement(MathsGeneralandReading)• MentalArithmetic• DevelopedAbility• ReadingModules(WordRecognition,WordDecoding,ComprehensionandSpelling)• DevelopedAbilityModules(PictureVocabularyandNon-VerbalAbility)• MentalArithmetic(+-x÷)(Addition,Subtraction,MultiplicationandDivision)• Attitudes(AttitudetoMaths,AttitudetoReadingandAttitudetoSchool)
This is a Scores Chart.
4
3
5
2
1
1. Datesassessmentswerecompleted2. Age equivalent scores. This scale is determined for each pupil depending on the difference between their age at the time of assessment and their age equivalent scores.3. The green line shows the pupil’s age at the time of assessment. If the green line is not perfectly straight the assessments have not been completed on the same day.4. The blue squares show the age equivalent scores5. Confidence interval
The greater the space between the confidence interval and the green line the more statistically significant the difference between the pupil’s age at the time of assessment andtheir age equivalent score.
Please note, that in a Scores Chart for Attitudes the red squares represent the attitude score from negative to positive and the lines above and below are the confi dence intervals.
Understanding: 6b

Information for Primary Principals
InCAS Feedback
Longitude ChartsLongitudeChartsareavailablefor:
• MathsGeneral• Reading• DevelopedAbility• MentalArithmetic
ThisisaLongitudeChart.
1. Age at time of assessment2. Age equivalent score3. Age equivalent score4. Confidence interval5. Age equivalent score mapped against the age at the time of assessment. The position of the green line will vary depending on the difference between the pupil’s age at time of assessment and age equivalent score
N.B. Sometimes if the difference is so large that it is outside the range of the scale, the green line does not appear on the chart.
7 7.5 8 8.5 9 9.5 10 10.5
Age
Ag
e E
qu
ival
ent
Sco
re
11
10
9
8
7
6
5
Understanding: 7a
Information for Primary Principals
InCAS Feedback
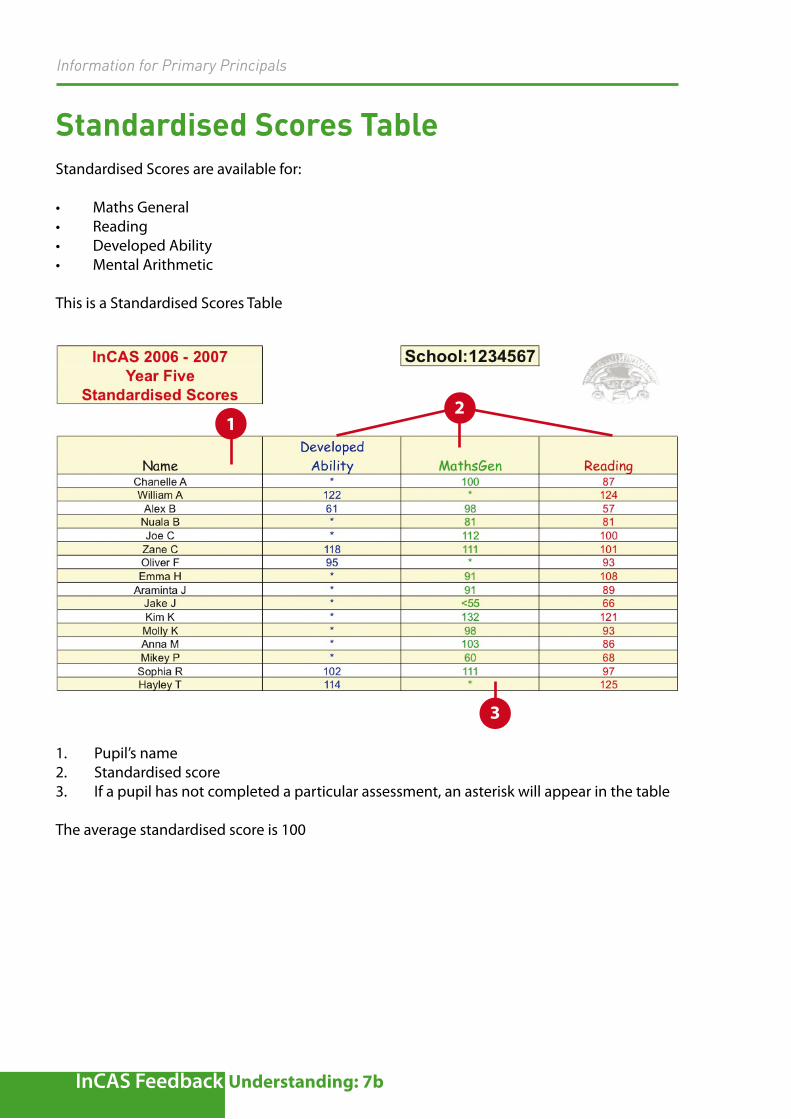
1. Pupil’s name2. Standardised score3. If a pupil has not completed a particular assessment, an asterisk will appear in the table
The average standardised score is 100
Standardised Scores TableStandardised Scores are available for:
• MathsGeneral• Reading• DevelopedAbility• MentalArithmetic
This is a Standardised Scores Table
3
12
Understanding: 7b

Information for Primary Principals
InCAS Feedback
Age Comparison ChartsAge Comparison Charts are available for:
• Allunitsandmodules,excludingAttitudes• Achievement(MathsGeneralandReading)
PupilScoresTablesincludeDifferenceScores.Therefore,DifferenceTablesarenotproducedatpupil level.
This is an Age Comparison Chart.
7
2
5
1. Age equivalent score mapped against the age at time of assessment2. The scores of the middle half of the pupils shown will lie within the box3. This line shows the middle score for the pupils shown4. The width of the box shows the range of ages for the middle half of the pupils shown5. Thepointwherethewhiskersjointheboxindicatesthemiddleageofthepupilsshown6. The closer the pupil is to the vertical axis the younger he is7. The red horizontal lines on the age comparison charts represent the upper and lower limits of the range of scores that InCAS can provide.
You will see these red lines if the pupils shown have extremely high or low age equivalent scores
6
4 3
1
Understanding: 8a
