introduction to improvement methodology - corra foundation · what i aim to cover today •why we...
TRANSCRIPT
Project Funding – Introduction to Improvement Methodology
Julie Wild
Improvement Advisor
National Partners, Scottish Government
What I aim to cover today
• Why we use ‘improvement methodology’
• What is the model for improvement
• The three questions of the model in more detail
• The QI Toolkit
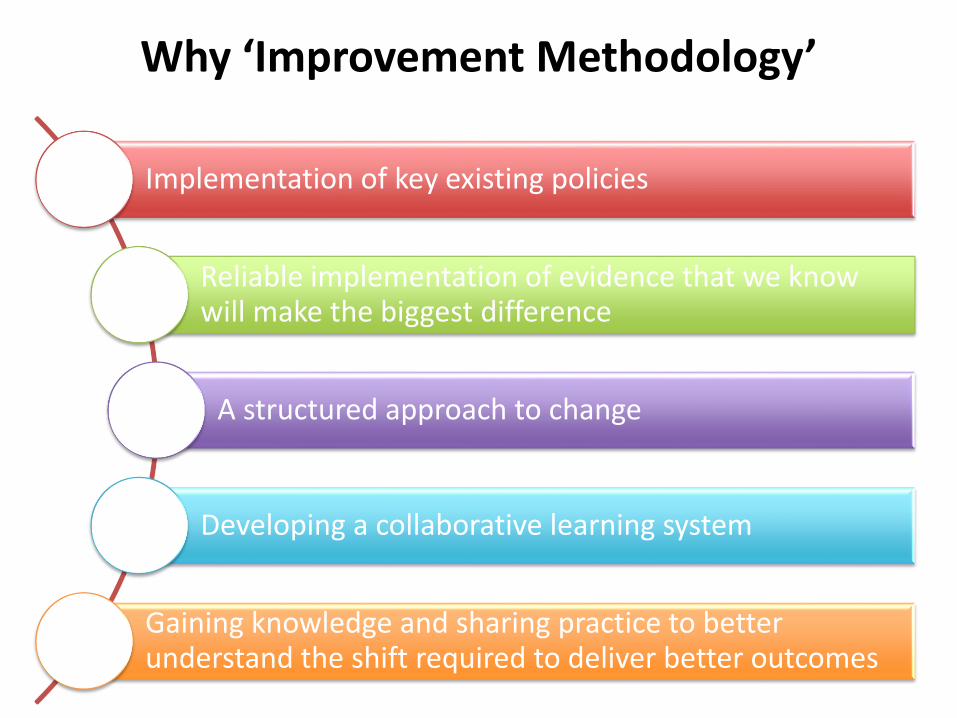
Why ‘Improvement Methodology’
Implementation of key existing policies
Reliable implementation of evidence that we know will make the biggest difference
A structured approach to change
Developing a collaborative learning system
Gaining knowledge and sharing practice to better understand the shift required to deliver better outcomes

A Collective Vision for Children & Young People
Scotland: the best place in the world to grow up
….where every child has the best start in life and is ready to succeed
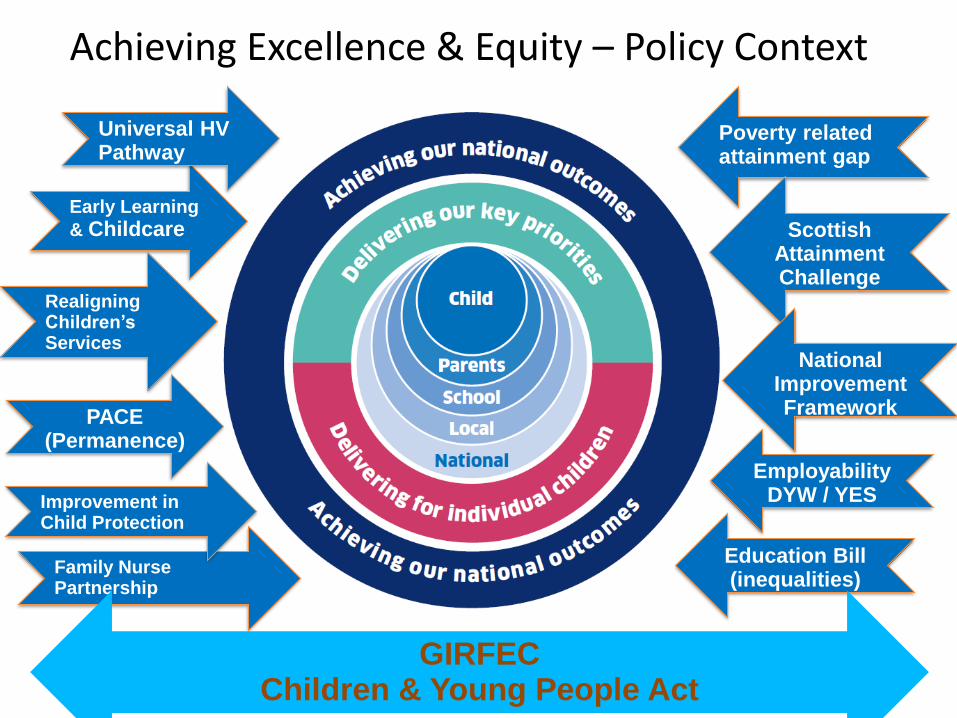
Achieving Excellence & Equity – Policy Context
Early Learning
& Childcare
Family Nurse Partnership
PACE(Permanence)
Poverty related attainment gap
Scottish Attainment Challenge
National ImprovementFramework
Employability DYW / YES
Education Bill(inequalities)
Improvement in Child Protection
Realigning Children’s Services
GIRFECChildren & Young People Act
Universal HVPathway
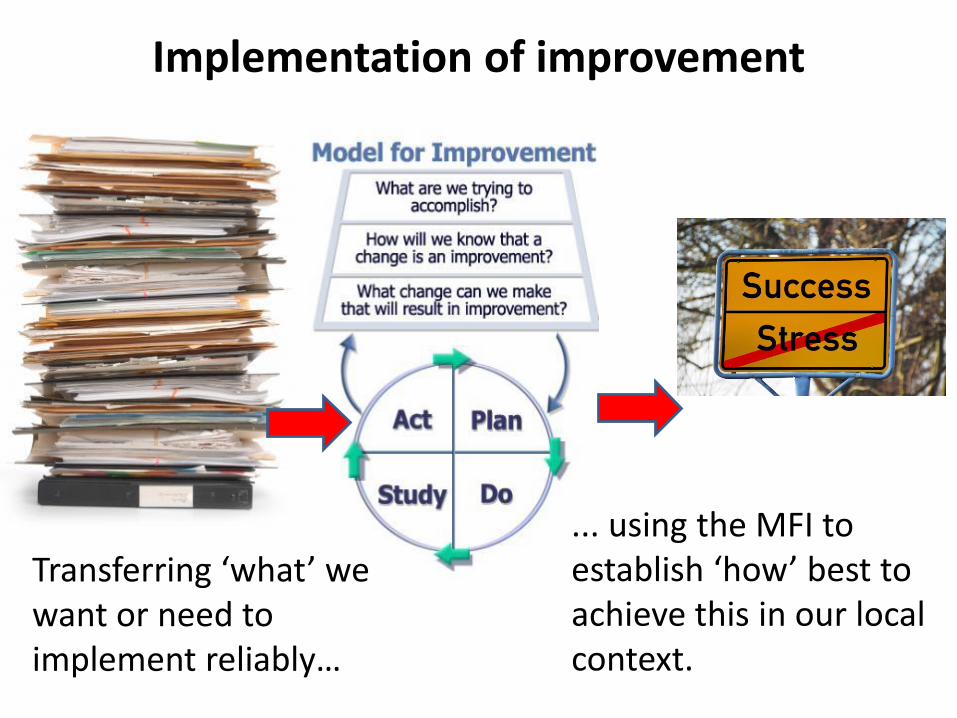
Transferring ‘what’ we want or need to implement reliably…
... using the MFI to establish ‘how’ best to achieve this in our local context.
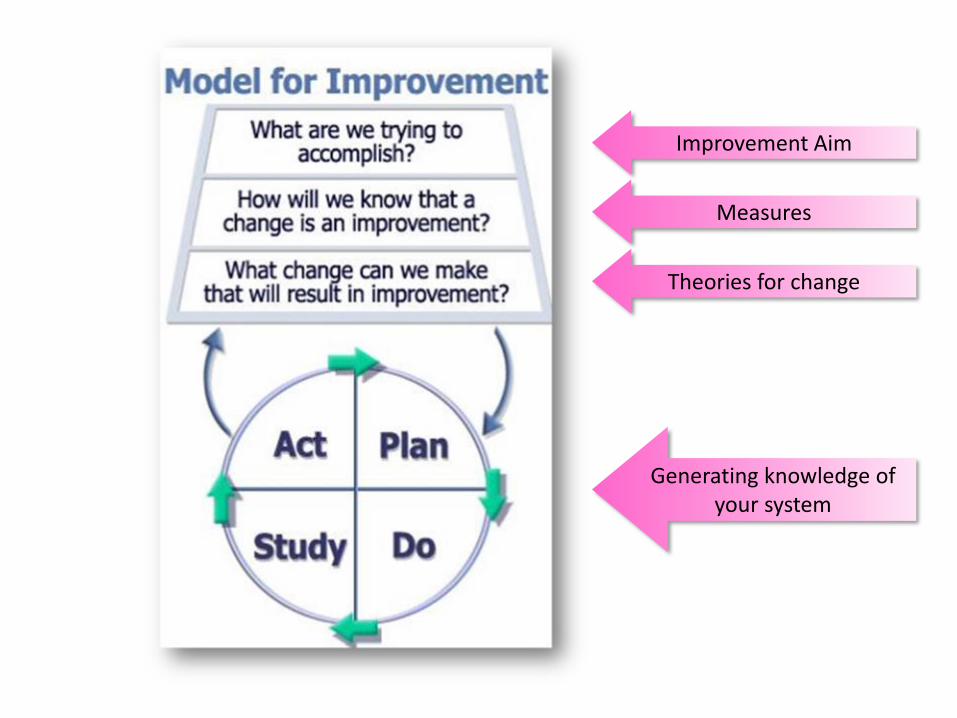
Implementation of improvement
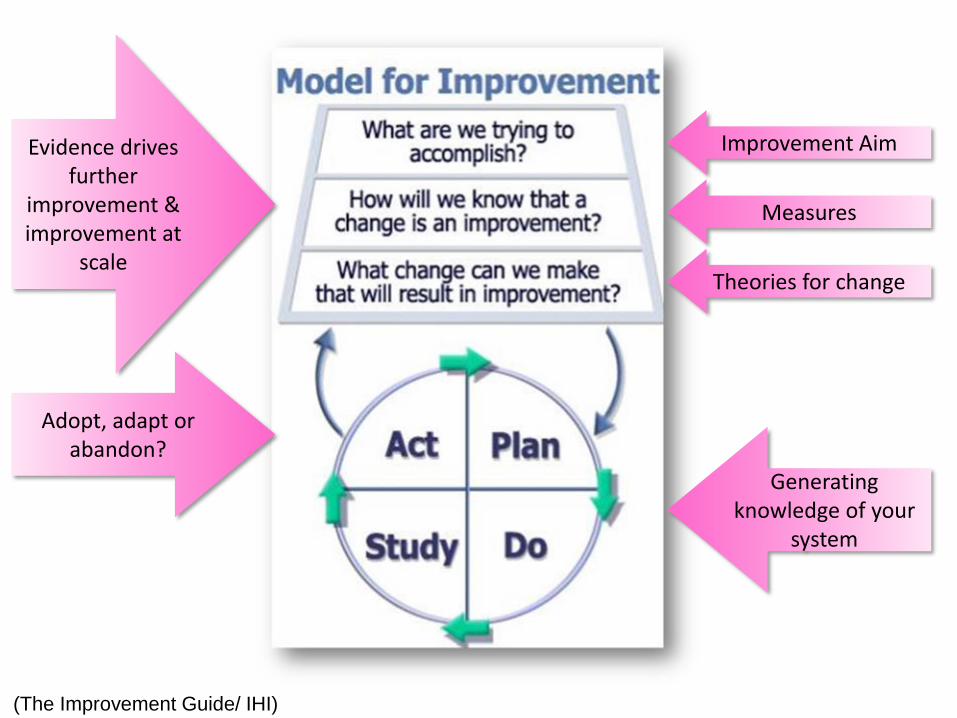
Adopt, adapt or abandon?
Improvement Aim
Generating knowledge of your
system
Measures
Theories for change
Evidence drives further
improvement & improvement at
scale
(The Improvement Guide/ IHI)
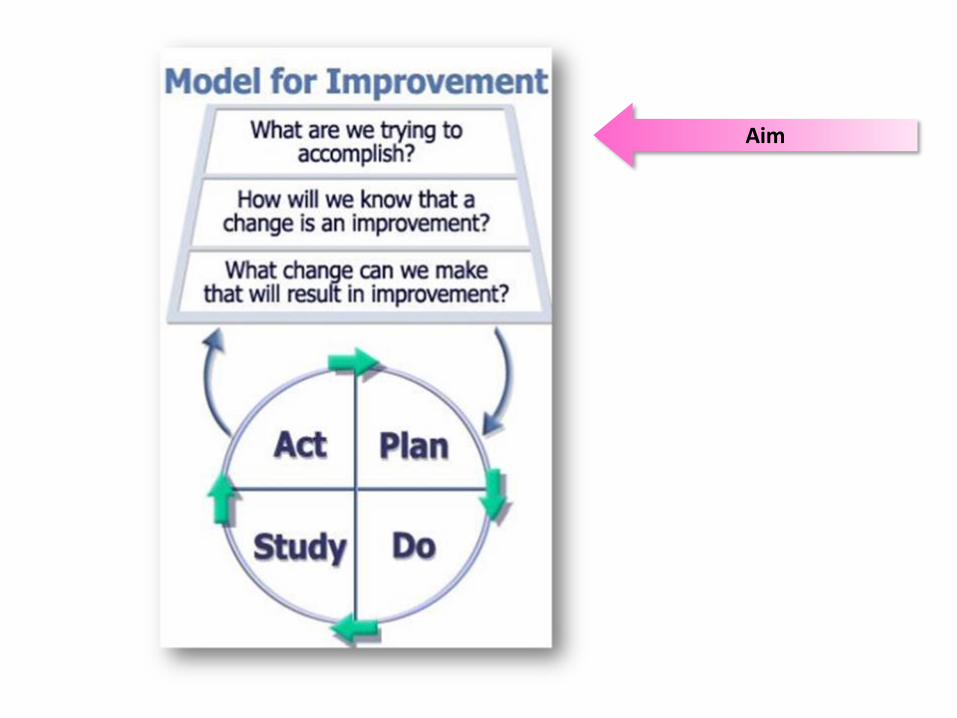
Aim
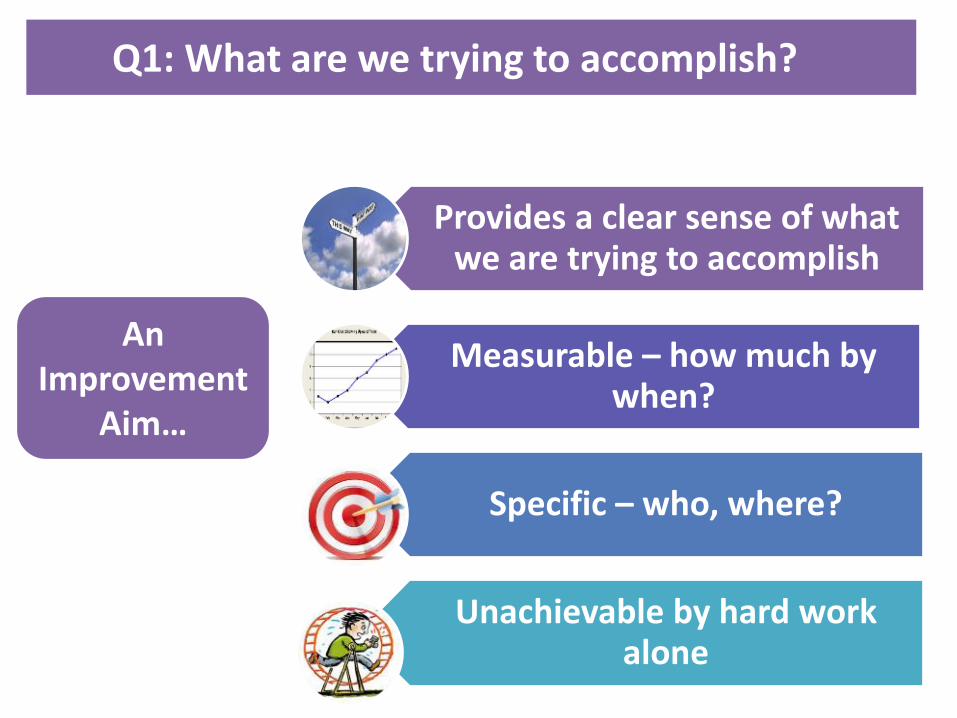
Q1: What are we trying to accomplish?
Provides a clear sense of what we are trying to accomplish
Measurable – how much by when?
Specific – who, where?
Unachievable by hard work alone
An Improvement
Aim…
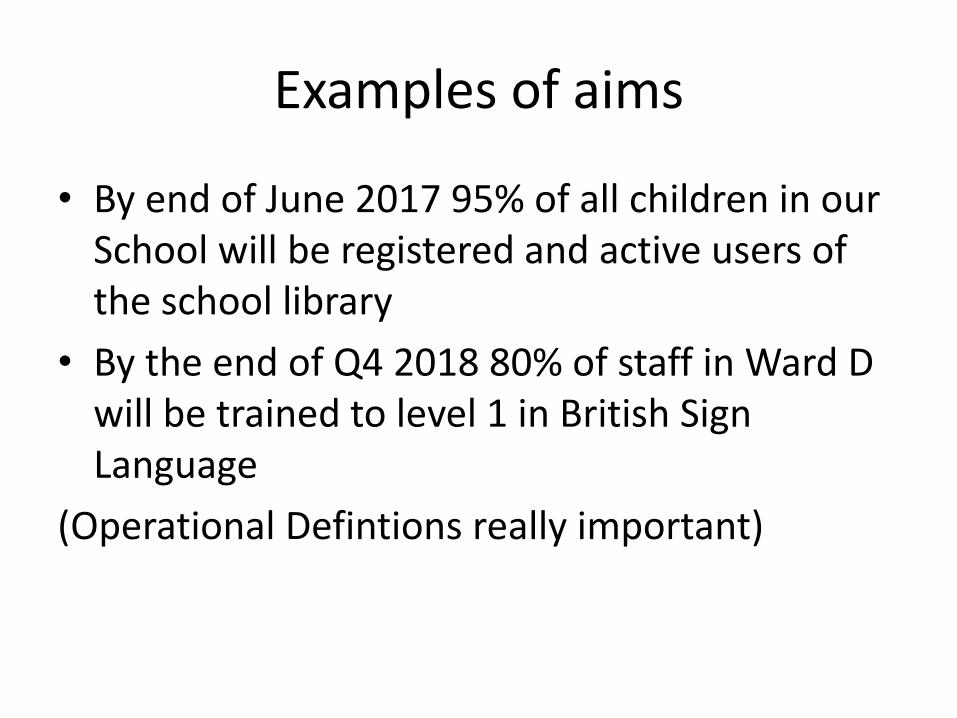
Examples of aims
• By end of June 2017 95% of all children in our School will be registered and active users of the school library
• By the end of Q4 2018 80% of staff in Ward D will be trained to level 1 in British Sign Language
(Operational Defintions really important)
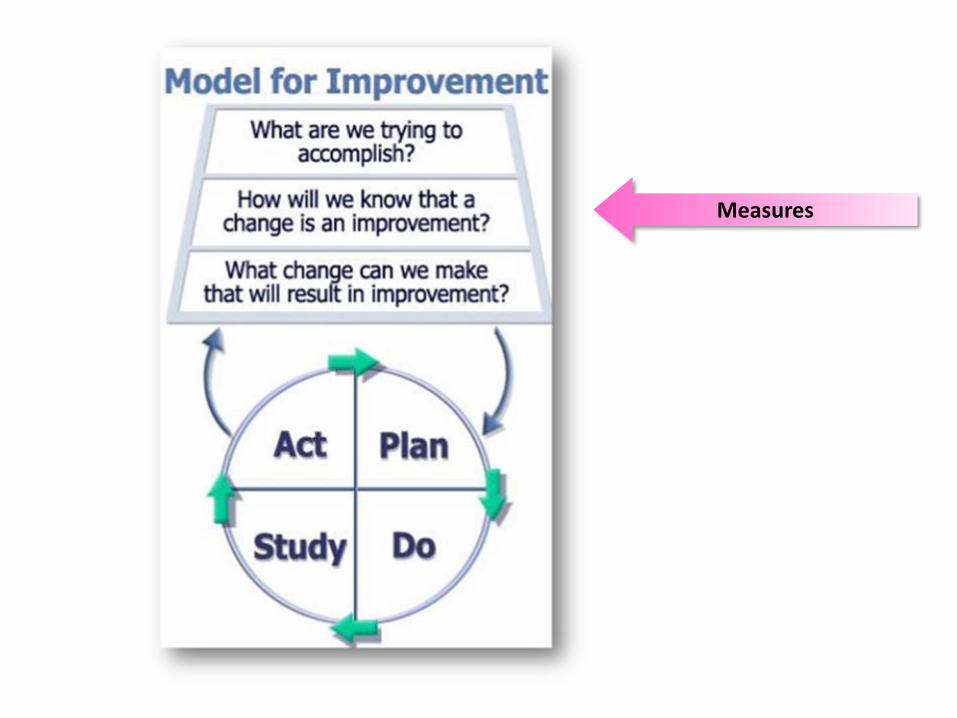
Measures
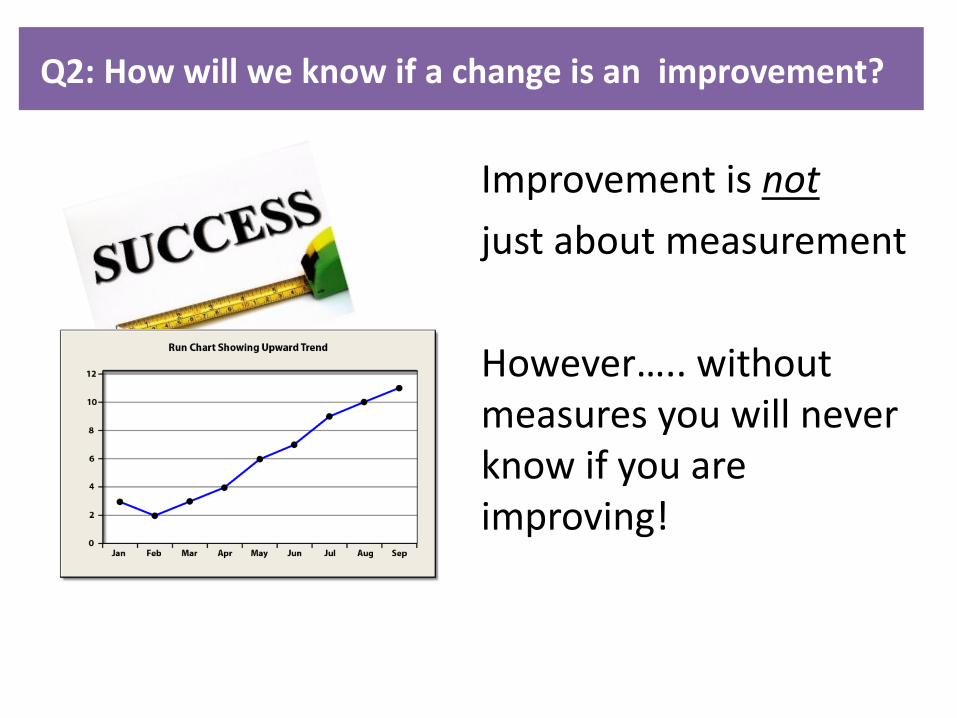
Improvement is not
just about measurement
However….. without measures you will never know if you are improving!
Q2: How will we know if a change is an improvement?
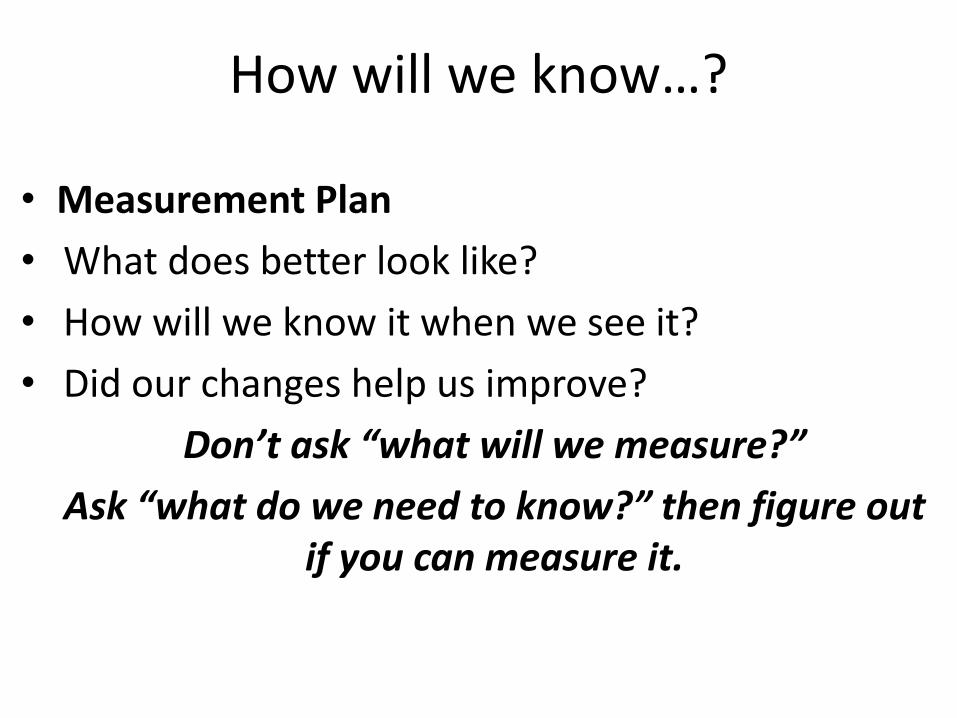
How will we know…?
• Measurement Plan
• What does better look like?
• How will we know it when we see it?
• Did our changes help us improve?
Don’t ask “what will we measure?”
Ask “what do we need to know?” then figure out if you can measure it.
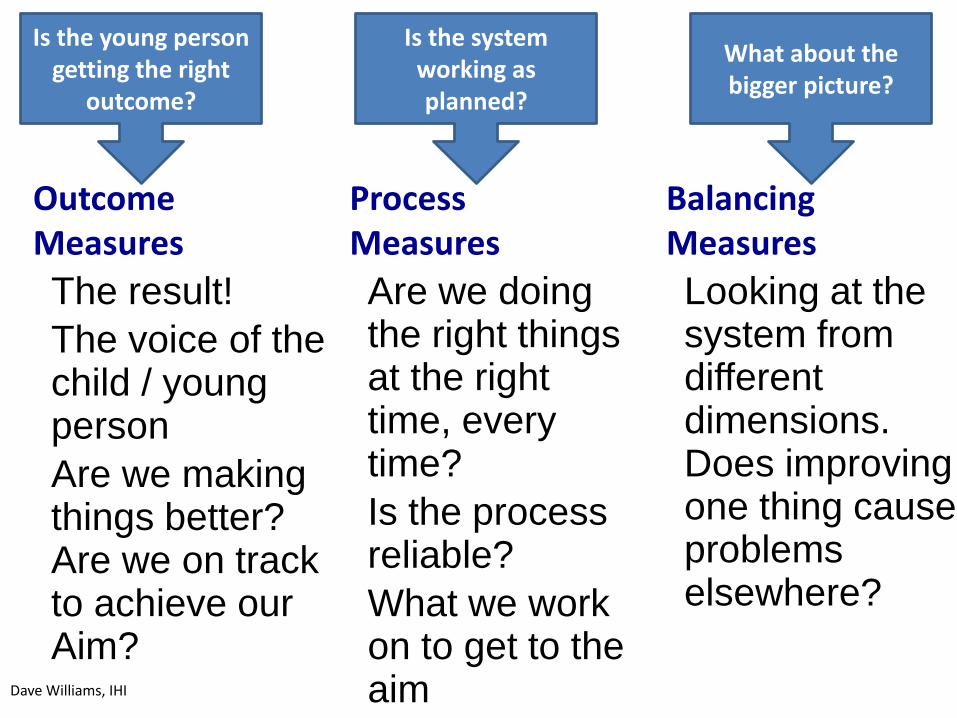
Balancing Measures
Looking at the system from different dimensions. Does improving one thing cause problems elsewhere?
ProcessMeasures
Are we doing the right things at the right time, every time?
Is the process reliable?
What we work on to get to the aim
Outcome Measures
The result!
The voice of the child / young person
Are we making things better? Are we on track to achieve our Aim?
Dave Williams, IHI
Is the young person getting the right
outcome?
Is the system working as planned?
What about the bigger picture?
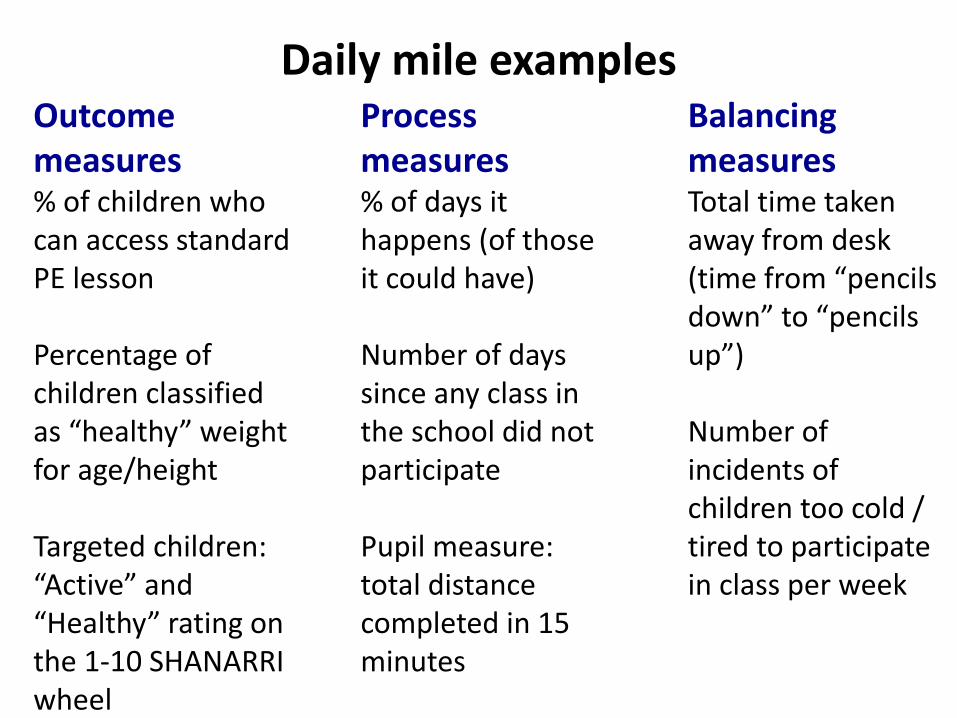
Daily mile examplesBalancing measuresTotal time taken away from desk (time from “pencils down” to “pencils up”)
Number of incidents of children too cold / tired to participate in class per week
Process measures% of days it happens (of those it could have)
Number of days since any class in the school did not participate
Pupil measure: total distance completed in 15 minutes
Outcome measures% of children who can access standard PE lesson
Percentage of children classified as “healthy” weight for age/height
Targeted children: “Active” and “Healthy” rating on the 1-10 SHANARRI wheel
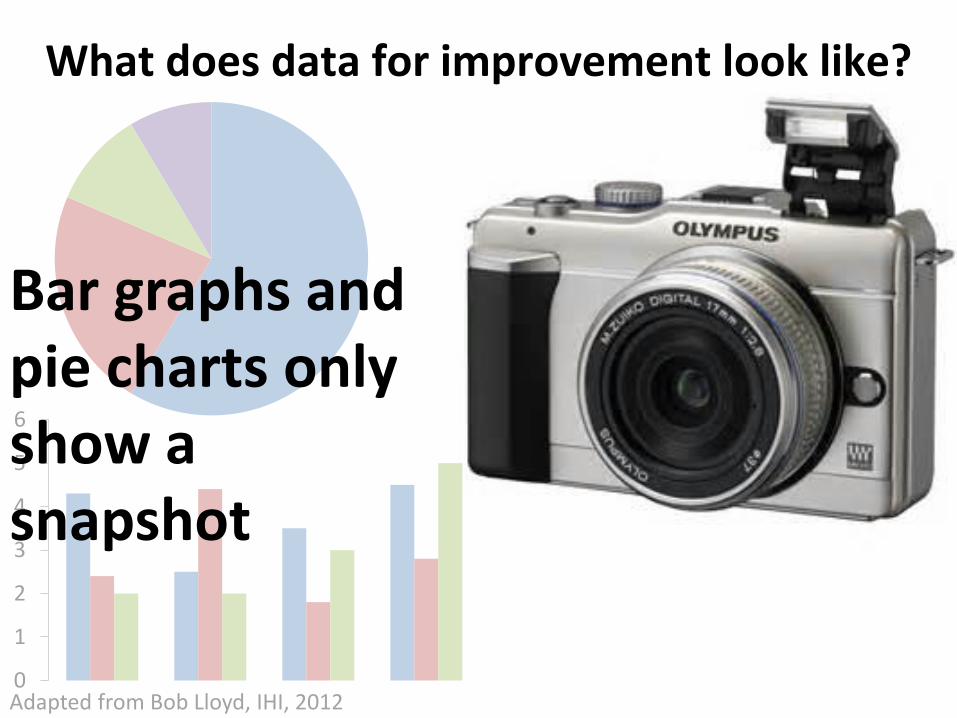
What does data for improvement look like?
0
1
2
3
4
5
6
Adapted from Bob Lloyd, IHI, 2012
Bar graphs and pie charts only show a snapshot
What does data for improvement look like?
Adapted from Bob Lloyd, IHI, 2012
Snapshot data is used for judgement
Showing data over time allows us to measure the impact of our
changes so that we can learn from them
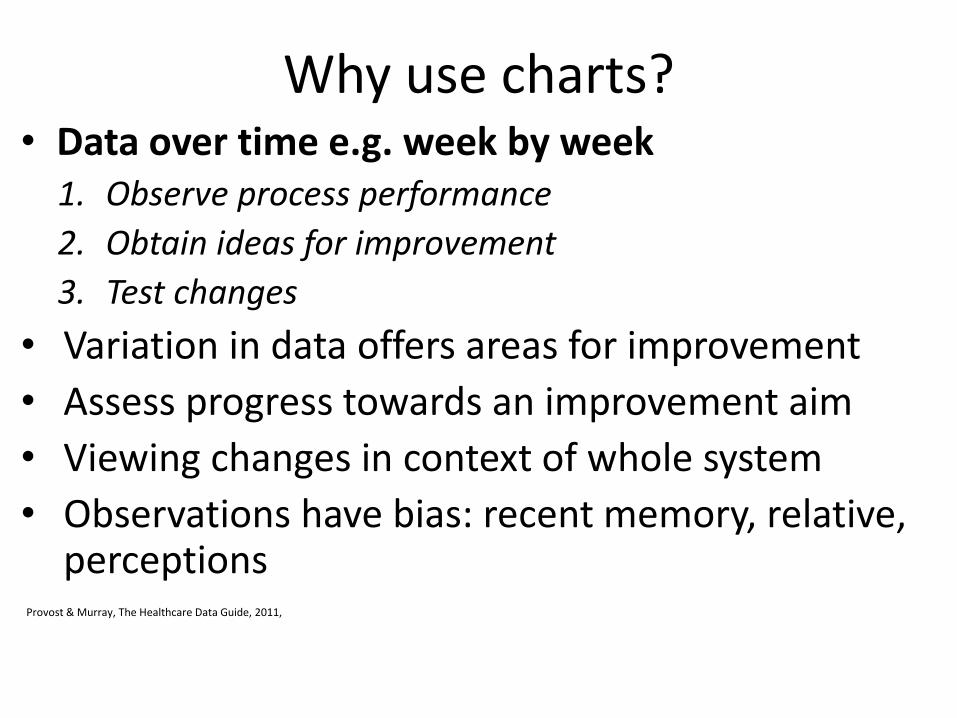
Why use charts?• Data over time e.g. week by week
1. Observe process performance
2. Obtain ideas for improvement
3. Test changes
• Variation in data offers areas for improvement
• Assess progress towards an improvement aim
• Viewing changes in context of whole system
• Observations have bias: recent memory, relative, perceptions
Provost & Murray, The Healthcare Data Guide, 2011,
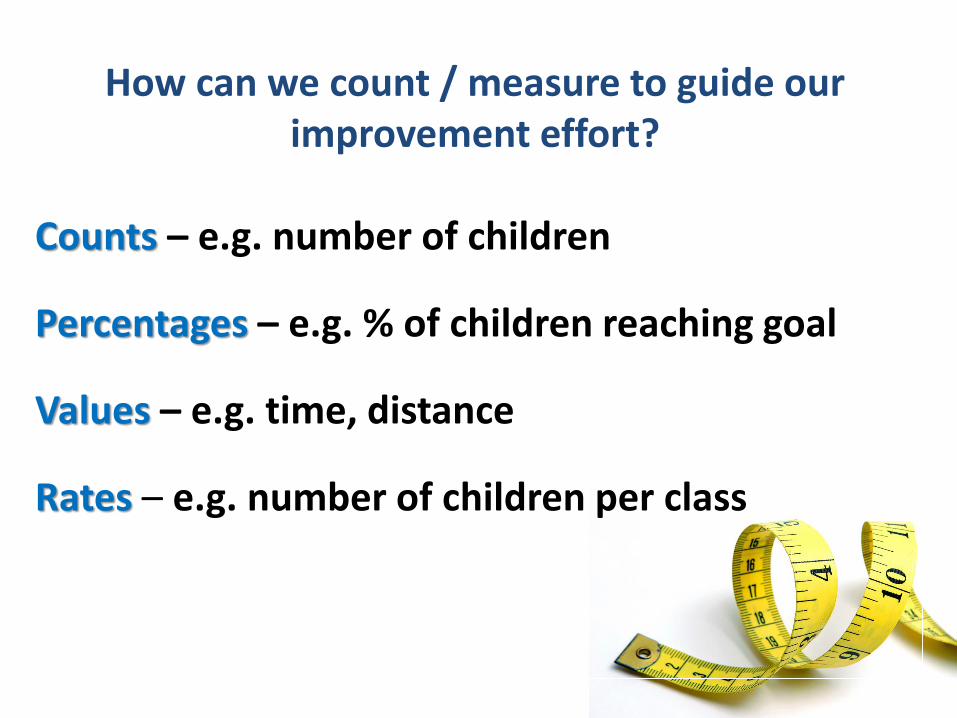
How can we count / measure to guide our improvement effort?
Counts – e.g. number of children
Percentages – e.g. % of children reaching goal
Values – e.g. time, distance
Rates – e.g. number of children per class
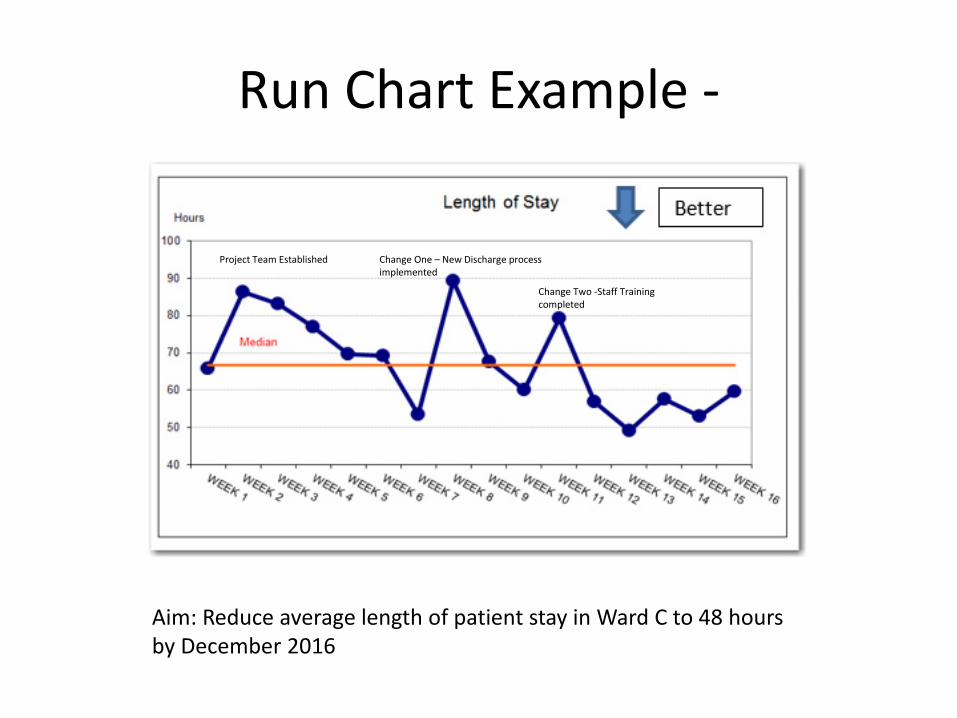
Run Chart Example -
Change Two -Staff Training completed
Project Team Established Change One – New Discharge process implemented
Aim: Reduce average length of patient stay in Ward C to 48 hours by December 2016
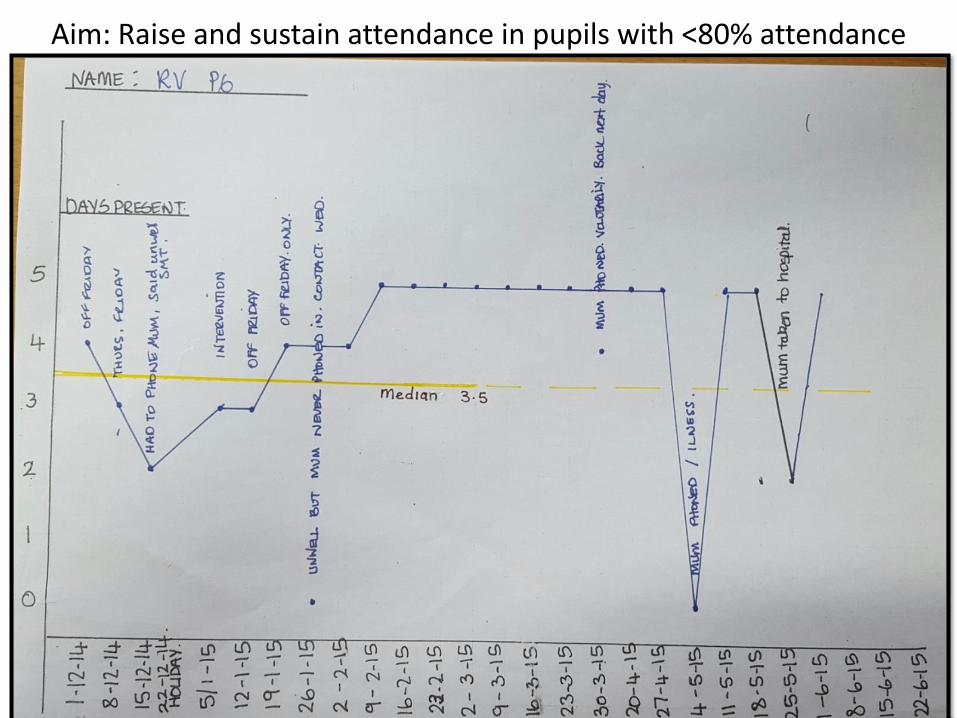
Aim: Raise and sustain attendance in pupils with <80% attendance
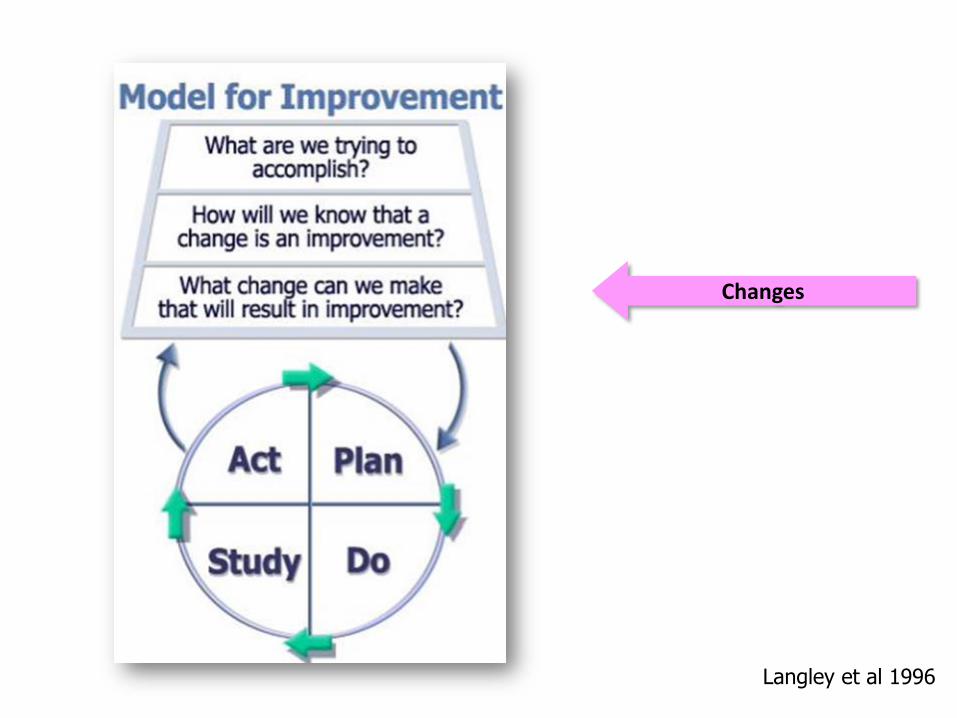
Langley et al 1996
Changes
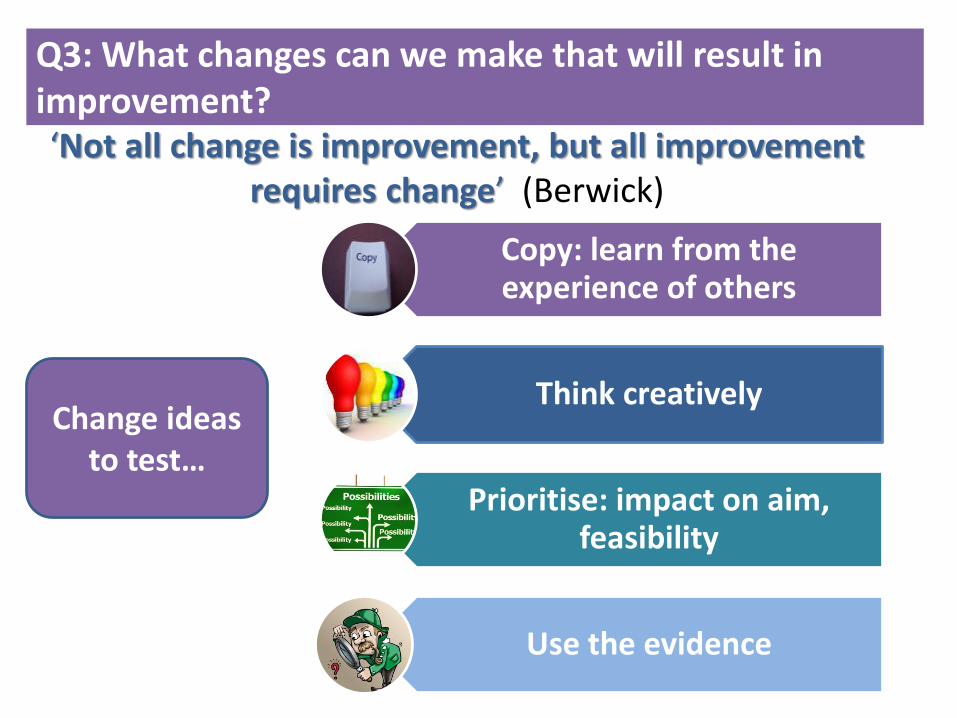
Q3: What changes can we make that will result in improvement?‘Not all change is improvement, but all improvement
requires change’ (Berwick)
Copy: learn from the experience of others
Think creatively
Prioritise: impact on aim, feasibility
Use the evidence
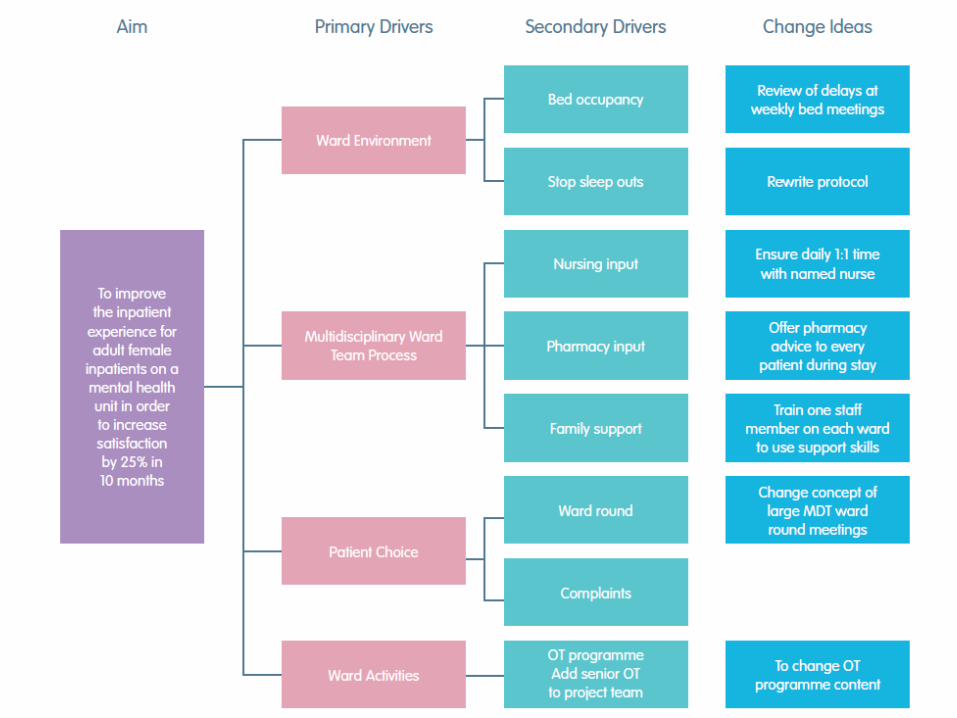
Change ideas to test…
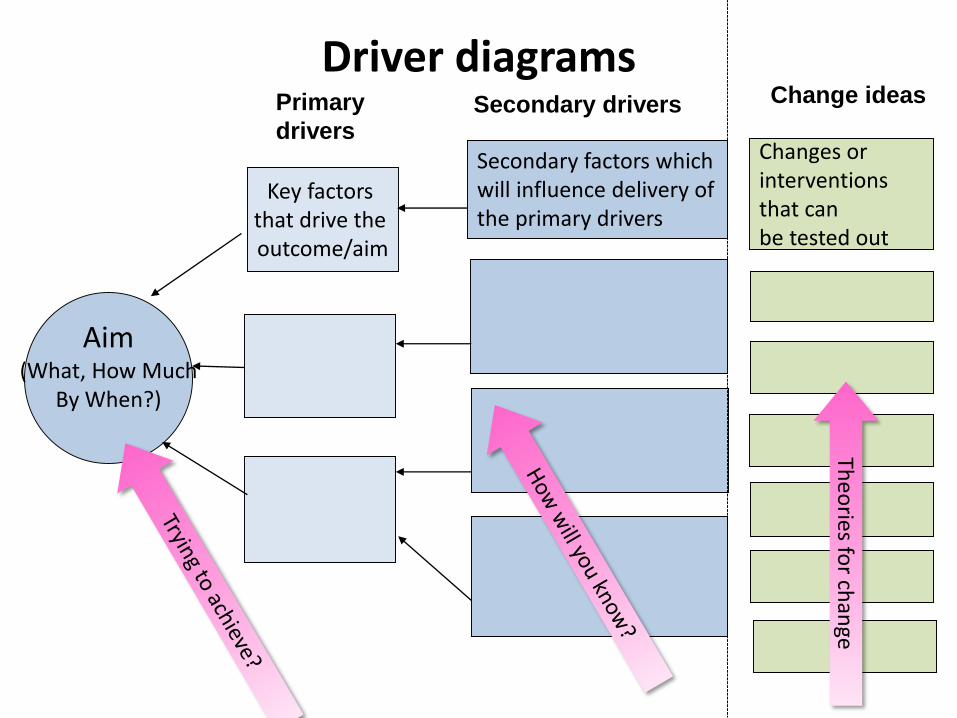
Aim(What, How Much
By When?)
Change ideas
Key factors that drive the outcome/aim
Secondary factors which will influence delivery of the primary drivers
Changes or interventions that can be tested out
Primary
driversSecondary drivers
Driver diagramsTh
eories fo
r chan
ge
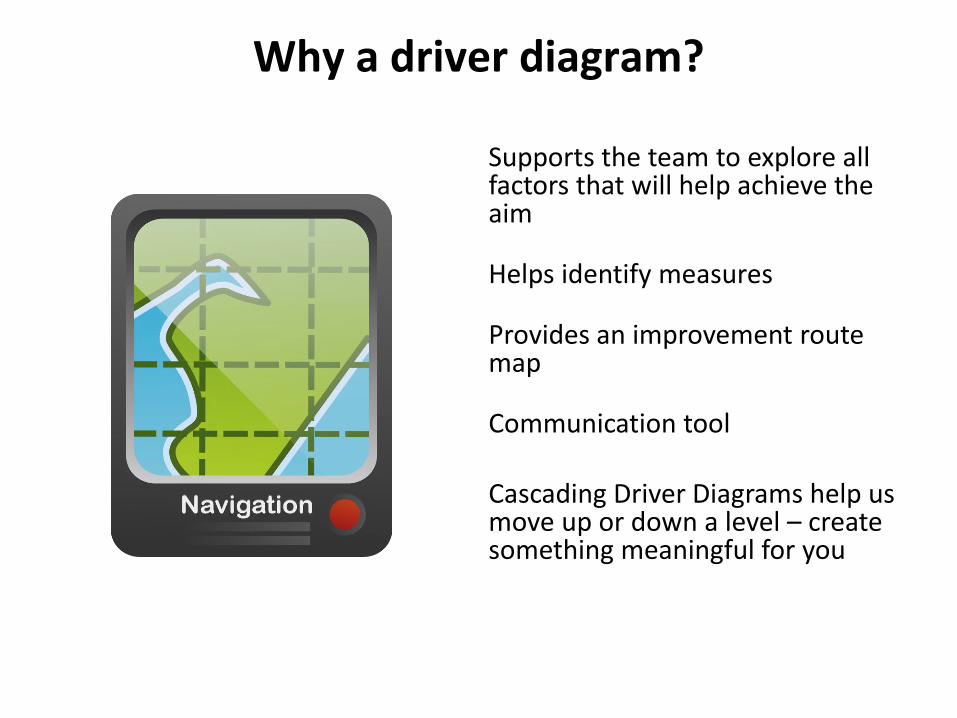
Supports the team to explore all factors that will help achieve the aim
Helps identify measures
Provides an improvement route map
Communication tool
Cascading Driver Diagrams help us move up or down a level – create something meaningful for you
Why a driver diagram?
Improvement Aim
Measures
Theories for change
Generating knowledge of your system
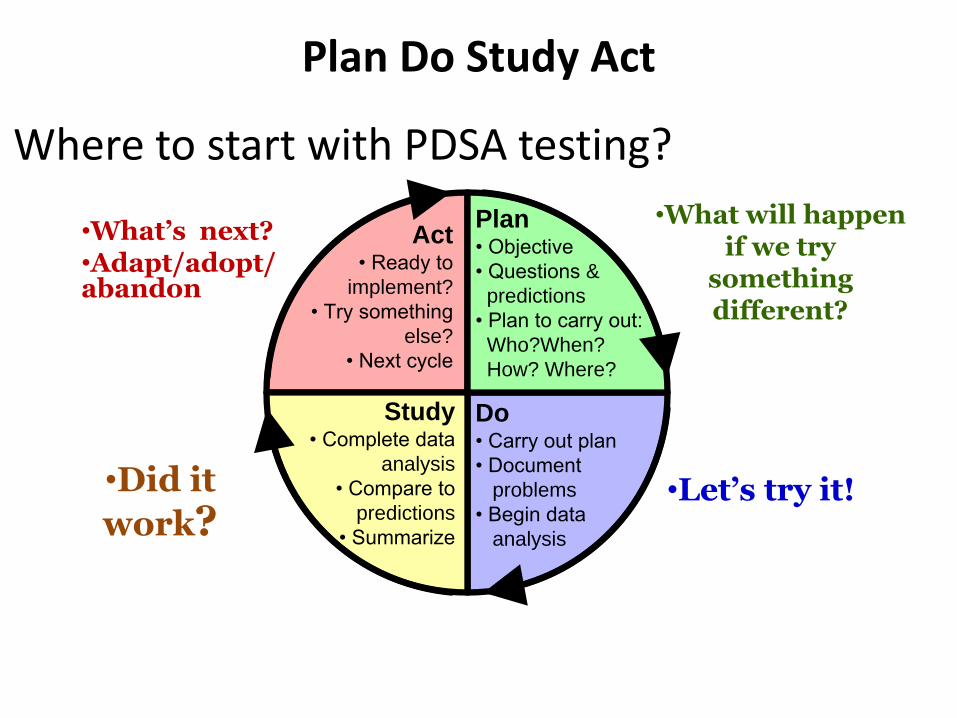
•What’s next? •Adapt/adopt/abandon
•Did it
work?
•What will happen if we try
something different?
•Let’s try it!
Plan• Objective
• Questions &
predictions
• Plan to carry out:
Who?When?
How? Where?
Do• Carry out plan
• Document
problems
• Begin data
analysis
Act• Ready to
implement?
• Try something
else?
• Next cycle
Study• Complete data
analysis
• Compare to
predictions
• Summarize
Where to start with PDSA testing?
Plan Do Study Act
Based on slide © IHI 2009
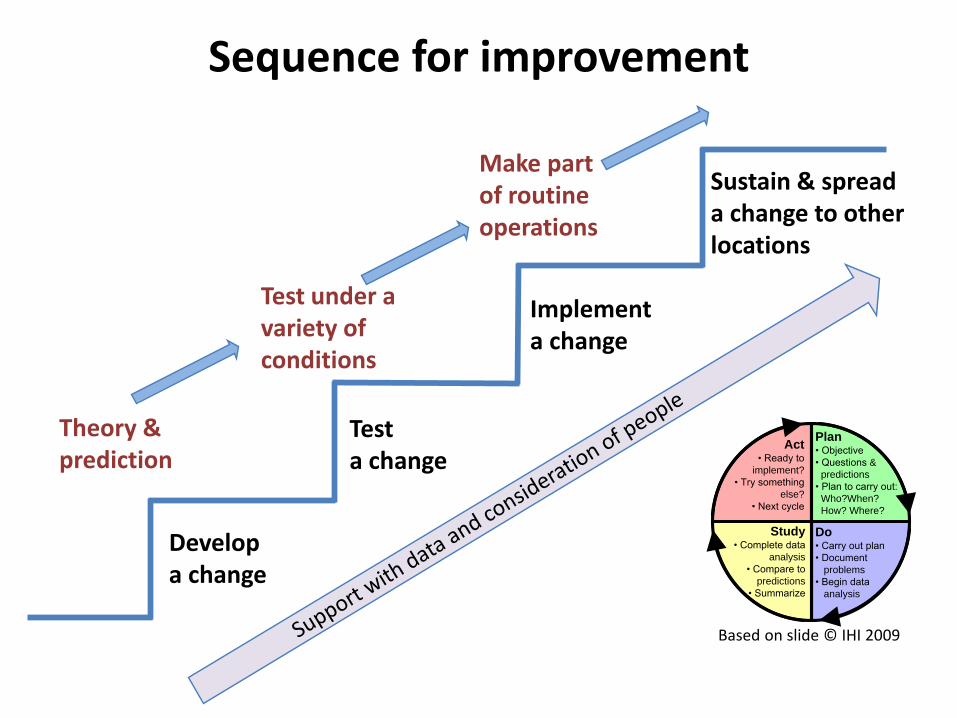
Develop a change
Test a change
Implement a change
Sustain & spread a change to other locations
Theory &prediction
Test under avariety of conditions
Make partof routineoperations
Plan• Objective
• Questions &
predictions
• Plan to carry out:
Who?When?
How? Where?
Do• Carry out plan
• Document
problems
• Begin data
analysis
Act• Ready to
implement?
• Try something
else?
• Next cycle
Study• Complete data
analysis
• Compare to
predictions
• Summarize
Sequence for improvement
Based on slide © IHI 2008
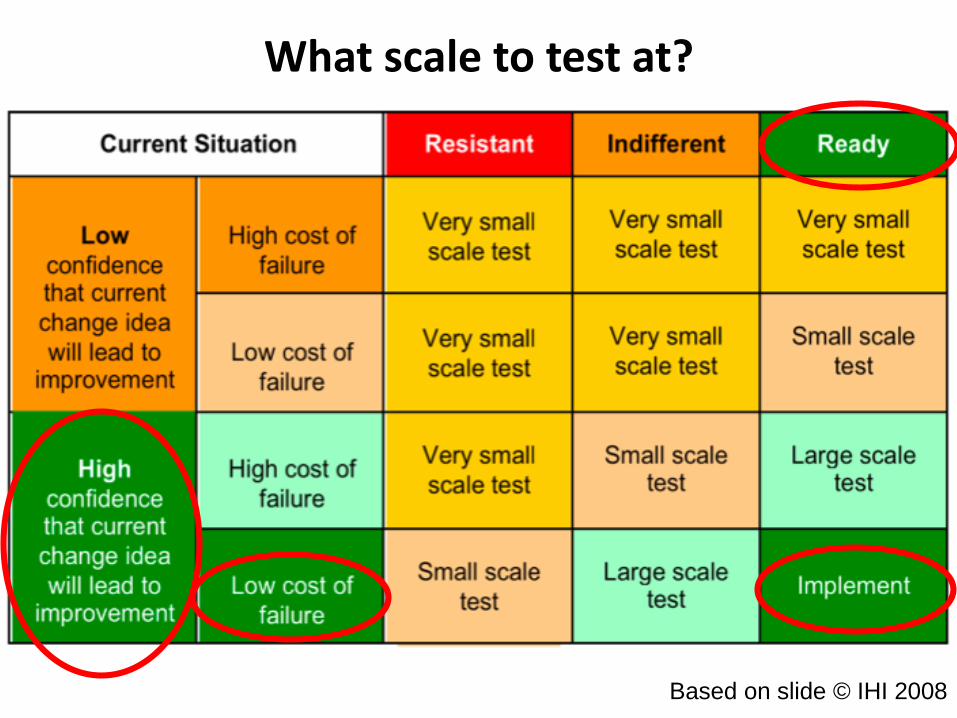
What scale to test at?
The QI Toolkit
• The Model for Improvement gives us some structure
• We use a variety of QI Tools to support this• Capacity within the team to use the tools is
essential • Leadership sponsorship and support can make or
break the work• There are many sources of help - online
resources, Improvement Specialists within CPP, NHS, Scottish Government

Contact Details : [email protected]