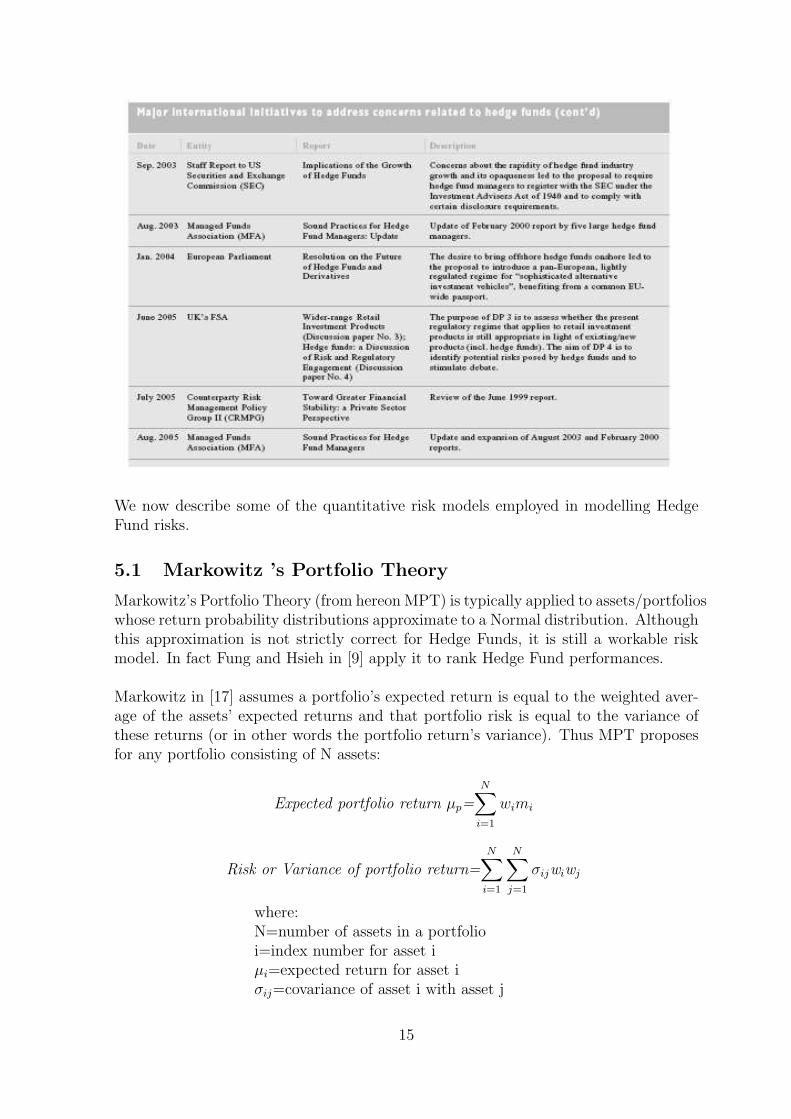
introduction to hedge funds - optirisk systems · 5 hedge fund risk models 13 ... 3 introduction to...
TRANSCRIPT
OptiRisk Systems: White Paper Series Domain: Finance Reference Number: OPT 005
INTRODUCTION TO HEDGE FUNDS
Last Update 24 April 2008

Acknowledgement
I gratefully acknowledge the comments and advice from Prof.G.Mitra ,Dr.C.Lucas,Dr.P.Date and Aseemali Fazal.
2
Contents
1 Scope and Purpose 51.1 Scope . . . . . . . . . . . . . . . . . . . . . . . . . . . . . . . . . . . . 51.2 Purpose . . . . . . . . . . . . . . . . . . . . . . . . . . . . . . . . . . . 5
2 Background 6
3 Introduction to Hedge Funds 73.1 Brief History of the Hedge Funds Industry . . . . . . . . . . . . . . . . 73.2 A Definition of Hedge Funds . . . . . . . . . . . . . . . . . . . . . . . . 73.3 Hedge Fund Performance Benchmark Targets . . . . . . . . . . . . . . 93.4 Hedge Fund Organisation . . . . . . . . . . . . . . . . . . . . . . . . . 103.5 Fund of Hedge Funds (FOHF) . . . . . . . . . . . . . . . . . . . . . . . 10
4 Hedge Fund Investment Strategies 114.1 Event Driven . . . . . . . . . . . . . . . . . . . . . . . . . . . . . . . . 114.2 Global . . . . . . . . . . . . . . . . . . . . . . . . . . . . . . . . . . . . 124.3 Global/Macro . . . . . . . . . . . . . . . . . . . . . . . . . . . . . . . . 124.4 Market Neutral . . . . . . . . . . . . . . . . . . . . . . . . . . . . . . . 124.5 Sector . . . . . . . . . . . . . . . . . . . . . . . . . . . . . . . . . . . . 124.6 Short Selling and Long-Only . . . . . . . . . . . . . . . . . . . . . . . . 12
5 Hedge Fund Risk Models 135.1 Markowitz ’s Portfolio Theory . . . . . . . . . . . . . . . . . . . . . . . 155.2 CAPM (Capital Asset Pricing Model) . . . . . . . . . . . . . . . . . . . 165.3 Sharpe Ratio and the Modified Sharpe Ratio . . . . . . . . . . . . . . . 175.4 Jenson’s Alpha and Treynor ratio . . . . . . . . . . . . . . . . . . . . . 185.5 Three Factor Model of Fama and French . . . . . . . . . . . . . . . . . 185.6 Sharpe’s Asset Class Factor Model . . . . . . . . . . . . . . . . . . . . 195.7 VaR (Value at Risk) . . . . . . . . . . . . . . . . . . . . . . . . . . . . 19
6 Problems with Hedge Fund Risk Modelling 216.1 Non-Normal Return Distribution . . . . . . . . . . . . . . . . . . . . . 216.2 Investment Strategy and Return Distribution . . . . . . . . . . . . . . . 216.3 Hedge Fund Failure Rate . . . . . . . . . . . . . . . . . . . . . . . . . . 21
7 Hedge Funds Available On The Market 237.1 Close Man Hedge Fund . . . . . . . . . . . . . . . . . . . . . . . . . . . 237.2 RAB Capital . . . . . . . . . . . . . . . . . . . . . . . . . . . . . . . . 237.3 Thames River Capital . . . . . . . . . . . . . . . . . . . . . . . . . . . 237.4 Ikos Hedge Fund . . . . . . . . . . . . . . . . . . . . . . . . . . . . . . 23
8 Famous Hedge Funds Withdrawn From The Market 248.1 George Soros’s Quantum Fund . . . . . . . . . . . . . . . . . . . . . . . 248.2 Long Term Capital Management (LTCM) . . . . . . . . . . . . . . . . 248.3 Robertson’s Tiger Management Fund . . . . . . . . . . . . . . . . . . . 24
3

9 The Case For and Against Hedge Funds 269.1 The Case for Preserving Hedge Funds . . . . . . . . . . . . . . . . . . . 269.2 The Case Against Hedge Funds . . . . . . . . . . . . . . . . . . . . . . 26
10 Conclusion 28
References 29
4
1 Scope and Purpose
1.1 Scope
This white paper gives an overview to Hedge Funds, with a focus on risk managementissues. We define and explain the general characteristics of Hedge Funds, their maininvestment strategies, risk models employed and address the problems in Hedge Fundmodelling. We also survey current Hedge Funds available on the market, those thathave been withdrawn and briefly argue the cases supporting and opposing Hedge Fundusage.
1.2 Purpose
The purpose of this white paper is to provide an informed analysis of Hedge Funds.This informational analysis will be of value not only to finance professionals but alsoacademics and more generally to any person broadly interested in finance.
This paper will be of interest to:
• Professionals working within the Financial Risk Management field, in particular:-Hedge Fund and Mutual Fund Managers-Quantitative Analysts-”Front” and ”Middle” Office banking functions e.g. Treasury Management
• Regulators concerned with Hedge Fund Financial Risk Management
• Private and Institutional Investors
• Academic Researchers in the area of Financial Risk Management
• General Finance community
A unique value of this whitepaper, compared to other Hedge Fund literature freelyavailable on the internet, is that this review is fully sourced from academic references(such as peer reviewed journals) and is thus a bona fide study.
5
2 Background
According to the European Central Bank [13], the Hedge Fund industry is growingrapidly with a total of US $1 trillion worth of assets under their control globally. AHedge Fund’s size is typically less than US $100 million, with nearly half under US$25 million [13]. They represent a small percentage of the asset management industry(see [13]) yet they exert a disproportionately massive influence on the financial andeconomic sector in relation to their size (see Fung [11]). This is due to Hedge Fundsgenerally using dynamic and leveraged trading strategies, which is in contrast to Mu-tual Funds that typically engage in buy-and-hold strategies.
Thus it is apparent Hedge Funds have a significant influence in financial markets, yetknowledge of them is relatively little, partly due to the secrecy exercised by the HedgeFund industry. Hence a study of Hedge Funds will be of interest to most members ofthe Finance and Academic community.
In this whitepaper we introduce Hedge Funds, attempting to firstly propose a definitionfor Hedge Funds as no common consensus has yet been agreed within the Finance com-munity. We then explain the common investment strategies applied by Hedge Fundse.g. event driven, long-only investment. In the next section, we survey the main riskmodels applied to analysing Hedge Funds whilst also discussing the difficulties in actu-ally measuring Hedge Fund risks. Finally we finish by surveying current Hedge Fundsavailable on the market and famous Hedge Funds that have been withdrawn.
It is important to note that knowledge and performance of the Hedge Fund indus-try is guarded with substantial secrecy. Consequently, the quality of information usedin any Hedge Fund study, including academic ones, can never be as good as those forother investment products e.g. Mutual Funds (see Fung [11],Fung [10], Do et al. [4]).
6
3 Introduction to Hedge Funds
Within the investment industry, many fund types exist: Hedge Funds, investmenttrusts, unit trusts etc... yet the term Hedge Fund has no explicit definition. In factthe European Central Bank states in its report on Hedge Funds [13] that no commonHedge Fund definition exists. Defining a Hedge Fund is in fact more problematic thanit appears. To appreciate the difficulty in defining a Hedge Fund, it is instructive toknow its brief history.
3.1 Brief History of the Hedge Funds Industry
According to Fung [10], the first ever Hedge Fund was formed by Albert Wislow Jones in1949, so called as the main investment strategy was to take hedged equity investments.By hedging (the act of removing risk in some investment by taking an investment inanother (typically related) investment) Winslow was able to eliminate some marketrisks.
Hedge Funds then became first well-known after an article in Fortune(1966) men-tioning Jones’s fund significantly outperforming other Mutual Funds [10]. Althoughthis article initiated wide interest in Hedge Funds, their popularity diminished as it fellvictim to the bear markets of 1969-70 and 1973-4. A decade later (1986), interest wasrevived by Robertson’s infamous Tiger Fund [10], which achieved compound annualreturns of 43% for 6 years after all expenses. Fung in [10] corroborates the impactthat the publicity of Robertson’s Fund had on the Hedge Fund industry by showingthe rapid expansion of Hedge Funds and CTA funds (commodity trading advisor funds(similar to Hedge Funds)) from 1985-97.
With numerous Hedge Fund investors and the fact that Hedge Funds were virtuallyunregulated compared to other funds, a multitude of new Hedge Fund trading strate-gies evolved, including the use of derivatives e.g. options. Now all these funds came tobe known as Hedge Funds yet many of them were using investment strategies beyondsimply ”hedging” that A.Winslow first employed (see paper later and [13] for moredetails). To complicate matters further, as Hedge Fund strategies developed so alsodid funds other than Hedge Funds begin employing Winslow’s equity hedging strategy,thus hedging was no longer unique to Hedge Funds. Today, the word ”hedge” in HedgeFunds has become a misnomer, more of a historical hangover from Alfred Winslowrather than a description.
3.2 A Definition of Hedge Funds
As the European Central bank states [13]:
”there is no common definition of what constitutes a Hedge Fund,it can be described asan unregulated or loosely regulated fund which can freely use various active investmentstrategies to achieve positive absolute returns”.
As the European Central Bank implies, a Hedge Fund is difficult to define partly
7
because of a lack of clarity of agreement on its term and also due to its diverse tradingspectrum. They are typically characterised by high leveraging, derivatives trading andshort selling compared to Mutual Funds. One way of defining a Hedge Fund is bycomparing the similarities and differences with Mutual Funds. In a sense Hedge Fundsare similar to any other portfolio investment in 3 respects:
• they are funded by capital from investors, rather than bank loans or other sourcesof capital
• they invest in publicly traded securities e.g. equities and bonds
• the capital is ”managed” or invested by expert fund managers
The key difference between Hedge Funds and Mutual Funds lies in the degree of reg-ulation, the level and variety of risky investment strategies. Whereas Mutual Funds arerequired to adhere to strict financial regulations, including the types and levels of risks,Hedge Funds are free to pursue virtually any investment strategy with any level of risk.
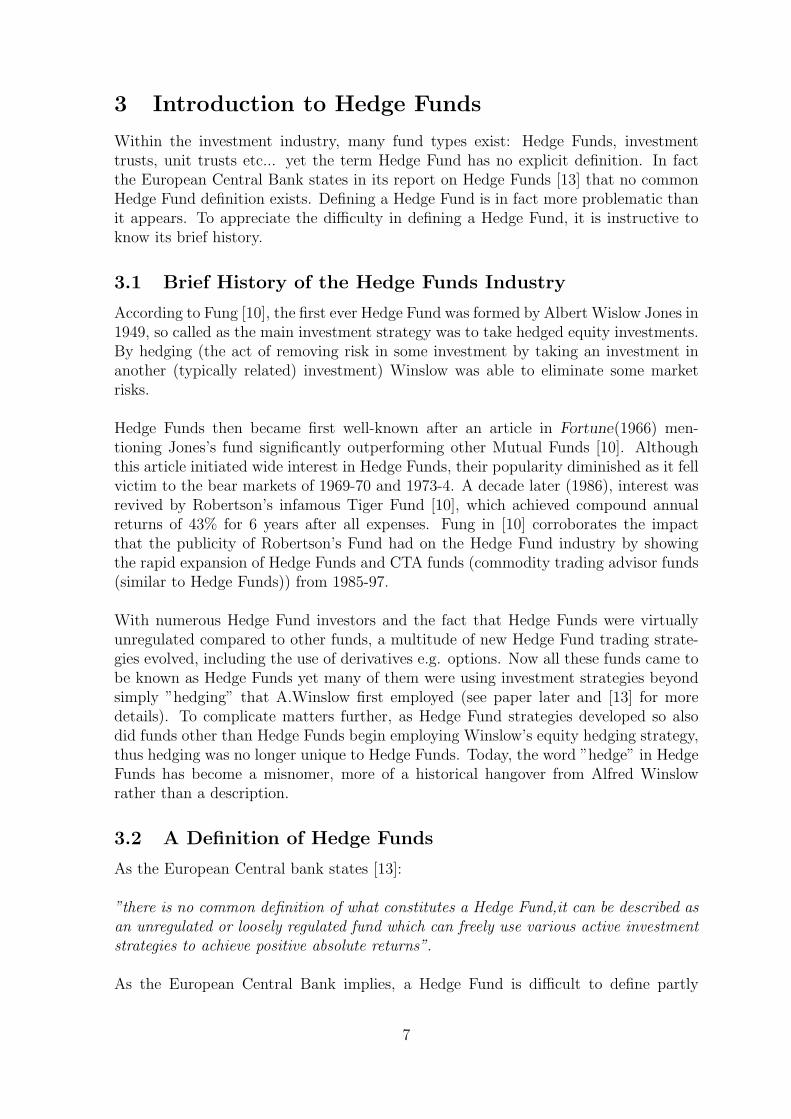
Secondly, Hedge Fund investors are typically high net worth (very wealthy) individ-uals or institutional investors e.g. pension funds [13], partly because Hedge Fundstypically require high minimum investment amounts. A graph taken from the Euro-pean Central Bank [13]shows the composition of Hedge Fund investors from 1992-2004.
Mutual funds on the other hand, are typically targetted at the general public andwill accept any investor who can meet the minimum investment amount. Hedge Fundsin fact are banned from advertising and in some cases the investors are required to be”accredited”.
A third key difference is the fund portfolio composition. As Fung [10] states, the ma-jority of Mutual Funds are composed of equities and bonds. Hedge fund portfolio com-positions are far more varied, with possibly a significant weighting in non-equity/bondassets e.g. derivatives.
A fourth key difference is that the historical return characteristics and distribution
8
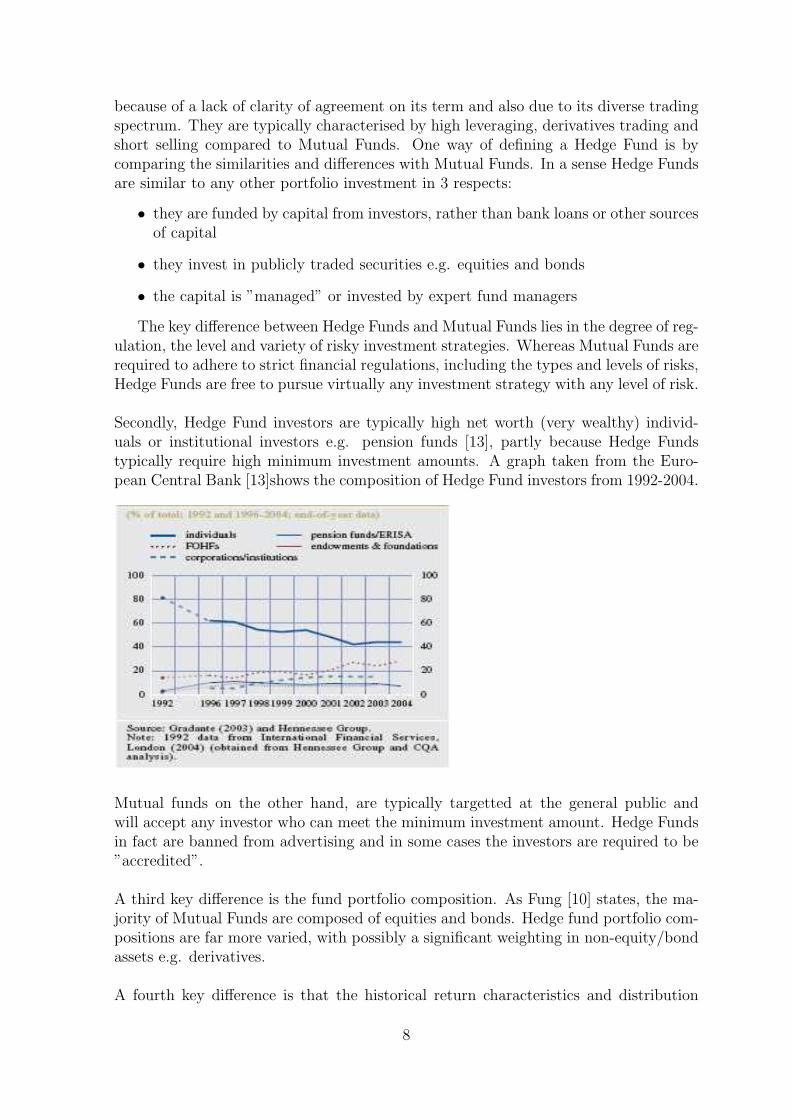
of Hedge Funds tend to differ significantly from Mutual Funds. For example, Capocciet al. [2] and Getmansky [14] demonstrate that Hedge Funds empirically display serialcorrelation in returns. According to Brown [1], Hedge Funds do not perform signifi-cantly better than most investment funds; Hedge Funds between 1989-95 earned 300basis points below the S&P 500. However, other studies conclude that Hedge Fundsproduce excess market returns (see [2],[4]). A graph below from [13] gives the perfor-mance of Hedge Funds compared to key indexes. The CSFB/Tremont index is a HedgeFund index, the ”equivalent” of the FTSE-100 for UK stocks.
3.3 Hedge Fund Performance Benchmark Targets
With Mutual Funds only 1 type of performance benchmark typically exists; the fundis expected to match or excel a particular index e.g. FTSE-100 index, S&P 500 index.This is an example of a relative return target, which some Hedge Funds adopt as theirbenchmark. However for Hedge Funds another benchmark exists called absolute returntargets.
An absolute return target is the typical benchmark choice for Hedge Funds and isthe opposite of relative return. It is a fixed return target and the fund is expectedto match/excel it regardless of the overall market performance. Hedge fund managersuse two main approaches to achieve absolute return targets: Market Timing and theNon-Directional approach.
Market Timingthis approach takes positions by anticipating the market trend or direction (eithermoving up/down). This approach potentially offers high returns, as demonstrated by
9
Georg Soros in his Quantum Fund when speculating on the British Pound in 1992.
Non-DirectionalAn example of Non-Directional is A.Winslow’s Hedge Fund; it is a fund that eliminatessome market risks, hence it can be considered non-directional, whilst also benefittingfrom relative price movements of assets. According to Fung [10] the non-directionalapproach has evolved over the last decade and is continuing to develop.
3.4 Hedge Fund Organisation
Hedge Funds typically prefer to concentrate their efforts on the key activity of max-imising investment return, so non-essential operations are outsourced e.g. ”back office”functions. Actual trading transactions too are outsourced to ”Prime Brokers”. Primebrokers are banks or securities firms, offering brokerage and other financial services tolarge institutional clients e.g. Pension Funds. It is also worth noting that Hedge Fundstypically reside ”offshore” to take advantage of more favourable tax treatments andregulations.
3.5 Fund of Hedge Funds (FOHF)
A Fund of Hedge Funds is simplistically a Mutual Fund that invests in multiple HedgeFunds e.g 15-25 different Hedge Funds, furthermore F3 funds or fund of FOHF alsoexist. All these funds provide diversification benefits and a method of investing inHedge Funds without requiring the skill to personally assess Hedge Funds individually.Also, FOHF normally have significantly lower minimum investment levels compared toa standard Hedge Fund, thus increasing investment access to the general public.
10
4 Hedge Fund Investment Strategies
The investment strategies employed by various Mutual funds are well documented,ranging from value investing to buying growth stocks, with each having particular riskand return implications. On the contrary, Hedge Fund investment strategies are farless well documented and the variety of strategies are greater than for Mutual Funds.Consequently, there is no widely accepted categorisation of Hedge Fund strategies,forexample, Stonham in [21] identifies 14 Hedge Fund strategy categories whereas Fung[10] only has 7.
We now describe the 7 main Hedge Fund investment strategies as given by Fung [10],which in turn are taken from MAR (Managed Account Reports (one of the oldestsources of global managed futures information )). The advantage of applying suchstrategy categorisation is that different Hedge Fund return characteristics can be ex-plained by them (see [10]).
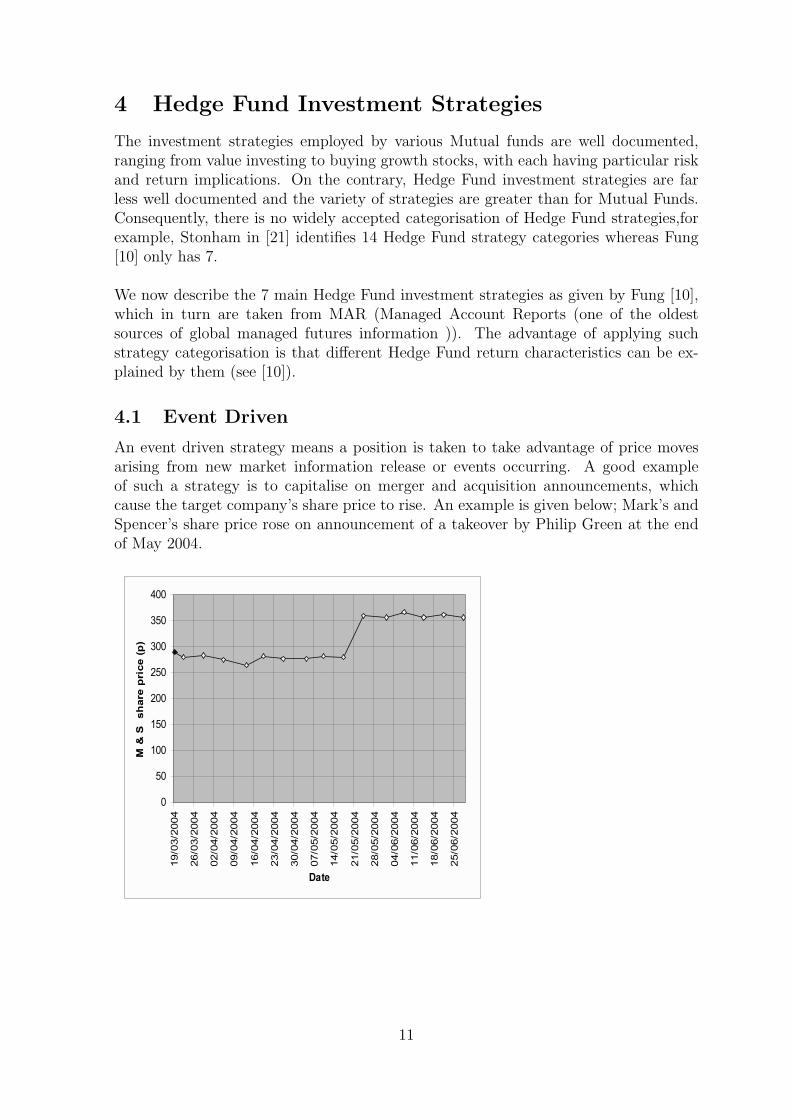
4.1 Event Driven
An event driven strategy means a position is taken to take advantage of price movesarising from new market information release or events occurring. A good exampleof such a strategy is to capitalise on merger and acquisition announcements, whichcause the target company’s share price to rise. An example is given below; Mark’s andSpencer’s share price rose on announcement of a takeover by Philip Green at the endof May 2004.
11
4.2 Global
The Global strategy is an all-round category for funds that invest in assets beyond thosebased in their home market. Other than that, no more specific technique is associatedwith this. A typical example would be a Hedge Fund investing in an emerging marketsuch as India.
4.3 Global/Macro
The Global/Macro strategies utilise macroeconomic analysis to capitalize on asset pricechanges that are strongly linked to macroeconomics e.g. currencies, bonds, stock in-dices, and commodities. As the name implies, this startegy is applied on a global scale.For example, George Soross Quantum Fund reputedly made US$1 billion in 1 day onSeptember 1992 by speculating the British Pound would exit the European ExchangeRate Mechanism.
4.4 Market Neutral
Market neutral investment refers to funds that hedge against market risk factors,thereby becoming ”neutral” to the market. This strategy profits by speculating onrelative price movements between assets or indexes. Examples of this method includelong-short equity, stock index arbitrage, fixed income arbitrage. A good example ofthe long-short equity method is the classic 1949 A.W. Jones Hedge Fund, who tooklong and short positions in equities.
4.5 Sector
Sector Hedge Fund investing concentrate on investing in specific sectors e.g. airlines,telecoms, utilities sectors etc... . The investment instrument itself can be a variety oftypes e.g. short selling, long and leveraged positions.
4.6 Short Selling and Long-Only
Short selling and long-only Hedge Funds are those funds which will only invest byshorting or going long respectively.
12
5 Hedge Fund Risk Models
The necessity for Hedge Fund risk modelling and management originates from 2 areas:
• Hedge Funds experiencing some of the greatest losses ever witnessed by the in-vestment community
• new regulatory pressure enforcing more stringent Hedge Fund risk management.
Firstly, Hedge Funds have been responsible for numerous catastrophic losses, caus-ing them to completely collapse and initiate a contagion effect by affecting numerouseconomic and financial sectors. The most notorious example of such a catastrophic lossbeing the Long Term Capital Management Hedge Fund, which lost US$2.1 Billion [21]and almost brought down the entire US financial system.
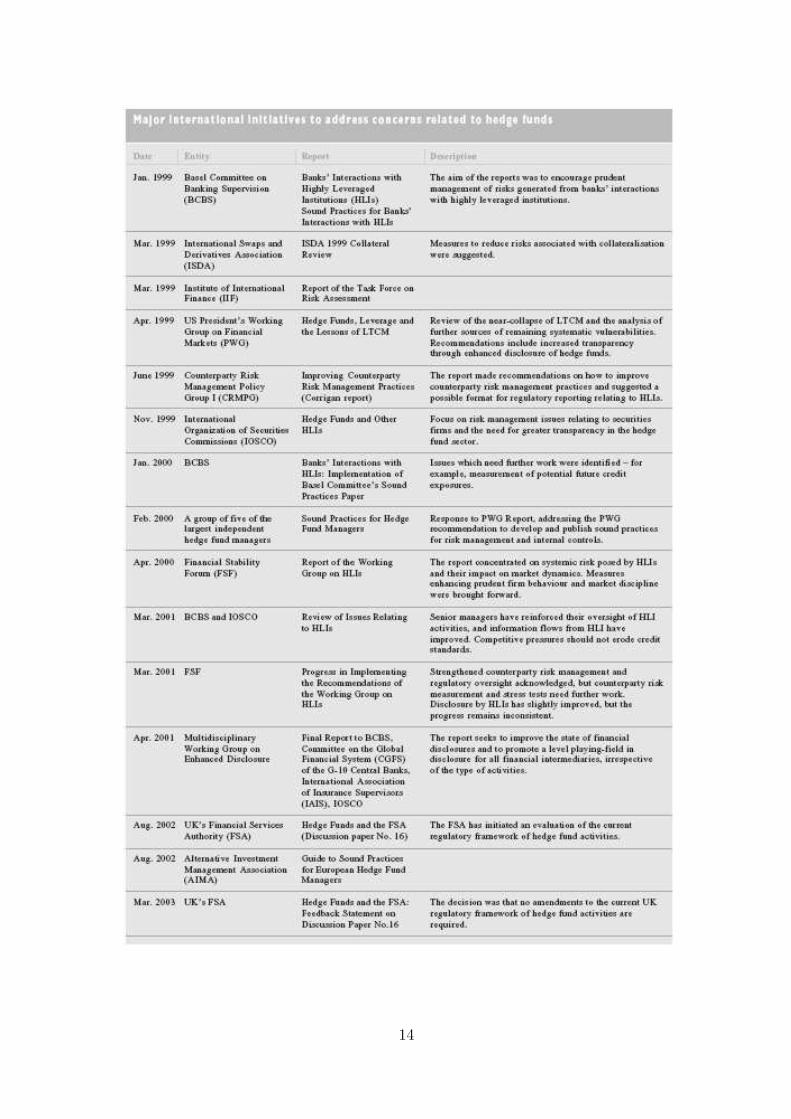
Secondly, as already mentioned, Mutual Funds are tightly regulated whereas HedgeFunds face little regulation. However, as Hedge Funds have gained public attentionand therefore more investment interest, this along with spectacular Hedge Fund disas-ters have prompted increased Hedge Fund regulation.
It was not until after the 1997 Asian Currency Crisis though that regulators becameinterested in regulating Hedge Fund activities [11]. The IMF (International MonetaryFund) initiated a study on the market influence of Hedge Funds by Eichengreen [5].This study described Hedge Funds activities and the potential problem of the marketimpact of Hedge Funds.
Moreover in 2004, the Securities and Exchange Commission now required Hedge Fundmanagers and sponsors to register as investment advisors under the Investment Advi-sor’s Act of 1940. This greatly increases the number of requirements placed on HedgeFunds e.g. keeping records and creating a code of ethics. For more information onSEC regulation visit the SEC website http : //www.sec.gov/.
13
14
We now describe some of the quantitative risk models employed in modelling HedgeFund risks.
5.1 Markowitz ’s Portfolio Theory
Markowitz’s Portfolio Theory (from hereon MPT) is typically applied to assets/portfolioswhose return probability distributions approximate to a Normal distribution. Althoughthis approximation is not strictly correct for Hedge Funds, it is still a workable riskmodel. In fact Fung and Hsieh in [9] apply it to rank Hedge Fund performances.
Markowitz in [17] assumes a portfolio’s expected return is equal to the weighted aver-age of the assets’ expected returns and that portfolio risk is equal to the variance ofthese returns (or in other words the portfolio return’s variance). Thus MPT proposesfor any portfolio consisting of N assets:
Expected portfolio return µp=N∑
i=1
wimi
Risk or Variance of portfolio return=N∑
i=1
N∑j=1
σijwiwj
where:N=number of assets in a portfolioi=index number for asset iµi=expected return for asset iσij=covariance of asset i with asset j
15
σii=variance of asset iwi=weighting or fraction of asset i in the portfolio, subject to
constraints:
0≤ wi ≤1
N∑i=1
wi=1
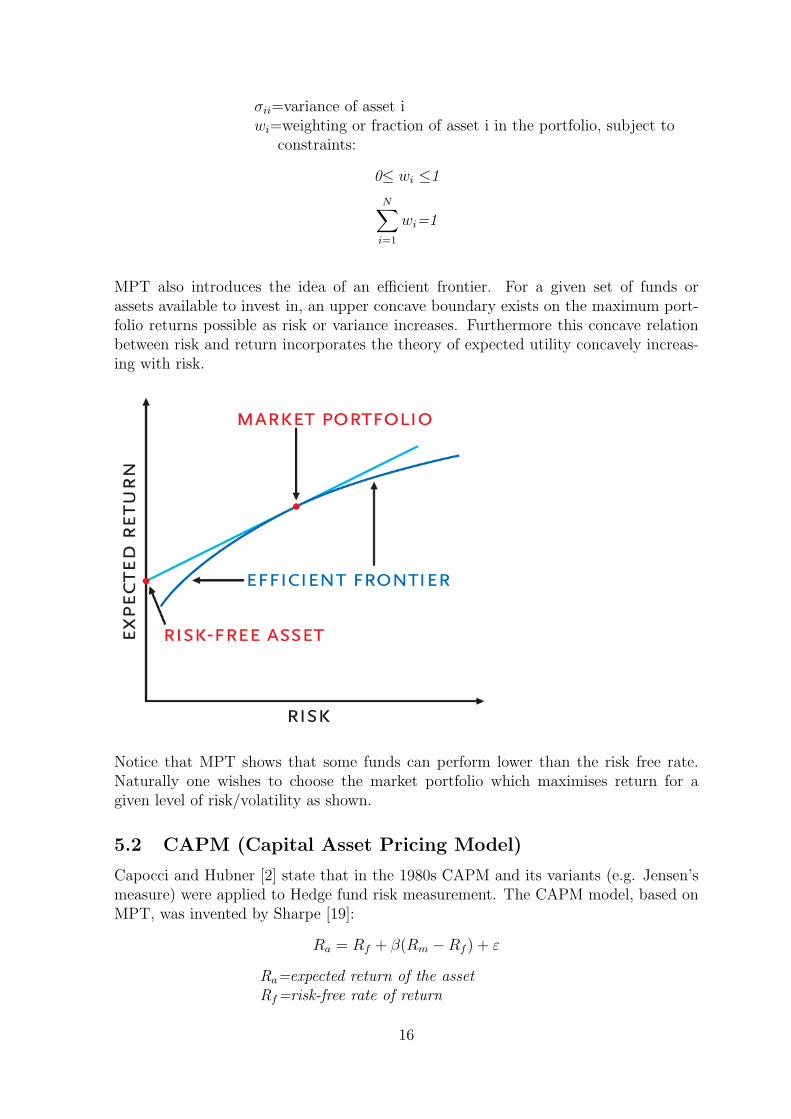
MPT also introduces the idea of an efficient frontier. For a given set of funds orassets available to invest in, an upper concave boundary exists on the maximum port-folio returns possible as risk or variance increases. Furthermore this concave relationbetween risk and return incorporates the theory of expected utility concavely increas-ing with risk.
Notice that MPT shows that some funds can perform lower than the risk free rate.Naturally one wishes to choose the market portfolio which maximises return for agiven level of risk/volatility as shown.
5.2 CAPM (Capital Asset Pricing Model)
Capocci and Hubner [2] state that in the 1980s CAPM and its variants (e.g. Jensen’smeasure) were applied to Hedge fund risk measurement. The CAPM model, based onMPT, was invented by Sharpe [19]:
Ra = Rf + β(Rm −Rf ) + ε
Ra=expected return of the assetRf=risk-free rate of return
16
Rm=expected market returnε= error term
β =σam
σmm
where σam= market and asset’s covarianceσmm= market’s variance
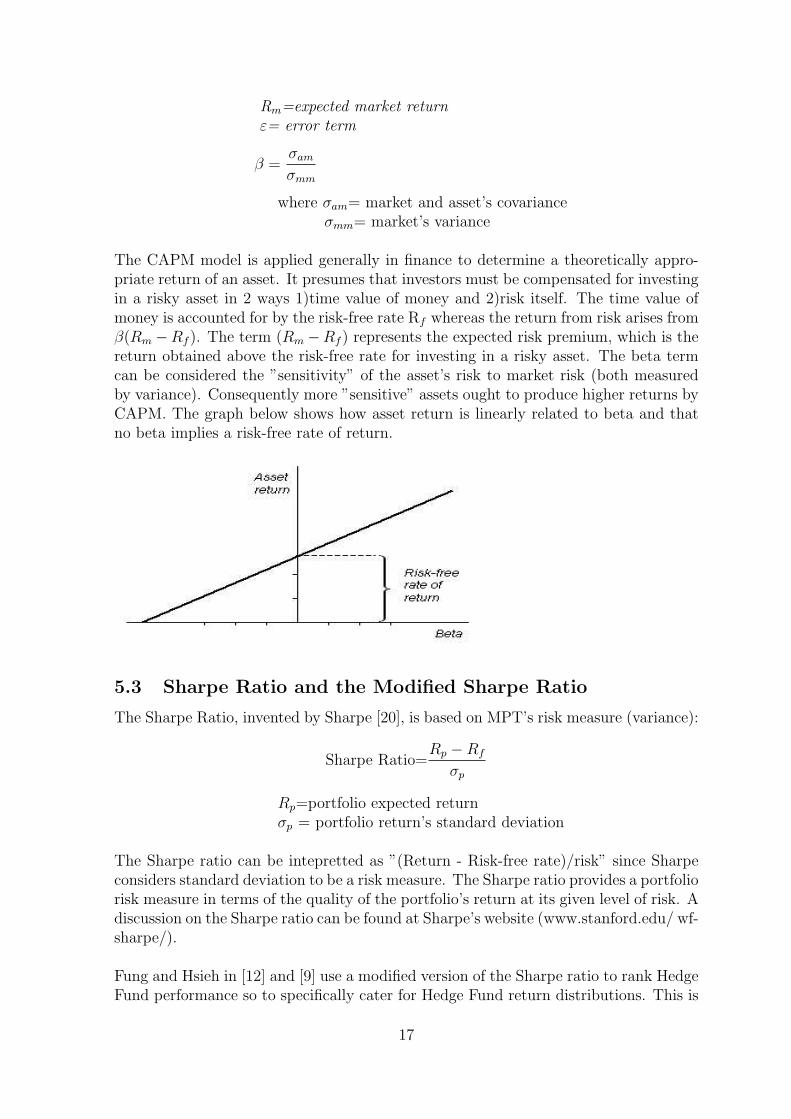
The CAPM model is applied generally in finance to determine a theoretically appro-priate return of an asset. It presumes that investors must be compensated for investingin a risky asset in 2 ways 1)time value of money and 2)risk itself. The time value ofmoney is accounted for by the risk-free rate Rf whereas the return from risk arises fromβ(Rm −Rf ). The term (Rm −Rf ) represents the expected risk premium, which is thereturn obtained above the risk-free rate for investing in a risky asset. The beta termcan be considered the ”sensitivity” of the asset’s risk to market risk (both measuredby variance). Consequently more ”sensitive” assets ought to produce higher returns byCAPM. The graph below shows how asset return is linearly related to beta and thatno beta implies a risk-free rate of return.
5.3 Sharpe Ratio and the Modified Sharpe Ratio
The Sharpe Ratio, invented by Sharpe [20], is based on MPT’s risk measure (variance):
Sharpe Ratio=Rp −Rf
σp
Rp=portfolio expected returnσp = portfolio return’s standard deviation
The Sharpe ratio can be intepretted as ”(Return - Risk-free rate)/risk” since Sharpeconsiders standard deviation to be a risk measure. The Sharpe ratio provides a portfoliorisk measure in terms of the quality of the portfolio’s return at its given level of risk. Adiscussion on the Sharpe ratio can be found at Sharpe’s website (www.stanford.edu/ wf-sharpe/).
Fung and Hsieh in [12] and [9] use a modified version of the Sharpe ratio to rank HedgeFund performance so to specifically cater for Hedge Fund return distributions. This is
17
simply the Sharpe ratio without subtracting the risk free rate from the numerator:
Modified Sharpe Ratio=Rp
σp
5.4 Jenson’s Alpha and Treynor ratio
Based on CAPM, Jensen formulated a portfolio risk measure to quantify portfolioreturns above that predicted by CAPM called α:
α = Rp − [Rf + βp(Rm −Rf )]
Rp=above CAPM predicted portfolio returnβp=portfolio’s beta
One can interpret α as a measure of ”excess returns” or portfolio manager’s investmentability or i.e. ”beating the market”.
The Treynor ratio is a lesser well known portfolio ratio measure, similar to the Sharperatio, but assesses portfolio performance on a CAPM model basis:
Treynor Ratio=Rp −Rf
βp
βp= portfolio βRp=portfolio return
Like the Sharpe ratio, the Treynor ratio can be interpretted as the ”quality” of portfolioreturn for the given level of risk but risk measured on a CAPM theory basis.
5.5 Three Factor Model of Fama and French
The CAPM model is a single factor model that compares a portfolio with the market asa whole. Fama and French modified this model in [6] to take into account 2 empiricalobservations about asset classes that tend to have higher returns:
• small sized companies
• value stocks (companies with high book to market value)
Having a higher return associated with them implies a higher risk premium associatedwith them. The 3 factor model accounts for these higher premiums with the followingequation:
Ra = Rf + βp1(Rm −Rf ) + βp2SMB + βp3HML + ε
ε=error termSMB=difference in return for small and large sized companiesHML=difference in return for high book to market value and
low book to market value companiesβp1, βp2, βp3 are regression slopes
18
Essentially the 3 factor model is a multiple linear regression equation. Jagadeeshand Titman in [16] modify the CAPM model by adding a momentum to account forreturn. Fung and Hsieh in [7] apply both these models to long/short equity hedgefunds, giving regression results.
5.6 Sharpe’s Asset Class Factor Model
Sharpe in [18] invented an asset factor model for risk measurement of Mutual Fundsbut Fung and Hsieh in [8] have applied it to Hedge Funds. This model essentiallysuggests that most Mutual Fund performances can be replicated by a small numberof major asset classes e.g. large capitalisation growth stocks, large capitalisation valuestocks, small capitalisation stocks etc... . Using Fung and Hsieh [8] notation Sharpe’smodel is:
Rp =∑
k
wkFk + ε
subject to:
wk =∑
j
xjλj
ε =∑
j
xjεj
Rp=portfolio returnj=asset classk=total number of asset classesxj=weighting of asset class jλj=factor loading for asset j (change in fund return/change
in asset j return)εj=error term for asset j
Thus Hedge Fund return is a weighted average of a small number of asset classes,rather than a weighted average of a large number of individual asset returns as inMPT.
5.7 VaR (Value at Risk)
VaR (value at risk) was invented by JP Morgan in 1994 as a general risk managementtool and has now become the industry standard for risk. It has become a popular andimportant risk measure primarily because of the Basel Committee, who standardiseinternational banking regulations and practises. Gupta and Liang in [15] applied VaRto Hedge Funds, specifically for assessing a Hedge Fund’s sufficient capital adequecy.
VaR tells us in monetary terms how much one’s portfolio can expect to lose, for agiven cumulative probability and for a given time horizon. For example, for a cumu-lative probability of 99% over a period of 1 day, the VaR amount would tell us theamount by which one would expect the portfolio to lose e.g.$100. Mathematically weexpress this as:
19
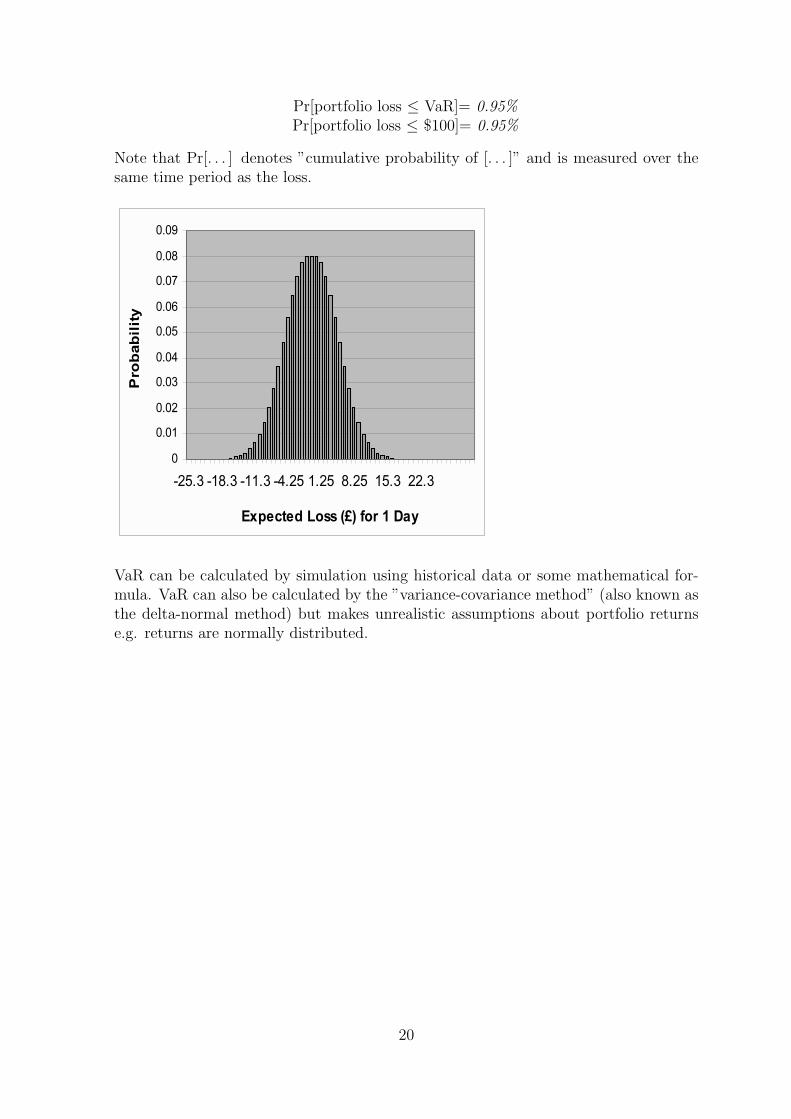
Pr[portfolio loss ≤ VaR]= 0.95%Pr[portfolio loss ≤ $100]= 0.95%
Note that Pr[. . . ] denotes ”cumulative probability of [. . . ]” and is measured over thesame time period as the loss.
VaR can be calculated by simulation using historical data or some mathematical for-mula. VaR can also be calculated by the ”variance-covariance method” (also known asthe delta-normal method) but makes unrealistic assumptions about portfolio returnse.g. returns are normally distributed.
20
6 Problems with Hedge Fund Risk Modelling
Most portfolio risk measures make unrealistic modelling assumptions, particularly withrespect to the assumed return probability distributions for mutual funds. Risk mea-surement assumptions become even more unrealistic for Hedge Funds. We now explainthe difficulties in Hedge Fund risk measurement.
6.1 Non-Normal Return Distribution
As stated by Do et al.[4], Hedge Fund returns do not approximate to normal distribu-tions, thus popular portfolio risk measures (which assume a normal distribution) areinappropriate e.g. Sharpe ratio. Furthermore Fung in [10] shows that the empiricalprobability distribution of monthly returns for Hedge and Mutual Funds differ signifi-cantly.
Fung [10] proposes the reason for a non-normal return distribution is a result of the di-verse trading strategies employed by Hedge Funds. Fung firstly suggests that Mutualsengage in buy-and-hold strategies whereas Hedge Funds engage in much more shorterterm trading strategies. Secondly, Hedge Funds apply substantial leveraging, whereasMutuals have limited or strict regulation on leveraging. Additionally, the relativelyregulation-free investment environment of Hedge Funds leads to complex managementstrategies and high performance incentives -these all affect Hedge Fund returns.
6.2 Investment Strategy and Return Distribution
It has been empirically observed that different investment strategies significantly alterthe return distribution, particularly the means and standard deviation. For examplestandard deviation, a common risk metric, varies from a low 2.1% in market neutralfunds to 16.3% in Global/Macro funds [10]. Consequently, it has been argued it wouldbe better to apply separate risk measures for each Hedge Fund type (according to itsstrategy), rather than treating all Hedge Funds as part of 1 homogenous class.
6.3 Hedge Fund Failure Rate
Hedge fund survival rates are significantly lower than other funds [13] and substantiallyvary; cumulative failure rates after 7 years range from 32-66% depending on the HedgeFund’s size . The table below from the European Central Bank [13] describes this:
21
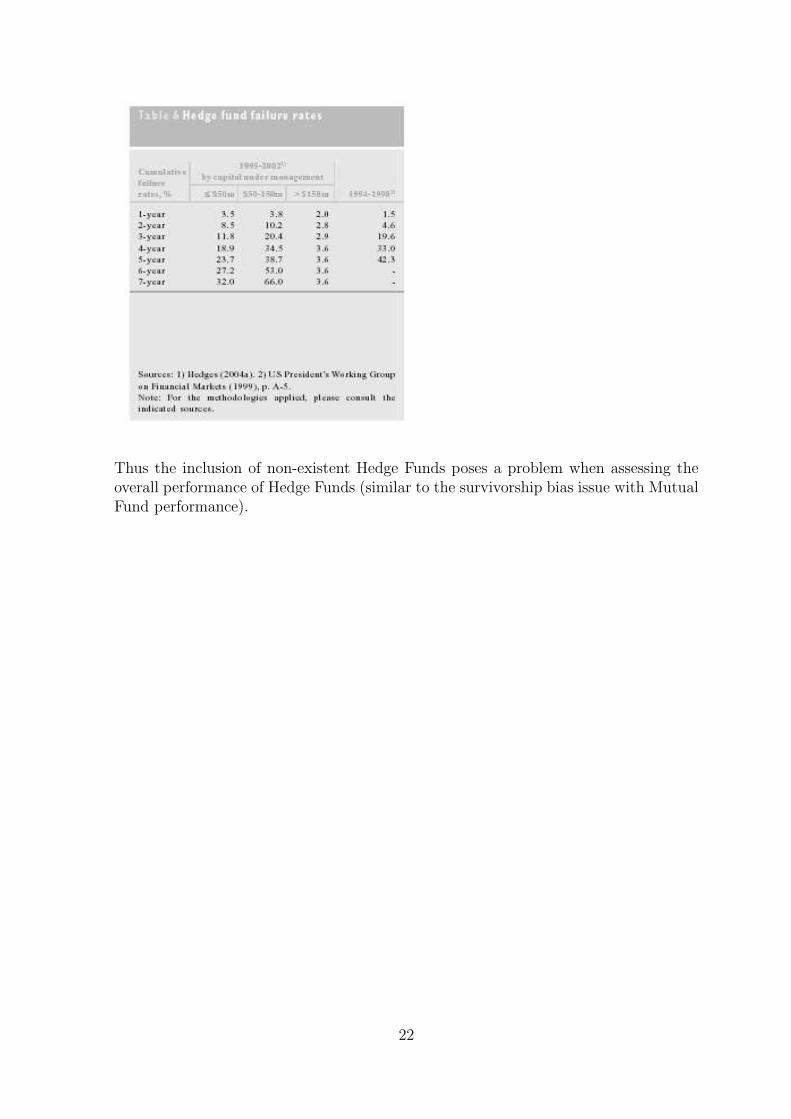
Thus the inclusion of non-existent Hedge Funds poses a problem when assessing theoverall performance of Hedge Funds (similar to the survivorship bias issue with MutualFund performance).
22
7 Hedge Funds Available On The Market
7.1 Close Man Hedge Fund
Close Man Hedge Fund is an absolute return Hedge Fund. This fund applies the marketneutral investment strategy (specifically fixed income arbitrage) by investing solely inCapital Guaranteed Bonds issued by The Royal Bank of Scotland. Thus the fund istheoretically insulated from market risks but can still benefit from price movementsusing a variety of techniques. For this particular fund, Close Man will engage inleveraging and using swaps (a type of derivative) to boost returns.See Close Man’s website http : //www.closefm.com/ for more detail.
7.2 RAB Capital
RAB Capital is a unique Hedge Fund in that it is one of the few UK Hedge Funds (ormore specifically FOHF) that is listed on the London Stock Exchange (ticker symbolRAB.L).Their funds are accessible to the general public rather than high net worthindividuals, although RAB warns ”These funds are not appropriate for a novice in-vestor”. They specialise in a variety of absolute return funds, some of which employthe long-only investment strategy, where assets are bought on the basis that they areconsidered undervalued.See RAB Capital’s website http : //www.rabcap.com/ for more detail.
7.3 Thames River Capital
Thames River Capital is an absolute return based Hedge Fund, offering a range ofregulated and unregulated funds. Each fund uses various investment strategies, rangingfrom Global strategies (see Global Emerging Market Fund) to market neutral strategiesusing high leverage.See Thames River Capital’s wesbite http : //www.thamesriver.co.uk/ for more detail.
7.4 Ikos Hedge Fund
The founder and co-owner of her own hedge fund has made Elena Ambrosiadou oneof the richest women in Britain according to the 2006 Sunday Times Rich List. Thishedge fund engages in ”program trading” whereby trades are executed according to acomputer program. This method of trading has the advantage removing any subjectivedecision making from speculation but can also result in investments that one wouldstrongly and intuitively disapprove. Ikos focus on exchange rate investing but alsospeculate in equities.For more information on Ikos see http : //www.ikosam.com/.
23
8 Famous Hedge Funds Withdrawn From The Mar-
ket
All major funds are susceptible to collapsing, however, in the case of Hedge Funds thisis more frequent and the losses tend to be substantially higher. It is therefore quiteinformative to understand some of the spectacular Hedge Fund losses. We now describesome Hedge Funds that were previously available on the market but have now ceasedtrading.
8.1 George Soros’s Quantum Fund
Perhaps the most famous Hedge Fund investor is Soros, who in 1 day made US$1 billionon Sept 6, 1992 by short selling the British pound. In 1992, England was part of theERM (European Exchange Rate Mechanism) and Soros was able to anticipate the cur-rency devaluation of the British Pound. Consequently by employing the Global/Macroinvestment strategy, Soros managed to net a profit of US$1 billion in 1 day. Howeveryears later, his fund suffered massive losses; in 1998 Russia’s defaulting crisis createda loss of US $2 billion. Then in 2000 Soros withdrew from Hedge Fund investing.
8.2 Long Term Capital Management (LTCM)
Perhaps the most notorious Hedge Fund collapse was in September 1998; LTCM an-nounced it had lost 44% of its investors’ capital in August alone (US$2.1 Billion) [21].For a detailed case study of LTCM see Stonham in [21],[22].
LTCM began trading with over $1 billion of investor capital. LTCM applied the HedgeFund strategy of market neutral investment;LTCM used the method of fixed incomearbitrage, taking advantage of temporary changes in prices.
The market neutral strategy was successful from 1994-98 but in 1998 Russian financialmarkets fell into crisis. However, LTCM speculated that the situation would quicklyreturn back to normal again, so LTCM took large, unhedged positions. Unfortunately,Russia began defaulting on its debts in Aug 1998, causing LTCM to experience lossesapproaching $4 billion as it was significantly exposed to Russian government bonds.The US Federal Government then devised a rescue plan for LTCM to avert a majorUS financial crisis and panic.
8.3 Robertson’s Tiger Management Fund
Robertson’s Hedge Fund invested by going long on undervalued stocks whilst simul-taneously short selling what he considered overvalued stocks. For years this strategywas extremely successful, giving annual returns of 43% from 1980-86, so he continuedapplying this strategy during the technology boom. During the tech boom, Robertsonrightly considered many stocks to be overvalued and so began short selling such stockswith the expectation overvalued stocks would eventually fall. Yet during the tech booma speculation bubble formed, causing the overvalued stocks to continue to rise beyond
24

expectation. Consequently Robertson’s fund collapsed in 2000 after heavy losses, justbefore the speculative bubble itself collapsed.
25
9 The Case For and Against Hedge Funds
Despite the potential to provide substantial returns, it would appear conclusive thatHedge Funds ought to be abolished or at least highly regulated. However the issue is farmore complex than one assumes. We now elaborate on the benefits and disadvantagesof Hedge Funds.
9.1 The Case for Preserving Hedge Funds
Hedge Funds actually provide an economic benefit to markets, in particular they aidprice discovery. It has been argued that Hedge Funds do not engage in ”herd-mentality”trading. Instead they take contrarian positions, unlike Mutual Funds, and they buy/sellassets according to an asset’s perceived fair value.
A second Economic benefit of Hedge Funds is that they aid competition and the Eco-nomic concept of the ”invisible hand” [3]. Hedge Funds thrive on market inefficiencies.As traders do not have instantaneous and costless access to market information, assetmispricing or an arbitrage opportunities must occur e.g. an asset trading in 2 differ-ent markets may have different prices. Hedge Funds take advantage of such arbitrageopportunities and so push prices to their no-arbitrage price.
Another important Economic benefit of Hedge is liquidity provision. Hedge Fundstypically investing in risky assets, so providing much needed capital for investmentsthat many investors would not consider.
Hedge Funds rather than increase risk can actually reduce overall risk. Firstly, HedgeFunds take on more risky investments, thereby absorbing or sharing some of the riskthat would otherwise be absorbed by other funds. Additionally they’re more willingto invest in volatile markets, thereby absorbing the effects of market shocks.
Hedge Funds are important as an investment product in itself. They provide sophis-ticated investors with another vehicle for high returns that would not be available intraditional Mutual Funds [3]. They also provide diversification (a method of reducingrisk without reducing return by investing in more than 1 asset) as they represent a newinvestment group.
A second benefit from a investor’s perspective is that Hedge Funds can provide ”abso-lute” returns. Hedge Funds can achieve this because they pursue a variety of sophisti-cated investment strategies. Traditional Mutual Funds are limited in trading strategiesdue to heavy regulation.
9.2 The Case Against Hedge Funds
Rather than aid market functioning, Hedge Funds have been criticized for doing moreharm than good. Firstly, rather than contrarian investing, Hedge Funds engage in”herding” [3]. Notable examples include the 1992 ERM crisis and the 1997 Asian Cur-rency Crisis.
26
Secondly, it was suggested Hedge Funds provide much needed capital by investing inrisky assets. Yet Hedge Funds have been blamed for exhausting liquidity in the market[3]. Due Hedge Funds typically taking large positions and the trading strategies theypursue, they are unable to make trades without causing a massive price moves due toilliquidity (Fung supports this idea in [11]). Additionally, Hedge Funds usually heavilyleverage, increasing the likelihood of illiquidity within the fund e.g.LTCM. However,Gupta in [15] investigates capital adequacy using VaR (value at risk) measures andconcludes that most Hedge Funds are adequately funded.
Thirdly, Hedge Funds can prevent efficient market functioning by causing market pricedistortions, rather than aiding price discovery. Large volume trades can cause signifi-cant price movements, rather than price movements occurring due to company/economicfundamentals. Fung in [11] cites such examples as the 1992 ERM Crisis but concludesthat Hedge Funds overall do not distort prices beyond their company/economic fun-damentals.
The Hedge Fund as a viable alternative investment product has also been heavilydisapproved. For instance some quotes from leading academics on Hedge Funds:
”If you want to invest in something where they steal your money and dont tell youwhat theyre doing, be my guest., Eugene Fama.
”If there’s a license to steal, it’s in the hedge fund arena”, Burton Malkiel.
In an article in Forbes (May 14 2004) Bernard Condon claims that ”You would dobetter giving your money to a monkey” than investing in Hedge Funds. As a managedinvestment product Hedge Funds command the highest management fees, typicallyaround 20%, compared to mutual funds that normally charge around 1%. Addition-ally Hedge Fund investors have tougher withdrawal constraints.
Secondly as Fama mentions, Hedge Funds have poor transparency. Regulatory bodiessuch as the SEC don’t dictate the same strict rules for Hedge Funds that it does forMutual Funds. There are no rules on publishing records on asset holdings and financialperformance. Lack of transparency increases the chances of investors being unable toeffectively risk assess Hedge Funds.
Finally, Hedge Funds have a higher failure rate than Mutual Funds and thus a highercredit risk. Hedge Fund face less regulation on leveraging and investment strategies,thus are susceptible to a higher probability of default e.g. LTCM. Consequently thereis less likelihood of capital recovery.
27
10 Conclusion
Hedge Funds are clearly a complex and unique investment product that can produceextraordinary gains as well as losses. They have and continue to thrive on the unregu-lated aspects of the business, spawning a variety of innovative investment techniques.It has only been in the past 10 years that regulatory bodies have focussed on HedgeFund regulation to avert previous Hedge Fund disasters e.g. LTCM.
Despite the clear necessity to understand such a powerful investment, knowledge andunderstanding of the Hedge Fund industry remains relatively poor. There is no consen-sus on what specifically defines a Hedge Fund, very little literature is devoted to HedgeFund risk modelling and their various investment techniques. Consequently there is alarge scope for future research into Hedge Fund risk management.
28
References
[1] S.J. Brown. Hedge funds: Omniscient or just plain wrong. Pacific-Basin FinanceJournal, 2001.
[2] D. Capocci and G. Hubner. Analysis of hedge fund performance. Journal ofEmpirical Finance, 2004.
[3] Taylor A. Danielsson, J. and J. Zigrand. Highwaymen or heroes:should hedgefunds be regulated? a survey. Journal of Financial Stability, 2005.
[4] Faff R. Do, V. and J. Wickramanatake. An empirical analysis of hedge fund per-formance: The case of australian hedge funds industry. Journal of MultinationalFinancial Management, 2005.
[5] Mathieson D. Chadha B. Jansen A. Kodres L. Eichengreen, B. and S. Sharma.Hedge fund and financial market dynamics. International Monetary Fund, 1998.
[6] E.F. Fama and K.R. French. Common risk factors in the returns on stocks andbonds. Journal of Financial Economics, 1993.
[7] W. Fung and D.A. Hsieh. JOURNAL OF INVESTMENT MANAGEMENT.
[8] W. Fung and D.A. Hsieh. The Review of Financial Studies.
[9] W. Fung and D.A. Hsieh. Is mean-variance applicable to hedge funds? EconomicLetters, 1998.
[10] W. Fung and D.A. Hsieh. A primer on hedge funds. Journal of Empirical Finance,1999.
[11] W. Fung and D.A. Hsieh. Measuring the market impact of hedge funds. Journalof Empirical Finance, 2000.
[12] W. Fung and D.A. Hsieh. Performance characteristics of hedge funds and com-modity funds: Natural vs. spurious biases. Journal of Financial and QuantitativeAnalysis, 2000.
[13] T. Garbaravicius and F. Dierick. Hedge funds and their implications for financialstability. European Central Bank, Occasional Paper Series, 2005.
[14] Lo A.W. Getmansky, M. and I. Makarov. An econometric model of serial cor-relation and illiquidity in hedge fund returns. Journal of Financial Economics,2004.
[15] A. Gupta and B. Liang. Do hedge funds have enough capital?a value-at-riskapproach. Journal of Financial Economics, 2005.
[16] N. Jagadeesh and S. Titman. Returns to buying winners and selling losers: Im-plications for stock market efficiency. Journal of Finance, 1993.
[17] H Markowitz. Portfolio selection. Journal of Finance,Vol. 7, No. 1,pp. 77-91.,1952.
29
[18] W.F. Sharpe. Journal of Portfolio Management.
[19] W.F. Sharpe. Capital asset prices: A theory of market equilibrium under condi-tions of risk. Journal of Finance, 1964.
[20] W.F. Sharpe. Mutual fund performance. Journal of Business, pp. 119-138, 1966.
[21] P. Stonham. Too close to the hedge:the case of long term capital management lppart one:hedge fund analytics. European Management Journal,Vol. 17,p282-289,1999.
[22] Paul Stonham. Too close to the hedge: The case of long term capital management.part two: Near-collapse and rescue. European Management Journal,Volume 17,Issue 4 ,Pages 382-390, 1999.
30