introduction: bottlenecks - diversify-eu · introduction: bottlenecks growth variation in ongrowing...
TRANSCRIPT
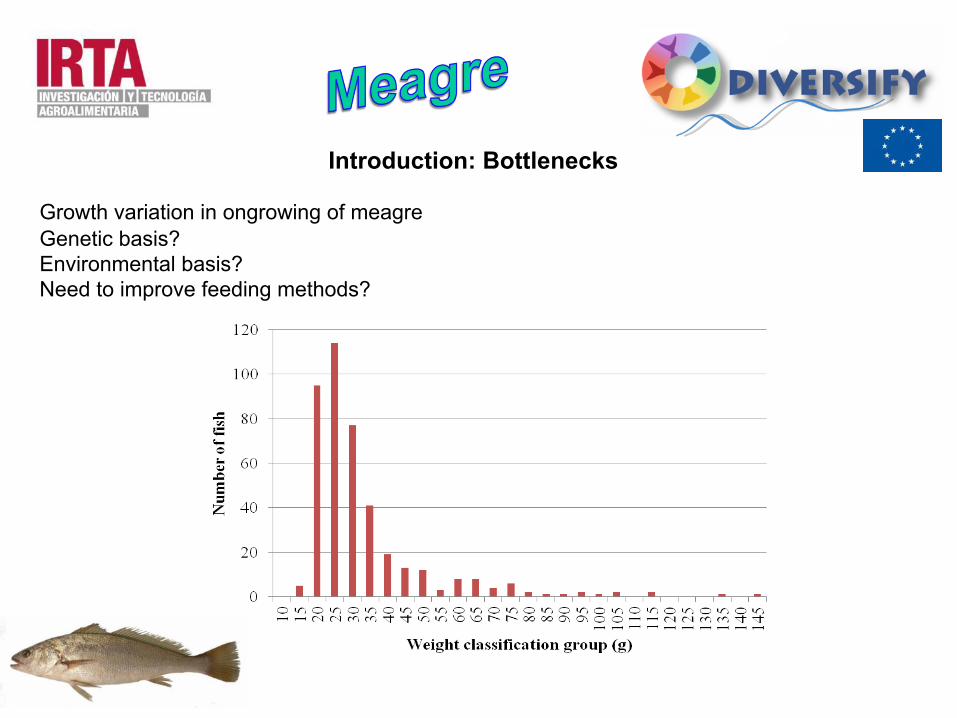
Introduction: Bottlenecks Growth variation in ongrowing of meagre Genetic basis? Environmental basis? Need to improve feeding methods?
Introduction: Demand feeding Demand feeding in Atlantic salmon (Salmo salar): • Improved growth rates, • Improved food conversion ratio (FCR) • Reduced variation in size • Reduced aggression in (Noble et al., 2007, 2008)
Demand feeding in European seabass (Dicentrarchus labrax): • Improved growth rates • Improved FCR (Azzaydi et al., 1998, 2000),
Demand feeding in Atlantic salmon was used to improve feed tables, growth and FCR (Noble et al., 2008) European seabass feeding in relation to feeding rhythms compared to feeding throughout the day gave the same or improved growth and lower FCR (Azzaydi et al., 2000, 1999). Research in cages and tanks on salmon and bass gave similar results.
Azzaydi, et al, 1998. Aquaculture, 163: 285-296 Azzaydi, et al,1999. Aquaculture, 170 253-266 Azzaydi, et al, 2000. Aquaculture, 182: 329-338 Noble, et al, 2007. Aquaculture Res 38, 1686–1691 Noble, et al, 2008. Aquaculture 275, 163-168
Objective: To compare programmed automatic feeding with auto-demand feeding in
tanks.
Conditions to simulate cage rearing conditions (temperature and photoperiod) and programmed automated feeding to follow cage feeding
practices.
Methods
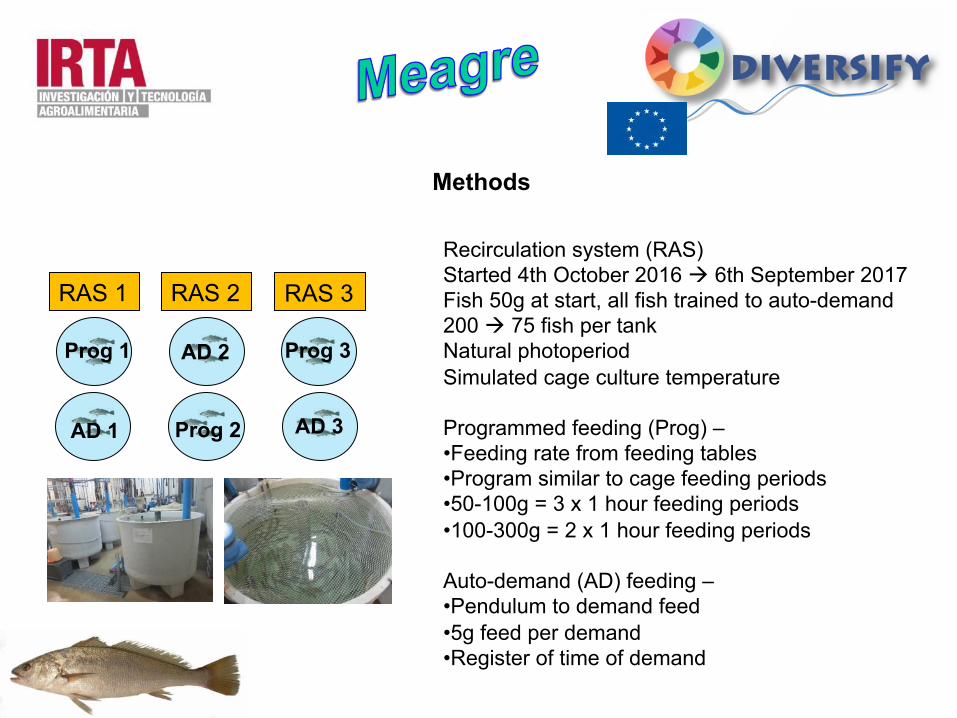
RAS 1 RAS 2 RAS 3
Prog 1
AD 1
Prog 3
Prog 2 AD 3
AD 2
Recirculation system (RAS) Started 4th October 2016 à 6th September 2017 Fish 50g at start, all fish trained to auto-demand 200 à 75 fish per tank Natural photoperiod Simulated cage culture temperature Programmed feeding (Prog) – • Feeding rate from feeding tables • Program similar to cage feeding periods • 50-100g = 3 x 1 hour feeding periods • 100-300g = 2 x 1 hour feeding periods
Auto-demand (AD) feeding – • Pendulum to demand feed • 5g feed per demand • Register of time of demand
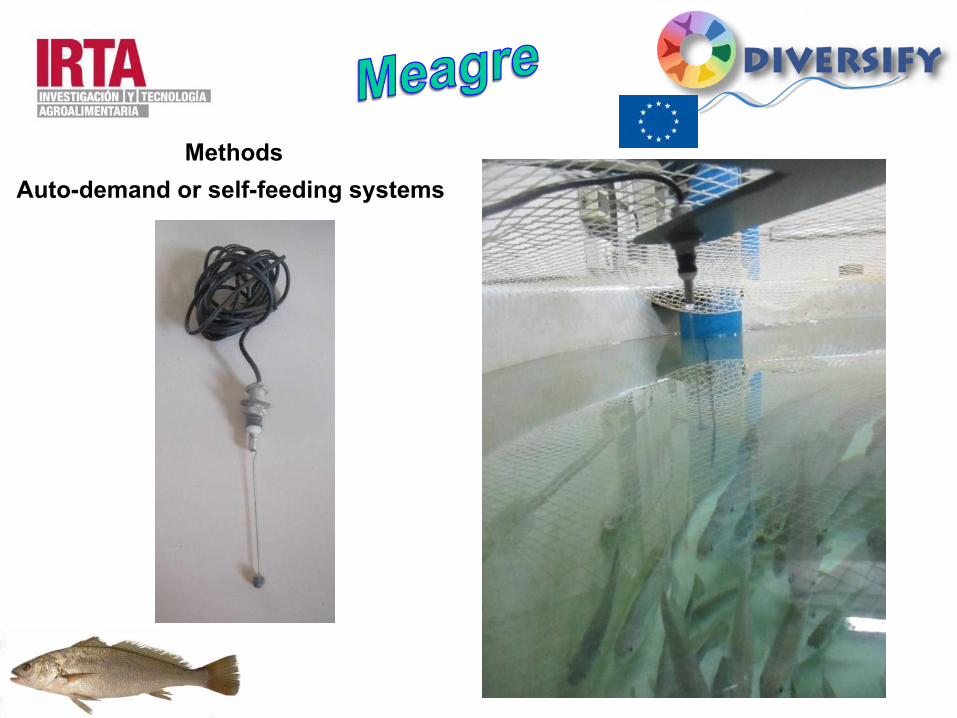
Methods
Auto-demand or self-feeding systems
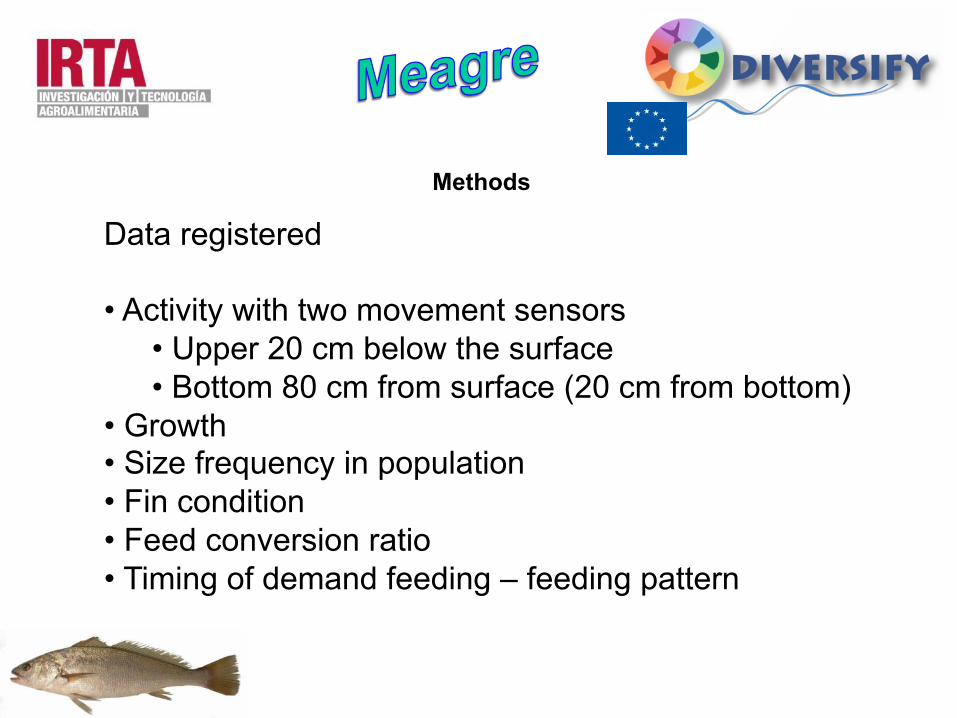
Methods
Data registered
• Activity with two movement sensors • Upper 20 cm below the surface • Bottom 80 cm from surface (20 cm from bottom)
• Growth • Size frequency in population • Fin condition • Feed conversion ratio • Timing of demand feeding – feeding pattern
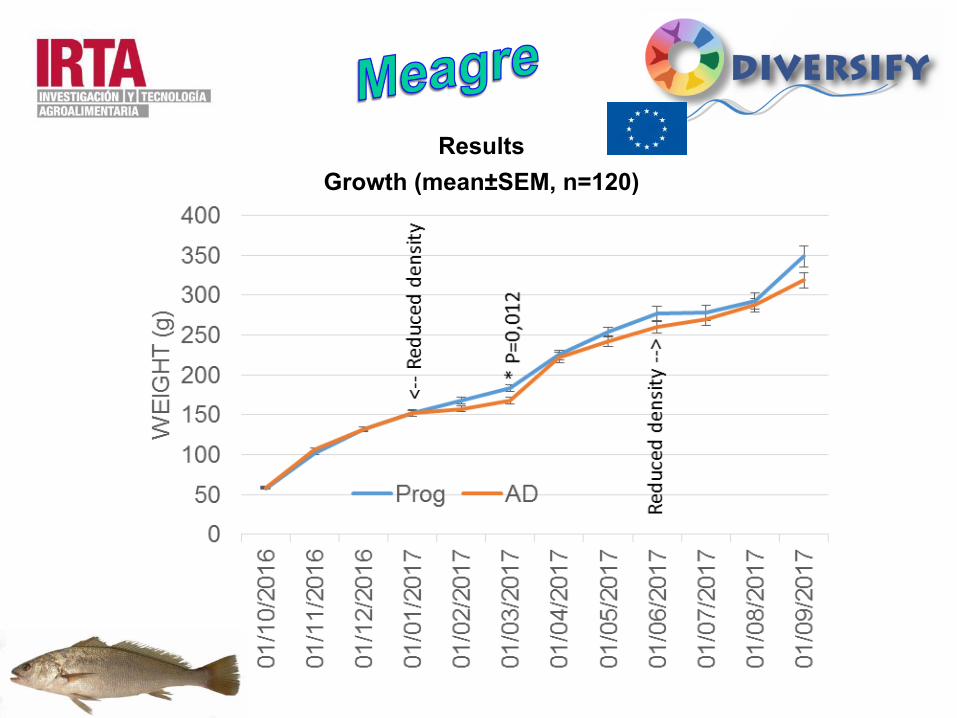
Results Growth (mean±SEM, n=120)
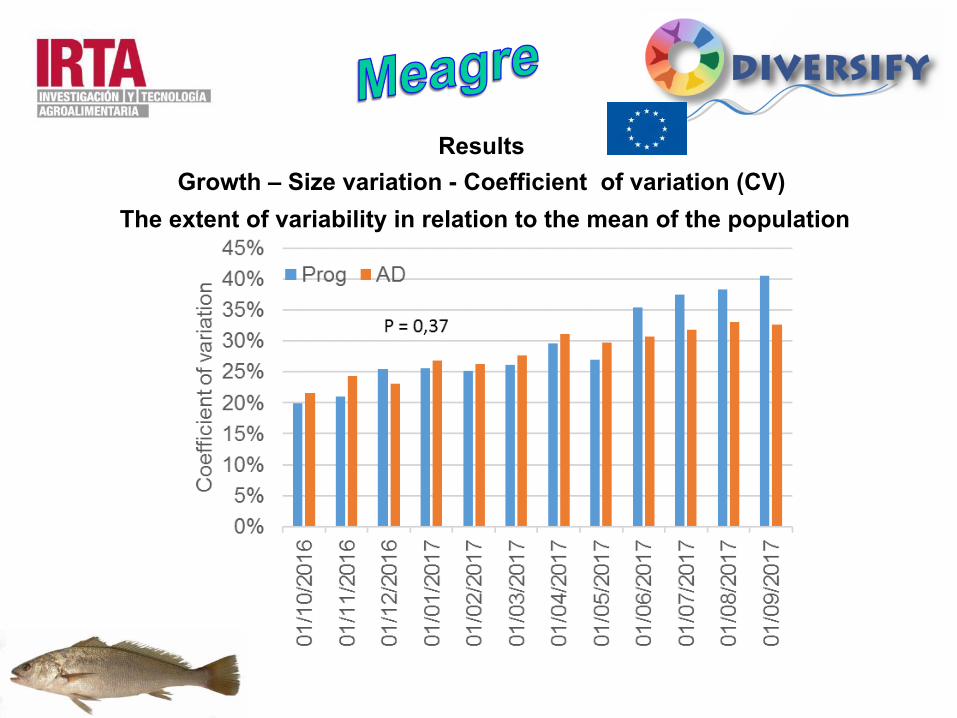
Results Growth – Size variation - Coefficient of variation (CV)
The extent of variability in relation to the mean of the population
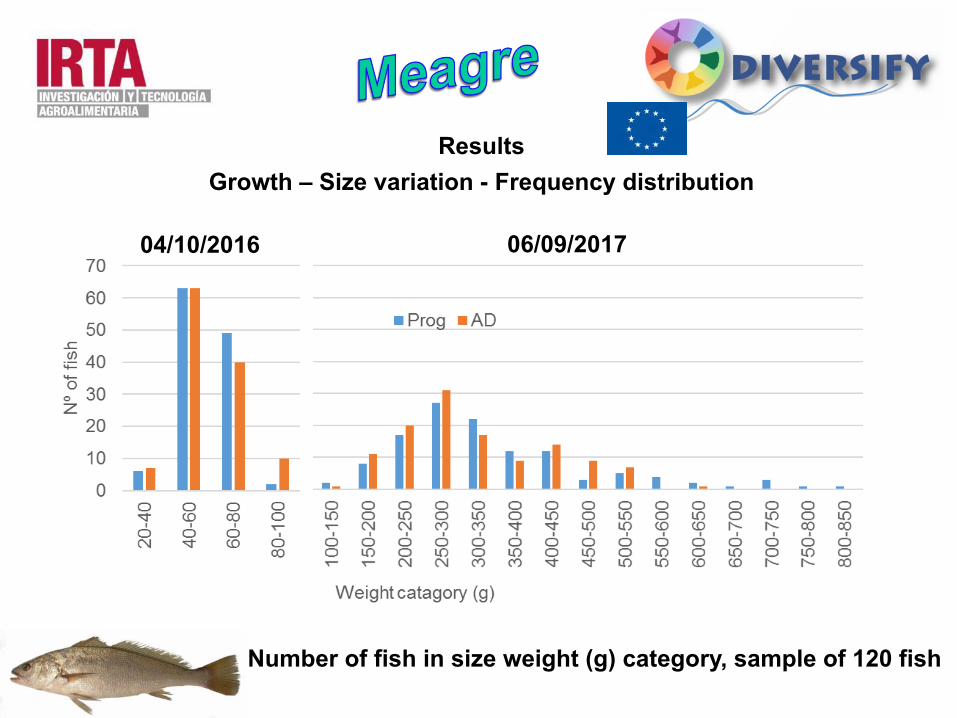
Results Growth – Size variation - Frequency distribution
06/09/2017 04/10/2016
Number of fish in size weight (g) category, sample of 120 fish
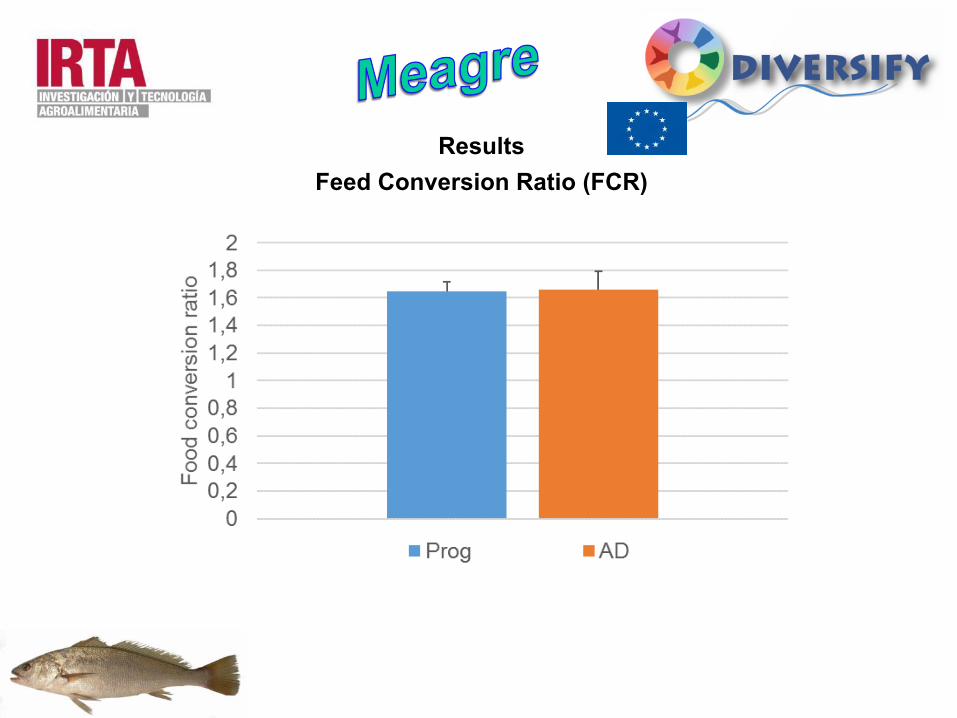
Results Feed Conversion Ratio (FCR)
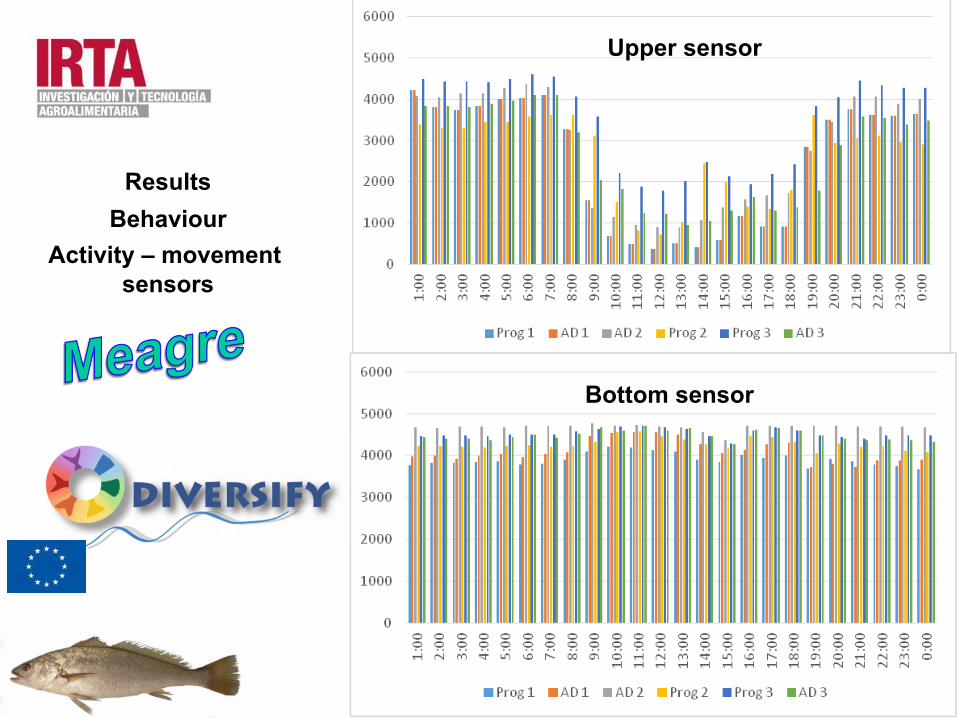
Results
Behaviour Activity – movement
sensors
Upper sensor
Bottom sensor
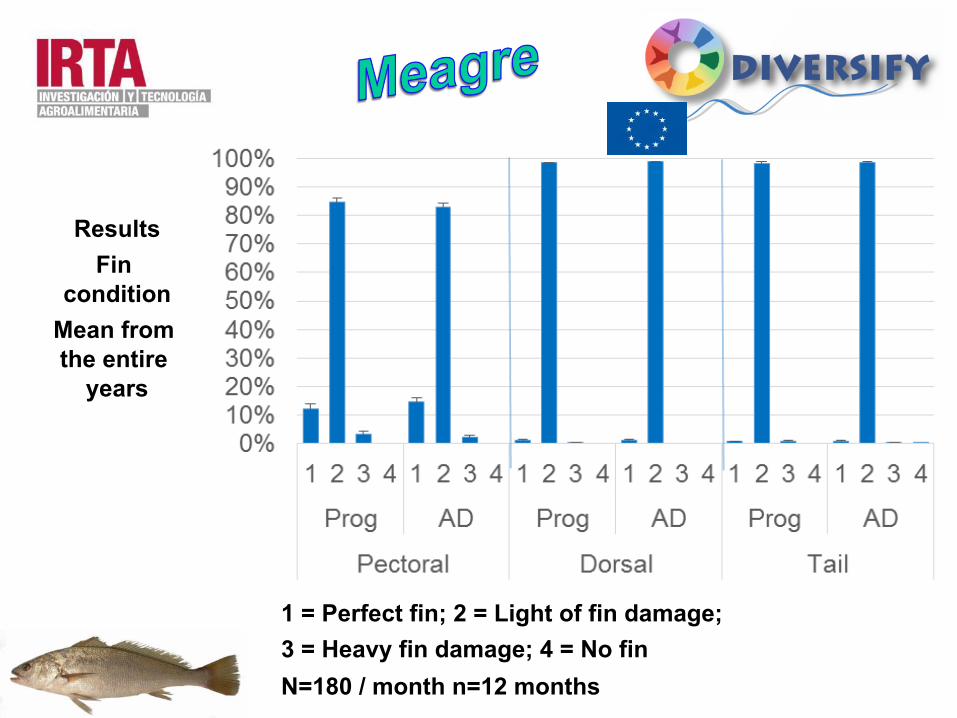
1 = Perfect fin; 2 = Light of fin damage; 3 = Heavy fin damage; 4 = No fin N=180 / month n=12 months
Results Fin
condition Mean from the entire
years
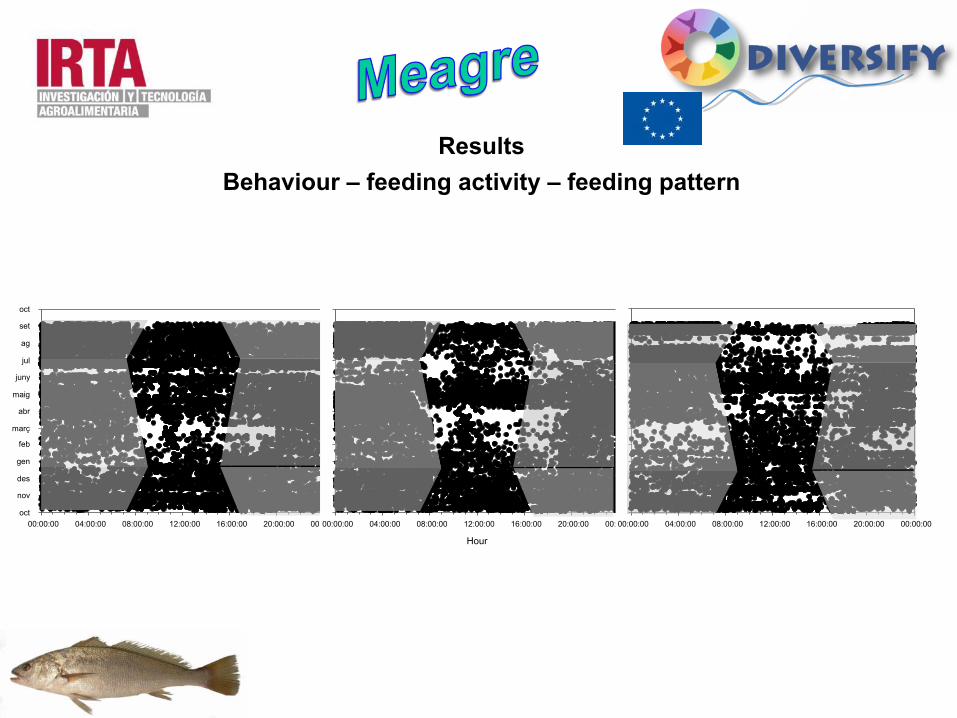
Results Behaviour – feeding activity – feeding pattern
00:00:00 04:00:00 08:00:00 12:00:00 16:00:00 20:00:00 00:00:00oct
nov
des
gen
feb
març
abr
maig
juny
jul
ag
set
oct
Hour
00:00:00 04:00:00 08:00:00 12:00:00 16:00:00 20:00:00 00:00:00 00:00:00 04:00:00 08:00:00 12:00:00 16:00:00 20:00:00 00:00:00
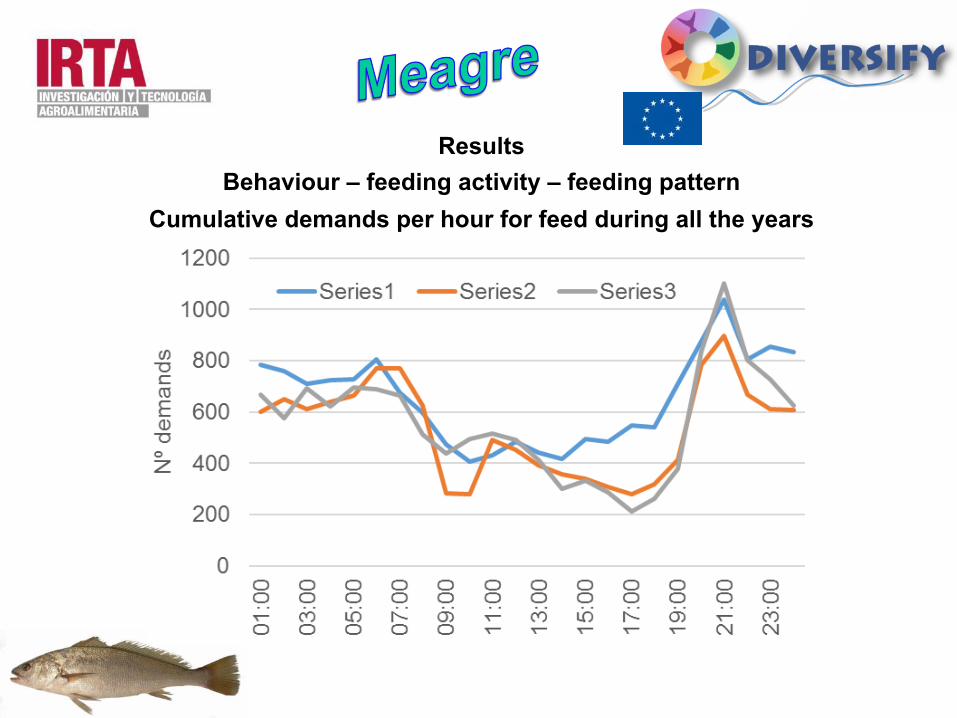
Results Behaviour – feeding activity – feeding pattern
Cumulative demands per hour for feed during all the years
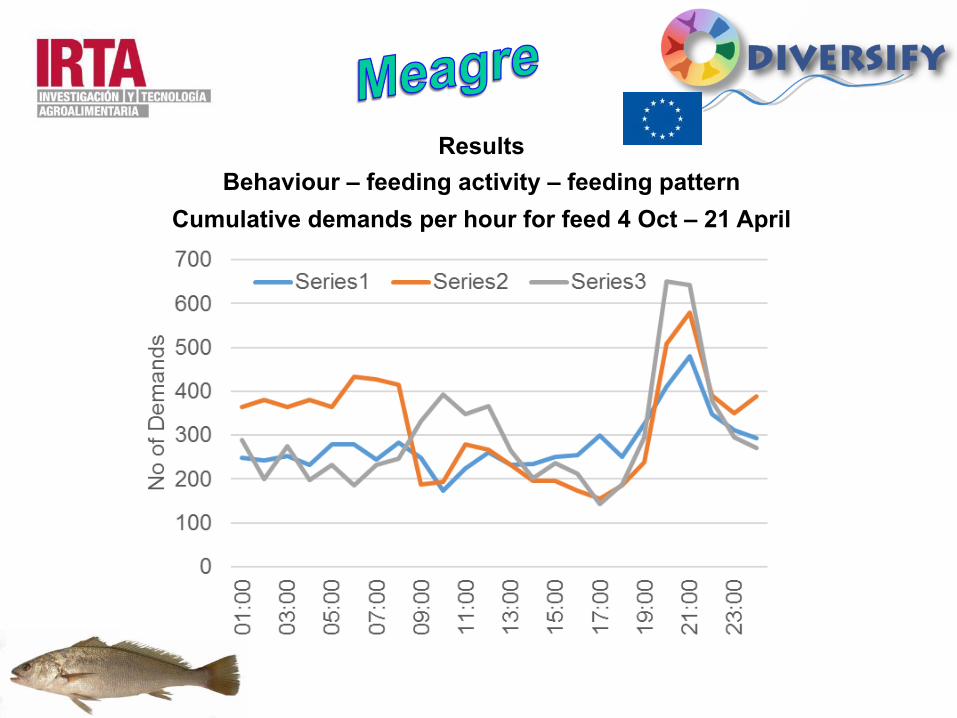
Results Behaviour – feeding activity – feeding pattern
Cumulative demands per hour for feed 4 Oct – 21 April
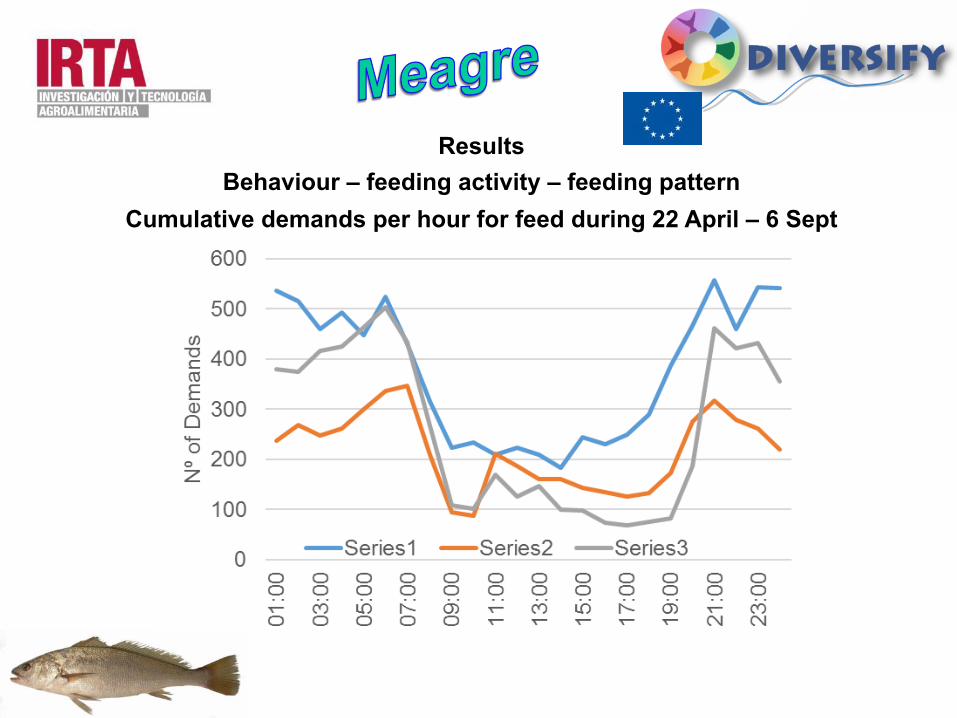
Results Behaviour – feeding activity – feeding pattern
Cumulative demands per hour for feed during 22 April – 6 Sept
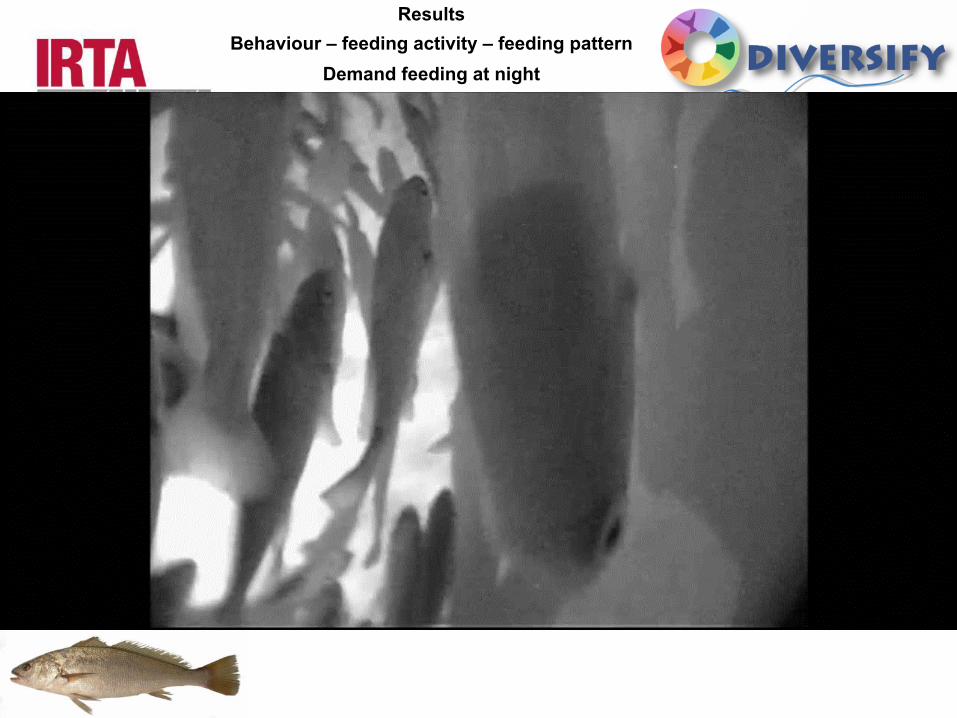
Results Behaviour – feeding activity – feeding pattern
Demand feeding at night
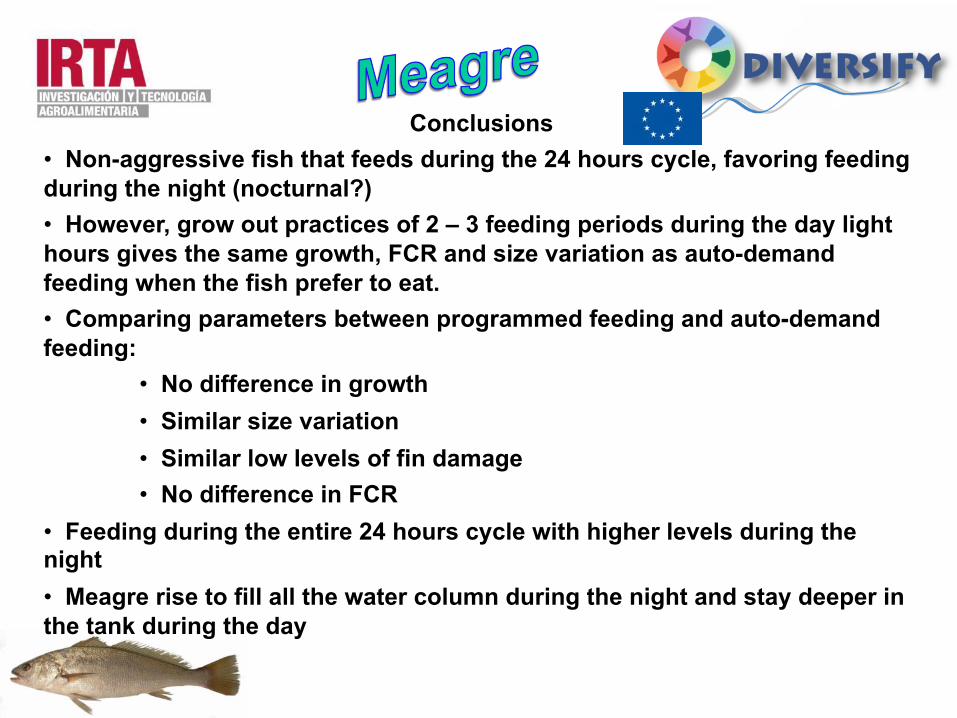
Conclusions • Non-aggressive fish that feeds during the 24 hours cycle, favoring feeding during the night (nocturnal?) • However, grow out practices of 2 – 3 feeding periods during the day light hours gives the same growth, FCR and size variation as auto-demand feeding when the fish prefer to eat. • Comparing parameters between programmed feeding and auto-demand feeding:
• No difference in growth • Similar size variation • Similar low levels of fin damage • No difference in FCR
• Feeding during the entire 24 hours cycle with higher levels during the night • Meagre rise to fill all the water column during the night and stay deeper in the tank during the day
Gracias por su atención El fin.