introduction analysis - manhattan college...team members: brian landvogt, ayesha rima, winnie tam,...
TRANSCRIPT
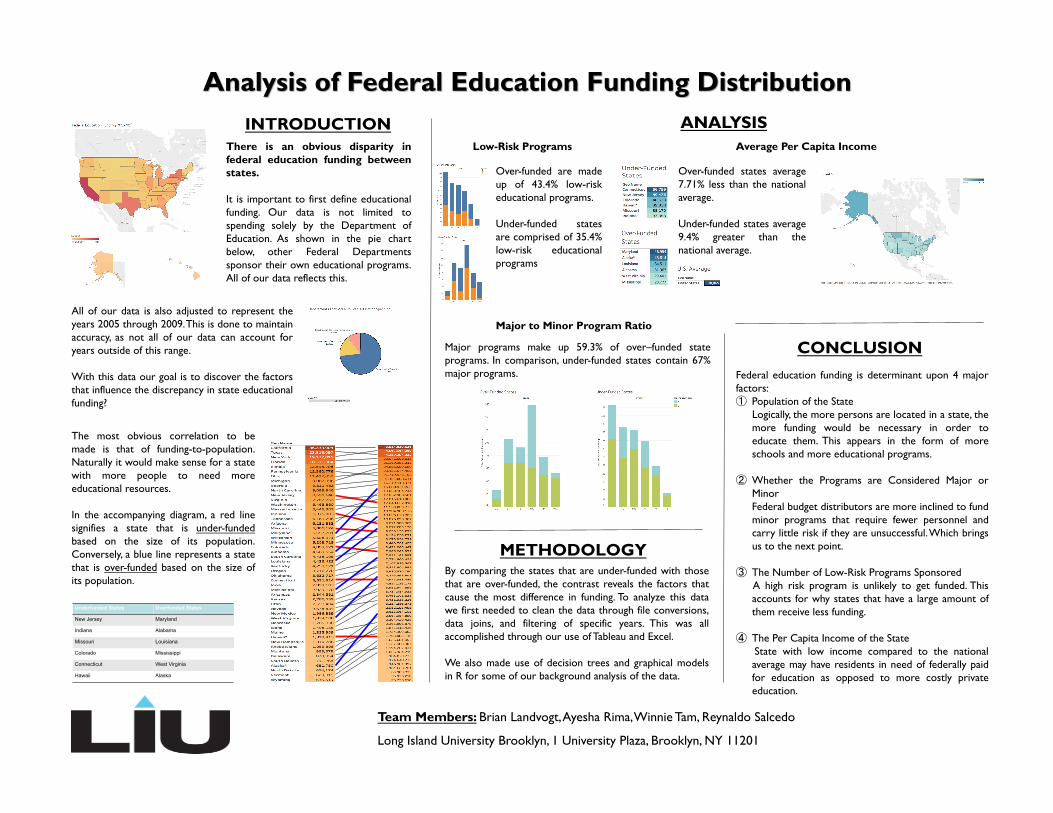
There is an obvious disparity in federal education funding between states.
It is important to first define educational funding. Our data is not limited to spending solely by the Department of Education. As shown in the pie chart below, other Federal Departments sponsor their own educational programs. All of our data reflects this.
Underfunded States Overfunded States
New Jersey Maryland
Indiana Alabama
Missouri Louisiana
Colorado Mississippi
Connecticut West Virginia
Hawaii Alaska
The most obvious correlation to be made is that of funding-to-population. Naturally it would make sense for a state with more people to need more educational resources.
In the accompanying diagram, a red line signifies a state that is under-funded based on the size of its population. Conversely, a blue line represents a state that is over-funded based on the size of its population.
By comparing the states that are under-funded with those that are over-funded, the contrast reveals the factors that cause the most difference in funding. To analyze this data we first needed to clean the data through file conversions, data joins, and filtering of specific years. This was all accomplished through our use of Tableau and Excel.
We also made use of decision trees and graphical models in R for some of our background analysis of the data.
All of our data is also adjusted to represent the years 2005 through 2009. This is done to maintain accuracy, as not all of our data can account for years outside of this range.
With this data our goal is to discover the factors that influence the discrepancy in state educational funding?
Team Members: Brian Landvogt, Ayesha Rima, Winnie Tam, Reynaldo Salcedo
Long Island University Brooklyn, 1 University Plaza, Brooklyn, NY 11201
INTRODUCTION ANALYSIS Low-Risk Programs Average Per Capita Income
Over-funded states average 7.71% less than the national average.
Under-funded states average 9.4% greater than the national average.
Over-funded are made up of 43.4% low-risk educational programs.
Under-funded states are comprised of 35.4% low-risk educational programs
Major to Minor Program Ratio
Major programs make up 59.3% of over–funded state programs. In comparison, under-funded states contain 67% major programs.
CONCLUSION
METHODOLOGY
Federal education funding is determinant upon 4 major factors: ① Population of the State
Logically, the more persons are located in a state, the more funding would be necessary in order to educate them. This appears in the form of more schools and more educational programs.
② Whether the Programs are Considered Major or Minor
Federal budget distributors are more inclined to fund minor programs that require fewer personnel and carry little risk if they are unsuccessful. Which brings us to the next point.
③ The Number of Low-Risk Programs Sponsored A high risk program is unlikely to get funded. This accounts for why states that have a large amount of them receive less funding.
④ The Per Capita Income of the State State with low income compared to the national average may have residents in need of federally paid for education as opposed to more costly private education.