introducing a streamlined life cycle assessment approach for evaluating sustainability in defense...
TRANSCRIPT
Introducing a streamlined life cycle assessment approachfor evaluating sustainability in defense acquisitions
K. A. Scanlon • C. Cammarata • S. Siart
Published online: 5 June 2013
� Springer Science+Business Media New York 2013
Abstract We introduce a methodological approach for
conducting a streamlined life cycle assessment (SLCA) of
defense systems. The approach is recommended for
application in those cases where assessors are faced with
alternative options for the design of a defense system and
where quantitative data describing the system inputs are
limited. Also, it is intended to be used to assist sustain-
ability-minded decision makers, those who recognize the
importance of sustaining resources while preventing
adverse impacts to mission, human health, ecosystem
health, air, water, and land. The approach includes defining
the scope and boundaries of the system, and its alternatives,
inventory data collection, impact assessment, and inter-
pretation. Results from the SLCA can be used to compare
performance of two or more alternatives in terms of
impacts to these areas of concern. The unique features of
this approach include the screening of system processes
using the activity profile, collection of resource input data
for the processes with the greatest potential for impacts,
and application of scoring factors unique to the impact
categories assessed. The approach is rigorous, systematic,
and intended to promote informed acquisition decisions
that consider principles of sustainable design. Future
research activities will include the application of the
methodological approach to acquisitions for defense and
other industries.
Keywords Streamlined life cycle assessment (SLCA) �Acquisition � Energy � Chemicals and materials � Water �Land � Sustainable design
1 Introduction
In this article, we introduce a methodological approach for
conducting a streamlined life cycle assessment (SLCA)
that can be used to promote informed decisions regarding
sustainability in defense acquisitions of weapons systems,
subsystems, or components. Derived from the standardized
method for life cycle assessment (LCA), as documented in
the ISO 14040 series, our SLCA’s intended use is to
identify and help prevent impacts to mission, human
health, and the environment resulting from a system’s life
cycle resource use. The SLCA introduced here is intended
to compare two or more systems, subsystems, or compo-
nents with the same function (e.g., alternatives with similar
expectations of performance) on the basis of potential
mission, human health, and environmental impacts. When
used in early conceptual and design decisions, the SLCA
results can be used to: design new defense systems or
improve on legacy systems undergoing notable modifica-
tions to require less resources over the system’s life cycle;
reduce the likelihood of financial and resource burdens
associated with impacts; or support robust and informed
trade-off analyses. A demonstration of the SLCA approach
introduced in this article will be conducted and docu-
mented in future publications.
Life cycle assessment is used to evaluate and quantify
the flow of substances, specifically materials and energy
inputs and outputs, and environmental releases from the
network of processes that make up a system. It is defined to
include four iterative phases: goal and scope definition, life
Electronic supplementary material The online version of thisarticle (doi:10.1007/s10669-013-9450-9) contains supplementarymaterial, which is available to authorized users.
K. A. Scanlon � C. Cammarata (&) � S. Siart
Concurrent Technologies Corporation, 100 CTC Drive,
Johnstown, PA 15904, USA
e-mail: [email protected]
123
Environ Syst Decis (2013) 33:209–223
DOI 10.1007/s10669-013-9450-9
cycle inventory analysis, life cycle impact assessment, and
interpretation (ISO 2006). An LCA can be both time and
resource intensive, as data collection for inventory analyses
and implementation of characterization factors for impact
assessment models can take months to complete. Such
characteristics make traditional LCA unworkable under the
resource-constrained and time-limited realities imposed on
defense acquisitions personnel.
Although LCAs are often impractical for use during
defense acquisition decision making, the results of such
studies could serve as critical data points used to inform
trade-off analyses in early design and technology devel-
opment activities. Such information could help personnel
involved with defense acquisitions to identify design
alternatives that present lower risk to military operations
and human and environmental health. These impacts often
result in hidden costs (e.g., medical monitoring, environ-
mental controls, remediation, convoys for fuel and water)
for operators downstream from production, and such costs
are rarely accounted for in acquisition cost estimates.
Identification of potential life cycle impacts during design
and technology development provides acquisition person-
nel with the opportunity to design out these risks, ulti-
mately resulting in reduced life cycle costs.
Our proposed SLCA differs from LCA in its approach to
scope, data requirements, and the range of impacts asses-
sed. In keeping with the criteria for SLCA promoted by
Todd and Curran (1999), the approach introduced in this
article is rigorous, systematic, and designed to provide
sufficient information for comparative decision support.
The methodological approaches for LCA and SLCA are
viewed as points on a continuum and the use of SLCA does
not preclude assessors from conducting an LCA (Todd and
Curran 1999; Hochschorner and Finnveden 2003). If
resources are available, an LCA may be conducted in lieu
of, or in addition to, the SLCA. However, unlike the
standardized method for LCA documented in the ISO
14040 series, a prescriptive or standardized method for
SLCA does not exist. Streamlined life cycle assessments
using varying methodological approaches have been
defined, documented, and implemented in practice (Todd
and Curran 1999; Graedel et al. 2005). For example, Gra-
edel et al. (2005) developed semi-quantitative assessment
matrices to perform SLCAs of four helicopters and the
principal subsystems (e.g., airframe, electronics) compos-
ing the helicopters. The matrices addressed the perfor-
mance of the systems and subsystems in two dimensions:
concerns for the environment (e.g., energy use and pro-
duction of solid or liquid residues) and life cycle stages
(e.g., manufacture or delivery of products). Assessors
assigned each element in the matrix a rating on a scale to
indicate impacts, the results of which were used to produce
an aggregate SLCA for the system.
The methodological approach for SLCA introduced in
this article produces results that can be used to compare the
performance of two or more alternatives on a relative scale
and describe the magnitude of difference between or
among alternatives in terms of impacts to mission, human
health, or environment. Traditional LCA is time and
resource intensive because it requires analysts to collect
inventory data on inputs and outputs for each process
within the system being assessed. The proposed SLCA
approach simplifies the traditional approach by using
scoring factors, representing relevant emission and impact
characterization factors, to characterize an inventory of
inputs into specified impact categories without the need to
collect process-level inventory data. The SLCA allows
analysts to directly translate a database of inputs, which
can be collected from multiple sources (e.g., bill of mate-
rials, material safety datasheets) into units of impact that
can be compared among other alternative systems.
The units of impact are relative units and should only be
used for relative comparisons between two or more sys-
tems. Unlike traditional LCA techniques established under
the ISO 14040 series, users should not interpret the results
of a SLCA as absolute values. Instead, the resulting impact
values from the SLCA model represent each alternative’s
position, relative to all other alternatives, for a specified
impact category. These impact categories represent the
following areas of concern: mission, human health, eco-
system health, air, water, and land. An area of concern
represents a prevention point, an area where potential harm
can be minimized and protection of areas worth main-
taining can be maximized. The impact categories and areas
of concern are similar to those commonly assessed in
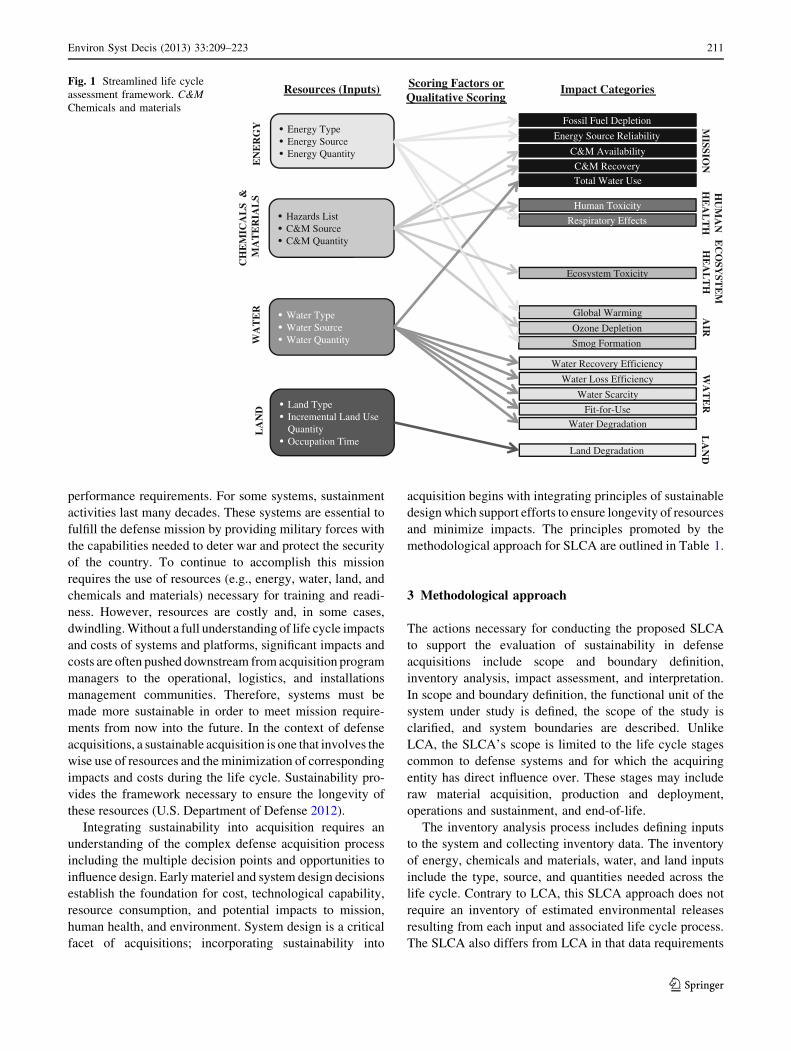
published LCA studies (Bare and Gloria 2008). Figure 1
illustrates the SLCA framework.
The impact categories in the right column of Fig. 1
represent the type of impacts that can result from resource
use and the environmental releases caused by such resource
use. For example, the type and quantity of energy used by a
system throughout its life cycle (resource input) will result
in greenhouse gas (GHG) emissions, which translate into
some amount of global warming (impact category).
The SLCA framework was developed for evaluation of
defense acquisitions. However, the life cycle stages and
impacts outlined in the framework are not unique to
defense acquisitions. Application of this approach to
evaluate acquisition sustainability in other industry and
government sectors is encouraged.
2 Background
Acquisition managers are responsible for acquiring defense
systems, subsystems, or components capable of meeting
210 Environ Syst Decis (2013) 33:209–223
123
performance requirements. For some systems, sustainment
activities last many decades. These systems are essential to
fulfill the defense mission by providing military forces with
the capabilities needed to deter war and protect the security
of the country. To continue to accomplish this mission
requires the use of resources (e.g., energy, water, land, and
chemicals and materials) necessary for training and readi-
ness. However, resources are costly and, in some cases,
dwindling. Without a full understanding of life cycle impacts
and costs of systems and platforms, significant impacts and
costs are often pushed downstream from acquisition program
managers to the operational, logistics, and installations
management communities. Therefore, systems must be
made more sustainable in order to meet mission require-
ments from now into the future. In the context of defense
acquisitions, a sustainable acquisition is one that involves the
wise use of resources and the minimization of corresponding
impacts and costs during the life cycle. Sustainability pro-
vides the framework necessary to ensure the longevity of
these resources (U.S. Department of Defense 2012).
Integrating sustainability into acquisition requires an
understanding of the complex defense acquisition process
including the multiple decision points and opportunities to
influence design. Early materiel and system design decisions
establish the foundation for cost, technological capability,
resource consumption, and potential impacts to mission,
human health, and environment. System design is a critical
facet of acquisitions; incorporating sustainability into
acquisition begins with integrating principles of sustainable
design which support efforts to ensure longevity of resources
and minimize impacts. The principles promoted by the
methodological approach for SLCA are outlined in Table 1.
3 Methodological approach
The actions necessary for conducting the proposed SLCA
to support the evaluation of sustainability in defense
acquisitions include scope and boundary definition,
inventory analysis, impact assessment, and interpretation.
In scope and boundary definition, the functional unit of the
system under study is defined, the scope of the study is
clarified, and system boundaries are described. Unlike
LCA, the SLCA’s scope is limited to the life cycle stages
common to defense systems and for which the acquiring
entity has direct influence over. These stages may include
raw material acquisition, production and deployment,
operations and sustainment, and end-of-life.
The inventory analysis process includes defining inputs
to the system and collecting inventory data. The inventory
of energy, chemicals and materials, water, and land inputs
include the type, source, and quantities needed across the
life cycle. Contrary to LCA, this SLCA approach does not
require an inventory of estimated environmental releases
resulting from each input and associated life cycle process.
The SLCA also differs from LCA in that data requirements
• Energy Type• Energy Source• Energy Quantity
• Hazards List• C&M Source• C&M Quantity
• Water Type• Water Source• Water Quantity
• Land Type• Incremental Land Use
Quantity• Occupation Time
EN
ER
GY
CH
EM
ICA
LS
&M
AT
ER
IAL
SW
AT
ER
LA
ND
Fossil Fuel Depletion
Energy Source Reliability
C&M Availability
C&M Recovery
Total Water Use
Global Warming
Ozone Depletion
Water Recovery Efficiency
Water Loss Efficiency
Water Scarcity
Fit-for-Use
Water Degradation
Land Degradation
Human Toxicity
Respiratory Effects
Ecosystem Toxicity
Resources (Inputs) Scoring Factors or Qualitative Scoring
Impact CategoriesM
ISSION
HU
MA
N
HE
AL
TH
EC
OSY
STE
M
HE
AL
TH
AIR
WA
TE
RL
AN
D
Smog Formation
Fig. 1 Streamlined life cycle
assessment framework. C&MChemicals and materials
Environ Syst Decis (2013) 33:209–223 211
123
are flexible. Quantitative legacy data are preferred for
inventory development; however, the SLCA approach is
robust even when using estimates based on a qualitative
scale (e.g., best to worst).
In the impact assessment phase, energy, chemicals and
materials, and land inputs are translated into impacts using
scoring factors. The SLCA uses these scoring factors to
classify the inventory of inputs into impact categories and
to determine the magnitude of impact. The methodologies
for deriving these scoring factors differ for each input type
and are summarized in Sect. 3.3.
Some impact categories (e.g., water degradation,
chemicals and materials availability, and energy source
reliability assessed using the SLCA methodology) do not
require scoring factors when characterizing impact from
inputs. Scoring factors for these impact categories are not
needed for one of two reasons: (1) Regardless of the
resulting impacts to human health and the environment, the
quantity of resources used by the system is itself a mission
impact and can be characterized by comparing the total
quantity of each resource consumed; or (2) many of the
impact categories (i.e., all water categories) use a qualita-
tive scoring framework for characterizing impact.
As a final phase in the SLCA, the results from the impact
assessment are interpreted and alternatives are compared on
a relative scale. Results from the SLCA are amenable to
visual presentation using radar charts to illustrate relative
impact values and the magnitude of the impacts.
3.1 Scope and boundary definition
Similar to LCA, our SLCA limits the scope of the analysis to
a predetermined functional unit, which is defined by the
function or performance characteristics of the system under
Table 1 Principles of sustainable design
Principles of sustainable design
Use low-impact materials that are… Non-toxic, as designated by the US Environmental Protection Agency (EPA);
From life cycle-enhancing renewable sources;
From local or regional sources (with regard to where the system is manufactured or assembled); and
Composed of recycled materials that require less energy to process than non-recycled substitute
materials
Optimize system-wide energy
consumption by…Reducing the fully burdened cost of delivered energy;
Designing manufacturing and assembly processes that minimize energy consumption;
Designing systems that employ energy efficiency technologies during the use stage of the life cycle;
Developing end-of-life scenarios for which systems can be easily disposed, recycled or reused with
minimal energy input; and
Using life cycle-enhancing renewable sources of energy
Improve system and component
design by…Extending the expected life of components and minimizing maintenance activities and materials by
improving durability;
Standardizing component function for reuse in newer versions of that same system or for reuse in
other similar systems; and
Minimizing the use of designs that far exceed specifications when such designs require additional
materials and energy and result in excess waste and pollution and when less impactful alternative
designs adequately achieve all specifications
Minimize life cycle waste by… Reusing waste materials from manufacturing, use and end-of-life activities;
Reusing system components with a longer lifetime than the systems they compose and recycling
materials to create new system components;
Increasing the life of a system through rigorous maintenance and repair schedules;
Developing waste-to-fuel capabilities; and
Integrating closed-loop system design
Minimize life cycle pollution by… Reducing the use of hazardous materials and fossil fuel energy sources that lead to pollution
emissions;
Engaging in pretreatment activities that mitigate pollution emissions; and
Collecting and treating pollution emissions before they enter the surrounding community or
ecosystem
Minimize risks to human health and the
environment by…Designing out known chemical, biological and physical hazards (including noise, radiation,
and ergonomic stressors) when technologically feasible; and
Ensuring that workplace and environmental exposures to known hazards are inherently safe
or below recognized limits
212 Environ Syst Decis (2013) 33:209–223
123
study. The primary purpose of a functional unit is to provide a
reference for which the resource requirements and resulting
impacts of a specified system are related. This reference is
necessary to ensure comparability of results across alterna-
tive systems. Being a relative analysis, comparability of
results for the SLCA is critical to ensure that comparisons are
made on a common basis. As with LCA, the functional unit
should be the same for all alternatives being evaluated.
With respect to defense acquisition, the functional unit
should be defined by the minimal requirements to meet the
stated capabilities or performance requirements necessary to
fulfill the mission. For example, if the system is required to
transport 100 combat vehicles a distance of 200 miles, then
the functional unit for the evaluation would be the transport
of 100 combat vehicles 200 miles. If the system is to meet a
capability over a 50-year period, then the functional unit
should also include this time component. For example,
consider Alternative 1, which has an expected life span of
25 years. Including this time element implies that two units
of Alternative 1 would be needed to meet the capability
requirement of 50-year life span. To demonstrate the
importance of incorporating this element of time, consider
Alternative 2 that has life span of 50 years, but the life cycle
impacts are greater than Alternative 1. When considering
that two units of Alternative 1 are needed to meet the capa-
bility, the cumulative impacts of selecting Alternative 1 may
be greater than the impacts of Alternative 2. The time and
number of mission tasks needed to fulfill a desired capability
can greatly influence the impact assessment.
In addition to the functional unit, an assessor conducting
the SLCA must also define the scope of the analysis. The
scope, which is informed by the functional unit, defines the
defense system, subsystem, or component to be included in
the SLCA and focuses on aspects of the acquired asset that
result in incremental differences in cost and impact. The
scope for each alternative should include all incremental
materiel, support, and sustainment needed to fulfill the
capability or performance requirement. For example, the
capability can be met by the acquisition of a missile, but
the newly acquired missile cannot be deployed using
existing launching platforms, and a new launching platform
must be acquired. Extending the SLCA scope to include
the launching platform ensures that all incremental impacts
(e.g., land use for the new platform) are included. The
defined scope should be the same for all alternatives being
assessed.
The system boundaries must be defined to ensure a fair
comparison among competing alternatives and limit the
scope of the study to inputs that result in the greatest impact.
The system boundaries determine the life cycle stages
included in the evaluation. A clear definition of the system
boundaries enables a better assessment for each alternative’s
impacts, while also ensuring an equitable comparison
between or among alternatives. Ideally, the boundaries
should include processes, products, infrastructure, and
activities from cradle (i.e., resource extraction and process-
ing) to grave (i.e., disposal). System boundaries that include
cradle-to-grave life cycle stages ensure that all impacts of an
alternative are accounted for and included in the evaluation.
However, situations may arise when it is appropriate to
exclude some life cycle stages from the system boundaries.
In these situations, assessors must ensure that the same life
cycle stages are excluded for alternatives in the evaluation.
3.2 Life cycle inventory analysis
The inventory analysis for the SLCA includes completing a
life cycle activity profile to identify key system inputs and life
cycle stages and then collecting data on a defense system’s life
cycle resource requirements for energy, chemicals and
materials, water, and land. The activity profile is a screening
tool that guides SLCA data collection by identifying the
resources a weapon system needs and the life cycle stages
during which those resources are being consumed. The
activity profile identifies those processes expected to drive
impacts and it narrows the data collection requirements.
Streamlined life cycle assessment assessors should com-
plete the activity profile for each alternative being consid-
ered. To complete an activity profile, assessors classify the
processes within the system boundary into one of four
activity descriptor classes: (1) active and stationary systems;
(2) active and mobile systems; (3) passive and stationary
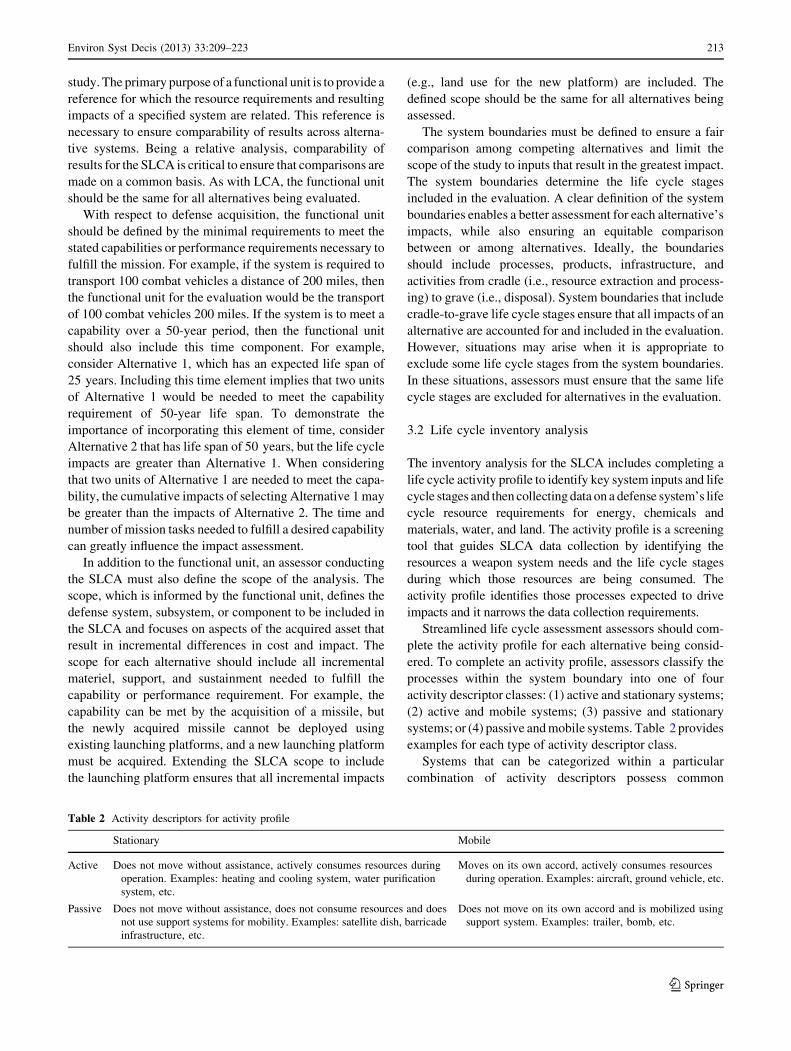
systems; or (4) passive and mobile systems. Table 2 provides
examples for each type of activity descriptor class.
Systems that can be categorized within a particular
combination of activity descriptors possess common
Table 2 Activity descriptors for activity profile
Stationary Mobile
Active Does not move without assistance, actively consumes resources during
operation. Examples: heating and cooling system, water purification
system, etc.
Moves on its own accord, actively consumes resources
during operation. Examples: aircraft, ground vehicle, etc.
Passive Does not move without assistance, does not consume resources and does
not use support systems for mobility. Examples: satellite dish, barricade
infrastructure, etc.
Does not move on its own accord and is mobilized using
support system. Examples: trailer, bomb, etc.
Environ Syst Decis (2013) 33:209–223 213
123
characteristics that can be used to filter the data collection
process. By defining and classifying activity descriptors for
each alternative system, assessors can better identify the
processes and life cycle stages that consume the most
energy, chemicals and materials, land, and water resources,
and, therefore, better focus finite resources for data col-
lection on system inputs that characterize the greatest
amount of impact. For example, assets that are both mobile
and active typically have high energy consumption during
the use stage of the life cycle and require more intensive
sustainment support due to system wear. Conversely, assets
that are stationary and active may still have high energy
demands during the use stage, but may have significantly
lower sustainment requirements due to less system wear.
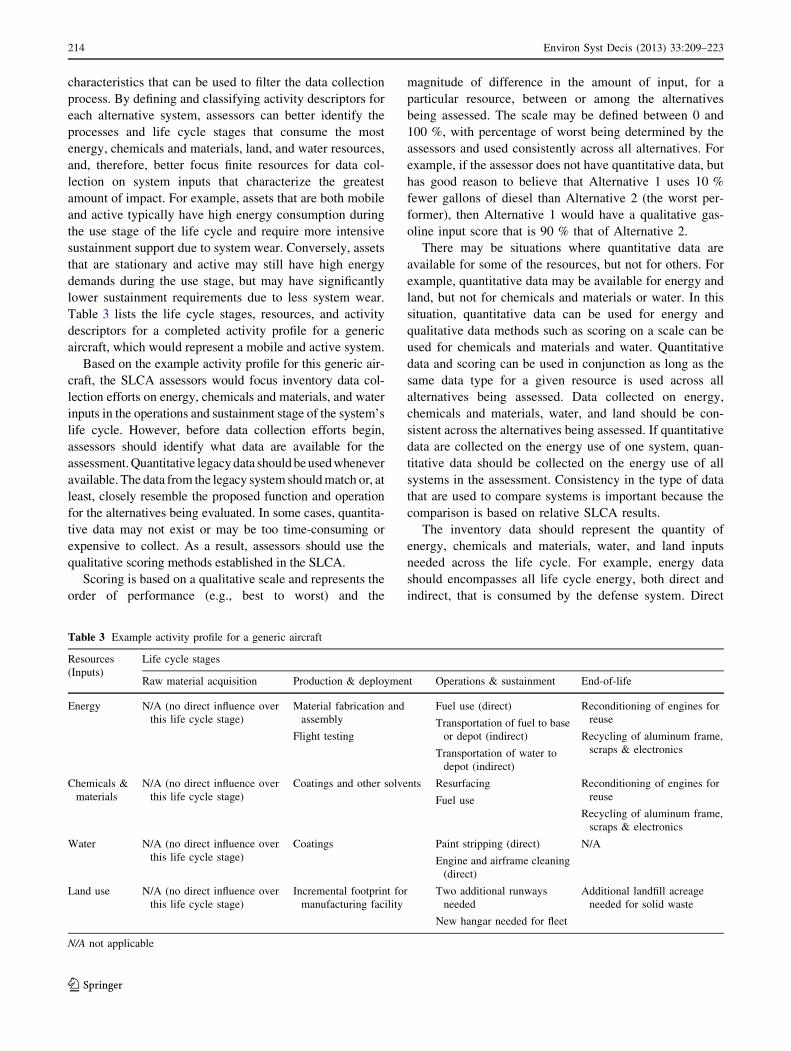
Table 3 lists the life cycle stages, resources, and activity
descriptors for a completed activity profile for a generic
aircraft, which would represent a mobile and active system.
Based on the example activity profile for this generic air-
craft, the SLCA assessors would focus inventory data col-
lection efforts on energy, chemicals and materials, and water
inputs in the operations and sustainment stage of the system’s
life cycle. However, before data collection efforts begin,
assessors should identify what data are available for the
assessment. Quantitative legacy data should be used whenever
available. The data from the legacy system should match or, at
least, closely resemble the proposed function and operation
for the alternatives being evaluated. In some cases, quantita-
tive data may not exist or may be too time-consuming or
expensive to collect. As a result, assessors should use the
qualitative scoring methods established in the SLCA.
Scoring is based on a qualitative scale and represents the
order of performance (e.g., best to worst) and the
magnitude of difference in the amount of input, for a
particular resource, between or among the alternatives
being assessed. The scale may be defined between 0 and
100 %, with percentage of worst being determined by the
assessors and used consistently across all alternatives. For
example, if the assessor does not have quantitative data, but
has good reason to believe that Alternative 1 uses 10 %
fewer gallons of diesel than Alternative 2 (the worst per-
former), then Alternative 1 would have a qualitative gas-
oline input score that is 90 % that of Alternative 2.
There may be situations where quantitative data are
available for some of the resources, but not for others. For
example, quantitative data may be available for energy and
land, but not for chemicals and materials or water. In this
situation, quantitative data can be used for energy and
qualitative data methods such as scoring on a scale can be
used for chemicals and materials and water. Quantitative
data and scoring can be used in conjunction as long as the
same data type for a given resource is used across all
alternatives being assessed. Data collected on energy,
chemicals and materials, water, and land should be con-
sistent across the alternatives being assessed. If quantitative
data are collected on the energy use of one system, quan-
titative data should be collected on the energy use of all
systems in the assessment. Consistency in the type of data
that are used to compare systems is important because the
comparison is based on relative SLCA results.
The inventory data should represent the quantity of
energy, chemicals and materials, water, and land inputs
needed across the life cycle. For example, energy data
should encompasses all life cycle energy, both direct and
indirect, that is consumed by the defense system. Direct
Table 3 Example activity profile for a generic aircraft
Resources
(Inputs)
Life cycle stages
Raw material acquisition Production & deployment Operations & sustainment End-of-life
Energy N/A (no direct influence over
this life cycle stage)
Material fabrication and
assembly
Flight testing
Fuel use (direct)
Transportation of fuel to base
or depot (indirect)
Transportation of water to
depot (indirect)
Reconditioning of engines for
reuse
Recycling of aluminum frame,
scraps & electronics
Chemicals &
materials
N/A (no direct influence over
this life cycle stage)
Coatings and other solvents Resurfacing
Fuel use
Reconditioning of engines for
reuse
Recycling of aluminum frame,
scraps & electronics
Water N/A (no direct influence over
this life cycle stage)
Coatings Paint stripping (direct)
Engine and airframe cleaning
(direct)
N/A
Land use N/A (no direct influence over
this life cycle stage)
Incremental footprint for
manufacturing facility
Two additional runways
needed
New hangar needed for fleet
Additional landfill acreage
needed for solid waste
N/A not applicable
214 Environ Syst Decis (2013) 33:209–223
123
energy is energy consumed directly by the system, for
example the diesel fuel needed in a ground vehicle. Indirect
energy is not consumed directly by the system, but is
necessary to manufacture, sustain, and protect the system.
Assessing system energy consumption requires calculating
the total amount of direct and indirect energy, for each type
of energy input (e.g., diesel fuel, gasoline, natural gas)
needed to meet the minimum required capabilities. In the
example presented in Table 3, inventory data collection
should consider the quantity of direct and indirect energy
needed to meet the minimum required capabilities.
There are hundreds, maybe thousands, of chemicals and
materials that a system may use throughout its life cycle.
Users of the SLCA should use expert judgment on chemicals
and materials that need to be included in the SLCA. A
chemical or material should be included in the SLCA if it is:
known to be toxic or harmful to human health or the envi-
ronment; rare, difficult to acquire, or expensive; or critical to
the system. Additionally, assessors should be mindful of all
chemicals and materials that are used to manufacture the
system or are used to support and sustain the system. After
identifying the chemicals and materials that a system uses
throughout its life cycle, assessors need to assign quantities
to each chemical and material. For chemicals and materials,
data will typically be in mass-based units.
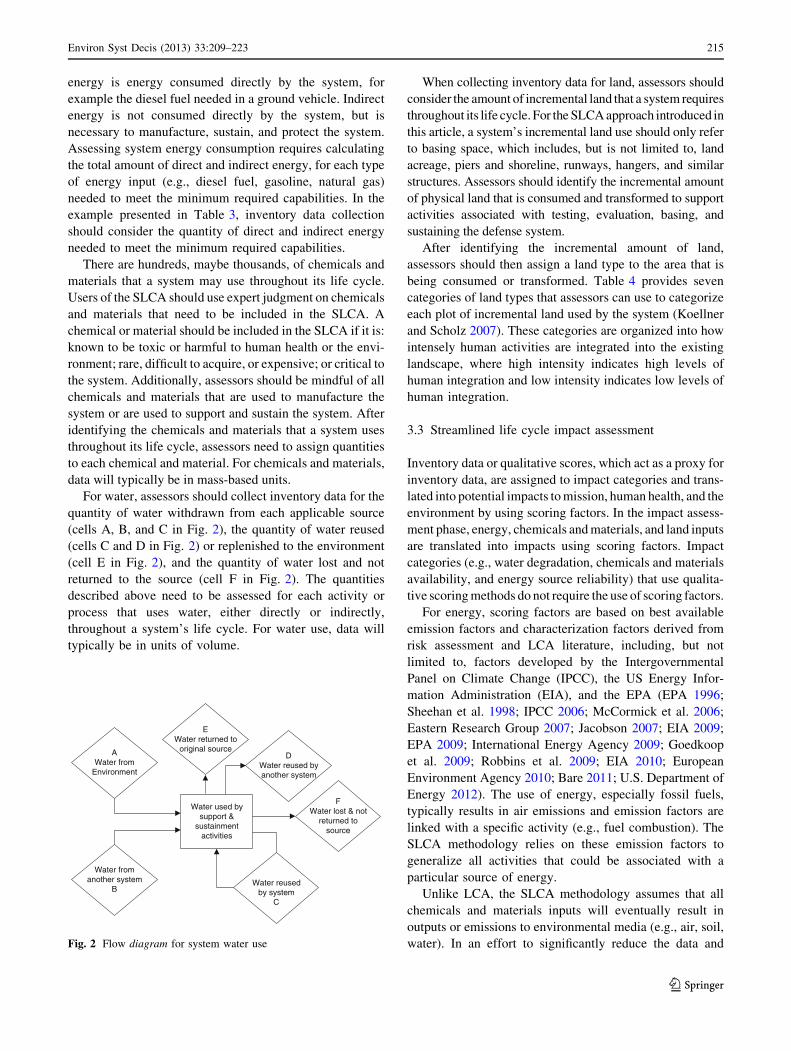
For water, assessors should collect inventory data for the
quantity of water withdrawn from each applicable source
(cells A, B, and C in Fig. 2), the quantity of water reused
(cells C and D in Fig. 2) or replenished to the environment
(cell E in Fig. 2), and the quantity of water lost and not
returned to the source (cell F in Fig. 2). The quantities
described above need to be assessed for each activity or
process that uses water, either directly or indirectly,
throughout a system’s life cycle. For water use, data will
typically be in units of volume.
When collecting inventory data for land, assessors should
consider the amount of incremental land that a system requires
throughout its life cycle. For the SLCA approach introduced in
this article, a system’s incremental land use should only refer
to basing space, which includes, but is not limited to, land
acreage, piers and shoreline, runways, hangers, and similar
structures. Assessors should identify the incremental amount
of physical land that is consumed and transformed to support
activities associated with testing, evaluation, basing, and
sustaining the defense system.
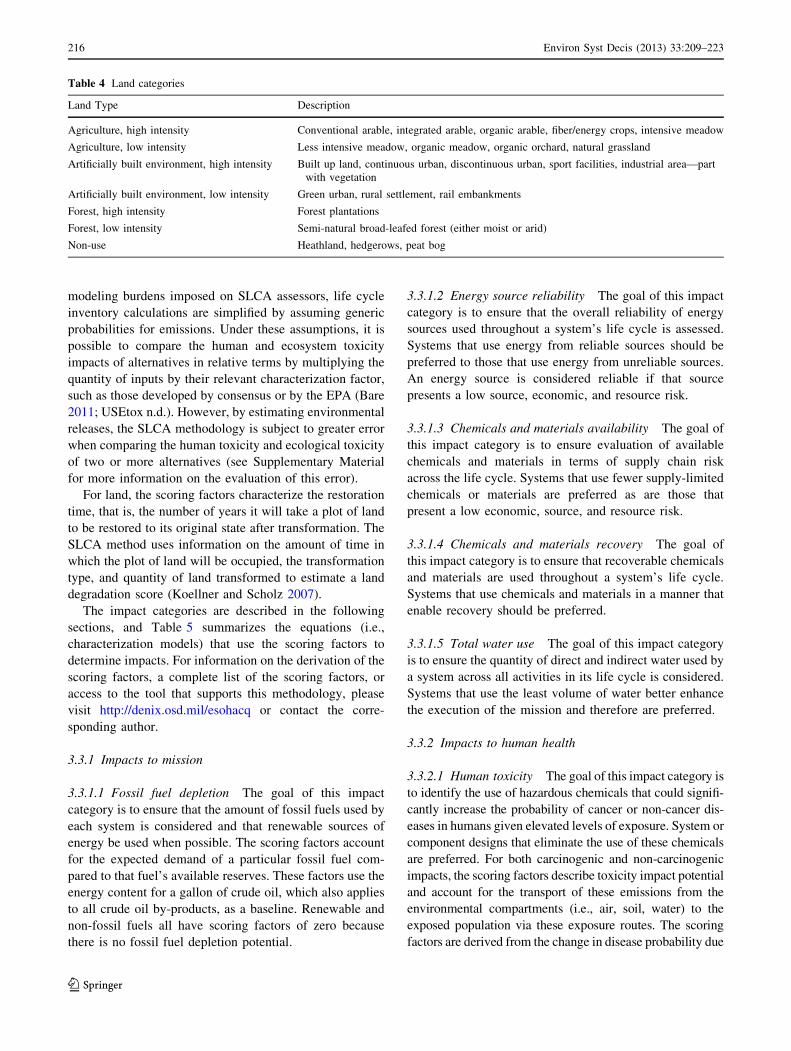
After identifying the incremental amount of land,
assessors should then assign a land type to the area that is
being consumed or transformed. Table 4 provides seven
categories of land types that assessors can use to categorize
each plot of incremental land used by the system (Koellner
and Scholz 2007). These categories are organized into how
intensely human activities are integrated into the existing
landscape, where high intensity indicates high levels of
human integration and low intensity indicates low levels of
human integration.
3.3 Streamlined life cycle impact assessment
Inventory data or qualitative scores, which act as a proxy for
inventory data, are assigned to impact categories and trans-
lated into potential impacts to mission, human health, and the
environment by using scoring factors. In the impact assess-
ment phase, energy, chemicals and materials, and land inputs
are translated into impacts using scoring factors. Impact
categories (e.g., water degradation, chemicals and materials
availability, and energy source reliability) that use qualita-
tive scoring methods do not require the use of scoring factors.
For energy, scoring factors are based on best available
emission factors and characterization factors derived from
risk assessment and LCA literature, including, but not
limited to, factors developed by the Intergovernmental
Panel on Climate Change (IPCC), the US Energy Infor-
mation Administration (EIA), and the EPA (EPA 1996;
Sheehan et al. 1998; IPCC 2006; McCormick et al. 2006;
Eastern Research Group 2007; Jacobson 2007; EIA 2009;
EPA 2009; International Energy Agency 2009; Goedkoop
et al. 2009; Robbins et al. 2009; EIA 2010; European
Environment Agency 2010; Bare 2011; U.S. Department of
Energy 2012). The use of energy, especially fossil fuels,
typically results in air emissions and emission factors are
linked with a specific activity (e.g., fuel combustion). The
SLCA methodology relies on these emission factors to
generalize all activities that could be associated with a
particular source of energy.
Unlike LCA, the SLCA methodology assumes that all
chemicals and materials inputs will eventually result in
outputs or emissions to environmental media (e.g., air, soil,
water). In an effort to significantly reduce the data and
Water used bysupport &
sustainmentactivities
AWater from
Environment
Water fromanother system
B
EWater returned to
original sourceD
Water reused byanother system
FWater lost & not
returned tosource
Water reusedby system
C
Fig. 2 Flow diagram for system water use
Environ Syst Decis (2013) 33:209–223 215
123
modeling burdens imposed on SLCA assessors, life cycle
inventory calculations are simplified by assuming generic
probabilities for emissions. Under these assumptions, it is
possible to compare the human and ecosystem toxicity
impacts of alternatives in relative terms by multiplying the
quantity of inputs by their relevant characterization factor,
such as those developed by consensus or by the EPA (Bare
2011; USEtox n.d.). However, by estimating environmental
releases, the SLCA methodology is subject to greater error
when comparing the human toxicity and ecological toxicity
of two or more alternatives (see Supplementary Material
for more information on the evaluation of this error).
For land, the scoring factors characterize the restoration
time, that is, the number of years it will take a plot of land
to be restored to its original state after transformation. The
SLCA method uses information on the amount of time in
which the plot of land will be occupied, the transformation
type, and quantity of land transformed to estimate a land
degradation score (Koellner and Scholz 2007).
The impact categories are described in the following
sections, and Table 5 summarizes the equations (i.e.,
characterization models) that use the scoring factors to
determine impacts. For information on the derivation of the
scoring factors, a complete list of the scoring factors, or
access to the tool that supports this methodology, please
visit http://denix.osd.mil/esohacq or contact the corre-
sponding author.
3.3.1 Impacts to mission
3.3.1.1 Fossil fuel depletion The goal of this impact
category is to ensure that the amount of fossil fuels used by
each system is considered and that renewable sources of
energy be used when possible. The scoring factors account
for the expected demand of a particular fossil fuel com-
pared to that fuel’s available reserves. These factors use the
energy content for a gallon of crude oil, which also applies
to all crude oil by-products, as a baseline. Renewable and
non-fossil fuels all have scoring factors of zero because
there is no fossil fuel depletion potential.
3.3.1.2 Energy source reliability The goal of this impact
category is to ensure that the overall reliability of energy
sources used throughout a system’s life cycle is assessed.
Systems that use energy from reliable sources should be
preferred to those that use energy from unreliable sources.
An energy source is considered reliable if that source
presents a low source, economic, and resource risk.
3.3.1.3 Chemicals and materials availability The goal of
this impact category is to ensure evaluation of available
chemicals and materials in terms of supply chain risk
across the life cycle. Systems that use fewer supply-limited
chemicals or materials are preferred as are those that
present a low economic, source, and resource risk.
3.3.1.4 Chemicals and materials recovery The goal of
this impact category is to ensure that recoverable chemicals
and materials are used throughout a system’s life cycle.
Systems that use chemicals and materials in a manner that
enable recovery should be preferred.
3.3.1.5 Total water use The goal of this impact category
is to ensure the quantity of direct and indirect water used by
a system across all activities in its life cycle is considered.
Systems that use the least volume of water better enhance
the execution of the mission and therefore are preferred.
3.3.2 Impacts to human health
3.3.2.1 Human toxicity The goal of this impact category is
to identify the use of hazardous chemicals that could signifi-
cantly increase the probability of cancer or non-cancer dis-
eases in humans given elevated levels of exposure. System or
component designs that eliminate the use of these chemicals
are preferred. For both carcinogenic and non-carcinogenic
impacts, the scoring factors describe toxicity impact potential
and account for the transport of these emissions from the
environmental compartments (i.e., air, soil, water) to the
exposed population via these exposure routes. The scoring
factors are derived from the change in disease probability due
Table 4 Land categories
Land Type Description
Agriculture, high intensity Conventional arable, integrated arable, organic arable, fiber/energy crops, intensive meadow
Agriculture, low intensity Less intensive meadow, organic meadow, organic orchard, natural grassland
Artificially built environment, high intensity Built up land, continuous urban, discontinuous urban, sport facilities, industrial area—part
with vegetation
Artificially built environment, low intensity Green urban, rural settlement, rail embankments
Forest, high intensity Forest plantations
Forest, low intensity Semi-natural broad-leafed forest (either moist or arid)
Non-use Heathland, hedgerows, peat bog
216 Environ Syst Decis (2013) 33:209–223
123
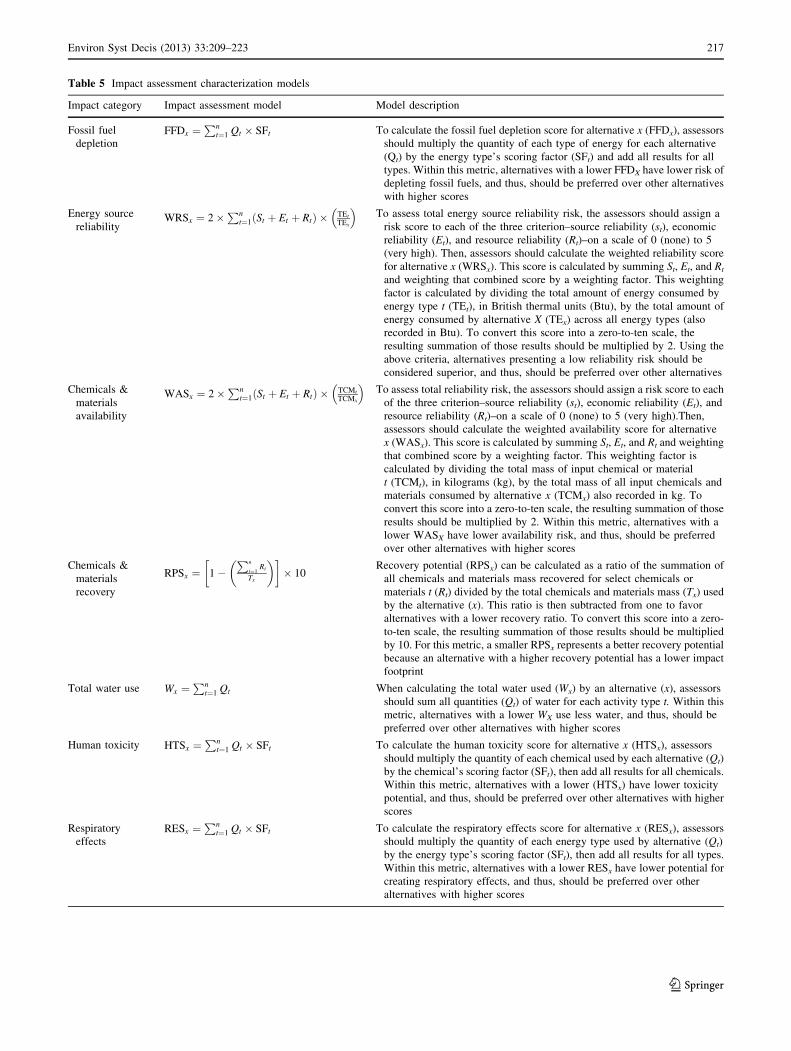
Table 5 Impact assessment characterization models
Impact category Impact assessment model Model description
Fossil fuel
depletionFFDx ¼
Pnt¼1 Qt � SFt To calculate the fossil fuel depletion score for alternative x (FFDx), assessors
should multiply the quantity of each type of energy for each alternative
(Qt) by the energy type’s scoring factor (SFt) and add all results for all
types. Within this metric, alternatives with a lower FFDX have lower risk of
depleting fossil fuels, and thus, should be preferred over other alternatives
with higher scores
Energy source
reliabilityWRSx ¼ 2�
Pnt¼1 St þ Et þ Rtð Þ � TEt
TEx
� �To assess total energy source reliability risk, the assessors should assign a
risk score to each of the three criterion–source reliability (st), economic
reliability (Et), and resource reliability (Rt)–on a scale of 0 (none) to 5
(very high). Then, assessors should calculate the weighted reliability score
for alternative x (WRSx). This score is calculated by summing St, Et, and Rt
and weighting that combined score by a weighting factor. This weighting
factor is calculated by dividing the total amount of energy consumed by
energy type t (TEt), in British thermal units (Btu), by the total amount of
energy consumed by alternative X (TEx) across all energy types (also
recorded in Btu). To convert this score into a zero-to-ten scale, the
resulting summation of those results should be multiplied by 2. Using the
above criteria, alternatives presenting a low reliability risk should be
considered superior, and thus, should be preferred over other alternatives
Chemicals &
materials
availability
WASx ¼ 2�Pn
t¼1 St þ Et þ Rtð Þ � TCMt
TCMx
� �To assess total reliability risk, the assessors should assign a risk score to each
of the three criterion–source reliability (st), economic reliability (Et), and
resource reliability (Rt)–on a scale of 0 (none) to 5 (very high).Then,
assessors should calculate the weighted availability score for alternative
x (WASx). This score is calculated by summing St, Et, and Rt and weighting
that combined score by a weighting factor. This weighting factor is
calculated by dividing the total mass of input chemical or material
t (TCMt), in kilograms (kg), by the total mass of all input chemicals and
materials consumed by alternative x (TCMx) also recorded in kg. To
convert this score into a zero-to-ten scale, the resulting summation of those
results should be multiplied by 2. Within this metric, alternatives with a
lower WASX have lower availability risk, and thus, should be preferred
over other alternatives with higher scores
Chemicals &
materials
recovery
RPSx ¼ 1�Pn
t¼1Rt
Tx
� �� �
� 10Recovery potential (RPSx) can be calculated as a ratio of the summation of
all chemicals and materials mass recovered for select chemicals or
materials t (Rt) divided by the total chemicals and materials mass (Tx) used
by the alternative (x). This ratio is then subtracted from one to favor
alternatives with a lower recovery ratio. To convert this score into a zero-
to-ten scale, the resulting summation of those results should be multiplied
by 10. For this metric, a smaller RPSx represents a better recovery potential
because an alternative with a higher recovery potential has a lower impact
footprint
Total water use Wx ¼Pn
t¼1 Qt When calculating the total water used (Wx) by an alternative (x), assessors
should sum all quantities (Qt) of water for each activity type t. Within this
metric, alternatives with a lower WX use less water, and thus, should be
preferred over other alternatives with higher scores
Human toxicity HTSx ¼Pn
t¼1 Qt � SFt To calculate the human toxicity score for alternative x (HTSx), assessors
should multiply the quantity of each chemical used by each alternative (Qt)
by the chemical’s scoring factor (SFt), then add all results for all chemicals.
Within this metric, alternatives with a lower (HTSx) have lower toxicity
potential, and thus, should be preferred over other alternatives with higher
scores
Respiratory
effectsRESx ¼
Pnt¼1 Qt � SFt To calculate the respiratory effects score for alternative x (RESx), assessors
should multiply the quantity of each energy type used by alternative (Qt)
by the energy type’s scoring factor (SFt), then add all results for all types.
Within this metric, alternatives with a lower RESx have lower potential for
creating respiratory effects, and thus, should be preferred over other
alternatives with higher scores
Environ Syst Decis (2013) 33:209–223 217
123
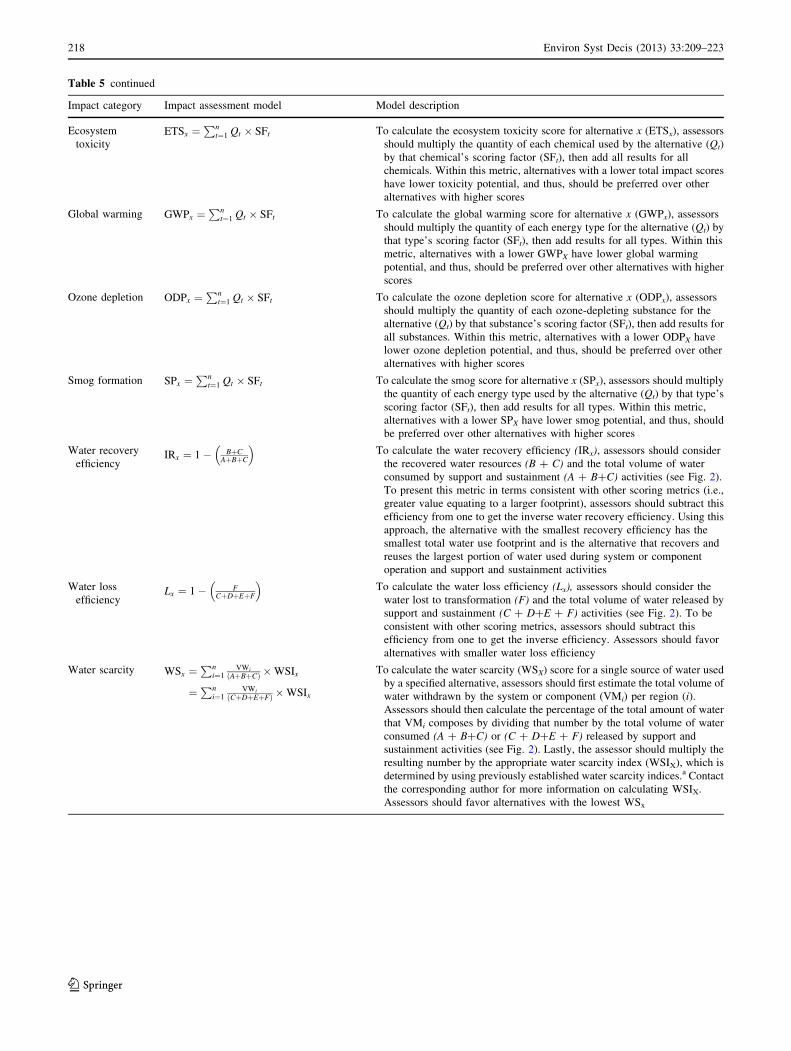
Table 5 continued
Impact category Impact assessment model Model description
Ecosystem
toxicityETSx ¼
Pnt¼1 Qt � SFt To calculate the ecosystem toxicity score for alternative x (ETSx), assessors
should multiply the quantity of each chemical used by the alternative (Qt)
by that chemical’s scoring factor (SFt), then add all results for all
chemicals. Within this metric, alternatives with a lower total impact scores
have lower toxicity potential, and thus, should be preferred over other
alternatives with higher scores
Global warming GWPx ¼Pn
t¼1 Qt � SFt To calculate the global warming score for alternative x (GWPx), assessors
should multiply the quantity of each energy type for the alternative (Qt) by
that type’s scoring factor (SFt), then add results for all types. Within this
metric, alternatives with a lower GWPX have lower global warming
potential, and thus, should be preferred over other alternatives with higher
scores
Ozone depletion ODPx ¼Pn
t¼1 Qt � SFt To calculate the ozone depletion score for alternative x (ODPx), assessors
should multiply the quantity of each ozone-depleting substance for the
alternative (Qt) by that substance’s scoring factor (SFt), then add results for
all substances. Within this metric, alternatives with a lower ODPX have
lower ozone depletion potential, and thus, should be preferred over other
alternatives with higher scores
Smog formation SPx ¼Pn
t¼1 Qt � SFt To calculate the smog score for alternative x (SPx), assessors should multiply
the quantity of each energy type used by the alternative (Qt) by that type’s
scoring factor (SFt), then add results for all types. Within this metric,
alternatives with a lower SPX have lower smog potential, and thus, should
be preferred over other alternatives with higher scores
Water recovery
efficiencyIRx ¼ 1� BþC
AþBþC
� �To calculate the water recovery efficiency (IRx), assessors should consider
the recovered water resources (B ? C) and the total volume of water
consumed by support and sustainment (A ? B?C) activities (see Fig. 2).
To present this metric in terms consistent with other scoring metrics (i.e.,
greater value equating to a larger footprint), assessors should subtract this
efficiency from one to get the inverse water recovery efficiency. Using this
approach, the alternative with the smallest recovery efficiency has the
smallest total water use footprint and is the alternative that recovers and
reuses the largest portion of water used during system or component
operation and support and sustainment activities
Water loss
efficiencyLx ¼ 1� F
CþDþEþF
� �To calculate the water loss efficiency (Lx), assessors should consider the
water lost to transformation (F) and the total volume of water released by
support and sustainment (C ? D?E ? F) activities (see Fig. 2). To be
consistent with other scoring metrics, assessors should subtract this
efficiency from one to get the inverse efficiency. Assessors should favor
alternatives with smaller water loss efficiency
Water scarcity WSx ¼Pn
i¼1VWi
AþBþCð Þ �WSIx
¼Pn
i¼1VWi
CþDþEþFð Þ �WSIx
To calculate the water scarcity (WSX) score for a single source of water used
by a specified alternative, assessors should first estimate the total volume of
water withdrawn by the system or component (VMi) per region (i).Assessors should then calculate the percentage of the total amount of water
that VMi composes by dividing that number by the total volume of water
consumed (A ? B?C) or (C ? D?E ? F) released by support and
sustainment activities (see Fig. 2). Lastly, the assessor should multiply the
resulting number by the appropriate water scarcity index (WSIX), which is
determined by using previously established water scarcity indices.a Contact
the corresponding author for more information on calculating WSIX.
Assessors should favor alternatives with the lowest WSx
218 Environ Syst Decis (2013) 33:209–223
123
to the lifetime intake. These scoring factors are used to rep-
resent the steps along the cause–effect chain starting with the
emission of the chemicals and materials that occur in the life
cycle of the system, followed by the fate and transport through
the environment, exposure to humans, and the resulting effects
on the exposed populations.
3.3.2.2 Respiratory effects The goal of this impact cate-
gory is to ensure that the emissions from fossil fuel com-
bustion and their impact on human health are considered.
The scoring factors describe and account for the transport
of criteria air pollutants to the exposed population via air
exposure routes and the change in probability to respiratory
conditions due to the lifetime intake.
3.3.3 Impacts to ecosystem health
3.3.3.1 Ecosystem toxicity The goal of this impact cate-
gory is to ensure that hazardous chemicals, which could
lead to ecological toxicity in freshwater environments, are
considered. The scoring factors for these impact categories
represent steps along the cause–effect chain starting with
the emission of the chemicals and materials that occur in
the life cycle of the system, followed by the fate and
transport through the environment, exposure to freshwater
wildlife, and the resulting effects on the exposed popula-
tions. The scoring factors are derived from the change in
disease probability of a population due to the lifetime
intake of emission from hazardous chemicals or materials.
3.3.4 Impacts to air
3.3.4.1 Global warming The goal of this impact category
is to ensure that greenhouse gas emissions from fossil fuel
combustion and their impact on global warming are con-
sidered. The scoring factors describe and account for GHG
emissions and their incremental contribution to global
warming.
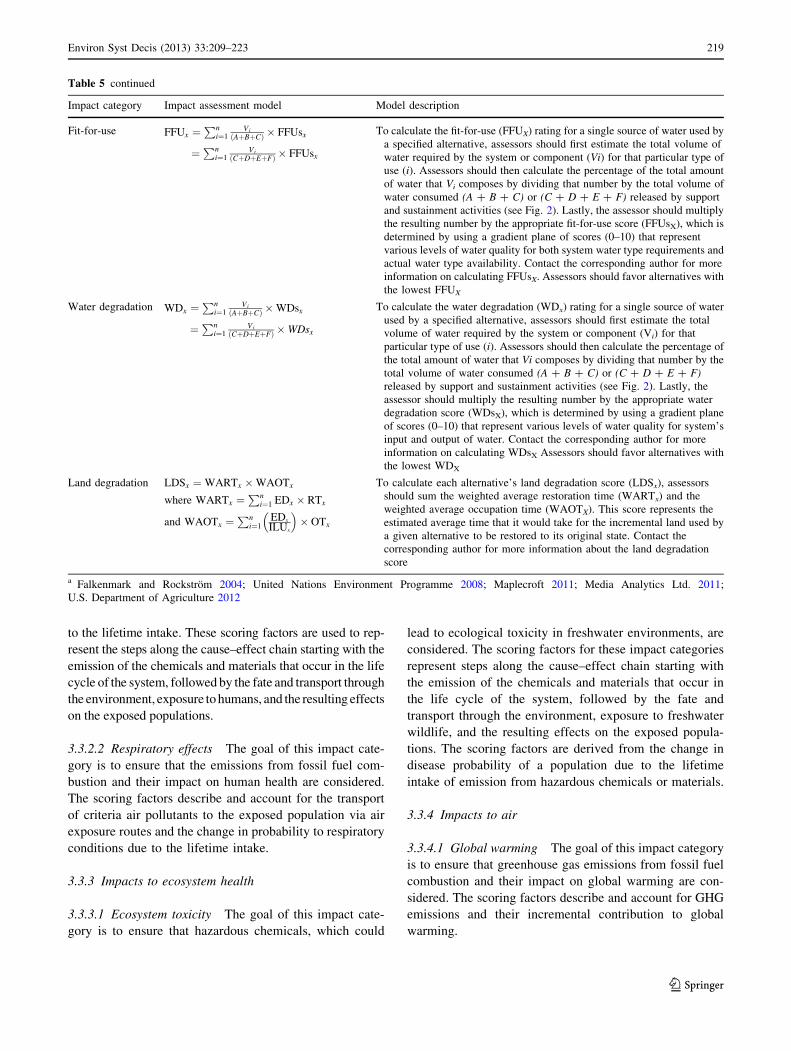
Table 5 continued
Impact category Impact assessment model Model description
Fit-for-use FFUx ¼Pn
i¼1Vi
AþBþCð Þ � FFUsx
¼Pn
i¼1Vi
CþDþEþFð Þ � FFUsx
To calculate the fit-for-use (FFUX) rating for a single source of water used by
a specified alternative, assessors should first estimate the total volume of
water required by the system or component (Vi) for that particular type of
use (i). Assessors should then calculate the percentage of the total amount
of water that Vi composes by dividing that number by the total volume of
water consumed (A ? B ? C) or (C ? D ? E ? F) released by support
and sustainment activities (see Fig. 2). Lastly, the assessor should multiply
the resulting number by the appropriate fit-for-use score (FFUsX), which is
determined by using a gradient plane of scores (0–10) that represent
various levels of water quality for both system water type requirements and
actual water type availability. Contact the corresponding author for more
information on calculating FFUsX. Assessors should favor alternatives with
the lowest FFUX
Water degradation WDx ¼Pn
i¼1Vi
AþBþCð Þ �WDsx
¼Pn
i¼1Vi
CþDþEþFð Þ �WDsx
To calculate the water degradation (WDx) rating for a single source of water
used by a specified alternative, assessors should first estimate the total
volume of water required by the system or component (Vi) for that
particular type of use (i). Assessors should then calculate the percentage of
the total amount of water that Vi composes by dividing that number by the
total volume of water consumed (A ? B ? C) or (C ? D ? E ? F)released by support and sustainment activities (see Fig. 2). Lastly, the
assessor should multiply the resulting number by the appropriate water
degradation score (WDsX), which is determined by using a gradient plane
of scores (0–10) that represent various levels of water quality for system’s
input and output of water. Contact the corresponding author for more
information on calculating WDsX Assessors should favor alternatives with
the lowest WDX
Land degradation LDSx ¼WARTx �WAOTx
where WARTx ¼Pn
i¼1 EDx � RTx
and WAOTx ¼Pn
i¼1EDx
ILUx
� �� OTx
To calculate each alternative’s land degradation score (LDSx), assessors
should sum the weighted average restoration time (WARTx) and the
weighted average occupation time (WAOTX). This score represents the
estimated average time that it would take for the incremental land used by
a given alternative to be restored to its original state. Contact the
corresponding author for more information about the land degradation
score
a Falkenmark and Rockstrom 2004; United Nations Environment Programme 2008; Maplecroft 2011; Media Analytics Ltd. 2011;
U.S. Department of Agriculture 2012
Environ Syst Decis (2013) 33:209–223 219
123
3.3.4.2 Ozone depletion The use of substances like
chlorofluorocarbons (CFCs), hydrochlorofluorocarbons
(HCFCs), and halogens for applications such as refriger-
ants and aerosols contribute to ozone depletion. The goal of
this impact category is to ensure that the use and associated
emissions of ozone-depleting substances are evaluated.
3.3.4.3 Smog formation The combustion of fuels for
energy, either directly at the source or indirectly through
the use of electricity, leads to the release of air pollutants
that may cause tropospheric smog. The goal of this impact
category is to ensure that emissions leading to smog for-
mation are evaluated.
3.3.5 Impacts to water
3.3.5.1 Water recovery efficiency The goal of this impact
category is to assess the total volume of direct and indirect water
that is recovered or reused by systems or components. Water
may be reused directly by that system or reused by other sys-
tems. The greater capacity a system has to recover and reuse
water, the less burden that system places on the environment
and any surrounding populations competing for the same water
resource. Efficient system design enhances water recovery.
Water recovery efficiency is the ratio of water withdrawn from
recovered sources to the total volume of water used by and in
support and sustainment of the system or component.
3.3.5.2 Water loss efficiency The goal of this impact
category is to ensure systems that minimize the total vol-
ume of direct and indirect water lost to transformations are
preferred. From an output perspective, the loss of water
from a system or component through transformations such
as evapotranspiration prevent the return of water to its
original source, which is detrimental to freshwater eco-
systems and local communities. Water loss efficiency is the
ratio of water lost to transformation to the total volume of
water used by and in support and sustainment of the system
or component.
3.3.5.3 Water scarcity The goal of this impact category
is to reduce water use, especially in regions where water
resources are scarce. This impact category assesses the
water scarcity of varying geographic locations by using a
scoring factor derived from water scarcity indices (Fal-
kenmark and Rockstrom 2004; United Nations Environ-
ment Programme 2008; Maplecroft 2011; Media Analytics
Ltd. 2011; U.S. Department of Agriculture 2012). The
scoring factor is used to calculate a weighted average
taking into consideration the volume of water withdrawn
from various geographic locations and the corresponding
water scarcity of the surrounding area.
3.3.5.4 Fit-for-use The goal of this impact category is to
closely match the water quality of a source with the water
quality required by a given use. For example, brackish
water will need to undergo extensive treatment in order to
become drinking water. If there is a source of water that is
closer in quality to drinking water standards, it is prefer-
ential to withdraw water from that source. Conversely, if
gray water is suitable for industrial applications, using
water that meets drinking water standards is a misuse of
resources. Matching the quality of source water with the
quality required by the use reduces the need for extensive
water treatment, which is typically energy intensive, and
minimizes the opportunity to contaminate potable water.
Fit-for-use is calculated by taking a weighted average that
uses scoring factors to represent how closely matched the
source water quality is with the quality required by the use.
3.3.5.5 Water degradation The goal of this impact cat-
egory is to promote system design that preserves water
quality. Industrial processes withdraw and use water from
the environment resulting in altered or degraded water
(e.g., increased temperature, salinity, turbidity). Systems
that minimize water degradation are preferred. Water
degradation is calculated as a weighted average of water
inputs and outputs multiplied by a scoring factor repre-
senting the extent of water degradation.
3.3.6 Impacts to land
3.3.6.1 Land degradation The goal of this impact cate-
gory is to consider land degradation resulting from the
activities of a system or component throughout its life
cycle. Systems that preserve ecosystems by reducing
incremental land use are preferred. Degradation is evalu-
ated using restoration time (Goedkoop et al. 2009). Res-
toration times represent the time it would take for an
ecosystem to regain its pre-disturbed state after a major
transformation. Land degradation is calculated by taking a
weighted average of incremental land use and restoration
times for ecosystem transformations.
3.4 Interpretation
Indexed scores (ISx) can be assigned to each alternative
within a particular impact category by calculating each
alternative’s impact in terms of a percentage score of the
worst performer. According to this indexing methodology,
the worst performer is assigned an indexed score of 100 %
and represents the outermost parameter of the scale against
which all other alternatives will be assessed. The indexed
scores for all alternatives not considered worst (Ax) can be
calculated by using Eq. 1.
220 Environ Syst Decis (2013) 33:209–223
123
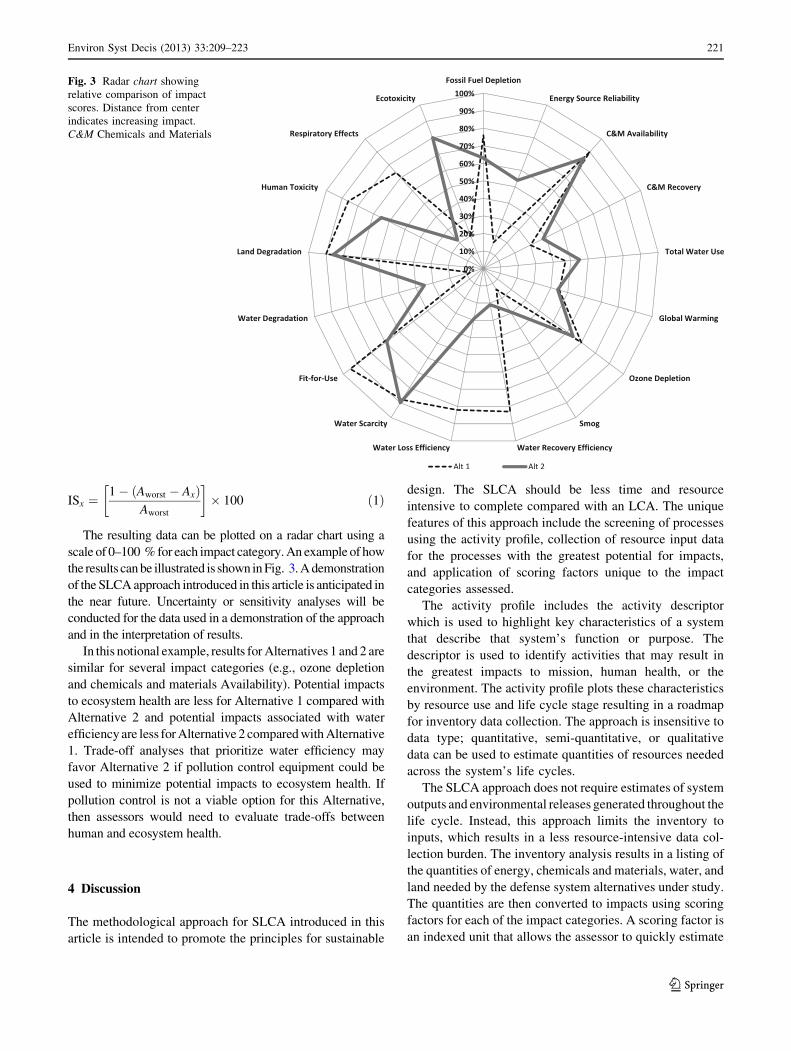
ISx ¼1� Aworst � Axð Þ
Aworst
� �
� 100 ð1Þ
The resulting data can be plotted on a radar chart using a
scale of 0–100 % for each impact category. An example of how
the results can be illustrated is shown in Fig. 3. A demonstration
of the SLCA approach introduced in this article is anticipated in
the near future. Uncertainty or sensitivity analyses will be
conducted for the data used in a demonstration of the approach
and in the interpretation of results.
In this notional example, results for Alternatives 1 and 2 are
similar for several impact categories (e.g., ozone depletion
and chemicals and materials Availability). Potential impacts
to ecosystem health are less for Alternative 1 compared with
Alternative 2 and potential impacts associated with water
efficiency are less for Alternative 2 compared with Alternative
1. Trade-off analyses that prioritize water efficiency may
favor Alternative 2 if pollution control equipment could be
used to minimize potential impacts to ecosystem health. If
pollution control is not a viable option for this Alternative,
then assessors would need to evaluate trade-offs between
human and ecosystem health.
4 Discussion
The methodological approach for SLCA introduced in this
article is intended to promote the principles for sustainable
design. The SLCA should be less time and resource
intensive to complete compared with an LCA. The unique
features of this approach include the screening of processes
using the activity profile, collection of resource input data
for the processes with the greatest potential for impacts,
and application of scoring factors unique to the impact
categories assessed.
The activity profile includes the activity descriptor
which is used to highlight key characteristics of a system
that describe that system’s function or purpose. The
descriptor is used to identify activities that may result in
the greatest impacts to mission, human health, or the
environment. The activity profile plots these characteristics
by resource use and life cycle stage resulting in a roadmap
for inventory data collection. The approach is insensitive to
data type; quantitative, semi-quantitative, or qualitative
data can be used to estimate quantities of resources needed
across the system’s life cycles.
The SLCA approach does not require estimates of system
outputs and environmental releases generated throughout the
life cycle. Instead, this approach limits the inventory to
inputs, which results in a less resource-intensive data col-
lection burden. The inventory analysis results in a listing of
the quantities of energy, chemicals and materials, water, and
land needed by the defense system alternatives under study.
The quantities are then converted to impacts using scoring
factors for each of the impact categories. A scoring factor is
an indexed unit that allows the assessor to quickly estimate
Fig. 3 Radar chart showing
relative comparison of impact
scores. Distance from center
indicates increasing impact.
C&M Chemicals and Materials
Environ Syst Decis (2013) 33:209–223 221
123
the level of impact for a given impact category. It aggregates
all relevant emission factors needed to estimate outputs from
a specific input and the characterization factors needed to
convert that output to appropriate impacts. Because the
scoring factors are based on generalized emission factors and
characterization factors, the calculated impacts are not
considered as robust as those calculated using LCA; how-
ever, they should be sufficient for most trade-off analyses on
a relative scale. For more information about the derivation of
the scoring factors or for a list of the scoring factors, please
visit http://denix.osd.mil/esohacq or contact the corre-
sponding author.
The presentation of impact assessment results using the
radar chart provides decision makers with a comprehensive
comparison of performance and magnitude of impacts
between or among defense system alternatives. The chart
can be used to evaluate trade-offs and communicate results
to different audiences (e.g., product designers, policy
makers, environmental health professionals). Results can
be generated for different design options enabling assessors
to compare impacts of various design choices.
We believe that the presented SLCA approach improves
trade-off analyses by reducing subjectivity. Like LCA, the
proposed SLCA impact assessment methodology does not
remove subjective analysis across impact categories with
dissimilar metrics. However, the SLCA differs from LCA
in that it delays and refines this bias by inserting subjective
analysis post-processing. Doing so avoids skewing the
results of the impact assessment by pre-determining the
relative value of each impact category and allows stake-
holders to focus consensus-building efforts on the more
controversial indicators. Returning to the example in Sect.
3 will demonstrate this value. The two alternatives pre-
sented in Fig. 3 are very similar in terms of chemical and
material availability and recovery potential. Although these
are very important mission indicators, they will not impact
the trade-off decision in this assessment, and thus deter-
mining pre-established weights would have wasted valu-
able time and resources. Conversely, a more focused trade-
off analysis can result when evaluating impact results for
criteria where the two alternatives differ (e.g., human
health, ecosystem health and water efficiency).
5 Conclusions
In this article, we introduce a methodological approach for
an SLCA that can be used to evaluate sustainability of
defense acquisitions. The approach is rigorous, systematic,
and intended to provide guidance to decision makers.
Specifically, the SLCA aims to untangle the complex web
of relationships among impacts to mission, human health,
and environment to inform product design, or re-design,
and to justify trade-offs between areas of concern. The
approach is recommended for application in those cases
where assessors are faced with alternative options for the
design of a product system and where quantitative data
describing the system inputs are not readily available. Also,
it is intended to be used to assist sustainability-minded
decision makers, those who recognize the importance of
sustaining resources while preventing impacts to human
health, the environment, and the mission of a company, an
agency, or an industry sector. Future research activities will
include the application and demonstration of the method-
ological approach to acquisitions for defense and other
industries. With repeated application of the approach,
iterative revisions and improvements to inventory data
collection techniques and scoring factors will be necessary.
In addition, the breadth of impact categories may be
expanded to include physical hazards experienced in the
work environment (e.g., ergonomic stressors and fall haz-
ards) and the associated impacts on worker health as a
subset of the human health area of concern.
Acknowledgments The authors kindly acknowledge the leadership
and support provided by Mr. Paul J. Yaroschak, Deputy for Chemical
and Material Risk Management within the Office of the Secretary of
Defense, Department of Defense.
References
Bare J (2011) TRACI 2.0: the tool for the reduction and assessment of
chemical and other environmental impacts 2.0. Clean Technol
Environ Policy 13:687–696
Bare JC, Gloria TP (2008) Environmental impact assessment
taxonomy providing comprehensive coverage of midpoints,
endpoints, damages, and areas of protection. J Clean Prod 16:
1021–1035
Eastern Research Group (2007) Emission factors for priority biofuels
in Minnesota. Minnesota pollution control agency. http://www.
pca.state.mn.us/index.php/view-document.html?gid=3402. Acces-
sed 8 Feb 2013
Falkenmark M, Rockstrom J (2004) Balancing water for humans and
nature. Routledge, London
Goedkoop M, Heijungs R, Huijbregts M, De Schryver A, Struijs J, van
Zelm R (2009) ReCiPe 2008: a life cycle impact assessment
method which comprises harmonized category indicators at the
midpoint and the endpoint level. First edition Report I: Charac-
terisation. http://www.lcia-recipe.net. Accessed 3 Oct 2012
Graedel TE, Lanzano T, Pott W, Araujo RJ (2005) Multiscale life-
cycle assessment. Working Paper Number 6. Yale School of
Forestry and Environmental Studies
Hochschorner E, Finnveden G (2003) Evaluation of two simplified
life cycle assessment methods. Int J LCA 8:119–128
Intergovernmental Panel on Climate Change (2006) 2006 guidelines
for national greenhouse gas inventories. http://www.ipcc-nggip.
iges.or.jp/public/2006gl/index.html. Accessed 8 Feb 2013
International Energy Agency (2009) Electricity/heat production and
consumption statistics by country. http://www.iea.org/stats/prodresult.
asp?PRODUCT=Electricity/Heat. Accessed 8 Feb 2013
International Organization for Standardization, Technical Committee
ISO/TC 207, Environmental Management, Subcommittee SC 5,
222 Environ Syst Decis (2013) 33:209–223
123
Life cycle assessment (2006) ISO 14044: environmental man-
agement—life cycle assessment—requirements and guidelines.
(1st ed.) Geneva, Switzerland: ISO
Jacobson M (2007) Effects of ethanol (E85) versus gasoline vehicles
on cancer and mortality in the U.S. Environ Sci Technol
41:4150–4157
Koellner T, Scholz RW (2007) Assessment of land use impacts on the
natural environment. Part 1: an analytical framework for pure
land occupation and land use change. Int J LCA 12:16–23
Maplecroft (2011) Water stress index 2011. PreventionWeb. http://
www.preventionweb.net/english/professional/maps/v.php?id=20
129. Accessed 5 Oct 2012
Media Analytics Ltd. (2011) Global water risk index. Global Water
Intelligence. http://www.water-risk-index.com/. Accessed 5 Oct 2012
McCormick RL, Williams A, Ireland J, Brimhall M, Hayes RR (2006)
Effects of biodiesel blends on vehicle emissions: fiscal year 2006
annual operating plan milestone 10.4. NREL/MP-540-40554
Robbins C, Hoekman SK, Gertler A, Broch A, Natarajan M (2009)
Biodistillate transportation fuels 2: emission impacts. SAE
Technical Paper 2009-01-2724, doi:10.4271/2009-01-2724
Sheehan J, Camobreco V, Duffield J, Graboski M, Shapour H (1998)
An overview of biodiesel and petroleum diesel lifecycles.
NREL/TP-580-24772
Todd JA, Curran MA (1999) Streamlined life-cycle assessment: a
final report from the SETAC North American Streamlined LCA
Workgroup. Soc Environ Toxicol Chem
United Nations Environment Programme (UNEP) (2008) Vital water
graphics: an overview of the state of the world’s fresh and
marine waters, 2nd edn. UNEP, Nairobi
U.S. Department of Agriculture (2012) Water supply stress index
(WaSSI) ecosystem services model. Climate Change Resource
Center. http://www.fs.fed.us/ccrc/tools/wassi.shtml. Accessed 5
Oct 2012
U.S. Department of Defense (2012) Installation sustainability agree-
ment signed. No. 086-12 Public Affairs News Release
U.S. Department of Energy (2012) Greenhouse gases, regulated
emissions, and energy use in transportation (GREET) model.
http://greet.es.anl.gov/. Accessed 8 Feb 2013
U.S. Energy Information Administration (2009) Instructions for Form
EIA-1605, voluntary reporting of greenhouse gases. http://www.
eia.gov/survey/form/eia_1605/. Accessed 8 Feb 2013
U.S. Energy Information Administration (2010) Data on U.S. electricity
net generation and emissions by State. EIA-767, EIA-906, EIA-923.
http://www.eia.gov/electricity/data.cfm AND http://www.eia.gov/
survey/#electricity. Accessed 8 Feb 2013
U.S. Environmental Protection Agency (1996) AP-42 compilation of
air pollutant emission factors: volume I stationary point and area
sources. http://www.epa.gov/ttn/chief/ap42/index.html. Acces-
sed 8 Feb 2013
U.S. Environmental Protection Agency (2009) Petroleum products
and natural gas liquids: definitions, emission factors, methods
and assumptions. Technical Support Document
USEtox (no date (n.d.)) USEtox Model available from http://www.
usetox.org. Accessed 15 Feb 2013
Environ Syst Decis (2013) 33:209–223 223
123