intra-industry trade and export diversification · 1 export diversification and intra-industry...
TRANSCRIPT
1
Export Diversification and Intra-Industry Trade in Africa1
Siope V. ‗Ofa2, Malcolm Spence
3, Simon Mevel
4 and Stephen Karingi
5
United Nations Economic Commission for Africa
Selected Paper for Presentation in the African Economic Conference 2012
Kigali, Rwanda, 30 October – 2 November 2012
11 October 2012
1 This research has benefited enormously from useful comments and contributions from the participants of an Expert
Group Meeting on ‗Export Diversification and Intra-Industry‘, Lusaka, Zambia on 3-4 May 2012. We are also
grateful for comments from Halima Noor Abdi, Patrick Osakwe and James Egbetayo. The views presented in this
paper may not necessarily reflect the position of the United Nations Economic Commission for Africa. Any
remaining errors are ours. 2Associate Economic Affairs Officer, Trade & International Negotiations Section, Regional Integration,
Infrastructure & Trade Division, UNECA. 3Former Ind. Contractor, Trade & International Negotiations Section, Regional Integration, Infrastructure & Trade
Division, UNECA. 4 Economic Affairs Officer, Trade & International Negotiations Section, Regional Integration, Infrastructure &
Trade Division, UNECA. 5 Director, Regional Integration, Infrastructure & Trade Division, UNECA.

2
Abstract: Intra-African trade, which has remained under 12 per cent in the last decade, is low compared to
other major regions of the world. In January 2012, the African Union (AU) Summit of African
Heads of State and Government endorsed the theme of ‗Boosting Intra-African trade‘ and called
on Member States, Regional Economic Communities (RECs) and the AU Commission to
promote industrial development with a view to diversify economies and moving away from
heavy reliance on traditional primary commodities for export. Using disaggregate export and
import statistics Harmonized System at the 6-digit level from BACI and COMTRADE data sets
between 1998 and 2009, measures of export diversification (using Herfindahl-Hirshman Index)
and intra-industry trade (using Grubel-Lloyd Index) are computed for 49 African economies for
which data is available. Preliminary results tend to indicate that while both export diversification
and intra-industry trade in Africa are generally low, there are exception cases. In addition, a
positive correlation between export diversification and intra-industry trade is found for the
sample of African countries. This has implication for policy dialogue suggesting that any future
trade policy designed to favor export diversification has positive implications for intra-industry
trade and vice versa. Other findings from the technical work provide two important contributions
to the direction of current trade policy dialogue on boosting Intra-African trade. First, export
diversification and intra-industry trade policies should not be treated in isolation. Second, we
identify constraints towards export diversification and intra-industry trade in Africa crucial
towards better understanding and subsequently developing effective program of actions for
boosting Intra-African trade.
3
Contents (1) Introduction .......................................................................................................................... 4
(2) Theoretical Underpinnings of Export Diversification and Intra-Industry Trade ................. 5
(i) Export Diversification ...................................................................................................... 5
(ii) Intra-Industry Trade ....................................................................................................... 10
(3) The Status and Evolution of Export Diversification and Intra-industry Trade in Africa .. 14
(i) Export Diversification Index for Africa ......................................................................... 14
(ii) Intra-Industry Trade ....................................................................................................... 19
(4) Linking Intra-Industry Trade and Export Diversification in Africa .................................. 31
(5) Necessity to overcome the constraints to Export Diversification and Intra-Industry Trade
in Africa ........................................................................................................................................ 36
(i) Tariffs and Non-Tariff Barriers on Trade in Goods ....................................................... 36
(ii) Non-Tariff Barriers on Trade in Services ...................................................................... 42
(6) Concluding Remarks and Policy Implications ................................................................... 44
(7) References .......................................................................................................................... 46
4
(1) Introduction
In January 2012, the African Union Summit of African Heads of State and Government
endorsed the theme of ‗Boosting Intra-African Trade‘, paving the way towards fast-tracking a
Continental Free Trade area (CFTA) with a tentative timeframe of 2017. The January 2012
decision mandated UNECA, AUC, AfDB and Member States to collaborate closely towards the
implementation of relevant action plans at the national, regional and continental levels on
boosting intra-African trade and the establishment of the CFTA. In particular, the January 2012
Summit recognized the low level of trade between African countries called upon Member States,
Regional Economic Communities (RECs) and the AUC to promote industrial development
policy and value addition to diversify African economies and thereby moving away from heavy
reliance on traditional primary exports.
It is against this backdrop that this study attempts to contribute to the current trade policy
dialogue on boosting intra-African trade in four aspects. First, the study examines patterns of
export diversification for African economies. Second, a measure of Intra-Industry trade for
African economies is estimated. Intra-industry trade is understood as simultaneous import and
export of similar but differentiated goods. Third, the study evaluates potential linkages between
export diversification and intra-industry trade in Africa. Informed by the patterns of trade in
African economies, constraints towards export diversification and intra-industry trade are
discussed and ways to overcoming these constraints are explored.
The paper begins by briefly discussing the theoretical underpinnings behind intra-
industry trade and export diversification. Second, it presents the evolution and status of intra-
industry trade and export diversification in Africa. Third, it attempts to examine the linkages
between intra-industry trade and export diversification as well as exploring potential pathways to
enhancing intra-industry trade and/or export diversification in Africa. Fourth, the paper discusses
constraints to intra-industry trade and export diversification in Africa. Finally, policy
recommendations are formulated to conclude the paper.
5
(2) Theoretical Underpinnings of Export Diversification and Intra-Industry Trade
(i) Export Diversification
Export expansion can be either through the extensive margin—new products or new
markets—or the intensive margin—more of current products. Export diversification is therefore
understood as the expansion of exports due to new products or new markets—extensive margin.
Amurgo-Pacheco and Pierola (2008) provide a useful narrower definition by discussing a
geographic dimension with export diversification via the extensive margin is the export of new
products to existing markets, old products to new markets, and new products to new markets.
Why export diversification is important for Africa? Export diversification—and
economic diversification in general—build resilience of poorer countries to external economic
shocks. Diversification is more relevant today to Africa as the impact of the global financial
crisis affect both rich and poor economies globally. For Africa, with its high dependence on
primary commodities and fluctuating world prices on most primary goods, there is therefore a
need for Africa to pursue developmental strategies which promote export diversification. In
addition, Africa requires high and sustained growth to make progress in combating poverty.
Export diversification is widely seen as a positive trade objective in sustaining economic growth
(Brenton, Newfarmer and Walkenhorst 2007). Delgado (1995) argued that diversifying the
agricultural export base and diversifying the economy across sectors are central to the long-run
growth strategies in Africa given the high concentration ratio of agricultural exports (food and
beverages typically account for well over half of merchandise exports in non-oil exporting
African countries). Moreover, there is convergence in the developmental literature that growth
requires structural transformation (primary—manufacturing—services trade), hence African
economies must diversify production base into high-value added production in order to sustained
economic growth6. Diversification is sometimes claimed to be of importance not just for
resource-rich countries, but as a pre-requisite for economic growth (Economic Commission for
Africa, 2007).
6 We are grateful to Patrick Osakwe for bringing these issues to our attention.

6
Virtually every theory of international trade predicts that a larger economy will export
more in absolute terms than a smaller economy. Nevertheless, trade theories differ in predicting
how relatively larger economies export more (Hummels and Klenow, 2005). One strand of
literature emphasizes on the export expansion through the intensive margin, based on seminal
work by Armington (1969). Brenton et al. (2007) argued that low income countries focus on
greater differentiation of existing products, rather than attempting to diversify directly into new
export categories. On the other hand, some have argued for the expansion of export via the
extensive margin, based on the influential work of Krugman (1980). However, Hummels and
Klenow (2005) argue that neither the intensive margin hypothesis by Armington (1969) nor
Krugman‘s extensive margin hypothesis fully explain international trade patterns in developing
countries and provided an empirical framework dividing trade expansion into both intensive and
extensive. The authors argued that consumer preferences for variety increases as economic
development increases, thereby providing an incentive for export expansion in the extensive
margin. Their study found that larger economies export higher volume of each goods (intensive
margin), export a higher variety of goods (extensive margin7) and export higher quality goods.
Imbs and Wacziarg (2003) found that the process of diversification follows a two stage
process (U-shape relationship), in which growth in early stages of development is accompanied
by diversification, until a turning point upon which the trend reverses toward increasing
specialization once more. Few African economies are at the level of development associated with
the turning point towards specialisation, suggesting that further growth on the continent can lead
to greater diversification. This study adopts a measure of GDP per capita, and there is faint
evidence of this relationship in Africa, although oil exporting economies with relatively large
GDPs but with poorly diversified exports are anomalies inconsistent with the two-stage
diversification hypothesis. A recent finding (Spence and Karingi 2011) suggests that many
African countries are currently engaged in export activities incommensurate with their level of
development and hence associated with significant opportunity costs. An outcome based measure
7 The study found that the extensive margin accounts for 62 per cent of the greater exports of larger economies
based on data from UNCTAD TRAINS collected from national statistical agencies of 76 importing countries
covering all 227 exporting countries in 1995.
7
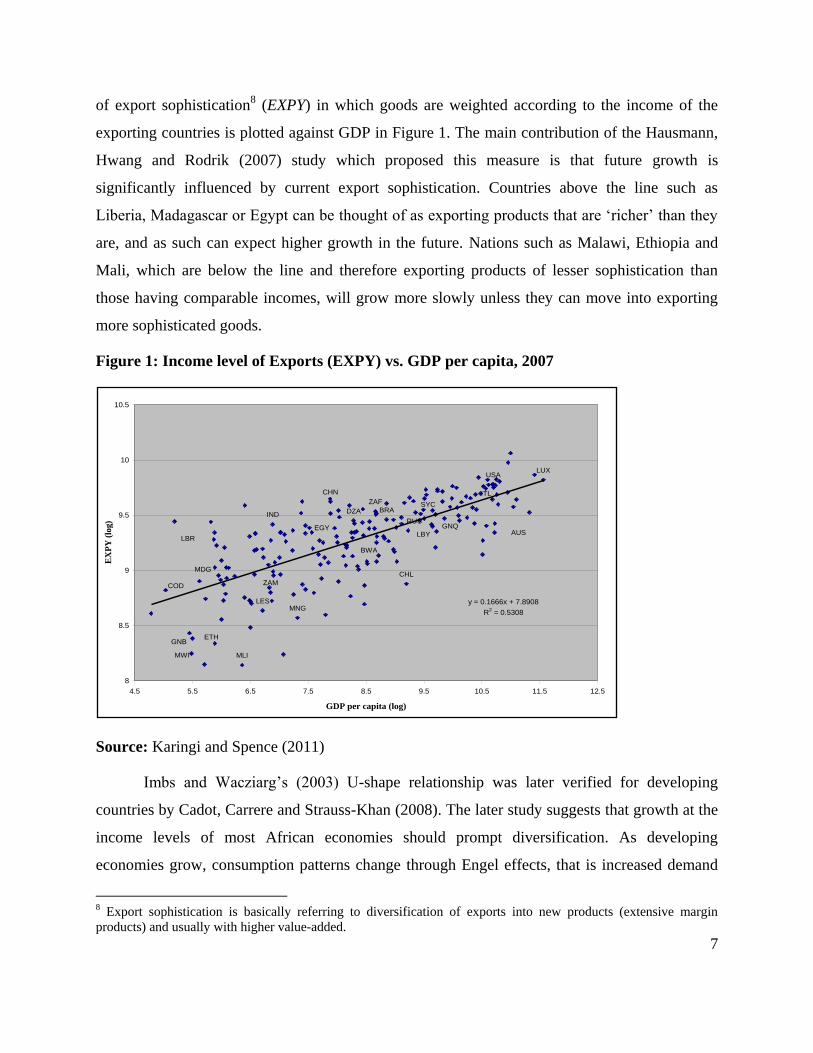
of export sophistication8 (EXPY) in which goods are weighted according to the income of the
exporting countries is plotted against GDP in Figure 1. The main contribution of the Hausmann,
Hwang and Rodrik (2007) study which proposed this measure is that future growth is
significantly influenced by current export sophistication. Countries above the line such as
Liberia, Madagascar or Egypt can be thought of as exporting products that are ‗richer‘ than they
are, and as such can expect higher growth in the future. Nations such as Malawi, Ethiopia and
Mali, which are below the line and therefore exporting products of lesser sophistication than
those having comparable incomes, will grow more slowly unless they can move into exporting
more sophisticated goods.
Figure 1: Income level of Exports (EXPY) vs. GDP per capita, 2007
Source: Karingi and Spence (2011)
Imbs and Wacziarg‘s (2003) U-shape relationship was later verified for developing
countries by Cadot, Carrere and Strauss-Khan (2008). The later study suggests that growth at the
income levels of most African economies should prompt diversification. As developing
economies grow, consumption patterns change through Engel effects, that is increased demand
8 Export sophistication is basically referring to diversification of exports into new products (extensive margin
products) and usually with higher value-added.
DZA
AUS
BWA
BRA
CHL
CHN
COD
EGY GNQ
ETHGNB
IND
ITL
LES
LBRLBY
LUX
MDG
MWI MLI
MNG
RUS
SYCZAF
USA
ZAM
y = 0.1666x + 7.8908
R2 = 0.5308
8
8.5
9
9.5
10
10.5
4.5 5.5 6.5 7.5 8.5 9.5 10.5 11.5 12.5
GDP per capita (log)
EX
PY
(lo
g)
8
for a greater variety of goods as income rises. A rising middle class in Africa can be expected to
demand a larger variety of goods (AfDB, 2011). UNECA‘s work on export diversification has
reiterated the justifications for diversification with respect to the growth dynamics (UNECA and
AUC, 2007, 2011; Karingi and Spence, 2011).
Ben Hammouda et al. (2006) offer a richer analysis of the diversification regimes in
Africa, found that there is little economic diversification despite prolonged periods of peace and
stability, some African economies remain poorly diversified, such as Burkina Faso and
Seychelles. Also, some African economies—for instance, Mozambique and Malawi—started the
process but have not made any significant breakthrough in diversifying agricultural products and
yet to diversify into the higher value activities. Nonetheless, the authors found that some African
economies with deepened diversification process are indeed engaging in structural
transformation in a sustainable manner. Tunisia‘s horizontal diversifications into high value
activities and Madagascar‘s capture of vertical value chains in clothing and apparels are
exemplarily. However, the study also found other African economies who were backsliding in
the diversification process. Typically, African economies which have struggled to move into new
sectors is due to rising commodity prices which leads to an ever increasing concentration of
exports, enclave economies and Dutch disease effect9. Guinea-Bissau and Angola can be
categorised by this regime. Lastly, the study found that countries which went through conflicts
see their diversification prospects negatively impacted. A category which initially included
countries like Liberia, Sierra Leone and the Democratic Republic of Congo, have positive
diversification outcomes in more stable years.
Export diversification through product differentiation in Africa has not been subject to
extensive economic scrutiny. Brenton et al. (2007) articulate a convincing case for low income
countries to focus on greater differentiation of existing products, rather than attempting to
diversify directly into new export categories. This stems from the observation that export growth
at the intensive margin is far more significant for developing countries than that at the extensive
margin (i.e. export growth is dominated by intensifying trade in existing products rather, than
undertaking new export activities – see Amurgo-Pacheco and Pierola, 2007; Brenton and
9A negative relationship between increased exploitation of natural resources and a decline in manufacturing sector.

9
Newfarmer, 2009). This may be linked to the fact that the gains from developing new goods for
export are socialised through information spillovers, yet the costs are private, leading to a sub-
optimal level of innovation (Hausmann and Rodrik, 2003).
Moreover, when developing countries do undertake extensive expansion, the survival rate
is very low. With imperfect information firms are ex ante unaware of the profitability of entering
foreign markets, and evidence suggests that Africa is particularly poor at sustaining export
relationships once they are created. Besedes and Prusa (2007) show that African exports would
have had a 3 percentage points higher growth rate if it had South Korea's survival compared to a
1.8 percentage points higher growth rate if it had South Korea's deepening (growth of trade in
surviving relationships). For Malawi, just 35 percent of export flows survive beyond one year
(Brenton et al., 2007). Investing in improving the quality of existing products is further
warranted on the grounds that rich countries import more from countries that produce higher
quality goods (Hallack, 2006). In the policy framework of ‗new structural economics‘ (Lin,
2010) export diversification is best achieved by focusing on existing comparative advantage,
where industries are competitive, leading to the capture of economic rents for reinvestment and
subsequent upgrading of endowments structures.
While this is suggestive of a need to prioritize intensive expansion through greater
differentiation, Kilnger and Lederman (2006) and Cadot, Carrere and Strauss-Khan (2008) show
that the process of diversification (as opposed to export growth) in low income countries is
driven by inside the frontier innovation (emulations) and extensive expansion, suggesting that
African countries should undertake new export activities if it is to succeed in diversifying its
exports, but that they should be in industries in which there is already existing expertise. In
practice the dichotomy between intensive and extensive expansion is of little prescriptive utility
as export growth and diversification requires the upgrading of production of existing exports and
the undertaking of new export activities. This implies that African economies need to explore
dynamic comparative advantages10
when promoting diversification. These are potential sectors
outside Africa‘s main comparative advantage sectors of primary commodities and fuel. The role
10 We thank Patrick Osakwe for raising this issue to our attention.

10
of developing the manufacturing sector therefore is of crucial importance. Structural adjustment
is of course a costly exercise and therefore indentifying the potential success sectors is essential.
The quality of institutions also matters for diversification. Rauch (2007) presents a model
in which institutional reforms is conducive to allowing firms to enter higher value production
activities and improve the results of trade liberalization relative to those targeted towards the
lower value production. Tybout‘s (2000) found that differences between manufacturing
efficiency in developing country firms relative to developed country counterparts are driven by
low incomes in target markets, detrimental macro-policies, high transportation costs,
bureaucracy, and poor rule of law. Given the rising incomes and improved macro-stability in
many African economies, transportation costs and improved rule of law emerge as policy
priorities. Improving intellectual property rights, in particular, can help to privatize some of the
positive externalities generated by new exporters which lead to sub-optimal innovation
(Hausmann and Rodrick, 2003). Greater adherence to international metrology standards is
crucial to ensure that differentiated goods can be assessed on a level playing field. With respect
to infrastructure, its negative impact on trade costs is well established (Freund and Rocha, 2010;
Limao and Venables, 2001).Cheaper international transit is also associated with extensive
expansion (Dennis and Shepard, 2007; Pearson, 2010), while recent evidence from Eastern
Europe shows it is also a driver of product quality (Harding, 2009). Karingi and Spence (2011)
also found infrastructure to be a significant determinant of both productivity and export
sophistication in the African context.
Overall, while the literature on export diversification have argued for the prioritization of
intensive or extensive margins respectively or both, we put forward an argument that there is a
case for African countries to pursue export expansion through the intensive margin—through
product differentiation—and also extensive margin conditional on existing industries
competitiveness to compete in foreign markets.
(ii) Intra-Industry Trade
Classical and neo-classical trade theories hypothesize that trade occurs because of
differences between economies and the subsequent prospect of gains from specialization. The
classical economist, Adam Smith (1776), developed the theory of absolute advantage and was

11
the first to argue the need for free trade to benefit a country. Two influential theories on
international trade have been developed based on Adam Smith's absolute advantage theory. The
first was David Ricardo's (1817) comparative advantage theory and later, two Swedish
economists, Eli Hecksher and Bertil Ohlin, develop the Heckscher-Ohlin theory (1933) of
international trade.
According to Ricardian comparative advantage, countries produce and export
commodities in which they have a relative cost advantages and import those commodities in
which they have a relative cost disadvantage. The Ricardian model explained that specialization
based on differences in labour productivity using different technologies determines a country‘s
comparative advantage. The Heckscher-Ohlin trade model extended the Ricardian model to show
that countries specialize and export products that use their abundant and cheap factors of
production and import products that use the countries' scarce (and therefore costly) factors.
Hence, factor endowments (capital, land and labour) determine a country's comparative
advantage.
However, a new trade pattern has emerged in most developed countries—increased intra-
industry trade—of which the classical theories of Smith, Ricardo and Hecksher-Ohlin could not
fully account for. Moreover, the classical trade theories above emphasised that firms have
homogeneous productivity and thus are expected to trade in similar quality goods, which is no
longer the case today. Balassa (1966) and Grubel (1967) were among the first to observe
tendencies towards trade of similar but differentiated products—intra-industry trade—rather than
specialization, in the trading patterns of the European Economic Community. Their work
heralded the search for new theories of international trade capable of explaining the phenomenon
of intra-industry trade. Of the ‗new‘ trade theories, Krugman (1979; 1980) and Lancaster‘s
(1980) monopolistic competition models are among the best known. They introduce two key
assumptions: increasing returns to scale and consumers love for variety. Under the assumption of
increasing returns to scale, large firms have a cost advantage over smaller firms and
monopolistic competition ensues. Opening up to trade means firms can serve a larger market and
hence reduce costs and consumers can benefit from an increased range of varieties. Increased
competition may also force prices down but consequently forcing smaller firms out of the
market. Brander and Krugman (1983) add that intra-industry trade may take place even in
12
instances in which goods are homogenous. Domestic monopolists may enter foreign markets at a
lower price than that charged for goods at home leading to the prospect of ‗reciprocal dumping‘:
two-way trade in the same product, even if the goods is identical, the initial prices are equal and
trade is costly11
.
Theories of economic geography add another possible explanation for intra-industry
trade. The role of external returns to scale is more explicit here. The argument is that
geographical location of firms leads to the development of clusters with technological and
pecuniary externalities and external economies of scale. The success of the gravity model of
trade flows also underlines that distance matters, and proximity to markets is a significant
determinant of trade (gravity models also reflect the Linder hypothesis, which proposes that trade
often occurs between similar sized economies – see Linder, 1961). Lastly, geographically
fragmented production sees different stages of the value change dispersed across countries
according to factor endowments or labor productivity. This can occur within multinational firms
or between firms at different levels of the supply chain. Ether (1982) presents a model through
which restricted trade in intermediate goods requires final good production to be located near to
intermediate goods, explaining the emergence of industrial clusters.
Debaere (2005) shows that new trade theory doesn‘t hold for non-OECD countries where
many of the key assumptions—namely mature industries capable of realizing economies of scale
and trading highly differentiated goods—do not reflect realities of African economies. Somewhat
crudely we can say that factor endowments determine North-South trade in line with the
Heckscher-Ohlin framework, with new trade theories offering insights into North-North trade.
However, intra-industry trade is emerging as vital to our understanding of South-South trade.
Indeed, UNCTAD (2011) suggests three alternative analytical frameworks of South-South trade
in which intra-industry trade is pivot. Firstly, the flying geese model (Akamatsu, 1962) of
regional industrialization allowed East Asian economies to dovetail on the success of regional
leaders. Intra-industry trade here is mechanism for learning, as low flying geese import more
sophisticated goods from their neighbors at first as a means of acquiring production know-how
which allows for their manufacture for reverse export. Secondly, new-centre-periphery patterns
11 In other words, Country A exports product ―a‖ to Country B and importing ―a bis‖ from any other country,
including potentially but not necessarily Country B.
13
envisage that African countries may be subject to foreign FDI flows in the shape of large multi-
national corporations which engage in intra-firm, intra-industry trade, but bring little in terms of
diversification or development. Thirdly, the emergence of regional growth poles may lead to
external economies of scale and agglomeration economies, allowing for product differentiation
and intra-industry trade. We may add a fourth analytical framework in the shape of regional
value chains. In a Ricardian perspective of intra-industry trade relatively capital-intensive
economies can specialize in the production of finished products, the intermediate inputs for
which can be off shored to relatively labor abundant economies thereby generating region value
chains (Falvey, 1981;Hirchberget al., 1994).The importation of raw materials for processing and
subsequent re-export is an example of vertical intra-industry trade, that in which the traded goods
which differ by quality rather than horizontally differentiated goods, which differ by price
(Fontagné and Freudenberg, 1997).
14
(3) The Status and Evolution of Export Diversification and Intra-industry Trade in Africa
(i) Export Diversification Index for Africa
This section evaluates the evolution and status of African economies export
diversification patterns. A Normalised Herfindahl-Hirschman Index (see Hirshman,1964;
UNECA and AUC, 2007) is use to estimate export diversification (or concentration), and is
given by:
𝐻 =
𝑥𝑖
𝑥𝑖𝑁𝑖=1
2
𝑁𝑖=1 −
1
𝑁
1 − 1
𝑁
where ‗ ix ‘ is the exports of product‗ i ‘, and ‗ N ‘ is the number of products considered. The
index ‗H‘ denotes values 10 H ; an index value closer to 1 represents extreme concentration
(low export diversification) and value close to 0 attests of high diversification.
The normalised Herfindahl-Hirschman Index is computed using the BACI dataset
(Gaulier and Zignago, 2010) created by the Centre d’Etudes Prospectivesetd’ Informations
Internationales (CEPII). The BACI dataset reconciles the trade flows reported to UN
COMTRADE by exporter and importer at the Harmonized System 6-digit level (HS6), vastly
improving the reliability of the data coverage vis-à-vis the original dataset. The database covers
more than 200 countries and 5,000 products. We use the nomenclature Harmonised System
1996, which covers the years 1998 to 2009. Data is currently available for 51 of the 56
economies in the dataset. Western Sahara and St. Helena are omitted leaving a sample of 49. The
Southern African Customs Union (SACU) is reported as one entity in the dataset. Hence, the
external trade of its members (Botswana, Lesotho, Namibia, South Africa and Swaziland) is
grouped together making it impossible to examine intra-industry trade between members (see

15
Visser, 2001; Carraneo and Fryer, 2003; TIPS and AusAid, 2006 for analysis of intra-industry
between Southern African countries).12
Aggregating regional trade flows (see Figure 2), we find that Africa lags behind other
regions in terms of export diversification, and is actually moving toward further concentration in
the products it exports over the period 1998-2009. Given the prominent role of fuel in Africa‘s
total exports, the rising fuel price over the period is one explanatory factor (a higher oil price
increases the value of oil exports relative to non-oil exports and hence the export basket is more
concentrated).
Figure 2: Export Diversification by Regions (1998-2009)
Source:Author‘s estimates using BACI data set.
Figure 3 reports the normalized-Hirschman Index for 49 African economies in 2009, with full
results for each year in the period 1998-2009 presented in Appendix 1 Table 6. The most striking
observation is the large heterogeneity in the concentration of exports, and a broadly uniform
distribution across that concentration. Therefore, while it is true that Africa lags behind other
12 Trade and Industrial Policy Strategies (TIPS) have also developed a set of analytical templates which includes
data on intra-industry trade for SADC countries. They area available online at: www.tips.org.za
0
0.05
0.1
0.15
0.2
0.25
0.3
0.35
0.4
0.45
0.5
1998 1999 2000 2001 2002 2003 2004 2005 2006 2007 2008 2009
No
rmal
ise
d H
erf
ind
ahl-
Hir
sch
man
Ind
ex
Africa Americas Asia Europe Pacific

16
regions with respect to export diversification, to say that African economies are poorly
diversified masks the vast range of diversification regimes.
Figure 3: Normalised Herfindahl-Hirschman Index, 2009
Source:Author‘s estimates using BACI data set.
What explains this heterogeneity? Given the large number of small economies in Africa one may
expect that the ability to export a large spectrum of goods be limited by the size of the economy
but there is no apparent correlation between GDP and diversification (Figure 4). Imbs and
Wacziarg (2003) found that diversification follows a two stage process, in which growth in early
stages of development is accompanied by diversification, until a turning point upon which the
trend reverses toward increasing specialization once more in a relationship replicated for exports
by Klinger and Lederman (2006), albeit at a slightly higher turning point. Few African
economies are at the level of development associated with the turning point toward
specialisation, suggesting that further growth can lead to greater diversification. Each study
adopts a measure of GDP per capita, and there is faint evidence of this relationship in Africa
0
0.1
0.2
0.3
0.4
0.5
0.6
0.7
0.8
0.9
1
African Sample Weighted Average
17
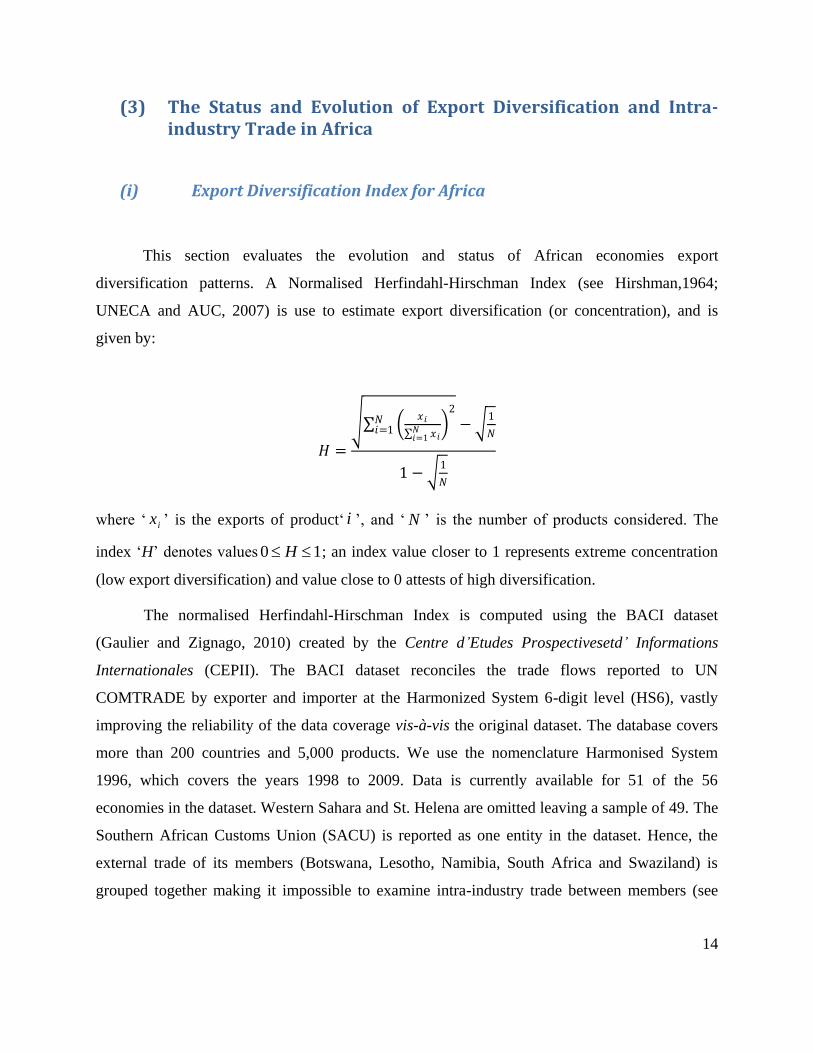
(figure 5), although oil exporting economies with relatively large GDPs poor poorly diversified
exports are anomalies inconsistent with the two-stage diversification hypothesis.
Figure 4:GDP vs. Normalised Herfindahl-Hirschman Index, 2009
Source:Author‘s estimates using BACI data set and UNCTADstat.
Figure 5:GDP per capita (current US$) vs. Normalised Herfindahl-Hirschman Index, 2009
DZAAGO
BEN BFA
BDI
CMR
CPV CAF
TCD
COM
COG
ZARCIV
DJI
EGY
GNQ
ERI
ETHGAB
GMB
GHA
GIN
GNB
KEN
LBR
LBY
MDGMWI
MLI
MRT
MUS
MAR
MOZNER
NGA
RWA
ZAF
STP
SEN
SYCSLE SOM
SDN
TZA
TGO
TUNUGA ZMB
ZWE
1
10
100
1000
10000
100000
1000000
0 0.1 0.2 0.3 0.4 0.5 0.6 0.7 0.8 0.9 1
GD
P, c
urr
en
t U
S$
Normalised Herfindahl-Hirschman Index
DZA
AGO
BEN
BFABDI
CMR
CPV
CAF
TCD
COM
COG
ZARCIV
DJIEGY
GNQ
ERIETH
GAB
GMB
GHA
GIN
GNB
KEN
LBR
LBY
MDG
MWIMLIMRT
MUS
MAR
MOZ
NERNGA
RWA
ZAF
STP
SEN
SYC
SLE
SOM
SDN
TZA
TGO
TUN
UGA
ZMB
ZWE
0
0.1
0.2
0.3
0.4
0.5
0.6
0.7
0.8
0.9
1
0 2000 4000 6000 8000 10000 12000 14000 16000
No
rmal
ise
d H
erf
ind
ahl-
Hir
sch
man
Ind
ex
GDP per capita, current US$
18
Source:Author‘s estimates using BACI data set and UNCTADstat.
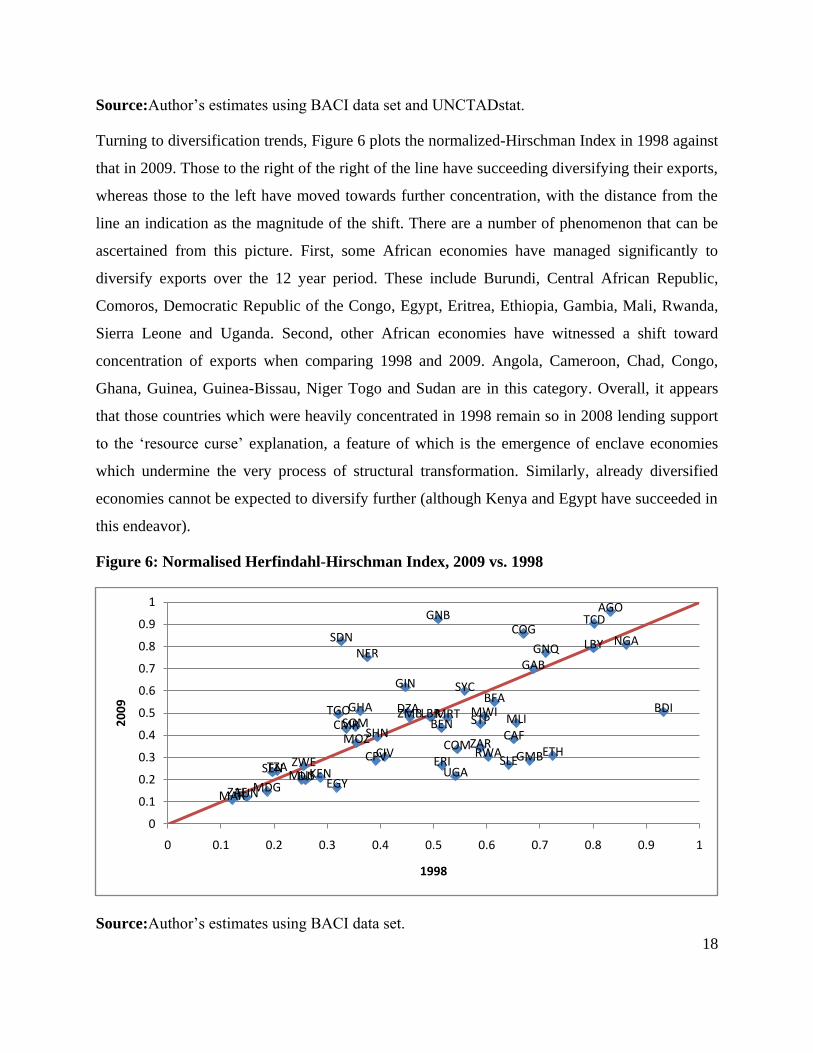
Turning to diversification trends, Figure 6 plots the normalized-Hirschman Index in 1998 against
that in 2009. Those to the right of the right of the line have succeeding diversifying their exports,
whereas those to the left have moved towards further concentration, with the distance from the
line an indication as the magnitude of the shift. There are a number of phenomenon that can be
ascertained from this picture. First, some African economies have managed significantly to
diversify exports over the 12 year period. These include Burundi, Central African Republic,
Comoros, Democratic Republic of the Congo, Egypt, Eritrea, Ethiopia, Gambia, Mali, Rwanda,
Sierra Leone and Uganda. Second, other African economies have witnessed a shift toward
concentration of exports when comparing 1998 and 2009. Angola, Cameroon, Chad, Congo,
Ghana, Guinea, Guinea-Bissau, Niger Togo and Sudan are in this category. Overall, it appears
that those countries which were heavily concentrated in 1998 remain so in 2008 lending support
to the ‗resource curse‘ explanation, a feature of which is the emergence of enclave economies
which undermine the very process of structural transformation. Similarly, already diversified
economies cannot be expected to diversify further (although Kenya and Egypt have succeeded in
this endeavor).
Figure 6: Normalised Herfindahl-Hirschman Index, 2009 vs. 1998
Source:Author‘s estimates using BACI data set.
DZA
AGO
BEN
BFABDI
CMR
CPV
CAF
TCD
COM
COG
ZARCIV
DJIEGY
GNQ
ERIETH
GAB
GMB
GHA
GIN
GNB
KEN
LBR
LBY
MDG
MWIMLIMRT
MUS
MAR
MOZ
NERNGA
RWA
STP
SEN
SYC
SLE
SOM
ZAF
SHN
SDN
TZA
TGO
TUN
UGA
ZMB
ZWE
0
0.1
0.2
0.3
0.4
0.5
0.6
0.7
0.8
0.9
1
0 0.1 0.2 0.3 0.4 0.5 0.6 0.7 0.8 0.9 1
20
09
1998

19
(ii) Intra-Industry Trade
This section unpacks the current status of intra-industry trade in Africa. It employs the
Grubel-Lloyd index (Grubel and Lloyd, 1975), an accepted measure of the proportion of total
trade which is intra-industry in nature, which is defined as:
𝐺𝐿𝐼𝑗 = 𝑥𝑖 + 𝑚𝑖 − |𝑥𝑖 − 𝑚𝑖|
𝑁𝑖=1
𝑥 𝑖 + 𝑚𝑖 𝑁𝑖=1
= 1 − |𝑥 𝑖 − 𝑚𝑖|
𝑁𝑖=1
𝑥 𝑖 + 𝑚 𝑖 𝑁𝑖=1
where 𝐺𝐿𝐼𝑗 is the Grubel-Lloyd Index for country j, which is scaled between 0 (no intra-industry
trade) and 1 (all trade is intra-industry); 𝑥𝑖 and 𝑚𝑖 represent country j‘s exports and imports of
product i respectively; and N is the total number of product lines.13
From existing research we know that intra-industry trade in Africa is low compared to
other regions. Figure 7 presents results of a World Bank study, showing that while the proportion
of African trade which is intra-industry in nature has increased from 1980 to 1998, the share of
IIT in total trade still lags behind all other regions.
Figure 7: Grubel-Lloyd Index of IIT by Regions, 1980 and 1998
Source: Ferranti et al. (2002)
13 An important criticism of the Grubel–Lloyd index is that it is not independent of the trade balance. The upper
bound of the index is negatively related to the size of the trade balance, meaning a larger imbalance is associated
with lower reported IIT. Aquino (1978) suggested an adjustment, which has fallen out of favour following a critique
by Greenaway and Milner (1986) meaning the issue remains empirically unresolved.

20
The BACI dataset used to calculate the Normalised Herfindahl-Hirschman Index above
can also be utilised to compute the Grubel-Lloyd Index for the 49 African economies identified.
The Grubel-Lloyd Index is extremely sensitive to the level of data aggregation, with analyse at
the 6 digit level allowing for the narrowest definition of ‗industry‘ available – meaning that only
simultaneous import and export of goods in the same product line are deemed intra-industry.
Brülhart's (2009) study, based on bilateral trade flows, defines intra-industry trade as the
simultaneous exports and imports of a given product between pairs of countries. Our analysis
employs a multilateral approach with trade aggregated across all partners and intra-industry trade
is said to be present as long as there is simultaneous exportation and importation of the given
product. This approach is preferred for two reasons. Firstly, while there is certainly further scope
for diversification in Africa‘s trading relationships, the imperative to diversify its products as
outlined above is more pressing and may well be a precursor to diversification of partners. As
such, we define export diversification in terms of products, not partners. Hence, a similar
definition of intra-industry trade is appropriate. Secondly, and somewhat more pragmatically,
under Brülhart's (2009) bilateral methodology, no African economy was said to have intra-
industry trade greater than 5 per cent of total trade and for numerous other African economies,
there was virtually no intra-industry trade. This provides very little scope for further analysis
relative to the multilateral approach which by definition returns a larger value of intra-industry
trade. Comparative analysis among the world‘s regions is not undertaken here, but we know
from existing surveys (Brülhart, 2009; World Bank, 2002; UNCTAD, 2011) that intra-industry
trade in Africa is low relative to other regions. Lastly, Grubel-Lloyd indices are computed across
the seven Broad Economic Categories (BECs) to provide insight into variations in intra-industry
trade across product categories.14
The Grubel-Lloyd Index for each African country is reported in Table 1. The first
observation is that intra-industry trade is generally rather low at around 10 per cent for the
average African economy. For 32 of the countries in our sample of 50, however, intra-industry
14The Broad Economic Categories (BEC) were developed in the late 1960s to summarise data on international trade
in goods. The classification by BEC are as follows; BEC 1 – Food and Beverages, BEC 2 – Industrial supplies not
elsewhere specified, BEC 3 – Fuels and Lubricants, BEC 4 – Capital Goods (except transport equipment), and parts
and accessories thereof, BEC 5 – Transport equipment and parts and accessories thereof, BEC 6 – Consumer Goods
not elsewhere specified, BEC 7 – Goods not elsewhere specified.

21
trade is below average, and for 8 economies the level of intra-industry trade is less than 2 per
cent. With the average skewed by the strong performance of a handful of countries the median
rate of intra-industry trade in a meagre 5 per cent. Turning to the strong performers, there are 8
economies in which intra industry trade exceeds 20 per cent of total trade. The finding that
Equatorial Guinea enjoys the largest rate of intra-industry trade in Africa is somewhat surprising
given that its external trade is highly concentrated in fuels. Indeed, analysis of intra-industry
trade by Broad Economy Category (BEC) reveals that out with Broad Economic Category 3, that
pertaining to fuels and lubricants, intra-industry trade is in fact very low. This result can be
attributed to the lack of refinery capacity in Equatorial Guinea, requiring the exporting and re-
importing of its petroleum products. When BEC 3 is removed from the analysis, Equatorial
Guinea falls from the top of the stack to third from the bottom. This pattern is repeated, albeit to
a lesser extent, for Cameroon, Niger, Libya and Cote d'Ivorie. For trade flows excluding BEC 3,
those countries with the highest Grubel-Lloyd indices are SACU (31 percent), Tunisia (27 per
cent), Uganda (20 per cent), Mauritius (18 per cent) and Egypt (17 percent).

22
Table 1: Grubel-Lloyd Index by Broad Economic Category, 2009
Country
Grubel-Lloyd
Index Grubel-Lloyd Index by Broad Economic Category
Grubel-Lloyd
Index excluding
BEC 3
Rank GL BEC1 BEC2 BEC3 BEC4 BEC5 BEC6 BEC7 Rank GL
Equatorial Guinea 1 0.544 0.000 0.002 0.638 0.009 0.017 0.004 0.000 47 0.007
Tunisia 2 0.289 0.117 0.227 0.447 0.413 0.295 0.223 0.022 2 0.267
SACU 3 0.286 0.205 0.231 0.171 0.348 0.570 0.378 0.404 1 0.306
Senegal 4 0.252 0.126 0.205 0.592 0.115 0.146 0.230 0.199 6 0.166
Cote d'Ivoire 5 0.227 0.039 0.148 0.605 0.161 0.231 0.162 0.854 15 0.105
Egypt 6 0.222 0.121 0.190 0.459 0.110 0.122 0.313 0.022 5 0.173
Uganda 7 0.206 0.189 0.196 0.274 0.220 0.227 0.147 0.034 3 0.196
Mozambique 8 0.204 0.201 0.067 0.607 0.151 0.102 0.080 0.010 12 0.112
Cameroon 9 0.196 0.014 0.032 0.613 0.068 0.021 0.058 0.003 28 0.033
Mauritius 10 0.175 0.171 0.185 0.108 0.214 0.101 0.184 0.059 4 0.179
Kenya 11 0.164 0.098 0.167 0.206 0.159 0.158 0.218 0.028 8 0.156
Liberia 12 0.152 0.026 0.004 0.030 0.015 0.175 0.073 0.024 7 0.159
Zambia 13 0.144 0.126 0.149 0.094 0.156 0.174 0.085 0.056 9 0.147
Morocco 14 0.139 0.079 0.121 0.134 0.185 0.174 0.157 0.003 10 0.139
Niger 15 0.130 0.016 0.014 0.764 0.037 0.016 0.010 0.000 39 0.019
Djibouti 16 0.123 0.138 0.080 0.579 0.057 0.215 0.044 0.107 14 0.106
Seychelles 17 0.120 0.202 0.047 0.621 0.122 0.019 0.066 0.000 13 0.110
Zimbabwe 18 0.105 0.086 0.146 0.015 0.086 0.060 0.075 0.016 11 0.113
Tanzania 19 0.099 0.105 0.085 0.113 0.114 0.080 0.136 0.187 17 0.097
Sierra Leone 20 0.098 0.028 0.053 0.051 0.167 0.243 0.113 0.000 16 0.101
Madagascar 21 0.085 0.080 0.059 0.211 0.113 0.105 0.056 0.458 19 0.075
Rwanda 22 0.071 0.036 0.037 0.015 0.072 0.372 0.038 0.004 20 0.075
Malawi 23 0.071 0.040 0.084 0.007 0.071 0.090 0.078 0.002 18 0.075
Libya 24 0.060 0.008 0.016 0.085 0.010 0.005 0.002 0.000 46 0.010
Gambia 25 0.052 0.031 0.080 0.004 0.035 0.062 0.059 0.000 21 0.055

23
Country
Grubel-Lloyd
Index Grubel-Lloyd Index excluding BEC 3
Grubel-Lloyd
Index excluding
BEC 3
Rank GL BEC1 BEC2 BEC3 BEC4 BEC5 BEC6 BEC7 Rank GL
Burundi 26 0.048 0.047 0.012 0.530 0.058 0.145 0.038 0.000 24 0.043
Sao Tome and
Principe 27 0.046 0.006 0.019 0.227 0.044 0.041 0.031 0.000 38 0.022
Togo 28 0.041 0.017 0.090 0.001 0.016 0.004 0.014 0.000 22 0.044
Ethiopia 29 0.036 0.043 0.015 0.000 0.061 0.075 0.043 0.000 25 0.041
Nigeria 30 0.034 0.010 0.048 0.027 0.059 0.040 0.067 0.084 23 0.044
Sudan 31 0.033 0.026 0.007 0.055 0.033 0.022 0.004 0.024 41 0.018
Eritrea 32 0.031 0.007 0.050 0.000 0.047 0.044 0.036 0.000 27 0.034
Algeria 33 0.029 0.041 0.026 0.025 0.018 0.070 0.012 0.000 29 0.033
Ghana 34 0.029 0.025 0.027 0.074 0.027 0.015 0.029 0.000 34 0.026
Somalia 35 0.028 0.036 0.007 0.004 0.010 0.068 0.028 0.148 32 0.029
Mali 36 0.028 0.005 0.032 0.071 0.047 0.006 0.016 0.000 36 0.023
Burkina Faso 37 0.028 0.035 0.023 0.001 0.037 0.051 0.056 0.000 30 0.032
Angola 38 0.022 0.002 0.027 0.019 0.052 0.016 0.007 0.003 33 0.028
Gabon 39 0.022 0.011 0.007 0.014 0.050 0.118 0.036 0.000 31 0.029
Central African Rep. 40 0.021 0.025 0.009 0.000 0.059 0.028 0.010 0.000 37 0.022
Cape Verde 41 0.020 0.020 0.006 0.000 0.034 0.020 0.049 0.030 35 0.023
Congo 42 0.019 0.005 0.008 0.021 0.033 0.029 0.008 0.005 43 0.016
Comoros 43 0.017 0.002 0.009 0.000 0.032 0.040 0.010 0.146 42 0.018
Guinea 44 0.016 0.028 0.009 0.001 0.052 0.021 0.006 0.000 40 0.018
Congo, Dem. Rep. 45 0.015 0.012 0.010 0.014 0.033 0.037 0.018 0.000 44 0.015
Chad 46 0.013 0.081 0.012 0.002 0.044 0.065 0.020 0.000 26 0.038
Guinea-Bissau 47 0.010 0.005 0.026 0.000 0.034 0.012 0.019 0.000 45 0.013
Benin 48 0.007 0.003 0.003 0.031 0.011 0.001 0.013 0.000 49 0.005
Mauritania 49 0.005 0.005 0.002 0.000 0.013 0.018 0.009 0.000 48 0.005
Median - 0.050 0.030 0.029 0.041 0.055 0.061 0.044 0.002 - 0.039
Weighted Average - 0.147 0.082 0.139 0.146 0.163 0.201 0.178 0.177 - 0.147

24
Closer scrutiny of IIT in BEC 3 there are a range of countries exhibiting high intra-
industry trade while the majority show relatively low IIT. Some oil exports including Cote
d‘Ivoire, Egypt and Equatorial Guinea, show large shares of intra-industry trade in fuels
indicating re-imports of exported products. However, most African oil exporters such as Algeria,
Angola, Chad, Congo, Gabon, Libya, Nigeria, and Sudan have very low intra-industry trade
indices. This general pattern reflects the well establish comparative advantages of African
economies, with the pattern replicated for BEC 7 (good not specified elsewhere) which includes
metals.
With the exception of extractive industries (BEC 3 and BEC7) there is relatively little
variance in IIT across BECs: countries with low IIT have low IIT and each category, and
countries with high IIT have high IIT in each category. Rwanda is a notable exception which has
low IIT in all categories except BEC 5 transport equipment and parts and accessories thereof, for
which the Grubel-Lloyd index is 37 per cent. It is interesting to note, however, that the two
entities with the highest intra-industry trade, SACU and Tunisia, have considerably higher IIT in
higher value added activities (BEC 4-6). This is suggestive of a possible threshold effect through
which intra-industry trade is relatively constant across product lines until a particular threshold,
after which there is little scope for further IIT in low value added activities but IIT continues to
grow in higher valued added activities which have more scope for differentiation. Given the low
level of IIT in Africa it is not possible to test such a hypothesis, however, and it remains highly
speculative.
The reasons for the generally low levels of intra-industry trade are suggested by the
theory discussed in Section 2. Firstly, the small size of many African economies is insufficient to
generate meaningful economies of scale to overcome trade costs. Indeed, the positive
relationship between income and IIT shown in Figure 14 (Appendix 4) implies that larger
economies may be able to benefit from economies of scale which in turn leads to deeper intra-
industry trade. Note that the positive relationship is slightly undermined, however, by a cluster of
high income countries for which there is little intra-industry trade owing to the concentration of
oil exports in their trade regimes (these countries include Algeria, Angola, Libya, Nigeria and
Sudan). Of course, this primary commodity concentration means that exports structures are
similar across countries with a focus on low value-added, poorly differentiated exports. The lack
of a mature manufacturing sector in most countries means there is little trade in finished

25
products, so there are few African varieties of manufactured goods for consumers to choose
from. The positive relationship between the share of manufacturing in GDP and IIT (Figure 15,
Appendix 5) implies that the greater scope for economies of scale and differentiation in the
manufacturing sector can lead to intra-industry trade.
Thirdly, trade costs are prohibitively high, and those African economies which have
developed industrial bases are geographically dispersed, making intra-industry trade
costly.15
Fourthly, intellectual property right development is poor,16
meaning that the incentive to
differentiate goods through branding in African economies is not well protected. Not one African
brand was featured in the top 100 most valuable global brands in a recent survey (Interbrand,
2011). Similarly, there are very few African multinational firms relative to other regions—many
of which are concentrated in extractive industries—implying that intra-firm (intra-industry) trade
is virtually non-existent.17
Lastly, a bias against domestic goods has been observed in many African countries, with
some research indicating a preference for imports from technologically more advanced countries
(Agbonifoh and Elimimian, 1999; Okechuku and Onyemah, 1999; Opoku and Akorli, 2009).
This preference for goods not ―made in Africa‖ means that differentiated goods that are produced
on the continent are less preferred, with origin of the product often more important than its price
or other attributes.18
Figure 16 (Appendix 6) compares intra-African intra-industry trade to that
with all trading partners. It shows that the economies with the largest total intra-industry trade,
Tunisia (28 percent) and SACU (28 per cent) have relatively low intra-African intra-industry
trade implying that their intra-industry trade is dominated by trade with trading partners located
outside Africa. This is not consistent with the trend, however, with most African economies
undertaking more intra-industry trade with each other than they do with external partners.
Geographical proximity is one possible explanation, as is the observation that intra-African trade
contains more value added, and hence more differentiated goods, than that with the rest of the
world (Gĩthĩnji, 2011). Members of the East African Community (EAC) in particular enjoy
higher intra-African IIT than that with all partners. In addition, we find that Uganda (32 percent),
15 See Appendix 2, Figure 12 16 According to Property Rights Alliance (2011), Africa has the lowed Intellectual Property Right Index of all
regions of the world, see Appendix 3, Figure 13. 17 See The Africa Report; available online at <http://www.theafricareport.com> 18‗Proudly South African‘, Uganda‘s ‗Gifted by Nature‘ and Nigeria‘s ‗Heart of Africa‘ are among the initiatives
designed to address this problem.
26
Zambia (20 percent), Tanzania (18 percent), Kenya (18 percent), Mauritius (18 percent), Senegal
(17 percent), Sierra Leone (16 percent) and Zimbabwe (15 percent) are among the highest intra-
African intra-industry trade economies (excluding BEC 3).
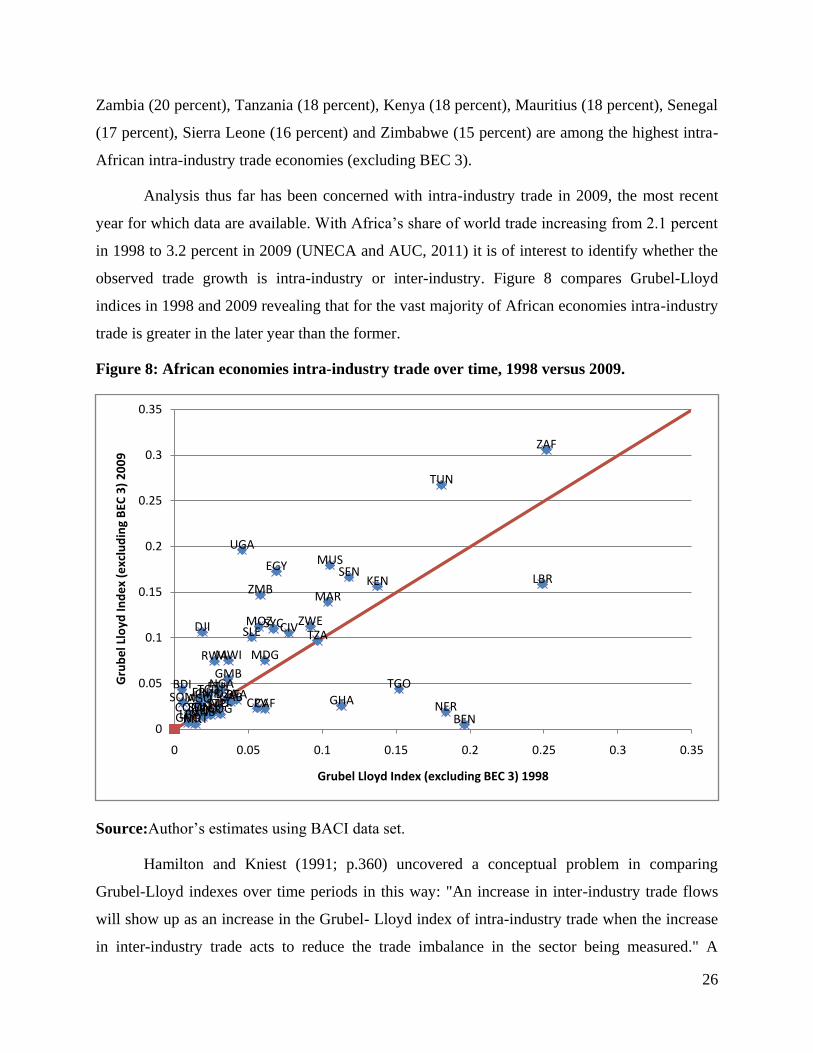
Analysis thus far has been concerned with intra-industry trade in 2009, the most recent
year for which data are available. With Africa‘s share of world trade increasing from 2.1 percent
in 1998 to 3.2 percent in 2009 (UNECA and AUC, 2011) it is of interest to identify whether the
observed trade growth is intra-industry or inter-industry. Figure 8 compares Grubel-Lloyd
indices in 1998 and 2009 revealing that for the vast majority of African economies intra-industry
trade is greater in the later year than the former.
Figure 8: African economies intra-industry trade over time, 1998 versus 2009.
Source:Author‘s estimates using BACI data set.
Hamilton and Kniest (1991; p.360) uncovered a conceptual problem in comparing
Grubel-Lloyd indexes over time periods in this way: "An increase in inter-industry trade flows
will show up as an increase in the Grubel- Lloyd index of intra-industry trade when the increase
in inter-industry trade acts to reduce the trade imbalance in the sector being measured." A
DZAAGOBDI
CMRCPVCAF
TCD
COM COGZARBENGNQ
ETHERI
DJI
GAB
GMB
GHAGIN
CIV
KEN LBR
LBY
MDGMWI
MLIMRT
MUS
MAR
MOZ
NER
NGA
GNB
RWA
STP
SEN
SYCSLE
SOM
ZAF
ZWE
SDN
TGO
TUN
UGA
EGY
TZA
BFA
ZMB
0
0.05
0.1
0.15
0.2
0.25
0.3
0.35
0 0.05 0.1 0.15 0.2 0.25 0.3 0.35
Gru
be
l Llo
yd In
de
x (e
xclu
din
g B
EC 3
) 2
00
9
Grubel Lloyd Index (excluding BEC 3) 1998
27
measure of marginal intra-industry trade has since been developed to capture the proportion of
the increase in imports or exports of a particular industry which is matched by an increase of
exports or imports of the same industry. As a dynamic indictor, it also provides insights into the
process of export diversification that forms the subject of present interest. The favoured measure
of Marginal Intra-industry Trade (MIIT) is that first put forth by Brülhart (1994) and given by:
𝑀𝐼𝐼𝑇𝑖𝑗𝑡 = 1 − |∆𝑡𝑥 𝑖𝑗 − ∆𝑡𝑚𝑖𝑗 |𝑁
𝑖=1
|∆𝑡𝑥 𝑖𝑗 | + |∆𝑡𝑚 𝑖𝑗 | 𝑁𝑖=1
which can be aggregated across industries as follows:
𝑀𝐼𝐼𝑇𝑗𝑡 = 𝑤𝑖𝑗𝑡 𝑀𝐼𝐼𝑇𝑖𝑗𝑡
𝑁
𝑖=1
Where ijtw is the weight of each industry exports and imports in total trade, given by:
𝑤𝑖𝑗𝑡 = ∆𝑡𝑥𝑖𝑗 + ∆𝑡𝑚𝑖𝑗
∆𝑡𝑥𝑖𝑗 + ∆𝑡𝑚𝑖𝑗 𝑁𝑖=1
and ijt x represents the change in exports between two points in time t for country j in product i
respectively; and N is the total number of product lines. Similarly, ijtm represents the change in
imports between two points in time t for country j in product i . As with the Grubel-Lloyd Index,
a value of 0 shows no marginal intra-industry trade while an index of 1 indicates that all of the
observed trade growth is intra industry in nature.
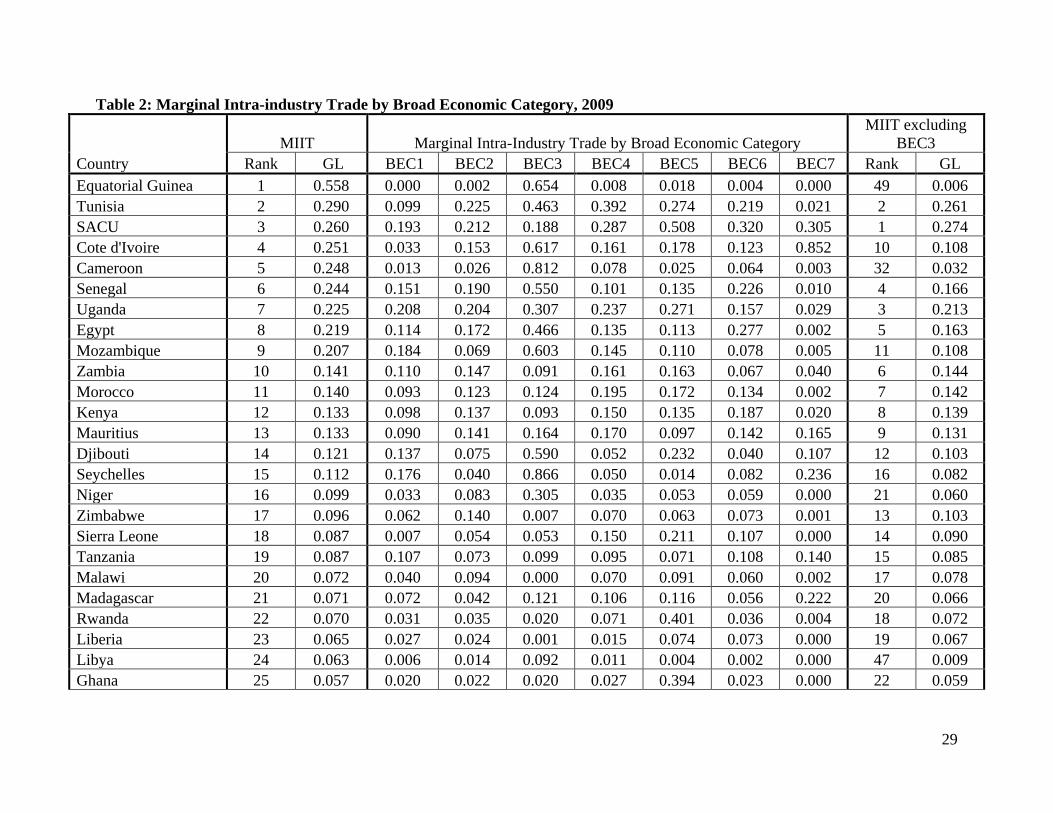
Table 2 reports the marginal intra-industry trade over the period 1998-2009. Given that
intra-industry trade in 2009 remained low for many African economies, it is not surprising that
the trade expansion in these economies has been dominated by inter-industry trade. The high
MIIT reported by Equatorial Guinea draws attention to the bias caused by fuels. Out-with Broad
Economic Category 3, Equatorial Guinea‘s trade expansion contained virtual no intra-industry
trade. Consulting the final column, that which reports MIIT excluding BEC 3, we see that only
five African economies can attribute more than 15 per cent of (non-oil) trade growth to IIT:
SACU, Tunisia, Uganda, Senegal and Egypt. For SACU and Uganda, MIIT is high in transport
equipment (BEC 5), while Tunisia‘s MIIT has been driven by capital goods (BEC 4) and food
and beverages (BEC 1). Thereafter, as was the case for the Grubel-Lloyd Index reported above,

28
results appear to be broadly uniform across economic categories with high MIIT in transport
equipment for Djibouti, Rwanda, Sierra Leone and Ghana clear exceptions.
29
Table 2: Marginal Intra-industry Trade by Broad Economic Category, 2009
Country
MIIT Marginal Intra-Industry Trade by Broad Economic Category
MIIT excluding
BEC3
Rank GL BEC1 BEC2 BEC3 BEC4 BEC5 BEC6 BEC7 Rank GL
Equatorial Guinea 1 0.558 0.000 0.002 0.654 0.008 0.018 0.004 0.000 49 0.006
Tunisia 2 0.290 0.099 0.225 0.463 0.392 0.274 0.219 0.021 2 0.261
SACU 3 0.260 0.193 0.212 0.188 0.287 0.508 0.320 0.305 1 0.274
Cote d'Ivoire 4 0.251 0.033 0.153 0.617 0.161 0.178 0.123 0.852 10 0.108
Cameroon 5 0.248 0.013 0.026 0.812 0.078 0.025 0.064 0.003 32 0.032
Senegal 6 0.244 0.151 0.190 0.550 0.101 0.135 0.226 0.010 4 0.166
Uganda 7 0.225 0.208 0.204 0.307 0.237 0.271 0.157 0.029 3 0.213
Egypt 8 0.219 0.114 0.172 0.466 0.135 0.113 0.277 0.002 5 0.163
Mozambique 9 0.207 0.184 0.069 0.603 0.145 0.110 0.078 0.005 11 0.108
Zambia 10 0.141 0.110 0.147 0.091 0.161 0.163 0.067 0.040 6 0.144
Morocco 11 0.140 0.093 0.123 0.124 0.195 0.172 0.134 0.002 7 0.142
Kenya 12 0.133 0.098 0.137 0.093 0.150 0.135 0.187 0.020 8 0.139
Mauritius 13 0.133 0.090 0.141 0.164 0.170 0.097 0.142 0.165 9 0.131
Djibouti 14 0.121 0.137 0.075 0.590 0.052 0.232 0.040 0.107 12 0.103
Seychelles 15 0.112 0.176 0.040 0.866 0.050 0.014 0.082 0.236 16 0.082
Niger 16 0.099 0.033 0.083 0.305 0.035 0.053 0.059 0.000 21 0.060
Zimbabwe 17 0.096 0.062 0.140 0.007 0.070 0.063 0.073 0.001 13 0.103
Sierra Leone 18 0.087 0.007 0.054 0.053 0.150 0.211 0.107 0.000 14 0.090
Tanzania 19 0.087 0.107 0.073 0.099 0.095 0.071 0.108 0.140 15 0.085
Malawi 20 0.072 0.040 0.094 0.000 0.070 0.091 0.060 0.002 17 0.078
Madagascar 21 0.071 0.072 0.042 0.121 0.106 0.116 0.056 0.222 20 0.066
Rwanda 22 0.070 0.031 0.035 0.020 0.071 0.401 0.036 0.004 18 0.072
Liberia 23 0.065 0.027 0.024 0.001 0.015 0.074 0.073 0.000 19 0.067
Libya 24 0.063 0.006 0.014 0.092 0.011 0.004 0.002 0.000 47 0.009
Ghana 25 0.057 0.020 0.022 0.020 0.027 0.394 0.023 0.000 22 0.059

30
Country
MIIT Marginal Intra-Industry Trade by Broad Economic Category
MIIT excluding
BEC3
Rank GL BEC1 BEC2 BEC3 BEC4 BEC5 BEC6 BEC7 Rank GL
Benin 26 0.051 0.007 0.102 0.028 0.015 0.001 0.041 0.000 23 0.053
Burundi 27 0.049 0.081 0.011 0.482 0.055 0.156 0.034 0.000 24 0.047
Sao Tome and
Principe 28 0.046 0.014 0.020 0.231 0.036 0.024 0.030 0.000 38 0.022
Gambia 29 0.042 0.023 0.059 0.000 0.037 0.021 0.055 0.000 25 0.044
Ethiopia 30 0.038 0.052 0.014 0.000 0.065 0.090 0.041 0.000 26 0.044
Togo 31 0.036 0.023 0.053 0.002 0.041 0.024 0.024 0.000 29 0.037
Algeria 32 0.033 0.051 0.026 0.028 0.020 0.093 0.015 0.000 28 0.039
Sudan 33 0.033 0.022 0.006 0.055 0.036 0.023 0.004 0.023 43 0.017
Central African Rep. 34 0.031 0.088 0.008 0.000 0.061 0.067 0.017 0.000 31 0.032
Somalia 35 0.030 0.039 0.007 0.005 0.010 0.070 0.031 0.148 33 0.031
Nigeria 36 0.028 0.012 0.047 0.016 0.060 0.041 0.054 0.007 27 0.043
Burkina Faso 37 0.027 0.028 0.022 0.000 0.040 0.042 0.060 0.000 34 0.031
Eritrea 38 0.021 0.020 0.024 0.000 0.022 0.022 0.020 0.000 39 0.022
Angola 39 0.021 0.001 0.030 0.017 0.053 0.017 0.007 0.003 35 0.029
Cape Verde 40 0.020 0.019 0.009 0.000 0.035 0.017 0.047 0.025 37 0.023
Congo, Dem. Rep. 41 0.019 0.012 0.018 0.015 0.033 0.043 0.019 0.000 40 0.020
Gabon 42 0.019 0.011 0.009 0.008 0.040 0.038 0.065 0.016 36 0.024
Congo 43 0.018 0.011 0.010 0.019 0.030 0.031 0.009 0.005 42 0.017
Comoros 44 0.017 0.002 0.010 0.000 0.026 0.045 0.013 0.148 41 0.018
Guinea 45 0.013 0.035 0.004 0.000 0.034 0.023 0.017 0.000 45 0.015
Chad 46 0.012 0.082 0.008 0.001 0.044 0.089 0.025 0.000 30 0.037
Mali 47 0.012 0.008 0.008 0.001 0.047 0.007 0.013 0.000 46 0.012
Guinea-Bissau 48 0.010 0.007 0.019 0.000 0.041 0.012 0.021 0.000 45 0.013
Mauritania 49 0.006 0.005 0.002 0.000 0.021 0.023 0.009 0.000 48 0.007
Median - 0.054 0.032 0.028 0.024 0.049 0.065 0.044 0.002 - 0.044
Weighted Average - 0.10 0.057 0.077 0.138 0.092 0.087 0.101 0.427 - 0.083
31
(4) Linking Intra-Industry Trade and Export Diversification in Africa
To recap, based on the statistics of the status of intra-industry trade and export
diversification in Africa, we found that intra-industry trade and export diversification in Africa
lagged behind other regions. In addition, while it was found that a few African economies did
improve intra-industry trade and export diversification over the period, there is a clear pattern
towards sustaining inter-industry trade (which predominantly reflect Africa‘s high dependence
on primary exports) and product concentration. Also, as expected, oil-exporting countries play a
crucial role in sustaining product concentration figures for Africa. With these trends in mind, this
section sets out to explore the relationship between intra-industry and export diversification in
Africa.
Empirical literature on intra-industry trade is suggestive of a strong link with export-
diversification. Ferranti et al. (2002) find a robust positive relationship between intra-industry
trade and export diversification in Latin America, as does Peterson (2005) in South Africa. It is
intuitive that export diversification may increase intra-industry trade if the new product lines
undertaken allow for mutual exchange with trading partners. In this case, diversification expands
intra-industry trade. Diversification may also allow for the movement of capital toward
industries in which economies of scale have not yet been realized thereby further expanding the
opportunities for intra-industry trade.
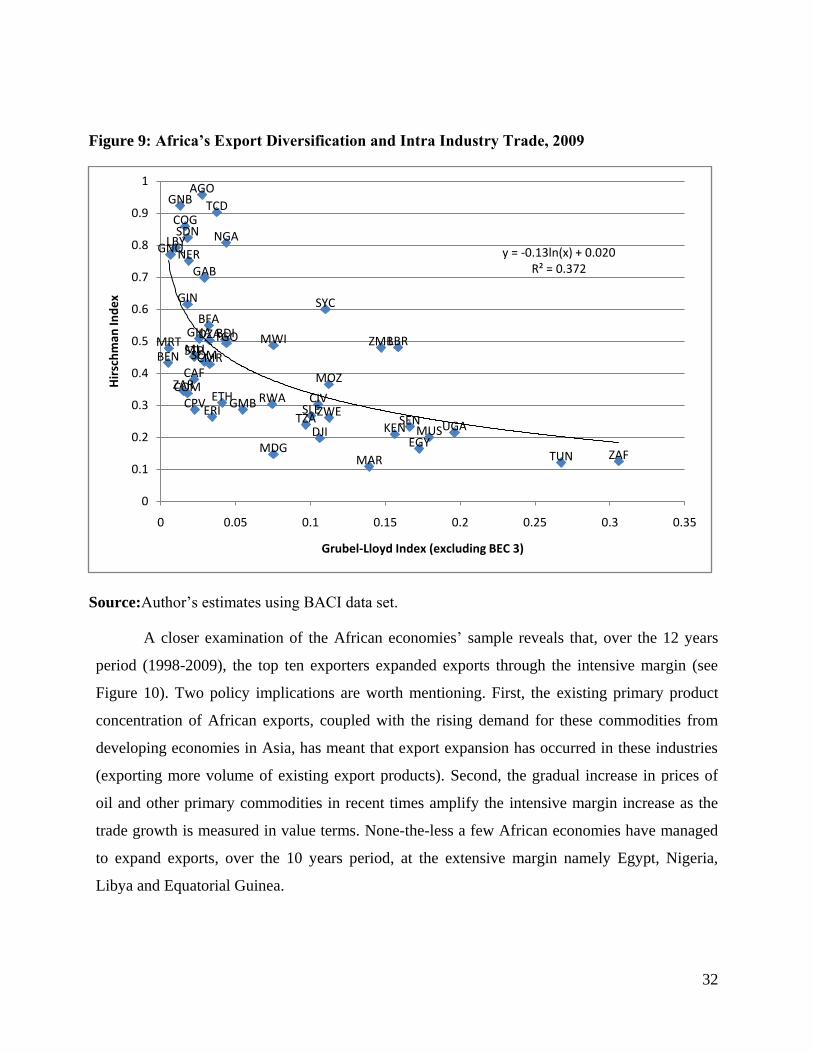
Figure 9 below shows a positive correlation between export diversification and intra-
industry trade for African economies, after isolating BEC 3. While at this point, we have not
established causation, the positive correlation—a formal linkage between the two variables of
interest for African economies is established—allows us to explore potential pathways towards
strengthening the growth of the two variables of interests.
32
Figure 9: Africa’s Export Diversification and Intra Industry Trade, 2009
Source:Author‘s estimates using BACI data set.
A closer examination of the African economies‘ sample reveals that, over the 12 years
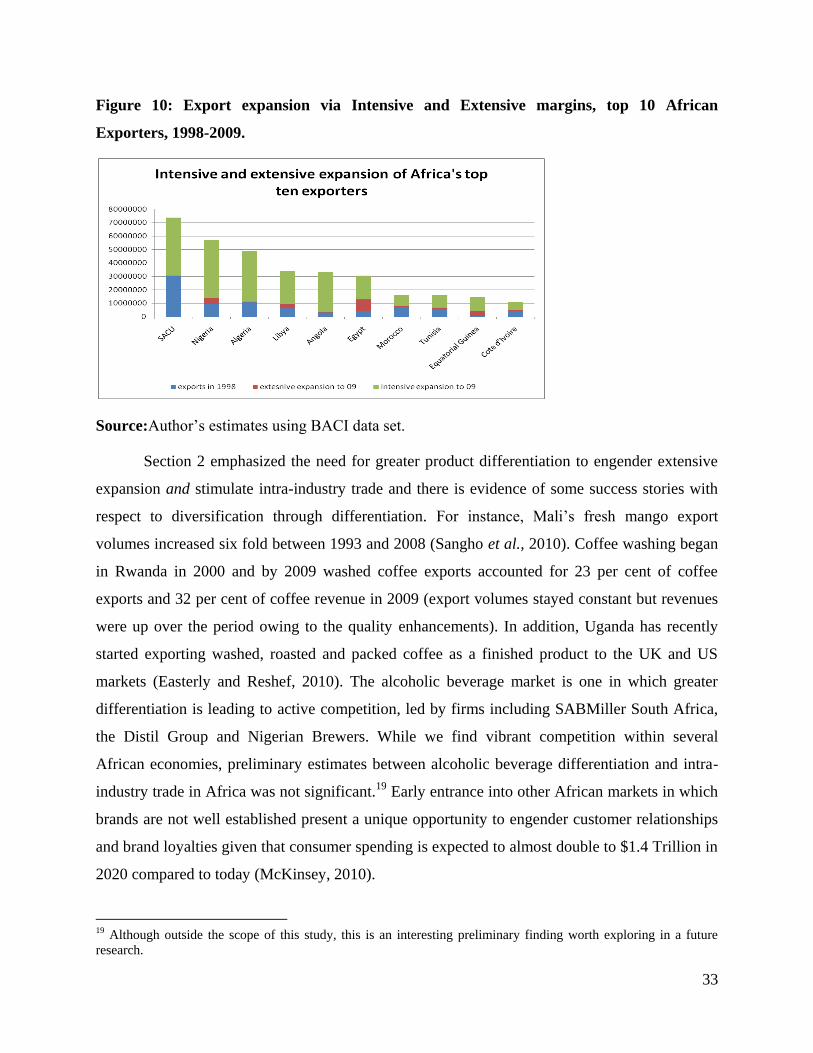
period (1998-2009), the top ten exporters expanded exports through the intensive margin (see
Figure 10). Two policy implications are worth mentioning. First, the existing primary product
concentration of African exports, coupled with the rising demand for these commodities from
developing economies in Asia, has meant that export expansion has occurred in these industries
(exporting more volume of existing export products). Second, the gradual increase in prices of
oil and other primary commodities in recent times amplify the intensive margin increase as the
trade growth is measured in value terms. None-the-less a few African economies have managed
to expand exports, over the 10 years period, at the extensive margin namely Egypt, Nigeria,
Libya and Equatorial Guinea.
DZA
AGO
BEN
BFABDI
CMR
CPV
CAF
TCD
COM
COG
ZARCIV
DJIEGY
GNQ
ERIETH
GAB
GMB
GHA
GIN
GNB
KEN
LBR
LBY
MDG
MWIMLI
MRT
MUS
MAR
MOZ
NER
NGA
RWA
STP
SEN
SYC
SLE
SOM
ZAF
SDN
TZA
TGO
TUN
UGA
ZMB
ZWE
y = -0.13ln(x) + 0.020R² = 0.372
0
0.1
0.2
0.3
0.4
0.5
0.6
0.7
0.8
0.9
1
0 0.05 0.1 0.15 0.2 0.25 0.3 0.35
Hir
sch
man
Ind
ex
Grubel-Lloyd Index (excluding BEC 3)
33
Figure 10: Export expansion via Intensive and Extensive margins, top 10 African
Exporters, 1998-2009.
Source:Author‘s estimates using BACI data set.
Section 2 emphasized the need for greater product differentiation to engender extensive
expansion and stimulate intra-industry trade and there is evidence of some success stories with
respect to diversification through differentiation. For instance, Mali‘s fresh mango export
volumes increased six fold between 1993 and 2008 (Sangho et al., 2010). Coffee washing began
in Rwanda in 2000 and by 2009 washed coffee exports accounted for 23 per cent of coffee
exports and 32 per cent of coffee revenue in 2009 (export volumes stayed constant but revenues
were up over the period owing to the quality enhancements). In addition, Uganda has recently
started exporting washed, roasted and packed coffee as a finished product to the UK and US
markets (Easterly and Reshef, 2010). The alcoholic beverage market is one in which greater
differentiation is leading to active competition, led by firms including SABMiller South Africa,
the Distil Group and Nigerian Brewers. While we find vibrant competition within several
African economies, preliminary estimates between alcoholic beverage differentiation and intra-
industry trade in Africa was not significant.19
Early entrance into other African markets in which
brands are not well established present a unique opportunity to engender customer relationships
and brand loyalties given that consumer spending is expected to almost double to $1.4 Trillion in
2020 compared to today (McKinsey, 2010).
19 Although outside the scope of this study, this is an interesting preliminary finding worth exploring in a future
research.

34
As these cases exemplify, the agro-food sector is perhaps the most ripe for product
differentiation given its prominence in many African economies and its relevance for Africa‘s
poverty reduction agenda. Indeed, many African economies are currently net food importers, and
domestic processing of food products (and possible capturing economies of scale therein) will be
imperative to addressing Africa‘s growing populations food demand. The African Agribusiness
and Agro-Industries Development Initiative (3ADI), part of NEPAD‘s Comprehensive Africa
Agriculture Development Programme, aims to have an agriculture sector in Africa which, by the
year 2020, is made up of highly productive and profitable agricultural value chains such that by
2020 more than 50 percent of the continent‘s food products sold in local and national markets
will be in processed form. At present there are a number of mechanisms through which agri-food
products can be differentiated towards this end. Voluntary sustainability initiatives in forestry,
coffee, tea, cocoa and banana industry sectors have been successful at differentiating goods, with
subsequent sales increases in excess of that experienced by conventional markets (IISD and
IIED, 2010). Of course, the social dimension of schemes including fair trade aims to provide
farmers with a surplus for re-investment and possible diversification.
Adhering to quality standards is a further option. The certification of Mali‘s mangoes as
organic was one factor of success with regard to exporting to the Europe, where organic products
are enjoying increased demand. The intuition behind differentiation of this kind is that buyers
rely on formal institutions and quality standards to allow them to differentiate between
horizontally goods differentiated by quality. Geographic indicators are another means of
differentiation, and have been successfully employed in the South African wine market and
protected under TRIPS. Differentiation by country of origin through schemes including ‗Proudly
South African‘, Uganda‘s ‗Gifted by Nature‘ and Nigeria‘s ‗Heart of Africa‘ also has the
advantage of a targeting bias toward imported goods from more developed countries.
Thus far analysis has been limited to trade in goods only, but the increasing role of trade
in services should offers further opportunities for differentiation, diversification and intra-
industry trade. For example, the arts and entertainment industry is a key service sector capable of
driving greater diversification. The production of and subsequent trade in films, literature, music
and broadcast services relies on a multiplicity of inputs and contains linkages to complementary
services and physical inputs, including publishing, technical equipment and financial, legal,
advertising and travel services. The film and television industry is exemplary here. Several
35
studies have applied the value chain concept to film production (Vickery and Hawkins, 2008;
Eliashberg et al., 2006; Joffe and Jacklin, 2003, for the SADC region) and South Africa
estimates that the economic multiplier of direct film spend is 2.5 (Joffe and Newton, 2008).
Nigeria is now ranked second in global film production behind India, benefiting from low cost
digital formats, a high share of Nigerian ownership (97 percent of 139 distribution companies are
almost entirely Nigerian-owned) and informal distribution networks to the growing African
market (UNESCO, 2009). The New York Times estimates the industry is now worth
$500million dollars.20
This is an excellent example of the value of external economies of scale
and agglomeration and simultaneous backward and forward linkages leading to intra-industry
trade and diversification. African authors and musicians are now globally recognised and are
amongst the most competitive African exports. None-the-less, creative industries face a number
of challenges including restrictions on foreign ownership of media (which often impedes the
generation of regional markets), lack of multinational indigenous distribution firms and an
ongoing preference for imported content (Balancing Act, 2012).
The financial service is a dynamic and growing sector traded globally. It remains a
valuable source of revenue for financial and other institutions engaged in various economic
activities across the globe. Within the last decade, African countries‘ financial markets have
expanded, with a noted increase in the number of commercial banks operating in countries like
Zambia, and measures have also been taken to reduce government ownership or privatize state-
owned banks such as in Malawi (World Bank, 2010). Diversification in the financial services
depends on the full range of banking and non-banking financial services, i.e. insurance, the stock
and bond exchange market, all of which equally depends largely on the full liberalization of the
financial industry. UNCTAD (2000) stated that aside from the efforts of the South African
financial services sector in boosting intra-industry trade in Africa, Nigerian banks have also been
expanding their presence throughout much of Africa, injecting capital into the African economy
by introducing new products and new managerial and technological skills, expanding lending
and savings mobilization.
20 ‗A Scorsese in Lagos: The making of Nigeria‘s Film Industry 23/2/2012‘. Available online at:
http://www.nytimes.com/2012/02/26/magazine/nollywood-movies.html?_r=1&pagewanted=all

36
(5) The constraints to Export Diversification and Intra-Industry Trade in Africa
In addition to the inherent disadvantages—heavy reliance on few primary commodities,
infrastructure inadequacy, and Dutch disease dilemma of most African economies discussed in
Section 2, there are other factors constraining the development of export diversification and
intra-industry trade in Africa. This section attempts to outline those constraints. The section is
divided into two parts; first, it discusses tariffs and non-tariffs barriers on trade in goods before
considering non-tariff measures on trade in services.
(i) Tariffs and Non-Tariff Barriers on Trade in Goods
A new study by (UNECA, AfDB & AUC, forthcoming) examined tariff barriers of 53
African economies based on data for 2004 computed from MAcMap-HS6v2 database21
, using
the TASTE software22
. The analysis shows that African economies face higher tariff rates on
their exports within Africa compared to the rest of the world. Table 3 provides a summary of the
average protection levels faced by African economies when trading among themselves and when
exchanging with the rest of the world.
21 The MAcMap-HS6 database offers the option to aggregate protection data using a so called ―reference group
weight‖. In this case, the weight used for aggregation does not strictly reflect the trade for the country considered,
but rather that of a group of countries (group of reference) to which a country belongs to according to its income
level. As a consequence, the ―reference group weight‖ limits possible endogeneity bias between trade and
protection. For example, in the case of a prohibited tariff, imports are discouraged. Thus, if the ―trade weight‖
aggregation method is used, there will be no weight associated to such a tariff line. The ―reference group weight‖,
therefore yields more satisfactory outcomes as it will allow some weight on non-traded tariff lines (UNECA,
AfDB& AUC, forthcoming). 22 Unfortunately, 2004 is the most recent data on market access currently available at such a disaggregated level.
However, note that a newer version of the MAcMap-HS6 database including data for the year 2007 is currently
being developed. Nevertheless, it is important to note that protection structures did not significantly evolve in Africa
between 2004 and 2007; changes have occurred more recently, thanks in particular to the COMESA-EAC-SADC
Tripartite initiative.

37
Table 3:Africa’s average protection imposed/faced on their imports/exports – In per cent
Average imposed protection on
imports Average faced protection on exports
TOTAL
Agricultura
l and food
products
Primary
products
Other
industrial
products
TOTAL
Agricultural
and food
products
Primary
products
Other
industrial
products
Fro
m A
fric
a
Fro
m t
he
Res
t
of
the
Wo
rld
Fro
m A
fric
a
Fro
m t
he
Res
t
of
the
Wo
rld
Fro
m A
fric
a
Fro
m t
he
Res
t
of
the
Wo
rld
Fro
m A
fric
a
Fro
m t
he
Res
t
of
the
Wo
rld
Fro
m A
fric
a
Fro
m t
he
Res
t
of
the
Wo
rld
To
Afr
ica
To t
he
Res
t o
f th
e
Wo
rld
To
Afr
ica
To t
he
Res
t o
f th
e
Wo
rld
To
Afr
ica
To t
he
Res
t o
f th
e
Wo
rld
AFRICA 8.7 13.6 12.4 19.4 2.3 4.7 9.0 13.1 8.7 2.6 12.4 9.5 2.3 1.1 9.0 2.3
Note: The MAcMapHS6v2 database does not provide protection data on trade in services.
Source: (UNECA, AfDB & AUC, forthcoming).
Looking at the columns indicating the protection faced on exports; on average African
economies face a 8.7 per cent tariff faced when exporting to their African partners, compared to
a 2.6 per cent average tariff faced by African economies when exporting to the rest of the world.
This is due to Sub-Saharan Africa benefiting from preferential market access when exporting to
foreign markets, thanks to various agreements concluded with the European Union under the
‗Everything but Arms‘ (EBA) initiative, with the United States via the African Growth and
Opportunity Act (AGOA) from and with certain Developed Countries through the General
System of Preferences (GSP).This trend is also consistent by major product groups (agricultural
and food products, primary products and other industrial products) providing some support
towards the case for a continental free trade to lower trade barriers among African member
countries.
In addition, the removal of tariff barriers imposed on imports of intermediate goods -
crucial for the development of manufacturing sector across African economies- is key. A study
by Laird et al. (2006) indicates applied tariffs23
by stage of processing (primary, intermediate and
final). This information, reproduced in Table 4, indicates that Least Developed Countries—33 of
them being from Africa—impose the highest average applied tariffs on their imports of
intermediate goods from the rest of the world (18 per cent compared to 9.1 per cent imposed by
Developing countries and 3.0 by Developed Countries).However, intermediate goods are vital
23 Laird et al. (2006) use a trade weight to aggregate the tariffs while the tariff from the UNECA, AUC, AfDB
(forthcoming) are weighted by the ―reference group‖ weight (as already explained).

38
inputs to be used in the production process allowing for production and export of goods of higher
value added. Therefore, we can legitimately expect that, if Least Developed Countries in Africa
reduce tariffs imposed on their imports of intermediate goods, African countries could
significantly enhance their export diversification and intra-industry trade as well as their overall
contribution to intra-African trade.
Table 4: Trade Weighted Applied Tariffs (Percentage) on Industrial Products, 2001.
Primary Intermediate Final
Developed Countries 0.4 3.0 3.4
Developing Countries 6.0 9.1 8.0
Least Developing
Countries
6.9 18.0 12.0
Source: Laird et al (2001)
An assessment of constraints on African exports by UNECA, AU & AfDB (2010) based
on a gravity model highlighted several supply-side constraints. Three are worth mentioning here.
First, the study identified the nature of African economies—small, high tariff imposed by
African countries, landlocked, high transportation cost, high dependence on primary products,
low export diversification, low intra-industry trade—and lack of progress towards regional
economic integration as constraints towards Africa boosting intra-African trade. Second, the
poor condition of trade-related infrastructure was identified as a major constraint towards trade
in Africa. Poor infrastructure (roads and telecommunications) increases transportation time and
costs and timely and affordable diffusion of market information is impossible in some parts of
Africa due to isolation and lack of effective telecommunications infrastructure. The length of
paved roads as per cent of total roads in Africa is about five times less than that of high income
OECD countries, whereas telephone coverage (proxied by telephone mainlines per 1,000 people)
is generally low (28.4) compared to (574.1) of OECD high-income countries. Telephone
coverage is even lower in Sub-Saharan Africa (excluding South Africa) with (8.4). Third, other
supply-side constraints include an effective trade export promotion strategy as well as efficient
bureaucracies to service exporters are lacking. Customs authorities in many African countries are
inefficient with frequent delays when goods cross borders. It is estimated that each day of delay
reduces the export volume by about 1 per cent. At this rate, if Uganda reduces its factor-to ship
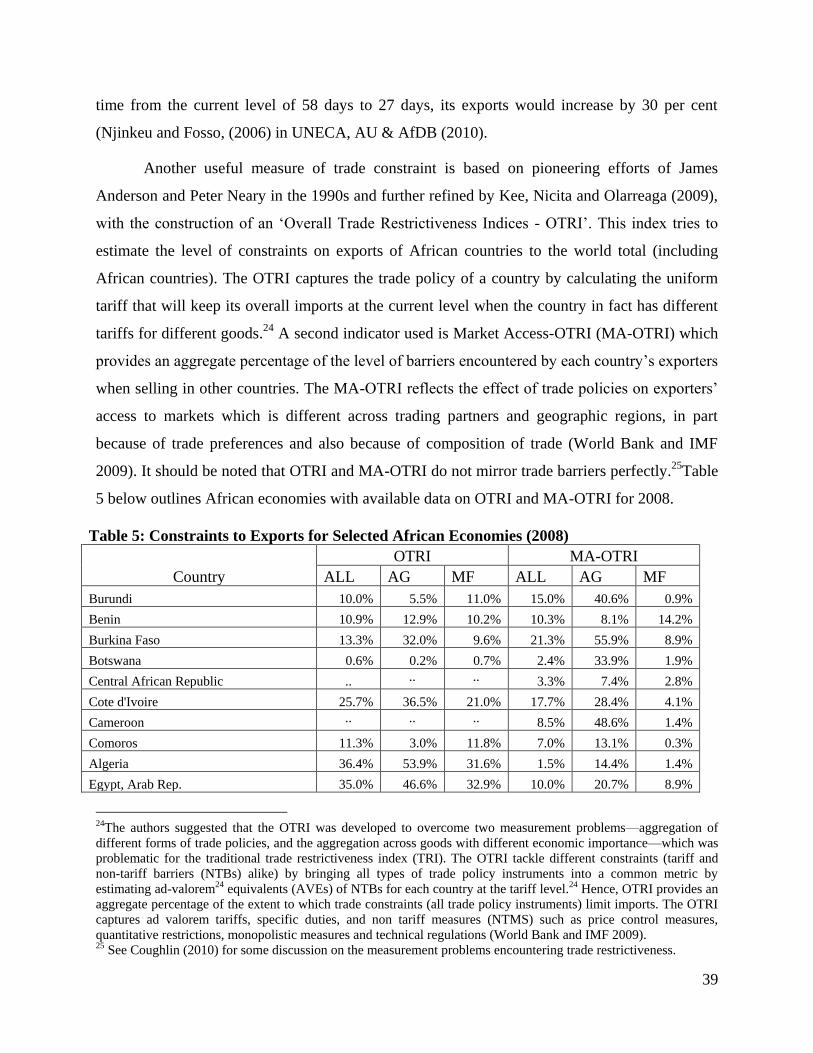
39
time from the current level of 58 days to 27 days, its exports would increase by 30 per cent
(Njinkeu and Fosso, (2006) in UNECA, AU & AfDB (2010).
Another useful measure of trade constraint is based on pioneering efforts of James
Anderson and Peter Neary in the 1990s and further refined by Kee, Nicita and Olarreaga (2009),
with the construction of an ‗Overall Trade Restrictiveness Indices - OTRI‘. This index tries to
estimate the level of constraints on exports of African countries to the world total (including
African countries). The OTRI captures the trade policy of a country by calculating the uniform
tariff that will keep its overall imports at the current level when the country in fact has different
tariffs for different goods.24
A second indicator used is Market Access-OTRI (MA-OTRI) which
provides an aggregate percentage of the level of barriers encountered by each country‘s exporters
when selling in other countries. The MA-OTRI reflects the effect of trade policies on exporters‘
access to markets which is different across trading partners and geographic regions, in part
because of trade preferences and also because of composition of trade (World Bank and IMF
2009). It should be noted that OTRI and MA-OTRI do not mirror trade barriers perfectly.25
Table
5 below outlines African economies with available data on OTRI and MA-OTRI for 2008.
Table 5: Constraints to Exports for Selected African Economies (2008)
Country
OTRI MA-OTRI
ALL AG MF ALL AG MF
Burundi 10.0% 5.5% 11.0% 15.0% 40.6% 0.9%
Benin 10.9% 12.9% 10.2% 10.3% 8.1% 14.2%
Burkina Faso 13.3% 32.0% 9.6% 21.3% 55.9% 8.9%
Botswana 0.6% 0.2% 0.7% 2.4% 33.9% 1.9%
Central African Republic .. .. .. 3.3% 7.4% 2.8%
Cote d'Ivoire 25.7% 36.5% 21.0% 17.7% 28.4% 4.1%
Cameroon .. .. .. 8.5% 48.6% 1.4%
Comoros 11.3% 3.0% 11.8% 7.0% 13.1% 0.3%
Algeria 36.4% 53.9% 31.6% 1.5% 14.4% 1.4%
Egypt, Arab Rep. 35.0% 46.6% 32.9% 10.0% 20.7% 8.9%
24The authors suggested that the OTRI was developed to overcome two measurement problems—aggregation of
different forms of trade policies, and the aggregation across goods with different economic importance—which was
problematic for the traditional trade restrictiveness index (TRI). The OTRI tackle different constraints (tariff and
non-tariff barriers (NTBs) alike) by bringing all types of trade policy instruments into a common metric by
estimating ad-valorem24 equivalents (AVEs) of NTBs for each country at the tariff level.24 Hence, OTRI provides an
aggregate percentage of the extent to which trade constraints (all trade policy instruments) limit imports. The OTRI
captures ad valorem tariffs, specific duties, and non tariff measures (NTMS) such as price control measures,
quantitative restrictions, monopolistic measures and technical regulations (World Bank and IMF 2009). 25 See Coughlin (2010) for some discussion on the measurement problems encountering trade restrictiveness.
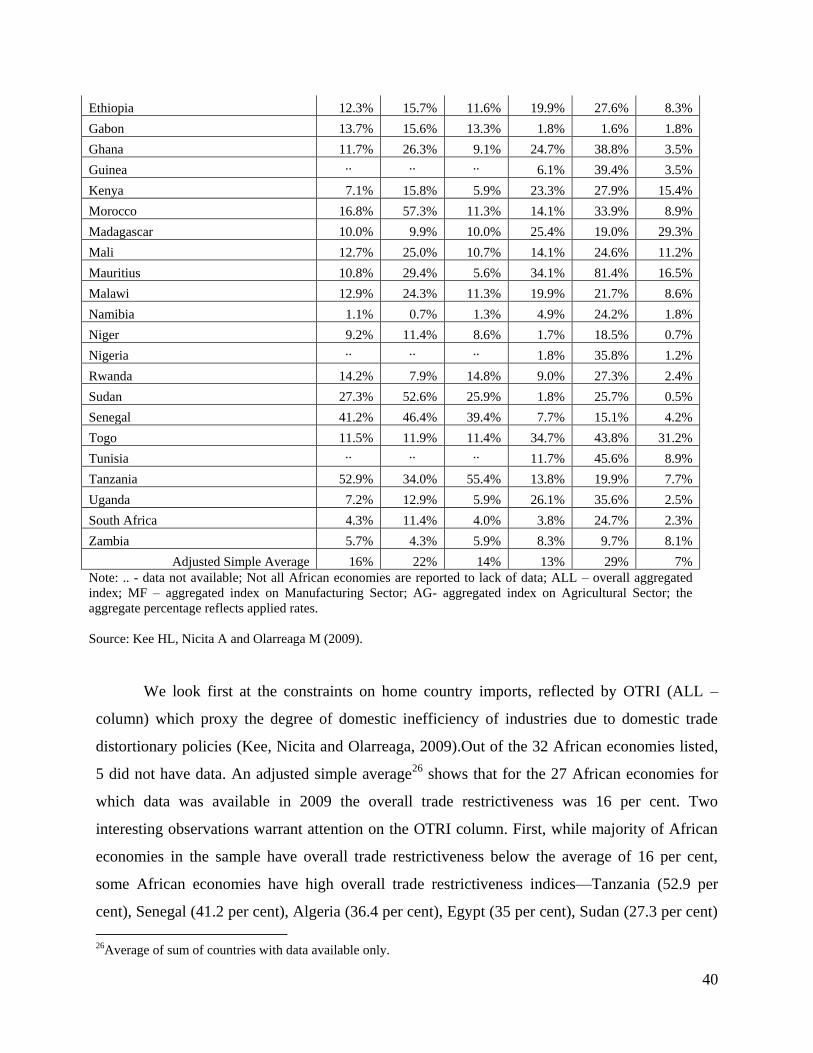
40
Ethiopia 12.3% 15.7% 11.6% 19.9% 27.6% 8.3%
Gabon 13.7% 15.6% 13.3% 1.8% 1.6% 1.8%
Ghana 11.7% 26.3% 9.1% 24.7% 38.8% 3.5%
Guinea .. .. .. 6.1% 39.4% 3.5%
Kenya 7.1% 15.8% 5.9% 23.3% 27.9% 15.4%
Morocco 16.8% 57.3% 11.3% 14.1% 33.9% 8.9%
Madagascar 10.0% 9.9% 10.0% 25.4% 19.0% 29.3%
Mali 12.7% 25.0% 10.7% 14.1% 24.6% 11.2%
Mauritius 10.8% 29.4% 5.6% 34.1% 81.4% 16.5%
Malawi 12.9% 24.3% 11.3% 19.9% 21.7% 8.6%
Namibia 1.1% 0.7% 1.3% 4.9% 24.2% 1.8%
Niger 9.2% 11.4% 8.6% 1.7% 18.5% 0.7%
Nigeria .. .. .. 1.8% 35.8% 1.2%
Rwanda 14.2% 7.9% 14.8% 9.0% 27.3% 2.4%
Sudan 27.3% 52.6% 25.9% 1.8% 25.7% 0.5%
Senegal 41.2% 46.4% 39.4% 7.7% 15.1% 4.2%
Togo 11.5% 11.9% 11.4% 34.7% 43.8% 31.2%
Tunisia .. .. .. 11.7% 45.6% 8.9%
Tanzania 52.9% 34.0% 55.4% 13.8% 19.9% 7.7%
Uganda 7.2% 12.9% 5.9% 26.1% 35.6% 2.5%
South Africa 4.3% 11.4% 4.0% 3.8% 24.7% 2.3%
Zambia 5.7% 4.3% 5.9% 8.3% 9.7% 8.1%
Adjusted Simple Average 16% 22% 14% 13% 29% 7%
Note: .. - data not available; Not all African economies are reported to lack of data; ALL – overall aggregated
index; MF – aggregated index on Manufacturing Sector; AG- aggregated index on Agricultural Sector; the
aggregate percentage reflects applied rates.
Source: Kee HL, Nicita A and Olarreaga M (2009).
We look first at the constraints on home country imports, reflected by OTRI (ALL –
column) which proxy the degree of domestic inefficiency of industries due to domestic trade
distortionary policies (Kee, Nicita and Olarreaga, 2009).Out of the 32 African economies listed,
5 did not have data. An adjusted simple average26
shows that for the 27 African economies for
which data was available in 2009 the overall trade restrictiveness was 16 per cent. Two
interesting observations warrant attention on the OTRI column. First, while majority of African
economies in the sample have overall trade restrictiveness below the average of 16 per cent,
some African economies have high overall trade restrictiveness indices—Tanzania (52.9 per
cent), Senegal (41.2 per cent), Algeria (36.4 per cent), Egypt (35 per cent), Sudan (27.3 per cent)
26Average of sum of countries with data available only.
41
and Côte d‘Ivoire (25.7 per cent). Second, some African economies show extremely low overall
trade restrictiveness indices—Botswana (0.6 per cent), Namibia (1.1 per cent), South Africa (4.3
per cent), Zambia (5.7 per cent) and Kenya (7.1 per cent)—suggesting that these countries have
rather liberal trade regimes.
Looking further to the constraints on the two industry sectors of agriculture and
manufacturing for each African economy in the sample, we find that the adjusted simple average
OTRI for agriculture sector in our African economies sample is extremely high at 22 per cent
reflecting the protectionist trade interest of most African economies on agriculture27
. On the
other hand, we find that the manufacturing sector faces an average of 14 per cent OTRI with the
exception of Tanzania which shows a 55.4 per cent OTRI on manufacture.
Moving on to the Market Access-OTRI (MA-OTRI)—an aggregate percentage of the
level of barriers encountered by each country‘s exporters when selling in other countries, the
overall market access adjusted simple average is 13 per cent. Three observations are worth
noting. First, in average, African economies face lower constraints imposed by other countries
(MA-OTRI, adjusted simple average of 13 per cent) compared to the constraints imposed by the
African economies themselves on their imports from their partners (OTRI adjusted simple
average of 16 per cent).This trend is suggestive that barriers to trade imposed by African
economies themselves to their own respective industry sectors (particularly agriculture and
manufacturing) is extremely high which may have a negative implication through lower
efficiency and productivity on export competitiveness. Second, while majority of African
economies face less barriers on their exports than the world average (13 per cent), some of them–
including Togo (34.7 per cent), Mauritius (34.1 per cent), Uganda (26.1 per cent), Ghana (24.7
per cent), and Kenya (23.3 per cent)—to encounter high constraints when exporting to other
countries. Third, African agricultural exports face high protection from other countries; this is
especially the case for agricultural exports from Mauritius (81.4 per cent), Burkina Faso (55.9
per cent), Cameroon (48.6 per cent), Tunisia (45.6 per cent), Togo (43.8 per cent) and Burundi
(40.6 per cent).On the other hand, African exports of manufacture face fewer constraints with an
adjusted simple average of 7 per cent, compared to a 29 per cent average for agriculture exports.
27Some African economies show extremely high OTRI—Morocco (57 per cent), Algeria (53.9 per cent) and Sudan
(52.6 per cent).
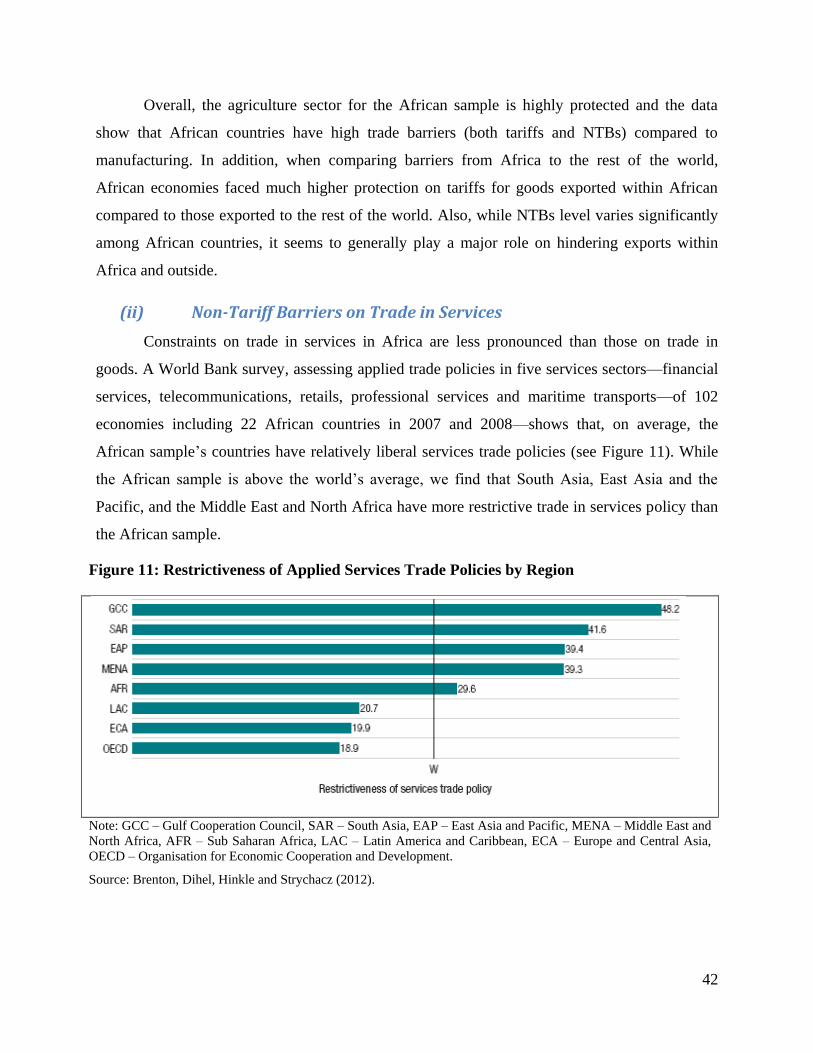
42
Overall, the agriculture sector for the African sample is highly protected and the data
show that African countries have high trade barriers (both tariffs and NTBs) compared to
manufacturing. In addition, when comparing barriers from Africa to the rest of the world,
African economies faced much higher protection on tariffs for goods exported within African
compared to those exported to the rest of the world. Also, while NTBs level varies significantly
among African countries, it seems to generally play a major role on hindering exports within
Africa and outside.
(ii) Non-Tariff Barriers on Trade in Services
Constraints on trade in services in Africa are less pronounced than those on trade in
goods. A World Bank survey, assessing applied trade policies in five services sectors—financial
services, telecommunications, retails, professional services and maritime transports—of 102
economies including 22 African countries in 2007 and 2008—shows that, on average, the
African sample‘s countries have relatively liberal services trade policies (see Figure 11). While
the African sample is above the world‘s average, we find that South Asia, East Asia and the
Pacific, and the Middle East and North Africa have more restrictive trade in services policy than
the African sample.
Figure 11: Restrictiveness of Applied Services Trade Policies by Region
Note: GCC – Gulf Cooperation Council, SAR – South Asia, EAP – East Asia and Pacific, MENA – Middle East and
North Africa, AFR – Sub Saharan Africa, LAC – Latin America and Caribbean, ECA – Europe and Central Asia,
OECD – Organisation for Economic Cooperation and Development.
Source: Brenton, Dihel, Hinkle and Strychacz (2012).

43
The survey, however, claims that there is significant variation among African
economies—Madagascar and Mauritius are found to have very liberal trade in services policies,
while Ethiopia has the highest restrictiveness not only in the African sample but for the whole
surveyed sample. Nevertheless, only 22 African economies out of 54 were included in the
survey, which is less than half of African countries. In addition, the survey does not provide the
list of African countries surveyed. There is very limited data on applied policies governing trade
in services in developing countries and this is certainly an area to explore for future research.
To summarize this section, with respect to constraints on trade in goods, we find that
agriculture sector is highly protected and the data show that African countries have high trade
barriers (both tariffs and NTBs) compared to manufacturing. In addition, when comparing trade
barriers in goods within African countries and between Africa and the rest of the world, we find
that African economies faced much higher tariff barriers on goods exported to African partners
than on goods exported to the rest of the world. Also, while NTBs level varies among African
countries, it plays a major role on hindering exports within Africa and outside. Nonetheless,
while data on constraints for trade in services is limited for Africa, we find a preliminary study
by the World Bank showing less pronounced constraints compared to Asia and Latin America.
However, this preliminary survey should be interpreted with some caution as further studies in
the country level for all African countries is needed, subject to data availability. The main
implication of high barriers to trade within Africa is that it deters the potential for export
diversification among African countries. In addition, high tariff on intermediate goods across
Africa which is vital for the growth and development of the manufacturing sector further
hampers the need to diversify exports from primary commodities to higher value products. The
next section concludes the paper with some policy recommendations.
44
(6) Concluding Remarks and Policy Implications
Based on the computation of Grubel-Lloyd Indices (Intra-Industry Trade) and
Herfindahl-Hirschman Indices (Export Diversification) for 49 African countries, there are three
findings worthy of attention. First, we found that in general, the African sample have extremely
low export diversification and intra-industry trade patterns. However, within the African sample,
we find significant heterogeneity in export diversification patterns. Second, over the period
1998-2009, we find that the African sample shows a gradual move towards product
concentration (lack of export diversification). Further, Africa is lagging behind other major
regions (Asia, Pacific and the Americas) in terms of export diversification. Third, there is a
positive correlation between intra-industry trade and percentage of manufacturing in GDP,
suggesting that an increase in manufacturing production have positive effect on intra-industry
trade and vice versa. In addition, the economies with the largest total intra-industry trade
(Tunisia and SACU) have relatively low intra-African intra-industry trade, meaning that for
these African economies intra-industry trade mainly takes place with external trading partners
located outside the continent.
In terms of the linkages between intra-industry trade and export diversification in the
African sample, we found that an increase in export diversification is positively correlated to
intra-industry trade and vice versa. The paper identified three key constraints to export
diversification and intra-industry trade in Africa. First, while African countries have a
comparative advantage on primary commodities (including agricultural products), the average
tariff barriers faced by African exports of agricultural are quite high. In addition, African LDCs
impose very high tariffs on their imports of intermediate goods which are crucial for the
expansion of intra-industry trade and export diversification in Africa. Second, we find that Africa
encounters higher average tariff rates on goods traded within the continent than when exported to
the rest of the world. Third, constraints in trade in services are less pronounced. These
constraints need to be addressed in a systematic manner, ensuring that efforts towards boosting
export diversification and intra-industry trade in Africa is undeterred.
In light with these preliminary above findings, three policy implications deserve
emphasis. First, the low export diversification and intra-industry trade for most African
economies emphasizes the need to facilitate trade in the extensive margin. However, export

45
expansion through the intensive margin should equally be promoted and supported. Trade
facilitation may include hard and soft infrastructure. Greater product differentiation represents
one possible pathway to simultaneously increasing intra-industry trade and export
diversification. Second, the low export diversification and intra-industry for Africa implies that
there are real constraints to trade among African economies which need addressed. The issue of
tariff and non-tariff barriers to trade needs to be addressed in order to facilitate trade. In
particular, the need to ensure that African exporters have the capacity to meet trade standards
necessary to permit their exports within Africa as well as outside Africa. The development of the
regional labelling programmes that enhances the environmental profile of African products and
improves their market access is a commendable effort by ARSO and UNEP. The CFTA and the
regional integration agenda have a critical role to play in that respect. Third, the liberalisation of
the financial sector (among other services sectors) is key in ensuring the growth of exports of
goods and services in Africa.
This study is best understood as a prolegomena to the assessment of intra-industry trade
and export diversification in Africa. Intra-industry trade is not yet a key issue for African
economies, but if they sustain their current growth trajectories it will become increasingly
relevant. As such, this paper describes some of the pressing issues surrounding IIT, and the
policy interventions to better embrace as a pillar of the export diversification paradigm. Future
research would be well placed to closer scrutinize bi-lateral intra-industry trade and disaggregate
horizontal and vertical intra-industry trade. We also need a better understanding of the role of
domestic, regional and international firms (FDI) in intra-industry cross-border trade, and
identification at the national level of key sectors in which intra-industry trade is expanding and
why. Furthermore, firm level data would allow for greater scrutiny of the implication of so-called
‗New-New Trade Theory‘ (NNTT) and its implications for export diversification and intra-
industry trade in Africa. Similarly, more disaggregated data on trade in services presents would
allow for deeper understanding of intra-industry trade in service sectors, and its relevance for
wider export diversification.

46
(7) References
AfDB (2011) ‗The middle of the pyramid: dynamics of the middle class in Africa‘, AfDB Market Brief,
Tunis, Tunisia.
Agbonifoh, A. and J.U. Elimimian (1999) ‗Attitudes of developing countries towards "country-of-origin"
products in an era of multiple brands‘, Journal of International Consumer Marketing. 11 (4): 97-116.
Akamatsu, K. (1962) ‗A historical pattern of economic growth in developing countries‘, Journal of
Developing Economies. 1(1): 3-25.
Ali, R., J. Alwang and P.B. Siegel (1991) ‗Is export diversification the best way to achieve export growth
and stability? A look at three African countries.‘The Policy, Research and External Affairs Working
Papers Agriculture Operations (Working Papers no.WPS 729).
Amiti, Mary and Caroline Freund (2010) ‘An Anatomy of China's Export Growth,‘ in R. C. Feenstra and
S.J. Wei, (Eds.) China's Growing Role in World Trade, The University of Chicago Press.
Amurgo-Pacheco, A. and D. Pierola (2007) ‘Patterns of export diversification in developing countries:
intensive and extensive margins‘, mimeo, GIIS, Geneva.
AUC (2010) ‗The Status of Integration in Africa (3rd Edition)‘. African Union Commission, Addis Ababa,
Ethiopia.
Auty, R. (2001) ‗The Political Economy of Resource-Driven Growth‘ European Economic Review.
Aquino, A. (1978) ‗Intra-industry trade: current perspectives and unresolved issues‘
WeltwirtschaftlichesArchiv, 114. pp 275–295.
Balassa, B. (1966) ‗Tariff reductions and trade in manufacturers among the industrial countries‘, The
American Economic Review. 56(3): 466-473.
Balancing Act (2012) Africa Broadcast and Film Markets: 2nd Edition (http://www.balancingact-
africa.com/reports/broadcast/african-broadcast-an-0)
Besedes, T. and T.J. Prusa (2007) ‗The Role of Extensive and Intensive Margins and Export Growth‘
NBER Working Paper No.13628
Biesebroeck VH (2007) ‗The Rising Importance of Intra-Industry Trade‘, University of Toronto and
NBER,
<https://lirias.kuleuven.be/bitstream/123456789/200576/1/The>, accessed 20 March 2012.

47
Birdsall, N. and A. Hamoudi (2002) ‗Commodity Dependence, Trade and Growth: When ―openness‘ is
not Enough‘ CCentre for Global DevelopmentWorking Paper No.7
Brander, J.A. and P. Krugman (1983) ‗A 'reciprocal dumping' model of international trade.‘Journal of
International Economics. 15(3): 313-321.
Brenton, Dihel, Hinkle and Strychacz (2012), ‗Africa‘s Trade in Services and the Opportunities and Risks
of Economic Partnership Agreements‘, in ‗De-Fragmenting Africa Deepening Regional Trade Integration
in Goods and Services‘, World Bank.
Brenton P., et al (2010) Africa‘s Trade in Services and the Opportunities and Risks of Economic
Partnership Agreements: Africa Trade Policy Note # 6.
Brenton, P. and R. Newfarmer (2009) ‗Watching more than the discovery channel to diversify exports‘
inR. Newfarmer, W. Shaw and P. Walkenhorst (eds.) Breaking into New Markets: Emerging Lessons for
Export Diversification, World Bank, Washington DC.
Brenton, P., R. Newfarmer and P. Walkenhorst (2007) ‗Export Diversification: A Policy Portfolio
Approach‘ Paper Presented to the Growth Commission Conference on Development
Brülhart, M. (1994) ‗Marginal Intra-Industry Trade: Measurement and Relevance for the Pattern of
Industrial Adjustment‘ WeltwirtschaftlichesArchiv 130(3): 600-613.
Brülhart, M. (1999) ‗Marginal intra-industry trade and trade-induced adjustment: a survey‘ in M. Brülhart
and R.C. Hine (eds.) Intra-Industry Trade and Adjustment: The European Experience, Macmillan,
Basingstoke, UK.
Brülhart, M. (2008) ‗An account of global intra-industry trade, 1962-2006‘ University of Nottingham
Globalisation, Productivity and Technology Research Paper Series, Research Paper 2008/08.
Cadot, O., C. Carrere and S. Strauss-Kahn (2008) ‗Export diversification: what‘s behind the hump?‘
CEPR Discussion Paper DP6590, Centre for Economic Policy Research, London.
Cattaneo, N. Fryer, D. (2003) ‗Intra-versus Inter-Industry Specialization, Labour Market Adjustment and
Poverty: Implications for Regional Integration in Southern Africa‘ Trade and Industrial Strategies mimeo.
Chritie and Crompton (2001) Tourism in Africa: Africa Region Working Paper Series No. 12
Collier, P. and A. Hoeffler (2004) ‗Greed and grievance in civil war,’ Oxford Economic Papers. 56(4):
563-595.
48
Collier, P. and A. Hoeffler (2000) ‗Greed and Grievance in Civil War‘ World Bank Policy Research
Working Paper No. 2355.
Coughlin CC (2010), ‗Measuring International Trade Policy: A Primer on Trade Restrictiveness Indices‘,
Federal Reserve Bank of St. Louis Review, September/October, pp. 381-393.
Czubala W, Shepherd B & Wilson JS (2009), ‗Help or Hindrance? The Impact of Harmonized Standards
on African Exports‘, Journal of African Economies, Vol. 18, No. 5, pp. 711-744.
Dabee B. (2000) Liberalization of Trade in Services: The case of Mauritius.
Debaere, P. (2005) ‗Monopolistic competition and trade, revisited: testing the model without testing for
gravity‘ Journal of International Economics, Vol. 66(1): 249-266
Delgado, CL. (1995) ‗Agricultural diversification and export promotion in Sub-Saharan Africa‘, Food
Policy, Vol. 20, No. 3, pp. 225-243.
Diamond, L. (2008) The Spirit of Democracy Macmillan: New York
Dixit, A.K. and J. Stiglitz (1977), ‗Monopolistic Competition and Optimum Product Diversity,‘ American
Economic Review, vol.67
Dollar, D. and A. Kraay (2002) ‗Trade, Growth and Poverty‘, World Bank Policy Research Working
Paper No. 2587.
Easterly W. and A. Reshef (2010) ‗African Export Successes: Surprises, Stylized Facts and Explanations‘
NBER Working Paper 16597, Cambridge, MA.
Eliashberg, J., A. Elberse, and M. Leenders (2006) ‗The Motion Picture Industry: Critical Issues in
Practice, Current Research, and New Research Directions‘Marketing Science, Vol. 25, No. 6, November-
December 2006, pp. 638-661.
Ethier, W. J. (1982) ‗National and international returns to scale in the modern theory of international
trade’, The American Economic Review. 72,(3): 389-405.
Evenett, S.J. and A.J. Venables (2002), ‗Export Growth in Developing Countries: Market Entry and
Bilateral Trade Flows,‘ University of Bern working paper, mimeo.
Falvey, R. (1981) ‗Commercial policy and intra-industry trade,‘ Journal of International Economics.11:
495-511.
Falvey, R.E. and H. Kierkowski (1987), ‗Product Quality Intra-industry Trade and(im)perfect
competition‘, in H. Kierkowski (ed.), Protection and Competition in International Trade.

49
Ferranti, D. de, G.E. Perry, D. Lederman and W.F. Maloney (2002) From Natural Resources to the
Knoweldge Economy: Trade and Job Quality, World Bank, Washington D.C.
Fontagné L. and M. Freudenberg (1997) ‗Intra-industry trade: methodological issues reconsidered,‘ CEPII
Working Papers, #97-01.
Frommer (2006): Frommer‘s Top Travel Destination for 2007: Available at
http://www.frommers.com/articles/4056.html
Frommer (2010) Frommer Travel Guide: Available at http://www.frommers.com/articles/6469.html
Gaulier, G. and S. Zignago (2010) ‗BACI: international trade database at the product-level: the 1994-
2007 version" CEPII Working Paper No. 2010-23, Paris.
Gelb, A. (1988) Oil Windfalls: Blessing or Curse? Oxford University Press, Oxford.
Gĩthĩnji, M. wa (2011) ‗Industrialization by Industrialization by Export Destination: The Relationship
between Trade and Export Sophistication in African Countries.‘ Background paper prepared for UNECA.
Gore, C. (2010) Developing Productive Capacities in Least Developed Countries: Issues for Discussion‘
Pre-conference Event to UNLDC-IV: Building Productive Capacities in LDCs for Inclusive and
Sustainable Development.
Greenaway, D. and C. Milner (1981) ―Trade imbalance effects in the measurement of intra-industry
trade‘, WeltwirtschaftlichesArchiv, 117.pp.756–762.
Grubel, H. G. (1967) ‗Intra-industry specialization and the pattern of trade‘, The Canadian Journal of
Economics and Political Science. 33 (3): 374-388.
Grubel, H.G. and P.J. Lloyd (1975) Intra-Industry Trade: The theory and Measurement of International
Trade with Differentiated Products. Macmillan, London.
Gylfason, T. (2001) ‗Natural Resources and Economic Growth: What Is the Connection?‘ CESifo
Working Paper (530).
Hammouda B, Karingi SN., Njuguna AE and Sadni-Jallab M (2006) ‗Diversification: towards a new
paradigm for Africa‘s development‘ Africa Trade Policy Centre Work in Progress No. 35, UNECA,
Addis Ababa, Ethiopia.
Hakura, D. and F. Jaumotte (1999) ‗The role of inter- and intra-industry trade in technology diffusion‘
IMF Working Paper No 99/58.

50
Hallak, J.C. (2006) ‗Product Quality and the Direction of Trade,‘ Journal of International Economics
68(1): 238-265.
Harding, T. and B. SmarzynskaJavorcik (2007) FDI and Unit Values of Exports, Oxford University,
Oxford, U.K
Harding T. (2009) ‗Infrastructure and Diversifying Through Better Products‘inR. Newfarmer, W. Shaw
and P. Walkenhorst (eds.) Breaking into New Markets: Emerging Lessons for Export Diversification,
World Bank, Washington DC.
Hausmann, R. and D. Rodrik (2003) ―Economic development as self-discover‘ Journal of Development
Economics, 72: 603-633.
Hausmann, R., J. Hwang and D. Rodrik (2007) ‗What you export matters‘ CEPR Discussion paper 5444,
Centre for Economic Policy and Research, London.
Helpman, E., M. Melitz and Y. Rubinstein (2008), ‗Estimating Trade Flows: Trading Partners and
Trading Volumes,‘ Quarterly Journal of Economics, 123(2).
Hirchberg, G. H, Sheldon, I. M. and Dayton J.R. (1994) ‗The analysis of bilateral intra-industry trade in
the food-processing sector,‘ Applied Economics. 26: 159-167.
Hirschman, A. (1964), ‗The Paternity of an Index‘, American Economic Review 54(4-6), pp 761-762.
Hirschman, A. (1958) The Strategy of Economic Development, Yale University Press, New Haven, CT.
IISD and IIED (2010). The State of Sustainability Initiatives Review 2010: Sustainability and
Transparency, International Institute for Sustainable Development and the International Institute for
Environment and Development.
ILO (2011) Global Employment Trends 2011: The challenge of jobs recovery, ILO, Geneva.
Imbs, J. and R. Wacziarg (2003) ‗Stages of diversification‘, American Economic Review. 93(1):63-86
Interbrand (2011) Best Global Brands 2011 (http://www.interbrand.com/en/best-global-brands/Best-
Global-Brands-2011.aspx)
Isham, J., M. Woolcock, L. Pritchett and G. Busby (2005) ‗The varieties of resource experience: natural
resource export structures and the political economy of economic growth,‘ The World Bank Economic
Review (Oxford University Press on behalf of the International Bank for Reconstruction and
Development).
51
Joffe, A and Jacklin, N. (2003) The Film and Television Industry: Promoting the Cultural Sector through
Job Creation and Small Enterprise Development in the SADC Countries, ILO/ Seed working paper
No.53, Geneva
Joffe, A. and M. Newton (2008) ‗Creative Industries Sector Report‘ Research Commissioned by
Department of labour South Africa.
Laird, A., D. Vanzett and S.F. de Códoba (2006) ‗Smoke and Mirrors: Making Sense of the WTO
Industrial Tariff Negotiations‘ Policy Issues in International Trade and Commodities Study Series No. 30,
UNCTAD, New York and Geneva
Kaldor, N. (1967) Strategic Factors in Economic Development. Ithaca, New York.
Karingi, S. N. and V. Leyaro, (2009) ‗Monitoring aid for trade in Africa: an assessment of the
effectiveness of Aid for Trade‘, African Trade Policy Centre Work in Progress No. 83, UNECA, Addis
Ababa, Ethiopia.
Karingi, S. N. and M. D. Spence (2011) ‗Impact of trade facilitation mechanisms on export
competitiveness in Africa.‘ African Trade Policy Centre Work in Progress No.84 , UNECA, Addis
Ababa, Ethiopia.
Kee HL, Nicita A and Olarreaga M 2009, ‗Estimating trade restrictiveness indices‘, Economic
Journal,Vol. 119, p. 172--199.
Klinger, B. and D. Lederman (2006) ‗Diversification, innovation and imitation inside the global
technological frontier‘ World Bank Policy Research Working Paper 3872.
Krugman, P. R. (1979) ‗Increasing returns, monopolistic competition, and international trade‘, Journal of
InternationalEconomics. 9(4): 469-479.
Krugman, P. R. (1980) ‗Scale economies, product differentiation, and the pattern of trade‘, American
Economic Review. 70(5): 950-959.
Krugman, P. R. (1981) Intraindustry, Specialization and the Gains from Trade: Journal of Political
Economy. Vol 89, no.5
Kuznets, S. (1973) ‗Modern Economic Growth: Findings and Reflections‘, Nobel Memorial Lecture,
December 11, 1971, American Economic Review. 63(3):247-58.
Lancaster, K. J. (1980) 'Intra-Industry Trade under Perfect Monopolistic Competition', Journal of
International Economics. 10: 151-75.

52
Laird S, Vanzetti D & Cordoba SF 2006, ‗Smoke and Mirrors – Making sense of the WTO industrial
policy tariff negotiations‘, Policy Issues in International Trade and Commodities, Study Series No. 30,
UNCTAD.
Lejarraga, I.and P. Walkenhorst (2009) ‗Fostering productive diversification through tourism‘ in R.
Newfarmer, W. Shaw and P. Walkenhorst (eds.) Breaking into New Markets: Emerging Lessons for
Export Diversification, World Bank, Washington DC.
Lewis, W. A. (1954) ‗Economic development with unlimited supplies of labour,‘ Manchester School, 22:
139-191.
Limao, N., and A. J. Venables (2001) ‗Infrastructure, Geographical Disadvantage, Transport Costs, and
Trade.‘World Bank Economic Review 15 (3): 451–79.
Lin, J-Y. (2010) ‗New structural economics: a framework for rethinking development‘ World Bank
Policy Research Working Paper 5197.
Linder, S.B. (1961) ‗An Essay on Trade and Transformation‘ Stockholm: Almqvist&Wicksell.
McKinsey Global institute (2010) Lions on the Move: The progress and Potential of African Economies
McMillan, M. and D. Rodrik (2011) ‗Globalization, Structural Change and Productivity Growth‘
Working Paper
Naude, et al, (2005) Determinants of tourist arrival in Africa: a panel data regression analysis. Tourism
Economics, Vol. 11 (3) pp.360.
Nordas, H.K. (1996) ‗South African manufacturing industries – catching up or falling behind?‘The
Journal of Development Studies, 32, (5): 715-733.
OECD (2008) The Contribution of Services to Development and the Role of Trade Liberalisation and
Regulation. ODI Briefing Notes, DFID, UK
Okech N.R (2010) Tourism Development in Africa: Focus on Poverty Alleviation. The Journal of
Tourism and Peace Research, 1(1), 2010.
Okechuku C and V. Onyemah (1999) ‗Nigerian Consumer Attitudes toward Foreign and Domestic
Products,‘ Journal of International Business Studies 30 (3): 611-622.
Opoku, R.A. and P.A.K. Akorli (2009) ‗The preference gap: Ghanaian consumers‘ attitudes toward local
and imported products‘ African Journal of Business Management, Vol. 3(8), pp.350-357.

53
Osakwe, P.N. (2007) ‗Foreign Aid, resources and Export diversification in Africa: A New Test of
Existing Theories‘ Africa Trade Policy Centre Work in Progress No.61, UNECA, Addis Ababa, Ethiopia.
Petersson, L. (2005) Export Diversification and Intra-Industry Trade in South Africa‘ South African
Journal of Economics, Vol. 73 (4), pp.785-802.
Prebisch, R. (1950) ‗Commercial policy in the underdeveloped countries,‘ American Economic Review,
49(2): 251-273.
Property Rights Alliance (2011) Intellectual property Rights Index: 2011 Report, Property Rights
Alliance, washington D.C.
Rauch, J. (2007) ‗Development through synergistic reform,‘ NBER Working Paper 13170.
Rosenstein-Rodan, P. (1943) ‗Problems of industrialization of Eastern and South- Eastern Europe,‘
Economic Journal, 53(210/211): 202-11.
Ross, M. (2001) ‗Does Oil Hinder Democracy?‘ World Politics 53 pp. 325–61.
Rostow, W.W. (1953) The Process of Economic Growth, Oxford University Press, London.
Sachs, J. and A. Warner (2001) ‗The curse of natural resources,‖ European Economic Review. 45(4-6):
827-838.
Sachs, J.D. and A.M. Warner (1995) ‗Natural Resource Abundance and Economic Growth‘ National
Bureau of Economic Research Working Paper No. 5398.
Sangho, Y., P.Labaste and C. Ravry (2010) ‗Growing Mali‘s Mango Exports: Linking Farmers to
Markets through Innovations in the Value Chain‘ The World Bank and JE Austin Associates
Shaked, A. and J. Sutton (1984), "Natural Oligopolies and International Trade" in H. Kierzkowski (ed.)
Monopolistic Competition and International Trade, Oxford University Press and Clarendon Press.
Sichei M. and Harmse C. (2004) Determinant of South Africa-US Intra-Industry trade in Services: A
Panel Data Analysis
Sindiga, I. (1999). Tourism and African Development: Change and Challenge of Tourism in Kenya.
African Studies Centre Research Series
Singer, H.W. (1950). ‗U.S. foreign investment in underdeveloped areas: the distribution of gains between
investing and borrowing countries,‘ American Economic Review, 40(2): 473-485.
TIPS and AusAid (2006) Intra SADC Trade Performance Review 2006, Arcadia, South Africa
54
Thomas R. (2011) Trade in Financial Services in Southern Africa: What Rooms for Negotiators post-
2008 Financial Crisis. Economic Diplomacy Programme. SAIIA Research Report No.8
Tybout, J. R. (2000) ‗Manufacturing Firms in Developing Countries: How Well Do They Do, and Why?‖
Journal of Economic Literature, 38(1), pp. 11-44.
UNCTAD (2011).Economic Development in Africa Report 2010.Fostering Industrial Development in
Africa, United Nations, New York and Geneva.
UNCTAD (2010) Economic Development in Africa Report 2009.Fostering Industrial Development in
Africa, United Nations, New York and Geneva.
UNCTAD (2006) Least Developed countries report 2006: Building Productive Capacities, United
Nations, New York and Geneva.
UNECA and AUC (2011) Economic Report on Africa 2011: Governing Development in Africa – the Role
of the State in Economic Transformation, UNECA, Addis Ababa, Ethiopia.
UNECA and AUC (2007) Economic report on Africa 2007: Accelerating Africa’s Development through
Diversification, UNECA, Addis Ababa, Ethiopia.
UNESCO (2009) Analysis of 2007 UIS Statistics on Feature Films, Information Sheet No.1. Available
online: http://www.uis.unesco.org/culture/Documents/Infosheet_No1_cinema_EN.pdf
UNOSAA and OECD (2010) Economic Diversification in Africa: A Review of Selected Countries,
UNOSAA, New York, USA.
Vickery, G. and R. Hawkins (2008) ‗Remaking the Movies: Digital Content and the Evolution of the Film
and Video Industries‘ in The Organisation For Economic Co-operation and Development (OECD),
Science & Information Technology Journal vol. 2008, no. 1, pp. 1 - 135, OECD Publishing, France.
Visser, M. (2001) ‗The Role of Intra-industry trade and cross-border Supply Chains in Facilitating
regional Integration in the SADC Markets‘ DPRU Working Papers No. 01/57, Development Policy
Research Unit, University of Cape Town
World Bank (2011) Doing Business: Trading Across Borders
Database.(http://www.doingbusiness.org/data/exploretopics/trading-across-borders).
World Bank (2010) The State of Tourism in Africa: A joint publication of Africa House at New York
University, The Africa Travel Association and the World Bank. Vol. 1 Issue 1, May, 2010.
55
World Bank, (2010) Trade in Financial Services: Mobile Banking in Southern Africa
World Bank (2003), ‗Standards and Global Trade: A voice for Africa‘, accessed 20 April 2012,
<http://www.unido.org/fileadmin/import/12960_WorldBank_StandardsGlobalTrade_voiceForAfrica.pdf>
World Bank and IMF 2009, ‗Global Monitoring Report 2009 – A development emergency‘, Washington.
World Bank Enterprise Survey, Online Source, accessed 5 April 2012,
http://www.enterprisesurveys.org/

56
(8) Appendices
Appendix 1, Table 6: Export Diversification of 49 African Economies (Normalized Herfindahl-
Hirschman Index), 1998-2009
1998 1999 2000 2001 2002 2003 2004 2005 2006 2007 2008 2009
Algeria 0.5 0.4 0.5 0.4 0.5 0.5 0.6 0.6 0.6 0.6 0.5 0.5
Angola 0.8 0.8 0.9 0.9 0.9 0.9 1.0 0.9 1.0 1.0 1.0 1.0
Burundi 0.9 0.8 0.8 0.7 0.5 0.6 0.6 0.6 0.4 0.4 0.4 0.5
Cameroon 0.3 0.3 0.4 0.4 0.4 0.4 0.4 0.4 0.5 0.5 0.5 0.4
Cape Verde 0.4 0.3 0.4 0.3 0.3 0.2 0.2 0.4 0.4 0.4 0.4 0.3
Central African
Republic
0.7 0.7 0.7 0.5 0.6 0.4 0.4 0.5 0.3 0.3 0.3 0.4
Chad 0.8 0.8 0.7 0.8 0.7 0.7 0.8 0.7 0.9 0.9 0.9 0.9
Comoros 0.5 0.4 0.5 0.6 0.5 0.7 0.5 0.4 0.3 0.3 0.3 0.3
Congo 0.7 0.7 0.7 0.7 0.8 0.7 0.7 0.8 0.9 0.8 0.8 0.9
Congo, Dem. Rep. 0.6 0.7 0.6 0.6 0.7 0.5 0.5 0.5 0.4 0.4 0.4 0.3
Benin 0.5 0.6 0.5 0.5 0.4 0.5 0.5 0.5 0.4 0.4 0.4 0.4
Equatorial Guinea 0.7 0.7 0.8 0.9 0.9 0.9 0.9 0.9 0.9 0.9 0.8 0.8
Ethiopia 0.7 0.6 0.6 0.3 0.3 0.3 0.3 0.3 0.3 0.3 0.3 0.3
Eritrea 0.5 0.4 0.2 0.2 0.2 0.1 0.2 0.3 0.2 0.7 0.3 0.3
Djibouti 0.3 0.3 0.2 0.2 0.2 0.3 0.2 0.1 0.2 0.4 0.3 0.2
Gabon 0.7 0.7 0.8 0.8 0.8 0.8 0.7 0.8 0.7 0.7 0.7 0.7
Gambia 0.7 0.6 0.3 0.3 0.3 0.3 0.3 0.3 0.4 0.3 0.4 0.3
Ghana 0.4 0.3 0.3 0.3 0.4 0.4 0.4 0.3 0.4 0.4 0.4 0.5
Guinea 0.4 0.5 0.4 0.4 0.4 0.5 0.5 0.5 0.4 0.5 0.4 0.6
Cote d'Ivoire 0.4 0.4 0.4 0.3 0.4 0.4 0.3 0.3 0.3 0.3 0.3 0.3
Kenya 0.3 0.3 0.3 0.3 0.2 0.2 0.2 0.2 0.2 0.2 0.2 0.2
Liberia 0.5 0.5 0.4 0.5 0.4 0.6 0.5 0.5 0.4 0.5 0.4 0.5
Libyan Arab
Jamahiriya
0.8 0.8 0.8 0.8 0.8 0.8 0.9 0.9 0.9 0.9 0.9 0.8
Madagascar 0.2 0.2 0.2 0.2 0.3 0.3 0.2 0.2 0.2 0.2 0.2 0.1
Malawi 0.6 0.5 0.5 0.6 0.5 0.5 0.4 0.5 0.5 0.4 0.4 0.5
Mali 0.7 0.6 0.5 0.5 0.7 0.7 0.6 0.7 0.7 0.7 0.7 0.5
Mauritania 0.5 0.5 0.4 0.4 0.4 0.4 0.4 0.4 0.5 0.4 0.4 0.5
Mauritius 0.3 0.2 0.2 0.2 0.2 0.2 0.3 0.2 0.2 0.2 0.2 0.2
Morocco 0.1 0.1 0.1 0.1 0.1 0.1 0.1 0.1 0.1 0.1 0.2 0.1
Mozambique 0.4 0.3 0.3 0.5 0.5 0.5 0.5 0.5 0.5 0.5 0.4 0.4
Niger 0.4 0.4 0.5 0.3 0.3 0.4 0.3 0.3 0.4 0.4 0.3 0.8
Nigeria 0.9 0.9 0.9 0.9 0.8 0.9 0.9 0.9 0.9 0.9 0.8 0.8
Guinea-Bissau 0.5 0.6 0.6 0.8 0.6 0.8 0.7 0.9 0.8 0.9 0.9 0.9
Rwanda 0.6 0.7 0.6 0.6 0.5 0.4 0.6 0.4 0.4 0.3 0.4 0.3
Sao Tome and
Principe
0.6 0.3 0.3 0.3 0.5 0.6 0.4 0.5 0.4 0.4 0.5 0.5
Senegal 0.2 0.2 0.2 0.2 0.2 0.2 0.2 0.2 0.2 0.2 0.3 0.2
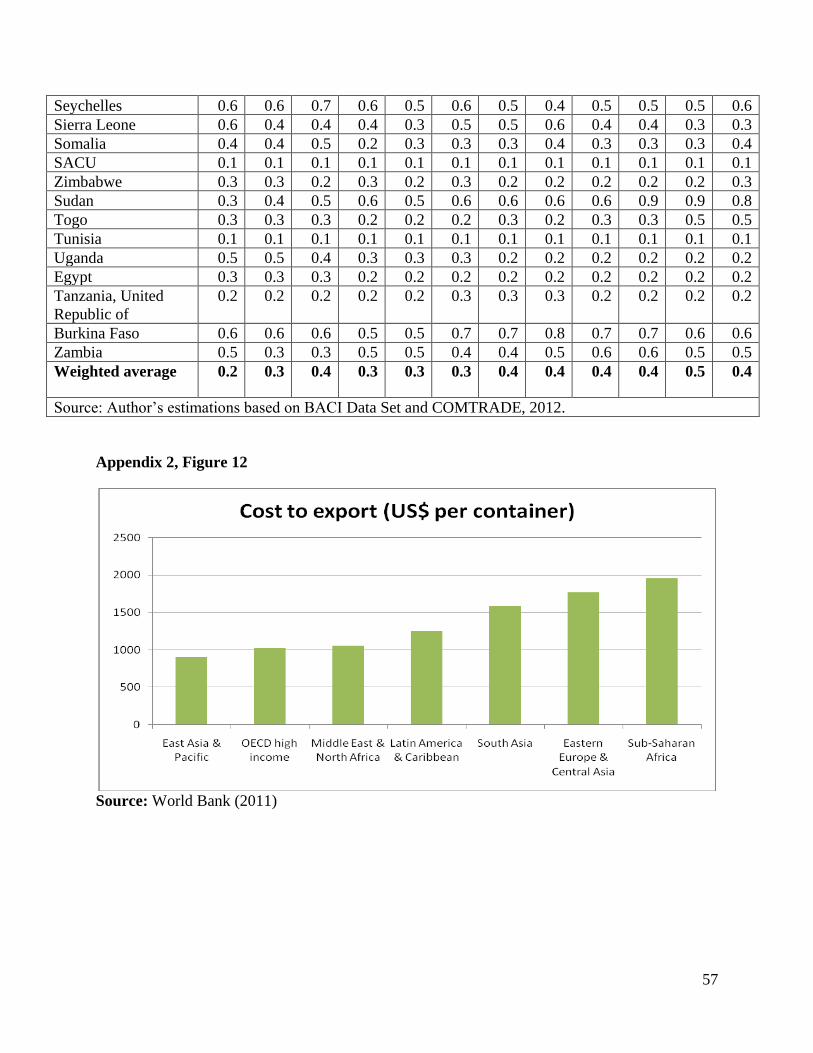
57
Seychelles 0.6 0.6 0.7 0.6 0.5 0.6 0.5 0.4 0.5 0.5 0.5 0.6
Sierra Leone 0.6 0.4 0.4 0.4 0.3 0.5 0.5 0.6 0.4 0.4 0.3 0.3
Somalia 0.4 0.4 0.5 0.2 0.3 0.3 0.3 0.4 0.3 0.3 0.3 0.4
SACU 0.1 0.1 0.1 0.1 0.1 0.1 0.1 0.1 0.1 0.1 0.1 0.1
Zimbabwe 0.3 0.3 0.2 0.3 0.2 0.3 0.2 0.2 0.2 0.2 0.2 0.3
Sudan 0.3 0.4 0.5 0.6 0.5 0.6 0.6 0.6 0.6 0.9 0.9 0.8
Togo 0.3 0.3 0.3 0.2 0.2 0.2 0.3 0.2 0.3 0.3 0.5 0.5
Tunisia 0.1 0.1 0.1 0.1 0.1 0.1 0.1 0.1 0.1 0.1 0.1 0.1
Uganda 0.5 0.5 0.4 0.3 0.3 0.3 0.2 0.2 0.2 0.2 0.2 0.2
Egypt 0.3 0.3 0.3 0.2 0.2 0.2 0.2 0.2 0.2 0.2 0.2 0.2
Tanzania, United
Republic of
0.2 0.2 0.2 0.2 0.2 0.3 0.3 0.3 0.2 0.2 0.2 0.2
Burkina Faso 0.6 0.6 0.6 0.5 0.5 0.7 0.7 0.8 0.7 0.7 0.6 0.6
Zambia 0.5 0.3 0.3 0.5 0.5 0.4 0.4 0.5 0.6 0.6 0.5 0.5
Weighted average 0.2 0.3 0.4 0.3 0.3 0.3 0.4 0.4 0.4 0.4 0.5 0.4
Source: Author‘s estimations based on BACI Data Set and COMTRADE, 2012.
Appendix 2, Figure 12
Source: World Bank (2011)
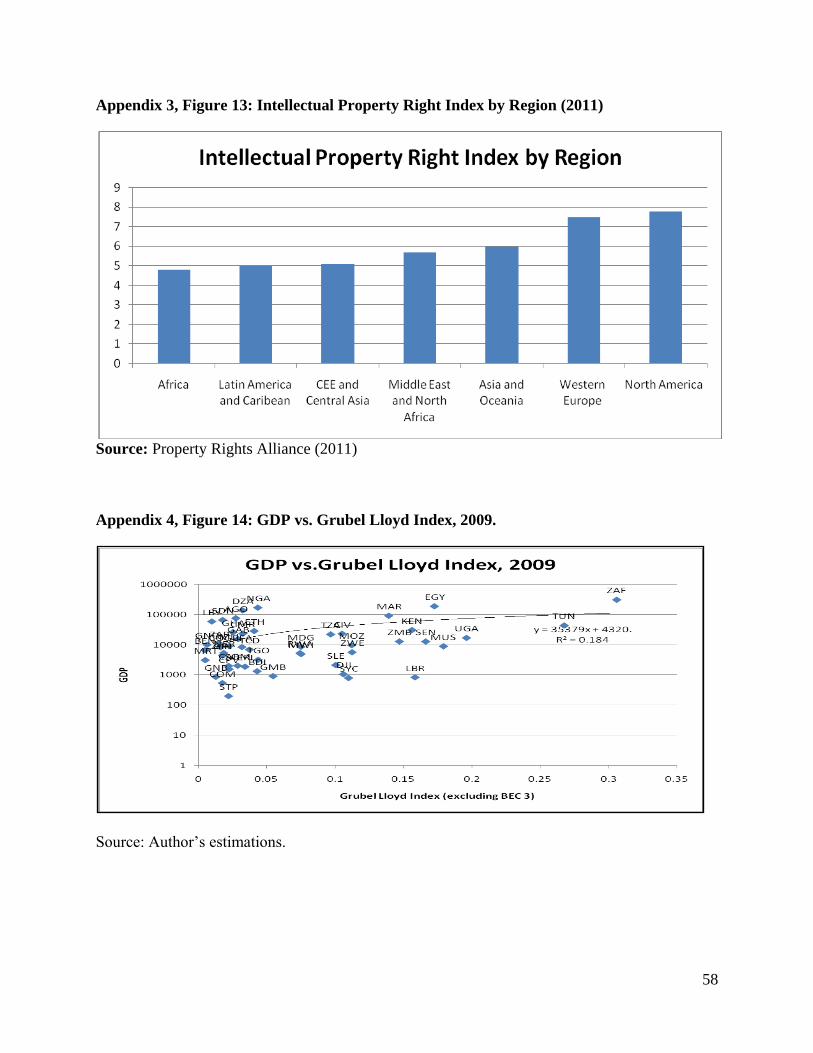
58
Appendix 3, Figure 13: Intellectual Property Right Index by Region (2011)
Source: Property Rights Alliance (2011)
Appendix 4, Figure 14: GDP vs. Grubel Lloyd Index, 2009.
Source: Author‘s estimations.
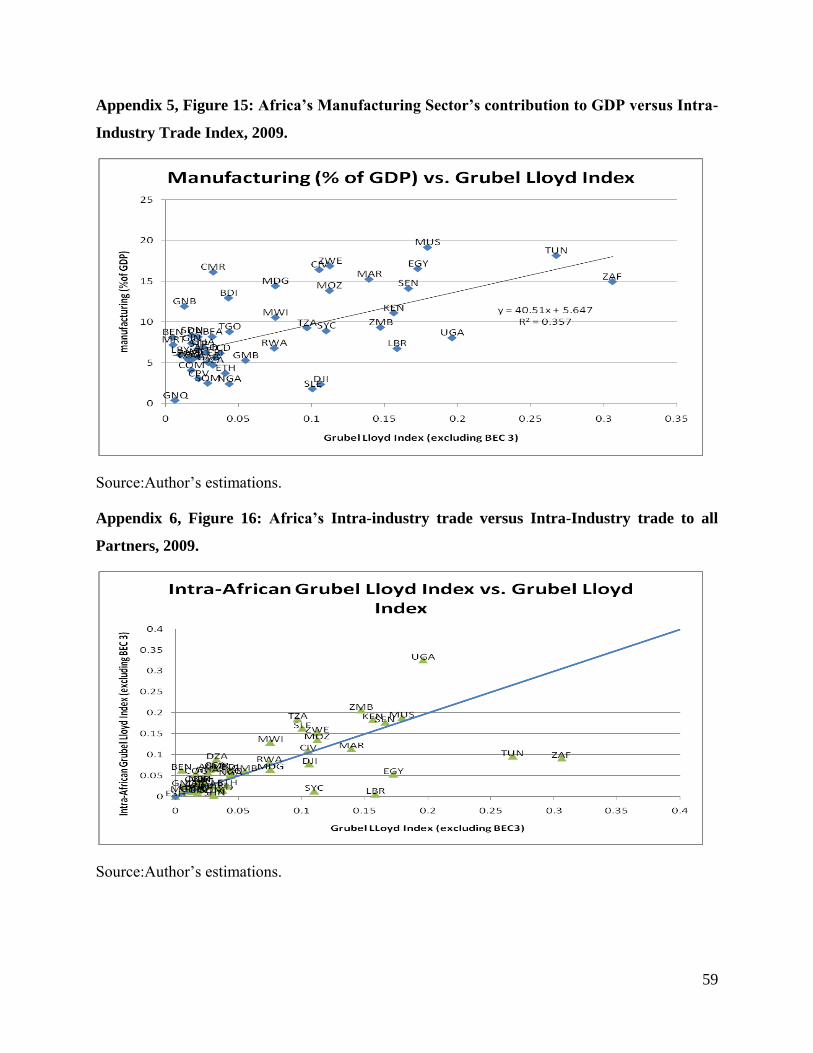
59
Appendix 5, Figure 15: Africa’s Manufacturing Sector’s contribution to GDP versus Intra-
Industry Trade Index, 2009.
Source:Author‘s estimations.
Appendix 6, Figure 16: Africa’s Intra-industry trade versus Intra-Industry trade to all
Partners, 2009.
Source:Author‘s estimations.

60
Appendix 7, Figure 17: Constraints to Manufacturing Sectors in Africa
Percent of firms identifying transportation as a
major constraint
Percent of firms identifying customs and trade
regulations as a major constraint
Source: Adapted from Enterprise Surveys (http://www.enterprisesurveys.org), The World Bank,
2012.
0.0 10.0 20.0 30.0 40.0 50.0 60.0
Sub-Saharan Africa
Angola
Burundi
Benin
Burkina Faso
Botswana
Central African Republic
Côte d'Ivoire
Cameroon
Congo, Rep.
Cape Verde
Eritrea
Ethiopia
Gabon
Ghana
Guinea
Gambia, The
Guinea-Bissau
Kenya
Liberia
Lesotho
Madagascar
Mali
Mozambique
Mauritania
Mauritius
Malawi
Namibia
Niger
Nigeria
Rwanda
Senegal
Sierra Leone
Swaziland
Chad
Togo
Tanzania
Uganda
South Africa
Congo, Dem. Rep.
Zambia