interpreting innovation
TRANSCRIPT

BlackRock Investment InstItute
InteRPRetInG InnovatIon IMPACT ON PRODUCTIVITY, INFLATION & INVESTING
SEPTEMbER 2014

[ 2 ] I n t e R P R e t I n G I n n o v at I o n
The opinions expressed are as of September 2014 and may change as subsequent conditions vary.
Interpreting InnovationTechnological change is disrupting economies and companies. Could it alter the gloomy outlook for nominal economic growth? And what does innovation mean for employment and inflation? We gathered 85 BlackRock investment professionals to debate this topic—and separate hype from reality.
Why is innovation so important for investors? Technological change is at the intersection of employment, nominal economic growth and inflation risk—the focus areas of global policymakers. Central banks are prepared to risk falling behind the curve because they see little inflation risk and focus on increasing employment. Innovation can help keep a lid on the former (suppressing wages and prices) but hurt the latter (producing more with fewer people).
We detail the links between innovation, productivity and inflation. We also identify potential winners and losers (both companies and countries), and gauge innovation’s impact on interest rates and investing strategies. Our main conclusions:
} Repetitive tasks in manufacturing are now performed mostly by machines. This is nothing new: Robots have roamed factory floors for decades. Yet we could be near a tipping point in adoption. Robots are getting cheaper—and smarter.
} The next leg of innovation is just starting. Think of the exponential increases in computer power, machine learning and the ability to analyze vast reservoirs of data. Many companies—and investors—have yet to tap these data riches.
} Faster diffusion of technologies makes it harder for companies to maintain a competitive edge. The Internet economy enables companies to piggyback off existing infrastructure, reducing the need for capital investments.
} Innovation erodes the traditional edge of many emerging markets: cheap labor. Also, diffusion of technology is slow in much of the emerging world due to poor infrastructure and weak legal protections.
} Techno optimists argue we are on the cusp of a productivity renaissance as new technologies are adopted more broadly. Pessimists counter the productivity boon from the Internet era is waning. We lean toward the first group.
} Innovation cuts out middlemen in supply chains and leads to commoditization. The former tends to reduce demand for existing services; the latter boosts supply. The net result is a steady downward pressure on prices.
} Technological change is helping put a lid on U.S. jobs and wage growth. This means the U.S. Federal Reserve’s next tightening cycle is likely to be more gentle than in the past—with rates peaking at a lower level.
} Subdued inflation, aging populations and high debt loads will likely depress nominal gross domestic product (GDP) growth the in long run. Long-term yields could stay low for a while. Yield curves are likely to flatten further as long-term bonds receive a steady bid from insurance companies and others amid limited supply.
} Corporate financing will likely stay cheap. bond markets are effectively subsidizing equities. Yet the longer financial conditions remain easy, the greater the potential recoil. The link between equities and bonds also means the two could become more correlated, challenging traditional portfolio diversification.
Rick RiederChief Investment Officer, BlackRock Fundamental Fixed Income
Ewen Cameron WattChief Investment Strategist, BlackRock Investment Institute
Peter FisherSenior Director, BlackRock Investment Institute
Chris JonesChief Investment Officer, BlackRock Americas Fundamental Equity
What Is Inside
Introduction ................................3–5
Winners & Losers ................... 6–7
Productivity ................................8–9
Inflation ................................... 10–11
Investing ..................................12–15
[ 3 ]I n t R o D u c t I o n
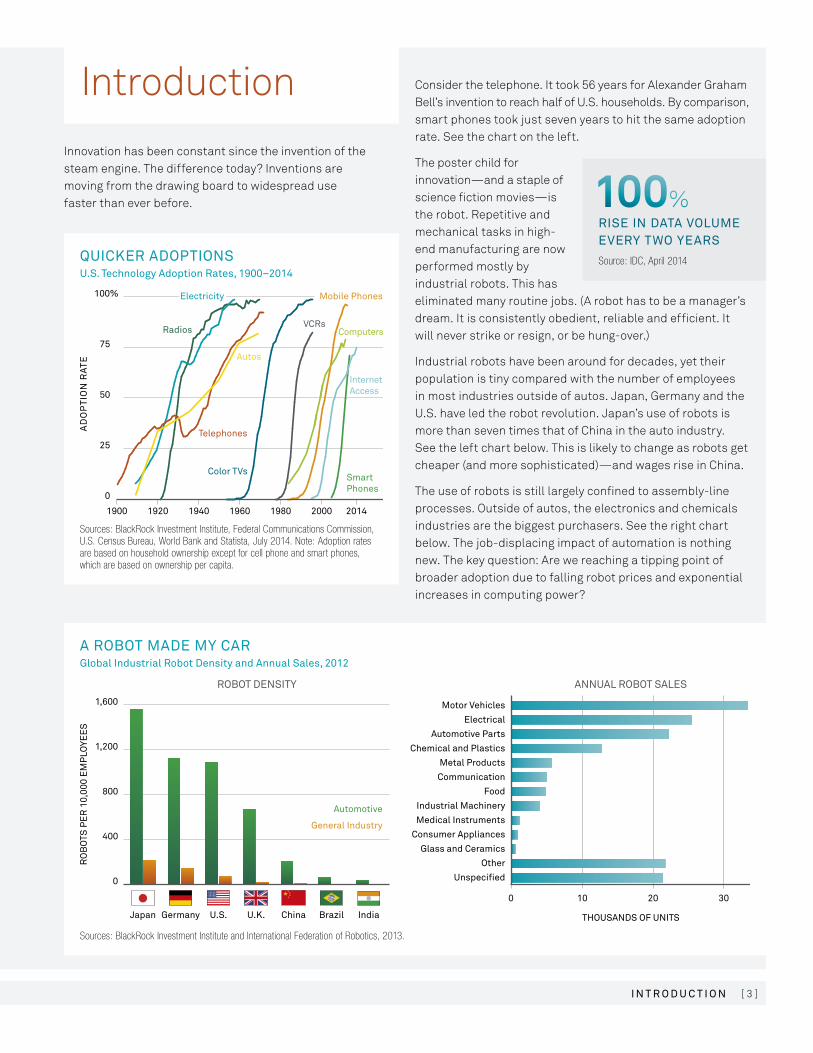
Innovation has been constant since the invention of the steam engine. The difference today? Inventions are moving from the drawing board to widespread use faster than ever before.
Sources: BlackRock Investment Institute, Federal Communications Commission, U.S. Census Bureau, World Bank and Statista, July 2014. Note: Adoption rates are based on household ownership except for cell phone and smart phones, which are based on ownership per capita.
QuIckeR aDoPtIonsu.s. technology adoption Rates, 1900–2014
0
100%
75
50
25
1900 1920 1940 1960 1980 2000 2014
AD
OP
TIO
N R
ATE Autos
Telephones
Color TVs
VCRs
Mobile Phones
Computers
InternetAccess
SmartPhones
Electricity
Radios
Sources: BlackRock Investment Institute and International Federation of Robotics, 2013.
a RoBot maDe mY caR Global Industrial Robot Density and annual sales, 2012
1,600
1,200
800
400
0
RO
BO
TS P
ER
10,
000
EM
PLO
YEE
S
ROBOT DENSITY
Automotive
General Industry
ANNUAL ROBOT SALES
Motor Vehicles
Electrical
Automotive Parts
Chemical and Plastics
Metal Products
Communication
Food
Industrial Machinery
Medical Instruments
Consumer Appliances
Glass and Ceramics
Other
Unspecified
THOUSANDS OF UNITS
0 10 20 30
Japan Germany U.S. U.K. China Brazil India
Introduction Consider the telephone. It took 56 years for Alexander Graham bell’s invention to reach half of U.S. households. by comparison, smart phones took just seven years to hit the same adoption rate. See the chart on the left.
The poster child for innovation—and a staple of science fiction movies—is the robot. Repetitive and mechanical tasks in high-end manufacturing are now performed mostly by industrial robots. This has eliminated many routine jobs. (A robot has to be a manager’s dream. It is consistently obedient, reliable and efficient. It will never strike or resign, or be hung-over.)
Industrial robots have been around for decades, yet their population is tiny compared with the number of employees in most industries outside of autos. Japan, Germany and the U.S. have led the robot revolution. Japan’s use of robots is more than seven times that of China in the auto industry. See the left chart below. This is likely to change as robots get cheaper (and more sophisticated)—and wages rise in China.
The use of robots is still largely confined to assembly-line processes. Outside of autos, the electronics and chemicals industries are the biggest purchasers. See the right chart below. The job-displacing impact of automation is nothing new. The key question: Are we reaching a tipping point of broader adoption due to falling robot prices and exponential increases in computing power?
Source: IDC, April 2014
RIse In Data volume eveRY two YeaRs
100%
[ 4 ] I n t e R P R e t I n G I n n o v at I o n
“ I’m in the techno optimist camp. I think we’re just on the tip of the iceberg.”
— Kristen WaltersGlobal Chief Operating Officer, BlackRock
Risk and Quantitative Analysis Group
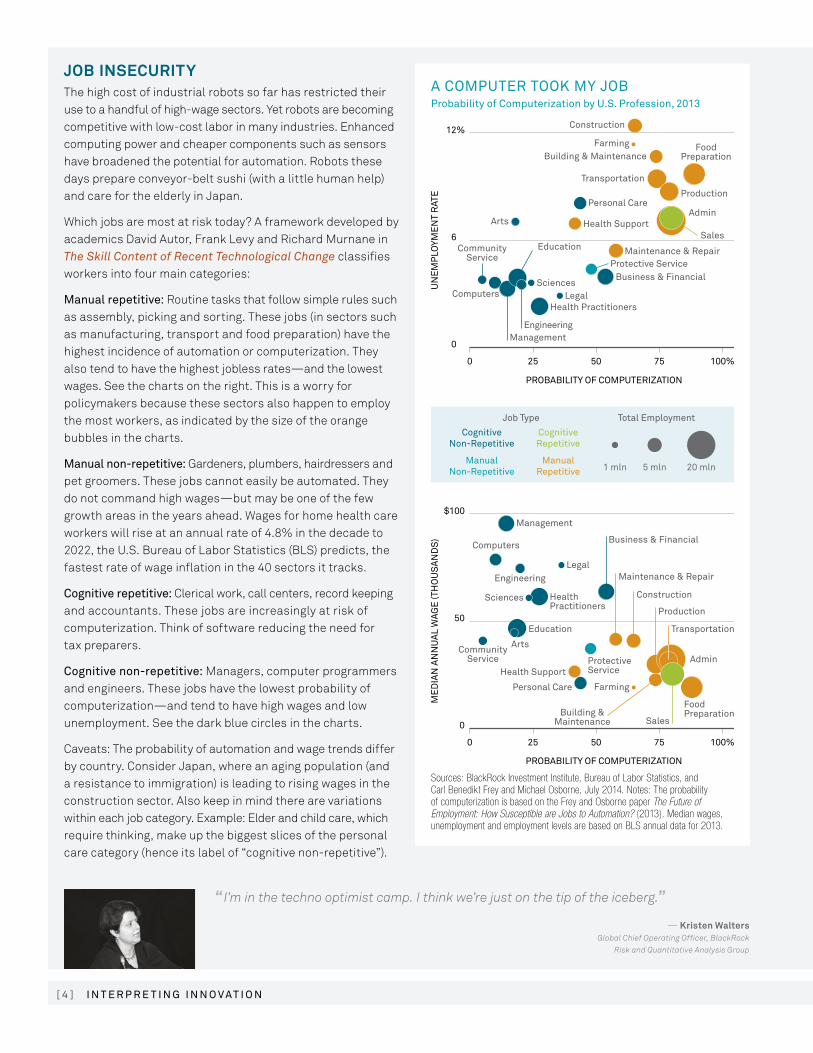
Sources: BlackRock Investment Institute, Bureau of Labor Statistics, and Carl Benedikt Frey and Michael Osborne, July 2014. Notes: The probability of computerization is based on the Frey and Osborne paper The Future of Employment: How Susceptible are Jobs to Automation? (2013). Median wages, unemployment and employment levels are based on BLS annual data for 2013.
a comPuteR took mY JoB Probability of computerization by u.s. Profession, 2013
12%
0
6
Construction
Building & Maintenance
Building &Maintenance
Transportation
Farming
Farming
UN
EM
PLO
YME
NT
RAT
E
0 25 50 75
$100
50
0
ME
DIA
N A
NN
UA
L W
AGE
(TH
OU
SA
ND
S)
PROBABILITY OF COMPUTERIZATION
PROBABILITY OF COMPUTERIZATION
100%
0 25 50 75 100%
Production
Production
Sales
Admin
Admin
Maintenance & RepairProtective Service
ProtectiveService
Legal
Health Practitioners
HealthPractitioners
Management
Management
Maintenance & Repair
CommunityService
CommunityService
Education
Education Transportation
Sciences
Sciences
Engineering
Engineering
Personal Care
Personal Care
Health Support
Health Support
Arts
Arts
Business & Financial
Business & Financial
CognitiveNon-Repetitive
CognitiveRepetitive
ManualNon-Repetitive
ManualRepetitive 1 mln 20 mln5 mln
Total EmploymentJob Type
Computers
Sales
Construction
Legal
Computers
FoodPreparation
FoodPreparation
JOB INSECURITYThe high cost of industrial robots so far has restricted their use to a handful of high-wage sectors. Yet robots are becoming competitive with low-cost labor in many industries. Enhanced computing power and cheaper components such as sensors have broadened the potential for automation. Robots these days prepare conveyor-belt sushi (with a little human help) and care for the elderly in Japan.
Which jobs are most at risk today? A framework developed by academics David Autor, Frank Levy and Richard Murnane in The Skill Content of Recent Technological Change classifies workers into four main categories:
manual repetitive: Routine tasks that follow simple rules such as assembly, picking and sorting. These jobs (in sectors such as manufacturing, transport and food preparation) have the highest incidence of automation or computerization. They also tend to have the highest jobless rates—and the lowest wages. See the charts on the right. This is a worry for policymakers because these sectors also happen to employ the most workers, as indicated by the size of the orange bubbles in the charts.
manual non-repetitive: Gardeners, plumbers, hairdressers and pet groomers. These jobs cannot easily be automated. They do not command high wages—but may be one of the few growth areas in the years ahead. Wages for home health care workers will rise at an annual rate of 4.8% in the decade to 2022, the U.S. bureau of Labor Statistics (bLS) predicts, the fastest rate of wage inflation in the 40 sectors it tracks.
cognitive repetitive: Clerical work, call centers, record keeping and accountants. These jobs are increasingly at risk of computerization. Think of software reducing the need for tax preparers.
cognitive non-repetitive: Managers, computer programmers and engineers. These jobs have the lowest probability of computerization—and tend to have high wages and low unemployment. See the dark blue circles in the charts.
Caveats: The probability of automation and wage trends differ by country. Consider Japan, where an aging population (and a resistance to immigration) is leading to rising wages in the construction sector. Also keep in mind there are variations within each job category. Example: Elder and child care, which require thinking, make up the biggest slices of the personal care category (hence its label of “cognitive non-repetitive”).

[ 5 ]I n t R o D u c t I o n
InnovatIon waRs key arguments of techno optimists and Pessimists
tecHno oPtImIsts tecHno PessImIsts
OVERALL
} We are at an inflection point in the adoption of new technologies.} The next few years will see a massive acceleration in the pace of
technological change.
} This is all hype, no matter what the jeans-clad tech CEOs say. Productivity is actually falling.
} Are smart phones really as revolutionary as the steam engine or electricity? No way.
BIG DATA
} big data will touch almost every industry. Most companies have yet to exploit it—when they do, the gains will be enormous.
} Example: health care moving from paper to computer records that combine medical, insurance and other data.
} big data is overhyped. So far it has just created an arms race to gain market share.
} There will be winners and losers—but overall it is a wash for the economy.
AUTOMATION
} Robots are getting cheaper and smarter—and are on the cusp of much broader adoption.
} Limited robot use in the services industry (as of yet) raises the possibility manual labor might be able to earn a growing return.
} Modern economies are built on services—where robots are hardest to employ.
} The benefits of automation go mainly to the wealthy. Those without skills will find it even harder to get jobs or wage hikes.
RETAIL
} Online retail is increasing price transparency, benefiting consumers.
} Technology is transforming supply chain management and logistics, delivering big productivity boosts.
} Some online retailers are effectively operating as non-profits. Margins are wafer-thin.
} Many brick-and-mortar stores could go the way of the dodo.
AGRICULTURE
} Cheap drones with sensors help farmers maximize yields and reduce crop damage.
} Genetically modified plants produce crops more resistant to pests, flooding and drought.
} Farming is becoming more capital intensive. Smaller operators will have to merge—or be wiped out.
} Some consumers are revolting against genetically modified crops. Organic farming has legs.
GENOMICS
} Genome and medical advances have only just begun.} The price of extracting genomic data is tumbling, heralding
widespread usage.
} The impact is likely to be narrow and the focus will be on expensive treatments—rather than broad health improvements that raise productivity.
SHARING ECONOMY
} The “sharing economy” allows people to exploit underused capacity of their assets or talents by selling or renting them. Cars and apartments could be just the beginning.
} Capacity utilization will rise. This may improve productivity, but it will also dampen investment.
} Middlemen will be wiped out, exacerbating the gap between winners and losers.
GLUM PICTURE The distinction between job categories is becoming increasingly blurry. Software and algorithms are starting to replace (or complement) humans—even in professions that need cognitive skills. Think insurance claims processing, fraud detection, equity trading and legal research. Some 65% of U.S. workers are in jobs that can be classified as “information processing,” according to MIT technologists Andrew McAfee and Erik brynjolfsson (authors of The Second Machine Age). Many “manual non-repetitive” jobs may be more at risk than previously thought, too. Driverless cars could one day displace truck and taxi drivers.
There is an inverse relationship between projected productivity growth and employment, we believe. The bottom two quintiles—the industries with the lowest anticipated productivity growth—are expected to contribute almost two-thirds of total growth in U.S. jobs forecast by bLS in the coming decade, our analysis shows. If jobs growth is concentrated in low-productivity industries, overall productivity will be “stickily” low. Yet history suggests such forecasts (which are based on extrapolations of recent trends) may be way off.
Fracking, for example, has raised productivity and employment in the U.S. energy sector. bottom line: Innovation will shrink jobs in some industries—but its net impact on the economy is hard to predict. Education and retraining of displaced workers will be key to softening the adverse employment effects of innovation.
Will today’s innovations be as disruptive as the steam engine or electricity? See the table below for arguments for and against (note the truth could lie somewhere in the middle). Our view: Robots may be old news. Many innovation benefits take time to realize or fully understand. The foundations of the current wave of innovation have been in place for just five years. The bounty from universal wireless broadband, smart phones and “big data” (the ability to store, process and analyze huge reams of data, helping track everything from business trends to the spread of diseases) may be still to come.
Source: RIA, January 2014
cost of unIveRsal RoBot Base moDel
$34,000
[ 6 ] I n t e R P R e t I n G I n n o v at I o n
“ Automation makes the traditional EM model of competing based on cheap labor much more challenging.”
— Gerardo RodriguezSenior Investment Strategist,
BlackRock Emerging Markets Team
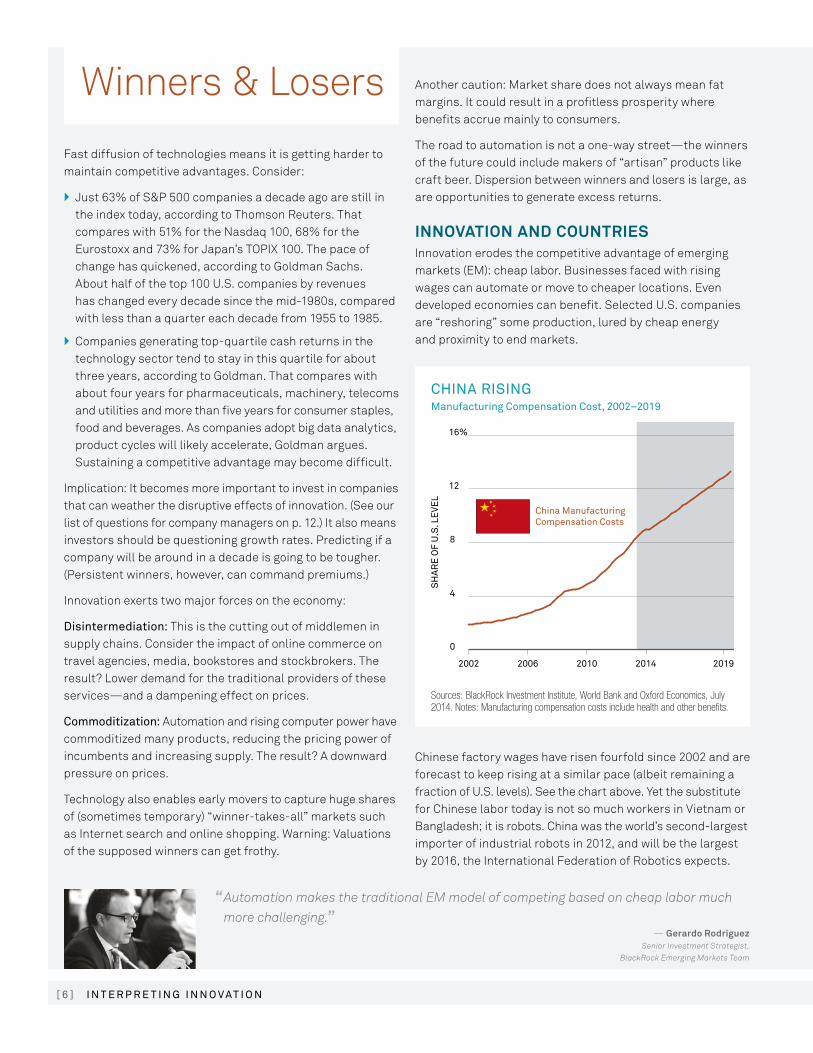
Sources: BlackRock Investment Institute, World Bank and Oxford Economics, July 2014. Notes: Manufacturing compensation costs include health and other benefits.
cHIna RIsInG manufacturing compensation cost, 2002–2019
16%
12
8
4
0
SH
AR
E O
F U
.S. L
EVE
L
2002 2006 2010 2014 2019
China Manufacturing Compensation Costs
Fast diffusion of technologies means it is getting harder to maintain competitive advantages. Consider:
} Just 63% of S&P 500 companies a decade ago are still in the index today, according to Thomson Reuters. That compares with 51% for the Nasdaq 100, 68% for the Eurostoxx and 73% for Japan’s TOPIX 100. The pace of change has quickened, according to Goldman Sachs. About half of the top 100 U.S. companies by revenues has changed every decade since the mid-1980s, compared with less than a quarter each decade from 1955 to 1985.
} Companies generating top-quartile cash returns in the technology sector tend to stay in this quartile for about three years, according to Goldman. That compares with about four years for pharmaceuticals, machinery, telecoms and utilities and more than five years for consumer staples, food and beverages. As companies adopt big data analytics, product cycles will likely accelerate, Goldman argues. Sustaining a competitive advantage may become difficult.
Implication: It becomes more important to invest in companies that can weather the disruptive effects of innovation. (See our list of questions for company managers on p. 12.) It also means investors should be questioning growth rates. Predicting if a company will be around in a decade is going to be tougher. (Persistent winners, however, can command premiums.)
Innovation exerts two major forces on the economy:
Disintermediation: This is the cutting out of middlemen in supply chains. Consider the impact of online commerce on travel agencies, media, bookstores and stockbrokers. The result? Lower demand for the traditional providers of these services—and a dampening effect on prices.
commoditization: Automation and rising computer power have commoditized many products, reducing the pricing power of incumbents and increasing supply. The result? A downward pressure on prices.
Technology also enables early movers to capture huge shares of (sometimes temporary) “winner-takes-all” markets such as Internet search and online shopping. Warning: Valuations of the supposed winners can get frothy.
Another caution: Market share does not always mean fat margins. It could result in a profitless prosperity where benefits accrue mainly to consumers.
The road to automation is not a one-way street—the winners of the future could include makers of “artisan” products like craft beer. Dispersion between winners and losers is large, as are opportunities to generate excess returns.
INNOVATION AND COUNTRIESInnovation erodes the competitive advantage of emerging markets (EM): cheap labor. businesses faced with rising wages can automate or move to cheaper locations. Even developed economies can benefit. Selected U.S. companies are “reshoring” some production, lured by cheap energy and proximity to end markets.
Chinese factory wages have risen fourfold since 2002 and are forecast to keep rising at a similar pace (albeit remaining a fraction of U.S. levels). See the chart above. Yet the substitute for Chinese labor today is not so much workers in Vietnam or bangladesh; it is robots. China was the world’s second-largest importer of industrial robots in 2012, and will be the largest by 2016, the International Federation of Robotics expects.
Winners & Losers

[ 7 ]w I n n e R s & l o s e R s
GET AN EDUCATIONIt is not all bad news for the developing world. Emerging markets can piggyback off innovations and skip intermediate steps. Think of Kenya’s thriving cell phone payment system and South Korea and Taiwan’s edge in technology component design and manufacturing.
but weak institutions and spotty law enforcement (particularly in intellectual property) in many EM countries make it harder for new technologies to disrupt the status quo. This highlights the importance of structural reforms in emerging markets to boost productivity.
bottom line: If you lose your labor cost advantage, you better come up with something else. This has big implications for growth and social stability.
The quality of education will be a key determinant of success. Asian economies such as China and South Korea are well ahead of other emerging regions such as Latin America in this respect—particularly in the important area of math and science education. See the map below and our interactive graphic on growth and education levels across the world.Developed economies in North America and Europe still score well on this metric, but other regions are catching up fast.
Developed economies tangled in red tape also risk falling behind. Europe, for example, lags the United States in investment in information and communications technology (ICT).
Consider the following facts from The Conference board:
} ICT-related investment and productivity gains accounted for just 30% of Europe’s GDP growth from 2001–2011, versus 55% for the U.S.
} Five times more telecommunications patent applications are filed in the U.S. than in Europe.
} None of the world’s 10 most-visited Internet sites are European (two are Chinese).
Reasons include a fragmented European market that inhibits economies of scale (lots of countries and languages), a lack of entrepreneurial culture and poor access to venture capital. France, Italy and Spain are among the biggest laggards—partly due to a lack of structural reforms, The Conference board argues.
Source: Cisco, June 2014
InteRnet tRaffIc volume, 2018 vs. 2005
64X
eDucatIon DefIcIts Quality of math and science education by country
Sources: BlackRock Investment Institute and World Economic Forum Global Competitiveness Report 2013, July 2014.
BestWorst
[ 8 ] I n t e R P R e t I n G I n n o v at I o n
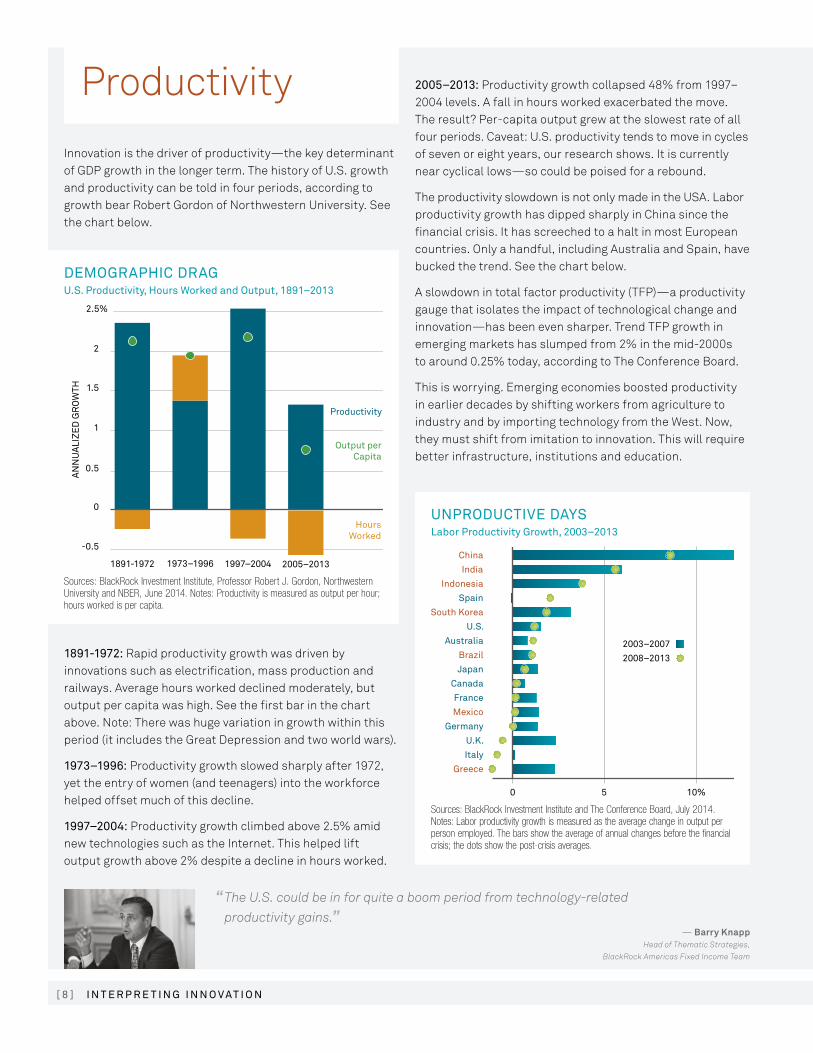
Sources: BlackRock Investment Institute and The Conference Board, July 2014. Notes: Labor productivity growth is measured as the average change in output per person employed. The bars show the average of annual changes before the financial crisis; the dots show the post-crisis averages.
unPRoDuctIve DaYslabor Productivity Growth, 2003–2013
0 5 10%
China
India
Indonesia
Spain
South Korea
2003–2007
U.S.
Australia
Brazil
Japan
Canada
France
Mexico
Germany
U.K.
Italy
Greece
2008–2013
Innovation is the driver of productivity—the key determinant of GDP growth in the longer term. The history of U.S. growth and productivity can be told in four periods, according to growth bear Robert Gordon of Northwestern University. See the chart below.
Sources: BlackRock Investment Institute, Professor Robert J. Gordon, Northwestern University and NBER, June 2014. Notes: Productivity is measured as output per hour; hours worked is per capita.
DemoGRaPHIc DRaGu.s. Productivity, Hours worked and output, 1891–2013
2.5%
-0.5
0
0.5
1
1.5
2
1891-1972 1973–1996 1997–2004 2005–2013
HoursWorked
AN
NU
ALI
ZE
D G
RO
WTH
Output perCapita
Productivity
1891-1972: Rapid productivity growth was driven by innovations such as electrification, mass production and railways. Average hours worked declined moderately, but output per capita was high. See the first bar in the chart above. Note: There was huge variation in growth within this period (it includes the Great Depression and two world wars).
1973–1996: Productivity growth slowed sharply after 1972, yet the entry of women (and teenagers) into the workforce helped offset much of this decline.
1997–2004: Productivity growth climbed above 2.5% amid new technologies such as the Internet. This helped lift output growth above 2% despite a decline in hours worked.
2005–2013: Productivity growth collapsed 48% from 1997–2004 levels. A fall in hours worked exacerbated the move. The result? Per-capita output grew at the slowest rate of all four periods. Caveat: U.S. productivity tends to move in cycles of seven or eight years, our research shows. It is currently near cyclical lows—so could be poised for a rebound.
The productivity slowdown is not only made in the USA. Labor productivity growth has dipped sharply in China since the financial crisis. It has screeched to a halt in most European countries. Only a handful, including Australia and Spain, have bucked the trend. See the chart below.
A slowdown in total factor productivity (TFP)—a productivity gauge that isolates the impact of technological change and innovation—has been even sharper. Trend TFP growth in emerging markets has slumped from 2% in the mid-2000s to around 0.25% today, according to The Conference board.
This is worrying. Emerging economies boosted productivity in earlier decades by shifting workers from agriculture to industry and by importing technology from the West. Now, they must shift from imitation to innovation. This will require better infrastructure, institutions and education.
“ The U.S. could be in for quite a boom period from technology-related productivity gains.”
— Barry KnappHead of Thematic Strategies,
BlackRock Americas Fixed Income Team
Productivity
[ 9 ]P R o D u c t I v I t Y
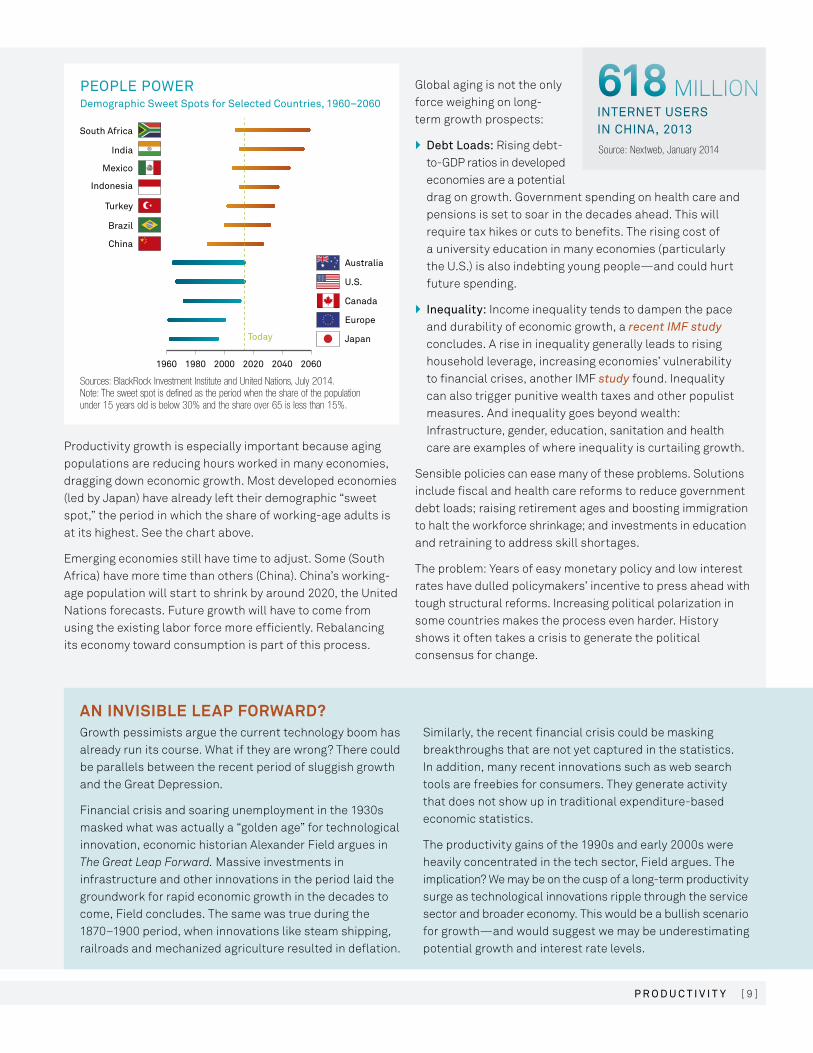
Sources: BlackRock Investment Institute and United Nations, July 2014. Note: The sweet spot is defined as the period when the share of the population under 15 years old is below 30% and the share over 65 is less than 15%.
PeoPle PoweRDemographic sweet spots for selected countries, 1960–2060
1960 1980 2000 2020 2040 2060
South Africa
Today
Europe
Japan
India
Mexico
Indonesia
Turkey
Brazil
China
Canada
U.S.
Australia
AN INVISIBLE LEAP FORWARD? Growth pessimists argue the current technology boom has already run its course. What if they are wrong? There could be parallels between the recent period of sluggish growth and the Great Depression.
Financial crisis and soaring unemployment in the 1930s masked what was actually a “golden age” for technological innovation, economic historian Alexander Field argues in The Great Leap Forward. Massive investments in infrastructure and other innovations in the period laid the groundwork for rapid economic growth in the decades to come, Field concludes. The same was true during the 1870–1900 period, when innovations like steam shipping, railroads and mechanized agriculture resulted in deflation.
Similarly, the recent financial crisis could be masking breakthroughs that are not yet captured in the statistics. In addition, many recent innovations such as web search tools are freebies for consumers. They generate activity that does not show up in traditional expenditure-based economic statistics.
The productivity gains of the 1990s and early 2000s were heavily concentrated in the tech sector, Field argues. The implication? We may be on the cusp of a long-term productivity surge as technological innovations ripple through the service sector and broader economy. This would be a bullish scenario for growth—and would suggest we may be underestimating potential growth and interest rate levels.
Global aging is not the only force weighing on long-term growth prospects:
} Debt loads: Rising debt-to-GDP ratios in developed economies are a potential drag on growth. Government spending on health care and pensions is set to soar in the decades ahead. This will require tax hikes or cuts to benefits. The rising cost of a university education in many economies (particularly the U.S.) is also indebting young people—and could hurt future spending.
} Inequality: Income inequality tends to dampen the pace and durability of economic growth, a recent IMF study concludes. A rise in inequality generally leads to rising household leverage, increasing economies’ vulnerability to financial crises, another IMF study found. Inequality can also trigger punitive wealth taxes and other populist measures. And inequality goes beyond wealth: Infrastructure, gender, education, sanitation and health care are examples of where inequality is curtailing growth.
Sensible policies can ease many of these problems. Solutions include fiscal and health care reforms to reduce government debt loads; raising retirement ages and boosting immigration to halt the workforce shrinkage; and investments in education and retraining to address skill shortages.
The problem: Years of easy monetary policy and low interest rates have dulled policymakers’ incentive to press ahead with tough structural reforms. Increasing political polarization in some countries makes the process even harder. History shows it often takes a crisis to generate the political consensus for change.
Productivity growth is especially important because aging populations are reducing hours worked in many economies, dragging down economic growth. Most developed economies (led by Japan) have already left their demographic “sweet spot,” the period in which the share of working-age adults is at its highest. See the chart above.
Emerging economies still have time to adjust. Some (South Africa) have more time than others (China). China’s working-age population will start to shrink by around 2020, the United Nations forecasts. Future growth will have to come from using the existing labor force more efficiently. Rebalancing its economy toward consumption is part of this process.
Source: Nextweb, January 2014
InteRnet useRs In cHIna, 2013
618 MILLION
[ 1 0 ] I n t e R P R e t I n G I n n o v at I o n
Innovations that replace people are generally deflationary. Not all deflation is bad: Good deflation is driven by increased supply, often due to disruptive innovations. Case in point: the deflationary period of 1870 to 1900. The light bulb, electricity and steam engine all lowered the cost of living. (bad deflation is driven by a collapse in demand, and tends to reduce profit margins and raise debt burdens. Examples are the Great Depression or the bursting of Japan’s 1980s bubble economy.)
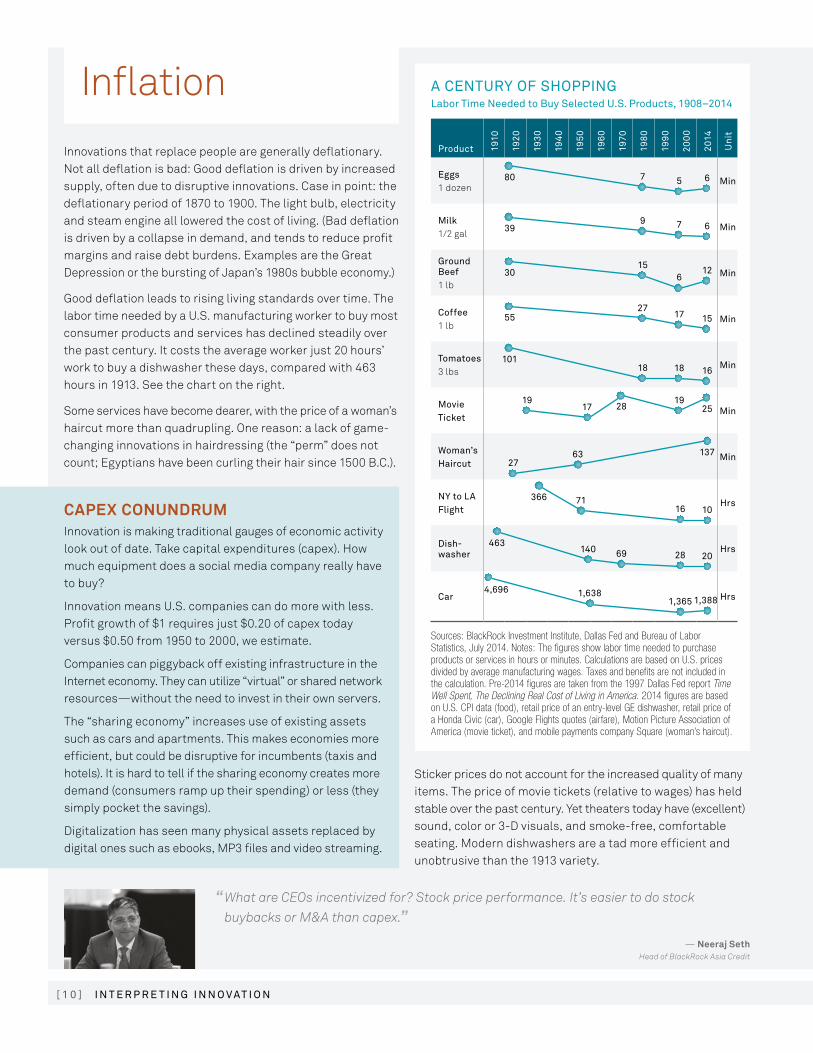
Good deflation leads to rising living standards over time. The labor time needed by a U.S. manufacturing worker to buy most consumer products and services has declined steadily over the past century. It costs the average worker just 20 hours’ work to buy a dishwasher these days, compared with 463 hours in 1913. See the chart on the right.
Some services have become dearer, with the price of a woman’s haircut more than quadrupling. One reason: a lack of game-changing innovations in hairdressing (the “perm” does not count; Egyptians have been curling their hair since 1500 b.C.).
Sources: BlackRock Investment Institute, Dallas Fed and Bureau of Labor Statistics, July 2014. Notes: The figures show labor time needed to purchase products or services in hours or minutes. Calculations are based on U.S. prices divided by average manufacturing wages. Taxes and benefits are not included in the calculation. Pre-2014 figures are taken from the 1997 Dallas Fed report Time Well Spent, The Declining Real Cost of Living in America. 2014 figures are based on U.S. CPI data (food), retail price of an entry-level GE dishwasher, retail price of a Honda Civic (car), Google Flights quotes (airfare), Motion Picture Association of America (movie ticket), and mobile payments company Square (woman’s haircut).
a centuRY of sHoPPInG labor time needed to Buy selected u.s. Products, 1908–2014
Product 1910
1920
1930
1940
1950
1960
1970
1980
1990
2000
2014
uni
t
eggs 1 dozen
min
milk 1/2 gal
min
Ground Beef 1 lb
min
coffee 1 lb
min
tomatoes 3 lbs
min
movie ticket
min
woman’s Haircut
min
nY to la flight
Hrs
Dish- washer Hrs
car Hrs
80
463
101
4,696
366 71
1,638
55
39
30
7
69 20
1,3881,365
18
27
9
15
5
18
17
7
6
6
16
137
1016
28
6327
28 2517
140
19 19
15
6
12
CAPEX CONUNDRUM Innovation is making traditional gauges of economic activity look out of date. Take capital expenditures (capex). How much equipment does a social media company really have to buy?
Innovation means U.S. companies can do more with less. Profit growth of $1 requires just $0.20 of capex today versus $0.50 from 1950 to 2000, we estimate.
Companies can piggyback off existing infrastructure in the Internet economy. They can utilize “virtual” or shared network resources—without the need to invest in their own servers.
The “sharing economy” increases use of existing assets such as cars and apartments. This makes economies more efficient, but could be disruptive for incumbents (taxis and hotels). It is hard to tell if the sharing economy creates more demand (consumers ramp up their spending) or less (they simply pocket the savings).
Digitalization has seen many physical assets replaced by digital ones such as ebooks, MP3 files and video streaming.
Sticker prices do not account for the increased quality of many items. The price of movie tickets (relative to wages) has held stable over the past century. Yet theaters today have (excellent) sound, color or 3-D visuals, and smoke-free, comfortable seating. Modern dishwashers are a tad more efficient and unobtrusive than the 1913 variety.
“ What are CEOs incentivized for? Stock price performance. It’s easier to do stock buybacks or M&A than capex.”
— Neeraj SethHead of BlackRock Asia Credit
Inflation
[ 1 1 ]I n f l at I o n
The bank of Japan (boJ) appears fully committed to doing whatever it takes to hit a 2% inflation target. A tough battle.
Predicting inflation is not easy (economists have a checkered history). And not all innovations are deflationary. Take pharmaceuticals, where patents protect new drugs from commoditization (and price competition). The U.S. producer price index for pharmaceuticals has risen at a 5.7% annual pace over the past decade.
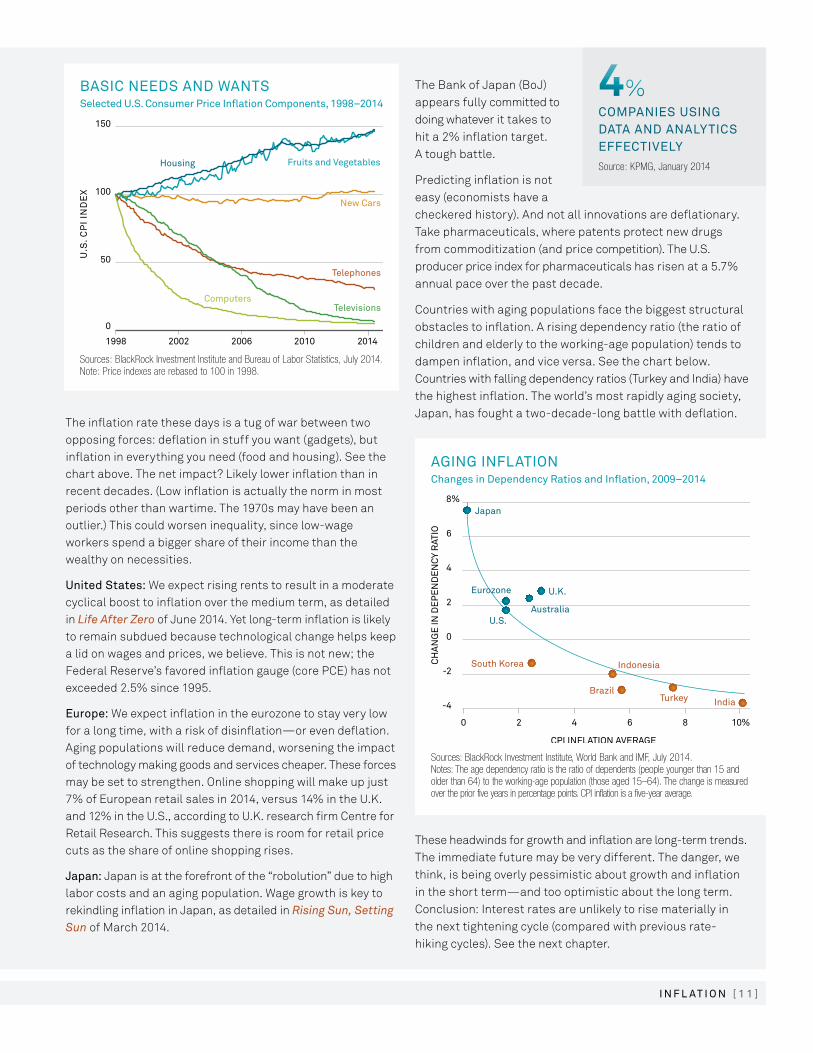
Countries with aging populations face the biggest structural obstacles to inflation. A rising dependency ratio (the ratio of children and elderly to the working-age population) tends to dampen inflation, and vice versa. See the chart below. Countries with falling dependency ratios (Turkey and India) have the highest inflation. The world’s most rapidly aging society, Japan, has fought a two-decade-long battle with deflation.
Source: KPMG, January 2014
comPanIes usInG Data anD analYtIcs effectIvelY
4%
Sources: BlackRock Investment Institute and Bureau of Labor Statistics, July 2014.Note: Price indexes are rebased to 100 in 1998.
BasIc neeDs anD wants selected u.s. consumer Price Inflation components, 1998–2014
0
50
100
150
New Cars
Fruits and VegetablesHousing
Computers
Telephones
Televisions
20142010200620021998
U.S
. CP
I IN
DE
X
Sources: BlackRock Investment Institute, World Bank and IMF, July 2014. Notes: The age dependency ratio is the ratio of dependents (people younger than 15 and older than 64) to the working-age population (those aged 15–64). The change is measured over the prior five years in percentage points. CPI inflation is a five-year average.
aGInG InflatIonchanges in Dependency Ratios and Inflation, 2009–2014
CH
AN
GE
IN D
EP
EN
DE
NCY
RAT
IO
CPI INFLATION AVERAGE
8%
6
4
0
-4
0 2 4 6 8
-2
2
10%
Japan
Eurozone
U.S.
U.K.
Australia
South Korea Indonesia
BrazilTurkey India
The inflation rate these days is a tug of war between two opposing forces: deflation in stuff you want (gadgets), but inflation in everything you need (food and housing). See the chart above. The net impact? Likely lower inflation than in recent decades. (Low inflation is actually the norm in most periods other than wartime. The 1970s may have been an outlier.) This could worsen inequality, since low-wage workers spend a bigger share of their income than the wealthy on necessities.
united states: We expect rising rents to result in a moderate cyclical boost to inflation over the medium term, as detailed in Life After Zero of June 2014. Yet long-term inflation is likely to remain subdued because technological change helps keep a lid on wages and prices, we believe. This is not new; the Federal Reserve’s favored inflation gauge (core PCE) has not exceeded 2.5% since 1995.
europe: We expect inflation in the eurozone to stay very low for a long time, with a risk of disinflation—or even deflation. Aging populations will reduce demand, worsening the impact of technology making goods and services cheaper. These forces may be set to strengthen. Online shopping will make up just 7% of European retail sales in 2014, versus 14% in the U.K. and 12% in the U.S., according to U.K. research firm Centre for Retail Research. This suggests there is room for retail price cuts as the share of online shopping rises.
Japan: Japan is at the forefront of the “robolution” due to high labor costs and an aging population. Wage growth is key to rekindling inflation in Japan, as detailed in Rising Sun, Setting Sun of March 2014.
These headwinds for growth and inflation are long-term trends. The immediate future may be very different. The danger, we think, is being overly pessimistic about growth and inflation in the short term—and too optimistic about the long term. Conclusion: Interest rates are unlikely to rise materially in the next tightening cycle (compared with previous rate- hiking cycles). See the next chapter.
[ 1 2 ] I n t e R P R e t I n G I n n o v at I o n
“ It can take 30 or 40 years for new technologies to have a real impact. Are we too early in judging the Second Machine Age?”
— Jeff ShenHead of BlackRock Emerging Markets
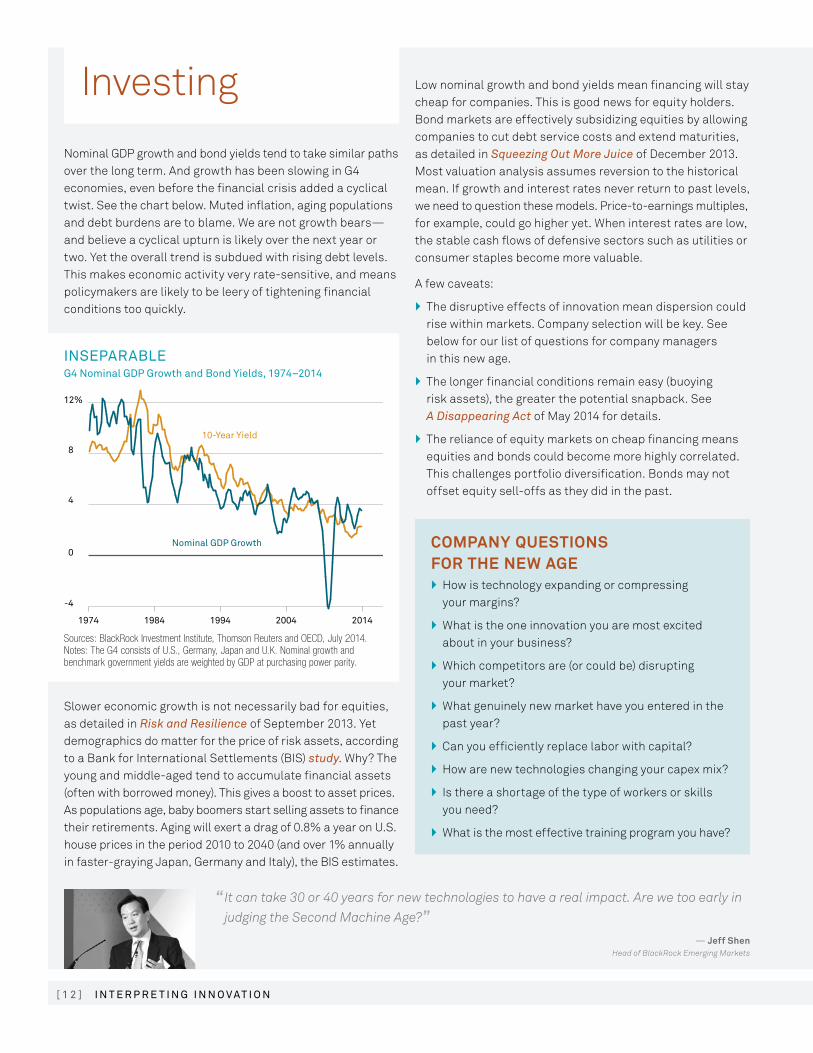
Nominal GDP growth and bond yields tend to take similar paths over the long term. And growth has been slowing in G4 economies, even before the financial crisis added a cyclical twist. See the chart below. Muted inflation, aging populations and debt burdens are to blame. We are not growth bears—and believe a cyclical upturn is likely over the next year or two. Yet the overall trend is subdued with rising debt levels. This makes economic activity very rate-sensitive, and means policymakers are likely to be leery of tightening financial conditions too quickly.
Sources: BlackRock Investment Institute, Thomson Reuters and OECD, July 2014. Notes: The G4 consists of U.S., Germany, Japan and U.K. Nominal growth and benchmark government yields are weighted by GDP at purchasing power parity.
InsePaRaBle G4 nominal GDP Growth and Bond Yields, 1974–2014
12%
8
4
0
-4
Nominal GDP Growth
10-Year Yield
1974 1984 1994 2004 2014
Slower economic growth is not necessarily bad for equities, as detailed in Risk and Resilience of September 2013. Yet demographics do matter for the price of risk assets, according to a bank for International Settlements (bIS) study. Why? The young and middle-aged tend to accumulate financial assets (often with borrowed money). This gives a boost to asset prices. As populations age, baby boomers start selling assets to finance their retirements. Aging will exert a drag of 0.8% a year on U.S. house prices in the period 2010 to 2040 (and over 1% annually in faster-graying Japan, Germany and Italy), the bIS estimates.
Low nominal growth and bond yields mean financing will stay cheap for companies. This is good news for equity holders. bond markets are effectively subsidizing equities by allowing companies to cut debt service costs and extend maturities, as detailed in Squeezing Out More Juice of December 2013.Most valuation analysis assumes reversion to the historical mean. If growth and interest rates never return to past levels, we need to question these models. Price-to-earnings multiples, for example, could go higher yet. When interest rates are low, the stable cash flows of defensive sectors such as utilities or consumer staples become more valuable.
A few caveats:
} The disruptive effects of innovation mean dispersion could rise within markets. Company selection will be key. See below for our list of questions for company managers in this new age.
} The longer financial conditions remain easy (buoying risk assets), the greater the potential snapback. See A Disappearing Act of May 2014 for details.
} The reliance of equity markets on cheap financing means equities and bonds could become more highly correlated. This challenges portfolio diversification. bonds may not offset equity sell-offs as they did in the past.
COMPANY qUESTIONS FOR THE NEW AGE} How is technology expanding or compressing
your margins?
} What is the one innovation you are most excited about in your business?
} Which competitors are (or could be) disrupting your market?
} What genuinely new market have you entered in the past year?
} Can you efficiently replace labor with capital?
} How are new technologies changing your capex mix?
} Is there a shortage of the type of workers or skills you need?
} What is the most effective training program you have?
Investing
[ 1 3 ]
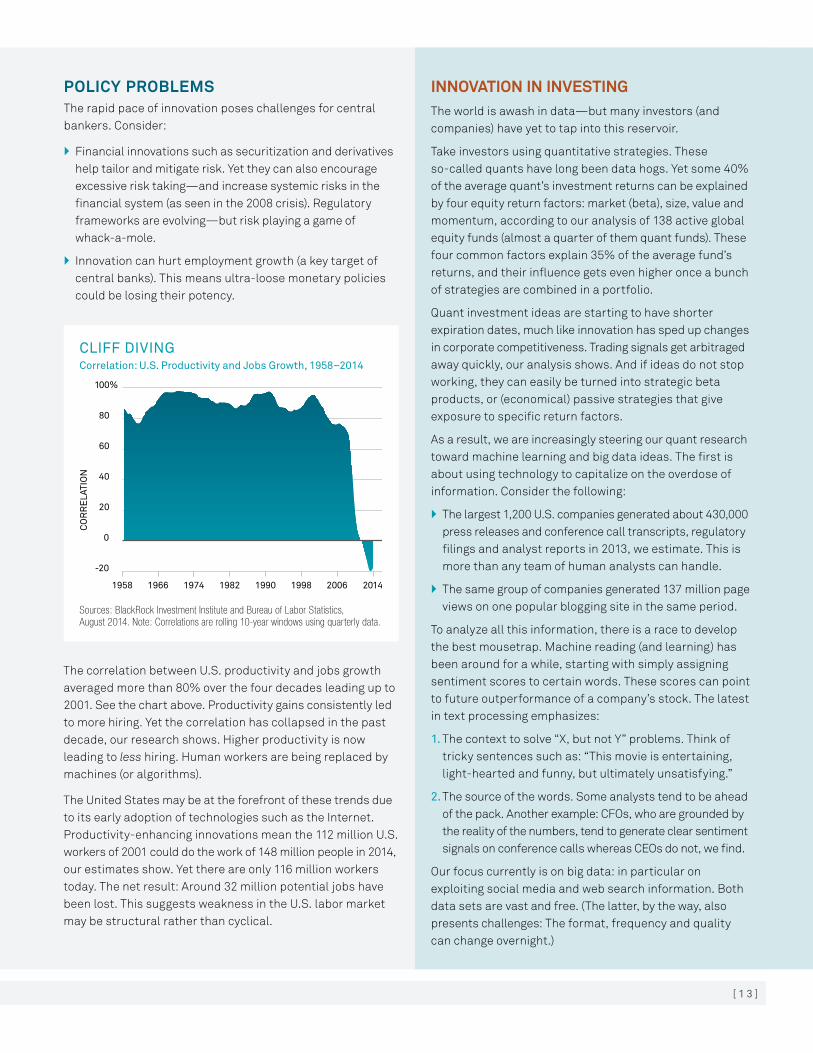
Sources: BlackRock Investment Institute and Bureau of Labor Statistics, August 2014. Note: Correlations are rolling 10-year windows using quarterly data.
clIff DIvInG correlation: u.s. Productivity and Jobs Growth, 1958–2014
100%
CO
RR
ELA
TIO
N
0
-20
80
60
40
20
1958 1966 1974 1982 1990 1998 2006 2014
POLICY PROBLEMS The rapid pace of innovation poses challenges for central bankers. Consider:
} Financial innovations such as securitization and derivatives help tailor and mitigate risk. Yet they can also encourage excessive risk taking—and increase systemic risks in the financial system (as seen in the 2008 crisis). Regulatory frameworks are evolving—but risk playing a game of whack-a-mole.
} Innovation can hurt employment growth (a key target of central banks). This means ultra-loose monetary policies could be losing their potency.
The correlation between U.S. productivity and jobs growth averaged more than 80% over the four decades leading up to 2001. See the chart above. Productivity gains consistently led to more hiring. Yet the correlation has collapsed in the past decade, our research shows. Higher productivity is now leading to less hiring. Human workers are being replaced by machines (or algorithms).
The United States may be at the forefront of these trends due to its early adoption of technologies such as the Internet. Productivity-enhancing innovations mean the 112 million U.S. workers of 2001 could do the work of 148 million people in 2014, our estimates show. Yet there are only 116 million workers today. The net result: Around 32 million potential jobs have been lost. This suggests weakness in the U.S. labor market may be structural rather than cyclical.
INNOVATION IN INVESTING The world is awash in data—but many investors (and companies) have yet to tap into this reservoir.
Take investors using quantitative strategies. These so-called quants have long been data hogs. Yet some 40% of the average quant’s investment returns can be explained by four equity return factors: market (beta), size, value and momentum, according to our analysis of 138 active global equity funds (almost a quarter of them quant funds). These four common factors explain 35% of the average fund’s returns, and their influence gets even higher once a bunch of strategies are combined in a portfolio.
Quant investment ideas are starting to have shorter expiration dates, much like innovation has sped up changes in corporate competitiveness. Trading signals get arbitraged away quickly, our analysis shows. And if ideas do not stop working, they can easily be turned into strategic beta products, or (economical) passive strategies that give exposure to specific return factors.
As a result, we are increasingly steering our quant research toward machine learning and big data ideas. The first is about using technology to capitalize on the overdose of information. Consider the following:
} The largest 1,200 U.S. companies generated about 430,000 press releases and conference call transcripts, regulatory filings and analyst reports in 2013, we estimate. This is more than any team of human analysts can handle.
} The same group of companies generated 137 million page views on one popular blogging site in the same period.
To analyze all this information, there is a race to develop the best mousetrap. Machine reading (and learning) has been around for a while, starting with simply assigning sentiment scores to certain words. These scores can point to future outperformance of a company’s stock. The latest in text processing emphasizes:
1. The context to solve “X, but not Y” problems. Think of tricky sentences such as: “This movie is entertaining, light-hearted and funny, but ultimately unsatisfying.”
2. The source of the words. Some analysts tend to be ahead of the pack. Another example: CFOs, who are grounded by the reality of the numbers, tend to generate clear sentiment signals on conference calls whereas CEOs do not, we find.
Our focus currently is on big data: in particular on exploiting social media and web search information. both data sets are vast and free. (The latter, by the way, also presents challenges: The format, frequency and quality can change overnight.)
[ 1 4 ] I n t e R P R e t I n G I n n o v at I o n
“ Ideas stop working; the evidence is that they get arbitraged away more quickly these days.”
— Ron KahnGlobal Head of BlackRock
Scientific Active Equity Research
Another example: Web search data are a source for uncovering economic trends—and enhancing returns. Consumers use the web to research big-ticket purchases such as houses, durable goods and plane tickets.
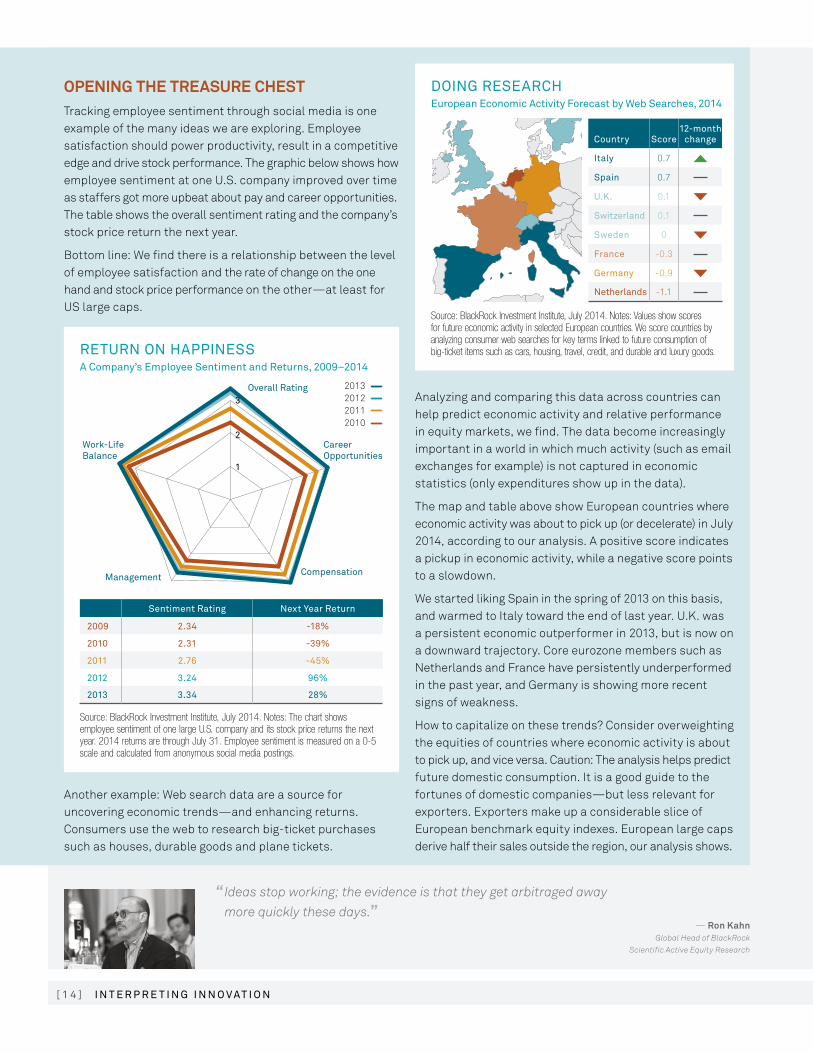
Source: BlackRock Investment Institute, July 2014. Notes: Values show scores for future economic activity in selected European countries. We score countries by analyzing consumer web searches for key terms linked to future consumption of big-ticket items such as cars, housing, travel, credit, and durable and luxury goods.
DoInG ReseaRcHeuropean economic activity forecast by web searches, 2014
country score12-month
change
Italy 0.7
spain 0.7
u.k. 0.1
switzerland 0.1
sweden 0
france -0.3
Germany -0.9
netherlands -1.1
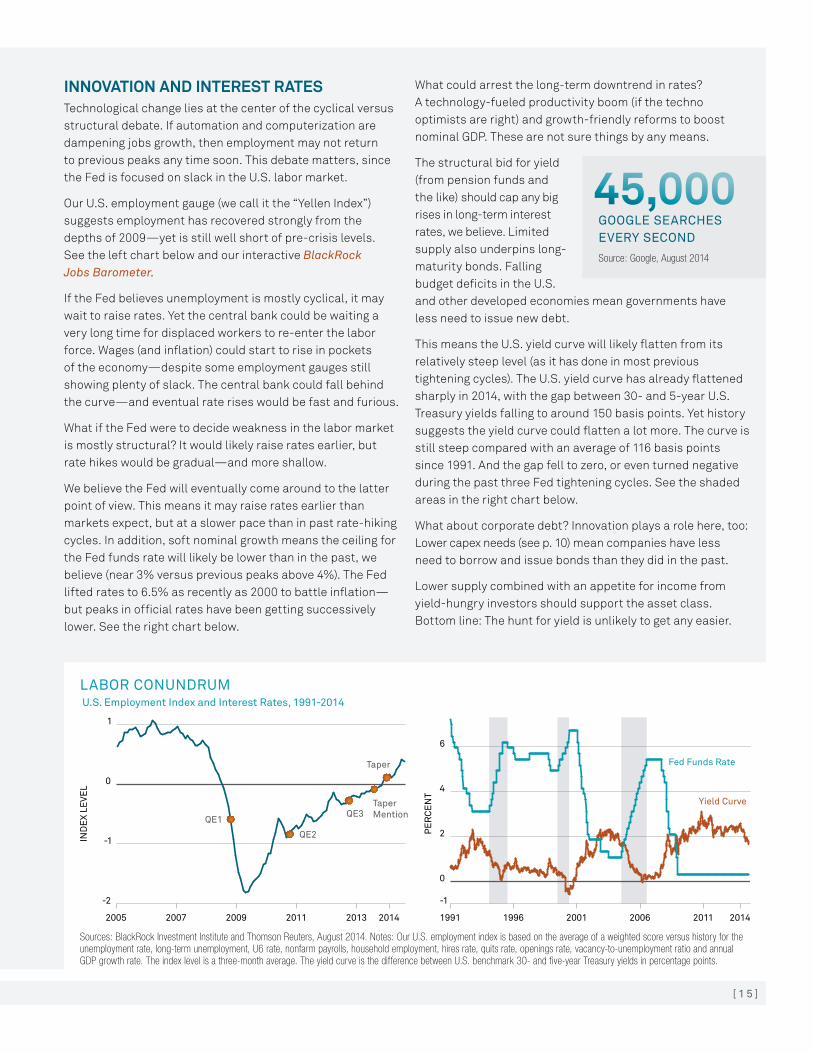
Source: BlackRock Investment Institute, July 2014. Notes: The chart shows employee sentiment of one large U.S. company and its stock price returns the next year. 2014 returns are through July 31. Employee sentiment is measured on a 0-5 scale and calculated from anonymous social media postings.
RetuRn on HaPPInessa company’s employee sentiment and Returns, 2009–2014
Compensation
Overall Rating
Management
Work-LifeBalance
CareerOpportunities
2013201220112010
3
2
1
sentiment Rating next Year Return
2009 2.34 -18%
2010 2.31 -39%
2011 2.76 -45%
2012 3.24 96%
2013 3.34 28%
OPENING THE TREASURE CHEST Tracking employee sentiment through social media is one example of the many ideas we are exploring. Employee satisfaction should power productivity, result in a competitive edge and drive stock performance. The graphic below shows how employee sentiment at one U.S. company improved over time as staffers got more upbeat about pay and career opportunities. The table shows the overall sentiment rating and the company’s stock price return the next year.
bottom line: We find there is a relationship between the level of employee satisfaction and the rate of change on the one hand and stock price performance on the other—at least for US large caps.
Analyzing and comparing this data across countries can help predict economic activity and relative performance in equity markets, we find. The data become increasingly important in a world in which much activity (such as email exchanges for example) is not captured in economic statistics (only expenditures show up in the data).
The map and table above show European countries where economic activity was about to pick up (or decelerate) in July 2014, according to our analysis. A positive score indicates a pickup in economic activity, while a negative score points to a slowdown.
We started liking Spain in the spring of 2013 on this basis, and warmed to Italy toward the end of last year. U.K. was a persistent economic outperformer in 2013, but is now on a downward trajectory. Core eurozone members such as Netherlands and France have persistently underperformed in the past year, and Germany is showing more recent signs of weakness.
How to capitalize on these trends? Consider overweighting the equities of countries where economic activity is about to pick up, and vice versa. Caution: The analysis helps predict future domestic consumption. It is a good guide to the fortunes of domestic companies—but less relevant for exporters. Exporters make up a considerable slice of European benchmark equity indexes. European large caps derive half their sales outside the region, our analysis shows.
[ 1 5 ]
INNOVATION AND INTEREST RATES Technological change lies at the center of the cyclical versus structural debate. If automation and computerization are dampening jobs growth, then employment may not return to previous peaks any time soon. This debate matters, since the Fed is focused on slack in the U.S. labor market.
Our U.S. employment gauge (we call it the “Yellen Index”) suggests employment has recovered strongly from the depths of 2009—yet is still well short of pre-crisis levels. See the left chart below and our interactive BlackRock Jobs Barometer.
If the Fed believes unemployment is mostly cyclical, it may wait to raise rates. Yet the central bank could be waiting a very long time for displaced workers to re-enter the labor force. Wages (and inflation) could start to rise in pockets of the economy—despite some employment gauges still showing plenty of slack. The central bank could fall behind the curve—and eventual rate rises would be fast and furious.
What if the Fed were to decide weakness in the labor market is mostly structural? It would likely raise rates earlier, but rate hikes would be gradual—and more shallow.
We believe the Fed will eventually come around to the latter point of view. This means it may raise rates earlier than markets expect, but at a slower pace than in past rate-hiking cycles. In addition, soft nominal growth means the ceiling for the Fed funds rate will likely be lower than in the past, we believe (near 3% versus previous peaks above 4%). The Fed lifted rates to 6.5% as recently as 2000 to battle inflation—but peaks in official rates have been getting successively lower. See the right chart below.
Sources: BlackRock Investment Institute and Thomson Reuters, August 2014. Notes: Our U.S. employment index is based on the average of a weighted score versus history for the unemployment rate, long-term unemployment, U6 rate, nonfarm payrolls, household employment, hires rate, quits rate, openings rate, vacancy-to-unemployment ratio and annual GDP growth rate. The index level is a three-month average. The yield curve is the difference between U.S. benchmark 30- and five-year Treasury yields in percentage points.
laBoR conunDRum u.s. employment Index and Interest Rates, 1991-2014
1
0
-1
-2
IND
EX
LEVE
L
Fed Funds Rate
QE1
QE2
QE3TaperMention
Taper
Yield Curve
6
4
2
0
-1
PE
RC
EN
T
2005 2007 2009 2011 2013 2014 1991 1996 2001 2006 2011 2014
What could arrest the long-term downtrend in rates? A technology-fueled productivity boom (if the techno optimists are right) and growth-friendly reforms to boost nominal GDP. These are not sure things by any means.
The structural bid for yield (from pension funds and the like) should cap any big rises in long-term interest rates, we believe. Limited supply also underpins long-maturity bonds. Falling budget deficits in the U.S. and other developed economies mean governments have less need to issue new debt.
This means the U.S. yield curve will likely flatten from its relatively steep level (as it has done in most previous tightening cycles). The U.S. yield curve has already flattened sharply in 2014, with the gap between 30- and 5-year U.S. Treasury yields falling to around 150 basis points. Yet history suggests the yield curve could flatten a lot more. The curve is still steep compared with an average of 116 basis points since 1991. And the gap fell to zero, or even turned negative during the past three Fed tightening cycles. See the shaded areas in the right chart below.
What about corporate debt? Innovation plays a role here, too: Lower capex needs (see p. 10) mean companies have less need to borrow and issue bonds than they did in the past.
Lower supply combined with an appetite for income from yield-hungry investors should support the asset class. bottom line: The hunt for yield is unlikely to get any easier.
Source: Google, August 2014
GooGle seaRcHes eveRY seconD
45,000

Not FDIC Insured • May Lose Value • No Bank Guarantee
This paper is part of a series prepared by the BlackRock Investment Institute and is not intended to be relied upon as a forecast, research or investment advice, and is not a recommendation, offer or solicitation to buy or sell any securities or to adopt any investment strategy. The opinions expressed are as of September 2014 and may change as subsequent conditions vary. The information and opinions contained in this paper are derived from proprietary and nonproprietary sources deemed by BlackRock to be reliable, are not necessarily all-inclusive and are not guaranteed as to accuracy. As such, no warranty of accuracy or reliability is given and no responsibility arising in any other way for errors and omissions (including responsibility to any person by reason of negligence) is accepted by BlackRock, its officers, employees or agents. This paper may contain “forward-looking” information that is not purely historical in nature. Such information may include, among other things, projections and forecasts. There is no guarantee that any forecasts made will come to pass. Reliance upon information in this paper is at the sole discretion of the reader.
In the EU issued by BlackRock Investment Management (UK) Limited (authorised and regulated by the Financial Conduct Authority). Registered office: 12 Throgmorton Avenue, London, EC2N 2DL. Registered in England No. 2020394. Tel: 020 7743 3000. For your protection, telephone calls are usually recorded. BlackRock is a trading name of BlackRock Investment Management (UK) Limited. Issued in Australia by BlackRock Investment Management (Australia) Limited ABN 13 006165975 AFSL 230523. This document contains general information only and does not take into account an individual’s financial circumstances. An assessment should be made as to whether the information is appropriate in individual circumstances and consideration should be given to talking to a financial or other professional adviser before making an investment decision. In New Zealand, this information is provided for registered financial service providers only. To the extent the provision of this information represents the provision of a financial adviser service, it is provided for wholesale and professional investors only. In Singapore, this is issued by BlackRock (Singapore) Limited (Co. registration no. 200010143N). In Hong Kong, this document is issued by BlackRock Asset Management North Asia Limited 貝萊德資產管理北亞有限公司 and has not been reviewed by the Securities and Futures Commission of Hong Kong. Not approved for distribution in Taiwan or Japan. In Canada, this material is intended for permitted clients only. In Latin America this piece is intended for use with Institutional and Professional Investors only. This material is solely for educational purposes and does not constitute investment advice, or an offer or a solicitation to sell or a solicitation of an offer to buy any shares of any funds (nor shall any such shares be offered or sold to any person) in any jurisdiction within Latin America in which such an offer, solicitation, purchase or sale would be unlawful under the securities laws of that jurisdiction. If any funds are mentioned or inferred to in this material, it is possible that some or all of the funds have not been registered with the securities regulator of Brazil, Chile, Colombia, Mexico, Peru or any other securities regulator in any Latin American country, and thus, might not be publicly offered within any such country. The securities regulators of such countries have not confirmed the accuracy of any information contained herein.
The information provided here is neither tax nor legal advice. Investors should speak to their tax professional for specific information regarding their tax situation. Investment involves risk. The two main risks related to fixed income investing are interest rate risk and credit risk. Typically, when interest rates rise, there is a corresponding decline in the market value of bonds. Credit risk refers to the possibility that the issuer of the bond will not be able to make principal and interest payments. International investing involves risks, including risks related to foreign currency, limited liquidity, less government regulation, and the possibility of substantial volatility due to adverse political, economic or other developments. These risks are often heightened for investments in emerging/developing markets or smaller capital markets.
FOR MORE INFORMATION: www.blackrock.com
© 2014 BlackRock, Inc. All Rights reserved. BLACKROCK, BLACKROCK SOLUTIONS, iSHARES, SO WHAT DO I DO WITH MY MONEY, INVESTING FOR A NEW WORLD, and BUILT FOR THESE TIMES are registered and unregistered trademarks of BlackRock, Inc. or its subsidiaries in the United States and elsewhere. All other trademarks are those of their respective owners.
Lit. No. BII-INNOVA-0914 1797A-BII-0914 / BII-0013
EXECUTIVE DIRECTORLee Kempler
CHIEF STRATEGIST Ewen Cameron Watt
EXECUTIVE EDITORJack Reerink
BLACKROCK INVESTMENT INSTITUTEThe BlackRock Investment Institute leverages the firm’s expertise across asset classes, client groups and regions. The Institute’s goal is to produce information that makes blackRock’s portfolio managers better investors and helps deliver positive investment results for clients.
Why blackRockblackRock was built to provide the global market insight, breadth of capabilities, unbiased investment advice and deep risk management expertise these times require. With access to every asset class, geography and investment style, and extensive market intelligence, we help investors of all sizes build dynamic, diverse portfolios to achieve better, more consistent
returns over time.
BlackRock. Investing for a New World.®