interpretation of electron rutherford …digital.csic.es/bitstream/10261/99800/1/2014 - sia...1...
TRANSCRIPT
1
Interpretation of Electron Rutherford Backscattering Spectrometry for
Hydrogen Quantification
Rafael Alvarez, Francisco Yubero*
Instituto de Ciencia de Materiales de Sevilla (CSIC – Univ. Sevilla) Av. Américo
Vespucio 49, E-41092 Sevilla, Spain (http://sincaf-icmse.es)
* Corresponding author: [email protected]
Abstract
In the last few years several papers have appeared showing the capabilities of
Electron Rutherford Backscattering Spectrometry (eRBS) to quantify the H
content at surfaces. The basis of the H detection in this technique relies on the
difference in recoil energy of the incident electrons depending on the mass of the
atoms located at the surface that act as scatter centers. In this paper we address
the interpretation of eRBS spectra of Hydrogen containing surfaces. The aim is
to compare the naïve single elastic scattering approximation with a more realistic
description of eRBS spectra including multiple elastic scattering using the HQ-
eRBS (Hydrogen Quantification eRBS) software based on a Monte Carlo
algorithm. It is concluded that multiple elastic scattering is a significant
contribution to experimentally measured eRBS spectra of a polyethylene surface.
It induces significant broadening of the distribution of the maximum elastic
scattering angle along the electron trajectories contributing to the measured
spectra. However, it has weak effect in the energy distribution of the collected
electrons (about 10% overestimation of the H content in the particular case of a
polyethylene surface with respect to the corresponding ratio of elastic scattering
cross sections).
2
Introduction
The quantitative determination of the Hydrogen (H) content at surfaces is
a subject of key importance in many technological fields. Thus, surface
functionalization, polymers, carbon based hard coatings or new H storage
materials, may require such analysis to improve the understanding of the
processes that involve the presence of H atoms at surfaces.
However, quantification of this element at the surface region (few nanometres
depth) of a sample is not an easy task. Note for example that direct evidence of
H atoms does not show up in standard non destructive surface analysis
techniques such as X-ray photoemission or Auger spectroscopies. Indirect way
to quantify H content at the surface region can be made by means of High
resolution electron energy loss spectroscopy (HREELS). However, in this case,
only those H atoms that contribute to the vibrational absorption spectra are
observed. Secondary ion mass spectroscopy (SIMS) is another indirect way to
determine H content through the analysis of the radicals present at surfaces, but
this technique has as the drawbacks that it is destructive and that its interpretation
is handicapped by strong matrix effects. It is also possible H quantification with
surface sensitivity by means of 1H(15N,α)12C nuclear reaction analysis, but this
technique is not easily available.
Electron Rutherford backscattering spectrometry (eRBS) using primary electron
beams of 1-2 keV has been postulated as an alternative technique to quantify the
H content at the surface of a-C:H and polymer samples [1-3]. This is due to the
fact that the energy distribution of elastically backscattered electrons at surfaces
can be correlated with their H content. The recoil energy of the impinging
electrons depends on the atomic mass of the particular atom present at the
surface, and the difference in recoil energies between the H atoms and the rest
of the elements present at the surface of the analysed sample is easily observed
with any standard electron spectrometer used in surface analysis.
Despite of the capabilities of this technique to quantify H content at surfaces, its
use is not extensive. Only few groups have reported scientific papers using it [1-
8]. Following the same principles but using higher electron kinetic energies (up to

3
40 keV), this technique has also been proposed to evaluate electron inelastic
mean free paths and to study of binary compounds and buried interfaces [9-12].
This paper aims to give a deep inside look into the interpretation of eRBS spectra,
focussing on the understanding of multiple elastic scattering angle effects on the
electron trajectories contributing to eRBS spectra of H containing surfaces. This
is done by means of HQ_eRBS (Hydrogen Quantification by eRBS) Monte Carlo
software, specially developed for this purpose. The developed software will be
freely available for the scientific community (for non-commercial use) to
encourage the practical use of this technique.
It is worth mentioning that experiments with elastically backscattered electrons
are extensively used to determine electron inelastic mean free paths [13]. In this
context the experimental technique is known as elastic peak electron
spectroscopy (EPES). However, we prefer to keep the eRBS acronym here due
to the similarity of the technique with traditional Rutherford Backscattering
spectrometry experiments with MeV ions.
Brief description of the theoretical background
A first naïve description of the electron-solid interaction can be made considering
binary electrostatic collisions between the impinging electrons and the nuclei of
the atoms in the sample. Within a classical description of the interaction of
charged particles, considering energy and momentum conservation laws, the
energy transferred (recoil energy Ern) of an electron impinging on a surface of a
multi-elemental material (Mn: atomic mass of the sample atoms) can be written
as [14]:
cossinsincoscoscoscos1
2
0
0mE
ME
M
mE nn
n
rn (1)
where is the angle of scattering, m and E0 are the mass and kinetic energy of
the electron before scattering, n is the kinetic energy of the atom, and and
characterizes the direction of motion of the atom with respect to the velocity of

4
the electron before the scattering event and the scattering plane. If the scatter
atom is at rest (i.e., ε=0), the well-known energy transfer relation of an atom at
rest is recovered
𝐸𝑟 =2.18×10⁻³
𝑀𝑠𝑖𝑛2(/2)𝐸0 (2)
(E0 given in eV). Within this approach, differences in electron recoil energies ΔEr
between two different atoms at the surface of a given sample will be given by:
∆𝐸𝑟 = 2.18 × 10⁻³𝑠𝑖𝑛2 (
2) 𝐸0 [
1
𝑀1−
1
𝑀2] (3)
According to eqn.(3), we will observe recoil energy differences in the order of 2-
4 eV for multi-elemental surfaces composed by H (M1=1) and other elements (for
example C with M2=8), for scattering angles of more than 120º and kinetic
energies in the 1-2 keV energy range. Thus, the observation of several elastic
peaks in a eRBS experiment is an evidence of the presence of different type of
atoms at the sample surface.
On the other hand, to perform elemental quantification at the surface region the
corresponding electron scattering cross section will need to be considered. In this
case we have used elastic scattering cross section obtained from NIST Electron
Elastic-Scattering Cross-Section Database [15]. If only independent single
scattering events are considered, the stoichiometry of binary homogeneous
samples will be directly correlated to the intensity ratio of the corresponding
electron backscattering signals. The ratio of cross sections σC/σH for electrons of
1500 eV impinging on C and H takes values about 42 for scattering angles of
135º.
Multiple elastic scattering approximation: Monte Carlo simulations using
HQ_eRBS code
Monte Carlo (MC) simulation of electron transport in solids is based on the
stochastic description of scattering processes. Binary collisions are considered
according to the description outlined above. Electron penetration is approximated

5
by a classical zigzag trajectory. Besides, angular differential elastic scattering
cross sections are used to account for the probability of scattering as a function
of the energy of the electron and scattering angle. They are described by the
partial expansion method using Hartee-Fock-Slater type wavefunctions [15].
We suppose that the studied sample is semi-infinite, homogenous and
amorphous. The scattering point is where the electron changes its direction
and/or energy. The primary energy beam is considered monochromatic. In our
calculations both the elastic and inelastic scattering events are taken into
account. If an electron suffers an inelastic collision, the calculation of its trajectory
is stopped, since it will not contribute to the elastic peak spectrum. Particular
values of scattering angles of electrons in an individual event are realized by
random numbers following the angular differential elastic cross sections of the
target material.
After each elastic scattering event, the recoil energy is calculated according to
eqn.(1), which takes into account the mass of the scattering atom. Thus energy
and angular distributions of elastically backscattered electrons from a semi-
infinite sample were determined. This was done using the HQ_eRBS Monte
Carlo code developed to simulate eRBS spectra of H containing surfaces.
In this work we present results on polyethylene (CH2). This material is chosen
because the H content is higher than in most other polymers. We select the
primary electron energy as E0= 1.5 keV with an incident angle of in = 45 with
respect to the sample’s surface normal and detection normal to the surface.
Analyzer acceptance angle was assumed to be ac = 9. The energy spread of
the primary electron beam is simulated by Gaussian distribution with a full width
at half maximum of 0.5 eV. The other input data of our Monte Carlo simulations
were as follow: The atomic density is ρ(CH2)=0.93 g/cm3. The corresponding
inelastic mean free paths is λin(CH2) = 53 Å [16]. We used =120 meV and =
80 meV for the average kinetic energy of the H and C atoms, respectively [4]. The
number of incident primary electrons was in the range of 1010.
Results and discussion

6
In the following we address several points concerning the interpretation of eRBS
spectra. The aim is to compare the naïve single scattering approximation outlined
above with a more realistic description of simulated eRBS spectra including
multiple elastic scattering.
A first aim of this study is to give a clear image of the trajectories of the
backscattered electrons contributing to measured eRBS spectra.
Multiple scattering contributions to eRBS spectra
Figure 1 shows HQ_eRBS MC simulations of electrons backscattered from a CH2
sample (E0=1500 eV kinetic energy, 45º angle of incidence, normal detection, 9º
acceptance angle). The figure discriminates between the contributions to the total
backscattered spectra of single and multiple scattering collisions. The “C” and “H”
peaks can easily be identified appearing at about 0.3 and 2.7 eV recoil energies,
respectively. About 40% of the intensity of the total spectra is formed by electrons
whose trajectory has experienced just a single elastic scattering event, either at
C or H atoms. Electron trajectories composed by several elastic scattering
collisions on H atoms only account for less than 5% of the “H” peak. However
multiple C collisions contribute to about 50% of the intensity of the “C” peak. On
the other hand, the contribution of mixed multiple collisions accounts for less than
7% at the “C” peak and about half of the “H” peak. Note also that there is
significant intensity between the C and H peaks in the mixed C/H contribution
An important point for quantification purposes is the ratio between peaks ascribed
to presence of H and C at the sample surface. In the particular case described in
figure 1, least squares fitting of the H and C peaks of the total spectrum by
Gaussian functions gives a C/H intensity ratio of 19, while the predicted ratio from
the elastic scattering cross section is 21. This 10% deviation is due to the
contribution of mixed multiple scattering to the intensity between the peaks, which
provokes overestimation of the H signal. This result will have to be taken into
account for accurate H quantification from eRBS measurements.
Figure 2 shows a 2D plot of HQ_eRBS MC simulation where the number of elastic
collisions vs the recoil energy is shown (CH2, 1.5 keV, normal detection, 45º

7
incident angle, 9º acceptance angle). The color scale (log scale) indicates the
number of electrons detected for each recoil energy-number of elastic collisions
pair. It is worth noting that the C peak includes electrons which underwent more
multiple collisions (up to 10-12) than the H peak (up to 4-5).
Figures 1 and 2 show that the electron trajectories contributing to experimental
eRBS spectra are strongly affected by multiple elastic scattering. However, these
multiple elastic scattering effects introduce only a 10% deviation on the C/H
intensity ratio, allowing the use of the H and C intensities as a first reasonable
estimation for elemental quantification purposes.
Angular dispersion of the backreflected electron trajectories
Figure 3 shows the distributions of θmax, the highest scattering angle among all
scattering angles during the trajectory of an electron which is finally detected. The
results are sorted according to the type of elastic collisions contributing to the
total eRBS spectrum.
Single-C and single-H distribution of θmax are forced by the analyzer acceptance
angle. In these cases, the electrons reaching the detector follow strict V-type
trajectories and no events are allowed out of the limits 180 - θi - θac < θmax < 180
- θi + θac . This is not the case for electron trajectories characterized by several
elastic scattering events. In fact long tails are observed in the θmax distributions
out of the 135º ± θac limits. However, still most of the intensity is within 135º ± 20º
limits, so most trajectories contributing to the eRBS spectra can still be
considered V-type. Similar conclusion was deduced for those electrons
contributing to the single inelastic scattering cross section in reflection electron
energy loss spectra in a previous work [17].
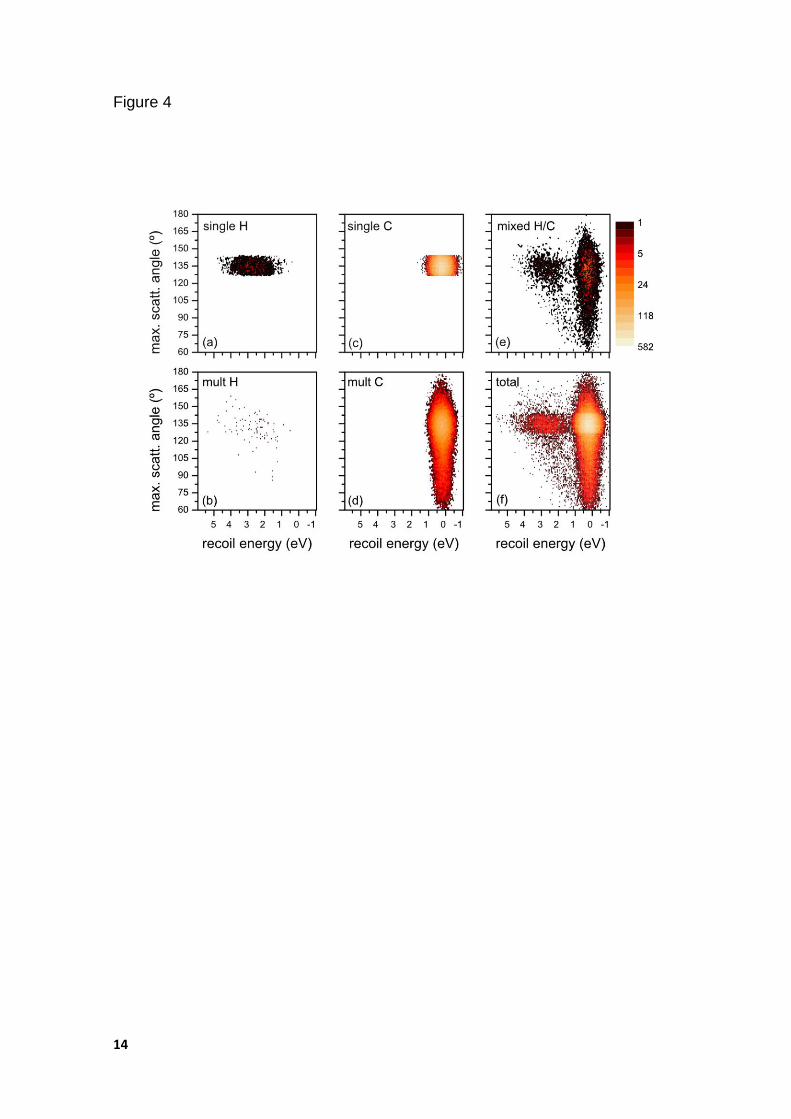
Figure 4 shows HQ_eRBS MC simulations of θmax vs recoil energy detected for
each type of electron trajectory. The color scale (log scale) indicates the number
of electrons detected for each recoil energy/maximum scattering angle pair. The
figure shows single collisions at H (a) or C (c) atoms, multiple collisions at either
H (b) or C atoms (d), as well as the mixed H/C multiple collisions contribution (e)
to the total spectrum (f). This series of 2D drawings gives us a clear picture of
the electron trajectories contributing to eRBS spectra from CH2. Note that multiple

8
scattering just at C atoms is a significant contribution to the spectrum and the
corresponding electron trajectories may differ significantly from each other (note
the large dispersion in the θmax values). The most probable θmax is forced by the
experiment geometry (incidence, detection, and acceptance angles), but the
dispersion of θmax increases significantly when multiple scattering is considered.
Note also that electron trajectories of backscattered electrons on either H or C
atoms may differ significantly. Thus, broader angular dispersion is expected for
those electrons contributing to the “C” peak than to the “H” peak. It is also worth
noting that most mixed H/C elastic scattering contribution adds intensity to the
“C” peak (see also Figure 1). Besides, note that there is some intensity in-
between of the H and C peak contribution that cannot be clearly assigned to H or
C (with maximum scattering angle significantly away from 135º). This intensity is
responsible for the 10% deviation observed above between the quantification of
simulated eRBS spectra by fitting with symmetric Gaussian peaks and the
predicted intensity ratio according to the elastic scattering cross sections. Most
probably better description of the H and C peaks would be as slightly asymmetric
with broader tails in the energy region between the two main recoil energies
corresponding to the H and C contributions, with more intensity in the C peak,
due to the higher probability for elastic scattering.
Conclusions
Multiple elastic scattering is a significant contribution to experimentally measured
eRBS spectra of a polyethylene surface. It mainly induces broadening of the
distribution of the maximum scattering angle of elastic scattering of the electron
trajectories contributing to the measured spectra with low effect (about 10%
overestimation of the H content in the particular case of a polyethylene surface
with respect to the corresponding ratio of elastic scattering cross sections) in the
energy distribution of the collected electrons. Thus, elemental H quantification
based on eRBS measurements can be done by just making normalized intensity
ratio between H and C contributions to the spectra. Finally, we would like to
mention that the HQ_eRBS MC code used in this work, especially developed to
improve the understanding of eRBS spectra of H containing surfaces, will be
available free of charge to the scientific community for non-commercial use.

9
References
[1] G.T. Orosz, G. Gergely, M. Menyhard, J.Toth, D. Varga, B. Lesiak, A.
Jablonski, Surf. Sci. 2004; 566-568, 544.
[2] F. Yubero, V.J. Rico, J.P. Espinós, J. Cotrino, A.R. González-Elipe, Appl.
Phys. Lett. 2005; 87, 084101.
[3] V.J. Rico, F. Yubero, J.P. Espinós, J. Cotrino, A.R. González-Elipe, D. Garg,
S. Henry, Diamond and Relat. Mater. 2007; 16, 107.
[4] D. Varga, K. Tokesi, Z. Berenyi, J. Toth, L. Kover, Surf. Interface Anal. 2006;
38, 544.
[5] B. Lesiak, J. Zemek, J. Houdkova, Polymer 2008; 49, 4127.
[6] M. Filippi, L. Calliari, C. Verona, G. Verona-Rinati, Surf. Sci. 2009; 603,
2082.
[7] J. Zemek, J. Houdkova, P. Jiricek, H. Kozak, A. Kromka, Diamond Relat
Mater. 2012; 26, 66.
[8] F. Yubero, K. Tokési, Appl. Phys. Lett. 2009; 95, 084101.
[9] M. Vos, M.R. Went, J. Electron Spect. Relat. Phenom. 2007; 155, 35.
[10] M. R. Went, M. Vos Appl. Phys. Lett. 2007; 90, 072104.
[11] M. Vos, M.R. Went Phys. Rev. B 2006; 74, 205407.
[12] K. Tokesi, D. Varga, Surf. Sci. 2010; 604, 623.
[13] S. Tanuma, T. Shiratori, T. Kimura, K. Goto, S. Ichimura, C. J. Powell,
Surf. Interface Anal. 2005; 37, 833.
[14] D. Varga, K. Tokesi, Z. Berenyi, J. Toth, L. Kover, G. Gergely, A. Sulyok,
Surf. Interface Anal. 2001; 31, 1019.

10
[15] A. Jablonski, F. Salvat, C. J. Powell, NIST Electron Elastic-Scattering
Cross-Section Database - Version 3.2, National Institute of Standards and
Technology, Gaithersburg, MD (2010).
[16] S. Tanuma, C. J. Powell, D. R. Penn, Surf. Interf. Anal. 1994; 21, 165.
[17] F. Yubero, N. Pauli, A. Dubus, S. Tougaard, Phys. Rev. B 2008; 77,
245405.
Figure captions
Figure 1. HQ_eRBS MC spectra of 1.5 keV electrons impinging on CH2 (normal
detection, 45º incidence angle, 9º acceptance angle). Single H, single C,
multiple C, multiple H and mixed H/C contributions to the total spectrum are
shown.
Figure 2. HQ_eRBS MC simulation of the number of elastic scattering events vs
the recoil energy (CH2, 1.5 keV, normal detection, 45º incident angle, 9º
acceptance angle).
Figure 3. HQ_eRBS MC simulations of the distribution of θmax, the highest
scattering angle among all scattering angles during the trajectory of an electron
which is finally detected. The results are sorted according to the type of elastic
collisions contribution to the total eRBS spectrum. (CH2, 1.5 keV primary
energy, normal detection, 45º incidence angle, 9º acceptance angle).
Figure 4. HQ_eRBS MC simulations of the different contributions to the spectra,
shown as maximum scattering angle vs recoil energy of (CH2, 1.5 keV primary
energy, normal detection, 45º incident angle, 9º acceptance angle). The color
scale (log scale) indicates the number of electrons detected for each recoil
energy-maximum scattering angle pair

11
Figure 1

12
Figure 2

13
Figure 3
14
Figure 4