international residential real estate brokerage fees …€¦ · · 2011-04-25international...
TRANSCRIPT
12 Delcour and Miller
INTERNATIONAL REAL ESTATE REVIEW 2002 Vol. 5 No. 1: pp. 12 - 39
International Residential Real Estate Brokerage Fees and Implications for the US Brokerage Industry Natalya Delcoure Assistant Professor in Finance, Department of Finance and Economics, Mitchell College of Business,University of South Alabama, Mobile, AL 36695, USA or [email protected] Norm G. Miller West Shell Jr. Professor of Real Estate, 404 Lindner Hall, CBA, University of Cincinnati, Cincinnati, OH, USA or [email protected] It is commonly understood that residential real estate brokerage fees in the US tend to run 6% or 7% within local markets for existing property resales. Exceptions to these historically uniform going rates are starting to appear, and utilization of the internet will provide new efficiencies that should lead to lower commission rates in the future. One possible indication of where the long term commission rates may head, should price competition increase, is provided by a review of commission rates around the world. This study is a first attempt to gather such data and begin the process of global comparisons. Most industrialized country brokerage rates are significantly below those of the US, although there are clearly differences in the services provided, red tape, and liabilities, as well as information access. An exploratory model attempts to explain variations in fees around the world and deepen our understanding of possible equilibriums for US firms should price competition increase. Keywords Brokerage, Commissions, International, Internet, Future
International Residential Real Estate Brokerage Fees 13
Introduction Most residential real estate brokerage firms in the United States charge single-family home sellers a commission of 6% or 7% of the selling price, depending on the region1. Agents seem to compete for business on every dimension except price (commission rates) with claims of faster sales, higher selling prices, or better service. This relative uniformity of commission rates within local markets, the ease of entry into the industry, and the relatively few sales per agent in the US, have encouraged debate over the efficiency of the industry compared to other industrialized countries 2 . International comparisons also beg the question: “What would happen if US brokers competed on price?” A preliminary model presented using brokerage fees and data from around the world suggests that, based on global data, the US residential brokerage fees should run closer to 3.0%. If the typical US agent were as productive as those in England, the brokerage fees would be closer to 1.5%. Pricing, Efficiency, and Brokerage Fees Around the World Debate over the efficiency of the residential real estate brokerage (RREB) industry has echoed through the literature since the late 1970s. If the RREB industry is deemed grossly inefficient, the implication is that over time, with new innovations, commission rates (service prices) would come down and/or services would increase or improve. On the side arguing for general efficiency are Lewis and Anderson (1999) and Anderson, Lewis, and Zumpano (1999). On the other side are Miller and Shedd (1979), Crockett (1982), Wachter (1987), Yinger (1981), and others. A key premise behind those arguing for inefficiency is the fairly uniform and rigid commission pricing within local markets for similar property types3. Prices appear to be
1 Homebuilders, as repeat customers with multiple listings, often pay 5%. 2 Sale per full time real estate agent is measured annually. 3 Note that imitative pricing may not require collusion, as would typically be the case with fixed pricing. The market enforcement mechanism will be explained later in this paper. Debate has also ensued over the issue of collusion. Austin (1973), Owen (1977), Barlett (1981), Yinger (1981), Wachter (1987), and Jenkins (1989) all argued for collusive behavior, while Miller and Shedd (1979) argued for interdependency. More recently, Yavas (2001) argued that high fixed costs have made it impossible to have market driven commission rates. Independent of the perspective on collusion, we agree with Yavas (2001) and will provide arguments that agents do not earn excess profits. Criticism of the residential real estate brokerage industry in the past has probably been inhibited by the incestuous resource linkage, whereby many university real estate centers receive funding from license fees within a state. This is true in States like Wisconsin, Texas, and Ohio.
14 Delcour and Miller
abnormally stable for a competitive market. A rare exception to this widely held belief was presented by Carney (1982)4. Rather than use the history of somewhat uniform commission rates as the only evidence of “market” or long-term equilibrium commission rates in the US, we compared brokerage costs in other countries focusing only on residential resales.5 Globally, we see much lower residential commission rates in most of the other highly industrialized nations, including the United Kingdom (UK), Hong Kong, Ireland, Singapore, Australia, and New Zealand (See Figure 1: International Commission Rate Comparisons). Fees in Hong Kong, typically 1% for the seller, are among the lowest in the world even with the extra charges for lawyers typically incurred at closing.6 In the UK, the commission rates average less then 2%. The seller is often required to pay for some advertising costs up front without a contingency for this fixed charge, which lowers the risk of the broker spending money that may not be recovered through a successful sale. In New Zealand and South Africa, commission rates average 3.14%. In Singapore, the commission rates also tend to run around 3%. Many countries have fees that average 5% or less, including Germany, Spain, Israel and Thailand. Indonesia, Jamaica, Sweden, Trinidad and Tobago, and the Philippines also tend to be around 5%. It is hard to argue that non-US countries have more efficient communication technology, real estate public information or record access that would lead to lower commission rates.7 At the other end of the fee spectrum, commission rates in less developed countries with no public records and no reliable MLS (Multiple Listing Services), such as Russia and Belarus, fluctuate between 5% and 15%. Net listings where fees may run even higher than 15% are also common in the Russian cities of St. Petersburg and Moscow.8 The Chinese government recently developed a regulatory environment and license standards for its real estate industry. The Chinese market experiences few real estate transactions, and the extremely high transfer tax of 15% severely constrains
4 See Michael Carney, “Costs and Pricing of Home Brokerage Services” The AREUEA Journal, Fall, No 3., 1982, p.331-354. 5 Naturally, commission rates in other countries alone will not be sufficient evidence of long term equilibrium unless we also control for differences in the services provided. Such a study is beyond the scope of this paper, although attempts have been made to collect such information. 6 We are indebted to Ivan YF Chan, Business Development Director for Pacific Relocations for this information that has been verified with colleagues. Their website is: http://www.chinarelo.com 7 An attempt to proxy for economic efficiency is provided in Figure 4 based on data in the appendix, where it appears that the US is an outlier in terms of commission rates. 8 Net listings where the broker keeps all of the fees above some minimum price are considered unethical by the National Association of REALTORS in the US and discouraged by the US Code of Ethics. The reason for this position is the presumption that some agents will take advantage of naïve sellers and contract for a net list price far below actual value.
International Residential Real Estate Brokerage Fees 15
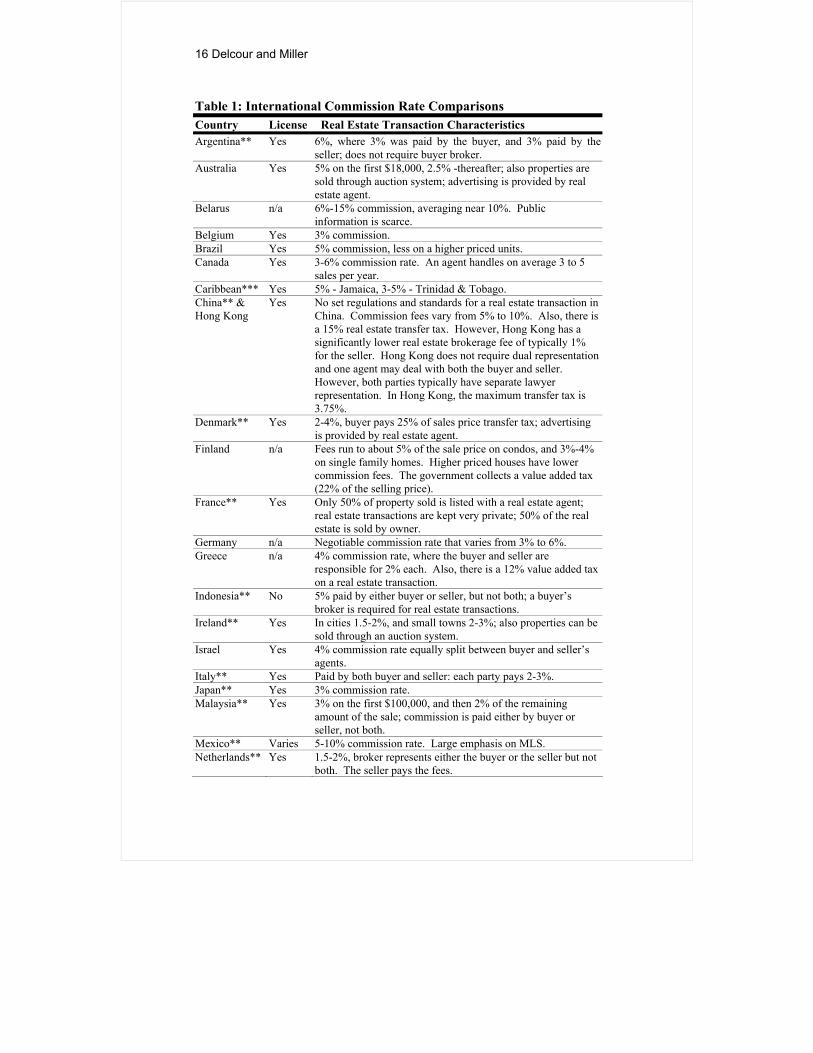
the incentive to transfer property.9 High transfer taxes in countries like China and Greece certainly constrain the transfer of residential properties and encourage sub-optimal resource allocation where some households will be over-consuming housing and others under consuming.10 Benjamin, et. al. (2000) compared American and international real estate brokerage firms, and suggested several noteworthy differences between US residential brokerage commission and other overseas markets. The comparison includes agency rules, representation, potential liability, and the use of auctions. Liability tends to be higher in the US and agency tends to be more clearly separated between buyers and sellers. Data on such differences is not readily available and beyond the scope of this study. According to Dotzour, et. al. (1998), many developed countries use auction markets simultaneously with traditional real estate listings. This use of auctions seems to be gaining interest and market share in the US as well.11 Auction fees tend to be the same or higher than traditional listings, so this alternative is viewed merely as a way to accelerate the time to sale rather than a way to save on fees.12 Table 1 is a collection of international brokerage fees. In all cases, the fee information sought is the total fee paid by the buyer and the seller. Arrangements with respect to agent splits are not always known. Buyers’ fees are noted where utilized. Also noted is any information on advertising fees or value added fees or taxes. The authors have collected this direct data directly from brokers and industry experts within each country.13
9 Note that Hong Kong does not incur these same transfer taxes. 10 Further research on the impact of transfer taxes in different countries delving into the volume of sales per capita could produce mor We are indebted to Ivan YF Chan, Business Development Director for Pacific Relocations for this information that has been verified with colleagues. Their website is: http://www.chinarelo.come insight on the true costs and impact of these transfer taxes. 11 See “Auctions Gain Popularity Among High-End Sellers” Dayton Business Journal, 10/01/01 by Lori Johnston. Since 1980, the number of real estate auctions has quadrupled across the nation. In 1998 alone, auction sales raked in $49 billion, up nearly 20 percent from the two previous years, according to the Gwent Group, a Bloomington, Ind.-based real estate auctions and consulting group. 12 While anecdotal as evidence, the authors surveyed several real estate firms across the US that were involved in auctioning, and while most were reluctant to discuss fees, they indicated that the fees ran from 7% to 10%, depending on the services provided. This is consistent with the fees of up to10% reported at Realtor.com magazine discussing the business of auctions. 13 The attendees at the European Real Estate Society Meetings in Spain in June 2001 and the International Real Estate Society Meetings in Alaska in July 2001 were particularly helpful in confirming the data.
16 Delcour and Miller
Table 1: International Commission Rate Comparisons Country License Real Estate Transaction Characteristics Argentina** Yes 6%, where 3% was paid by the buyer, and 3% paid by the
seller; does not require buyer broker. Australia Yes 5% on the first $18,000, 2.5% -thereafter; also properties are
sold through auction system; advertising is provided by real estate agent.
Belarus n/a 6%-15% commission, averaging near 10%. Public information is scarce.
Belgium Yes 3% commission. Brazil Yes 5% commission, less on a higher priced units. Canada Yes 3-6% commission rate. An agent handles on average 3 to 5
sales per year. Caribbean*** Yes 5% - Jamaica, 3-5% - Trinidad & Tobago. China** & Hong Kong
Yes No set regulations and standards for a real estate transaction in China. Commission fees vary from 5% to 10%. Also, there is a 15% real estate transfer tax. However, Hong Kong has a significantly lower real estate brokerage fee of typically 1% for the seller. Hong Kong does not require dual representation and one agent may deal with both the buyer and seller. However, both parties typically have separate lawyer representation. In Hong Kong, the maximum transfer tax is 3.75%.
Denmark** Yes 2-4%, buyer pays 25% of sales price transfer tax; advertising is provided by real estate agent.
Finland n/a Fees run to about 5% of the sale price on condos, and 3%-4% on single family homes. Higher priced houses have lower commission fees. The government collects a value added tax (22% of the selling price).
France** Yes Only 50% of property sold is listed with a real estate agent; real estate transactions are kept very private; 50% of the real estate is sold by owner.
Germany n/a Negotiable commission rate that varies from 3% to 6%. Greece n/a 4% commission rate, where the buyer and seller are
responsible for 2% each. Also, there is a 12% value added tax on a real estate transaction.
Indonesia** No 5% paid by either buyer or seller, but not both; a buyer’s broker is required for real estate transactions.
Ireland** Yes In cities 1.5-2%, and small towns 2-3%; also properties can be sold through an auction system.
Israel Yes 4% commission rate equally split between buyer and seller’s agents.
Italy** Yes Paid by both buyer and seller: each party pays 2-3%. Japan** Yes 3% commission rate. Malaysia** Yes 3% on the first $100,000, and then 2% of the remaining
amount of the sale; commission is paid either by buyer or seller, not both.
Mexico** Varies 5-10% commission rate. Large emphasis on MLS. Netherlands** Yes 1.5-2%, broker represents either the buyer or the seller but not
both. The seller pays the fees.
International Residential Real Estate Brokerage Fees 17
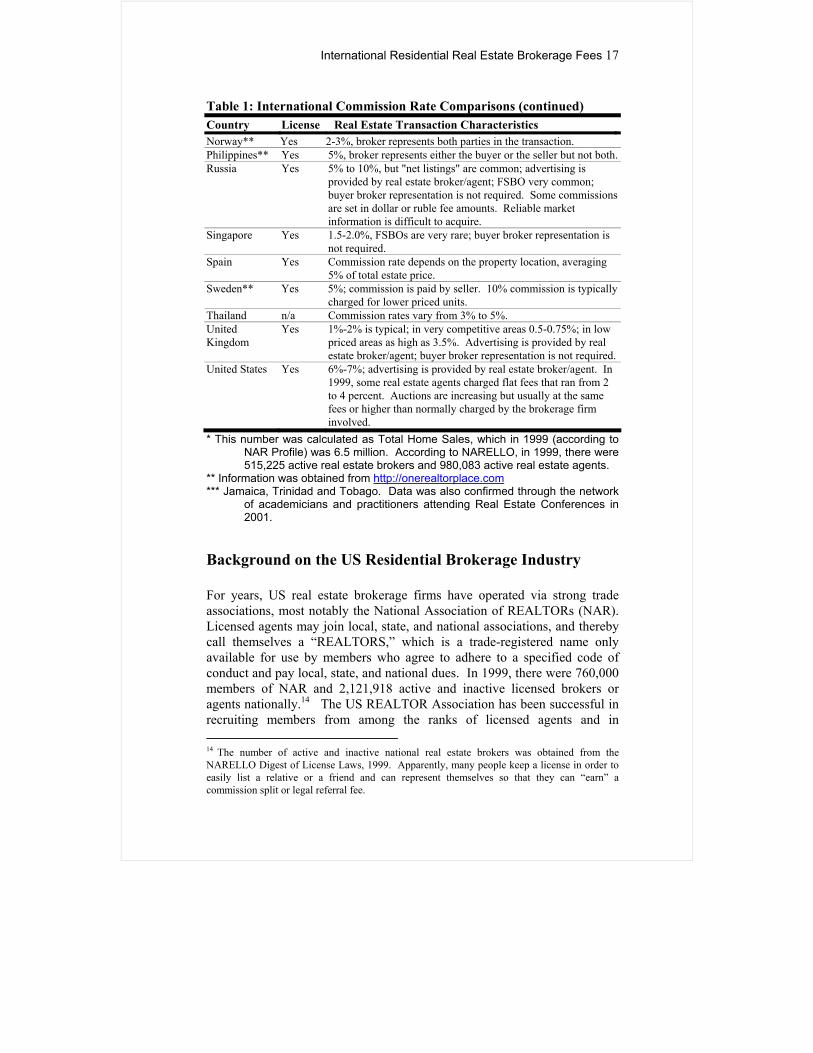
Table 1: International Commission Rate Comparisons (continued) Country License Real Estate Transaction Characteristics Norway** Yes 2-3%, broker represents both parties in the transaction. Philippines** Yes 5%, broker represents either the buyer or the seller but not both. Russia Yes 5% to 10%, but "net listings" are common; advertising is
provided by real estate broker/agent; FSBO very common; buyer broker representation is not required. Some commissions are set in dollar or ruble fee amounts. Reliable market information is difficult to acquire.
Singapore Yes 1.5-2.0%, FSBOs are very rare; buyer broker representation is not required.
Spain Yes Commission rate depends on the property location, averaging 5% of total estate price.
Sweden** Yes 5%; commission is paid by seller. 10% commission is typically charged for lower priced units.
Thailand n/a Commission rates vary from 3% to 5%. United Kingdom
Yes 1%-2% is typical; in very competitive areas 0.5-0.75%; in low priced areas as high as 3.5%. Advertising is provided by real estate broker/agent; buyer broker representation is not required.
United States Yes 6%-7%; advertising is provided by real estate broker/agent. In 1999, some real estate agents charged flat fees that ran from 2 to 4 percent. Auctions are increasing but usually at the same fees or higher than normally charged by the brokerage firm involved.
* This number was calculated as Total Home Sales, which in 1999 (according to NAR Profile) was 6.5 million. According to NARELLO, in 1999, there were 515,225 active real estate brokers and 980,083 active real estate agents.
** Information was obtained from http://onerealtorplace.com *** Jamaica, Trinidad and Tobago. Data was also confirmed through the network
of academicians and practitioners attending Real Estate Conferences in 2001.
Background on the US Residential Brokerage Industry For years, US real estate brokerage firms have operated via strong trade associations, most notably the National Association of REALTORs (NAR). Licensed agents may join local, state, and national associations, and thereby call themselves a “REALTORS,” which is a trade-registered name only available for use by members who agree to adhere to a specified code of conduct and pay local, state, and national dues. In 1999, there were 760,000 members of NAR and 2,121,918 active and inactive licensed brokers or agents nationally.14 The US REALTOR Association has been successful in recruiting members from among the ranks of licensed agents and in 14 The number of active and inactive national real estate brokers was obtained from the NARELLO Digest of License Laws, 1999. Apparently, many people keep a license in order to easily list a relative or a friend and can represent themselves so that they can “earn” a commission split or legal referral fee.
18 Delcour and Miller
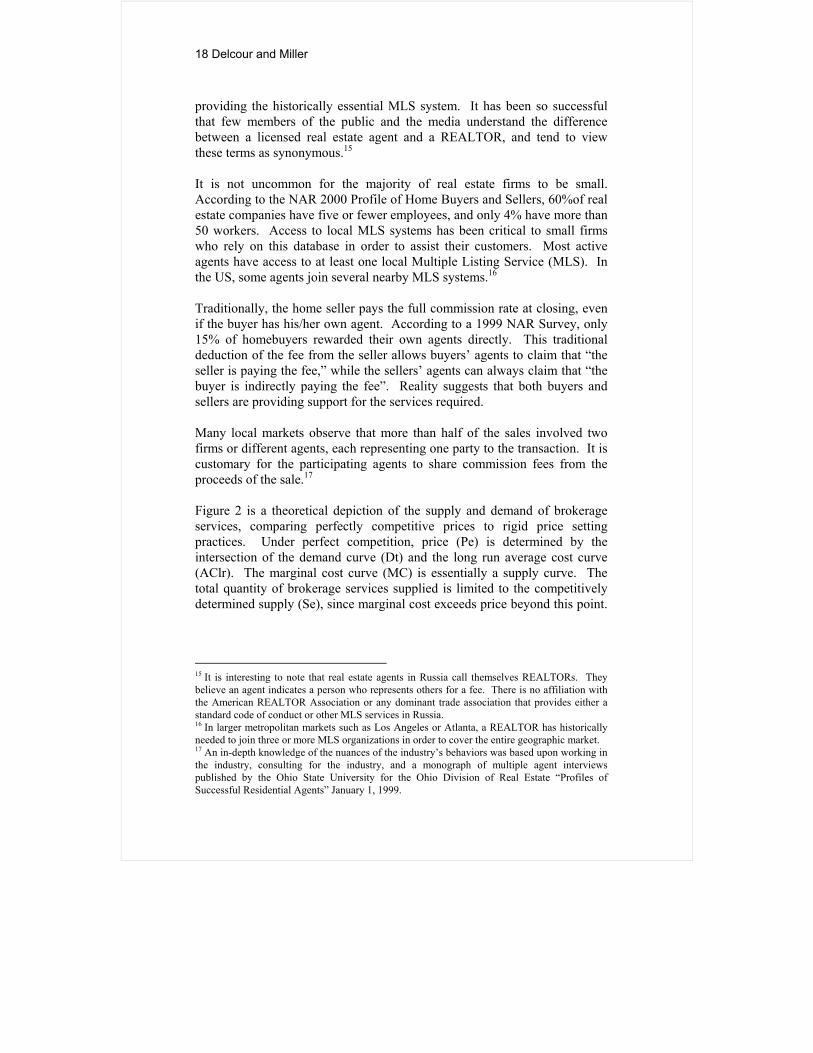
providing the historically essential MLS system. It has been so successful that few members of the public and the media understand the difference between a licensed real estate agent and a REALTOR, and tend to view these terms as synonymous.15 It is not uncommon for the majority of real estate firms to be small. According to the NAR 2000 Profile of Home Buyers and Sellers, 60%of real estate companies have five or fewer employees, and only 4% have more than 50 workers. Access to local MLS systems has been critical to small firms who rely on this database in order to assist their customers. Most active agents have access to at least one local Multiple Listing Service (MLS). In the US, some agents join several nearby MLS systems.16 Traditionally, the home seller pays the full commission rate at closing, even if the buyer has his/her own agent. According to a 1999 NAR Survey, only 15% of homebuyers rewarded their own agents directly. This traditional deduction of the fee from the seller allows buyers’ agents to claim that “the seller is paying the fee,” while the sellers’ agents can always claim that “the buyer is indirectly paying the fee”. Reality suggests that both buyers and sellers are providing support for the services required. Many local markets observe that more than half of the sales involved two firms or different agents, each representing one party to the transaction. It is customary for the participating agents to share commission fees from the proceeds of the sale.17 Figure 2 is a theoretical depiction of the supply and demand of brokerage services, comparing perfectly competitive prices to rigid price setting practices. Under perfect competition, price (Pe) is determined by the intersection of the demand curve (Dt) and the long run average cost curve (AClr). The marginal cost curve (MC) is essentially a supply curve. The total quantity of brokerage services supplied is limited to the competitively determined supply (Se), since marginal cost exceeds price beyond this point.
15 It is interesting to note that real estate agents in Russia call themselves REALTORs. They believe an agent indicates a person who represents others for a fee. There is no affiliation with the American REALTOR Association or any dominant trade association that provides either a standard code of conduct or other MLS services in Russia. 16 In larger metropolitan markets such as Los Angeles or Atlanta, a REALTOR has historically needed to join three or more MLS organizations in order to cover the entire geographic market. 17 An in-depth knowledge of the nuances of the industry’s behaviors was based upon working in the industry, consulting for the industry, and a monograph of multiple agent interviews published by the Ohio State University for the Ohio Division of Real Estate “Profiles of Successful Residential Agents” January 1, 1999.
International Residential Real Estate Brokerage Fees 19
Figure 2: Demand and Supply of Brokerage Services under the Traditional Cooperative Intensive Commission System Price
MCpc
MC traditional firm ΣMC = Supply
P* Aclr Pe ACpc
Dt
Dpc
Dp* Se S* Quantity
P* = actual price or commission rate. Pe = long run competitive equilibrium price. Dp* = the quantity of brokerage service demanded at price P*. Se = long run competitive equilibrium supply. S* = actual supply given price P*. Dt = the share of total demand for an individual firm. Dpc = the share of total demand for a price cutter firm. MC = marginal cost curve for an average firm in the industry, the supply curve. AClr = long run average cost curve for an average firm in the industry. MCpc = marginal cost curve for an individual firm (in this case that of the price cutter who pays smaller splits to agents per transaction). ACpc = average cost curve for an individual firm with marginal cost curve MCpc.
20 Delcour and Miller
When price is set above Pe, at say P*, the quantity of brokerage services supplied increases along with the marginal cost curve until P* no longer exceeds MC, at S*. The difference between Se and S* can be referred to as “excess supply” under a market with competitive pricing. Note that excess profits for the average firm will not exist even with a non-competitive price above Pe. The increase in supply absorbs the increased profit margin until P = MC is in equilibrium again.18 In contrast to the pure long run economic conclusion implied here, we have seen real agent earnings increase as the real price increases. In fact, from 2000 until late 2002, real estate home prices surged throughout the US, with the increases significantly ahead of the rate of inflation, while homes were sold in record times and with absolutely no indication of reduced commission rates.19 Evidence of increasing agent earnings will be provided in the following section of this paper. One factor on the supply side has been increased educational requirements, along with the associated costs of maintaining a license. This has forced some marginally productive agents out of the industry – to the benefit of the remaining agents. Excess supply, as depicted here, could not exist unless some enforcement mechanism prevents most firms from charging commission prices below P*. Take the case of an individual firm, which has marginal cost (MCpc) and average cost (ACpc) curves as shown in Figure 2. Because P* exceeds MC at the AC minimum, the firm decides to become a price cutter (pc), and lowers the price below P* and above or at MC = AC. Normally, such a price-cutting move would increase the total demand for the firm’s services, causing total revenues to increase, albeit with a lower fee per transaction. If such a move increases the price-cutting firm’s demand, other firms could be expected to react with similar price moves, thereby competitively driving the market-derived price down to Pe. However, when such behavior reduces a firm’s share of total demand (Dpc) to a level below AC, then such a price move would mean going out of business.
18 There are two perspectives that can be confusing when one examines the economics of the industry. This graph is an aggregate industry perspective emphasizing the impact of supply elasticity with rigid prices, but from the perspective of the individual firm, it will need to increase the commission split paid to productive agents so that their variable costs will rise, thereby squeezing out any excess profit. From the agent’s point of view, there will also not appear to be any excess profit, as the increased supply of agents means that the pie is merely split into more pieces. Overall, the result of non-price competition is merely excess supply, while in the absence of supply elasticity one would observe excess profit. Excess profit would occur if the supply could be constrained to less than Se. 19 Data source: FNIS and www.valueyourhome.com, where prices have been seen to rise so fast that many analysts are talking about real estate price bubbles.
International Residential Real Estate Brokerage Fees 21
How can the price-cutting firm’s share of demand be so detrimentally affected (from Dt to Dpc)? This behavior is explained by recognizing that a significant portion of Dt involves two cooperating brokers. That is, a firm’s share of Dt is not only dependent on the public, but to a significant degree on other firms. When a price cutter reduces the commission rate, it affects not only its own profit margin on those successful sales, but also reduces the portion available for other cooperative firms providing buyers. The shift from Dt to Dpc is a result of the loss of cooperative business by the price-cutting firm. When cooperative sales represent a significant portion of the firm’s business, such price-cutting behavior is not economically feasible. To the extent that firms depend on one another to share the total demand for their services, imitative pricing will be the rule of survival in local markets.20 Unless they involve consent or collusion, uniform pricing among competitors is not illegal. Imitative pricing practices, even as a result of conscious parallelism, may also be entirely proper. Even without collusion, the uniform commission rates found in the real estate brokerage industry have been necessitated by the interdependency of the small traditional brokerage firms. An antitrust violation would exist if real estate brokers or salespersons made agreements to fix commission rates, and acted on that arrangement. In an attempt to achieve completeness, we should note that some academic analysts have argued that the marginal cost curve for brokerage firms is quite inflexible, and they note correctly that the profit margins are low. 21 However, it should be noted that most of the brokers’ costs are variable. The largest single cost per transaction is the split paid to an agent. The argument is that brokers can’t lower fees unless they lower the agent' cost, but they can’t lower the agent cost and still retain any agents. This is true, unless of course the firm could achieve more total and net revenue with lower fees, and unless the agents would be satisfied with more transaction business, albeit at lower fees per transaction. Most US based brokerage firms, except for a few brave price cutters, have rejected such a possibility. But we can observe lower commission rates and more productive systems working quite well in many other countries. Evidence of Real Earnings Driving Agent Supply In the absence of price competition for listings, we observed a fluctuation in the number of agents entering or leaving the market in response to changes
20 In contrast, Anglin and Arnott’s (1991) study of residential real estate brokerage supports the collusion hypothesis among brokers and industry behavior. 21 Abdullah Yavas at Penn State, for example, was one of these academics.
22 Delcour and Miller
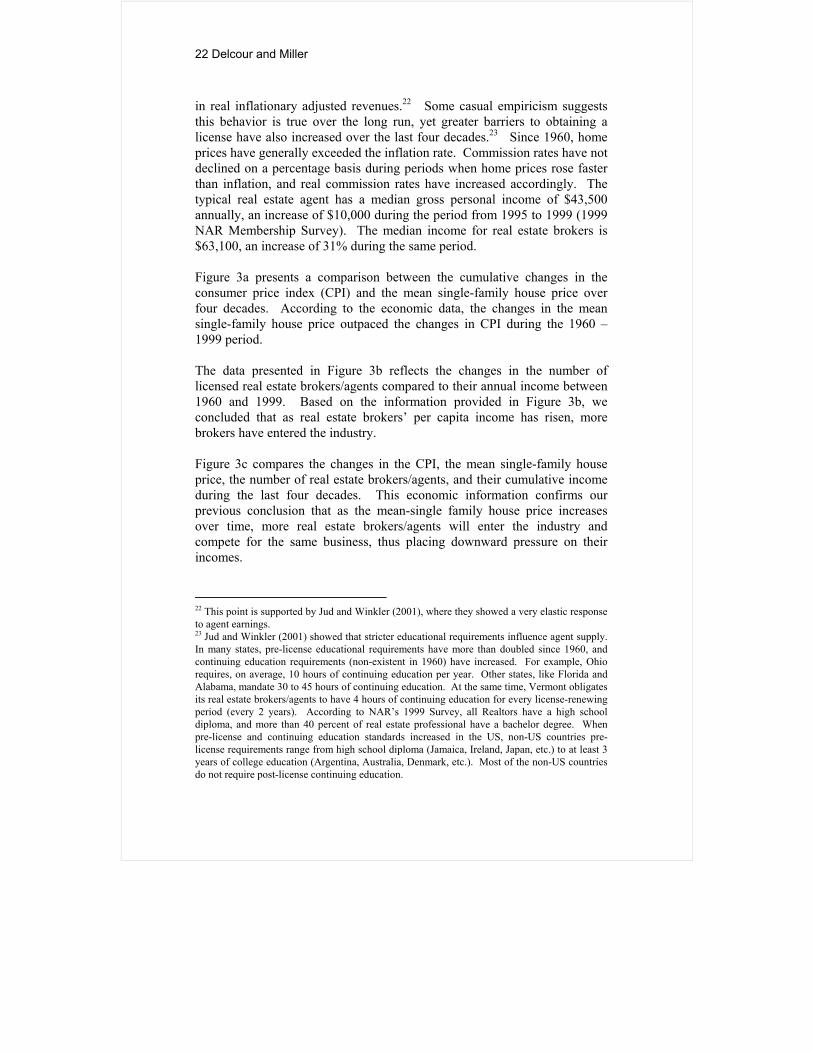
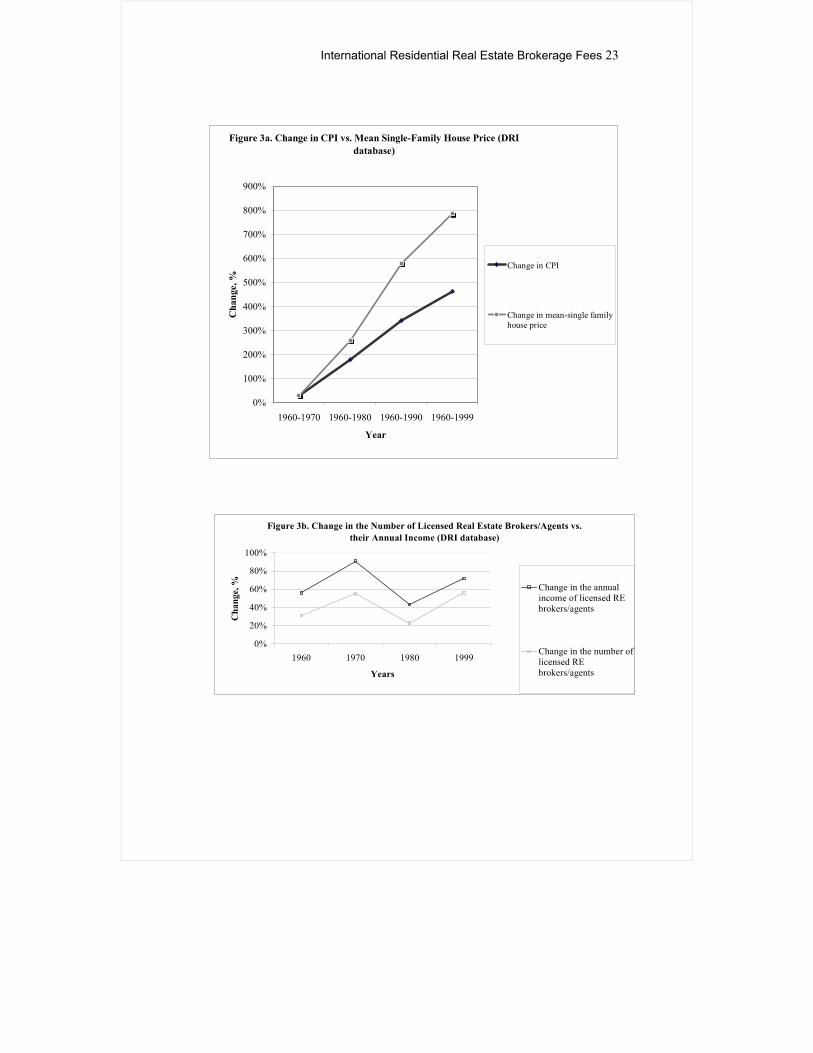
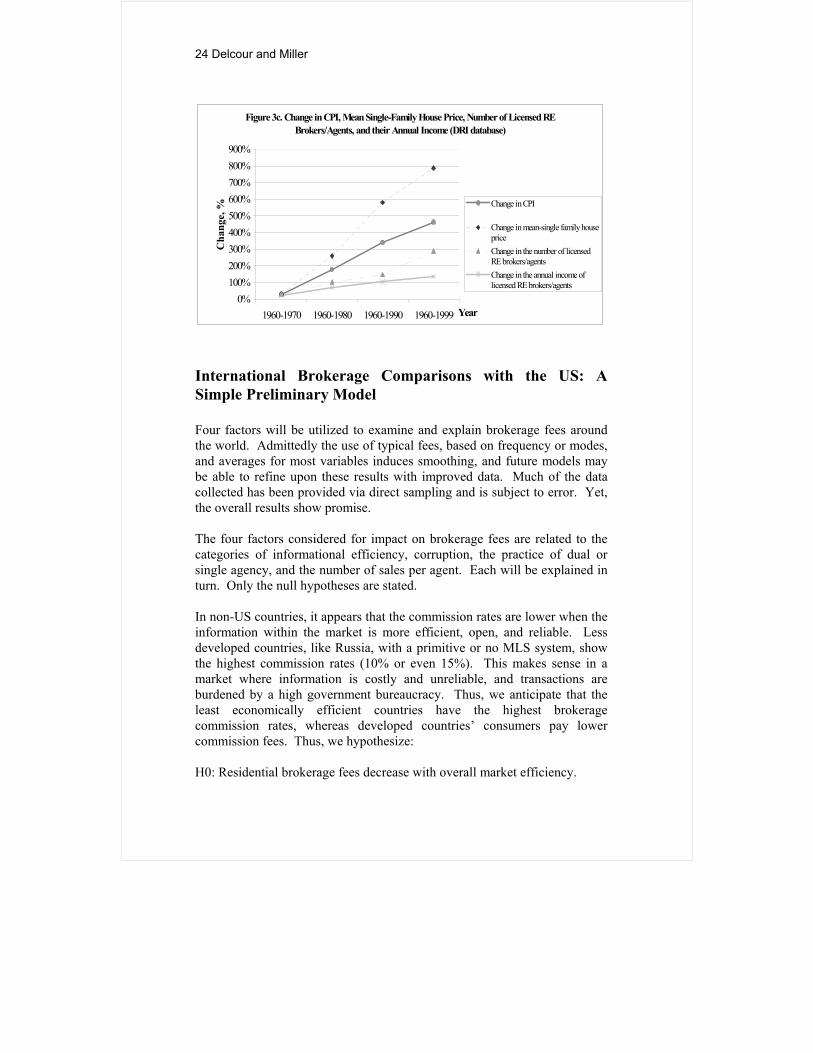
in real inflationary adjusted revenues.22 Some casual empiricism suggests this behavior is true over the long run, yet greater barriers to obtaining a license have also increased over the last four decades.23 Since 1960, home prices have generally exceeded the inflation rate. Commission rates have not declined on a percentage basis during periods when home prices rose faster than inflation, and real commission rates have increased accordingly. The typical real estate agent has a median gross personal income of $43,500 annually, an increase of $10,000 during the period from 1995 to 1999 (1999 NAR Membership Survey). The median income for real estate brokers is $63,100, an increase of 31% during the same period. Figure 3a presents a comparison between the cumulative changes in the consumer price index (CPI) and the mean single-family house price over four decades. According to the economic data, the changes in the mean single-family house price outpaced the changes in CPI during the 1960 – 1999 period. The data presented in Figure 3b reflects the changes in the number of licensed real estate brokers/agents compared to their annual income between 1960 and 1999. Based on the information provided in Figure 3b, we concluded that as real estate brokers’ per capita income has risen, more brokers have entered the industry. Figure 3c compares the changes in the CPI, the mean single-family house price, the number of real estate brokers/agents, and their cumulative income during the last four decades. This economic information confirms our previous conclusion that as the mean-single family house price increases over time, more real estate brokers/agents will enter the industry and compete for the same business, thus placing downward pressure on their incomes.
22 This point is supported by Jud and Winkler (2001), where they showed a very elastic response to agent earnings. 23 Jud and Winkler (2001) showed that stricter educational requirements influence agent supply. In many states, pre-license educational requirements have more than doubled since 1960, and continuing education requirements (non-existent in 1960) have increased. For example, Ohio requires, on average, 10 hours of continuing education per year. Other states, like Florida and Alabama, mandate 30 to 45 hours of continuing education. At the same time, Vermont obligates its real estate brokers/agents to have 4 hours of continuing education for every license-renewing period (every 2 years). According to NAR’s 1999 Survey, all Realtors have a high school diploma, and more than 40 percent of real estate professional have a bachelor degree. When pre-license and continuing education standards increased in the US, non-US countries pre-license requirements range from high school diploma (Jamaica, Ireland, Japan, etc.) to at least 3 years of college education (Argentina, Australia, Denmark, etc.). Most of the non-US countries do not require post-license continuing education.
International Residential Real Estate Brokerage Fees 23
Figure 3a. Change in CPI vs. Mean Single-Family House Price (DRIdatabase)
0%
100%
200%
300%
400%
500%
600%
700%
800%
900%
1960-1970 1960-1980 1960-1990 1960-1999
Year
Cha
nge,
%
Change in CPI
Change in mean-single familyhouse price
Figure 3b. Change in the Number of Licensed Real Estate Brokers/Agents vs. their Annual Income (DRI database)
0%
20%
40%
60%
80%
100%
1960 1970 1980 1999
Years
Cha
nge,
% Change in the annualincome of licensed REbrokers/agents
Change in the number oflicensed REbrokers/agents
24 Delcour and Miller
International Brokerage Comparisons with the US: A Simple Preliminary Model Four factors will be utilized to examine and explain brokerage fees around the world. Admittedly the use of typical fees, based on frequency or modes, and averages for most variables induces smoothing, and future models may be able to refine upon these results with improved data. Much of the data collected has been provided via direct sampling and is subject to error. Yet, the overall results show promise. The four factors considered for impact on brokerage fees are related to the categories of informational efficiency, corruption, the practice of dual or single agency, and the number of sales per agent. Each will be explained in turn. Only the null hypotheses are stated. In non-US countries, it appears that the commission rates are lower when the information within the market is more efficient, open, and reliable. Less developed countries, like Russia, with a primitive or no MLS system, show the highest commission rates (10% or even 15%). This makes sense in a market where information is costly and unreliable, and transactions are burdened by a high government bureaucracy. Thus, we anticipate that the least economically efficient countries have the highest brokerage commission rates, whereas developed countries’ consumers pay lower commission fees. Thus, we hypothesize: H0: Residential brokerage fees decrease with overall market efficiency.
Figure 3c. Change in CPI, Mean Single-Family House Price, Number of Licensed RE Brokers/Agents, and their Annual Income (DRI database)
0%100%200%300%400%500%600%700%800%900%
1960-1970 1960-1980 1960-1990 1960-1999 Year
Cha
nge,
% Change in CPI
Change in mean-single family housepriceChange in the number of licensedRE brokers/agentsChange in the annual income oflicensed RE brokers/agents
International Residential Real Estate Brokerage Fees 25
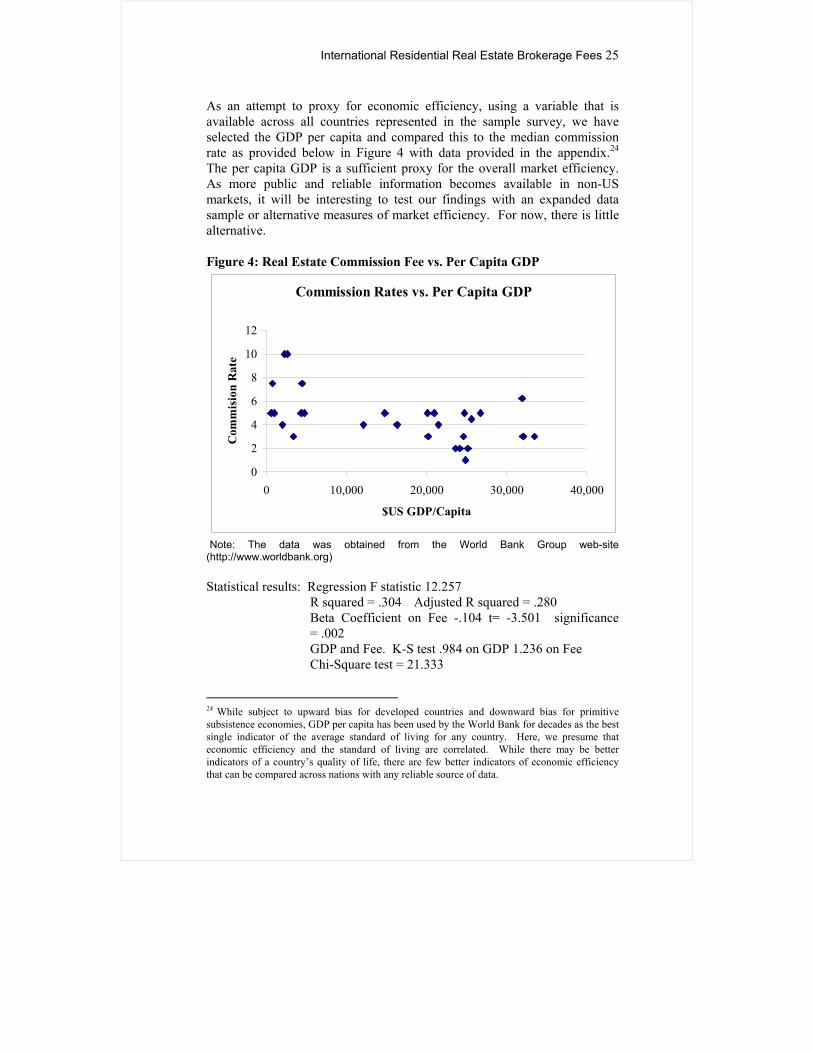
As an attempt to proxy for economic efficiency, using a variable that is available across all countries represented in the sample survey, we have selected the GDP per capita and compared this to the median commission rate as provided below in Figure 4 with data provided in the appendix.24 The per capita GDP is a sufficient proxy for the overall market efficiency. As more public and reliable information becomes available in non-US markets, it will be interesting to test our findings with an expanded data sample or alternative measures of market efficiency. For now, there is little alternative. Figure 4: Real Estate Commission Fee vs. Per Capita GDP
Commission Rates vs. Per Capita GDP
0
2
4
6
8
10
12
0 10,000 20,000 30,000 40,000
$US GDP/Capita
Com
mis
ion
Rat
e
Note: The data was obtained from the World Bank Group web-site (http://www.worldbank.org) Statistical results: Regression F statistic 12.257 R squared = .304 Adjusted R squared = .280
Beta Coefficient on Fee -.104 t= -3.501 significance = .002 GDP and Fee. K-S test .984 on GDP 1.236 on Fee Chi-Square test = 21.333
24 While subject to upward bias for developed countries and downward bias for primitive subsistence economies, GDP per capita has been used by the World Bank for decades as the best single indicator of the average standard of living for any country. Here, we presume that economic efficiency and the standard of living are correlated. While there may be better indicators of a country’s quality of life, there are few better indicators of economic efficiency that can be compared across nations with any reliable source of data.
26 Delcour and Miller
The statistical GDP/capita = f (Real estate commission fee) Figures some explanatory power (R-squared equals to approximately 30%), and will be used in the general model discussed below. One might note, however, that the fees charged in the US do not conform well to this measure, as seen in Figure 4. For this reason, the general model will be run with and without the US observation data. If there is less price competition in the US, then according to the theory provided earlier, the supply of agents should be higher and sales per agent should be lower, eliminating excess profits per agent. One indication of a higher supply of agents relative to the potential revenue per transaction is the number of sales for the typical full time agent. For the average REALTOR in the US, this number is about seven, but for full time agents it is about 12. This estimate is based on survey data, but it is included as an indication of the supply impact that higher commission pricing per transaction might induce. H0: Residential brokerage fees are lower in a country with a higher number of sales per full time agent. The Impact of Uncertain Markets and Bureaucratic Risks Within some countries it is difficult to complete business transactions in a timely fashion without occasionally being generous to local officials. Corruption within economies adds significant friction and uncertainty to the market, and directly to transactions costs as they become priced into fees. Countries in our sample have different political and regulatory environments that might impact the cost of doing business as a market player or intermediary. For example, developed countries in North America, Asia and Pacific Rim, and Western Europe have a stable market economy with relatively little corruption of government officials and very few changes in the regulatory environment. For the most part, these countries ensure and protect market participants’ real estate ownership rights. At the same time, less developed countries face frequent regulatory changes and are more susceptible to bribes that grease the system for the donors. In an attempt to proxy for this cost of doing business, we incorporated a corruption risk index into our model. It assesses the distortion of the predictable transaction processing and reduction of government and business efficiency. It is likely that real estate brokerage commission rates are greater in countries with a higher corruption index compared to countries with a lower corruption index, since agents must include this extraordinary cost of doing business to the usual business costs. The corruption index was obtained from International
International Residential Real Estate Brokerage Fees 27
Country Risk Guide.25 It is measured on a scale from one to six, where six is assigned to a least corrupted country. Thus, we hypothesize: H0: Residential brokerage fees are lower in a country with a low corruption risk. The Impact of Buyer/Seller Separate Agents It is not uncommon in real estate transactions around the world to utilize a single agent representing both sides, which is known as a dual agency. In the US, a dual agency is legal only if it has been fully disclosed, and separate buyer and seller agency is common. When multiple agents are involved, the cost of doing business is likely to grow as well as the fairness of the representation. Thus, we hypothesize: H0: Residential brokerage fees are lower in a country where dual agency representation is common. Empirical Models Tested We employed the following four models:
Real state brokerage fee = ƒ (GDP per capita) Real state brokerage fee = ƒ (GDP per capita, Corruption Index) Real state brokerage fee = ƒ (GDP per capita, Corruption Index, Agent representation) Real state brokerage fee = ƒ (GDP per capita, Corruption Index, Agent representation,
Sales per agent), where Real state brokerage fee (FEE) is measured in %;
GDP per capita (GDPP) is measured in US$ per capita;
Corruption Index (CI) measures a threat of country’s instability and risk environment. CI
25 The International Country Risk Guide is the PRS Group publication. The corruption index is an assessment of corruption within the political system. It measures the threat of economic and environmental instability.
28 Delcour and Miller
takes a value of “1” for countries with a Corruption Index between 1 to 3, and “0” for countries with a Corruption Index between 4 and 6;
Agent representation (AGENTS) represents the number of real estate agents participating in a typical real estate transaction (dual or single agent representation). Takes a value of “0” for dual agency representation and “1” if otherwise; and
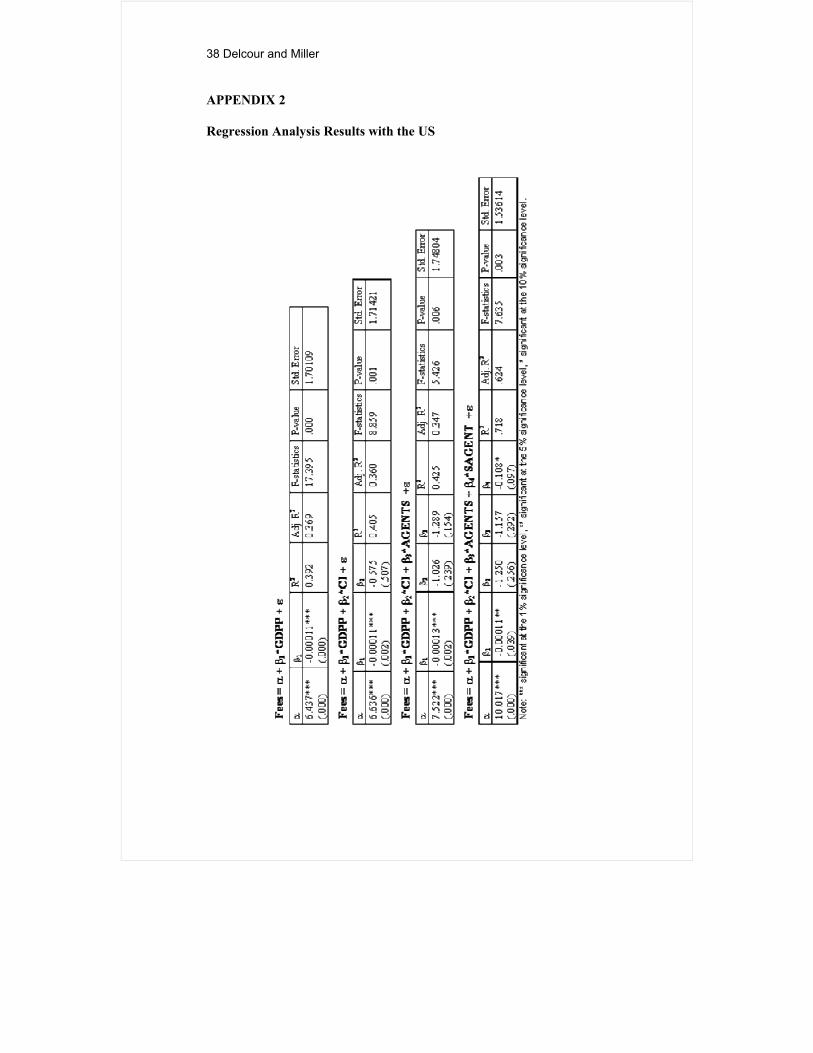
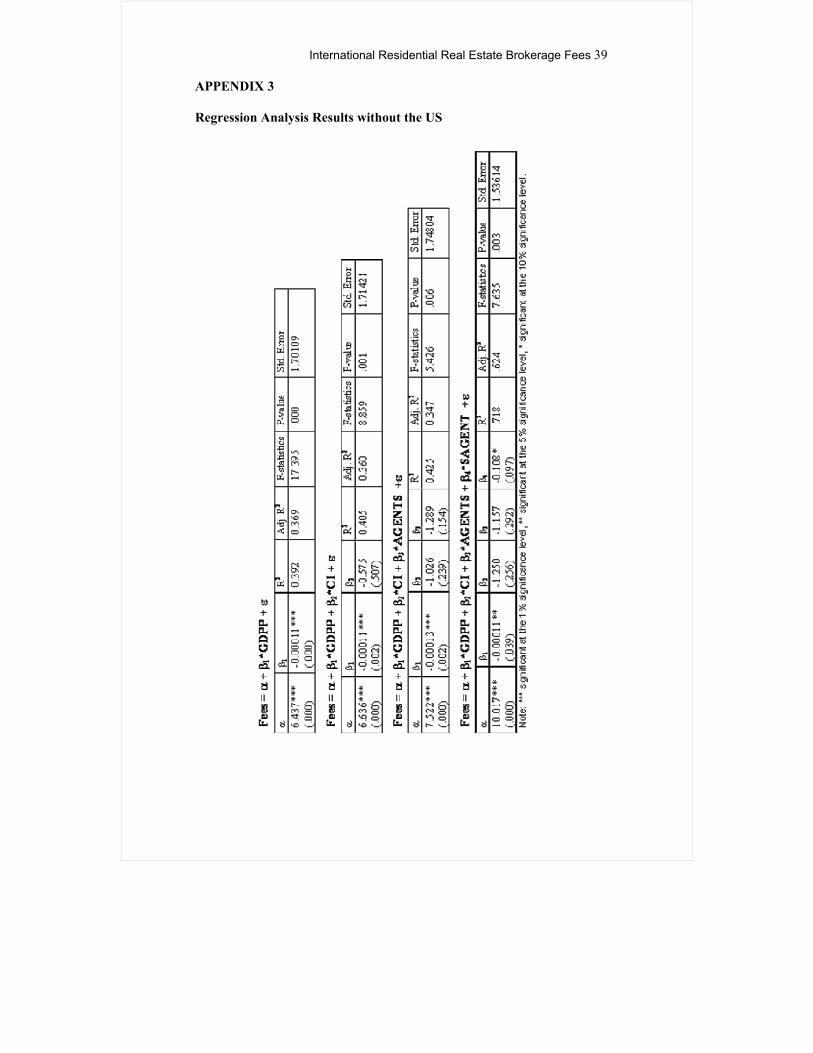
Sales per agent (SAGENT) measures mean units sold per typical real estate agent. Empirical Results The empirical results are summarized in Appendices 2 and 3. It appears that commission rates in the US are abnormally high for a country as efficient as we presumed and as price competitive as we would like it to be. Those who believe that the US brokerage industry is efficient and price competitive must find these results puzzling. Explanations for relatively higher fees for US firms include greater liability and the provision of more services, whether they are desired by consumers or not. But the interdependency of the traditional industry that has tended to reduce price competition and encourage imitative pricing seems to be the most compelling explanation. The statistical models feature good explanatory power (R-squared values vary from 0.304 to 0.688 for the model that includes the US, with an R-squared that reaches .718 for the all variable model, excluding the US). Taking out the US improves the fit, as this is consistent with the notion that US fees are an anomaly. All eight models are statistically significant. As anticipated, the estimated coefficient for GDPP is negative and statistically significant. Thus, we accept the null hypothesis that fees are lower with a higher economic efficiency.26
26 The policies governing the cooperative commission split vary from country to country. In Argentina and Italy, it is common for commission fees to be split between buyer’s and seller’s agents. In Indonesia, Malaysia, the Netherlands, and the Philippines, either the buyer or the seller, depending on the real estate contract, pays commission fees. Denmark and some other countries (e.g. Venezuela, Argentina, Mexico, Italy, and Hong Kong) charge transfer ownership sales taxes and require notary participation in real estate transactions.
International Residential Real Estate Brokerage Fees 29
With respect to the prevalence of the dual agency, the estimated coefficient on a dummy variable is negative and statistically insignificant. Thus, we rejected our null hypothesis, and it appears that residential brokerage fees are not higher in countries where separate buyer and seller agency representation is common. Nuances within countries may not be appropriately captured by a single dummy variable. With respect to the corruption index, the estimated coefficient is negative and statistically insignificant. We have anticipated the negative sign for the corruption index’s estimated coefficient. Residential brokerage fees are lower in countries with less corruption, but the measurement here is a bit crude and statistically weak. Finally, we accepted the null hypothesis that residential brokerage fees are lower in a country with a higher number of sales per full time agent. The estimated coefficient is negative and statistically significant. Based on Global Data, What Should US Residential Fees Run? We estimated the US residential brokerage fees using the full variable final model estimated without US data, as shown in Appendix 3. Based on the estimated coefficients, US residential brokerage fees should equal something closer to 3.0% versus the common 6% or 7% fee. Note that this result is sensitive to the number of sales per agent. If the number of sales per agent for England is plugged into the same model (much higher than that of the US) the fee estimate equals a fee close to the actual fees observed in England. The conclusion is that fees in England, Hong Kong, and many other price competitive markets are close to equilibrium, while fees in the US seem to be artificially high based on price rigidity within the US system. Further Differences Observed by Country and Model Limitations In some countries, commission rates vary with the difficulty of the sale or the price level of the home. This is the case for Sweden, Finland, Ireland, Mexico, and Belarus. Higher priced homes see lower commission rates in these regions, indicating that the cost structure and profitability of buying/selling homes is not linear with respect to price. This behavior is consistent with price competitive markets, and we should expect the same to
30 Delcour and Miller
occur within any market that is not characterized by price rigidity.27 Within this study, such variation was not captured. The Internet Impacts the International Real Estate Industry Since 1999, the real estate industry has become more web-based. According to the web-site www.owners.com in 2000, more than one million Americans sold their homes by themselves. About 20% of sellers executed their real estate transactions utilizing FSBO (For Sale By Owner) web-sites. Thrall (1998), as well as Benjamin, Jud, and Sirmans (2000), suggested that the growing use of the Internet in all stages of the real estate process will have a dramatic impact on both the information diffusion and the economies of an MLS. Baen and Roulac (1998) and Jud and Roulac (2001) stated that technological changes will have a tremendous affect on how real estate is bought and sold in the future. Guttery, Baen, and Benjamin (2000) speculated that information technology and greater efficiency in the matching of buyers and sellers will lead to fewer active sales agents. Muhanna (2000) suggested lower commission rates will occur. Yavas and Colwell (1999) concluded that changes occurring in the real estate industry as a result of the information revolution may encourage the development of new forms of MLS systems. They speculated that the new form of MLS will look more like an "Internet bulletin board”. Access cost of this bulletin board will be very low; therefore, if traditional real estate companies are to stay in business, they must develop and implement new types of brokerage contracts. To effectively compete with on-line multi-service real estate brokerage e-tailers, traditional real estate companies must make the Internet their ally. In their analysis of the effects of technology changes on real estate brokerage, Guttery, et. al. (2000) reached a similar conclusion. In their working paper, Zumpano, et. al. (2001) presented empirical evidence that supports the notion of increasing the efficiency of real estate agents through the diffusion of the Internet. Their finding supports previous empirical inferences of decreasing commission rates through a greater utilization of technology in the real estate industry. The point of all these authors is to generally support greater efficiency and price competition in the future for the residential real estate industry. 27 In some instances, high priced US homes are probably listed for lower fees, yet, it is not clear where this break point begins in local markets. For example, in Hawaii, Prudential Locations charges 6% even on homes above a million dollars.
International Residential Real Estate Brokerage Fees 31
Conclusions This is the first study to compare, on a global basis, residential brokerage fees and attempts to model observed fees. While differences were observed, we saw most industrialized countries at 5% or less, and most less industrialized countries were above 5%, the US being an exception. Future studies might be able to consider constraints on agent supply, such as education and license fee requirements, continuing education requirements and other institutional constraints. Such data is not readily available at this time. We agree with many other academic analysts that eventually, US fees will come down. The key is that the potential business gain derived from price-cutting in the US must outweigh the expense of lost cooperation from other brokerage firms. Indeed, if a few of the larger firms make a successful break from the common pattern of uniform commission rates, they could trigger a price revolution in the brokerage industry. Beyond a la carte services and a menu of packages for consumers, as suggested by Jud and Roulac (2001), there are several other implications of price competition on the real estate brokerage industry as observed in non-US markets. One implication is that lower priced homes should see higher commission rates relative to higher priced homes. Lower end homes might require commission rates in excess of 7%, or even 10%, if they are not in a very marketable condition. This could explain why some more productive agents refuse to list lower priced homes. It may also clarify why agents put forth less advertising, hold fewer open houses, and expend much less effort into such listings. We should also see more marketable and higher priced homes listed at lower percentage commission rates, similar to those found in the United Kingdom. The success rate of FSBOs should continue to increase as the number of private MLS web-based sites decline, and market concentration increases, making buyer searches easier and more efficient. 28 The traditional brokerage firm using more automated services and expert systems to serve both consumers and agents will likely provide a range of service packages. A drop in US commission rates to the 5% range or less would likely drive
28 No more then 5 to 10 private side US-based MLS systems are likely over the long run, as economies of scale and natural efficiencies combine with consumer resistance to using so many different websites. Links between affiliated sites might help to maintain multiple sites as long as the integration for consumers is seamless. Fewer FSBO websites imply a higher success rate, as the survivors become more effective.
32 Delcour and Miller
many marginal producers out of the industry.29 This “weeding-out” process is likely to result in a more professional and experienced agent becoming the norm. For consumers both in the US and other markets, this is the greatest benefit from price competition. Acknowledgements An earlier version of this paper was presented at the International Real Estate Society Meeting, Girdwood, Alaska, in July 2001. We thank the reviewers for their comments, as well as all our colleagues around the world who have helped in data verification. We also thank the anonymous reviewers of this journal who have helped to improve the paper. References Anderson R., D. Lewis, and L. Zumpano. (1999), Residential Real Estate Brokerage Efficiency From a Cost and Profit Perspective, Journal of Real Estate Finance and Economics, 20, 3, 295-310.
Anglin P. M. and R. Arnott. (1991), Residential Real Estate Brokerage as a Principal-Agent Problem, Journal of Real Estate Finance and Economics, 4, 99-125.
Austin, A.D.(1973), The Antitrust Threat to Real Estate Brokerage, Real Estate Review, 2, 9-14.
Bajtelsmit V. L. and E. Worzala. (1997), Adversarial Brokerage in Residential Real Estate Transactions: The Impact of Separate Buyer Representation, Journal of Real Estate Research, 14, ½, 65-76.
Barlett, R.(1981), Property Rights and the Pricing of Real Estate Brokerage, The Journal of Industrial Economics, 30, 79-94.
Benjamin J. D., G. D. Jud and G. Stacy Sirmans. (2000), What Do We Know about Real Estate Brokerage?, Journal of Real Estate Research, 20, ½, 5-30.
29 According to British brokerage associations and five firms interviewed in 1999 by the authors, the typical British agent makes 25 to 50 sales per year – far more than the typical US agent. As fees in the US come down, agent productivity will increase.
International Residential Real Estate Brokerage Fees 33
Carney M. (1982), Costs and Pricing of Home Brokerage Services, Journal of the American Real Estate and Urban Economics Association, fall, 3, 331-354.
Cox, Arthur T. (2001), The Use of the Internet by Iowa Real Estate Licenssees, working paper presented at ARES meetings, April, Idaho.
Crockett, J.H. (1982), Competition and Efficiency in Transacting: The Case of Residential Real Estate Brokerage, Journal of the American Real Estate and Urban Economics Association, 10, 2, 209-227.
Dotzour, M. G., E. Morehead and D. T. Winkler. (1988), The Impact of Auctions on Residential Sales Prices in New Zealand, Journal of real Estate Research, 16, 1, 57-71.
DRI database.
Frew, J. R. and G. D. Jud. (1986), The Value of a real Estate Franchise, Journal of the American Real Estate and Urban Economics Association, 14, 2, 374-383.
Guttery R. S., J. S. Baen, and J. Benjamin. (2000), Alamo Realty: The Effects of Technology Changes on Real Estate Brokerage, Journal of Real Estate Practice and Education, 3, 1, 71-84.
Jud, G. D., R. C. Rogers and G. E. Crellin. (1994), Franchising and Real Estate Brokerage, Journal of Real Estate Finance and Economics, 8, 1, 87-93.
Jud, G. D. and S. E. Roulac. (2000), The Future of the Real Estate Brokerage Industry, working paper presented at the American Real Estate Meeting, Santa Barbara, California, April.
Jud, G. D. and D. T. Winkler. (1998), The Earnings of Real Estate Salespersons and Others in the Financial Services Industry, Journal of Real Estate Finance and Economics, 17, 3, 279-291.
Jud, G. D. and D. T. Winkler. (2000), A Note on Licensing and the Market for Real Estate Agents, Journal of Real Estate Finance and Economics, 21, 2.
Jud, G. D., D. T. Winkler and G. Stacy Sirmans. (2001), The Impact of Information Technology on Real Estate Licenssee Income, working paper
34 Delcour and Miller
presented at the American Real Estate Society Annual Meeting, Coeur d’Alene, Idaho, April.
International Country Risk Guide, The PRS Group, May 2001, 22, 5.
Lewis, D. and R. Anderson. (1999), Is Franchising More Cost Efficient? The Case of the Residential Real Estate Brokerage Industry, Journal of Real Estate Economics, 27, 3, 545-560.
Marsh G. A. and L. V. Zumpano. (1988), Agency Theory and the Changing Role of the Real Estate Broker: Conflicts and Possible Solutions, Journal of Real Estate Research, 3, 2, 151-165.
Miller N. G. (1996), Telecommunications Technology and Real Estate: Some Additional Perspectives, Real Estate Finance, Summer, 13, 2, 18-25.
Miller, N.G. and P.J. Shedd. (1979), Do Antitrust Laws Apply to the Real Estate Brokerage Industry? American Business Law Journal, 17/3, Fall.
Miller, N.G. (1999), Profiles of Successful Residential Agents, Research Monograph published by the Ohio State University Real Estate Center under the auspices of the Ohio Division of Real Estate.
Muhanna, Waleed A.(2000), E-Commerce in the Real Estate Brokerage Industry, Journal of Real Estate Practice and Education, 3, 1, 1-16.
Muneke, H.J. and A. Yavas. (2001), Incentives and Performance in Real Estate Brokerage, The Journal of Real Estate Finance and Economics, 22, 1.
NAR Membership Survey, 1999, http://nar.realtor.com
Owen, B. M., Kickbacks. (1977), Spcialization, Price Fixing, and Efficiency in Residential Real Estate Markets, Stanford Law Review, 29, 931-967.
Roth, K.,(2000), The 2000 National Association of Realtors Profile of Home Buyers and Sellers, National Association of Realtors, www.nar.realtor.com
The 1999 National Association of Realtors Membership Survey, National Association of Realtors, 1999. The 2001 National Survey of 800 Adults conducted on February 5-6, 2001 on Behalf of the National Association of Realtors.
Thrall, Grant. (1998), Real Estate Information Technology: The Future is Today, GIS in Real Estate, Edited by Gil Castle, Appraisal Institute, Chicago.
International Residential Real Estate Brokerage Fees 35
Turnbull, G. K. (1996), Real Estate Brokers, Nonprice Competition and the Housing Market, Real Estate Economics, fall, 24, 3, 293-304.
Worzala, E.M. and A. M. McCarthy, Landlords, Tenants and E-commerce: Will the Retail Industry Change Significantly?, Journal of Real Estate Literature, forthcoming.
Wachter, S.M. (1987), Residential Real Estate Brokerage: Rate Uniformality and Moral Hazard, Research in Law and Economics series, Greenwich, CT and London JAI Press, 10, 189-210.
Yavas, A. (2001), Impossibility of a Competitive Equilibrium in the Real Estate Brokerage Industry, Journal of Real Estate Research, 21, 3,187-200.
Yavas, A. and P. Colwell. (1999), Buyer Brokerage: Incentive and Efficiency Implications, Journal of Real Estate Finance and Economics, 18, 3, 259-277.
Yinger, J., A Search Model of Real Estate Broker Behavior, American Economic Review, 71, 4, 591-604.
Zumpano, L. V., R. I. Anderson, E. A. Baryla, Jr. and K. H. Johnson (2001), Internet Use and Real Estate Brokerage Market Intermediation, working paper presented at the American Real Estate Society Annual Meeting, Coeur d’Alene, Idaho, April.
Zumpano, L.V., Elder, H.W. Elder and G.E. Crellin. (1993), The Market for Residential Real Estate Brokerage Services: Costs of Production and Economies of Scale, Journal of Real Estate Finance and Economics, 6, 3, 237-250
Internet Sites Examined: www.1ownerhomes.com
www.4Sale-ByOwner.com
www.CloseYourDeal.com
www.coldwellbanker.com
www.cyberhomes.com
www.e-realtor.net
36 Delcour and Miller
www.FIZBODepot.com
www.FSBOFreedom.com
www.homeadvisor.com
www.homebytes.com
www.homefair.com
www.homes.com
www.homeshark.com
www.homesthatclick.com
www.homestore.com
www.iown.com
www.ipix.com
www.ired.com
www.ec.gov.sg
www.newhomenetwork.com
www.onerealtorplace.com
www.owners.com
www.realestatevillage.com
www.realtor.com
www.valueyourhome.com
www.worldbank.org
www.ziprealty.co
International Residential Real Estate Brokerage Fees 37
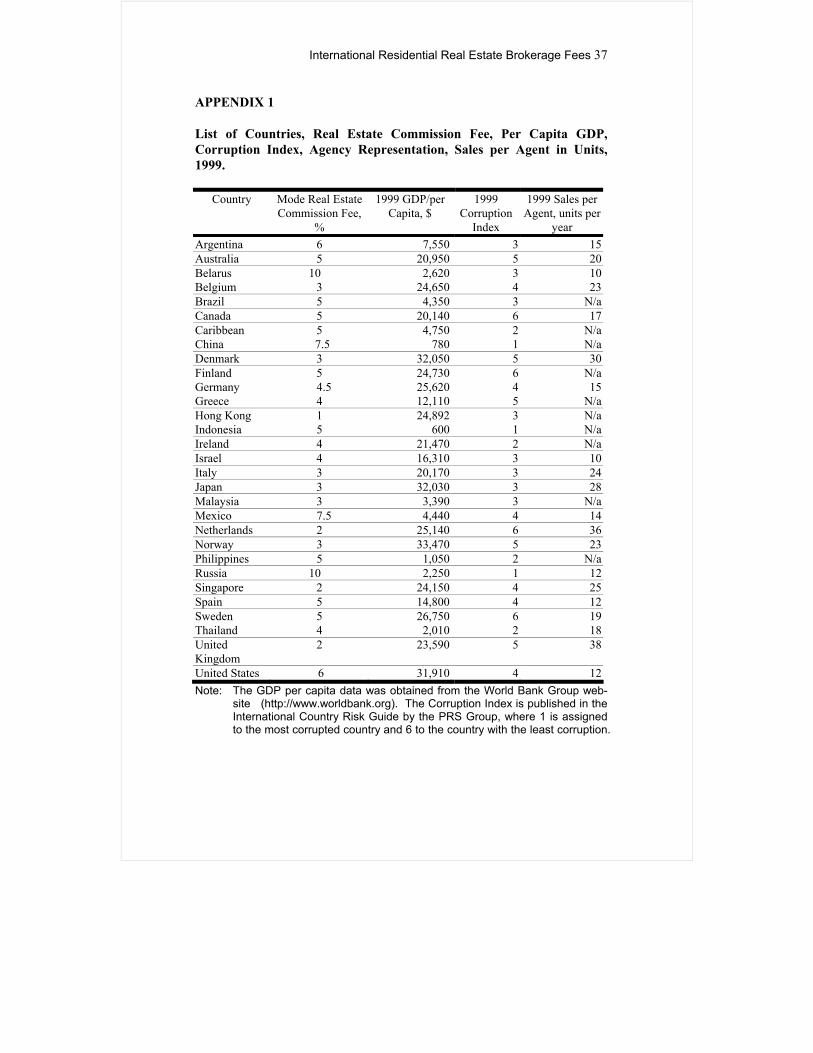
APPENDIX 1
List of Countries, Real Estate Commission Fee, Per Capita GDP, Corruption Index, Agency Representation, Sales per Agent in Units, 1999.
Country Mode Real Estate Commission Fee,
%
1999 GDP/per Capita, $
1999 Corruption
Index
1999 Sales per Agent, units per
year Argentina 6 7,550 3 15 Australia 5 20,950 5 20 Belarus Belgium
10 3
2,62024,650
34
10 23
Brazil 5 4,350 3 N/a Canada 5 20,140 6 17 Caribbean China
5 7.5
4,750780
21
N/a N/a
Denmark 3 32,050 5 30 Finland Germany Greece
5 4.5
4
24,73025,62012,110
645
N/a 15
N/a Hong Kong Indonesia
1 5
24,892600
31
N/a N/a
Ireland 4 21,470 2 N/a Israel 4 16,310 3 10 Italy 3 20,170 3 24 Japan 3 32,030 3 28 Malaysia 3 3,390 3 N/a Mexico 7.5 4,440 4 14 Netherlands 2 25,140 6 36 Norway 3 33,470 5 23 Philippines 5 1,050 2 N/a Russia 10 2,250 1 12 Singapore 2 24,150 4 25 Spain 5 14,800 4 12 Sweden Thailand
5 4
26,7502,010
62
19 18
United Kingdom
2 23,590 5 38
United States 6 31,910 4 12 Note: The GDP per capita data was obtained from the World Bank Group web-
site (http://www.worldbank.org). The Corruption Index is published in the International Country Risk Guide by the PRS Group, where 1 is assigned to the most corrupted country and 6 to the country with the least corruption.
38 Delcour and Miller
APPENDIX 2 Regression Analysis Results with the US
International Residential Real Estate Brokerage Fees 39
APPENDIX 3 Regression Analysis Results without the US