international energy agency world energy outlook strategic challenges hideshi emoto senior energy...
TRANSCRIPT

INTERNATIONAL ENERGY AGENCY
World Energy Outlook World Energy Outlook Strategic ChallengesStrategic Challenges
Hideshi EmotoHideshi EmotoSenior Energy Analyst Senior Energy Analyst
International Energy AgencyInternational Energy Agency

INTERNATIONALENERGY AGENCY
Energy Trends & Strategic ChallengesReference Scenario

INTERNATIONALENERGY AGENCY
World Primary Energy Demand
Fossil fuels account for more than 80% of the growth in energy demand between now and 2030
0
1 000
2 000
3 000
4 000
5 000
6 000
1970 1980 1990 2000 2010 2020 2030
Mto
eOil
Natural gas
Coal
Nuclear power
Hydro power
Other renewables
0
1 000
2 000
3 000
4 000
5 000
6 000
1970 1980 1990 2000 2010 2020 2030
Mto
eOil
Natural gas
Coal
Nuclear power
Hydro power
Other renewables
INTERNATIONALENERGY AGENCY
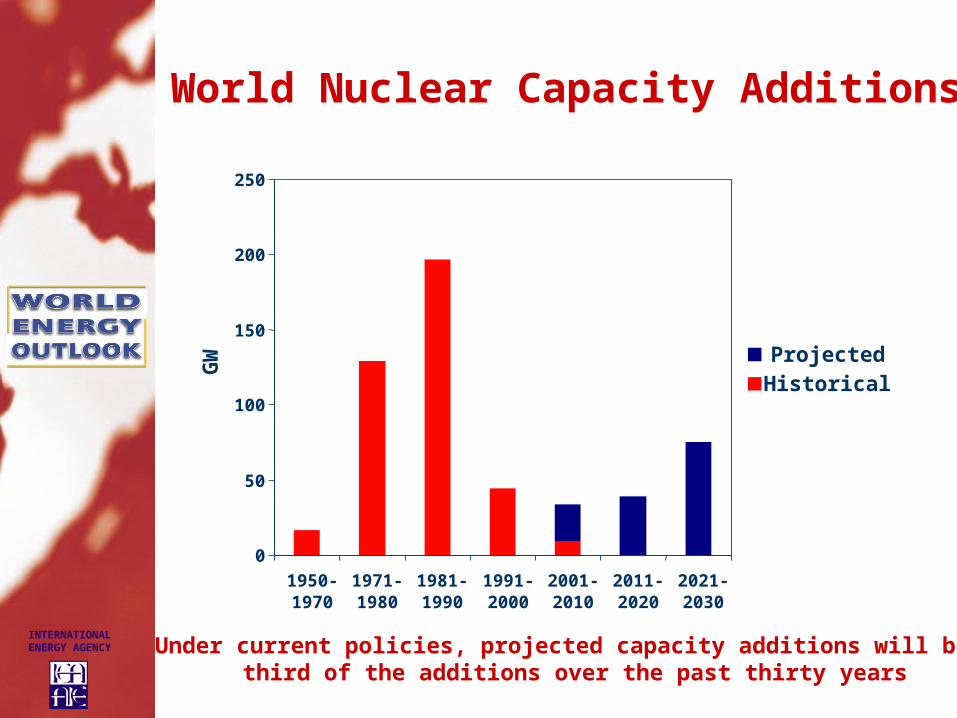
World Nuclear Capacity Additions
Under current policies, projected capacity additions will be a third of the additions over the past thirty years
0
50
100
150
200
250
1950-1970
1971-1980
1981-1990
1991-2000
2001-2010
2011-2020
2021-2030
GW Projected
Historical
INTERNATIONALENERGY AGENCY
Challenge 1:Security of
Supply
INTERNATIONALENERGY AGENCY
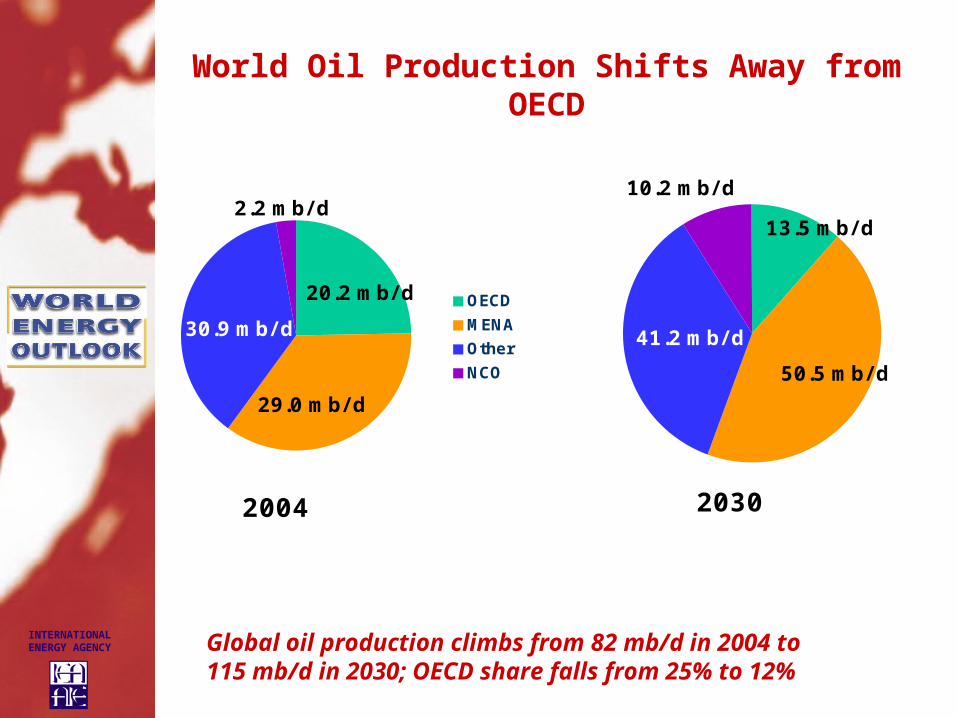
World Oil Production Shifts Away from OECD
Global oil production climbs from 82 mb/d in 2004 to 115 mb/d in 2030; OECD share falls from 25% to 12%
OECD
MENA
Other
NCO
41.2 mb/ d
50.5 mb/ d
13.5 mb/ d
30.9 mb/ d
29.0 mb/ d
20.2 mb/ d
2004 2030
2.2 mb/ d10.2 mb/ d

INTERNATIONALENERGY AGENCY
MENA Crude Oil & NGL Production by Country
MENA’s share of world oil production rises from 35% in 2004 to 44% in 2030 in the RS, with Saudi production rising to over 18
mb/d
0
10
20
30
40
50
1970 1980 1990 2000 2010 2020 2030
mb
/d
Iran Iraq Kuwait Other Middle East Saudi Arabia UAE North Africa
0
10
20
30
40
50
1970 1980 1990 2000 2010 2020 2030
mb
/d
Iran Iraq Kuwait Other Middle East Saudi Arabia UAE North Africa
INTERNATIONALENERGY AGENCY
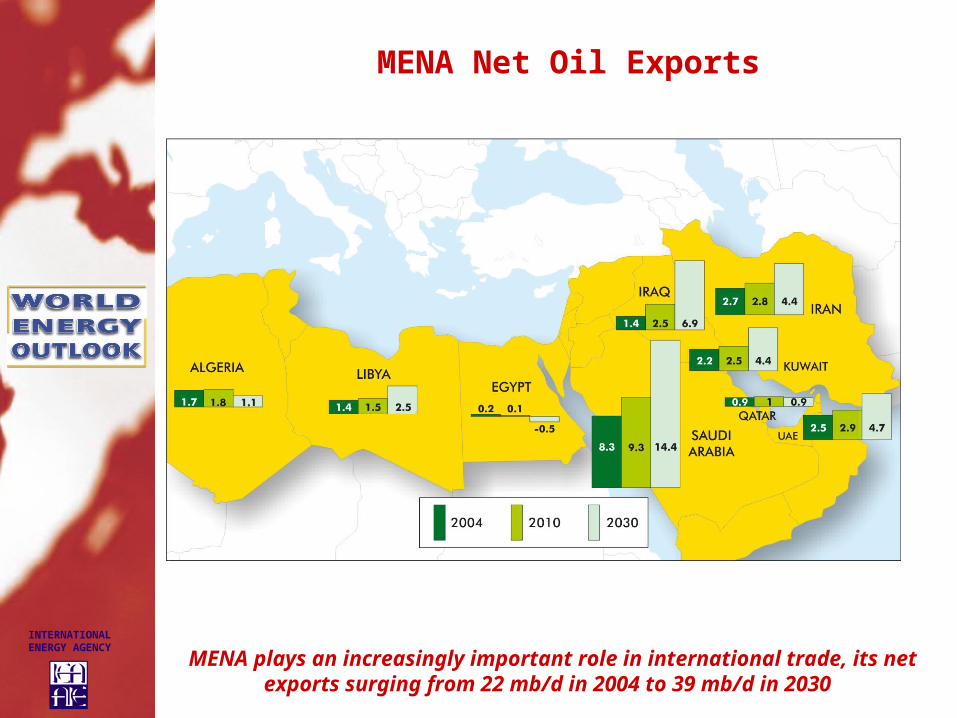
MENA Net Oil Exports
MENA plays an increasingly important role in international trade, its net exports surging from 22 mb/d in 2004 to 39 mb/d
in 2030

INTERNATIONALENERGY AGENCY
Saudi Arabia’s Oil Production by Source in the Reference Scenario
Based on its reserves and global demand trends, Saudi oil production is projected to reach 18 mb/d in 2030
0
4
8
12
16
20
1970 1980 1990 2000 2010 2020 2030
mb
/d
Currently producing fields Fields awaiting development
Reserve additions and new discoveries Total production

INTERNATIONALENERGY AGENCY
Iran’s Oil Balance in the Reference Scenario
Iran oil production reaches 6.8 mb/d in 2030, but exports increase
less rapidly due to strong growth in domestic demand
0
2
4
6
8
1970 1980 1990 2000 2010 2020 2030
mb
/d
Net exports Domestic demand

INTERNATIONALENERGY AGENCY
Oil Production Outlook in Iraq in the Reference Scenario
Oil production in Iraq is expected to reach around 3 mb/d in 2010 and
8 mb/d in 2030, provided that stability and security are restored
0
2
4
6
8
1970 1980 1990 2000 2010 2020 2030
mb
/d
Currently producing fields Fields awaiting development
Reserve additions and new discoveries Total production

INTERNATIONALENERGY AGENCY
Net Oil Imports by OECD Regions
OECD North America
OECD Europe OECD Pacific
0
3
6
9
12
15
18
2004 2030 2004 2030 2004 2030
mb/
d
MENA non MENA
OECD Europe will rely more on MENA oil – imports from MENA reach
8.5 mb/d, or nearly two-thirds of total imports in 2030
INTERNATIONALENERGY AGENCY
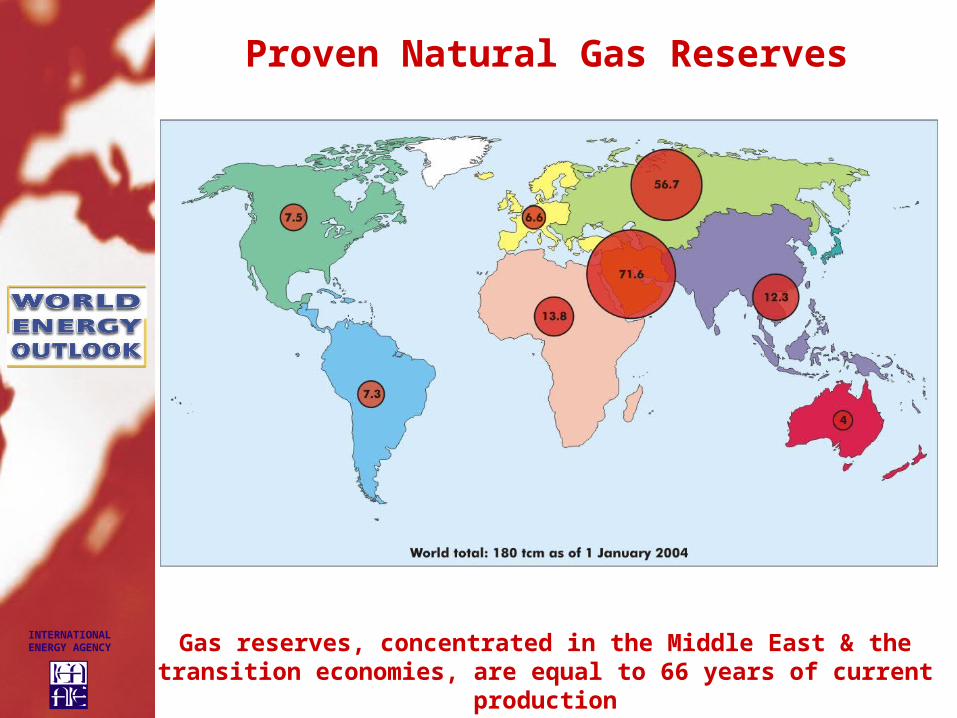
Proven Natural Gas Reserves
Gas reserves, concentrated in the Middle East & the transition economies, are equal to 66 years of current
production
INTERNATIONALENERGY AGENCY
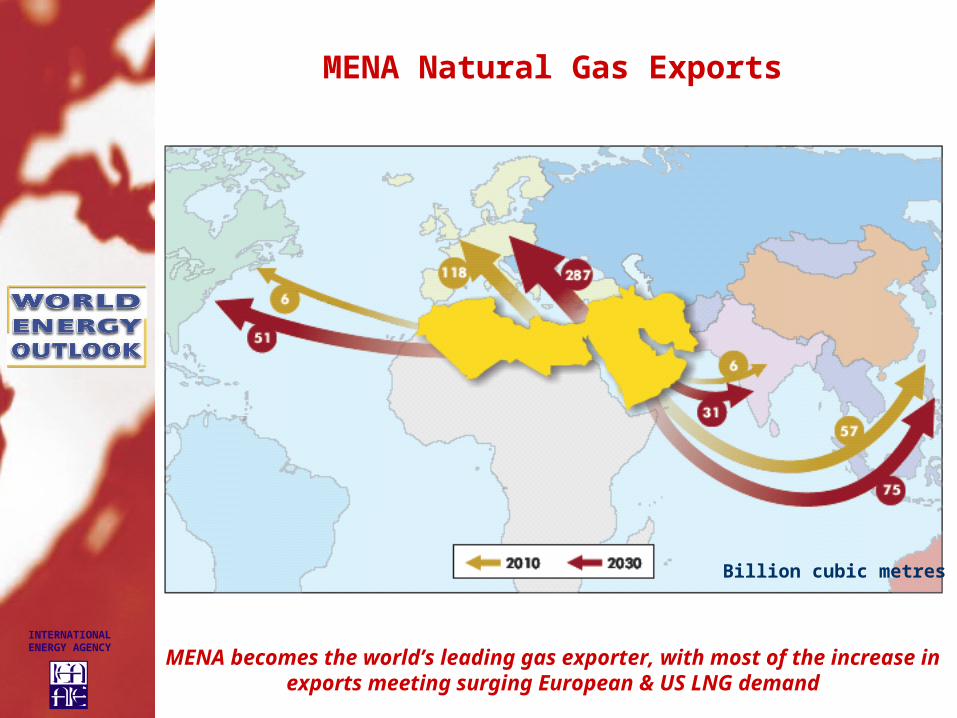
MENA Natural Gas Exports
MENA becomes the world’s leading gas exporter, with most of the increase in exports meeting surging European & US LNG
demand
Billion cubic metres

INTERNATIONALENERGY AGENCY
EU Gas Supply Balance
Rising demand – mainly for power generation – and declining output will cause net imports to surge
0
200
400
600
800
1980 1990 2004 2010 2020 2030
bcm
Production Net imports

INTERNATIONALENERGY AGENCY
Challenge 2:Carbon Dioxide Emissions
INTERNATIONALENERGY AGENCY
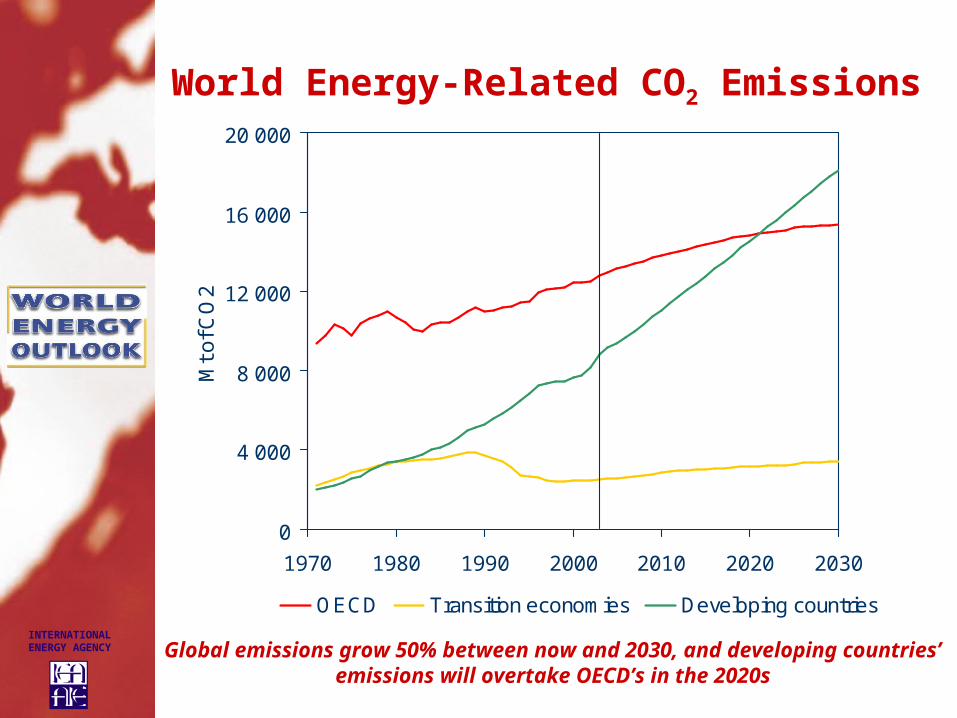
World Energy-Related CO2 Emissions
Global emissions grow 50% between now and 2030, and developing countries’ emissions will overtake OECD’s in the
2020s
0
4 000
8 000
12 000
16 000
20 000
1970 1980 1990 2000 2010 2020 2030
Mt o
f CO
2
OECD Transition economies Developing countries

INTERNATIONALENERGY AGENCY
CO2 Increase, 2004-2030
OECD CO2 additions equal to only three quarters of Chinese CO2 rise, but OECD emissions per capita still two times higher in
2030
0
1 000
2 000
3 000
4 000
China OECD
million
ton
nes
NorthAmerica
Pacific
Europe
0
3
6
9
12
15
ton
nes p
er c
ap
ita
2004
2030
2004
2030

INTERNATIONALENERGY AGENCY
World Alternative Policy Scenario

INTERNATIONALENERGY AGENCY
Key Policies in Alternative Scenario for European Union
Power generationRenewable energy directiveCombined Heat and Power directiveExtension of reactor useful lifetime
Transport sectorProlongation and tightening of Voluntary Agreement with car manufacturersBiofuels target
Residential and commercial sectorsEnergy performance in buildings directiveEnergy labelling

INTERNATIONALENERGY AGENCY
Reduction in Oil Demand in the Alternative vs. Reference Scenario,
2030
Oil savings in 2030 would be equivalent to the combined current production of Saudi Arabia and
the UAE
Oil savings = 12.1 mb/d
Transport64%
Other**4%
Industry13%
Power generation
8%
Residential and services
11%
INTERNATIONALENERGY AGENCY
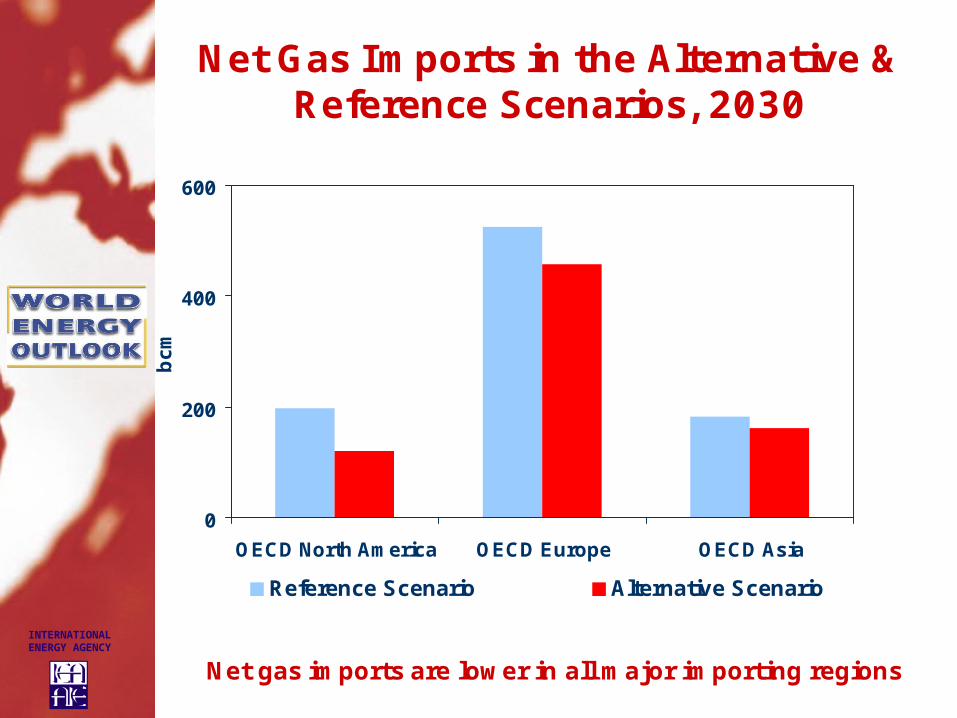
Net Gas Imports in the Alternative & Reference Scenarios, 2030
Net gas imports are lower in all major importing regions
0
200
400
600
OECD North America OECD Europe OECD Asia
bc
m
Reference Scenario Alternative Scenario
INTERNATIONALENERGY AGENCY
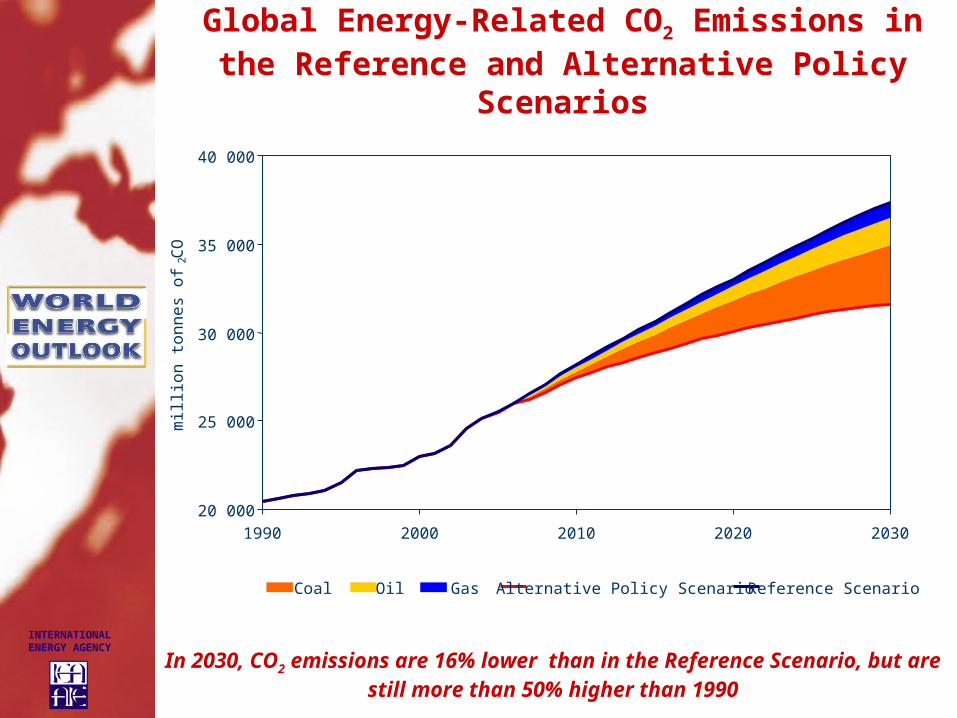
Global Energy-Related CO2 Emissions in the Reference and Alternative Policy
Scenarios
20 000
25 000
30 000
35 000
40 000
1990 2000 2010 2020 2030
mill
ion
to
nn
es
of
CO
2
Coal Oil Gas Alternative Policy Scenario Reference Scenario
In 2030, CO2 emissions are 16% lower than in the Reference Scenario, but are still more than 50% higher than 1990
INTERNATIONALENERGY AGENCY
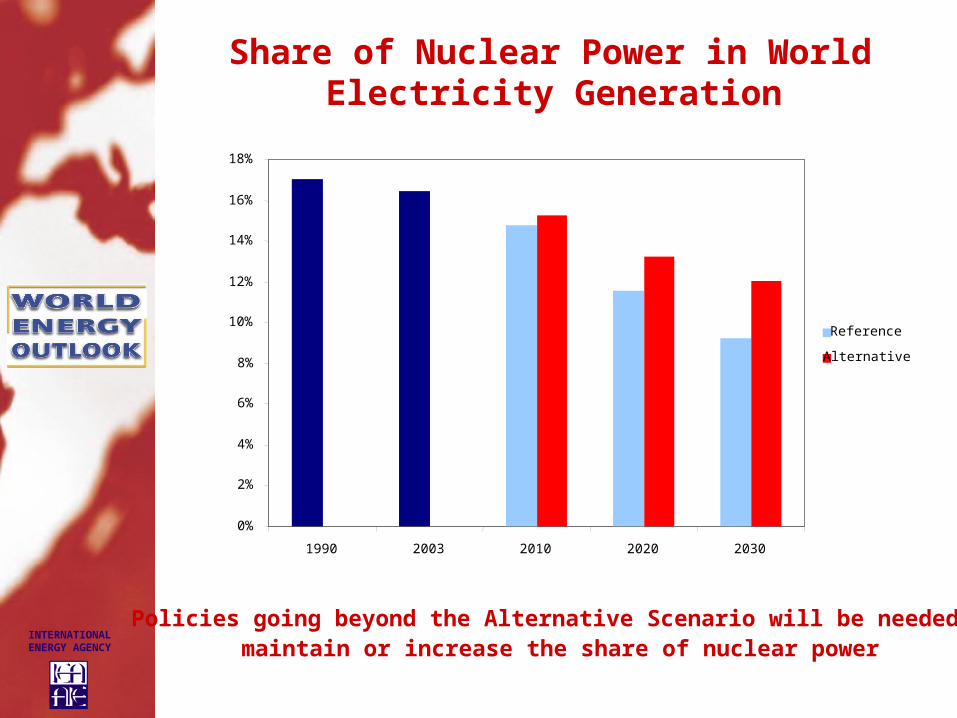
Share of Nuclear Power in World Electricity Generation
Policies going beyond the Alternative Scenario will be needed tomaintain or increase the share of nuclear power
0%
2%
4%
6%
8%
10%
12%
14%
16%
18%
1990 2003 2010 2020 2030
Reference
Alternative

INTERNATIONALENERGY AGENCY
Summary & Conclusions
Projected market trends raise serious concerns Increased risk for energy security Rising environmental concerns
More vigorous policies would curb rate of increase in energy demand and emission significantly
Nuclear power can largely contribute toward meeting these challenges
Urgent and decisive government action needed
INTERNATIONALENERGY AGENCY
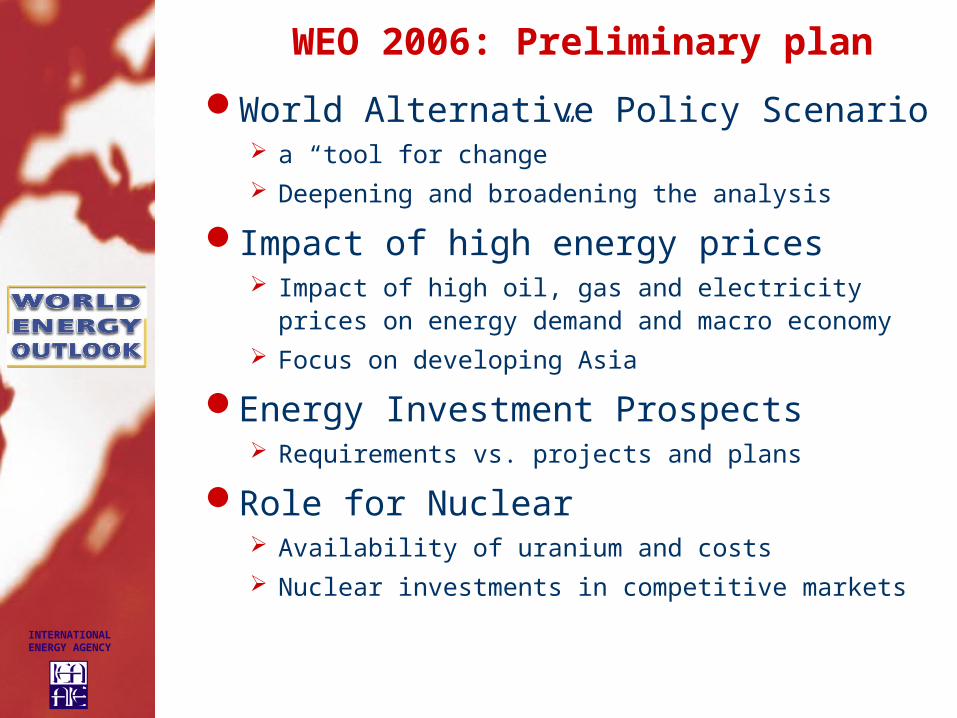
WEO 2006: Preliminary plan
World Alternative Policy Scenario a “tool for change” Deepening and broadening the analysis
Impact of high energy prices Impact of high oil, gas and electricity prices on
energy demand and macro economy Focus on developing Asia
Energy Investment Prospects Requirements vs. projects and plans
Role for Nuclear Availability of uranium and costs Nuclear investments in competitive markets