international basketball migration report 2012 - cies.ch · 2 international basketball migration...
TRANSCRIPT
international Basketball Migration Report 2012
international Basketball Migration Report2012
© Copyright 2012 CIES Observatory. All rights reserved.No part of this publication may be reproduced without the prior written permission of the authors.
2 International Basketball Migration Report 2012
Foreword FIBA
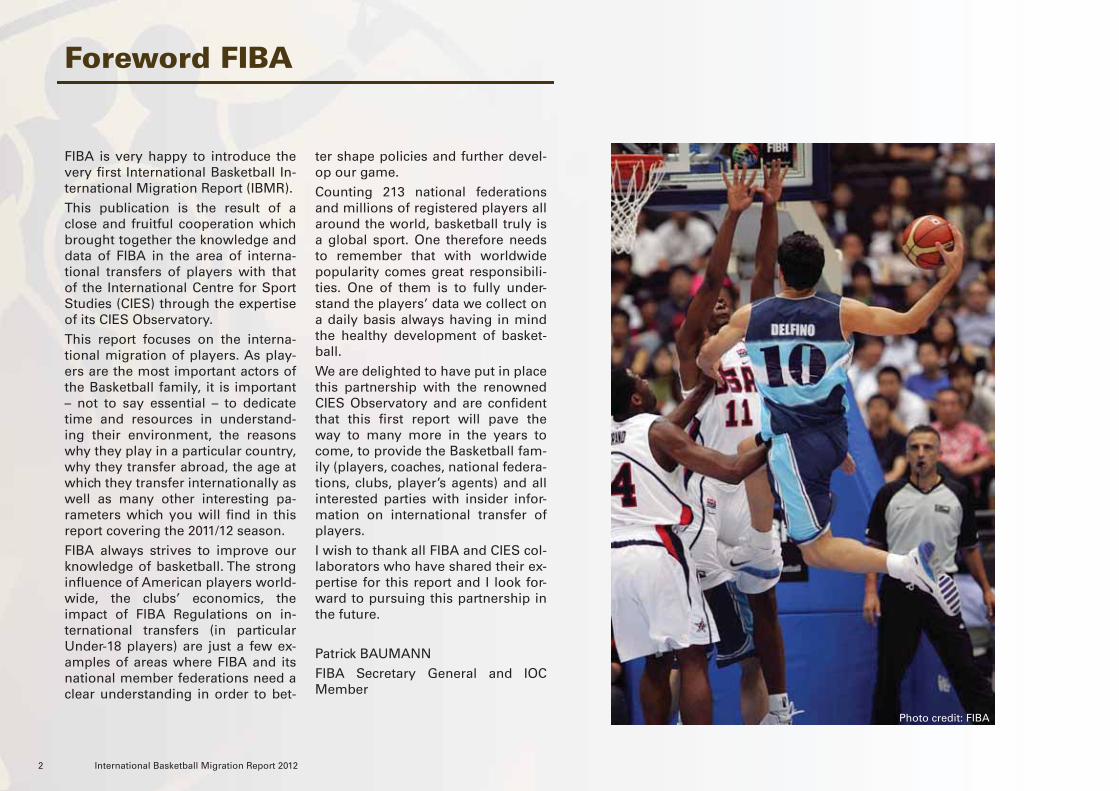
FIBA is very happy to introduce the very first International Basketball In-ternational Migration Report (IBMR).This publication is the result of a close and fruitful cooperation which brought together the knowledge and data of FIBA in the area of interna-tional transfers of players with that of the International Centre for Sport Studies (CIES) through the expertise of its CIES Observatory.This report focuses on the interna-tional migration of players. As play-ers are the most important actors of the Basketball family, it is important – not to say essential – to dedicate time and resources in understand-ing their environment, the reasons why they play in a particular country, why they transfer abroad, the age at which they transfer internationally as well as many other interesting pa-rameters which you will find in this report covering the 2011/12 season.FIBA always strives to improve our knowledge of basketball. The strong influence of American players world-wide, the clubs’ economics, the impact of FIBA Regulations on in-ternational transfers (in particular Under-18 players) are just a few ex-amples of areas where FIBA and its national member federations need a clear understanding in order to bet-
ter shape policies and further devel-op our game.Counting 213 national federations and millions of registered players all around the world, basketball truly is a global sport. One therefore needs to remember that with worldwide popularity comes great responsibili-ties. One of them is to fully under-stand the players’ data we collect on a daily basis always having in mind the healthy development of basket-ball.We are delighted to have put in place this partnership with the renowned CIES Observatory and are confident that this first report will pave the way to many more in the years to come, to provide the Basketball fam-ily (players, coaches, national federa-tions, clubs, player’s agents) and all interested parties with insider infor-mation on international transfer of players. I wish to thank all FIBA and CIES col-laborators who have shared their ex-pertise for this report and I look for-ward to pursuing this partnership in the future.
Patrick BAUMANNFIBA Secretary General and IOC Member
Photo credit: FIBA
3
Foreword CIES
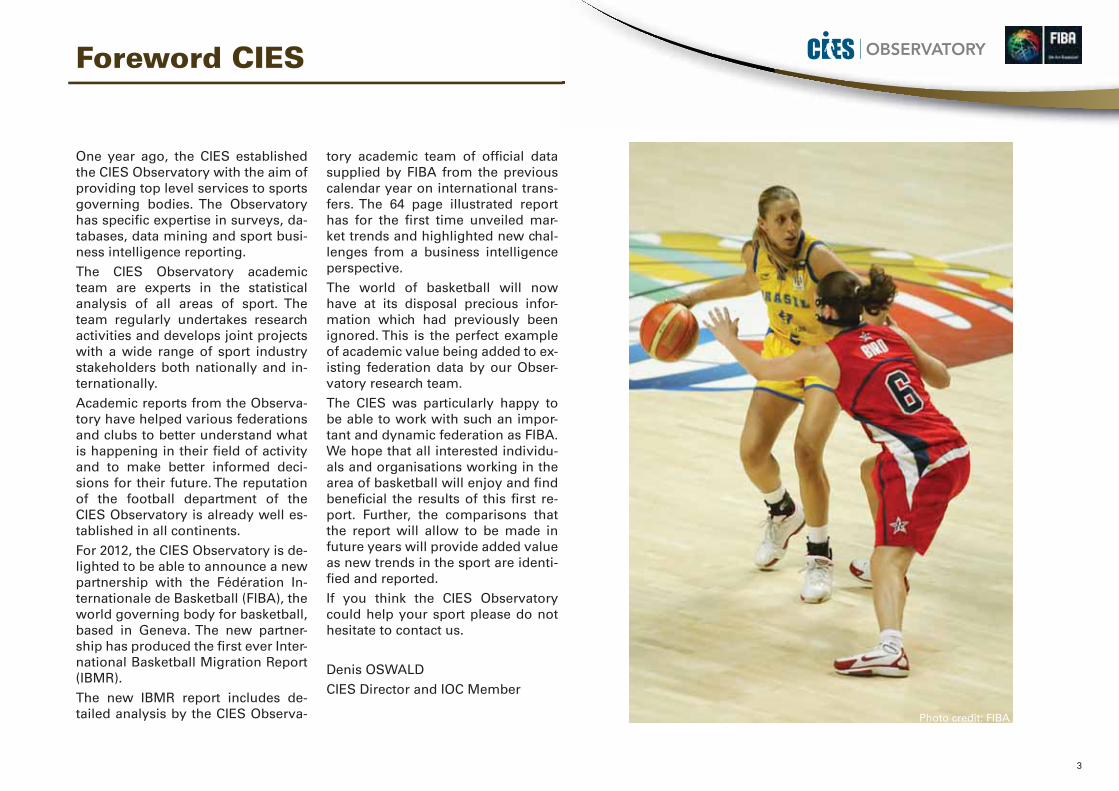
One year ago, the CIES established the CIES Observatory with the aim of providing top level services to sports governing bodies. The Observatory has specific expertise in surveys, da-tabases, data mining and sport busi-ness intelligence reporting. The CIES Observatory academic team are experts in the statistical analysis of all areas of sport. The team regularly undertakes research activities and develops joint projects with a wide range of sport industry stakeholders both nationally and in-ternationally. Academic reports from the Observa-tory have helped various federations and clubs to better understand what is happening in their field of activity and to make better informed deci-sions for their future. The reputation of the football department of the CIES Observatory is already well es-tablished in all continents.For 2012, the CIES Observatory is de-lighted to be able to announce a new partnership with the Fédération In-ternationale de Basketball (FIBA), the world governing body for basketball, based in Geneva. The new partner-ship has produced the first ever Inter-national Basketball Migration Report (IBMR).The new IBMR report includes de-tailed analysis by the CIES Observa-
tory academic team of official data supplied by FIBA from the previous calendar year on international trans-fers. The 64 page illustrated report has for the first time unveiled mar-ket trends and highlighted new chal-lenges from a business intelligence perspective.The world of basketball will now have at its disposal precious infor-mation which had previously been ignored. This is the perfect example of academic value being added to ex-isting federation data by our Obser-vatory research team.The CIES was particularly happy to be able to work with such an impor-tant and dynamic federation as FIBA. We hope that all interested individu-als and organisations working in the area of basketball will enjoy and find beneficial the results of this first re-port. Further, the comparisons that the report will allow to be made in future years will provide added value as new trends in the sport are identi-fied and reported.If you think the CIES Observatory could help your sport please do not hesitate to contact us.
Denis OSWALDCIES Director and IOC Member
Photo credit: FIBA
4 International Basketball Migration Report 2012
Sample and methodology
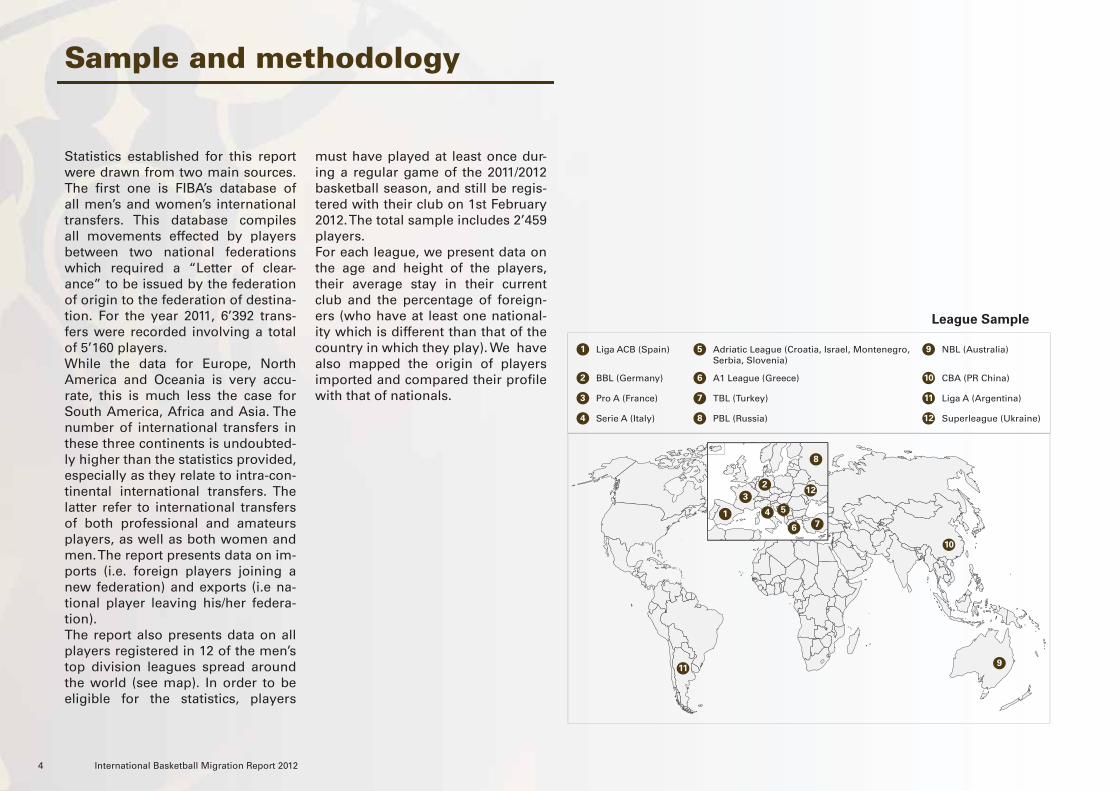
Statistics established for this report were drawn from two main sources. The first one is FIBA’s database of all men’s and women’s international transfers. This database compiles all movements effected by players between two national federations which required a “Letter of clear-ance” to be issued by the federation of origin to the federation of destina-tion. For the year 2011, 6’392 trans-fers were recorded involving a total of 5’160 players. While the data for Europe, North America and Oceania is very accu-rate, this is much less the case for South America, Africa and Asia. The number of international transfers in these three continents is undoubted-ly higher than the statistics provided, especially as they relate to intra-con-tinental international transfers. The latter refer to international transfers of both professional and amateurs players, as well as both women and men. The report presents data on im-ports (i.e. foreign players joining a new federation) and exports (i.e na-tional player leaving his/her federa-tion). The report also presents data on all players registered in 12 of the men’s top division leagues spread around the world (see map). In order to be eligible for the statistics, players
must have played at least once dur-ing a regular game of the 2011/2012 basketball season, and still be regis-tered with their club on 1st February 2012. The total sample includes 2’459 players.For each league, we present data on the age and height of the players, their average stay in their current club and the percentage of foreign-ers (who have at least one national-ity which is different than that of the country in which they play). We have also mapped the origin of players imported and compared their profile with that of nationals.
1
3
4 5
6 7
8
9
10
11
122
Adriatic League (Croatia, Israel, Montenegro,Serbia, Slovenia)
5
A1 League (Greece)6
TBL (Turkey)7
PBL (Russia)8
NBL (Australia)9
CBA (PR China)10
Liga A (Argentina)11
Superleague (Ukraine)12
Pro A (France)3
Serie A (Italy)4
BBL (Germany)2
Liga ACB (Spain)1
League Sample

Mapping Flows
6 International Basketball Migration Report 2012
Imports
Which countries import the most players?
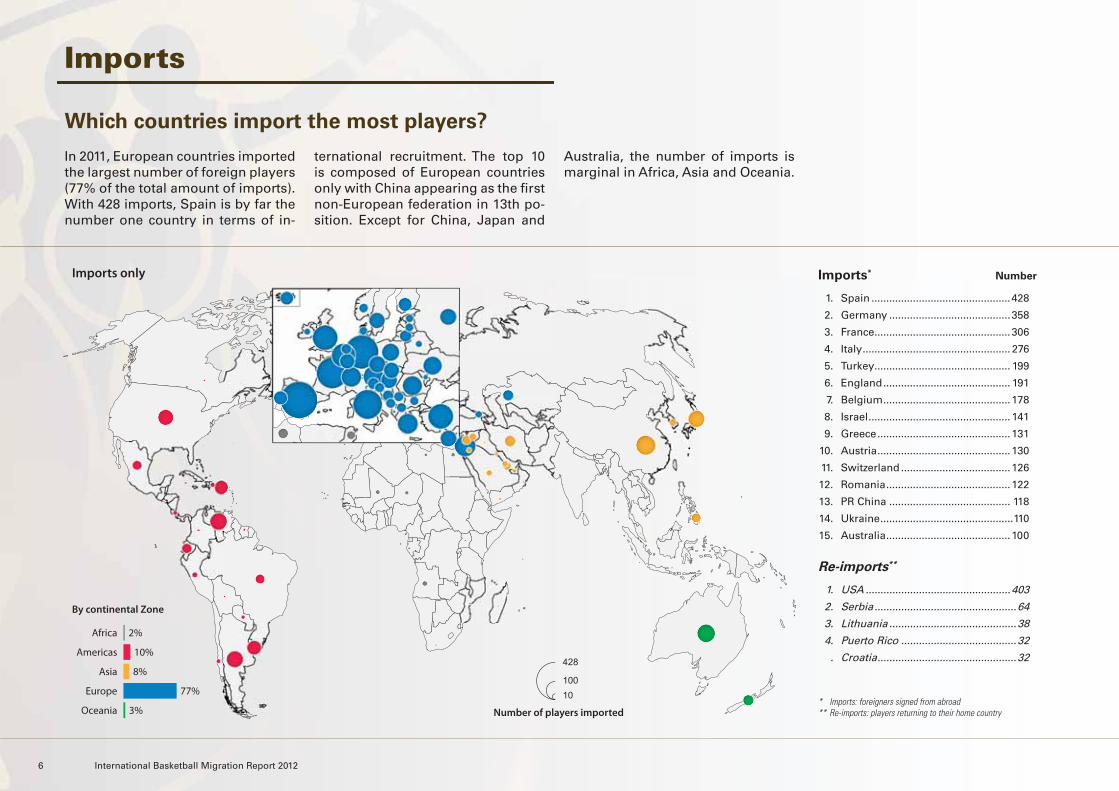
In 2011, European countries imported the largest number of foreign players (77% of the total amount of imports). With 428 imports, Spain is by far the number one country in terms of in-
ternational recruitment. The top 10 is composed of European countries only with China appearing as the first non-European federation in 13th po-sition. Except for China, Japan and
Australia, the number of imports is marginal in Africa, Asia and Oceania.
Imports* Number
1. Spain ...............................................428
2. Germany .........................................358
3. France ..............................................306
4. Italy .................................................. 276
5. Turkey .............................................. 199
6. England ........................................... 191
7. Belgium ...........................................178
8. Israel ................................................ 141
9. Greece .............................................131
10. Austria .............................................130
11. Switzerland .....................................126
12. Romania ..........................................122
13. PR China ......................................... 118
14. Ukraine .............................................110
15. Australia ..........................................100
Re-imports**
1. USA .................................................403
2. Serbia ................................................64
3. Lithuania ...........................................38
4. Puerto Rico .......................................32
. Croatia ...............................................32
Number of players imported
10100
428
77%
8%
10%
2%
3%Oceania
Europe
Asia
Americas
Africa
By continental Zone
Imports only
* Imports: foreigners signed from abroad** Re-imports: players returning to their home country
Mapping Flows 7
Home sweet home: USA players returning back to their country
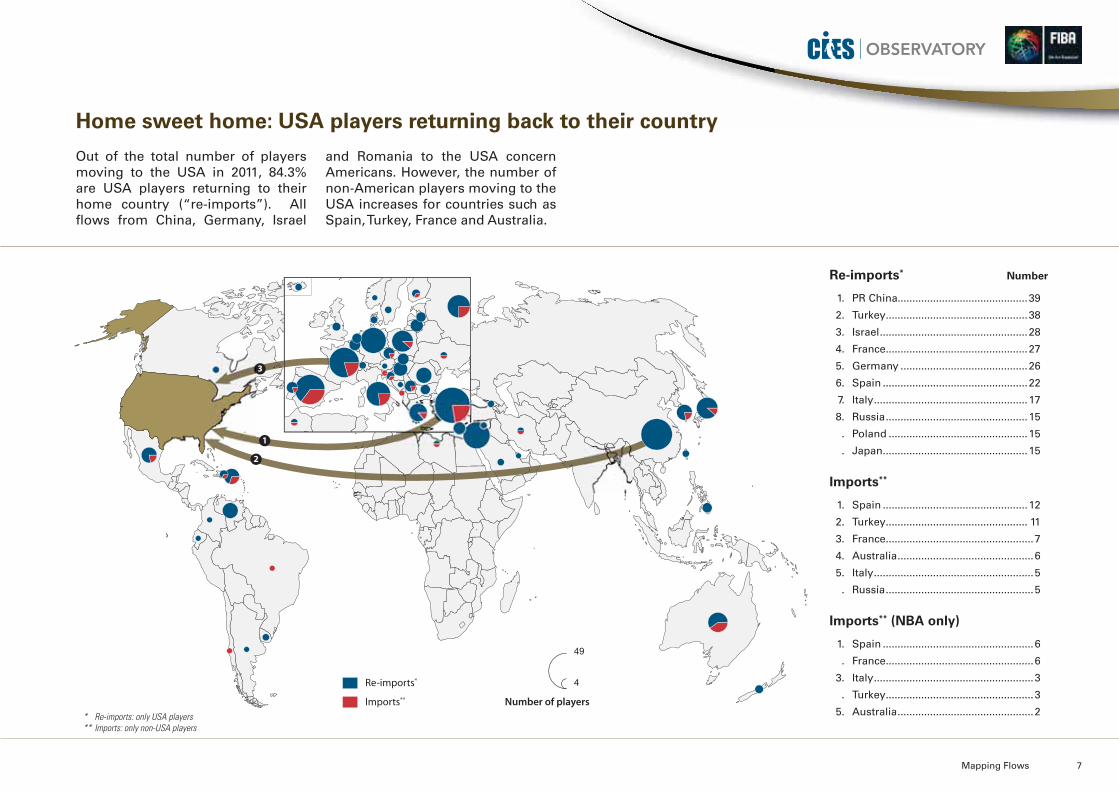
Out of the total number of players moving to the USA in 2011, 84.3% are USA players returning to their home country (“re-imports”). All flows from China, Germany, Israel
and Romania to the USA concern Americans. However, the number of non-American players moving to the USA increases for countries such as Spain, Turkey, France and Australia.
Re-imports* Number
1. PR China............................................39
2. Turkey ................................................38
3. Israel ..................................................28
4. France ................................................27
5. Germany ...........................................26
6. Spain .................................................22
7. Italy ....................................................17
8. Russia ................................................15
. Poland ...............................................15
. Japan .................................................15
Imports**
1. Spain .................................................12
2. Turkey ................................................ 11
3. France ..................................................7
4. Australia ..............................................6
5. Italy ......................................................5
. Russia ..................................................5
Imports** (NBA only)
1. Spain ...................................................6
. France ..................................................6
3. Italy ......................................................3
. Turkey ..................................................3
5. Australia ..............................................2
1
2
3
Number of players
4
49
Re-imports*
Imports**
* Re-imports: only USA players** Imports: only non-USA players
8 International Basketball Migration Report 2012
Exports
USA is by far the biggest exporter
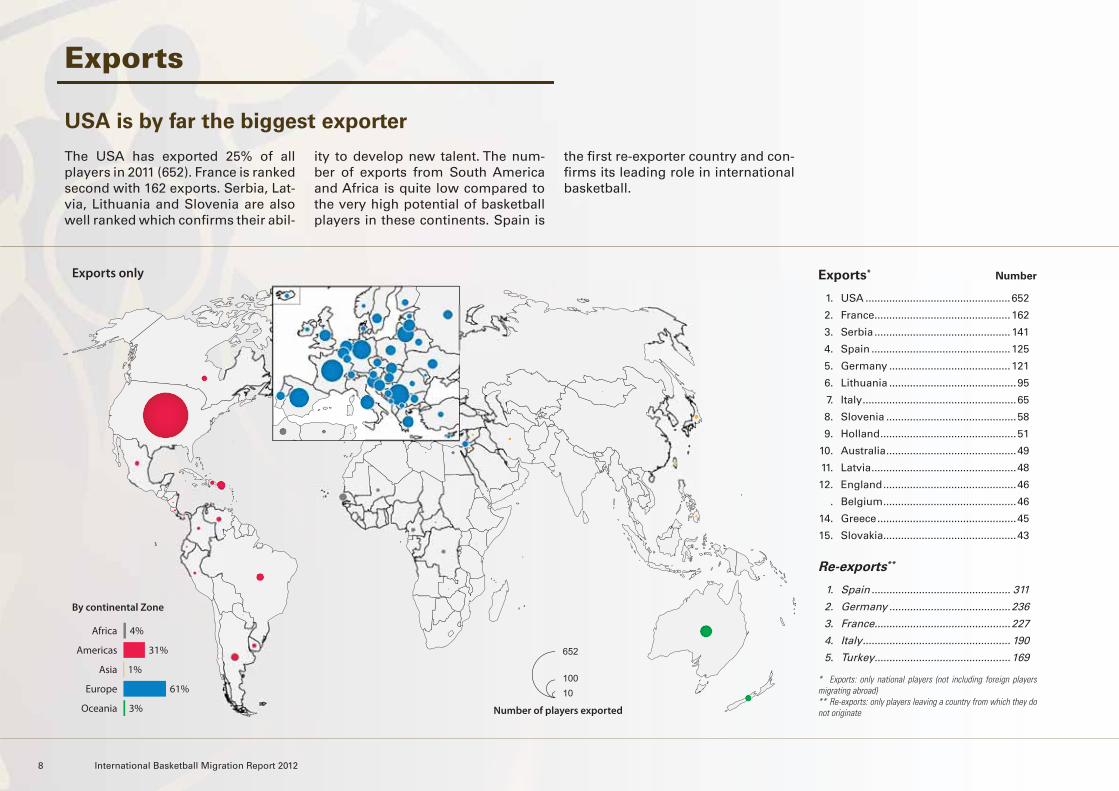
The USA has exported 25% of all players in 2011 (652). France is ranked second with 162 exports. Serbia, Lat-via, Lithuania and Slovenia are also well ranked which confirms their abil-
ity to develop new talent. The num-ber of exports from South America and Africa is quite low compared to the very high potential of basketball players in these continents. Spain is
the first re-exporter country and con-firms its leading role in international basketball.
Exports* Number
1. USA .................................................652
2. France ..............................................162
3. Serbia .............................................. 141
4. Spain ...............................................125
5. Germany .........................................121
6. Lithuania ...........................................95
7. Italy ....................................................65
8. Slovenia ............................................58
9. Holland ..............................................51
10. Australia ............................................49
11. Latvia .................................................48
12. England .............................................46
. Belgium .............................................46
14. Greece ...............................................45
15. Slovakia .............................................43
Re-exports**
1. Spain ............................................... 311
2. Germany .........................................236
3. France ..............................................227
4. Italy .................................................. 190
5. Turkey ..............................................169
Number of players exported
10100
652
61%
1%
31%
4%
3%Oceania
Europe
Asia
Americas
Africa
By continental Zone
Exports only
* Exports: only national players (not including foreign players migrating abroad)** Re-exports: only players leaving a country from which they do not originate
Mapping Flows 9
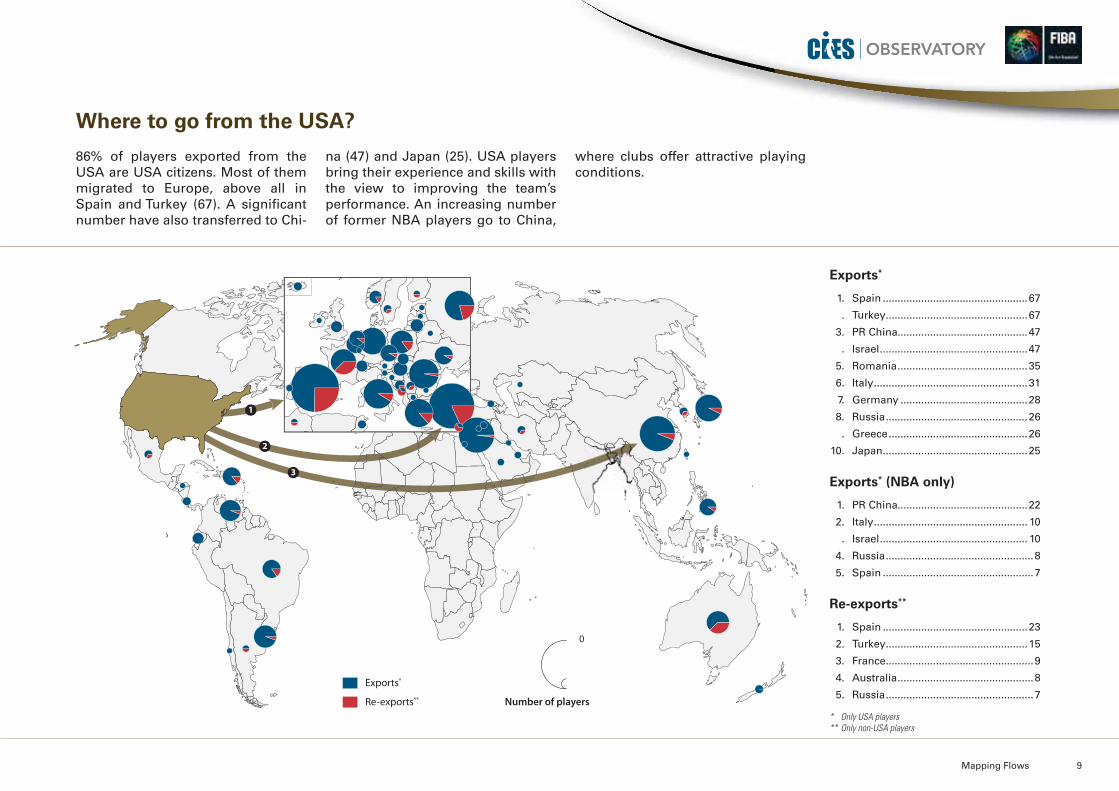
Where to go from the USA?
86% of players exported from the USA are USA citizens. Most of them migrated to Europe, above all in Spain and Turkey (67). A significant number have also transferred to Chi-
na (47) and Japan (25). USA players bring their experience and skills with the view to improving the team’s performance. An increasing number of former NBA players go to China,
where clubs offer attractive playing conditions.
Exports*
1. Spain .................................................67
. Turkey ................................................67
3. PR China............................................47
. Israel ..................................................47
5. Romania ............................................35
6. Italy ....................................................31
7. Germany ...........................................28
8. Russia ................................................26
. Greece ...............................................26
10. Japan .................................................25
Exports* (NBA only)
1. PR China............................................22
2. Italy .................................................... 10
. Israel .................................................. 10
4. Russia ..................................................8
5. Spain ...................................................7
Re-exports**
1. Spain .................................................23
2. Turkey ................................................15
3. France ..................................................9
4. Australia ..............................................8
5. Russia ..................................................7
1
2
3
Number of players
0
Exports*
Re-exports**
* Only USA players** Only non-USA players
10 International Basketball Migration Report 2012
USA Leagues
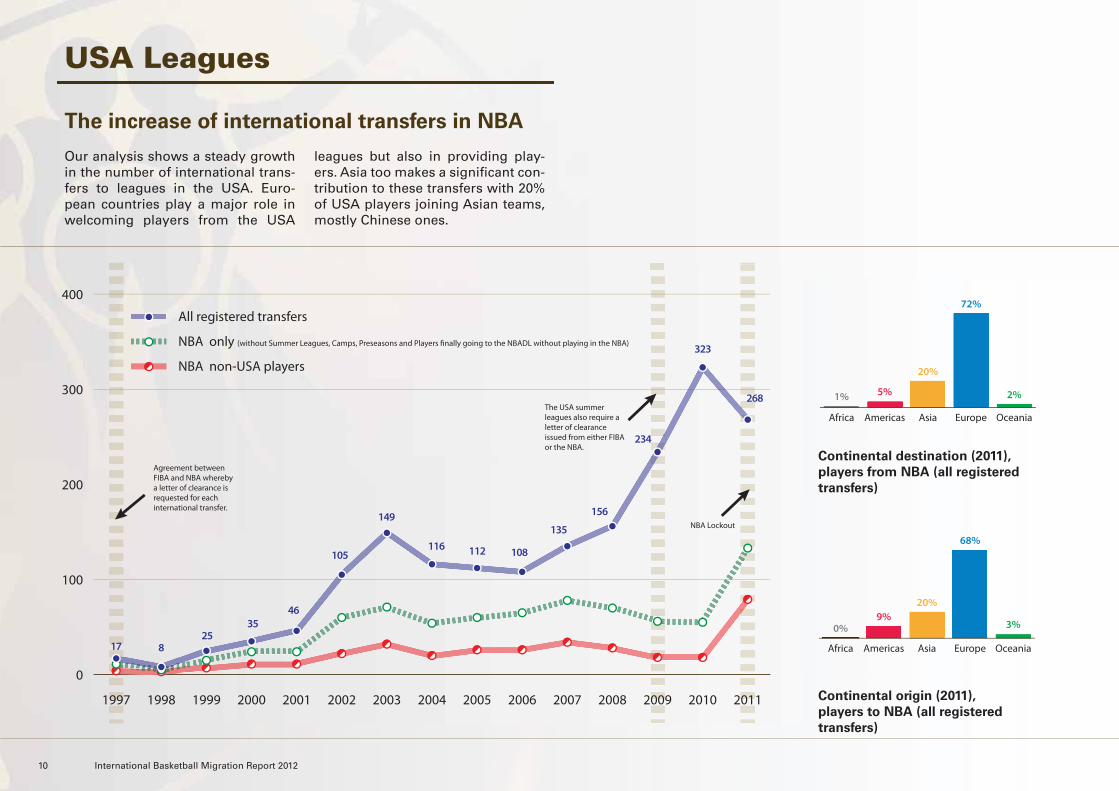
The increase of international transfers in NBA
Our analysis shows a steady growth in the number of international trans-fers to leagues in the USA. Euro-pean countries play a major role in welcoming players from the USA
leagues but also in providing play-ers. Asia too makes a significant con-tribution to these transfers with 20% of USA players joining Asian teams, mostly Chinese ones.
Agreement between FIBA and NBA whereby a letter of clearance is requested for each international transfer.
The USA summer leagues also require a letter of clearance issued from either FIBA or the NBA.
NBA Lockout
0
100
200
300
400
201120102009200820072006200520042003200220012000199919981997
All registered transfers
NBA only (without Summer Leagues, Camps, Preseasons and Players finally going to the NBADL without playing in the NBA)
NBA non-USA players
17 825
3546
105
149
116 112 108
135
156
234
323
268
OceaniaEuropeAsiaAmericasAfrica
2%
72%
20%
5%1%
OceaniaEuropeAsiaAmericasAfrica
3%
68%
20%9%
0%
Continental destination (2011),
players from NBA (all registered
transfers)
Continental origin (2011),
players to NBA (all registered
transfers)
Mapping Flows 11
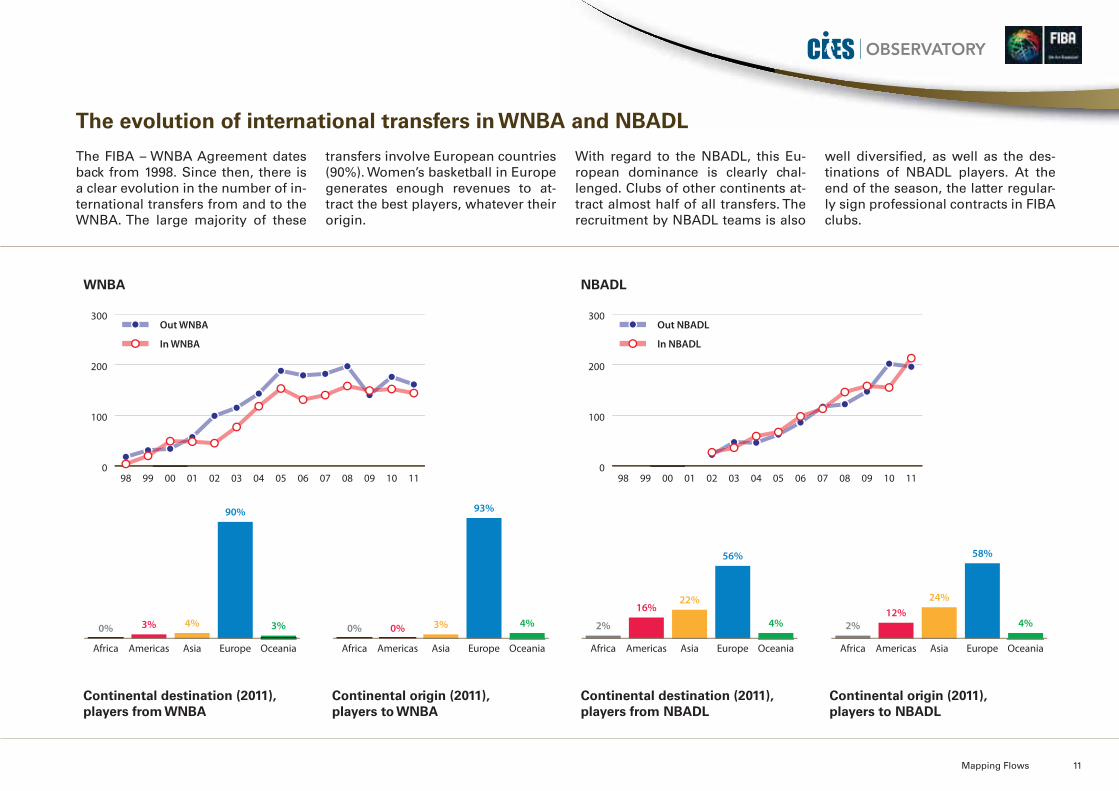
The evolution of international transfers in WNBA and NBADL
The FIBA – WNBA Agreement dates back from 1998. Since then, there is a clear evolution in the number of in-ternational transfers from and to the WNBA. The large majority of these
transfers involve European countries (90%). Women’s basketball in Europe generates enough revenues to at-tract the best players, whatever their origin.
With regard to the NBADL, this Eu-ropean dominance is clearly chal-lenged. Clubs of other continents at-tract almost half of all transfers. The recruitment by NBADL teams is also
well diversified, as well as the des-tinations of NBADL players. At the end of the season, the latter regular-ly sign professional contracts in FIBA clubs.
0
100
200
300
1110090807060504030201009998
Out WNBA
In WNBA
0
100
200
300
1110090807060504030201009998
Out NBADL
In NBADL
OceaniaEuropeAsiaAmericasAfrica
3%
90%
4%3%0%
OceaniaEuropeAsiaAmericasAfrica
4%
93%
3%0%0%
OceaniaEuropeAsiaAmericasAfrica
4%
56%
22%16%
2%
OceaniaEuropeAsiaAmericasAfrica
4%
58%
24%12%
2%
WNBA NBADL
Continental destination (2011),
players from WNBA
Continental origin (2011),
players to WNBA
Continental destination (2011),
players from NBADL
Continental origin (2011),
players to NBADL
12 International Basketball Migration Report 2012
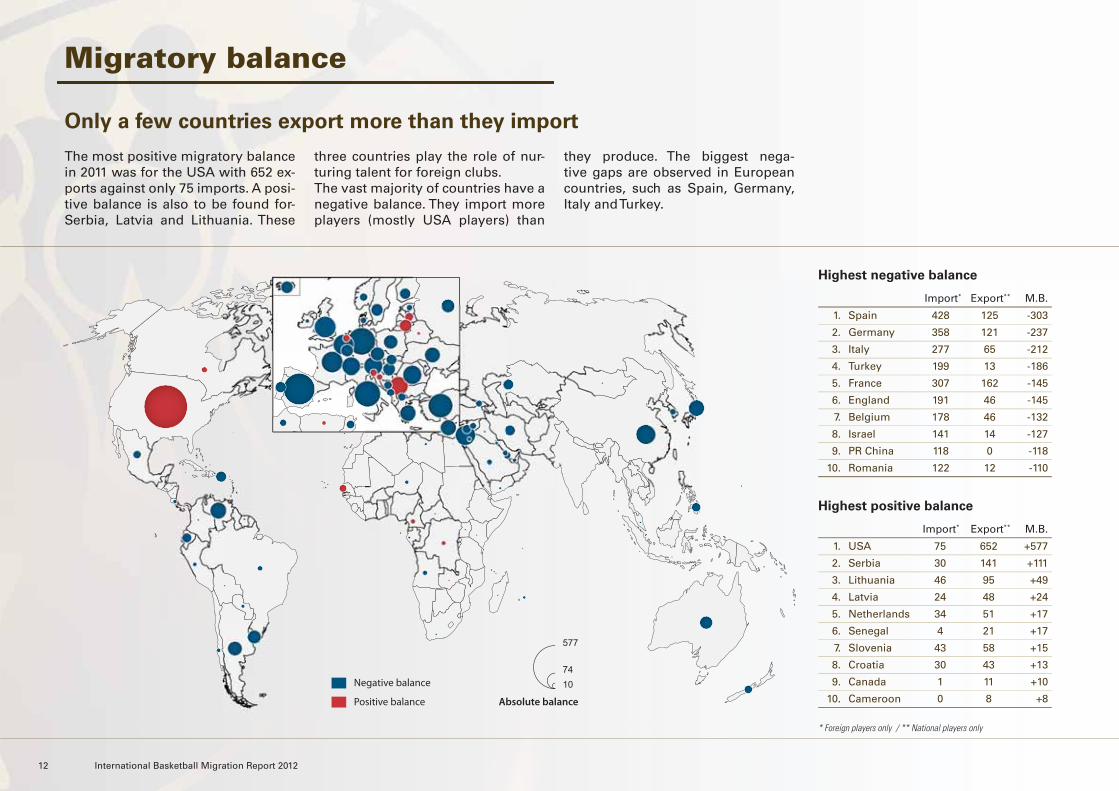
Migratory balance
Only a few countries export more than they import
The most positive migratory balance in 2011 was for the USA with 652 ex-ports against only 75 imports. A posi-tive balance is also to be found for-Serbia, Latvia and Lithuania. These
three countries play the role of nur-turing talent for foreign clubs. The vast majority of countries have a negative balance. They import more players (mostly USA players) than
they produce. The biggest nega-tive gaps are observed in European countries, such as Spain, Germany, Italy and Turkey.
Highest negative balance
Import* Export** M.B.
1. Spain 428 125 -303
2. Germany 358 121 -237
3. Italy 277 65 -212
4. Turkey 199 13 -186
5. France 307 162 -145
6. England 191 46 -145
7. Belgium 178 46 -132
8. Israel 141 14 -127
9. PR China 118 0 -118
10. Romania 122 12 -110
Absolute balance
1074
577
Negative balance
Positive balance
Highest positive balance
Import* Export** M.B.
1. USA 75 652 +577
2. Serbia 30 141 +111
3. Lithuania 46 95 +49
4. Latvia 24 48 +24
5. Netherlands 34 51 +17
6. Senegal 4 21 +17
7. Slovenia 43 58 +15
8. Croatia 30 43 +13
9. Canada 1 11 +10
10. Cameroon 0 8 +8
* Foreign players only / ** National players only
Mapping Flows 13
22
24
26
28
30
TotalAfricaEuropeAmericasOceaniaAsia
25.2025.50
25.09
27.66
24.23
25.41
22
24
26
28
30
TotalEuropeOceaniaAfricaAsiaAmericas
26.3826.61
25.98
28.0228.03
26.68
0% 3% 6% 9% 12% 15%
<13131415161718192021222324252627282930313233343536373839
>40 0.4
0.1
0.4
0.5
0.4
0.9
1.6
2.1
2.72
3.7
5.44
6.8
7.4
8.6.
9.7
10.2
11.22
10.3
5.9
3.0
2.55
1.9
1.9
0.7
0.7
0.4
0.2
0.2
0.1
% of players
per age of migration
Age of exports**
by continental Zone
Age of imports*
by continental Zone
Age of migration
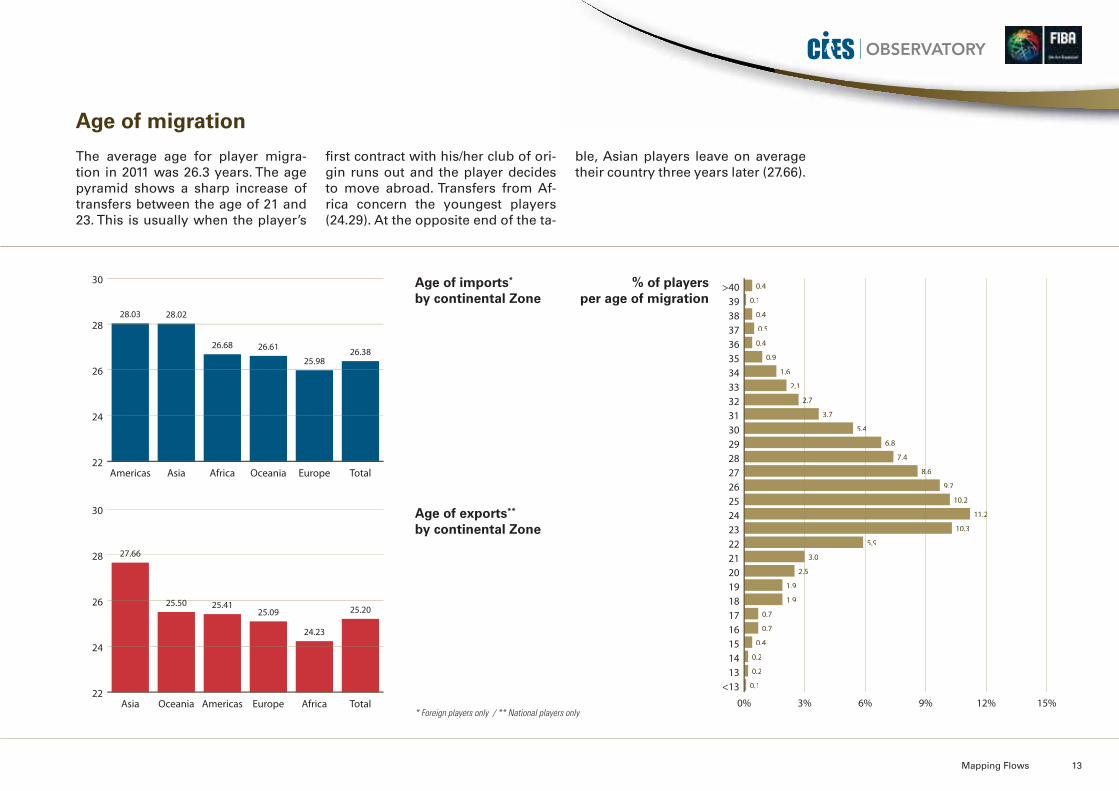
The average age for player migra-tion in 2011 was 26.3 years. The age pyramid shows a sharp increase of transfers between the age of 21 and 23. This is usually when the player’s
first contract with his/her club of ori-gin runs out and the player decides to move abroad. Transfers from Af-rica concern the youngest players (24.29). At the opposite end of the ta-
ble, Asian players leave on average their country three years later (27.66).
* Foreign players only / ** National players only
14 International Basketball Migration Report 2012
Networks
What are the most important migration paths?
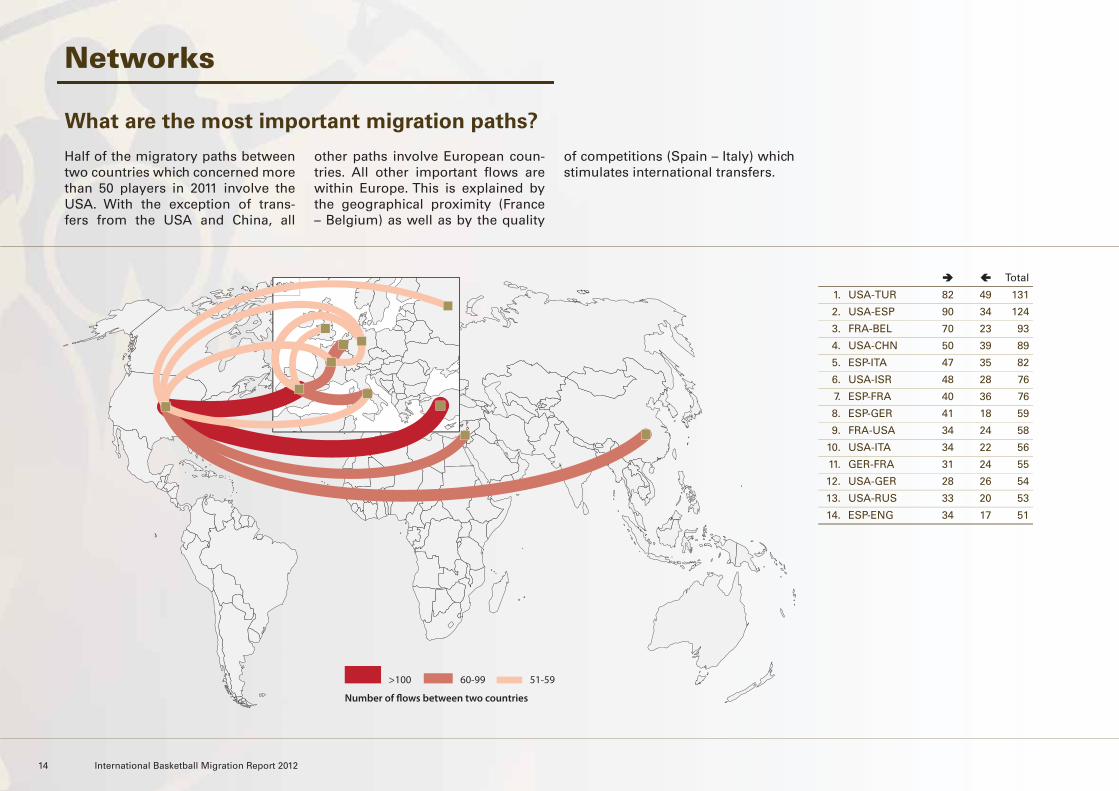
Half of the migratory paths between two countries which concerned more than 50 players in 2011 involve the USA. With the exception of trans-fers from the USA and China, all
other paths involve European coun-tries. All other important flows are within Europe. This is explained by the geographical proximity (France – Belgium) as well as by the quality
of competitions (Spain – Italy) which stimulates international transfers.
Total
1. USA-TUR 82 49 131
2. USA-ESP 90 34 124
3. FRA-BEL 70 23 93
4. USA-CHN 50 39 89
5. ESP-ITA 47 35 82
6. USA-ISR 48 28 76
7. ESP-FRA 40 36 76
8. ESP-GER 41 18 59
9. FRA-USA 34 24 58
10. USA-ITA 34 22 56
11. GER-FRA 31 24 55
12. USA-GER 28 26 54
13. USA-RUS 33 20 53
14. ESP-ENG 34 17 51
>100 60-99 51-59
Number of flows between two countries

League Profile

16 International Basketball Migration Report 2012
LIGA ACB(Spain) The ACB League is one of the most competitive
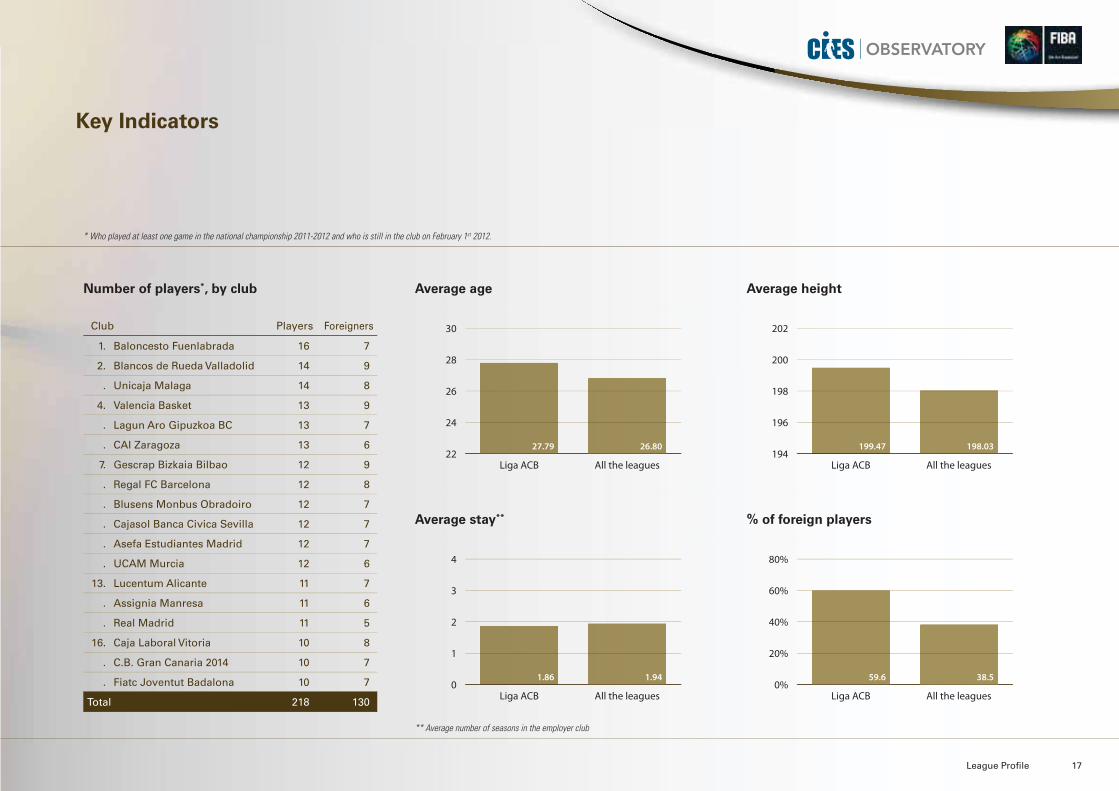
basketball leagues in the world. This is clearly illustrated by at least three demographic in-dicators. Firstly, clubs are composed of expe-rienced players. Their average age is the sec-ond highest of all the leagues studied in this report. Secondly, the proportion of foreigners is very high (59.6%). Finally, players are among the tallest of all leagues covered (on average 199cm, just behind Russia).
In a roster of 12 players, ACB league clubs must have at least 5 who - irrespective of their na-tionality - have been registered with a Spanishclub during three seasons between the youthand senior categories. Moreover, the number of foreign players who were not trained by Spanish clubs is limited to two. However, this limit does not apply to players coming from acountry affiliated to FIBA Europe.
League Profile 17
Key Indicators
Club Players Foreigners
1. Baloncesto Fuenlabrada 16 7
2. Blancos de Rueda Valladolid 14 9
. Unicaja Malaga 14 8
4. Valencia Basket 13 9
. Lagun Aro Gipuzkoa BC 13 7
. CAI Zaragoza 13 6
7. Gescrap Bizkaia Bilbao 12 9
. Regal FC Barcelona 12 8
. Blusens Monbus Obradoiro 12 7
. Cajasol Banca Civica Sevilla 12 7
. Asefa Estudiantes Madrid 12 7
. UCAM Murcia 12 6
13. Lucentum Alicante 11 7
. Assignia Manresa 11 6
. Real Madrid 11 5
16. Caja Laboral Vitoria 10 8
. C.B. Gran Canaria 2014 10 7
. Fiatc Joventut Badalona 10 7
Total 218 130
Average age
Average stay**
Average height
% of foreign players
22
24
26
28
30
All the leaguesLiga ACB
26.8027.79194
196
198
200
202
All the leaguesLiga ACB
198.03199.47
0
1
2
3
4
All the leaguesLiga ACB
1.941.860%
20%
40%
60%
80%
All the leaguesLiga ACB
38.559.6
Number of players*, by club
* Who played at least one game in the national championship 2011-2012 and who is still in the club on February 1st 2012.
** Average number of seasons in the employer club
18 International Basketball Migration Report 2012
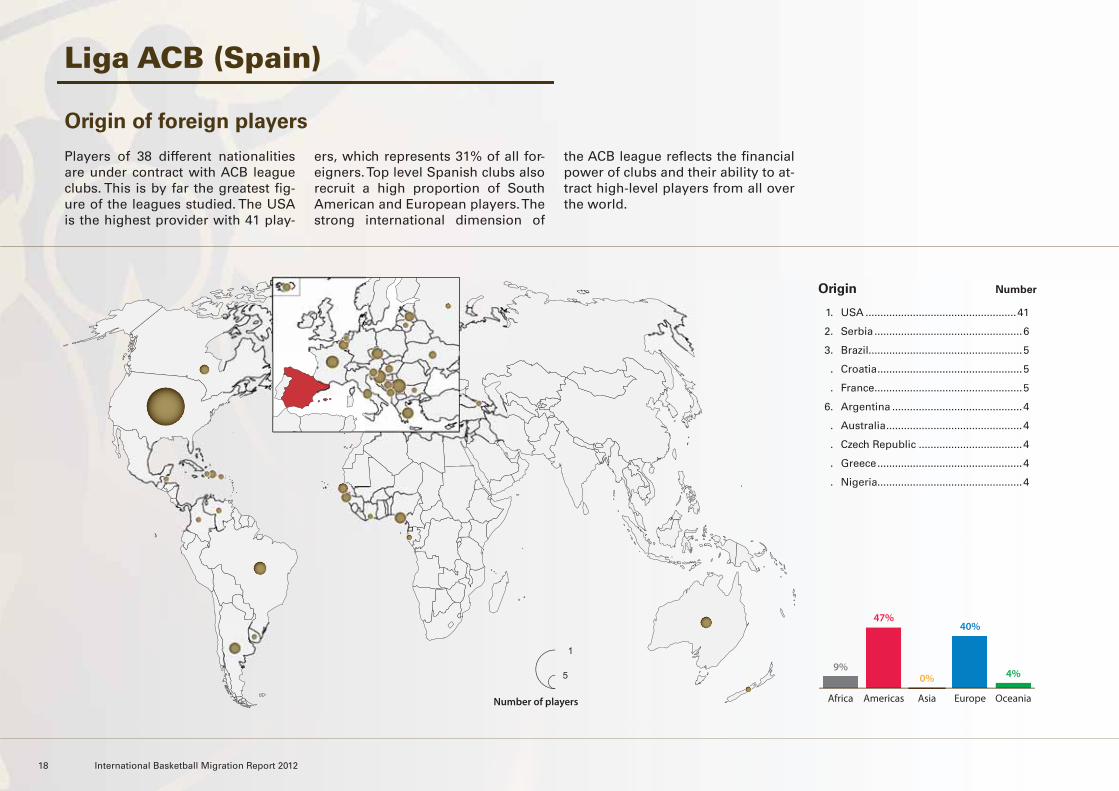
1. USA ...................................................41
2. Serbia ..................................................6
3. Brazil....................................................5
. Croatia .................................................5
. France ..................................................5
6. Argentina ............................................4
. Australia ..............................................4
. Czech Republic ...................................4
. Greece .................................................4
. Nigeria.................................................4
Liga ACB (Spain)
Origin of foreign players
Players of 38 different nationalities are under contract with ACB league clubs. This is by far the greatest fig-ure of the leagues studied. The USA is the highest provider with 41 play-
ers, which represents 31% of all for-eigners. Top level Spanish clubs also recruit a high proportion of South American and European players. The strong international dimension of
the ACB league reflects the financial power of clubs and their ability to at-tract high-level players from all over the world.
Origin Number
OceaniaEuropeAsiaAmericasAfrica
4%
40%
0%
47%
9%
Number of players
5
1
League Profile 19
Nationals Foreigners
Av. age 27.32 28.11
Av. height 198.13 200.38
Av. stay 2.23 1.61
Av. min/game 15.10 19.62
Age
Year of recruitment
Height
Number of minutes per game
National vs foreign players
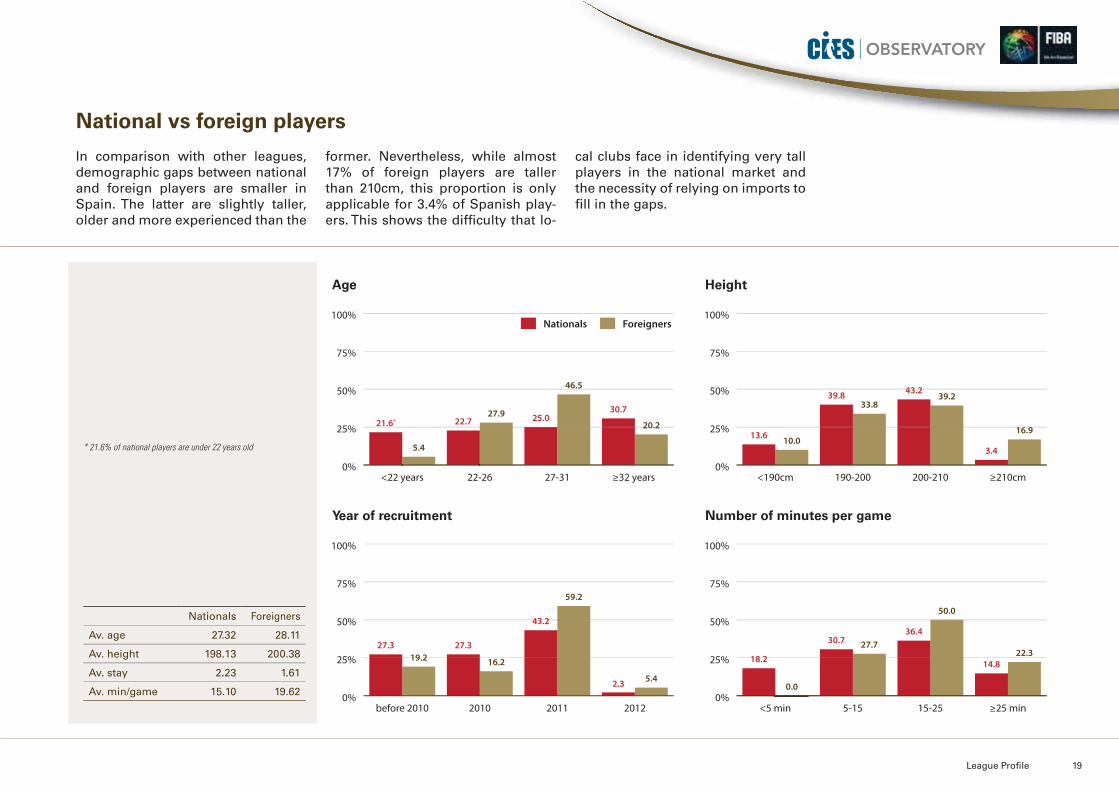
In comparison with other leagues, demographic gaps between national and foreign players are smaller in Spain. The latter are slightly taller, older and more experienced than the
former. Nevertheless, while almost 17% of foreign players are taller than 210cm, this proportion is only applicable for 3.4% of Spanish play-ers. This shows the difficulty that lo-
cal clubs face in identifying very tall players in the national market and the necessity of relying on imports to fill in the gaps.
0%
25%
50%
75%
100%
21.6*
30.7
46.5
25.027.922.7
5.4
20.2
≥32 years 27-3122-26<22 years
Nationals Foreigners
0%
25%
50%
75%
100%
13.6
3.4
39.243.2
33.839.8
10.016.9
≥210cm200-210190-200<190cm
0%
25%
50%
75%
100%
27.3
2.3
59.2
43.2
16.2
27.319.2
5.4
201220112010before 20100%
25%
50%
75%
100%
18.2 14.8
50.0
36.427.730.7
0.0
22.3
≥25 min15-255-15<5 min
* 21.6% of national players are under 22 years old

20 International Basketball Migration Report 2012
BasketballBundesliga(Germany)
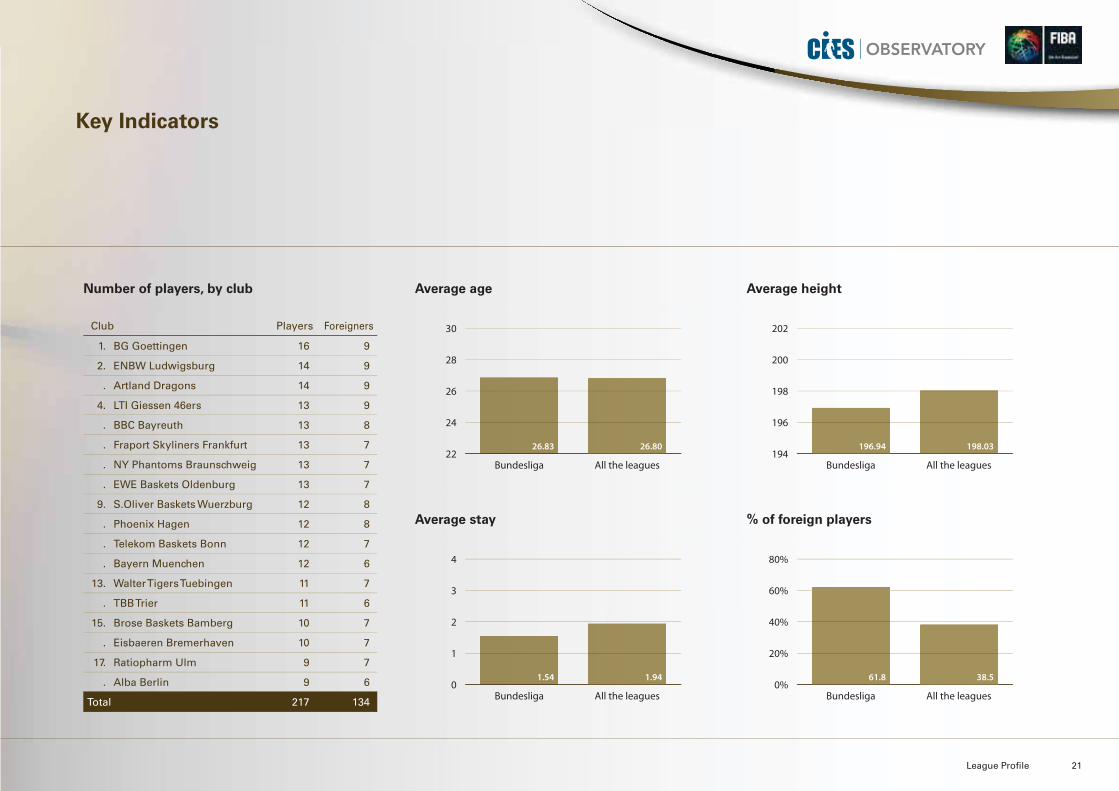
Among the leagues surveyed, the BBL League is the most dependent on foreign players (61.8% of all squad members). This is related to the fact that the only restriction is that teams must have a minimum of 5 national players outof 12 on the match sheet.
The high number of expatriates goes hand inhand with very high levels of player turnover. On average, squad members have been with their team for only 1.54 seasons. This is the lowest figure among leagues covered in this report.
Germany is the second highest re-exporting country of players (see p. 8), which shows the importance of this nation to the international basketball player transfer market.
League Profile 21
Key Indicators
Club Players Foreigners
1. BG Goettingen 16 9
2. ENBW Ludwigsburg 14 9
. Artland Dragons 14 9
4. LTI Giessen 46ers 13 9
. BBC Bayreuth 13 8
. Fraport Skyliners Frankfurt 13 7
. NY Phantoms Braunschweig 13 7
. EWE Baskets Oldenburg 13 7
9. S.Oliver Baskets Wuerzburg 12 8
. Phoenix Hagen 12 8
. Telekom Baskets Bonn 12 7
. Bayern Muenchen 12 6
13. Walter Tigers Tuebingen 11 7
. TBB Trier 11 6
15. Brose Baskets Bamberg 10 7
. Eisbaeren Bremerhaven 10 7
17. Ratiopharm Ulm 9 7
. Alba Berlin 9 6
Total 217 134
Average age
Average stay
Average height
% of foreign players
22
24
26
28
30
All the leaguesBundesliga
26.8026.83194
196
198
200
202
All the leaguesBundesliga
198.03196.94
0
1
2
3
4
All the leaguesBundesliga
1.941.540%
20%
40%
60%
80%
All the leaguesBundesliga
38.561.8
Number of players, by club
22 International Basketball Migration Report 2012
1. USA ................................................. 104
2. Serbia ..................................................7
3. Bosnia Herzegovina ...........................5
. Lithuania .............................................5
5. Nigeria.................................................3
6. Canada ................................................2
Basketball Bundesliga
Origin of foreign players
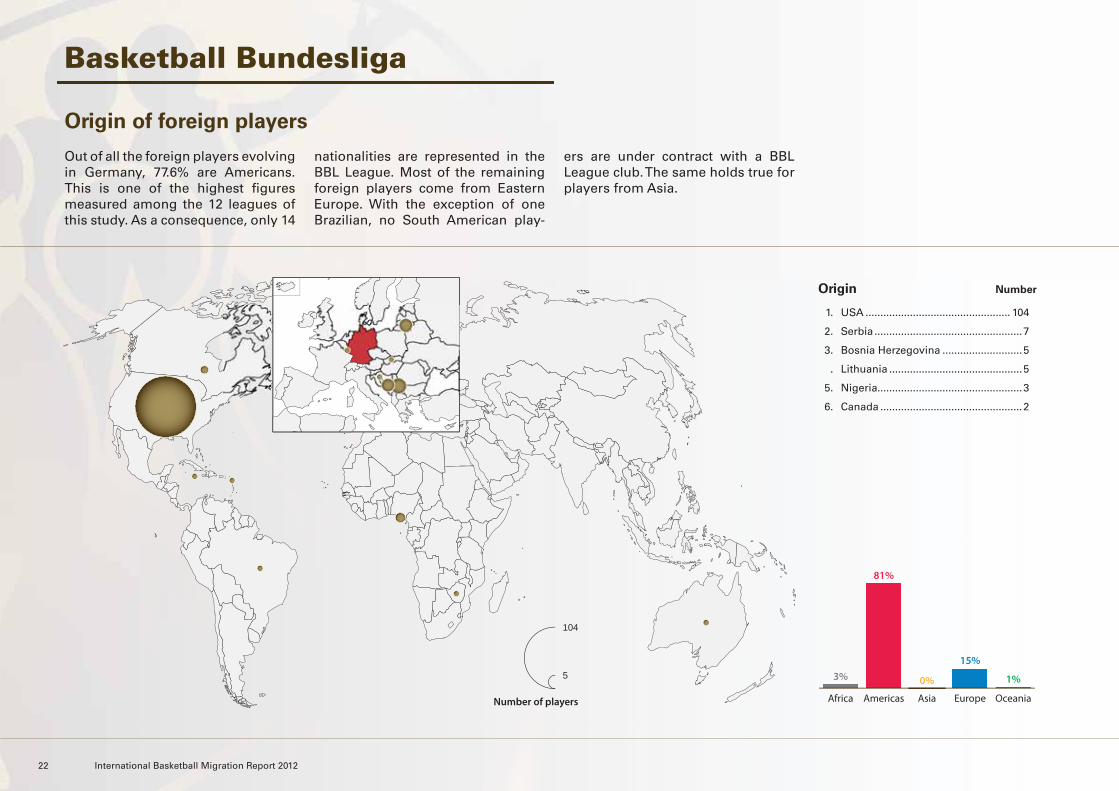
Out of all the foreign players evolving in Germany, 77.6% are Americans. This is one of the highest figures measured among the 12 leagues of this study. As a consequence, only 14
nationalities are represented in the BBL League. Most of the remaining foreign players come from Eastern Europe. With the exception of one Brazilian, no South American play-
ers are under contract with a BBL League club. The same holds true for players from Asia.
Origin Number
OceaniaEuropeAsiaAmericasAfrica
1%
15%
0%
81%
3%
Number of players
104
5
League Profile 23
Nationals Foreigners
Av. age 24.89 28.02
Av. height 198.13 196.21
Av. stay 1.80 1.38
Av. min/game 10.84 23.47
Age
Year of recruitment
Height
Number of minutes per game
National vs foreign players
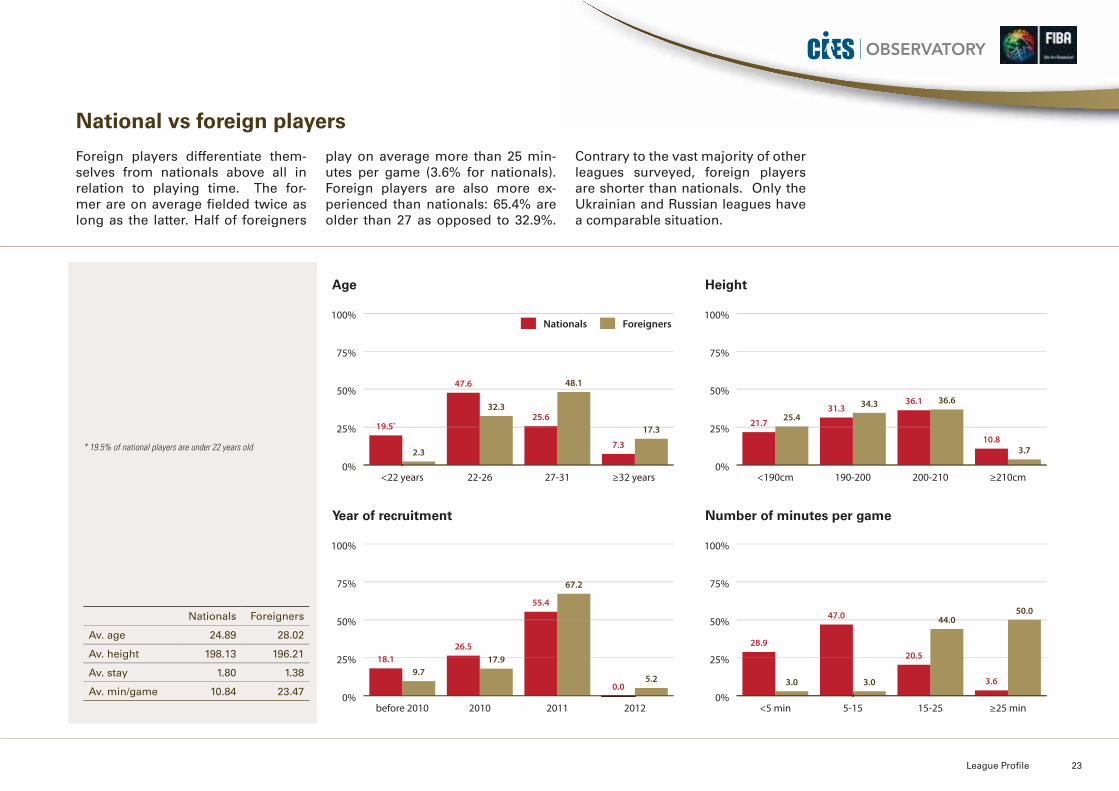
Foreign players differentiate them-selves from nationals above all in relation to playing time. The for-mer are on average fielded twice as long as the latter. Half of foreigners
play on average more than 25 min-utes per game (3.6% for nationals). Foreign players are also more ex-perienced than nationals: 65.4% are older than 27 as opposed to 32.9%.
Contrary to the vast majority of other leagues surveyed, foreign players are shorter than nationals. Only the Ukrainian and Russian leagues have a comparable situation.
0%
25%
50%
75%
100%
19.5*
7.3
48.1
25.632.3
47.6
2.3
17.3
≥32 years 27-3122-26<22 years
Nationals Foreigners
0%
25%
50%
75%
100%
21.7
10.8
36.636.134.331.325.4
3.7
≥210cm200-210190-200<190cm
0%
25%
50%
75%
100%
18.1
0.0
67.2
55.4
17.926.5
9.75.2
201220112010before 20100%
25%
50%
75%
100%
28.9
3.6
44.0
20.5
3.0
47.0
3.0
50.0
≥25 min15-255-15<5 min
* 19.5% of national players are under 22 years old

24 International Basketball Migration Report 2012
Pro A(France)
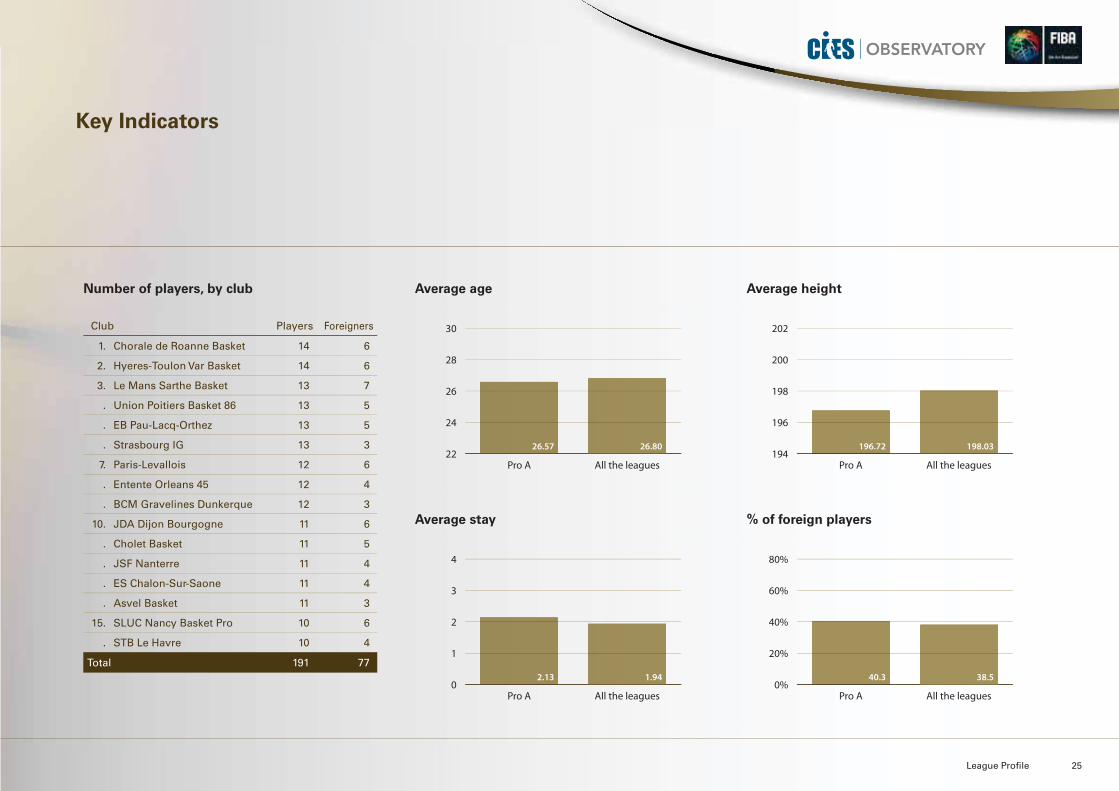
French Pro A clubs are, on average, composed of younger players than in the other leagues covered. This is particularly true for national players. This reflects the importance France places on the training, development and pro-motion of local players.
Since the 2010/11 season, French clubs are required to employ at least four “locally-trainedplayers”. These players must have participated for four years, between the age of 12 and21, in a competition organised by the French Basketball Federation.
The average stay of players in their current club is also greater in France than in the majority of other leagues (2.13 seasons).
League Profile 25
Key Indicators
Club Players Foreigners
1. Chorale de Roanne Basket 14 6
2. Hyeres-Toulon Var Basket 14 6
3. Le Mans Sarthe Basket 13 7
. Union Poitiers Basket 86 13 5
. EB Pau-Lacq-Orthez 13 5
. Strasbourg IG 13 3
7. Paris-Levallois 12 6
. Entente Orleans 45 12 4
. BCM Gravelines Dunkerque 12 3
10. JDA Dijon Bourgogne 11 6
. Cholet Basket 11 5
. JSF Nanterre 11 4
. ES Chalon-Sur-Saone 11 4
. Asvel Basket 11 3
15. SLUC Nancy Basket Pro 10 6
. STB Le Havre 10 4
Total 191 77
Average age
Average stay
Average height
% of foreign players
22
24
26
28
30
All the leaguesPro A
26.8026.57194
196
198
200
202
All the leaguesPro A
198.03196.72
0
1
2
3
4
All the leaguesPro A
1.942.130%
20%
40%
60%
80%
All the leaguesPro A
38.540.3
Number of players, by club
26 International Basketball Migration Report 2012
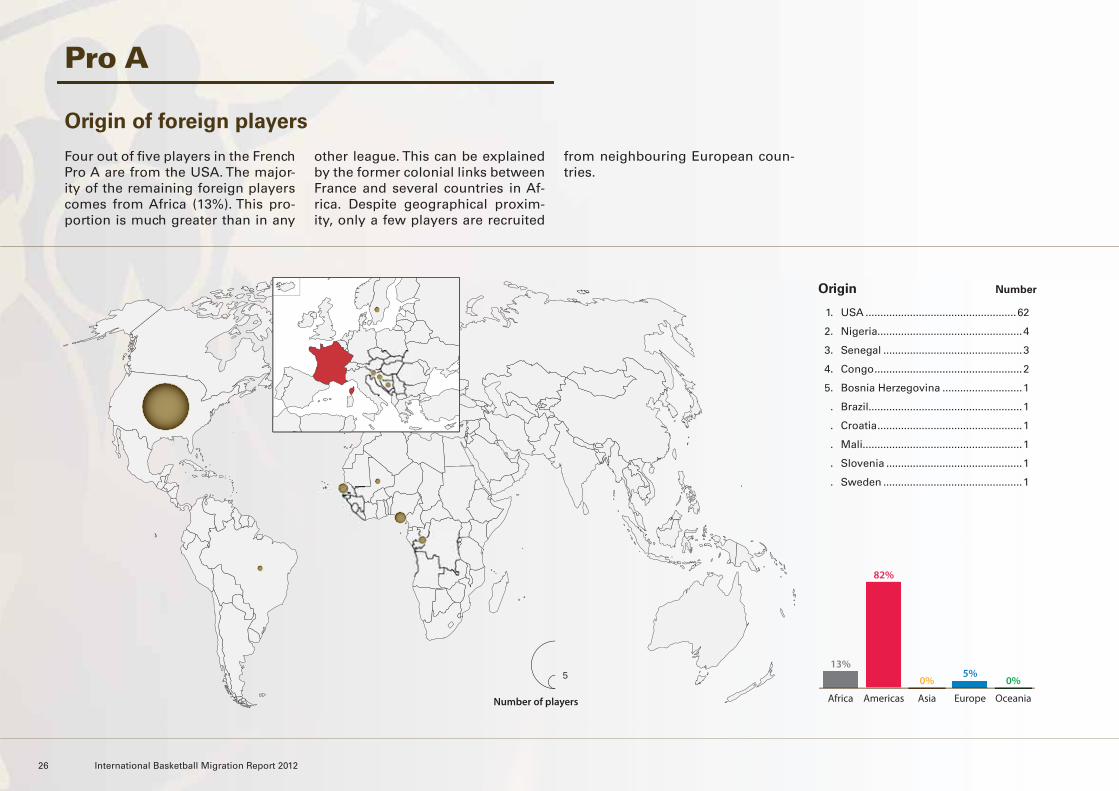
1. USA ...................................................62
2. Nigeria.................................................4
3. Senegal ...............................................3
4. Congo ..................................................2
5. Bosnia Herzegovina ...........................1
. Brazil....................................................1
. Croatia .................................................1
. Mali......................................................1
. Slovenia ..............................................1
. Sweden ...............................................1
Pro A
Origin of foreign players
Four out of five players in the French Pro A are from the USA. The major-ity of the remaining foreign players comes from Africa (13%). This pro-portion is much greater than in any
other league. This can be explained by the former colonial links between France and several countries in Af-rica. Despite geographical proxim-ity, only a few players are recruited
from neighbouring European coun-tries.
Origin Number
OceaniaEuropeAsiaAmericasAfrica
0%5%
0%
82%
13%
Number of players
5
League Profile 27
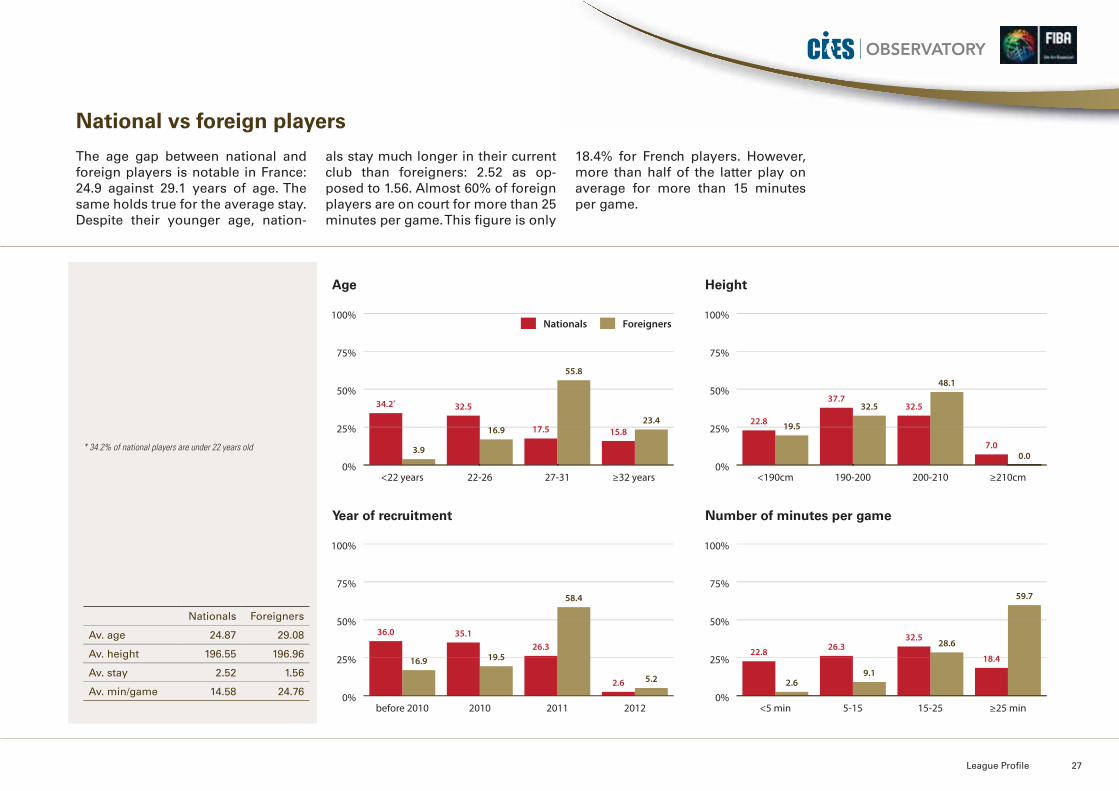
Nationals Foreigners
Av. age 24.87 29.08
Av. height 196.55 196.96
Av. stay 2.52 1.56
Av. min/game 14.58 24.76
Age
Year of recruitment
Height
Number of minutes per game
National vs foreign players
The age gap between national and foreign players is notable in France: 24.9 against 29.1 years of age. The same holds true for the average stay. Despite their younger age, nation-
als stay much longer in their current club than foreigners: 2.52 as op-posed to 1.56. Almost 60% of foreign players are on court for more than 25 minutes per game. This figure is only
18.4% for French players. However, more than half of the latter play on average for more than 15 minutes per game.
0%
25%
50%
75%
100%
34.2*
15.8
55.8
17.516.9
32.5
3.9
23.4
≥32 years 27-3122-26<22 years
Nationals Foreigners
0%
25%
50%
75%
100%
22.8
7.0
48.1
32.532.537.7
19.5
0.0
≥210cm200-210190-200<190cm
0%
25%
50%
75%
100%
36.0
2.6
58.4
26.319.5
35.1
16.9
5.2
201220112010before 20100%
25%
50%
75%
100%
22.818.4
28.632.5
9.1
26.3
2.6
59.7
≥25 min15-255-15<5 min
* 34.2% of national players are under 22 years old

28 International Basketball Migration Report 2012
Serie A(Italy)
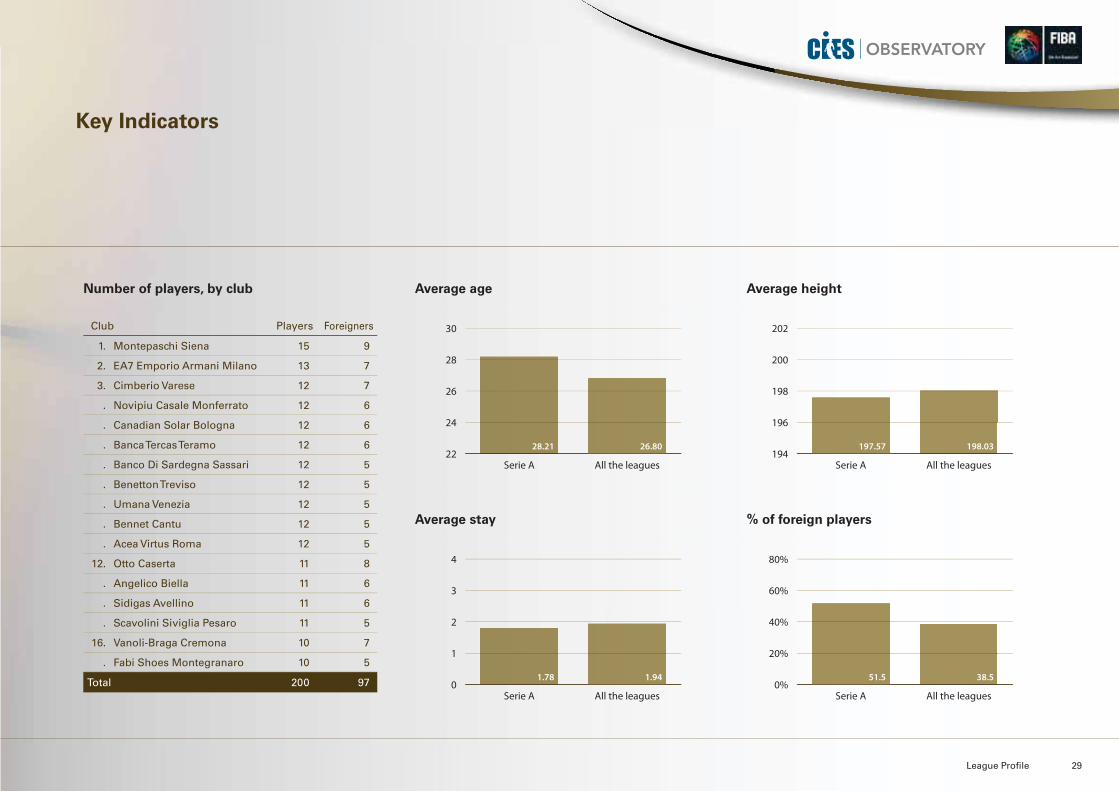
The Italian Serie A is the “oldest” league re-viewed. Italian clubs are composed of players aged on average 28.2 years. Foreigners are onaverage one year older than Italian nationals (28.7 compared to 27.7). Generally speaking, top division Italian clubs prefer experiencedplayers. From a demographic perspective, the Italian Serie A shares many similarities with the Spanish ACB League.
The percentage of foreign players among squadmembers is 51.5%. This figure is significantly greater than that measured in all leagues as a whole (38.5%). Italian clubs can only have ontheir roster up to six foreign players, of whomno more than 2 can be non European (EU), oralternatively up to five, of whom no more than3 can be non European (EU).
League Profile 29
Key Indicators
Club Players Foreigners
1. Montepaschi Siena 15 9
2. EA7 Emporio Armani Milano 13 7
3. Cimberio Varese 12 7
. Novipiu Casale Monferrato 12 6
. Canadian Solar Bologna 12 6
. Banca Tercas Teramo 12 6
. Banco Di Sardegna Sassari 12 5
. Benetton Treviso 12 5
. Umana Venezia 12 5
. Bennet Cantu 12 5
. Acea Virtus Roma 12 5
12. Otto Caserta 11 8
. Angelico Biella 11 6
. Sidigas Avellino 11 6
. Scavolini Siviglia Pesaro 11 5
16. Vanoli-Braga Cremona 10 7
. Fabi Shoes Montegranaro 10 5
Total 200 97
Average age
Average stay
Average height
% of foreign players
22
24
26
28
30
All the leaguesSerie A
26.8028.21194
196
198
200
202
All the leaguesSerie A
198.03197.57
0
1
2
3
4
All the leaguesSerie A
1.941.780%
20%
40%
60%
80%
All the leaguesSerie A
38.551.5
Number of players, by club
30 International Basketball Migration Report 2012
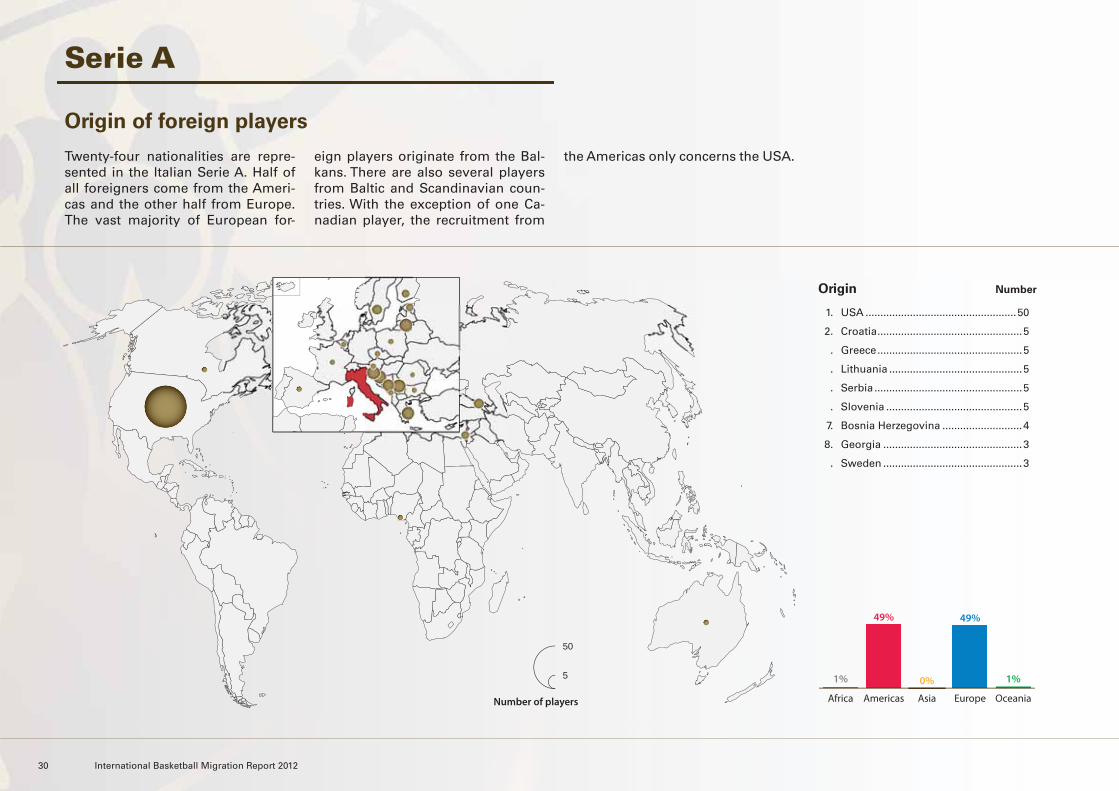
1. USA ...................................................50
2. Croatia .................................................5
. Greece .................................................5
. Lithuania .............................................5
. Serbia ..................................................5
. Slovenia ..............................................5
7. Bosnia Herzegovina ...........................4
8. Georgia ...............................................3
. Sweden ...............................................3
Serie A
Origin of foreign players
Twenty-four nationalities are repre-sented in the Italian Serie A. Half of all foreigners come from the Ameri-cas and the other half from Europe. The vast majority of European for-
eign players originate from the Bal-kans. There are also several players from Baltic and Scandinavian coun-tries. With the exception of one Ca-nadian player, the recruitment from
the Americas only concerns the USA.
Origin Number
OceaniaEuropeAsiaAmericasAfrica
1%
49%
0%
49%
1%
Number of players
50
5
League Profile 31
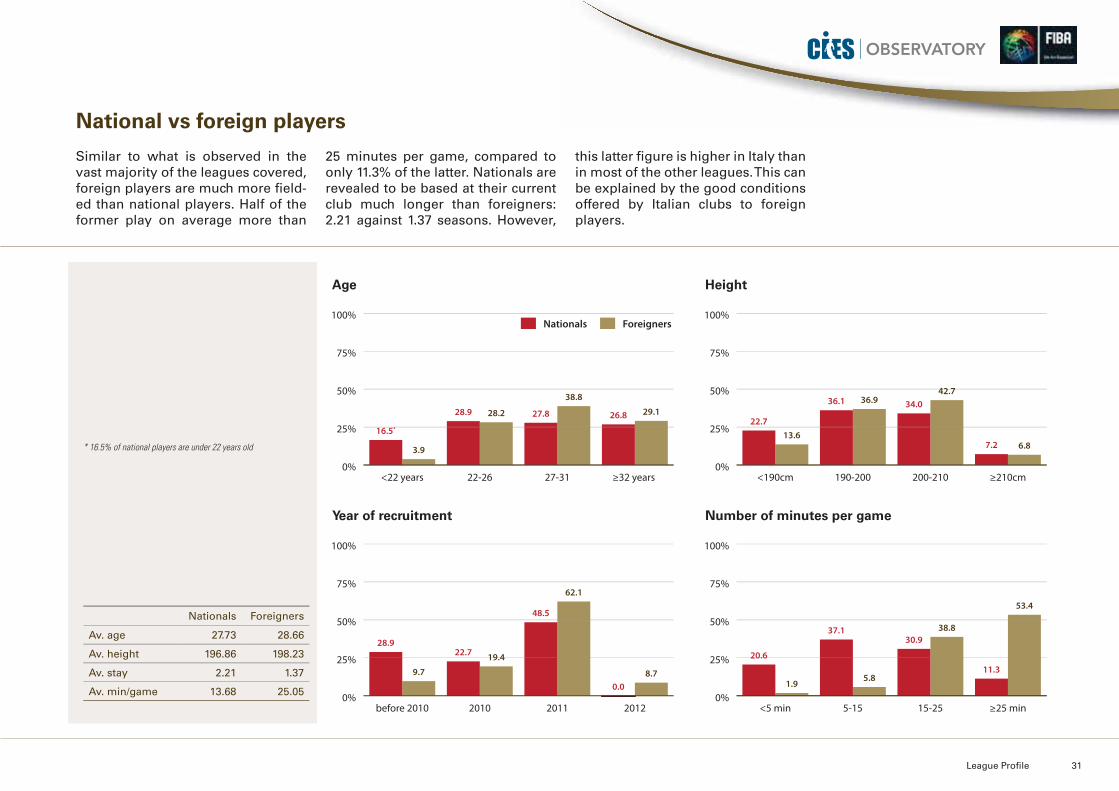
Nationals Foreigners
Av. age 27.73 28.66
Av. height 196.86 198.23
Av. stay 2.21 1.37
Av. min/game 13.68 25.05
Age
Year of recruitment
Height
Number of minutes per game
National vs foreign players
Similar to what is observed in the vast majority of the leagues covered, foreign players are much more field-ed than national players. Half of the former play on average more than
25 minutes per game, compared to only 11.3% of the latter. Nationals are revealed to be based at their current club much longer than foreigners: 2.21 against 1.37 seasons. However,
this latter figure is higher in Italy than in most of the other leagues. This can be explained by the good conditions offered by Italian clubs to foreign players.
0%
25%
50%
75%
100%
16.5*
26.8
38.8
27.828.228.9
3.9
29.1
≥32 years 27-3122-26<22 years
Nationals Foreigners
0%
25%
50%
75%
100%
22.7
7.2
42.734.036.936.1
13.66.8
≥210cm200-210190-200<190cm
0%
25%
50%
75%
100%
28.9
0.0
62.1
48.5
19.422.7
9.7 8.7
201220112010before 20100%
25%
50%
75%
100%
20.611.3
38.830.9
5.8
37.1
1.9
53.4
≥25 min15-255-15<5 min
* 16.5% of national players are under 22 years old
32 International Basketball Migration Report 2012
Adriatic League (Bosnia Herzegovina, croatia, israel, montenegro, serbia, slovenia)
The Adriatic League comprises the best teams from five former Yugoslavian countries, as well as the Israeli side Maccabi Tel-Aviv. These teams also participate in their respective na-tional championships. Gathering high profileteams with a great sporting tradition, the Adri-atic League allows for the enhancement and increased profile of the best basketball playersof this region.
From a methodological perspective, the defini-tion of a foreign player is based on the national federation to which its employer club is affili-ated. Consequently, a Serbian player playing for a Croatian club is considered as a foreign player in this league.
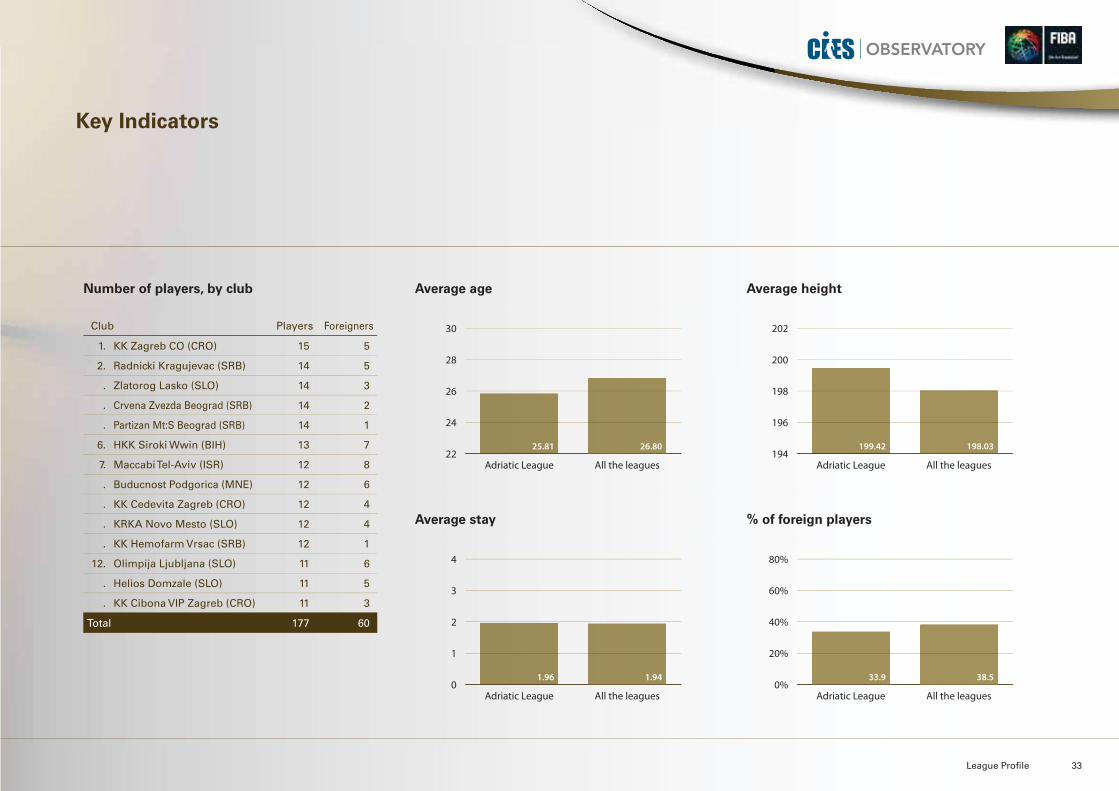
The Adriatic League is mainly composed of na-tional players (66.1%). The average age is much lower than in other leagues surveyed (25.81) and there is a dominance of very tall players (199cm on average).
League Profile 33
Key Indicators
Club Players Foreigners
1. KK Zagreb CO (CRO) 15 5
2. Radnicki Kragujevac (SRB) 14 5
. Zlatorog Lasko (SLO) 14 3
. Crvena Zvezda Beograd (SRB) 14 2
. Partizan Mt:S Beograd (SRB) 14 1
6. HKK Siroki Wwin (BIH) 13 7
7. Maccabi Tel-Aviv (ISR) 12 8
. Buducnost Podgorica (MNE) 12 6
. KK Cedevita Zagreb (CRO) 12 4
. KRKA Novo Mesto (SLO) 12 4
. KK Hemofarm Vrsac (SRB) 12 1
12. Olimpija Ljubljana (SLO) 11 6
. Helios Domzale (SLO) 11 5
. KK Cibona VIP Zagreb (CRO) 11 3
Total 177 60
Average age
Average stay
Average height
% of foreign players
22
24
26
28
30
All the leaguesAdriatic League
26.8025.81194
196
198
200
202
All the leaguesAdriatic League
198.03199.42
0
1
2
3
4
All the leaguesAdriatic League
1.941.960%
20%
40%
60%
80%
All the leaguesAdriatic League
38.533.9
Number of players, by club
34 International Basketball Migration Report 2012
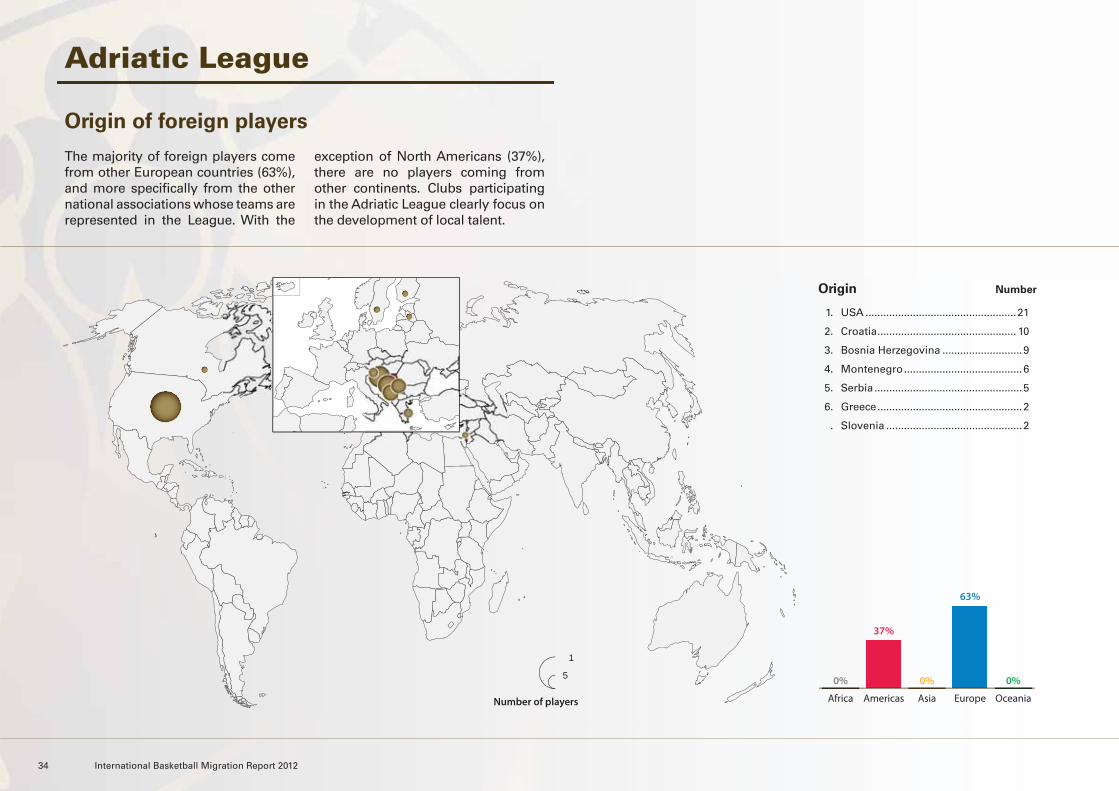
1. USA ...................................................21
2. Croatia ............................................... 10
3. Bosnia Herzegovina ...........................9
4. Montenegro ........................................6
5. Serbia ..................................................5
6. Greece .................................................2
. Slovenia ..............................................2
Adriatic League
Origin of foreign players
The majority of foreign players come from other European countries (63%), and more specifically from the other national associations whose teams are represented in the League. With the
exception of North Americans (37%), there are no players coming from other continents. Clubs participating in the Adriatic League clearly focus on the development of local talent.
Origin Number
OceaniaEuropeAsiaAmericasAfrica
0%
63%
0%
37%
0%
Number of players
5
1
League Profile 35
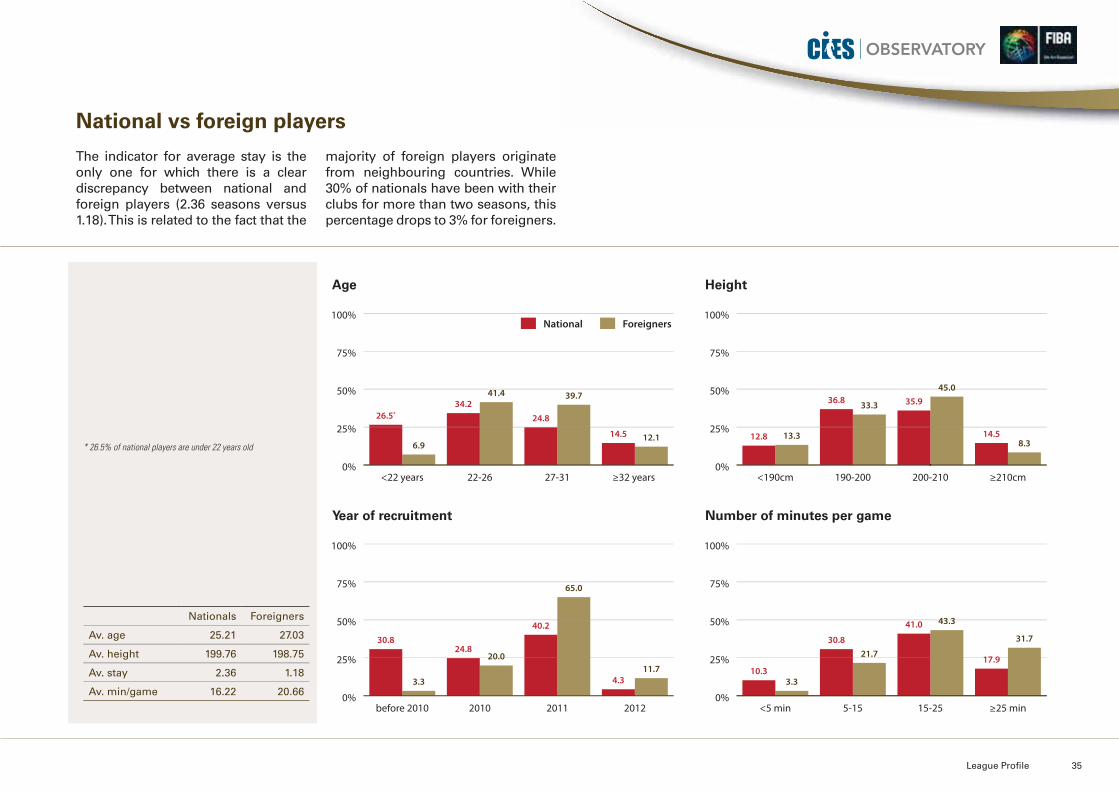
Nationals Foreigners
Av. age 25.21 27.03
Av. height 199.76 198.75
Av. stay 2.36 1.18
Av. min/game 16.22 20.66
Age
Year of recruitment
Height
Number of minutes per game
National vs foreign players
The indicator for average stay is the only one for which there is a clear discrepancy between national and foreign players (2.36 seasons versus 1.18). This is related to the fact that the
majority of foreign players originate from neighbouring countries. While 30% of nationals have been with their clubs for more than two seasons, this percentage drops to 3% for foreigners.
0%
25%
50%
75%
100%
26.5*
14.5
39.7
24.8
41.434.2
6.912.1
≥32 years 27-3122-26<22 years
National Foreigners
0%
25%
50%
75%
100%
12.8 14.5
45.035.933.336.8
13.38.3
≥210cm200-210190-200<190cm
0%
25%
50%
75%
100%
30.8
4.3
65.0
40.2
20.024.8
3.311.7
201220112010before 20100%
25%
50%
75%
100%
10.317.9
43.341.0
21.730.8
3.3
31.7
≥25 min15-255-15<5 min
* 26.5% of national players are under 22 years old

36 International Basketball Migration Report 2012
A1 League(Greece)
The A1 Greek League differentiates itself from other European leagues included in this analy-sis primarily by the lower proportion of foreign players. In average, only one third of a greek squad is made up of this category of players.This is even more noticeable since each team can potentially have up to six foreign players on its roster, with three coming from outsideEurope.
The quality of national players certainly ex-plains the league’s minimal dependence onimporting foreign talents. A1 League teams re-group slightly taller players than in other leagues. However, the average height remains lower than in Russia, Ukraine and the Adriatic league.
League Profile 37
Key Indicators
Club Players Foreigners
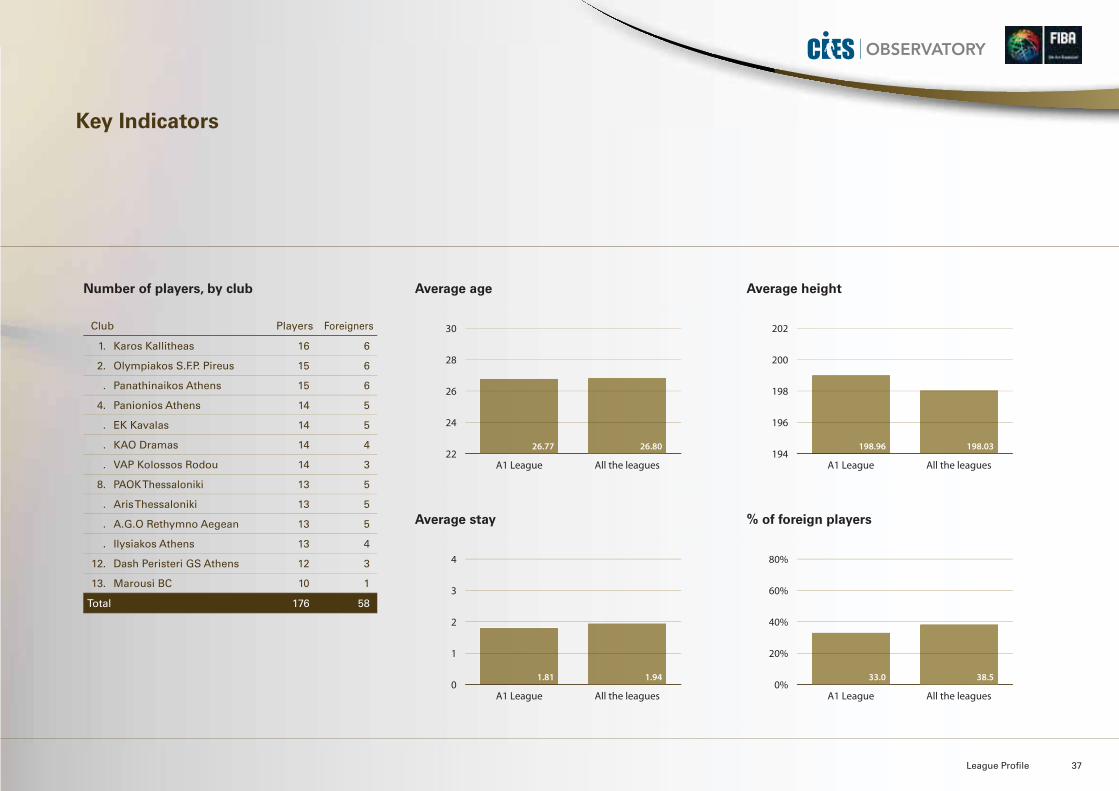
1. Karos Kallitheas 16 6
2. Olympiakos S.F.P. Pireus 15 6
. Panathinaikos Athens 15 6
4. Panionios Athens 14 5
. EK Kavalas 14 5
. KAO Dramas 14 4
. VAP Kolossos Rodou 14 3
8. PAOK Thessaloniki 13 5
. Aris Thessaloniki 13 5
. A.G.O Rethymno Aegean 13 5
. Ilysiakos Athens 13 4
12. Dash Peristeri GS Athens 12 3
13. Marousi BC 10 1
Total 176 58
Average age
Average stay
Average height
% of foreign players
22
24
26
28
30
All the leaguesA1 League
26.8026.77194
196
198
200
202
All the leaguesA1 League
198.03198.96
0
1
2
3
4
All the leaguesA1 League
1.941.810%
20%
40%
60%
80%
All the leaguesA1 League
38.533.0
Number of players, by club
38 International Basketball Migration Report 2012
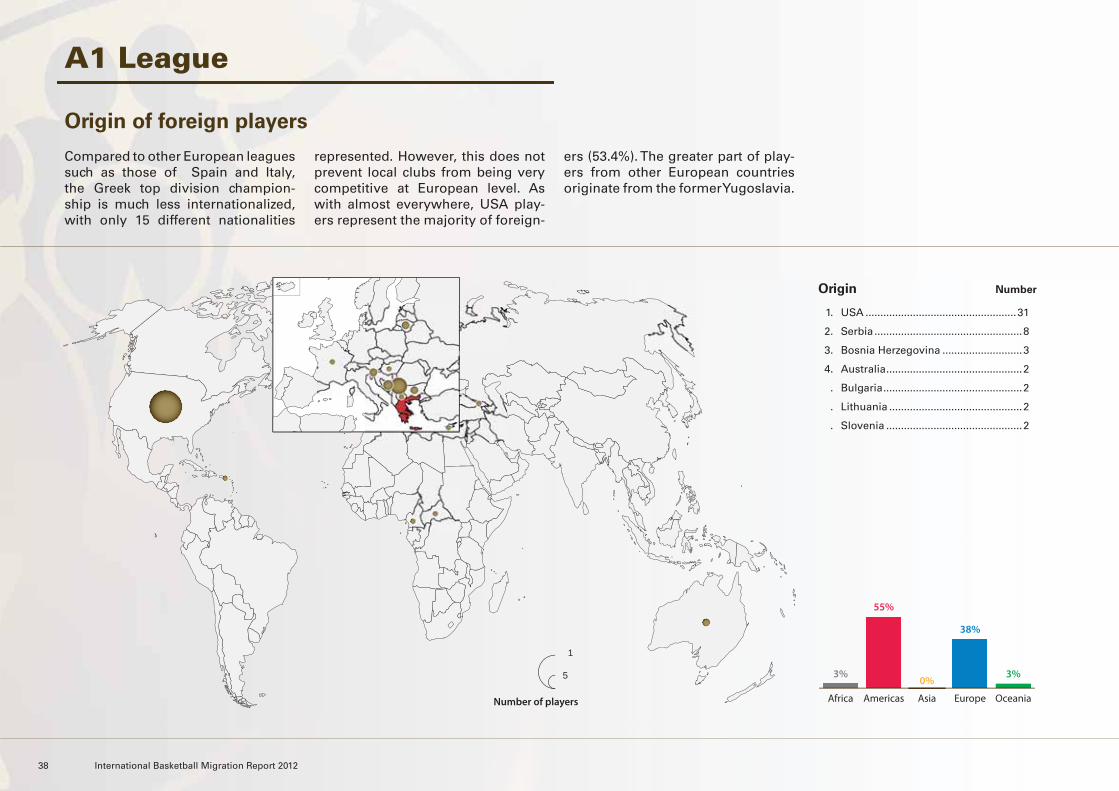
1. USA ...................................................31
2. Serbia ..................................................8
3. Bosnia Herzegovina ...........................3
4. Australia ..............................................2
. Bulgaria ...............................................2
. Lithuania .............................................2
. Slovenia ..............................................2
A1 League
Origin of foreign players
Compared to other European leagues such as those of Spain and Italy, the Greek top division champion-ship is much less internationalized, with only 15 different nationalities
represented. However, this does not prevent local clubs from being very competitive at European level. As with almost everywhere, USA play-ers represent the majority of foreign-
ers (53.4%). The greater part of play-ers from other European countries originate from the former Yugoslavia.
Origin Number
OceaniaEuropeAsiaAmericasAfrica
3%
38%
0%
55%
3%
Number of players
5
1
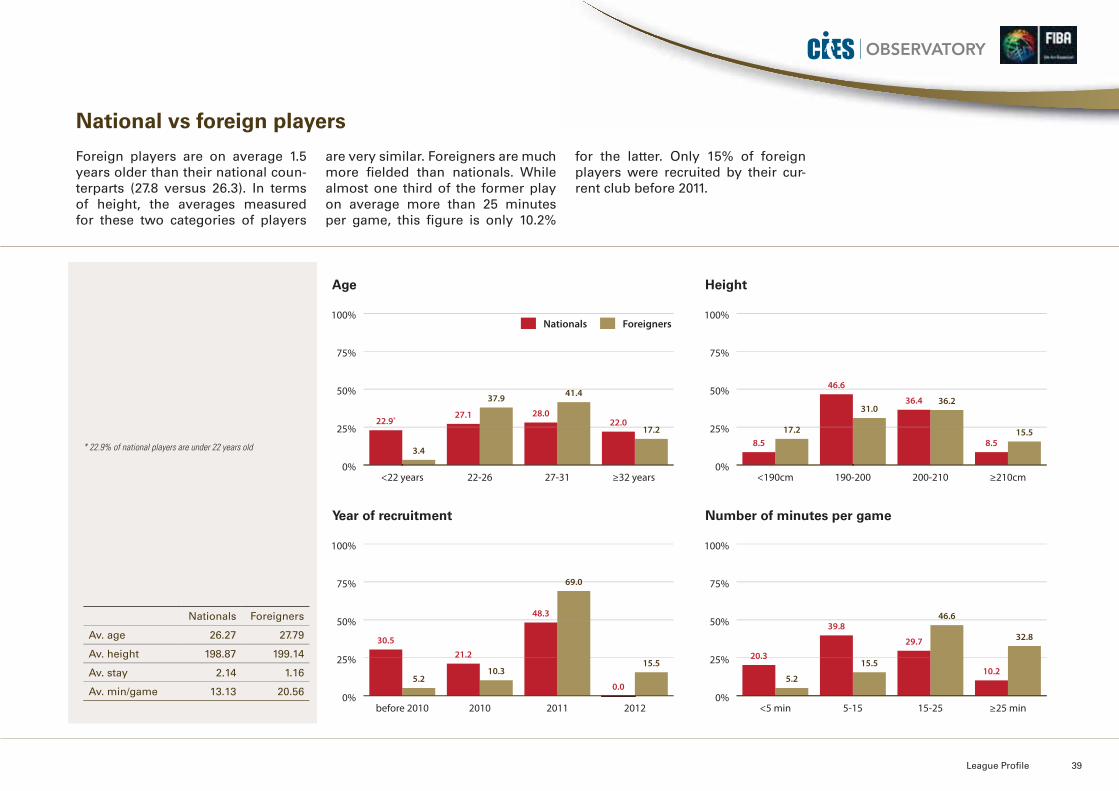
League Profile 39
Nationals Foreigners
Av. age 26.27 27.79
Av. height 198.87 199.14
Av. stay 2.14 1.16
Av. min/game 13.13 20.56
Age
Year of recruitment
Height
Number of minutes per game
National vs foreign players
Foreign players are on average 1.5 years older than their national coun-terparts (27.8 versus 26.3). In terms of height, the averages measured for these two categories of players
are very similar. Foreigners are much more fielded than nationals. While almost one third of the former play on average more than 25 minutes per game, this figure is only 10.2%
for the latter. Only 15% of foreign players were recruited by their cur-rent club before 2011.
0%
25%
50%
75%
100%
22.9* 22.0
41.4
28.0
37.9
27.1
3.4
17.2
≥32 years 27-3122-26<22 years
Nationals Foreigners
0%
25%
50%
75%
100%
8.5 8.5
36.236.431.0
46.6
17.2 15.5
≥210cm200-210190-200<190cm
0%
25%
50%
75%
100%
30.5
0.0
69.0
48.3
10.3
21.2
5.2
15.5
201220112010before 20100%
25%
50%
75%
100%
20.3
10.2
46.6
29.7
15.5
39.8
5.2
32.8
≥25 min15-255-15<5 min
* 22.9% of national players are under 22 years old

40 International Basketball Migration Report 2012
Basketball League (Turkey)
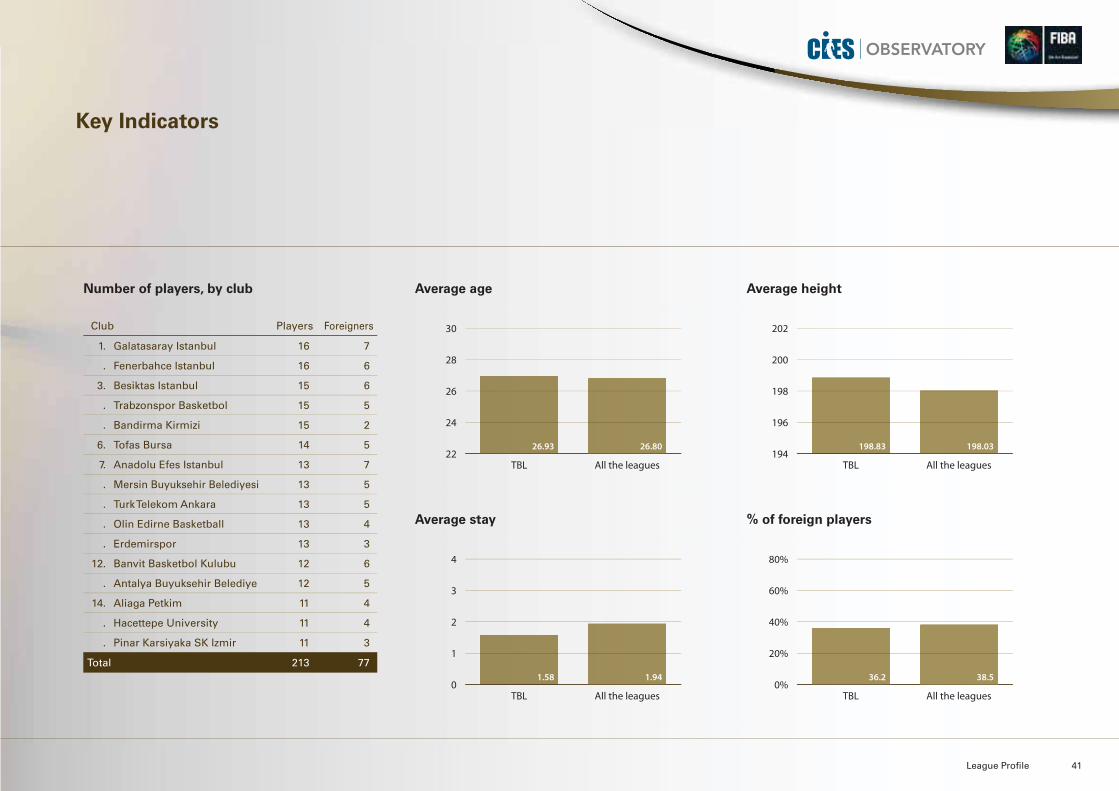
From a demographic perspective, the Turk-ish league differentiates itself from the otherleagues studied with data revealing the very short average stay of its players (1.58 seasons only in their current team). National players are much more mobile in Turkey than in other leagues. This reflects the existence of an impor-rrtant internal transfer market.
While clubs are allowed to have up to six for-rreigners on their roster, a minority of clubs take full advantage of this opportunity. As a con-sequence, the percentage of foreign playersis slightly lower than the average measured for all leagues surveyed (36.2% compared to38.5%). The USA is by far the most represented origin among foreigners.
League Profile 41
Key Indicators
Club Players Foreigners
1. Galatasaray Istanbul 16 7
. Fenerbahce Istanbul 16 6
3. Besiktas Istanbul 15 6
. Trabzonspor Basketbol 15 5
. Bandirma Kirmizi 15 2
6. Tofas Bursa 14 5
7. Anadolu Efes Istanbul 13 7
. Mersin Buyuksehir Belediyesi 13 5
. Turk Telekom Ankara 13 5
. Olin Edirne Basketball 13 4
. Erdemirspor 13 3
12. Banvit Basketbol Kulubu 12 6
. Antalya Buyuksehir Belediye 12 5
14. Aliaga Petkim 11 4
. Hacettepe University 11 4
. Pinar Karsiyaka SK Izmir 11 3
Total 213 77
Average age
Average stay
Average height
% of foreign players
22
24
26
28
30
All the leaguesTBL
26.8026.93194
196
198
200
202
All the leaguesTBL
198.03198.83
0
1
2
3
4
All the leaguesTBL
1.941.580%
20%
40%
60%
80%
All the leaguesTBL
38.536.2
Number of players, by club
42 International Basketball Migration Report 2012
1. USA ...................................................47
2. Serbia ..................................................8
3. Croatia .................................................5
4. Bosnia Herzegovina ...........................4
5. Slovenia ..............................................3
6. Lithuania .............................................2
. Macedonia FYR ..................................2
Turkish Basketball League
Origin of foreign players
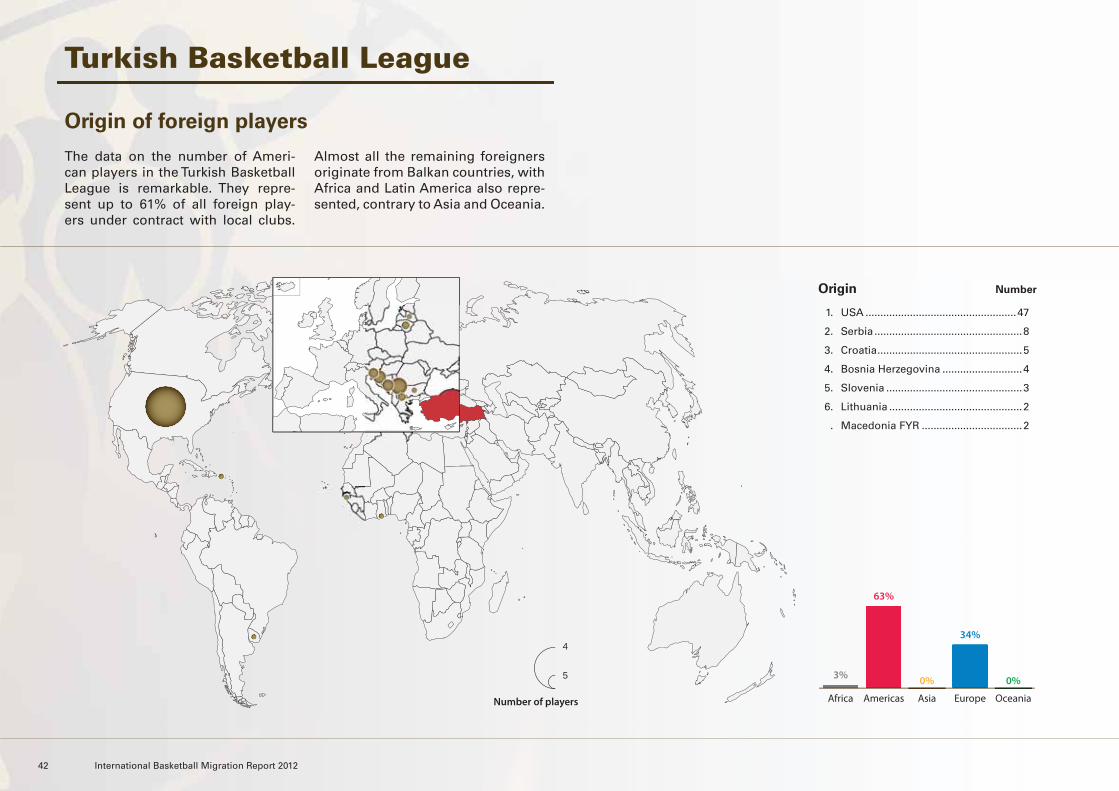
The data on the number of Ameri-can players in the Turkish Basketball League is remarkable. They repre-sent up to 61% of all foreign play-ers under contract with local clubs.
Almost all the remaining foreigners originate from Balkan countries, with Africa and Latin America also repre-sented, contrary to Asia and Oceania.
Origin Number
OceaniaEuropeAsiaAmericasAfrica
0%
34%
0%
63%
3%
Number of players
5
4
League Profile 43
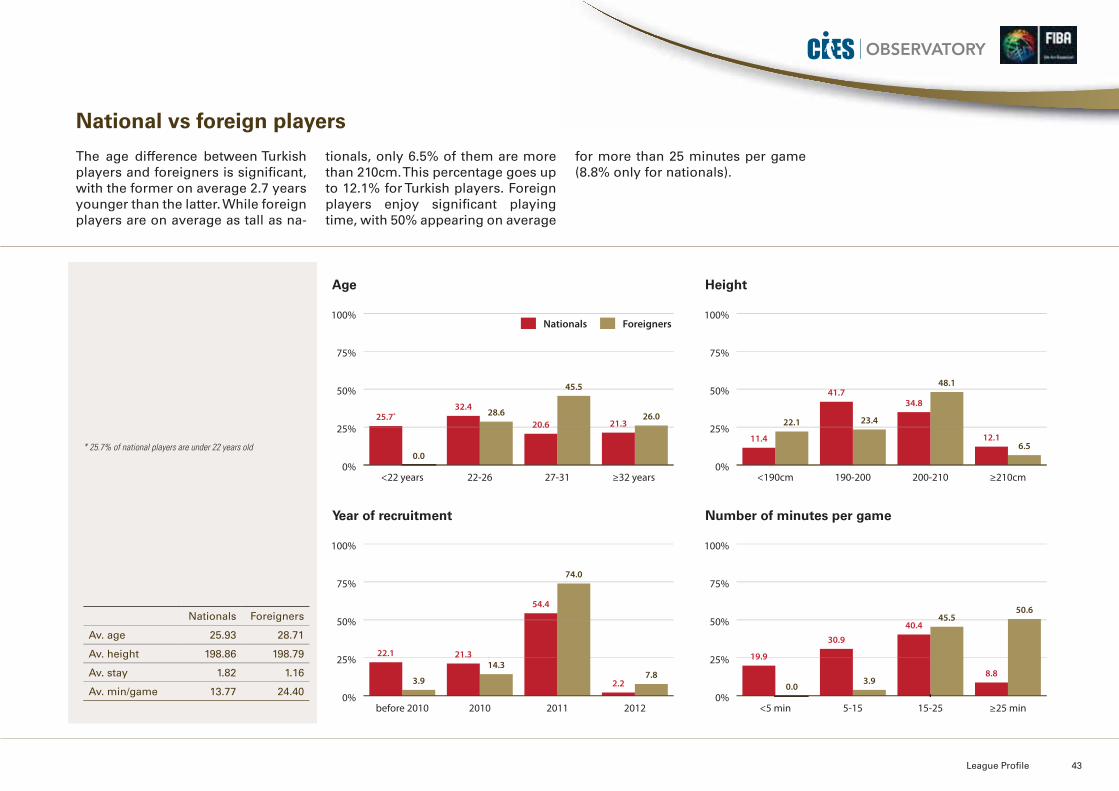
Nationals Foreigners
Av. age 25.93 28.71
Av. height 198.86 198.79
Av. stay 1.82 1.16
Av. min/game 13.77 24.40
Age
Year of recruitment
Height
Number of minutes per game
National vs foreign players
The age difference between Turkish players and foreigners is significant, with the former on average 2.7 years younger than the latter. While foreign players are on average as tall as na-
tionals, only 6.5% of them are more than 210cm. This percentage goes up to 12.1% for Turkish players. Foreign players enjoy significant playing time, with 50% appearing on average
for more than 25 minutes per game (8.8% only for nationals).
0%
25%
50%
75%
100%
25.7*
21.3
45.5
20.628.6
32.4
0.0
26.0
≥32 years 27-3122-26<22 years
Nationals Foreigners
0%
25%
50%
75%
100%
11.4 12.1
48.1
34.8
23.4
41.7
22.1
6.5
≥210cm200-210190-200<190cm
0%
25%
50%
75%
100%
22.1
2.2
74.0
54.4
14.321.3
3.97.8
201220112010before 20100%
25%
50%
75%
100%
19.9
8.8
45.540.4
3.9
30.9
0.0
50.6
≥25 min15-255-15<5 min
* 25.7% of national players are under 22 years old

44 International Basketball Migration Report 2012
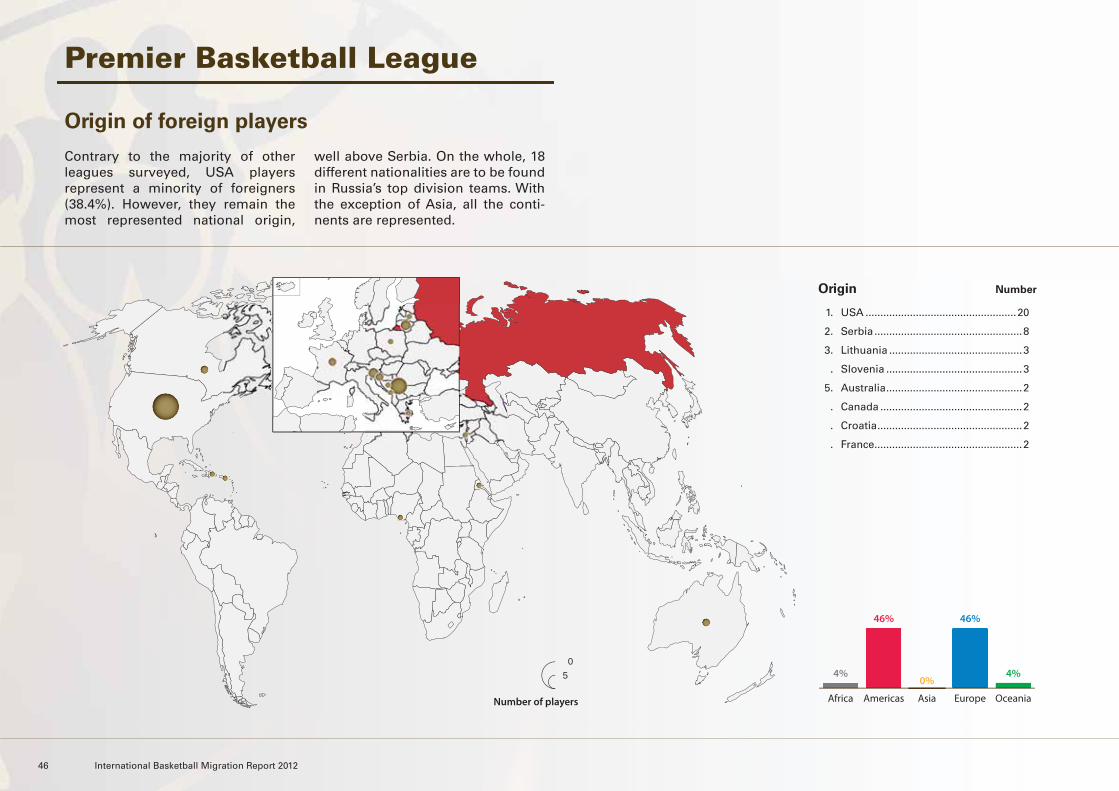
Premier Basketball League (Russia)
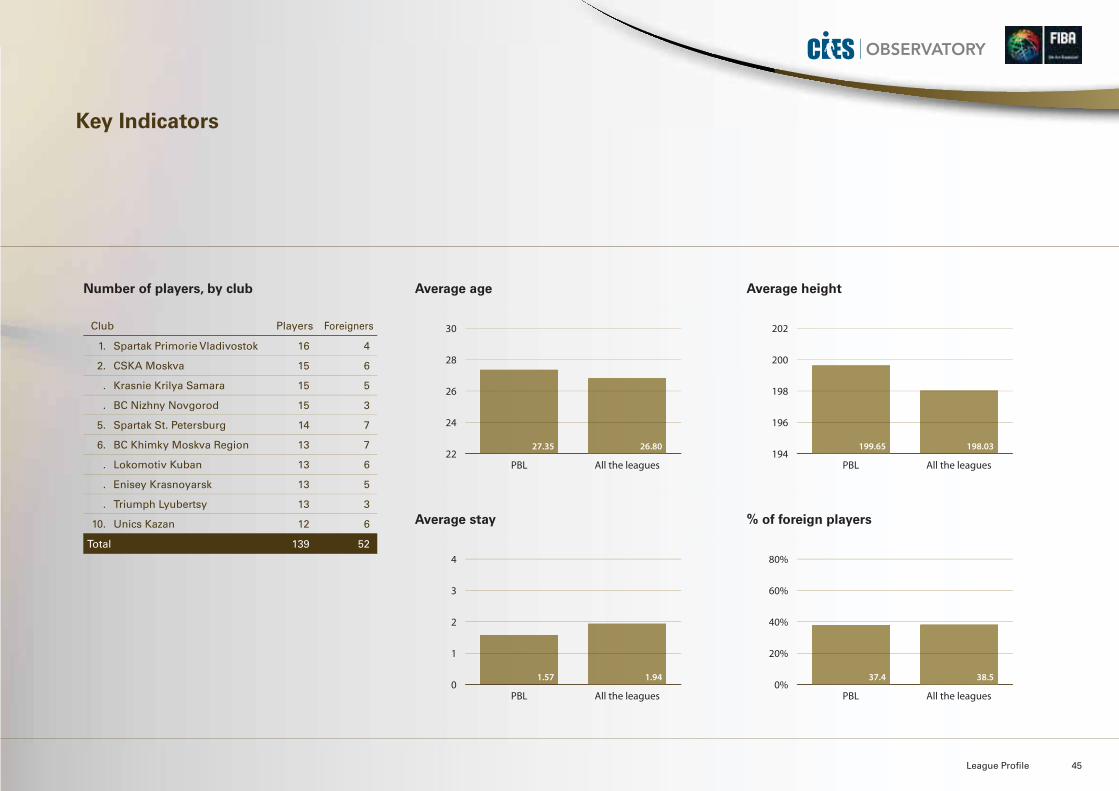
Russian top division clubs employ relatively seasoned players (27.3 years of age on aver-rrage). They also gather the tallest players of all leagues with an average height of 199.6 cm.The majority of squad members are more than 200 cm.
The percentage of foreign players is just belowthe average observed in all the leagues cov-ered in the report (37.4 versus 38.5%). While clubs are allowed up to seven foreign players on their roster, only two teams took full advan-tage of this opportunity.
The average stay for players at their current club is significantly lower in the Russian topdivision than in the other championships ana-lysed. This reflects a greater player turnoverboth for national and foreign players.
League Profile 45
Key Indicators
Club Players Foreigners
1. Spartak Primorie Vladivostok 16 4
2. CSKA Moskva 15 6
. Krasnie Krilya Samara 15 5
. BC Nizhny Novgorod 15 3
5. Spartak St. Petersburg 14 7
6. BC Khimky Moskva Region 13 7
. Lokomotiv Kuban 13 6
. Enisey Krasnoyarsk 13 5
. Triumph Lyubertsy 13 3
10. Unics Kazan 12 6
Total 139 52
Average age
Average stay
Average height
% of foreign players
22
24
26
28
30
All the leaguesPBL
26.8027.35194
196
198
200
202
All the leaguesPBL
198.03199.65
0
1
2
3
4
All the leaguesPBL
1.941.570%
20%
40%
60%
80%
All the leaguesPBL
38.537.4
Number of players, by club
46 International Basketball Migration Report 2012
1. USA ...................................................20
2. Serbia ..................................................8
3. Lithuania .............................................3
. Slovenia ..............................................3
5. Australia ..............................................2
. Canada ................................................2
. Croatia .................................................2
. France ..................................................2
Premier Basketball League
Origin of foreign players
Contrary to the majority of other leagues surveyed, USA players represent a minority of foreigners (38.4%). However, they remain the most represented national origin,
well above Serbia. On the whole, 18 different nationalities are to be found in Russia’s top division teams. With the exception of Asia, all the conti-nents are represented.
Origin Number
OceaniaEuropeAsiaAmericasAfrica
4%
46%
0%
46%
4%
Number of players
50
League Profile 47
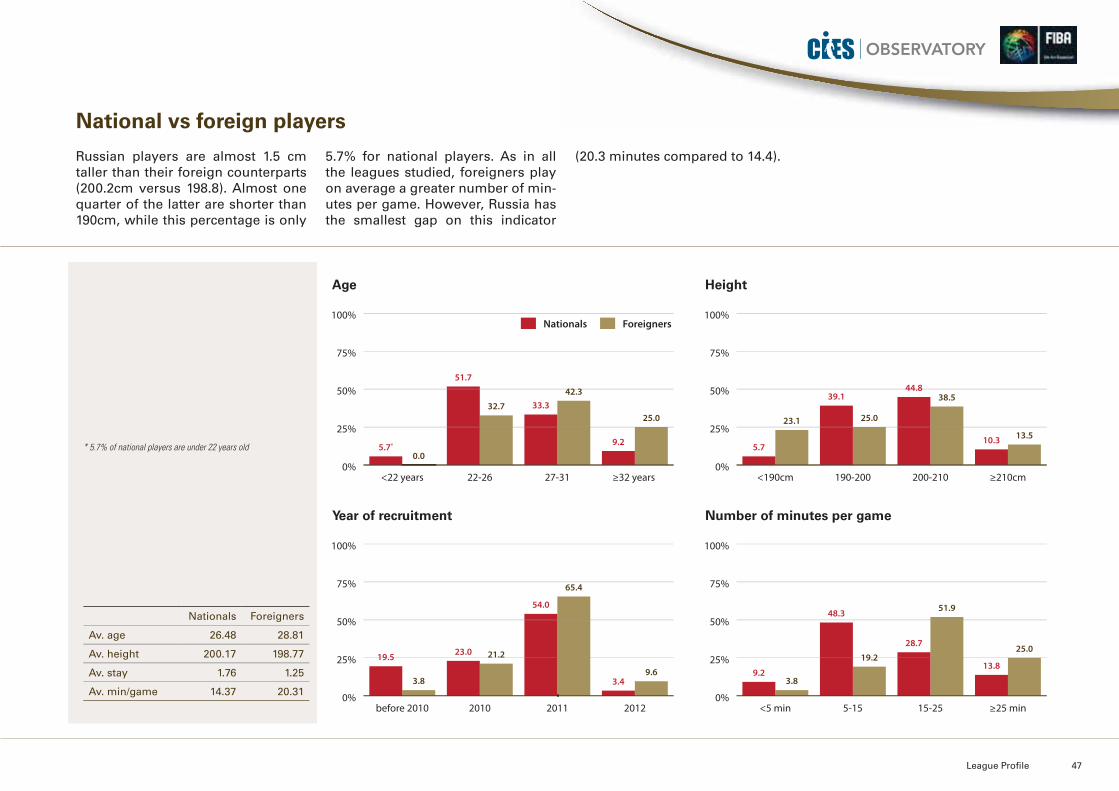
Nationals Foreigners
Av. age 26.48 28.81
Av. height 200.17 198.77
Av. stay 1.76 1.25
Av. min/game 14.37 20.31
Age
Year of recruitment
Height
Number of minutes per game
National vs foreign players
Russian players are almost 1.5 cm taller than their foreign counterparts (200.2cm versus 198.8). Almost one quarter of the latter are shorter than 190cm, while this percentage is only
5.7% for national players. As in all the leagues studied, foreigners play on average a greater number of min-utes per game. However, Russia has the smallest gap on this indicator
(20.3 minutes compared to 14.4).
0%
25%
50%
75%
100%
5.7* 9.2
42.333.332.7
51.7
0.0
25.0
≥32 years 27-3122-26<22 years
Nationals Foreigners
0%
25%
50%
75%
100%
5.710.3
38.544.8
25.0
39.1
23.1
13.5
≥210cm200-210190-200<190cm
0%
25%
50%
75%
100%
19.5
3.4
65.4
54.0
21.223.0
3.89.6
201220112010before 20100%
25%
50%
75%
100%
9.213.8
51.9
28.7
19.2
48.3
3.8
25.0
≥25 min15-255-15<5 min
* 5.7% of national players are under 22 years old

48 International Basketball Migration Report 2012
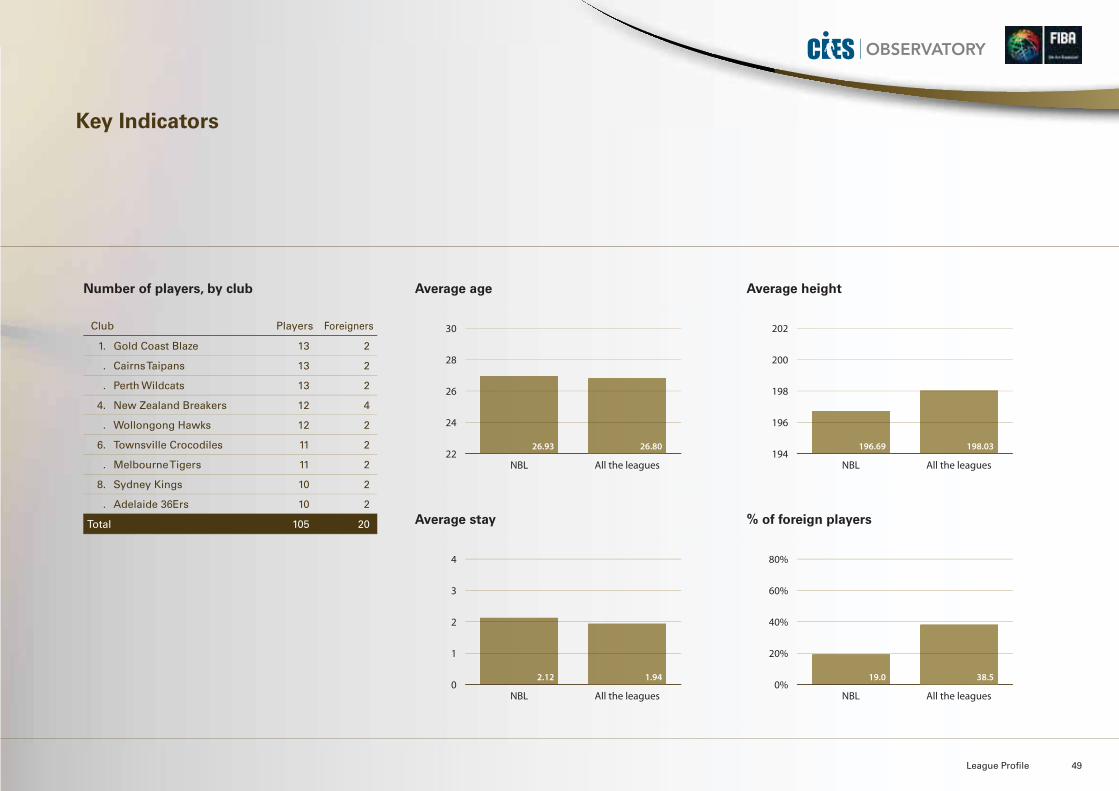
National Basketball League(Australia)
The Australian National Basketball League con-sists of nine teams for the 2011/12 season, with eight from Australia and one from New Zea-land. The percentage of foreign players is the lowest among the leagues analysed in this re-port. This is the direct consequence of the exist-ence of drastic limits.
No team is permitted to have more than two players who do not hold Australian or NewZealand citizenship. While an Australian teamcan have as many New Zealanders as it wishes, and a New Zealand team as many Australians as desired, there is no significant flow between these two countries.
The average age of players in the Australian National Basketball League is similar to that measured in all of the leagues surveyed, although the average height is significantlylower.
League Profile 49
Key Indicators
Club Players Foreigners
1. Gold Coast Blaze 13 2
. Cairns Taipans 13 2
. Perth Wildcats 13 2
4. New Zealand Breakers 12 4
. Wollongong Hawks 12 2
6. Townsville Crocodiles 11 2
. Melbourne Tigers 11 2
8. Sydney Kings 10 2
. Adelaide 36Ers 10 2
Total 105 20
Average age
Average stay
Average height
% of foreign players
22
24
26
28
30
All the leaguesNBL
26.8026.93194
196
198
200
202
All the leaguesNBL
198.03196.69
0
1
2
3
4
All the leaguesNBL
1.942.120%
20%
40%
60%
80%
All the leaguesNBL
38.519.0
Number of players, by club
50 International Basketball Migration Report 2012
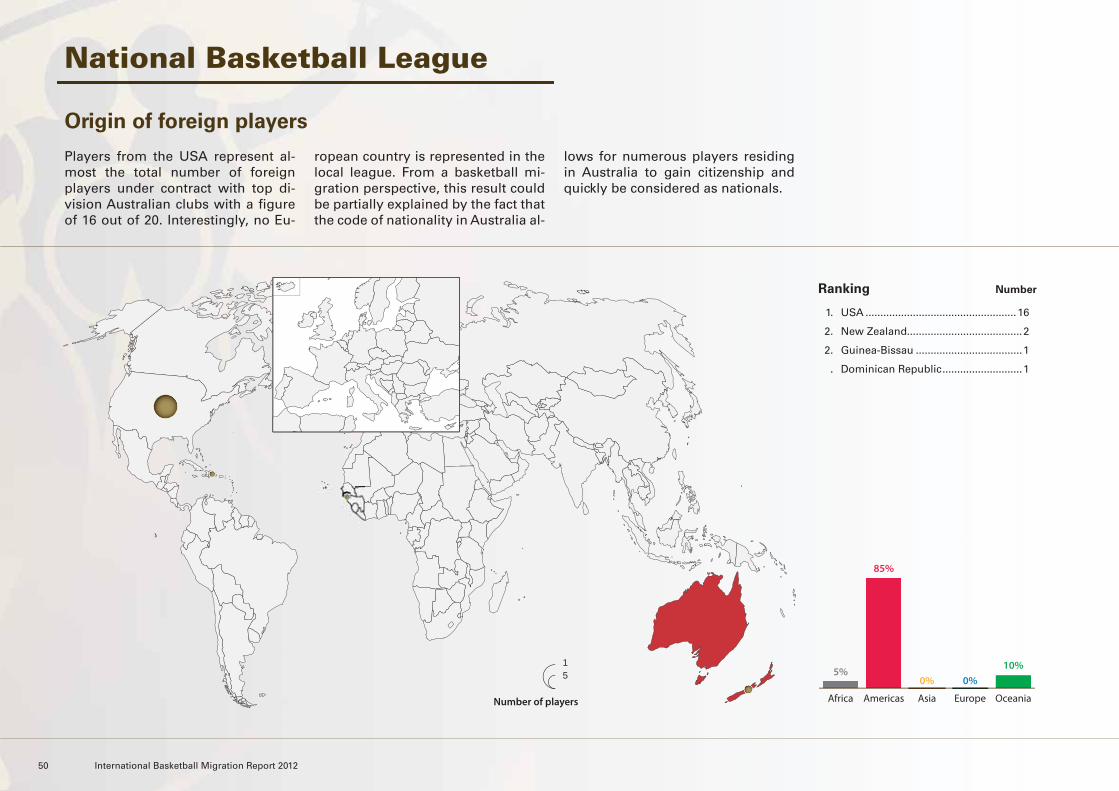
1. USA ...................................................16
2. New Zealand.......................................2
2. Guinea-Bissau ....................................1
. Dominican Republic ...........................1
National Basketball League
Origin of foreign players
Players from the USA represent al-most the total number of foreign players under contract with top di-vision Australian clubs with a figure of 16 out of 20. Interestingly, no Eu-
ropean country is represented in the local league. From a basketball mi-gration perspective, this result could be partially explained by the fact that the code of nationality in Australia al-
lows for numerous players residing in Australia to gain citizenship and quickly be considered as nationals.
Ranking Number
OceaniaEuropeAsiaAmericasAfrica
10%0%0%
85%
5%
Number of players
51
League Profile 51
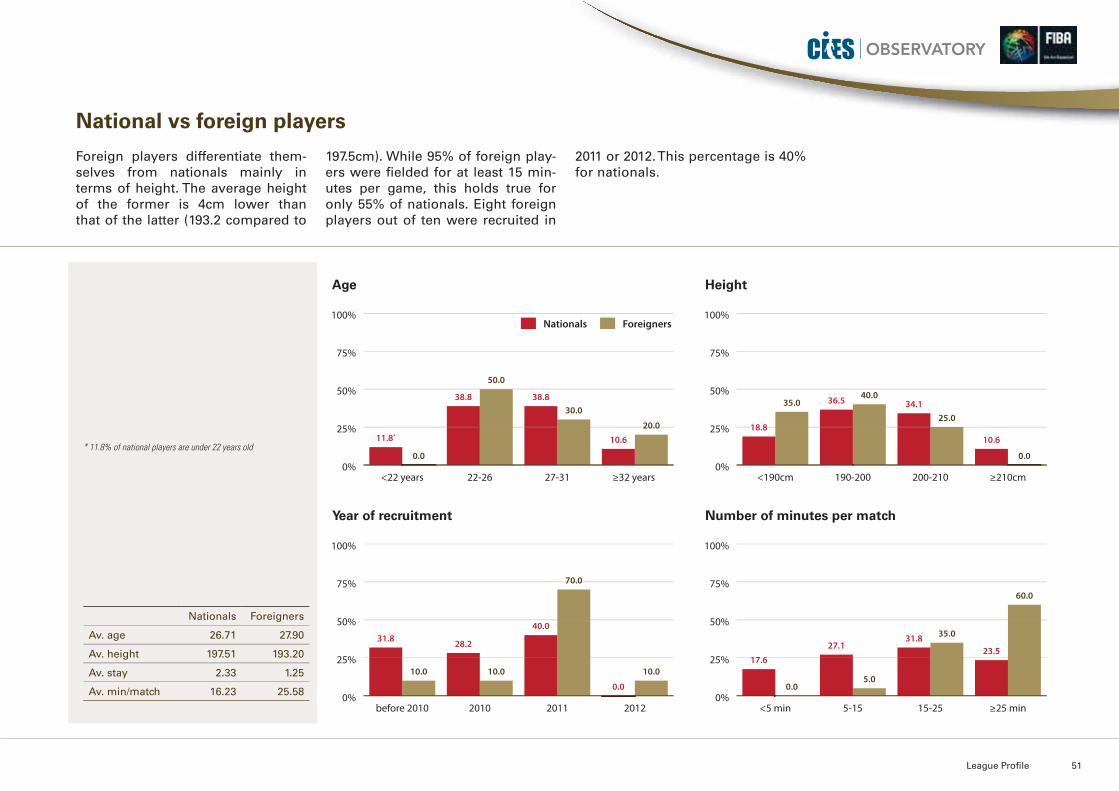
Nationals Foreigners
Av. age 26.71 27.90
Av. height 197.51 193.20
Av. stay 2.33 1.25
Av. min/match 16.23 25.58
Age
Year of recruitment
Height
Number of minutes per match
National vs foreign players
Foreign players differentiate them-selves from nationals mainly in terms of height. The average height of the former is 4cm lower than that of the latter (193.2 compared to
197.5cm). While 95% of foreign play-ers were fielded for at least 15 min-utes per game, this holds true for only 55% of nationals. Eight foreign players out of ten were recruited in
2011 or 2012. This percentage is 40% for nationals.
0%
25%
50%
75%
100%
11.8* 10.6
30.038.8
50.0
38.8
0.0
20.0
≥32 years 27-3122-26<22 years
Nationals Foreigners
0%
25%
50%
75%
100%
18.810.6
25.034.1
40.036.535.0
0.0
≥210cm200-210190-200<190cm
0%
25%
50%
75%
100%
31.8
0.0
70.0
40.0
10.0
28.2
10.0 10.0
201220112010before 20100%
25%
50%
75%
100%
17.623.5
35.031.8
5.0
27.1
0.0
60.0
≥25 min15-255-15<5 min
* 11.8% of national players are under 22 years old

52 International Basketball Migration Report 2012
Basketball Association(PR China)
The Chinese Basketball Association League pro-vides the biggest contrast to all of the leagues studied. Significantly, it contains the youngest players (25.1 years on average) and the small-est percentage of foreign players (18.8%). Con-versely, it has the greatest average stay (3.51 seasons in the current club).
The relatively low representation of foreign players can be explained by the strict limits in place for the employment of this category of player. Teams are only allowed to have two intheir squad. The five teams at the bottom of the standings have the possibility to sign an addi-tional foreign player. However, this player must come from the Asian Zone.
The case of the Buyi Fubang Rockets is excep-tional. As the team represents the People’s Lib-eration Army, it is not allowed to recruit any foreign players. This results in a competitive disadvantage compared to other league clubs.
League Profile 53
Key Indicators
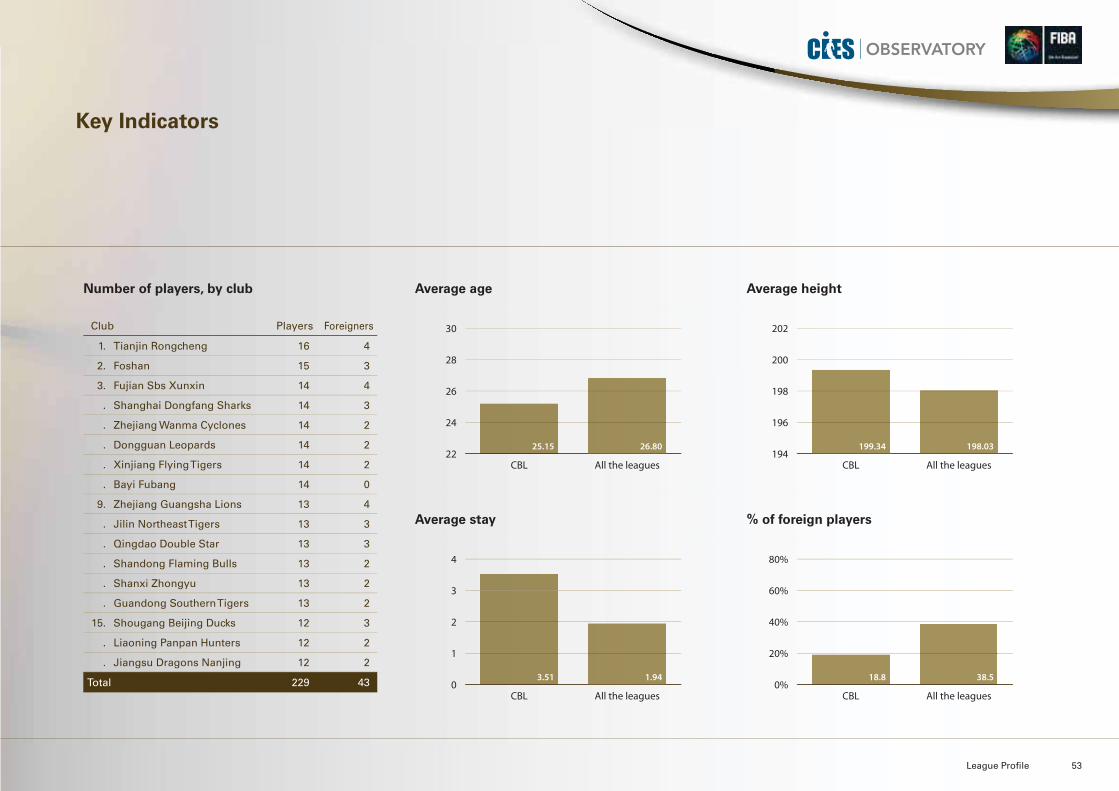
Club Players Foreigners
1. Tianjin Rongcheng 16 4
2. Foshan 15 3
3. Fujian Sbs Xunxin 14 4
. Shanghai Dongfang Sharks 14 3
. Zhejiang Wanma Cyclones 14 2
. Dongguan Leopards 14 2
. Xinjiang Flying Tigers 14 2
. Bayi Fubang 14 0
9. Zhejiang Guangsha Lions 13 4
. Jilin Northeast Tigers 13 3
. Qingdao Double Star 13 3
. Shandong Flaming Bulls 13 2
. Shanxi Zhongyu 13 2
. Guandong Southern Tigers 13 2
15. Shougang Beijing Ducks 12 3
. Liaoning Panpan Hunters 12 2
. Jiangsu Dragons Nanjing 12 2
Total 229 43
Average age
Average stay
Average height
% of foreign players
22
24
26
28
30
All the leaguesCBL
26.8025.15194
196
198
200
202
All the leaguesCBL
198.03199.34
0
1
2
3
4
All the leaguesCBL
1.943.510%
20%
40%
60%
80%
All the leaguesCBL
38.518.8
Number of players, by club
54 International Basketball Migration Report 2012
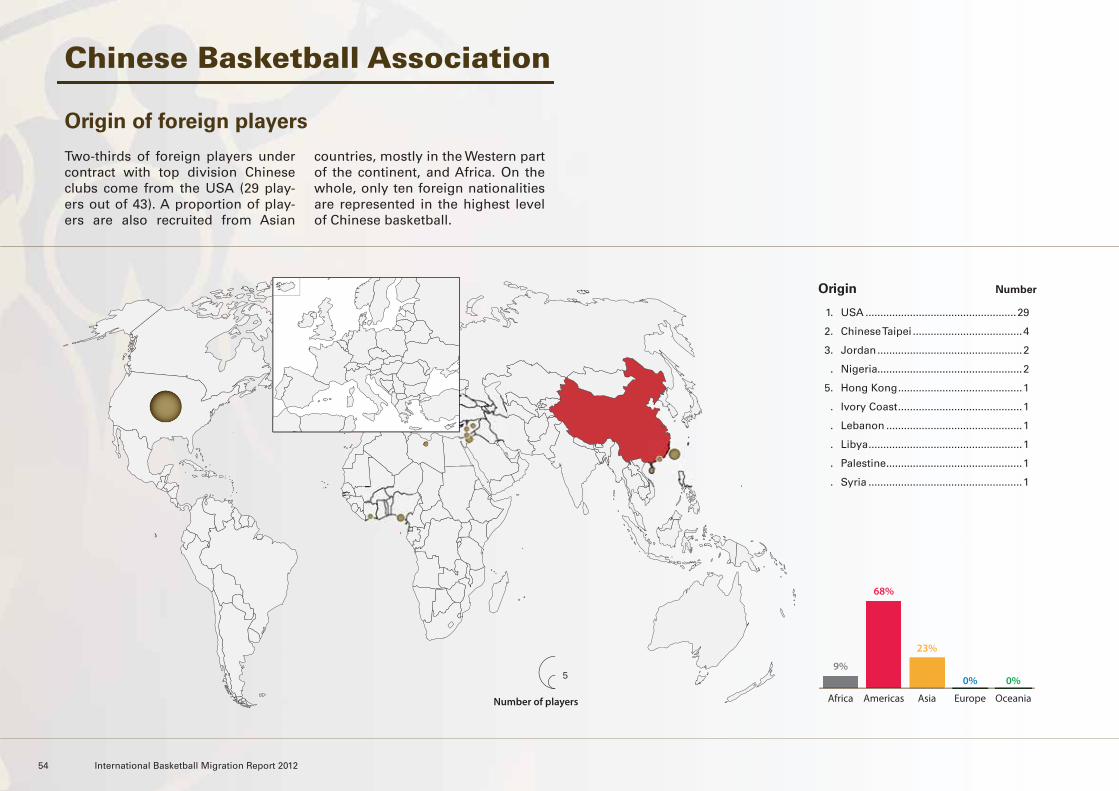
1. USA ...................................................29
2. Chinese Taipei .....................................4
3. Jordan .................................................2
. Nigeria.................................................2
5. Hong Kong ..........................................1
. Ivory Coast ..........................................1
. Lebanon ..............................................1
. Libya ....................................................1
. Palestine ..............................................1
. Syria ....................................................1
Chinese Basketball Association
Origin of foreign players
Two-thirds of foreign players under contract with top division Chinese clubs come from the USA (29 play-ers out of 43). A proportion of play-ers are also recruited from Asian
countries, mostly in the Western part of the continent, and Africa. On the whole, only ten foreign nationalities are represented in the highest level of Chinese basketball.
Origin Number
OceaniaEuropeAsiaAmericasAfrica
0%0%
23%
68%
9%
Number of players
5
League Profile 55
Nationals Foreigners
Av. age 24.25 29.00
Av. height 199.21 199.93
Av. stay 4.08 1.07
Av. min/game 17.43 32.63
Age
Year of recruitment
Height
Number of minutes per game
National vs foreign players
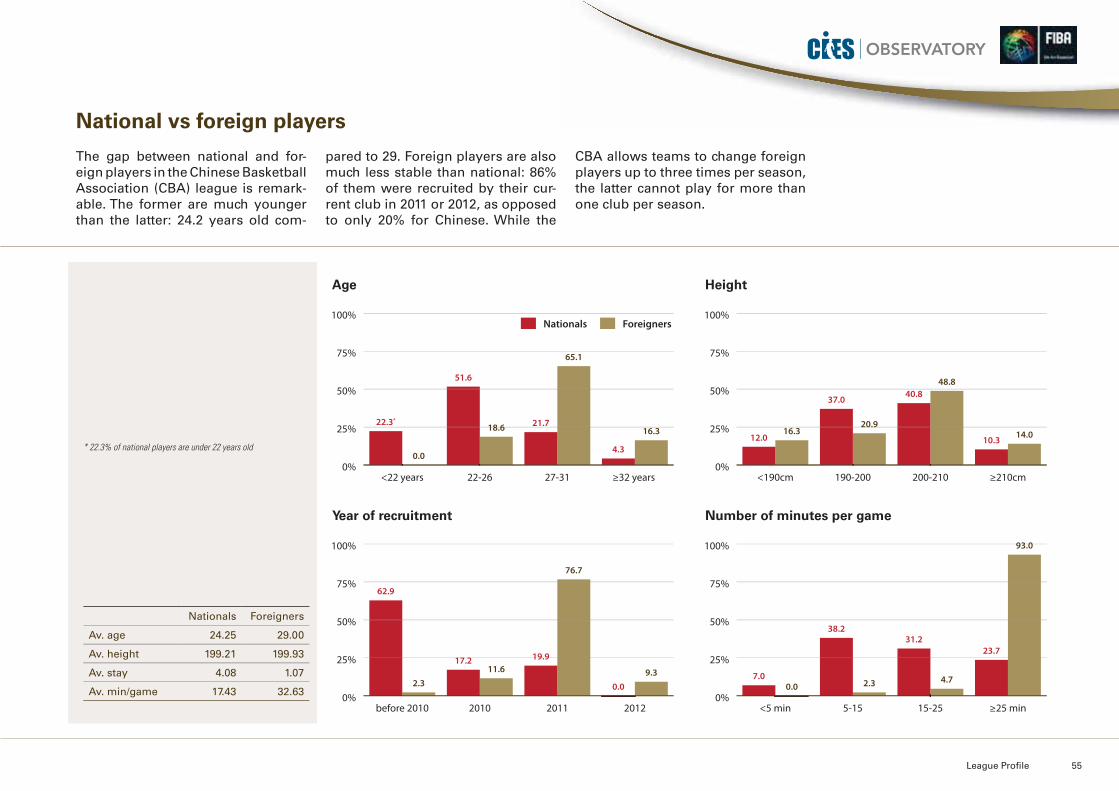
The gap between national and for-eign players in the Chinese Basketball Association (CBA) league is remark-able. The former are much younger than the latter: 24.2 years old com-
pared to 29. Foreign players are also much less stable than national: 86% of them were recruited by their cur-rent club in 2011 or 2012, as opposed to only 20% for Chinese. While the
CBA allows teams to change foreign players up to three times per season, the latter cannot play for more than one club per season.
0%
25%
50%
75%
100%
22.3*
4.3
65.1
21.718.6
51.6
0.0
16.3
≥32 years 27-3122-26<22 years
Nationals Foreigners
0%
25%
50%
75%
100%
12.0 10.3
48.840.8
20.9
37.0
16.3 14.0
≥210cm200-210190-200<190cm
0%
25%
50%
75%
100%
62.9
0.0
76.7
19.911.6
17.2
2.39.3
201220112010before 20100%
25%
50%
75%
100%
7.0
23.7
4.7
31.2
2.3
38.2
0.0
93.0
≥25 min15-255-15<5 min
* 22.3% of national players are under 22 years old

56 International Basketball Migration Report 2012
Liga A(Argentina)
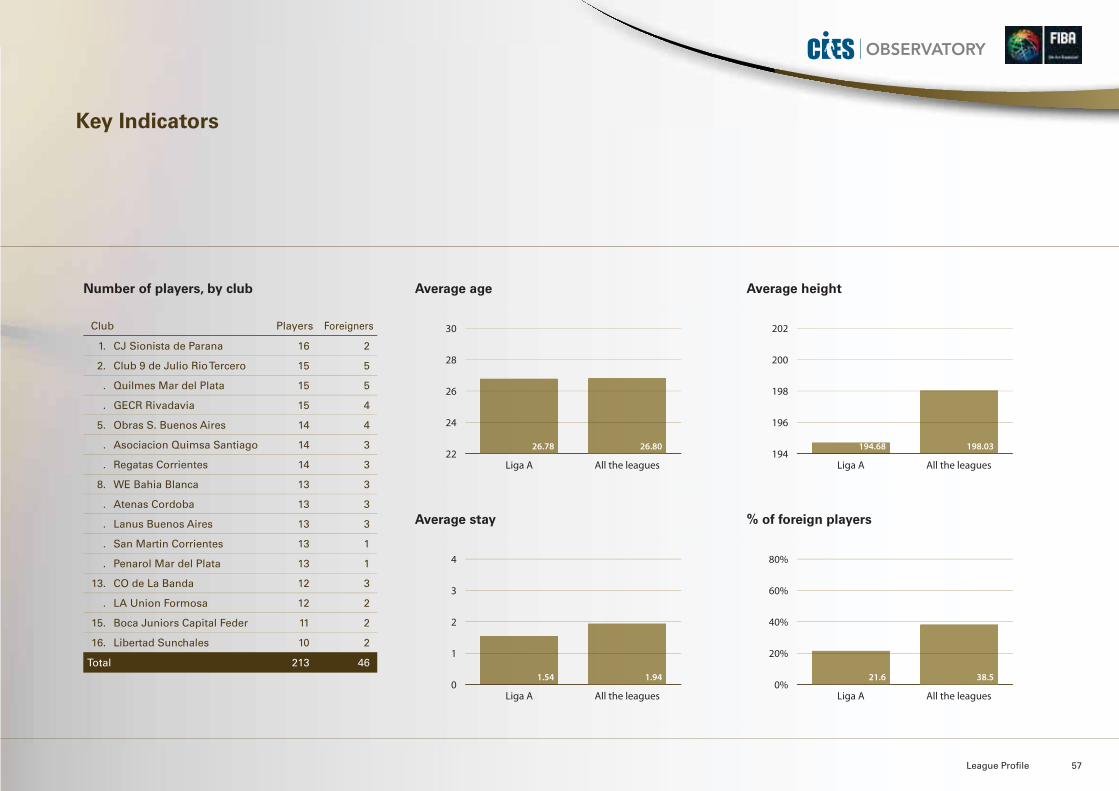
The Argentinean Liga Nacional de Bàsquet is in many respects different from the other leagues studied. Firstly, top division Argentinean clubs gather the shortest players (in average 194.7cm in comparison with 198cm in the other leaguessurveyed).
Similar to the situation observed in Australia and China, the percentage of foreigners islimited (21.6% versus 38.5% in all the leagues studied). This is related to the existence of quo-tas allowing clubs to have only three foreignplayers at the same time on their roster. Almost all foreign players originate from the USA (40 players out of 46).
League Profile 57
Key Indicators
Club Players Foreigners
1. CJ Sionista de Parana 16 2
2. Club 9 de Julio Rio Tercero 15 5
. Quilmes Mar del Plata 15 5
. GECR Rivadavia 15 4
5. Obras S. Buenos Aires 14 4
. Asociacion Quimsa Santiago 14 3
. Regatas Corrientes 14 3
8. WE Bahia Blanca 13 3
. Atenas Cordoba 13 3
. Lanus Buenos Aires 13 3
. San Martin Corrientes 13 1
. Penarol Mar del Plata 13 1
13. CO de La Banda 12 3
. LA Union Formosa 12 2
15. Boca Juniors Capital Feder 11 2
16. Libertad Sunchales 10 2
Total 213 46
Average age
Average stay
Average height
% of foreign players
22
24
26
28
30
All the leaguesLiga A
26.8026.78194
196
198
200
202
All the leaguesLiga A
198.03194.68
0
1
2
3
4
All the leaguesLiga A
1.941.540%
20%
40%
60%
80%
All the leaguesLiga A
38.521.6
Number of players, by club
58 International Basketball Migration Report 2012
1. USA ...................................................40
2. Panama ...............................................3
3. Puerto Rico .........................................2
4. Uruguay ..............................................1
Liga A
Origin of foreign players
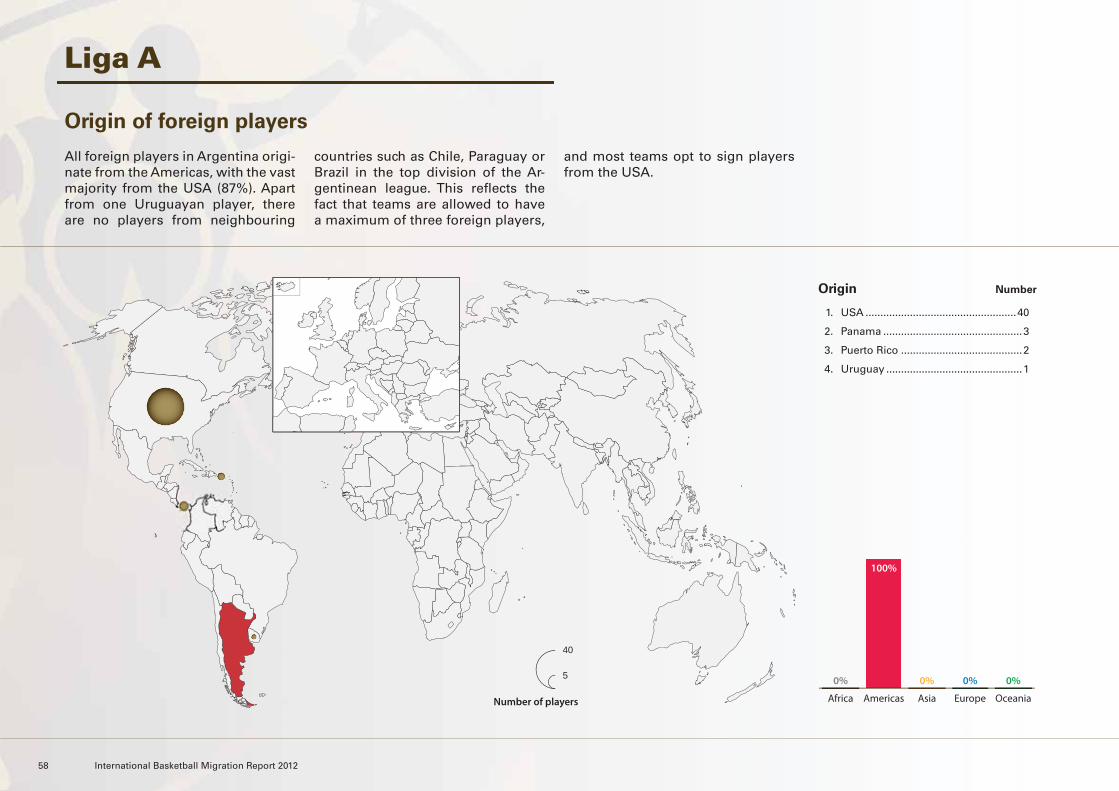
All foreign players in Argentina origi-nate from the Americas, with the vast majority from the USA (87%). Apart from one Uruguayan player, there are no players from neighbouring
countries such as Chile, Paraguay or Brazil in the top division of the Ar-gentinean league. This reflects the fact that teams are allowed to have a maximum of three foreign players,
and most teams opt to sign players from the USA.
Origin Number
OceaniaEuropeAsiaAmericasAfrica
0%0%0%
100%
0%
Number of players
5
40
League Profile 59
Nationals Foreigners
Av. age 25.73 30.50
Av. height 193.13 200.20
Av. stay 1.74 0.85
Av. min/game 14.44 24.13
Age
Year of recruitment
Height
Number of minutes per game
National vs foreign players
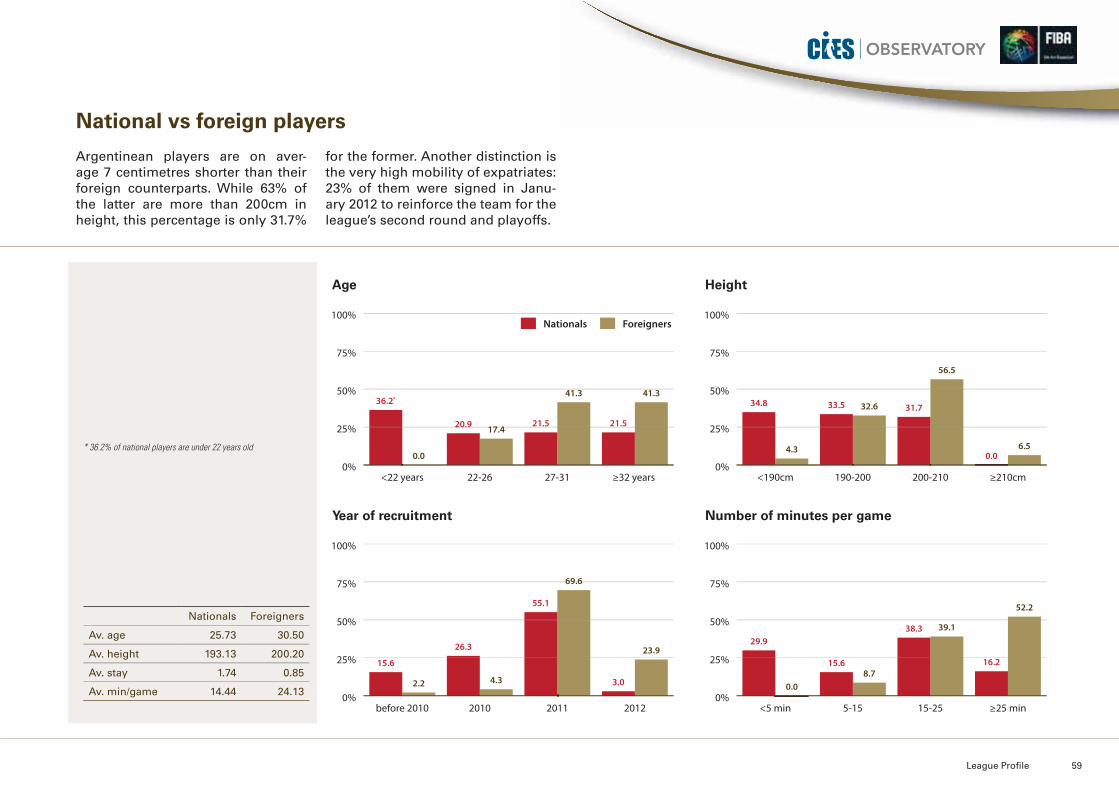
Argentinean players are on aver-age 7 centimetres shorter than their foreign counterparts. While 63% of the latter are more than 200cm in height, this percentage is only 31.7%
for the former. Another distinction is the very high mobility of expatriates: 23% of them were signed in Janu-ary 2012 to reinforce the team for the league’s second round and playoffs.
0%
25%
50%
75%
100%
36.2*
21.5
41.3
21.517.420.9
0.0
41.3
≥32 years 27-3122-26<22 years
Nationals Foreigners
0%
25%
50%
75%
100%
34.8
0.0
56.5
31.732.633.5
4.3 6.5
≥210cm200-210190-200<190cm
0%
25%
50%
75%
100%
15.6
3.0
69.6
55.1
4.3
26.3
2.2
23.9
201220112010before 20100%
25%
50%
75%
100%
29.9
16.2
39.138.3
8.715.6
0.0
52.2
≥25 min15-255-15<5 min
* 36.2% of national players are under 22 years old

60 International Basketball Migration Report 2012
Superleague(Ukraine)
The demographic profile of players in the Ukrainian Superleague is similar to that ob-served in the twelve leagues surveyed. This holds true in terms of age, height, average stay and the relative presence of foreign players.
While USA players represent two thirds of for-rreigners under contract with local clubs, there are also many players originating from other Eastern European countries. Similar to Russia, Serbia is the second most represented country among foreign players.
Clubs are obliged to permanently field a na-tional player. Moreover, they can simultane-ously have no more than five foreign players on their roster.
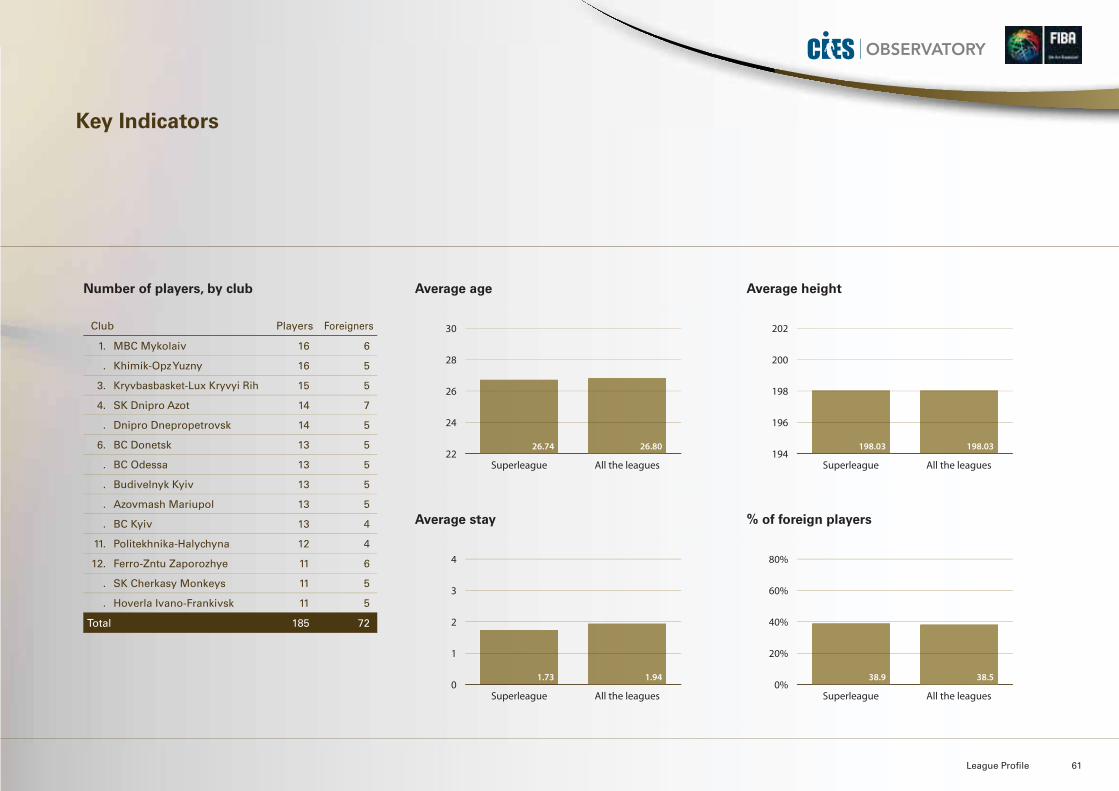
League Profile 61
Key Indicators
Club Players Foreigners
1. MBC Mykolaiv 16 6
. Khimik-Opz Yuzny 16 5
3. Kryvbasbasket-Lux Kryvyi Rih 15 5
4. SK Dnipro Azot 14 7
. Dnipro Dnepropetrovsk 14 5
6. BC Donetsk 13 5
. BC Odessa 13 5
. Budivelnyk Kyiv 13 5
. Azovmash Mariupol 13 5
. BC Kyiv 13 4
11. Politekhnika-Halychyna 12 4
12. Ferro-Zntu Zaporozhye 11 6
. SK Cherkasy Monkeys 11 5
. Hoverla Ivano-Frankivsk 11 5
Total 185 72
Average age
Average stay
Average height
% of foreign players
22
24
26
28
30
All the leaguesSuperleague
26.8026.74194
196
198
200
202
All the leaguesSuperleague
198.03198.03
0
1
2
3
4
All the leaguesSuperleague
1.941.730%
20%
40%
60%
80%
All the leaguesSuperleague
38.538.9
Number of players, by club
62 International Basketball Migration Report 2012
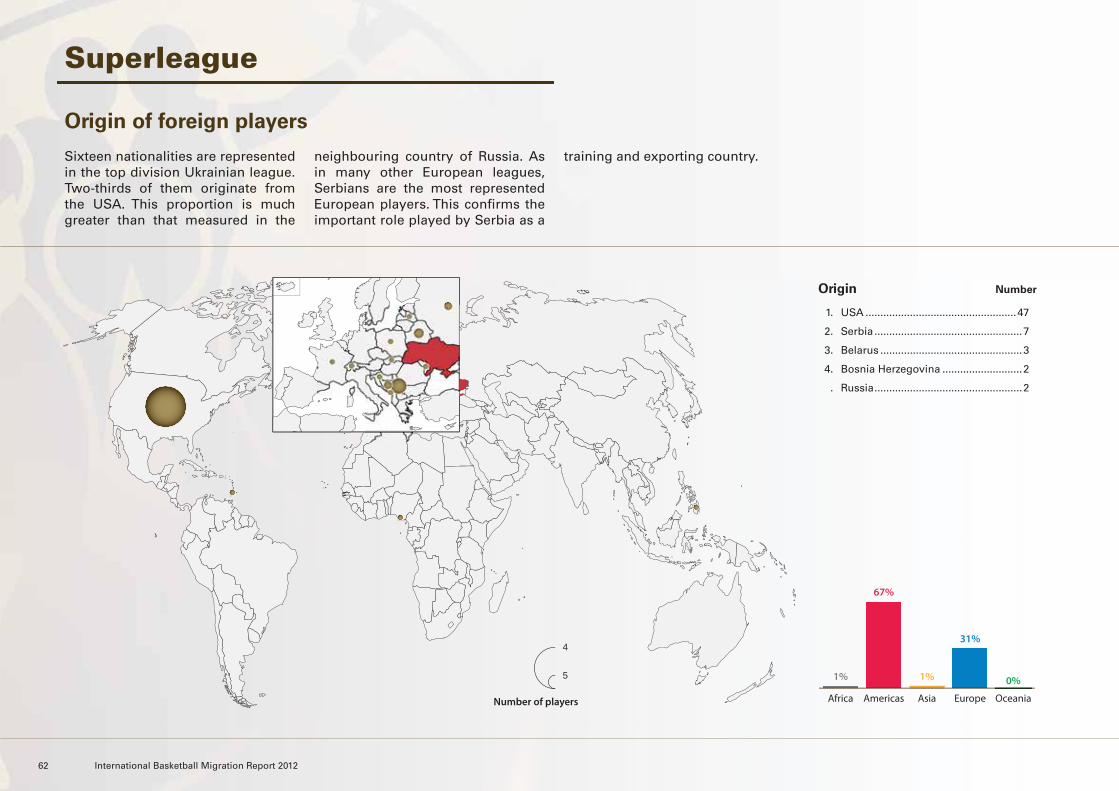
1. USA ...................................................47
2. Serbia ..................................................7
3. Belarus ................................................3
4. Bosnia Herzegovina ...........................2
. Russia ..................................................2
Superleague
Origin of foreign players
Sixteen nationalities are represented in the top division Ukrainian league. Two-thirds of them originate from the USA. This proportion is much greater than that measured in the
neighbouring country of Russia. As in many other European leagues, Serbians are the most represented European players. This confirms the important role played by Serbia as a
training and exporting country.
Origin Number
OceaniaEuropeAsiaAmericasAfrica
0%
31%
1%
67%
1%
Number of players
5
4
League Profile 63
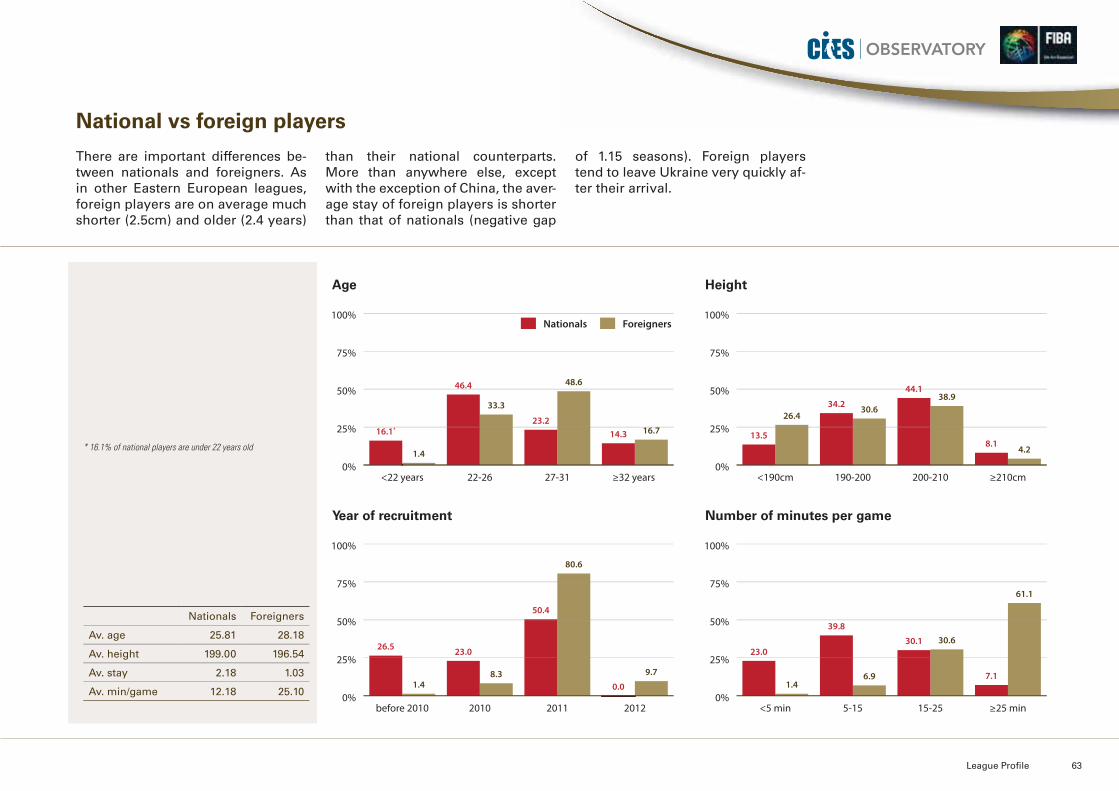
Nationals Foreigners
Av. age 25.81 28.18
Av. height 199.00 196.54
Av. stay 2.18 1.03
Av. min/game 12.18 25.10
Age
Year of recruitment
Height
Number of minutes per game
National vs foreign players
There are important differences be-tween nationals and foreigners. As in other Eastern European leagues, foreign players are on average much shorter (2.5cm) and older (2.4 years)
than their national counterparts. More than anywhere else, except with the exception of China, the aver-age stay of foreign players is shorter than that of nationals (negative gap
of 1.15 seasons). Foreign players tend to leave Ukraine very quickly af-ter their arrival.
0%
25%
50%
75%
100%
16.1*14.3
48.6
23.2
33.3
46.4
1.4
16.7
≥32 years 27-3122-26<22 years
Nationals Foreigners
0%
25%
50%
75%
100%
13.58.1
38.944.1
30.634.226.4
4.2
≥210cm200-210190-200<190cm
0%
25%
50%
75%
100%
26.5
0.0
80.6
50.4
8.3
23.0
1.49.7
201220112010before 20100%
25%
50%
75%
100%
23.0
7.1
30.630.1
6.9
39.8
1.4
61.1
≥25 min15-255-15<5 min
* 16.1% of national players are under 22 years old

64 International Basketball Migration Report 2012
About FIBA and CIES Observatory
FIBA
The International Basketball Federation (FIBA) is the world governing body for basketball and is an independent as-sociation formed by 213 National Basketball Federations throughout the world. FIBA is a non-profit making organi-sation based in Geneva, Switzerland and is recognised by the International Olympic Committee (IOC) as the sole competent authority in basketball.FIBA’s main mission is to develop and promote the game of basketball, to bring people together and unite the com-munity. FIBA’s main activities include establishing the Of-ficial Basketball Rules, the specifications for equipment and facilities, the rules regulating international competi-tions and the transfer of players as well as the appoint-ment of referees.FIBA’s main competitions include the FIBA Basketball World Cup and the FIBA World Championship for Women (both held every four years), the U17 FIBA World Cham-pionships for men and women (held every even calendar year) and the U19 FIBA World Championships for men and women (held every odd calendar year). Additionally, FIBA oversees the organisation of the Olympic Basketball Tournaments for men and women.FIBA also promotes the worldwide development for 3x3 Basketball, hosting the FIBA 3x3 World Tour, and the sen-ior and youth FIBA 3x3 World Cups.FIBA’s upcoming tournaments include the 2012 Olympic Qualifying Tournaments for men and women in Venezuela and Turkey respectively, and the FIBA U17 World Champi-onships for men and women in Lithuania and the Neth-erlands, while the inaugural FIBA 3x3 World Tour and the FIBA 3x3 World Cups will also be held in 2012.The 2014 FIBA World Cup will be held in Spain.For more information, visit www.fiba.com
The CIES Observatory is a research group within the In-ternational Centre for Sports Studies (CIES). The CIES is a independent foundation located in the Swiss town of Neuchâtel and affiliated to the local university.The CIES Observatory research team gathers experts specialized in the statistical analysis of sport. Its aim is to provide top level services for sports governing bodies in the areas of surveys, databases, data mining and sport-business intelligence.The academic team are experts in the statistical analysis of all areas of sport and regularly undertake research ac-tivities and develop joint projects with a wide range of sport industry stakeholders both nationally and interna-tionally.Since 2005, the CIES has also endorsed the Professional Football Players Observatory (PFPO) which was set up by the CIES Observatory chief researchers - Dr Raffaele Poli and Dr Loïc Ravenel. It was renamed as the CIES Football Observatory in 2011.For more information, please visit www.cies.chFollow us on Twitter at: www.twitter.com/@sportCIES
CIES Observatory

CIES OBSERVATORY
Avenue DuPeyrou 12000 Neuchâtel - Switzerland tel +41 (0)32 718 39 00
www.cies.ch
ABSTRACT
The International Basketball Migration Report includes detailed analysis by the CIES Observatory academic team of official data supplied by FIBA from the previous calendar year on international transfers. The 64 page illustrated report has for the first time unveiled market trends and highlighted new challenges from a business intelligence perspective.