intermodal yearbook 2011/2012 logistics and distribution ... · intermodal yearbook 2011/2012...
TRANSCRIPT
Intermodal Yearbook 2011/2012 Logistics and Distribution Concepts 09
of the project represent a stepping stone
for a clearer understanding of the transport
market service characteristics, requirements,
and functionalities in the South East
and North Adriatic areas, which represent
a key gateway for boosting traffi c
to/from Africa, North Europe, Black Sea
and the Far East/China”.
provides valuable insights into the South East
European area in support of improvements
to connections between sea ports, inland
ports and hinterland logistics centres in these
areas, by defi ning common indicators and
mapping the multimodal logistics facilities,
as well as in support of the implementation
of national and local infrastructure plans.
According to the author11, who led and
coordinated the activities summarised
in the aforementioned study, “the fi ndings
integration between seaports and interports.
But this would require greater liberalisation
and further regulatory changes for rail traction
service provision in port-hinterland markets.
In order to achieve greater effi ciency
and sustainability, it is essential to think
holistically about regional intermodal
infrastructure and service provision,
regulation and use. From a general
perspective, an expansion of the customs
facilities and facilitations for inland container
traffi c throughout the Campanian core
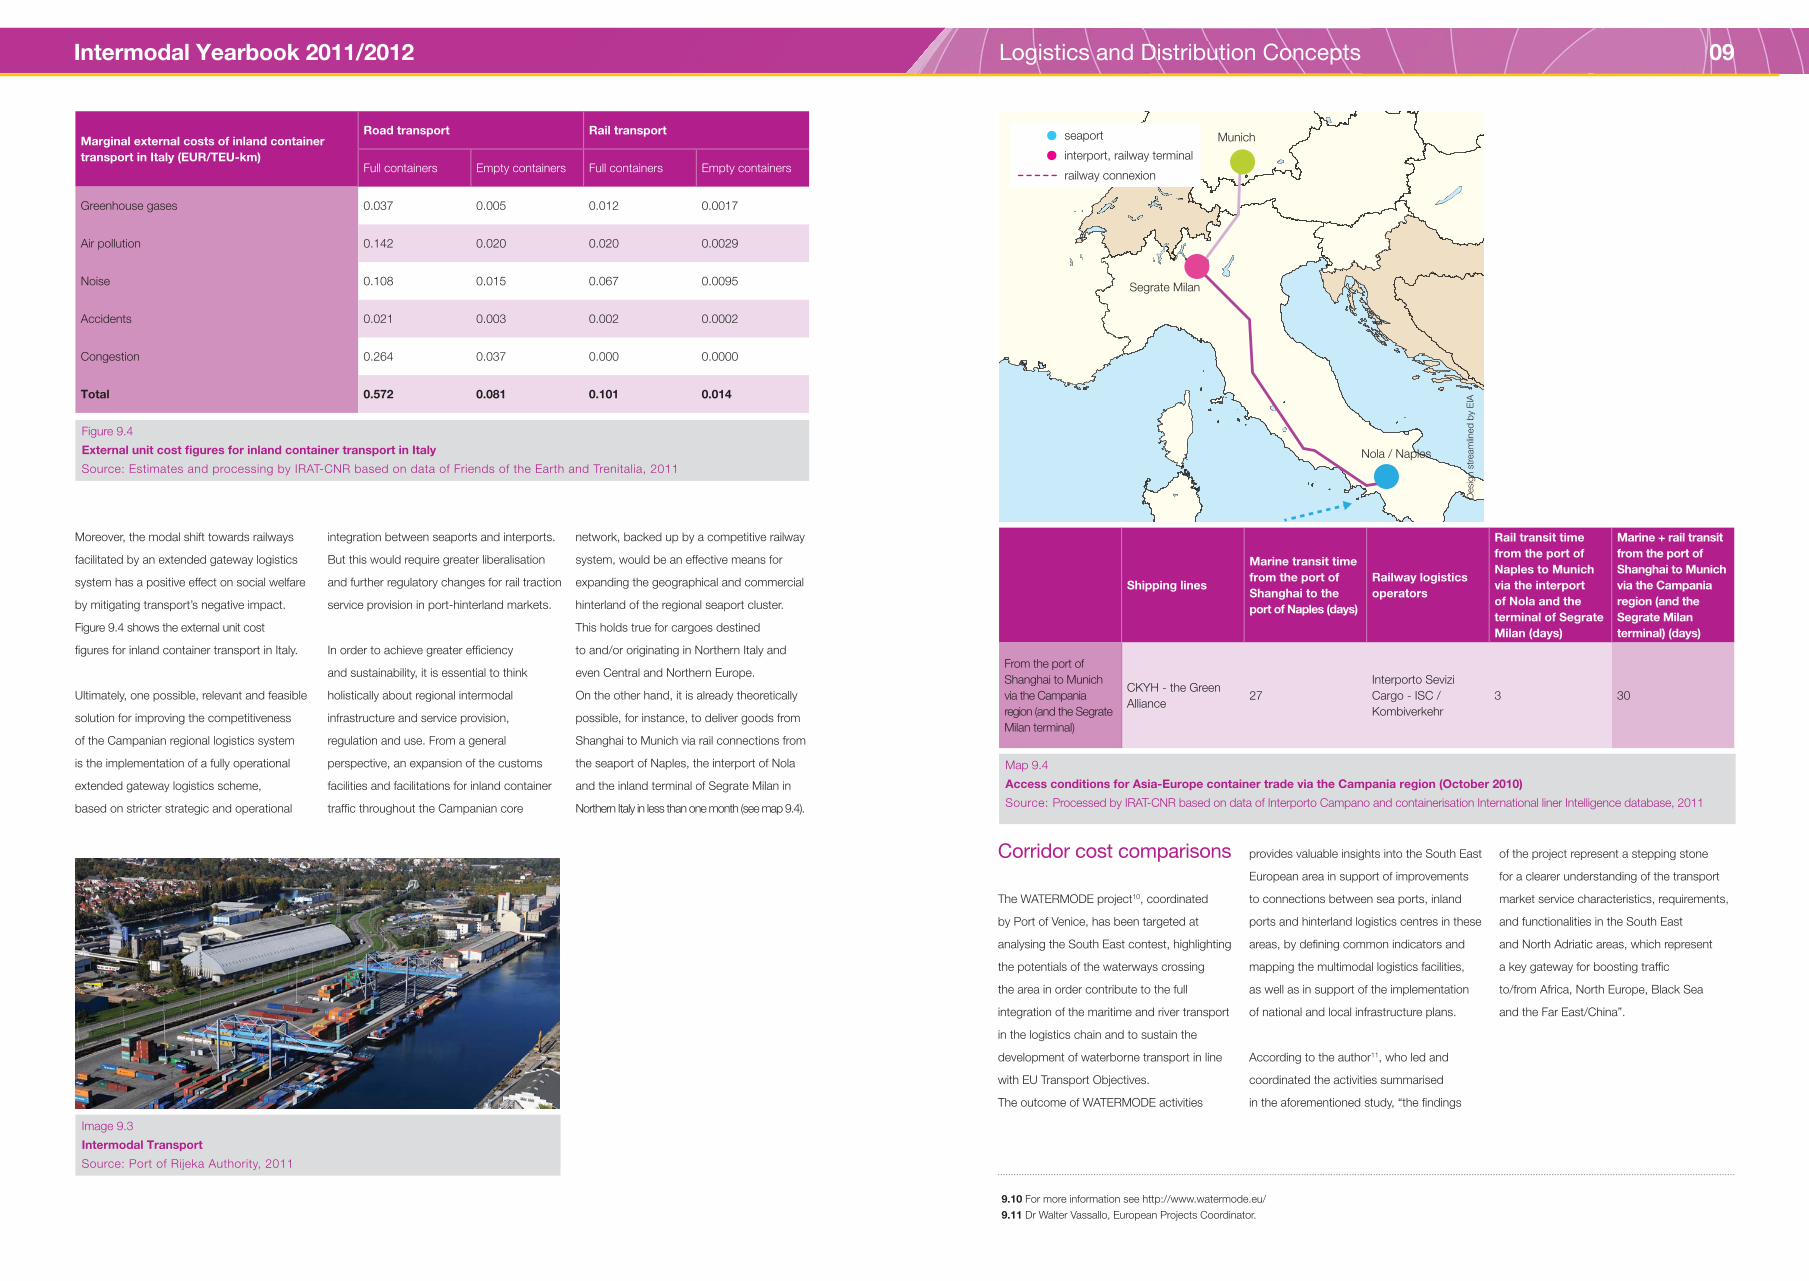
Moreover, the modal shift towards railways
facilitated by an extended gateway logistics
system has a positive effect on social welfare
by mitigating transport’s negative impact.
Figure 9.4 shows the external unit cost
fi gures for inland container transport in Italy.
Ultimately, one possible, relevant and feasible
solution for improving the competitiveness
of the Campanian regional logistics system
is the implementation of a fully operational
extended gateway logistics scheme,
based on stricter strategic and operational
network, backed up by a competitive railway
system, would be an effective means for
expanding the geographical and commercial
hinterland of the regional seaport cluster.
This holds true for cargoes destined
to and/or originating in Northern Italy and
even Central and Northern Europe.
On the other hand, it is already theoretically
possible, for instance, to deliver goods from
Shanghai to Munich via rail connections from
the seaport of Naples, the interport of Nola
and the inland terminal of Segrate Milan in
Northern Italy in less than one month (see map 9.4).
Corridor cost comparisons
The WATERMODE project10, coordinated
by Port of Venice, has been targeted at
analysing the South East contest, highlighting
the potentials of the waterways crossing
the area in order contribute to the full
integration of the maritime and river transport
in the logistics chain and to sustain the
development of waterborne transport in line
with EU Transport Objectives.
The outcome of WATERMODE activities
Marginal external costs of inland container
transport in Italy (EUR/TEU-km)
Road transport Rail transport
Full containers Empty containers Full containers Empty containers
Greenhouse gases 0.037 0.005 0.012 0.0017
Air pollution 0.142 0.020 0.020 0.0029
Noise 0.108 0.015 0.067 0.0095
Accidents 0.021 0.003 0.002 0.0002
Congestion 0.264 0.037 0.000 0.0000
Total 0.572 0.081 0.101 0.014
Shipping lines
Marine transit time
from the port of
Shanghai to the
port of Naples (days)
Railway logistics
operators
Rail transit time
from the port of
Naples to Munich
via the interport
of Nola and the
terminal of Segrate
Milan (days)
Marine + rail transit
from the port of
Shanghai to Munich
via the Campania
region (and the
Segrate Milan
terminal) (days)
From the port of
Shanghai to Munich
via the Campania
region (and the Segrate
Milan terminal)
CKYH - the Green
Alliance27
Interporto Sevizi
Cargo - ISC /
Kombiverkehr
3 30
Figure 9.4 External unit cost fi gures for inland container transport in Italy
Source: Estimates and processing by IRAT-CNR based on data of Friends of the Earth and Trenitalia, 2011
Image 9.3 Intermodal Transport
Source: Port of Rijeka Authority, 2011
Map 9.4 Access conditions for Asia-Europe container trade via the Campania region (October 2010)
Source: Processed by IRAT-CNR based on data of Interporto Campano and containerisation International liner Intelligence database, 2011
9.10 For more information see http://www.watermode.eu/
9.11 Dr Walter Vassallo, European Projects Coordinator.
seaport
interport, railway terminal
railway connexion
Segrate Milan
Munich
Nola / Naples
Desig
n s
tream
lined
by
EIA
Intermodal Yearbook 2011/2012 Logistics and Distribution Concepts 09
Below, an example of the outcome
of sub-route Port Said – Venice – Vienna
is given (fi gures 9.5 - 9.9).
the various origin/destination pairs as well
as environmental assessment of the various
origin/destination pairs for each transport
mode used.
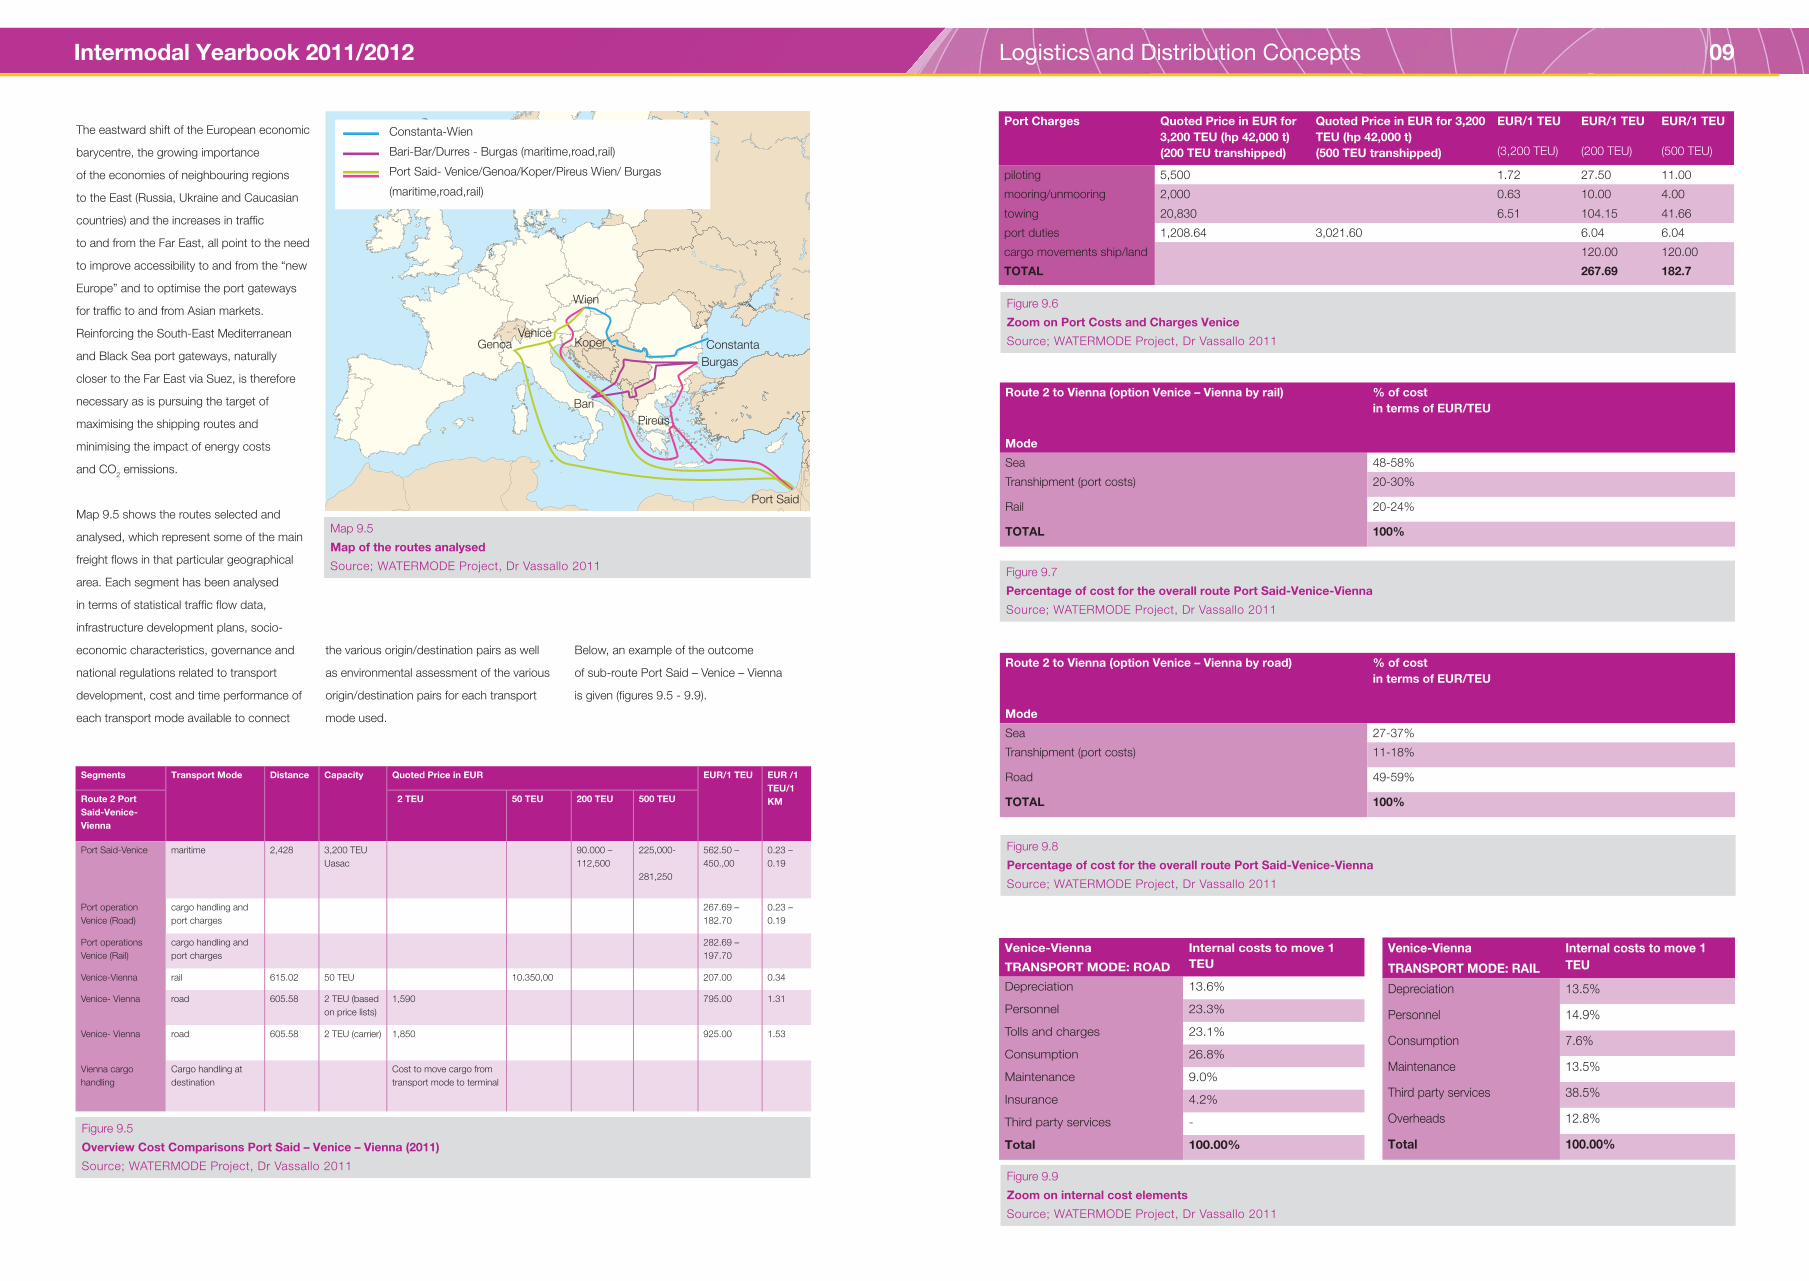
The eastward shift of the European economic
barycentre, the growing importance
of the economies of neighbouring regions
to the East (Russia, Ukraine and Caucasian
countries) and the increases in traffi c
to and from the Far East, all point to the need
to improve accessibility to and from the “new
Europe” and to optimise the port gateways
for traffi c to and from Asian markets.
Reinforcing the South-East Mediterranean
and Black Sea port gateways, naturally
closer to the Far East via Suez, is therefore
necessary as is pursuing the target of
maximising the shipping routes and
minimising the impact of energy costs
and CO2 emissions.
Map 9.5 shows the routes selected and
analysed, which represent some of the main
freight fl ows in that particular geographical
area. Each segment has been analysed
in terms of statistical traffi c fl ow data,
infrastructure development plans, socio-
economic characteristics, governance and
national regulations related to transport
development, cost and time performance of
each transport mode available to connect
Map 9.5 Map of the routes analysed
Source; WATERMODE Project, Dr Vassallo 2011
Segments Transport Mode Distance Capacity Quoted Price in EUR EUR/1 TEU EUR /1
TEU/1
KMRoute 2 Port
Said-Venice-
Vienna
2 TEU 50 TEU 200 TEU 500 TEU
Port Said-Venice maritime 2,428 3,200 TEU
Uasac
90.000 –
112,500
225,000-
281,250
562.50 –
450.,00
0.23 –
0.19
Port operation
Venice (Road)
cargo handling and
port charges
267.69 –
182.70
0.23 –
0.19
Port operations
Venice (Rail)
cargo handling and
port charges
282.69 –
197.70
Venice-Vienna rail 615.02 50 TEU 10.350,00 207.00 0.34
Venice- Vienna road 605.58 2 TEU (based
on price lists)
1,590 795.00 1.31
Venice- Vienna road 605.58 2 TEU (carrier) 1,850 925.00 1.53
Vienna cargo
handling
Cargo handling at
destination
Cost to move cargo from
transport mode to terminal
Figure 9.5 Overview Cost Comparisons Port Said – Venice – Vienna (2011)
Source; WATERMODE Project, Dr Vassallo 2011
Port Charges Quoted Price in EUR for
3,200 TEU (hp 42,000 t)
(200 TEU transhipped)
Quoted Price in EUR for 3,200
TEU (hp 42,000 t)
(500 TEU transhipped)
EUR/1 TEU EUR/1 TEU EUR/1 TEU
(3,200 TEU) (200 TEU) (500 TEU)
piloting 5,500 1.72 27.50 11.00
mooring/unmooring 2,000 0.63 10.00 4.00
towing 20,830 6.51 104.15 41.66
port duties 1,208.64 3,021.60 6.04 6.04
cargo movements ship/land 120.00 120.00
TOTAL 267.69 182.7
Figure 9.6 Zoom on Port Costs and Charges Venice
Source; WATERMODE Project, Dr Vassallo 2011
Route 2 to Vienna (option Venice – Vienna by rail) % of cost
in terms of EUR/TEU
Mode
Sea 48-58%
Transhipment (port costs) 20-30%
Rail 20-24%
TOTAL 100%
Figure 9.7 Percentage of cost for the overall route Port Said-Venice-Vienna
Source; WATERMODE Project, Dr Vassallo 2011
Route 2 to Vienna (option Venice – Vienna by road) % of cost
in terms of EUR/TEU
Mode
Sea 27-37%
Transhipment (port costs) 11-18%
Road 49-59%
TOTAL 100%
Figure 9.8 Percentage of cost for the overall route Port Said-Venice-Vienna
Source; WATERMODE Project, Dr Vassallo 2011
Venice-Vienna Internal costs to move 1
TEUTRANSPORT MODE: ROAD
Depreciation 13.6%
Personnel 23.3%
Tolls and charges 23.1%
Consumption 26.8%
Maintenance 9.0%
Insurance 4.2%
Third party services -
Total 100.00%
Venice-Vienna Internal costs to move 1
TEUTRANSPORT MODE: RAIL
Depreciation 13.5%
Personnel 14.9%
Consumption 7.6%
Maintenance 13.5%
Third party services 38.5%
Overheads 12.8%
Total 100.00%
Figure 9.9
Zoom on internal cost elements
Source; WATERMODE Project, Dr Vassallo 2011
Wien
VeniceGenoa
Bari
Koper Constanta
Burgas
Pireus
Port Said
Constanta-Wien
Bari-Bar/Durres - Burgas (maritime,road,rail)
Port Said- Venice/Genoa/Koper/Pireus Wien/ Burgas
(maritime,road,rail)

Intermodal Yearbook 2011/2012 Logistics and Distribution Concepts 09
with the introduction of Circle Lines,
the integration of proven logistics concepts
to create a full supply chain system.
Circle Lines leads to substantial transport
cost and CO2 reductions. Industrial estates
that are connected benefi t from positive
spinoffs in relation to their logistics centres
and local property prices.
Innovative sustainable transport between port city areas and their hinterland
Circle Lines
Sustainable accessibility of port city areas
for container transport is possible
✔ After the crisis of 2009 there was
an average decrease of about 15%
for the Northern European ports
and 6.7% for the Mediterranean.
The situation was much better
at the end of 2010 with (estimated)
Northern Europe + 7.6%, Southern
Europe + 6.2%, Eastern Europe + 20.1 %.
✔ It is important to note that growth
in the Mediterranean ports is mainly due
to transhipment (from 37.6% in 2001
to 47% in 2009).
✔ A shift of vessels from primary routes
to secondary routes in parallel with
an increase in mean dimensions.
✔ The North East Adriatic can, in the future,
play a major role as the gateway for traffi c
towards Central/South East/Black Sea
routes.
✔ German, Austrian, Czech, Slovak
operators look to the Adriatic for their
maritime terminals for Far East, China,
India and North African traffi cs.
✔ In this North Adriatic area, ports such
as Rijeka, Trieste, Koper have been
growing at annual rates in excess of 8.6%.
✔ Traffi c with China is increasing but
only represents about 5% in exports,
2.4% in imports from the North East
in the total for these two main Adriatic
Regions, which suggests that could
be much more to come in the future.
The main results of the aforementioned
project are thus summarised below:
✔ There is a risk that the capacity of existing
infrastructure may be exceeded at
port and inland terminals in the North
East Adriatic.
✔ There are possibilities in the areas of the
North Adriatic for acquiring new traffi cs
from/to Central Eastern Europe
(e.g. Bavaria, Hungary, Serbia).
✔ The Inland Terminals could become
contact points and partners for the ports
with regard to the land leg.
They can become gateways for the
consolidation of traffi c fl ows (e.g. Padua
for Eastern EU, Verona for Central-North
EU, Bologna for North-South in Italy).
Route 2 to Vienna
(option 1 Venice –
Vienna rail)
Transp.
Mode
Km Transit Time (in hr) Handling
Time
(200 TEU)
Handling
Time
(500 TEU)
Waiting
time
By sea theoretical (*) By sea Uasac By sea (in hr) (in hr) (in hr)
Port Said - Venice sea 2,428 100.8 240 120-168
Handling cargo in Venice port 8 20 168
Venice-Vienna rail 615.02 15.5 15.5 15.5
Total 3,043.02 116.3 8 20 168
Route 2 to Vienna
(option 1 Venice –
Vienna road)
Transp.
Mode
Km Transit Time (in hr) Handling
Time
(200 TEU)
Handling
Time
(500 TEU)
Waiting
time
By sea theoretical (*) By sea Uasac By sea (in hr) (in hr) (in hr)
Port Said - Venice sea 2,428 100.8 240 120-168
Handling cargo in Venice port 8 20 168
Venice-Vienna road 605.58 8 8 8
Total 3,033.58 108.8 8 20 168
Figure 9.10 Time Performance
Source; WATERMODE Project, Dr Vassallo 2011
Circle Lines is a project (2008-2011) funded
by the European Commission and sponsored
by the Dutch Ministry of Economic Affairs.
It also involves unique cooperation between
3 Provinces, 7 municipalities and the Port
of Amsterdam together with a number
of industrial fi rms.
Map 9.6
Circle Line concept
Source: Port of Amsterdam; 2011
1
23
National
RegionalPort area
1 National cargo transport Amsterdam
Schiphol Airport – Rotterdam
2 Regional cargo transport Shuttle
services industrial estates – ports
3 Cargo Transport Port Region Shuttle
Service in the port area/region
Transhipment points industrial
estates alongside waterways
Schipol Airport
Full Supply Hub
Amsterdam
Antwerp
Rotterdam Transferium
Duisburg