intermodal transportation in colombia sustainable growth
DESCRIPTION
Intermodal Transportation in Colombia Sustainable Growth. E D G A R H I G U E R A Manager Logistics, Transportation and Infrastructure Management Office. Bogotá, Octubre 23 de 2014. Atlantic Ocean. Population: 47.121.089. 1.600 km. Economy. Venezuela. Panamá. - PowerPoint PPT PresentationTRANSCRIPT


E D G A R H I G U E R AE D G A R H I G U E R AManagerManager
Logistics, Transportation and Infrastructure Management Office
Bogotá, Octubre 23 de 2014Bogotá, Octubre 23 de 2014
Intermodal Transportation in Intermodal Transportation in ColombiaColombia
Sustainable GrowthSustainable Growth

South America
Venezuela
AtlanticOcean
Panamá
PacificOcean
Ecuador
Perú
Brasil
Population: 47.121.089
Surface: 2.129.748 km²
- Continental: 1.141.748 km²
- Maritime: 988.000 km²
Land border: 6.342 km 1.645 km
-
Sea border: 2.800 km
Foreign trade
- Exports (current US$) : 67,11 Billion
- Imports (current US$): 74,41 Billion
2.219 km
1.626 km
266 km
: 586 km
1.600 km
1.300 km
Economy
- GDP (current US$): 378,15 Billion (30th of the world)
- GDP per capita (current US$) : 7.826

Current Trading Integration
Memo of understanding
Existing Agreement
Signed Agreement
Colombia has 10 sea terminals that sirven 34
routes through 42 shipping companies
Colombia has 2965 landing points in143 countries
Fuente: Proexport y MCYT
55 economies that represent 52,3% of the world GDP and an enlarged market of 1,5 billion people

With a close relation with transportation
En épocas de auge económico, el trafico de carga crece a tasas superiores y en épocas de recesión , el trafico decrece más rápido.
Cargo traffic in Colombia Vs GDP

However our competitiveness index is increasing slowly and….
Fuente: Global Competitiveness Report 2014-2015 - Foro Económico Mundial
2006 -2007 2007 -2008 2008 -2009 2009 -2010 2010 -2011 2011 -2012 2012 -2013 2013 -2014 2014 -2015Posición General ICG 65 69 74 69 68 68 69 69 66# Paises de Estudio 125 131 134 133 139 142 144 148 144Posición Relativa 48% 47% 45% 48% 51% 52% 52% 53% 54%
Índice de Competitividad Global - FEM
Evolución en la posición de Colombia

And we’re highly dependent on road transportation
Fuente: Ministerio de Transporte
Evolución1994 82,841 13,645 2,890 140 3,700 103,216 1995 86,741 14,616 2,634 140 4,000 108,131 1996 71,168 16,335 3,062 142 4,324 95,031 1997 89,399 17,206 2,755 139 3,997 113,496 1998 84,350 22,621 3,049 119 4,009 114,148 1999 77,674 25,402 3,735 134 1,385 108,330 2000 73,034 31,170 3,802 100 797 108,903 2001 100,284 33,457 3,069 104 720 137,634 2002 84,019 31,032 3,480 122 532 119,185 2003 99,782 42,781 3,725 132 928 147,348 2004 117,597 46,182 4,211 129 588 168,707 2005 139,646 49,227 4,863 135 400 194,271 2006 155,196 49,708 4,025 138 509 209,576 2007 183,126 53,204 4,563 137 454 241,484 2008 169,714 58,472 4,953 123 372 233,634 2009 173,558 59,398 4,070 109 364 237,499 2010 181,021 67,025 3,691 119 353 252,209 2011 191,701 74,554 3,650 124 ND 270,029 2012 199,369 76,800 3,474 127 388 280,158 2013 220,309 76,781 2,968 149 774 300,980
Fuente: Ministerio de Transporte
Miles de Toneladas
AÑO TERRESTE FLUVIAL AÉREO CABOTAJE TOTALFERREO
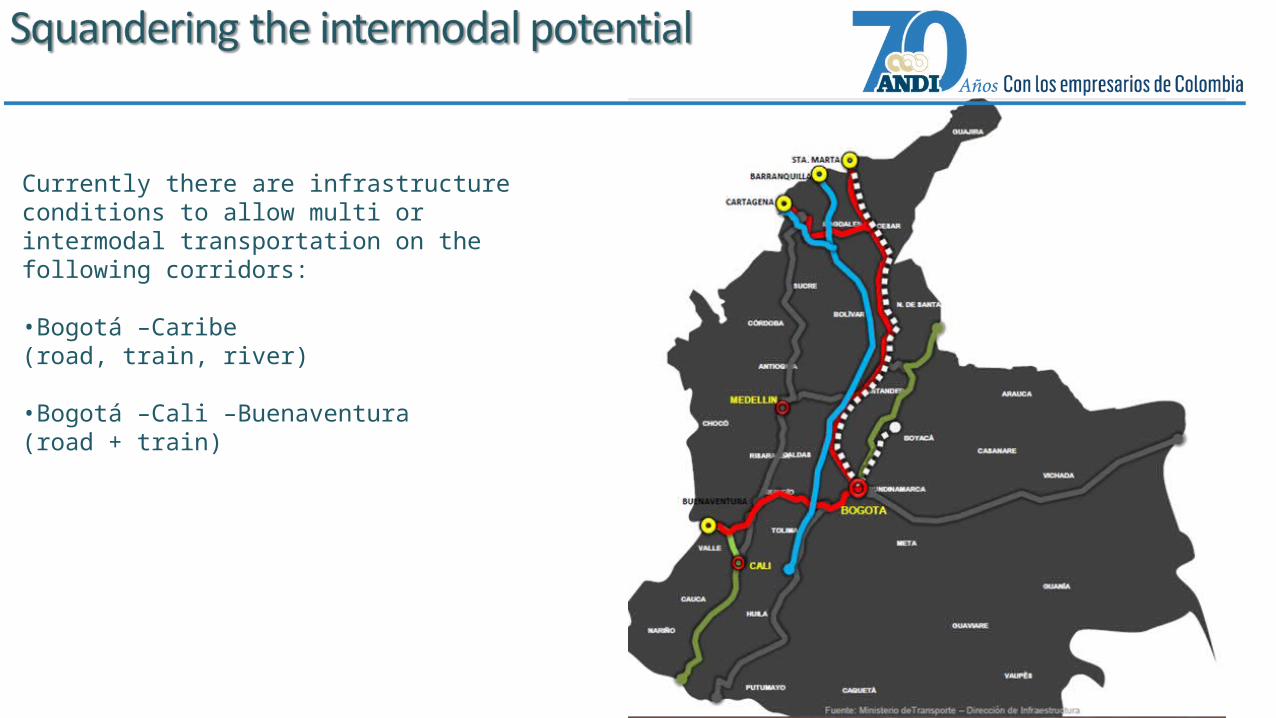
Currently there are infrastructure conditions to allow multi or intermodal transportation on the following corridors:
•Bogotá –Caribe(road, train, river)
•Bogotá –Cali –Buenaventura(road + train)

PTO CARRENO
CORREDORES LOGISTICOS
Operating road concessions
600 Km of dual highway constructed 2010 - 2014
World competitivity index

VILLAVICENCIO
CALI
BUGA
PEREIRA
SOGAMOSO
PALO DE LETRASCAUCASIA
MONTERÍA
SINCELEJO
CARMEN DE BOLÍVAR
VALLEDUPAR
BARRANQUILLA
CARTAGENA
SANTA MARTA
RIOHACHA
PARAGUACHON
SAN ROQUE
NECOCLÍ
PASTO
ZIPAQUIRA
Pamplona
Simití
Achí
San Marcos
SAN PELAYO
GIRARDOT
CÚCUTA
PTO CARRENO
NEIVA
PUERTO GAITÁN
POPAYÁN
SOGAMOSO
B/MANGA
CHACHAGÜÍ
ESPINAL
ARMENIA
IBAGUÉ
PTO. SALGAR
Cáqueza
CALERA
Sopó
TULUÁ
BUENAVENTURABUENAVENTURA
STDER. QUILICHAO
YOPAL
TAME
ARAUCA
Sisga
EL SECRETO
MOCOA
CARTAGO
Planeta Rica
Toluviejo
Cruz del Viso Carreto
PonederaLa Paz
San JuanBuenavista
Cuestecitas
Barbosa
Aguaclara
MANIZALES VILLETA
MEDELLÍN
BOGOTABOGOTA
BARRANCAB.REMEDIOS
Pto. Arimena
El Tigre
Pto. BerríoSanta fé de Ant.
Bolombolo
La Manuela
Camilo C
Túnel de Occidente
TUNJA
Aguachica
Granada
* Estimated amount. It may vary.* Estimated amount. It may vary.
New road concessions
Victorias Tempranas (611 Km) In bidding processCentro – Sur (567 Km)
Centro – Occidente (618 Km)Centro – Oriente (1882 Km)
Norte (1335 Km)Cordillera oriental (2766 Km)
Autopistas de la Prosperidad (1139 Km) In bidding process
8.918 Km in Total
USD$ 23 billion to invest*

VILLAVICENCIO
CALI
BUGA
PEREIRA
SOGAMOSO
PALO DE LETRASCAUCASIA
MONTERÍA
SINCELEJO
CARMEN DE BOLÍVAR
VALLEDUPAR
BARRANQUILLA
CARTAGENA
SANTA MARTA
RIOHACHA
PARAGUACHON
SAN ROQUE
NECOCLÍ
PASTO
ZIPAQUIRA
Pamplona
Simití
Achí
San Marcos
SAN PELAYO
GIRARDOT
CÚCUTA
PTO CARRENO
Current
New 4G
NEIVA
VILLAVICENCIO
PUERTO GAITÁN
POPAYÁN
CALI
SOGAMOSO
B/MANGA
CHACHAGÜÍ
ESPINAL
ARMENIA
IBAGUÉ
PTO. SALGAR
Cáqueza
CALERA
Sopó
LA PAILA
BUENAVENTURABUENAVENTURA
STDER. QUILICHAO
YOPAL
TAME
ARAUCA
Sisga
EL SECRETO
MOCOA
CARTAGO
Planeta Rica
La Yé
Toluviejo
Cruz del Viso Carreto
PonederaLa Paz
San JuanBuenavista
Cuestecitas
Barbosa
Aguaclara
MANIZALES VILLETA
MEDELLÍN
BOGOTABOGOTA
BARRANCAB.REMEDIOS
Pto. Arimena
El Tigre
Pto. BerríoSanta fé de Ant.
Bolombolo
La Manuela
Camilo C
Túnel de Occidente
TUNJA
Aguachica
Granada
Current Concessions + 4G Concessions
- USD$7.78 billion saving per - USD$7.78 billion saving per carbon emissions carbon emissions
- USD$1.18 billion saving per - USD$1.18 billion saving per operation costsoperation costs

Project: Recovery of River Magdalena’s navegability
General
Extension: 908 KM.Sector: TransportTotal costs: USD 1.25 billion
Unidades Funcionales
UF AlcanceEntrada en Operación
UF1 Bocas de Ceniza-la Gloria 2015
UF2 La Gloria –Barranca 2015UF3 Barranca-Puerto Berrio 2021UF4 Puerto Berrio-Puerto Salgar 2021
The aim of this Public and Private Association is to recover the Magdalena River as a main cargo transport way through the chanelling and maintenance of the canal.

Benefits of intermodal and river transportation
Minimizes waiting times at
transshipment points and congestion
Minimizes risks (citizen safety,
accidents, stroke prevention, deaths)
Reduces documentation and formalities.
Lower carbon print
Public health
Optimizes the use of land
180 vagones de 40 ton
Convoy de 7.200 ton
225 Camiones, equivales a una fila de 5 km uno detrás
de otro

Environmental Benefits
Studies were used as a baseline for decision making
Dredging has always been managed by Environment Management
Plan
Hydraulic works environmentally friendly.
Neither marshes interventions nor overflowing areas
There are funds for environmental compensations.

15
Corredor de TransporteMultimodal
Incentive for a change in the transportation mode in Colombia
The reduction in carbon dioxide emissions program, leaded by
CORMAGDALENA with the support of the French government and the Centro
Centro Andino para la Economía en el Medio Ambiente will achieve its goal
stimulating two practices:
(a) Changing the road transportation to river transportation
(b) Modernizing the naval fleet, promoting the purchase of high efficient
naval fleet, the use of dual fuel, use of natural gas, hybrid motors (diesel-
electric), and hopefully someday only solar and electric.

• Make use of other hidrografic basins
• Regulate intermodal transportation
• Manage operative/commercial changes
• Sustainable managing of the river
• Information systems
Ongoing challenges in Colombia

Fluvial Master Plan
Estrategia para desarrollar actividades fluviales de la Nación, teniendo en cuenta la caracterización de ríos más representativos, terminación estimada Dic/2014
Fluvial mode development support
Colombia – Netherlands Water Alliance

THANKS!THANKS!Logistics, Transportation and Infrastructure Management OfficeLogistics, Transportation and Infrastructure Management OfficeBogotá - Calle 73 No. 8-13, Phone: 571- 3268500 ext. 2240 - 2226Bogotá - Calle 73 No. 8-13, Phone: 571- 3268500 ext. 2240 - [email protected]@[email protected]@adi.com.co