interlaboratory tests of paving grade bitumen and …...grade 50/70 bitumen and polymer modified...
TRANSCRIPT
356
NAFTA-GAZ, ROK LXXII, Nr 5 / 2016
Krzysztof Błażejowski, Marta Wójcik-Wiśniewska
ORLEN Asfalt Sp. z o.o.
Jacek Olszacki, Hubert Peciakowski
PKN ORLEN S.A.
Interlaboratory tests of paving grade bitumen and polymer modified bitumen
In the paper the results of interlaboratory round-robin tests are presented. The RR program was executed for paving grade 50/70 bitumen and polymer modified bitumen 45/80-55. For both binders similar test programs have been prepared, starting from fundamental properties like Pen@25, Softening Point, Softening Point after RTFOT, Fraass breaking point, elastic recovery etc. and with use of more contemporary test methods as complex modulus G*, phase angle δ (60°C, f = 1.59 Hz (10 rad/s), PMB microstructure etc. Finally 8 properties for unmodified bitumen were tested and 9 for PMBs. In the program 24 laboratories from three european countries participated representing dif-ferent kinds of labs – private owned, technical universities, road administration and refinery control labs. The final results were evaluated with statistical and z-score method. Surprisingly results showed that the best methods with high reproductibility are complex modulus G* and phase angle δ.
Key words: interlaboratory tests, round-robin tests, paving grade bitumen, polymer modified bitumen, statistical evaluation.
Badania porównawcze asfaltów drogowych i modyfikowanych polimerami (PMB)W artykule zaprezentowano wyniki badań międzylaboratoryjnych zorganizowanych przez ORLEN Asfalt w 2012 roku. Program badań obejmował dwa rodzaje lepiszczy asfaltowych: asfalt drogowy 50/70 według PN-EN 12591 oraz asfalt modyfikowany polimerami PMB 45/80-55 według PN-EN 14023. Wśród wybranych parametrów oce-ny asfaltu drogowego 50/70 i modyfikowanego PMB 45/80-55 znalazły się badania obligatoryjne (zawarte w nor-mach, w oparciu o które produkowane są asfalty) oraz badania funkcjonalne oznaczane w reometrze dynamiczne-go ścinania DSR. Finalnie do porównań wybrano 8 właściwości asfaltu drogowego i 9 właściwości asfaltu modyfi-kowanego. W badaniach międzylaboratoryjnych wzięły udział 24 laboratoria reprezentujące zarówno inwestorów z branży drogowej jak i typowe jednostki badawcze. Otrzymane wyniki badań zostały poddane analizie statystycz-nej i ocenione zgodnie z ogólnymi zasadami opisanymi w normach: PN-EN ISO/IEC 17043:2011 Ocena zgodno-ści – Ogólne wymagania dotyczące badania biegłości oraz ISO 13528:2005 Statistical methods for use in proficien-cy testing by interlaboratory comparisons.
Słowa kluczowe: badania międzylaboratoryjne, badania porównawcze, asfalt drogowy, asfalt modyfikowany, ana-liza statystyczna.
The ORLEN Asfalt Research and Development Depart-ment has been making analyses of bitumens and gathering the data of the tests conducted for many years. The results of our own research, as well as that of other research insti-tutions which we have obtained via data exchange during
road construction-related conferences and seminars, have led the authors of this article to conduct an analysis of the deviations in the results of bituminous binders achieved by various laboratories, and by different operators (repro-ducibility). The scope of the project was an assessment
Introduction
DOI: 10.18668/NG.2016.05.07
artykuły
357Nafta-Gaz, nr 5/2016
of credibility received test results for paving grade and modified bitumen.
In mid-2012, ORLEN Asfalt organised a proficiency test1 via inter-laboratory comparison2, on the basis of guide-
lines included in standards PN-EN ISO/IEC 17043:2011 and ISO 13528:2005. The statistical processing of the test results was carried out by the ORLEN Laboratorium Sp. z o.o. company of the PKN ORLEN Corporate Group [4, 5, 6].
1 (PT – Proficiency Testing) – determination, via inter-laboratory comparisons, of the ability of a laboratory to perform tests or ratings (sometimes proficiency testing is also called EQA – External Quality Assurance) [1].
2 (ILC – Interlaboratory Comparisons) – organisation, performance and evaluation of tests or ratings of the same or various objects of test-ing or rating by at least two different laboratories, in accordance with previously defined conditions [1].
Purpose, Object and Scope of Performed Tests
The purpose of the performed test project was an objec-tive and impartial assessment of the quality of parameters of selected paving grade and modified bituminous binders by various road laboratories.
The tests were carried out on paving grade bitu-men 50/70 (sample A) as per PN-EN 12591, and poly-mer modified bitumen PMB 45/80-55 (sample B), as per PN-EN 14023 (National Annexe of 2011). Bitumen samples with a volume of 30 litres were extracted from ready-made
products tanks on one of the large-tank installations be-longing to ORLEN Asfalt Sp. z o.o., in accordance with PN-EN 58 (pt. 8.1.2. Sampling valve installed in tank walls). Each sample was mixed in order to achieve exact homo-geneity. Afterwards 30 “sub-samples” were extracted from the sample, with a volume of 1 litre each. The sub-samples were packaged in cardboard boxes lined internally with aluminium foil – specially designed for transporting and storage of bituminous binders. Such prepared and tagged
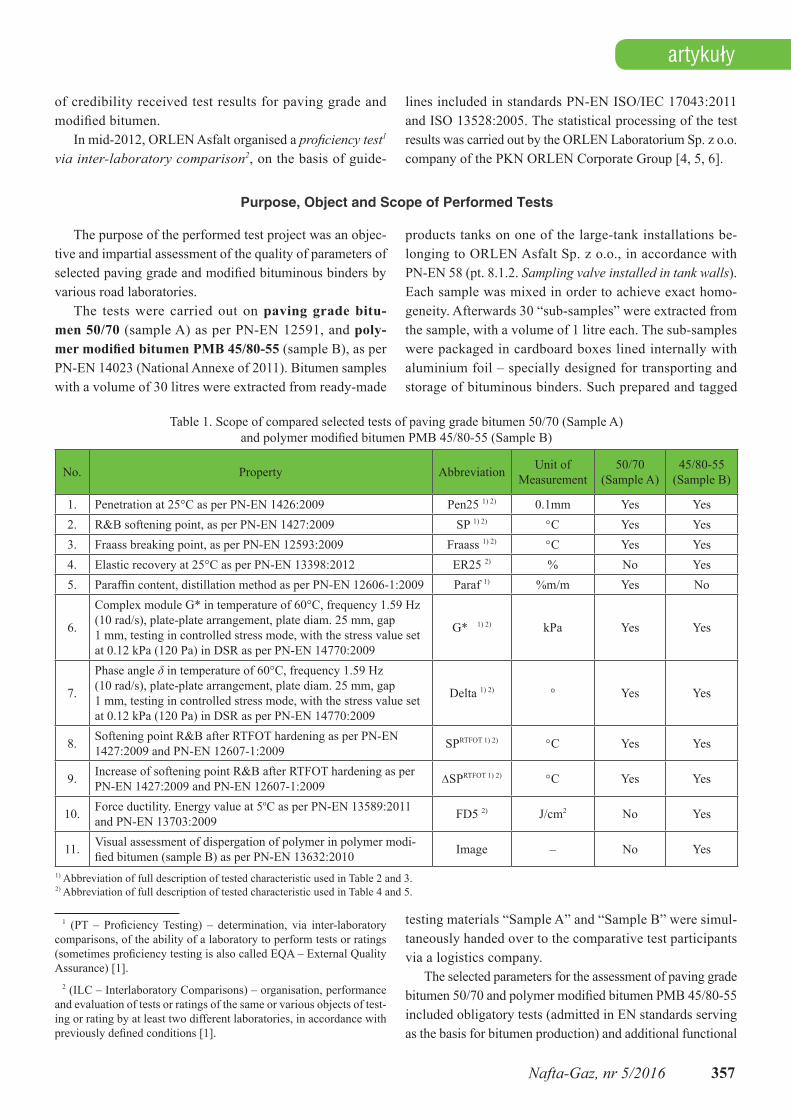
Table 1. Scope of compared selected tests of paving grade bitumen 50/70 (Sample A) and polymer modified bitumen PMB 45/80-55 (Sample B)
No. Property Abbreviation Unit of Measurement
50/70 (Sample A)
45/80-55 (Sample B)
1. Penetration at 25°C as per PN-EN 1426:2009 Pen25 1) 2) 0.1mm Yes Yes2. R&B softening point, as per PN-EN 1427:2009 SP 1) 2) °C Yes Yes3. Fraass breaking point, as per PN-EN 12593:2009 Fraass 1) 2) °C Yes Yes4. Elastic recovery at 25°C as per PN-EN 13398:2012 ER25 2) % No Yes5. Paraffin content, distillation method as per PN-EN 12606-1:2009 Paraf 1) %m/m Yes No
6.
Complex module G* in temperature of 60°C, frequency 1.59 Hz (10 rad/s), plate-plate arrangement, plate diam. 25 mm, gap 1 mm, testing in controlled stress mode, with the stress value set at 0.12 kPa (120 Pa) in DSR as per PN-EN 14770:2009
G* 1) 2) kPa Yes Yes
7.
Phase angle δ in temperature of 60°C, frequency 1.59 Hz (10 rad/s), plate-plate arrangement, plate diam. 25 mm, gap 1 mm, testing in controlled stress mode, with the stress value set at 0.12 kPa (120 Pa) in DSR as per PN-EN 14770:2009
Delta 1) 2) ° Yes Yes
8. Softening point R&B after RTFOT hardening as per PN-EN 1427:2009 and PN-EN 12607-1:2009 SPRTFOT 1) 2) °C Yes Yes
9. Increase of softening point R&B after RTFOT hardening as per PN-EN 1427:2009 and PN-EN 12607-1:2009 ∆SPRTFOT 1) 2) °C Yes Yes
10. Force ductility. Energy value at 5oC as per PN-EN 13589:2011 and PN-EN 13703:2009 FD5 2) J/cm2 No Yes
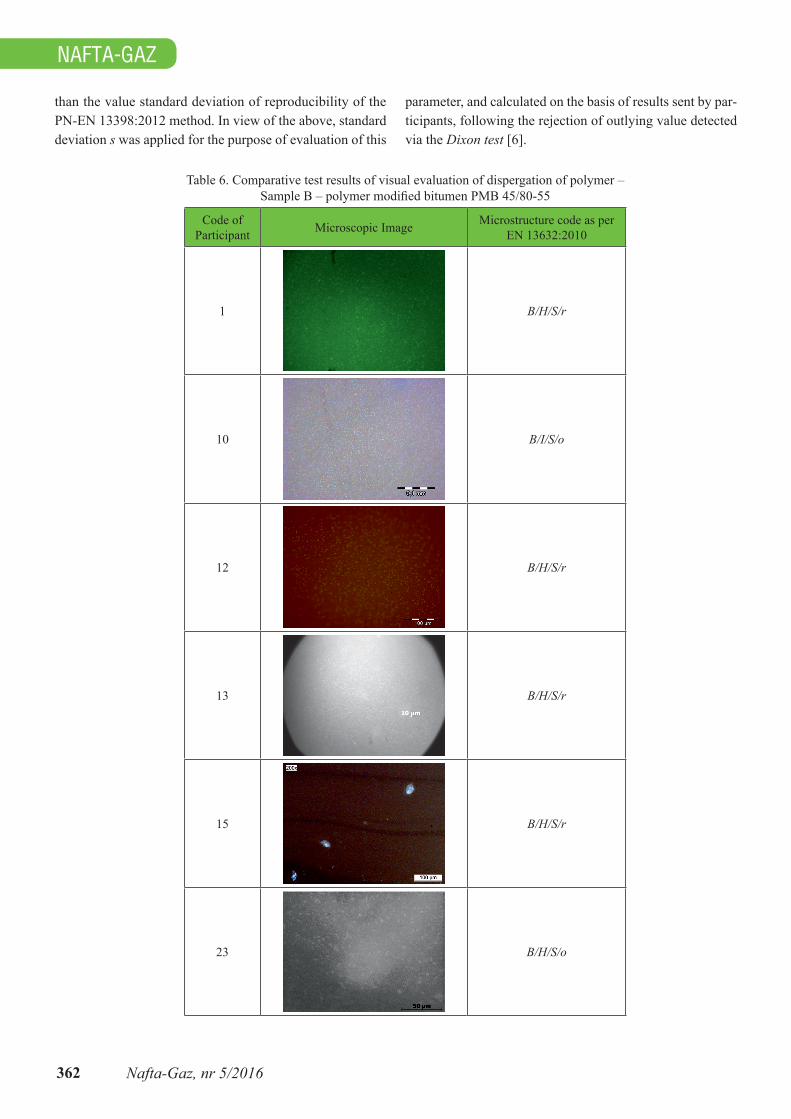
11. Visual assessment of dispergation of polymer in polymer modi-fied bitumen (sample B) as per PN-EN 13632:2010 Image – No Yes
1) Abbreviation of full description of tested characteristic used in Table 2 and 3.2) Abbreviation of full description of tested characteristic used in Table 4 and 5.
testing materials “Sample A” and “Sample B” were simul-taneously handed over to the comparative test participants via a logistics company.
The selected parameters for the assessment of paving grade bitumen 50/70 and polymer modified bitumen PMB 45/80-55 included obligatory tests (admitted in EN standards serving as the basis for bitumen production) and additional functional
NAFTA-GAZ
358 Nafta-Gaz, nr 5/2016
24 laboratories participated in the interlaboratory com-parison tests, which included facilities representing road con-struction investors, as well as standard research institutions. The structure of institutions administrating the participating laboratories was as follows:• State-owned belonging to the national road administra-
tion in Poland – 8,• Technical universities and research institutes – 7,• Road construction companies – 5,• Private – 1,• Bitumen manufacturers – 3.
Among the 24 laboratories, 8 had certificates of accredi-tation accordant with standard EN ISO 17025. It has to be
noted that the scope of accreditation of the laboratories did not fully cover the tests conducted under the proficiency test programme [1].
In view of generally accepted regulations governing com-parison tests, the organizer of the tests – ORLEN Asfalt – guaranteed the confidentiality of all information related to the participation in the programme of all participants. Therefore, for the purposes of the project, all names of laboratories have been coded by appropriating to them randomly chosen num-bers from 1 to 24, and each participant has been given its own personal code number. Each participant was also obliged to carry out the tests and hand over the results directly and only to the organizer, without contacting any of the other laboratories.
tests in a Dynamic Shear Rheometer (DSR). The functional tests (currently excluded from the scope of product specifica-tion standards) are much better in terms of quality charac-terisation of bituminous binders than strictly standard tests,
which should be considered rather as type-classification tests or commercial quality-defining tests. The scope of the compared selected tests of paving grade bitumen and polymer modified bitumen is shown in Table 1.
Information about Test Project Participants and Confidentiality of obtained results
Implemented Methodology of Statistical Evaluation of Results
Test results received from the Participants of interlabo-ratory tests were subject to standard statistical evaluation, using a MS Excel spreadsheet. The list of obtained results and calculated statistical measures are shown in Table 2 and 3 (for paving grade bitumen 50/70) and in Table 4 and 5 (for polymer modified bitumen PMB 45/80-55). One exception is the evaluation of the results of visual assessment of disperga-tion of polymer in polymer modified bitumen (PMB), where in accordance with the appropriate standard, the obtained result does not represent a number, but a microscopic image and the implemented code of description of the microstructure. In this case, statistical approach to the evaluation of obtained results, as was done in the case of other test results, is not possible, and the evaluation of variation in test results can only be done in a descriptive way.
In accordance with the implemented methodology of statistical evaluation of test results, the definition of attrib-uted value X*, standard uncertainty of attributed value ux, standard deviation for the evaluation of proficiencyσ^ and the evaluation of the tests results obtained by the participants, was carried out in accordance with the general rules described in standards [3] and [2], with the consideration of the fol-lowing particular boundary conditions implemented for the purposes of this analysis:• Attributed value X* was defined as the mean value of la-
boratory test results received from the participants, with the consideration of techniques minimising the effect of
extreme values using the resistant statistical method of Algorithm A [2]. The attributed value is the so-called “re-sistant mean value” [4, 6].
• The standard uncertainty ux of the attributed value X* was estimated only for the purpose of tests, where the num-ber of participating laboratories was less than 10 [4, 6].
• The estimated standard uncertainty was compared to stan-dard deviation applied to the evaluation of proficiency s^. If the criterion of ux ≤ 0,3s^ was not fulfilled, the effect of the uncertainty of definition of the attributed value on the evaluation of results of tests obtained by the partici-pants was taken into account, i.e. instead of z-score, the value of z’-score was applied [4, 6].
• For the purpose of evaluation of test results, resistant standard deviation s*, estimated on the basis of results sent by the participants, was applied instead of the stan-dard deviation for evaluation of proficiency s^. For the purpose of estimation of standard deviation on the basis of test results s*, the strong statistical method of Algori-thm A was applied [2, 4, 6].
• Only in one case (analysis of the results of elastic recove-ry at 25°C as per PN-EN 13398:2012) standard deviation calculated on the basis of results sent by the participants s was applied, after the rejection of the extreme value [4, 6].
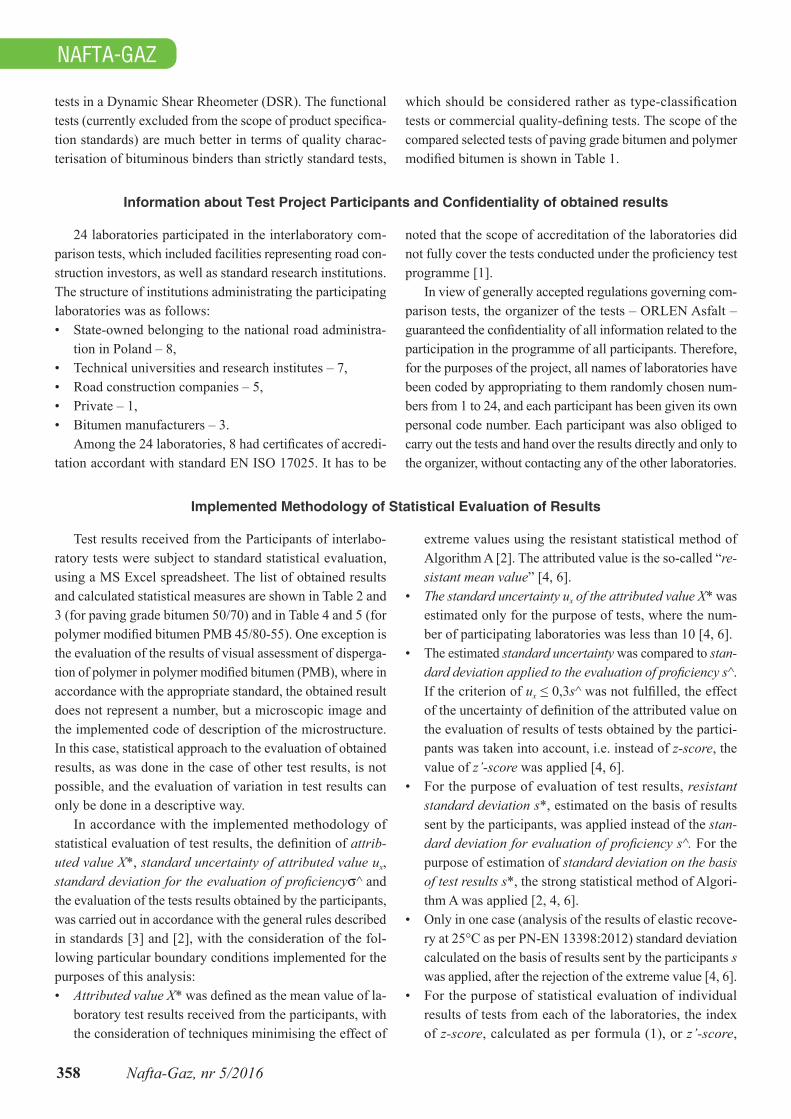
• For the purpose of statistical evaluation of individual results of tests from each of the laboratories, the index of z-score, calculated as per formula (1), or z’-score,
artykuły
359Nafta-Gaz, nr 5/2016
calculated as per formula (2), was applied. The z’-score index was applied in cases when the boundary condition of ux ≤ 0,3σ^ was not fulfilled [4, 6].
^
*
Xxz
(1)
22^
*
'xu
Xxz
(2)
where:x – result obtained by the Participant,X* – attributed value,σ^ – standard deviation,
ux – standard uncertainty of attributed value X*.
Test results obtained by the laboratories were subject to evaluation with the implementation of the following criteria in accordance with the z-score or z’-score index [4, 6]:|z| ≤ 2 – satisfactory result,2 < |z| < 3 – questionable result,|z| ≥ 3 – unsatisfactory result.
For the purposes of complementing the statistical evalu-ation carried out according to the z-score or z’-score index, the test results were further expanded with standard statistical measures for data sets, i.e. arithmetic average, median3, stan-dard deviation4, minimum value, maximum value and range5.
3 The value of a characteristic located in an ordered series, with iden-tical number of observations above and below it.
4 Informs how far the values in a given set are scattered beyond its ari-thmetic average. The smaller value of standard deviation, the bigger the concentration of observed values around the arithmetic average.
5 The difference between the lowest and highest value of a statistical characteristic in a given set.
Obtained Interlaboratory Test Results and their Statistical Evaluation
Tables 2, 3 and 4, 5 [4, 6] present results of compara-tive tests received from 24 laboratories participating in the research programme, including their statistical analysis and basic statistical measures. Table 6 [5] presents the results of comparative tests of the visual assessment of dispergation of polymer. Due to the specific character of these results, their analysis is limited to a descriptive comment.
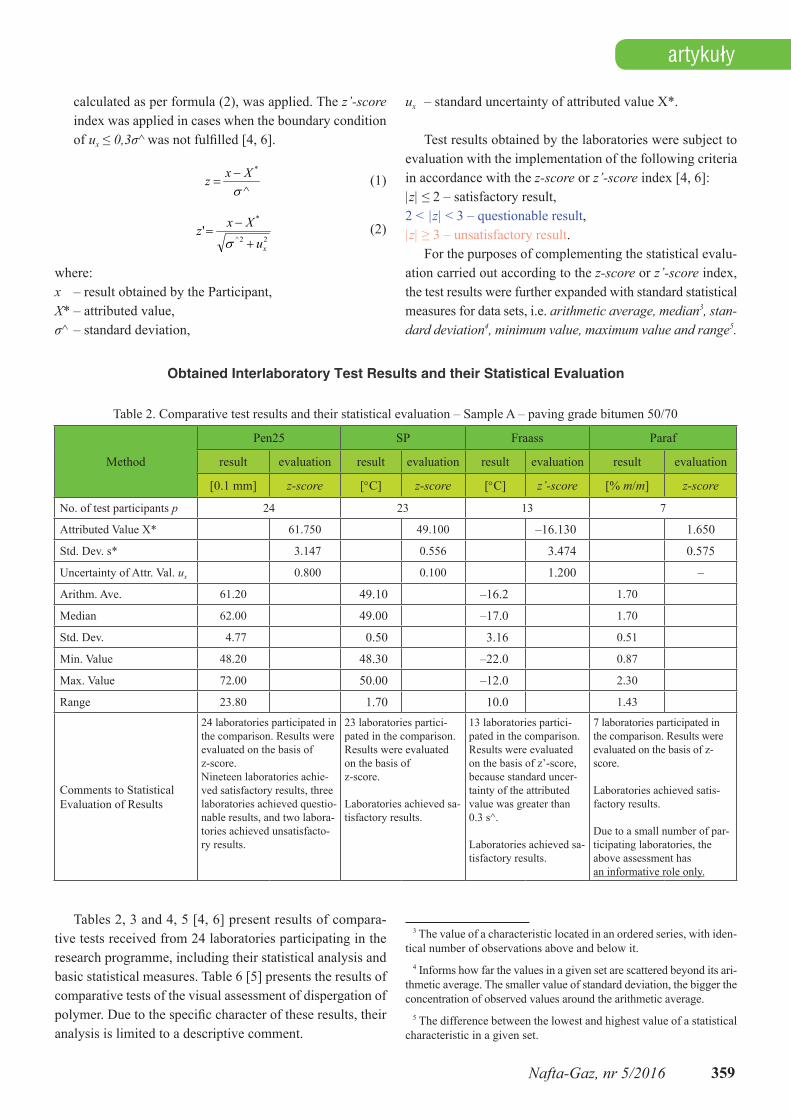
Table 2. Comparative test results and their statistical evaluation – Sample A – paving grade bitumen 50/70
Method
Pen25 SP Fraass Paraf
result evaluation result evaluation result evaluation result evaluation
[0.1 mm] z-score [°C] z-score [°C] z’-score [% m/m] z-score
No. of test participants p 24 23 13 7
Attributed Value X* 61.750 49.100 –16.130 1.650
Std. Dev. s* 3.147 0.556 3.474 0.575
Uncertainty of Attr. Val. ux 0.800 0.100 1.200 –
Arithm. Ave. 61.20 49.10 –16.2 1.70
Median 62.00 49.00 –17.0 1.70
Std. Dev. 4.77 0.50 3.16 0.51
Min. Value 48.20 48.30 –22.0 0.87
Max. Value 72.00 50.00 –12.0 2.30
Range 23.80 1.70 10.0 1.43
Comments to Statistical Evaluation of Results
24 laboratories participated in the comparison. Results were evaluated on the basis of z-score.Nineteen laboratories achie-ved satisfactory results, three laboratories achieved questio-nable results, and two labora-tories achieved unsatisfacto-ry results.
23 laboratories partici-pated in the comparison. Results were evaluated on the basis of z-score.
Laboratories achieved sa-tisfactory results.
13 laboratories partici-pated in the comparison. Results were evaluated on the basis of z’-score, because standard uncer-tainty of the attributed value was greater than 0.3 s^.
Laboratories achieved sa-tisfactory results.
7 laboratories participated in the comparison. Results were evaluated on the basis of z-score.
Laboratories achieved satis-factory results.
Due to a small number of par-ticipating laboratories, the above assessment hasan informative role only.
NAFTA-GAZ
360 Nafta-Gaz, nr 5/2016
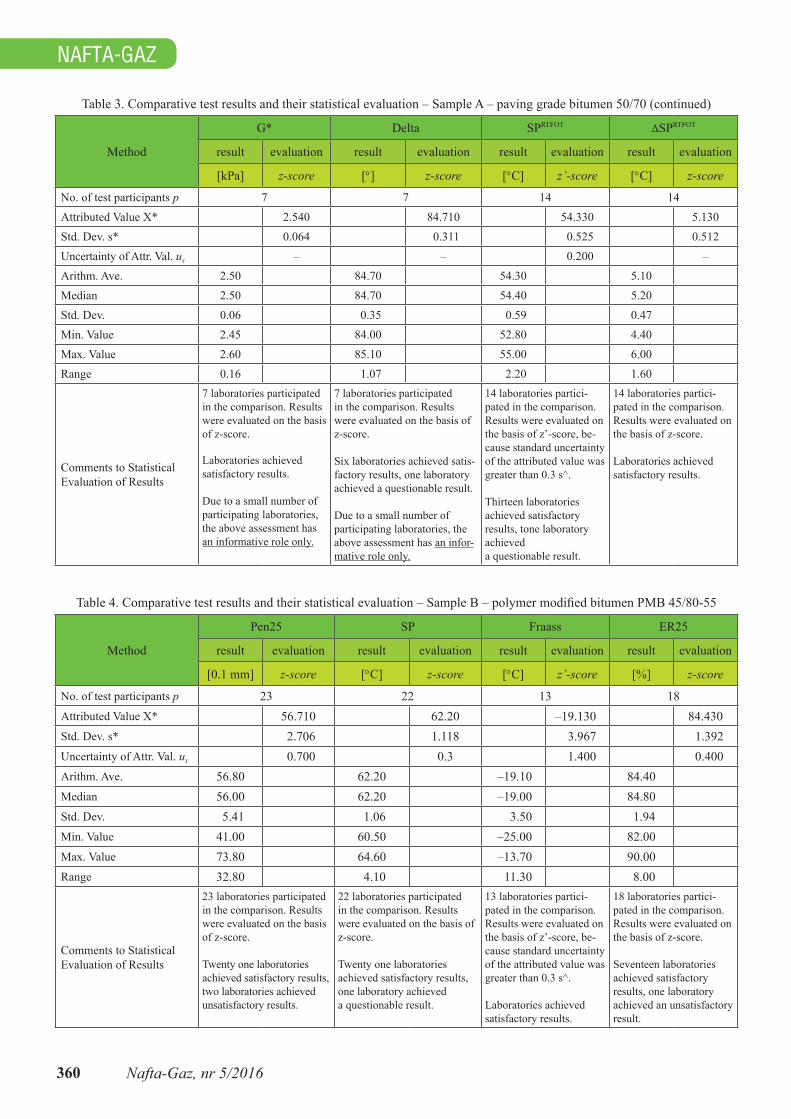
Table 3. Comparative test results and their statistical evaluation – Sample A – paving grade bitumen 50/70 (continued)
Method
G* Delta SPRTFOT ∆SPRTFOT
result evaluation result evaluation result evaluation result evaluation
[kPa] z-score [°] z-score [°C] z’-score [°C] z-score
No. of test participants p 7 7 14 14Attributed Value X* 2.540 84.710 54.330 5.130Std. Dev. s* 0.064 0.311 0.525 0.512Uncertainty of Attr. Val. ux – – 0.200 –Arithm. Ave. 2.50 84.70 54.30 5.10Median 2.50 84.70 54.40 5.20Std. Dev. 0.06 0.35 0.59 0.47Min. Value 2.45 84.00 52.80 4.40Max. Value 2.60 85.10 55.00 6.00Range 0.16 1.07 2.20 1.60
Comments to Statistical Evaluation of Results
7 laboratories participated in the comparison. Results were evaluated on the basis of z-score.
Laboratories achieved satisfactory results.
Due to a small number of participating laboratories, the above assessment has an informative role only.
7 laboratories participated in the comparison. Results were evaluated on the basis of z-score.
Six laboratories achieved satis-factory results, one laboratory achieved a questionable result.
Due to a small number of participating laboratories, the above assessment has an infor-mative role only.
14 laboratories partici-pated in the comparison. Results were evaluated on the basis of z’-score, be-cause standard uncertainty of the attributed value was greater than 0.3 s^.
Thirteen laboratories achieved satisfactory results, tone laboratory achieved a questionable result.
14 laboratories partici-pated in the comparison. Results were evaluated on the basis of z-score.
Laboratories achieved satisfactory results.
Table 4. Comparative test results and their statistical evaluation – Sample B – polymer modified bitumen PMB 45/80-55
Method
Pen25 SP Fraass ER25
result evaluation result evaluation result evaluation result evaluation
[0.1 mm] z-score [°C] z-score [°C] z’-score [%] z-score
No. of test participants p 23 22 13 18Attributed Value X* 56.710 62.20 –19.130 84.430Std. Dev. s* 2.706 1.118 3.967 1.392Uncertainty of Attr. Val. ux 0.700 0.3 1.400 0.400Arithm. Ave. 56.80 62.20 –19.10 84.40Median 56.00 62.20 –19.00 84.80Std. Dev. 5.41 1.06 3.50 1.94Min. Value 41.00 60.50 –25.00 82.00Max. Value 73.80 64.60 –13.70 90.00Range 32.80 4.10 11.30 8.00
Comments to Statistical Evaluation of Results
23 laboratories participated in the comparison. Results were evaluated on the basis of z-score.
Twenty one laboratories achieved satisfactory results, two laboratories achieved unsatisfactory results.
22 laboratories participated in the comparison. Results were evaluated on the basis of z-score.
Twenty one laboratories achieved satisfactory results, one laboratory achieved a questionable result.
13 laboratories partici-pated in the comparison. Results were evaluated on the basis of z’-score, be-cause standard uncertainty of the attributed value was greater than 0.3 s^.
Laboratories achieved satisfactory results.
18 laboratories partici-pated in the comparison. Results were evaluated on the basis of z-score.
Seventeen laboratories achieved satisfactory results, one laboratory achieved an unsatisfactory result.
artykuły
361Nafta-Gaz, nr 5/2016
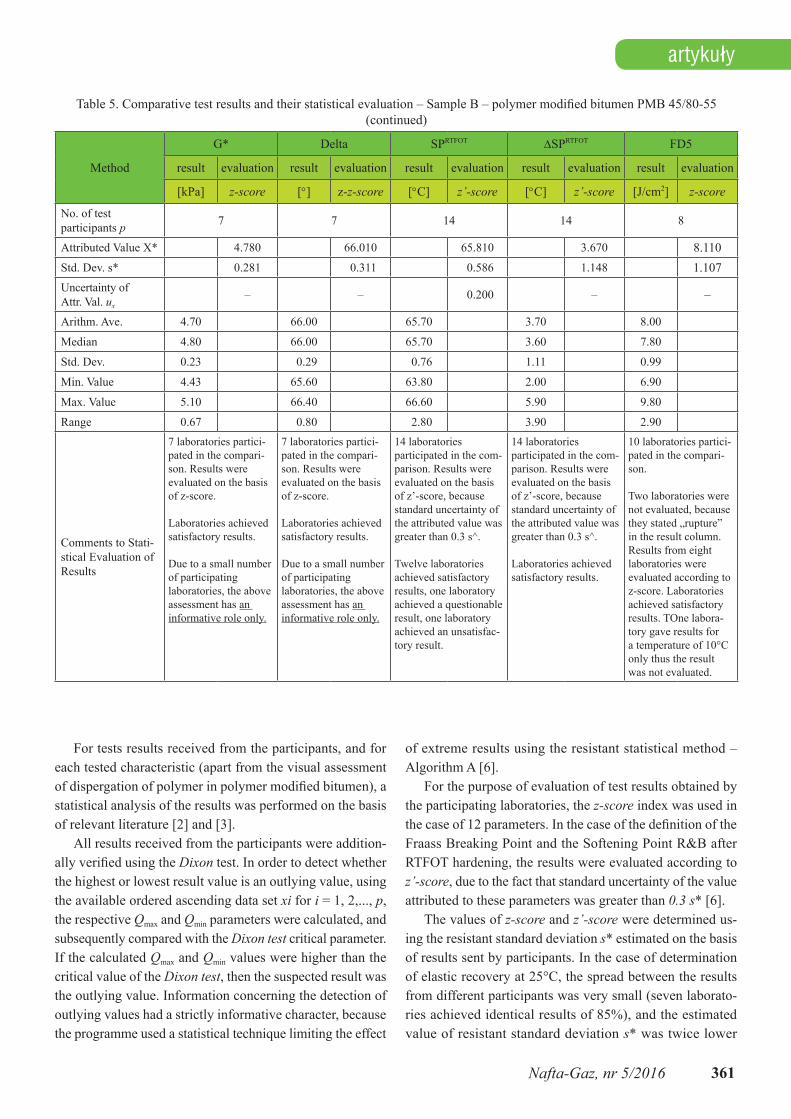
Table 5. Comparative test results and their statistical evaluation – Sample B – polymer modified bitumen PMB 45/80-55 (continued)
Method
G* Delta SPRTFOT ∆SPRTFOT FD5
result evaluation result evaluation result evaluation result evaluation result evaluation
[kPa] z-score [°] z-z-score [°C] z’-score [°C] z’-score [J/cm2] z-score
No. of testparticipants p 7 7 14 14 8
Attributed Value X* 4.780 66.010 65.810 3.670 8.110Std. Dev. s* 0.281 0.311 0.586 1.148 1.107Uncertainty of Attr. Val. ux
– – 0.200 – –
Arithm. Ave. 4.70 66.00 65.70 3.70 8.00
Median 4.80 66.00 65.70 3.60 7.80
Std. Dev. 0.23 0.29 0.76 1.11 0.99
Min. Value 4.43 65.60 63.80 2.00 6.90
Max. Value 5.10 66.40 66.60 5.90 9.80
Range 0.67 0.80 2.80 3.90 2.90
Comments to Stati-stical Evaluation of Results
7 laboratories partici-pated in the compari-son. Results were evaluated on the basis of z-score.
Laboratories achieved satisfactory results.
Due to a small number of participating laboratories, the above assessment has an informative role only.
7 laboratories partici-pated in the compari-son. Results were evaluated on the basis of z-score.
Laboratories achieved satisfactory results.
Due to a small number of participating laboratories, the above assessment has an informative role only.
14 laboratories participated in the com-parison. Results were evaluated on the basis of z’-score, because standard uncertainty of the attributed value was greater than 0.3 s^.
Twelve laboratories achieved satisfactory results, one laboratory achieved a questionable result, one laboratory achieved an unsatisfac-tory result.
14 laboratories participated in the com-parison. Results were evaluated on the basis of z’-score, because standard uncertainty of the attributed value was greater than 0.3 s^.
Laboratories achieved satisfactory results.
10 laboratories partici-pated in the compari-son.
Two laboratories were not evaluated, because they stated „rupture” in the result column. Results from eight laboratories were evaluated according to z-score. Laboratories achieved satisfactory results. TOne labora-tory gave results for a temperature of 10°C only thus the result was not evaluated.
For tests results received from the participants, and for each tested characteristic (apart from the visual assessment of dispergation of polymer in polymer modified bitumen), a statistical analysis of the results was performed on the basis of relevant literature [2] and [3].
All results received from the participants were addition-ally verified using the Dixon test. In order to detect whether the highest or lowest result value is an outlying value, using the available ordered ascending data set xi for i = 1, 2,..., p, the respective Qmax and Qmin parameters were calculated, and subsequently compared with the Dixon test critical parameter. If the calculated Qmax and Qmin values were higher than the critical value of the Dixon test, then the suspected result was the outlying value. Information concerning the detection of outlying values had a strictly informative character, because the programme used a statistical technique limiting the effect
of extreme results using the resistant statistical method – Algorithm A [6].
For the purpose of evaluation of test results obtained by the participating laboratories, the z-score index was used in the case of 12 parameters. In the case of the definition of the Fraass Breaking Point and the Softening Point R&B after RTFOT hardening, the results were evaluated according to z’-score, due to the fact that standard uncertainty of the value attributed to these parameters was greater than 0.3 s* [6].
The values of z-score and z’-score were determined us-ing the resistant standard deviation s* estimated on the basis of results sent by participants. In the case of determination of elastic recovery at 25°C, the spread between the results from different participants was very small (seven laborato-ries achieved identical results of 85%), and the estimated value of resistant standard deviation s* was twice lower
NAFTA-GAZ
362 Nafta-Gaz, nr 5/2016
than the value standard deviation of reproducibility of the PN-EN 13398:2012 method. In view of the above, standard deviation s was applied for the purpose of evaluation of this
parameter, and calculated on the basis of results sent by par-ticipants, following the rejection of outlying value detected via the Dixon test [6].
Table 6. Comparative test results of visual evaluation of dispergation of polymer – Sample B – polymer modified bitumen PMB 45/80-55
Code of Participant Microscopic Image Microstructure code as per
EN 13632:2010
1 B/H/S/r
10 B/I/S/o
12 B/H/S/r
13 B/H/S/r
15 B/H/S/r
23 B/H/S/o
artykuły
363Nafta-Gaz, nr 5/2016
Summary and Conclusions
The project Testing of Proficiency through Interlabora-tory Comparisons organised by ORLEN Asfalt included the participation of 24 laboratories with major experience and certification in the scope of tests which were undertaken in this project.
The project covered standard and non-standard tests of the properties of bituminous binders – paving grade bitumen 50/70 and polymer modified bitumen PMB 45/80-55. Bitumens designated for testing were extracted from manufacturing installations belonging to ORLEN Asfalt.
Paving grade bitumen (sample A) was subject to compara-tive tests in terms of 8 parameters, while polymer modified bi-tumen (sample B) was subject to comparison of 9 parameters.
The results of the described project have shown that the
weakest results were achieved for the parameter of penetration at 25°C (as many as 5 cases of questionable or unsatisfactory results), especially for paving grade bitumen. On the other hand, the most striking results were achieved for Fraass Breaking Point, where for paving grade bitumen, results were obtained in the range of –12 to –22°C, and for polymer modi-fied bitumen between –13.7 and –25°C. In view of the fact that in most countries, breaking point represents a control test on road construction projects, this may be a cause for concern.
Attention should also be paid to the results of the complex modulus of stiffness G* and the phase angle δ for 50/70 bitu-men and PMB 45/80-55. In view of relatively short experience with DSR tests and differences in testing equipment used, these results can be considered as very good.
Please cite as: Nafta-Gaz 2016, nr 6, s. 356–363, DOI: 10.18668/NG.2016.05.07
Article contributed to the Editor 4.01.2016. Approved for publication 29.03.2016.
Literature[1] Internet webpage of the Polish Accreditation Centre; www.pca.
gov.pl (access on: 26.08.2014).[2] ISO 13528:2005 Statistical methods for use in proficiency te-
sting by interlaboratory comparisons.[3] PN-EN ISO/IEC 17043:2011 Evaluation of conformity – Ge-
neral requirements regarding proficiency testing.[4] Proficiency testing by interlaboratory comparisons comple-
mentation to report in Lepiszcza asfaltowe No. OA/2012,
results of force ductility tests. Energy value at 5°C as per PN-EN 13589:2011 and PN-EN 13703:2009. Płock 17.01.2013.
[5] Proficiency testing by interlaboratory comparisons comple-mentation to report in Lepiszcza asfaltowe No. OA/2012, visual assessment of polymer dispergation in polymer-modified bitu-men (sample B) as per PN-EN 13632:2010. Płock 17.01.2013.
[6] Proficiency testing by interlaboratory comparisons. Report „Lepiszcza asfaltowe No. OA/2012”, Płock 27.11.2012.
Dr inż. Krzysztof BŁAŻEJOWSKIDyrektor ds. Badań i RozwojuDział Badań i RozwojuORLEN Asfalt Sp. z o.o. ul. Łukasiewicza 3909-400 PłockE-mail: [email protected]
Mgr inż. Hubert PECIAKOWSKISpecjalista Zespół Optymalizacji Rafineryjnych i Petrochemicz-nych Procesów ProdukcyjnychObszar Produkcji RafineryjnejPKN ORLEN S.A.ul. Chemików 7, 09-411 Płock
E-mail: [email protected]
Dr inż. Jacek OLSZACKISpecjalistaZespół Badań i Rozwoju Nowych Technologii w PKN ORLEN, Dział Badań i Rozwoju Nowych Technologii w GK ORLENPKN ORLEN S.A.ul. Chemików 7, 09-411 Płock
E-mail: [email protected]
Mgr inż. Marta WÓJCIK-WIŚNIEWSKASpecjalista ds. badań i rozwojuDział Badań i RozwojuORLEN Asfalt Sp. z o.o.ul. Łukasiewicza 3909-400 PłockE-mail: [email protected]