interim report january september 2016 · interim report january – september 2016. november 1,...
TRANSCRIPT
Interim ReportJanuary–September 2016
November 1, 2016President and CEO Ari Lehtoranta
Market share, net sales and profitability improved in Q3 year-over-year. Markets in general flat, Russia stabilizing.
2
2. Nokian Tyres financial performance
3. Business units
4. Nokian Tyres going forward
1. General overview
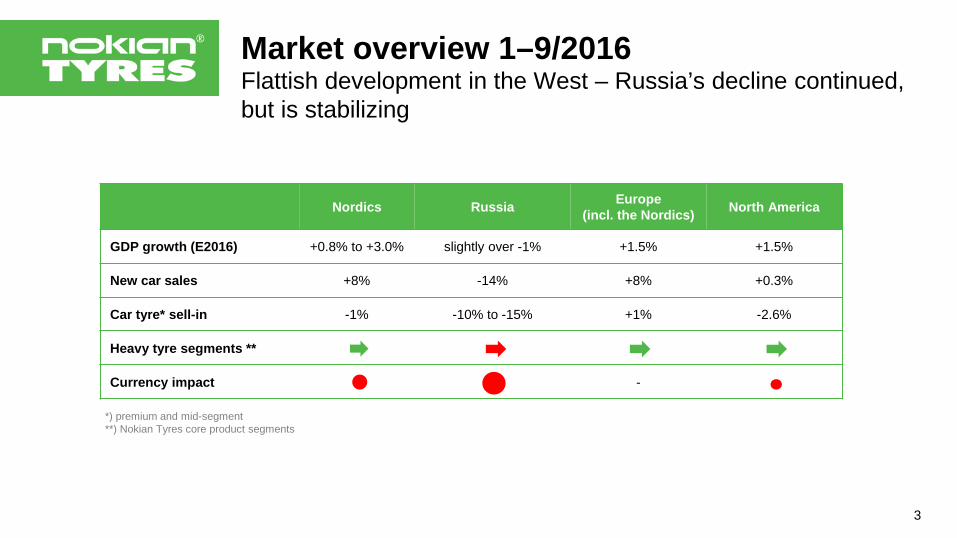
Market overview 1–9/2016Flattish development in the West – Russia’s decline continued, but is stabilizing
*) premium and mid-segment**) Nokian Tyres core product segments
3
Nordics Russia Europe (incl. the Nordics) North America
GDP growth (E2016) +0.8% to +3.0% slightly over -1% +1.5% +1.5%
New car sales +8% -14% +8% +0.3%
Car tyre* sell-in -1% -10% to -15% +1% -2.6%
Heavy tyre segments **
Currency impact -
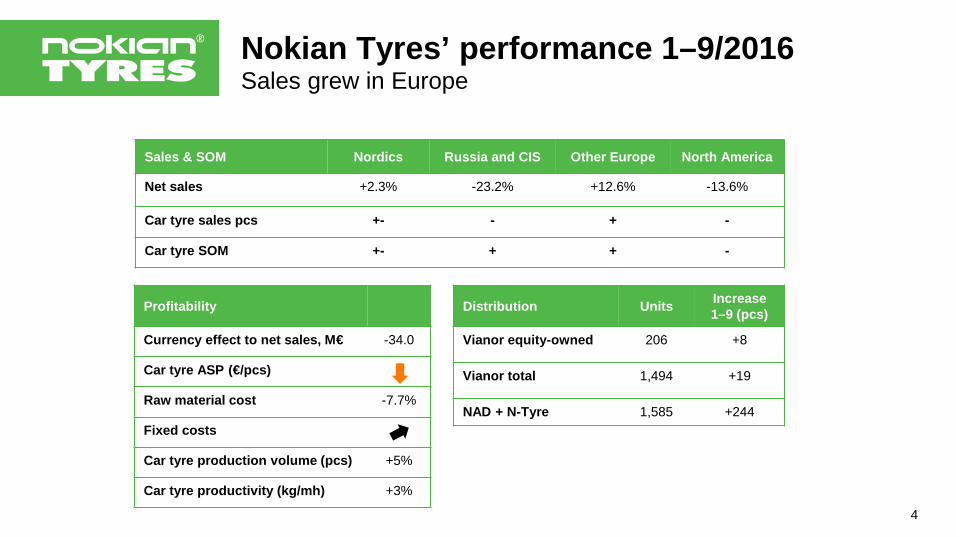
Distribution Units Increase1–9 (pcs)
Vianor equity-owned 206 +8
Vianor total 1,494 +19
NAD + N-Tyre 1,585 +244
Profitability
Currency effect to net sales, M€ -34.0
Car tyre ASP (€/pcs)
Raw material cost -7.7%
Fixed costs
Car tyre production volume (pcs) +5%
Car tyre productivity (kg/mh) +3%
Sales & SOM Nordics Russia and CIS Other Europe North America
Net sales +2.3% -23.2% +12.6% -13.6%
Car tyre sales pcs +- - + -
Car tyre SOM +- + + -
Nokian Tyres’ performance 1–9/2016Sales grew in Europe
4
5
1. General overview
3. Business units
4. Nokian Tyres going forward
2. Nokian Tyres financial performance Summary Net sales by market area Raw material cost development
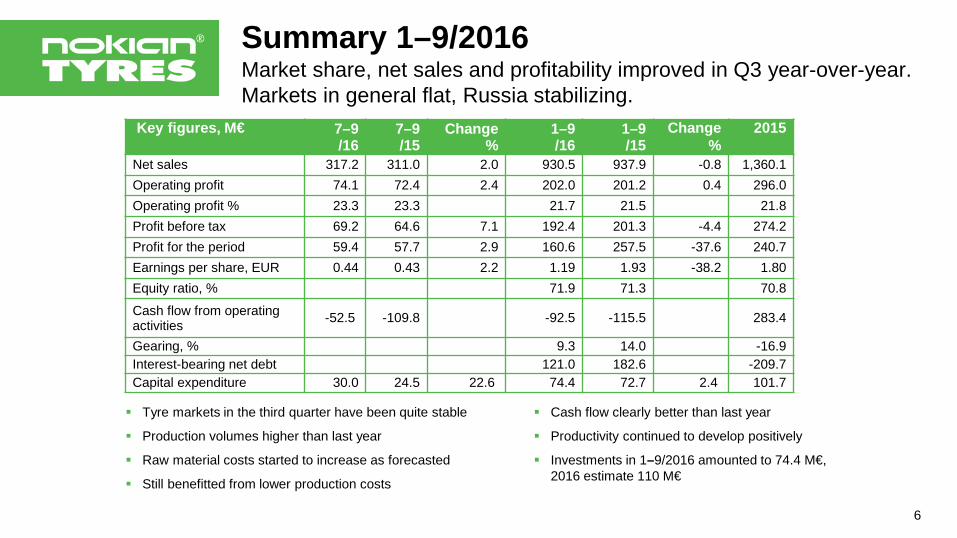
Tyre markets in the third quarter have been quite stable
Production volumes higher than last year
Raw material costs started to increase as forecasted
Still benefitted from lower production costs
Summary 1–9/2016Market share, net sales and profitability improved in Q3 year-over-year. Markets in general flat, Russia stabilizing.
6
Cash flow clearly better than last year
Productivity continued to develop positively
Investments in 1–9/2016 amounted to 74.4 M€, 2016 estimate 110 M€
Key figures, M€ 7–9/16
7–9/15
Change%
1–9/16
1–9/15
Change%
2015
Net sales 317.2 311.0 2.0 930.5 937.9 -0.8 1,360.1Operating profit 74.1 72.4 2.4 202.0 201.2 0.4 296.0Operating profit % 23.3 23.3 21.7 21.5 21.8Profit before tax 69.2 64.6 7.1 192.4 201.3 -4.4 274.2Profit for the period 59.4 57.7 2.9 160.6 257.5 -37.6 240.7Earnings per share, EUR 0.44 0.43 2.2 1.19 1.93 -38.2 1.80Equity ratio, % 71.9 71.3 70.8
Cash flow from operating activities -52.5 -109.8 -92.5 -115.5 283.4
Gearing, % 9.3 14.0 -16.9Interest-bearing net debt 121.0 182.6 -209.7Capital expenditure 30.0 24.5 22.6 74.4 72.7 2.4 101.7
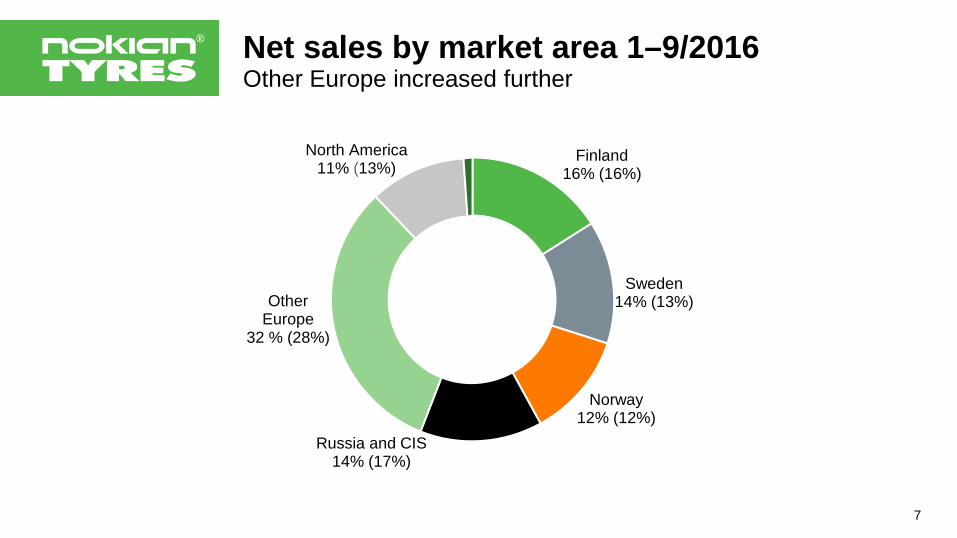
Net sales by market area 1–9/2016Other Europe increased further
7
Finland16% (16%)
Sweden14% (13%)
Norway12% (12%)
Russia and CIS14% (17%)
Other Europe
32 % (28%)
North America11% (13%)
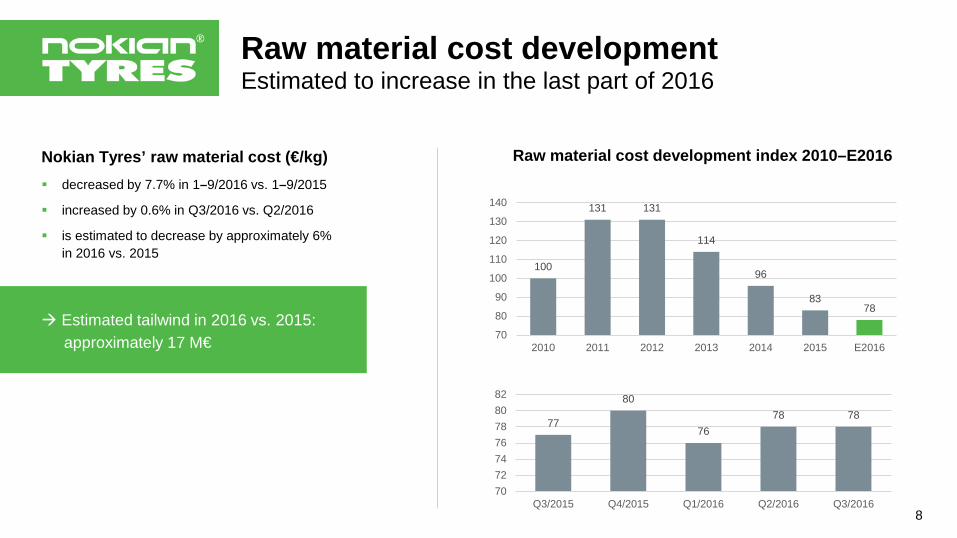
Raw material cost developmentEstimated to increase in the last part of 2016
Nokian Tyres’ raw material cost (€/kg) decreased by 7.7% in 1–9/2016 vs. 1–9/2015
increased by 0.6% in Q3/2016 vs. Q2/2016
is estimated to decrease by approximately 6%in 2016 vs. 2015
Estimated tailwind in 2016 vs. 2015: approximately 17 M€
Raw material cost development index 2010–E2016
8
100
131 131
114
96
8378
70
80
90
100
110
120
130
140
2010 2011 2012 2013 2014 2015 E2016
77
80
7678 78
70727476788082
Q3/2015 Q4/2015 Q1/2016 Q2/2016 Q3/2016

1. General overview
2. Nokian Tyres financial performance
4. Nokian Tyres going forward
9
3. Business units General overview Passenger Car Tyres Heavy Tyres Vianor and retail network
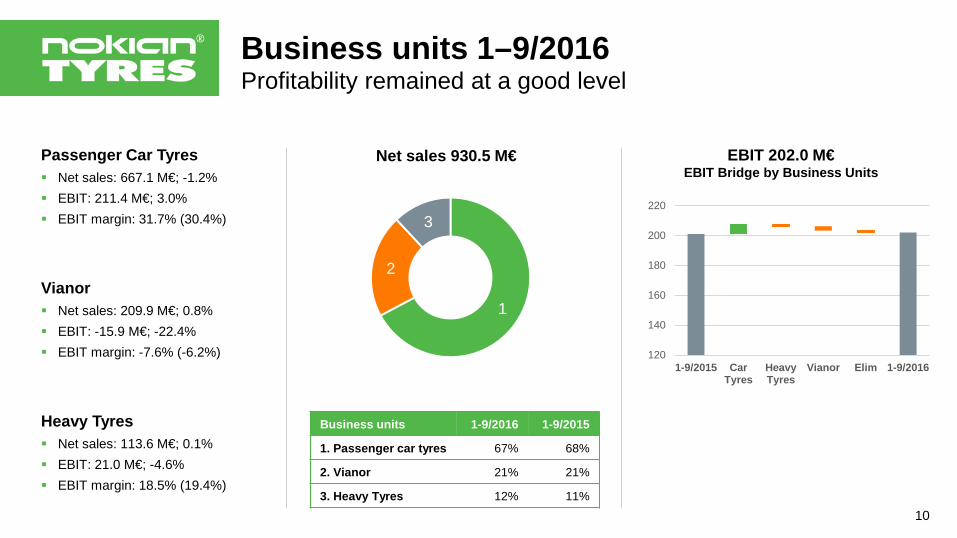
Business units 1–9/2016Profitability remained at a good level
Passenger Car Tyres Net sales: 667.1 M€; -1.2% EBIT: 211.4 M€; 3.0% EBIT margin: 31.7% (30.4%)
Vianor Net sales: 209.9 M€; 0.8% EBIT: -15.9 M€; -22.4% EBIT margin: -7.6% (-6.2%)
Heavy Tyres Net sales: 113.6 M€; 0.1% EBIT: 21.0 M€; -4.6% EBIT margin: 18.5% (19.4%)
Net sales 930.5 M€
Business units 1-9/2016 1-9/2015
1. Passenger car tyres 67% 68%
2. Vianor 21% 21%
3. Heavy Tyres 12% 11%
EBIT 202.0 M€EBIT Bridge by Business Units
10
1
2
3
120
140
160
180
200
220
1-9/2015 CarTyres
HeavyTyres
Vianor Elim 1-9/2016
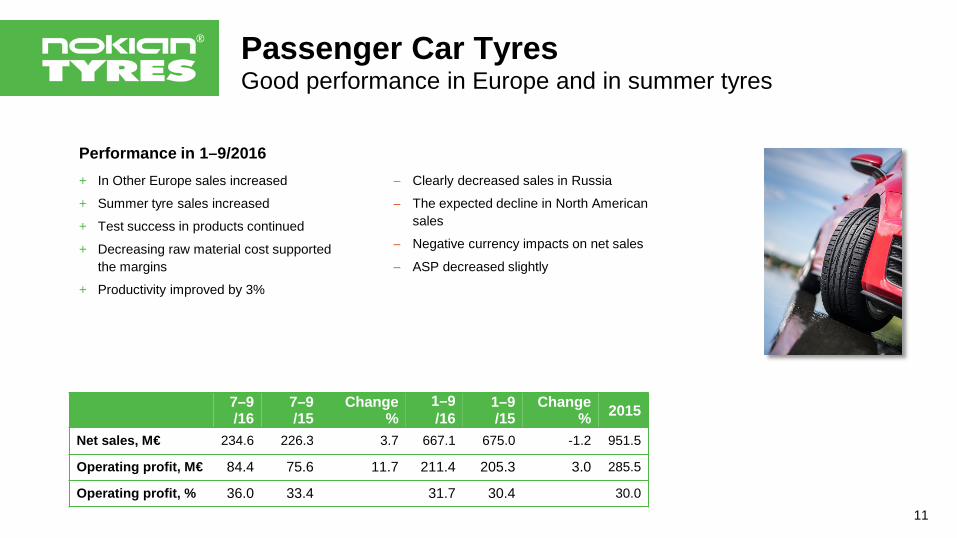
Passenger Car TyresGood performance in Europe and in summer tyres
Performance in 1–9/2016+ In Other Europe sales increased
+ Summer tyre sales increased
+ Test success in products continued
+ Decreasing raw material cost supported the margins
+ Productivity improved by 3%
11
7–9/16
7–9/15
Change%
1–9/16
1–9/15
Change% 2015
Net sales, M€ 234.6 226.3 3.7 667.1 675.0 -1.2 951.5
Operating profit, M€ 84.4 75.6 11.7 211.4 205.3 3.0 285.5
Operating profit, % 36.0 33.4 31.7 30.4 30.0
− Clearly decreased sales in Russia
− The expected decline in North American sales
− Negative currency impacts on net sales
− ASP decreased slightly
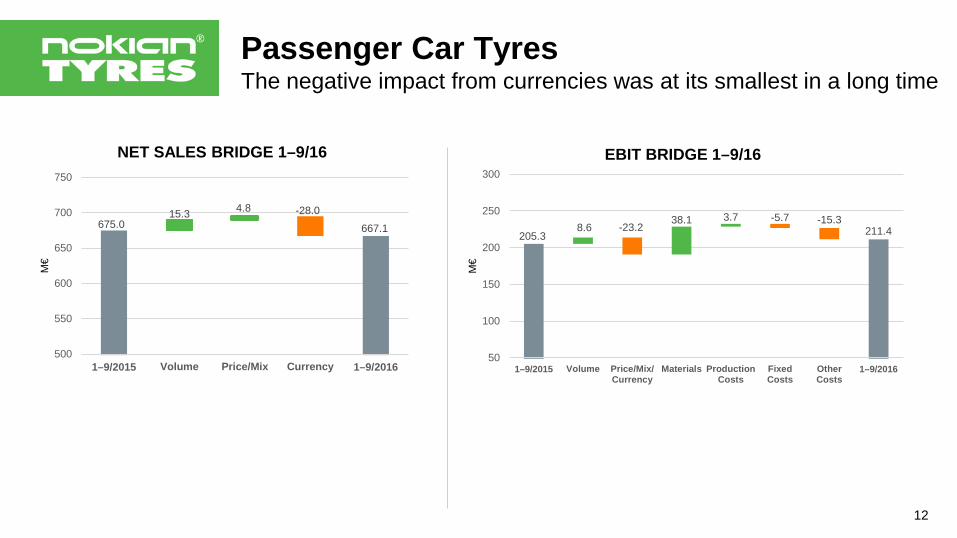
205.38.6 -23.2
38.1 3.7 -5.7 -15.3211.4
50
100
150
200
250
300
1–9/2015 Volume Price/Mix/Currency
Materials ProductionCosts
FixedCosts
OtherCosts
1–9/2016
M€
EBIT BRIDGE 1–9/16
Passenger Car Tyres
12
The negative impact from currencies was at its smallest in a long time
675.015.3 4.8 -28.0
667.1
500
550
600
650
700
750
1–9/2015 Volume Price/Mix Currency 1–9/2016
M€
NET SALES BRIDGE 1–9/16
13
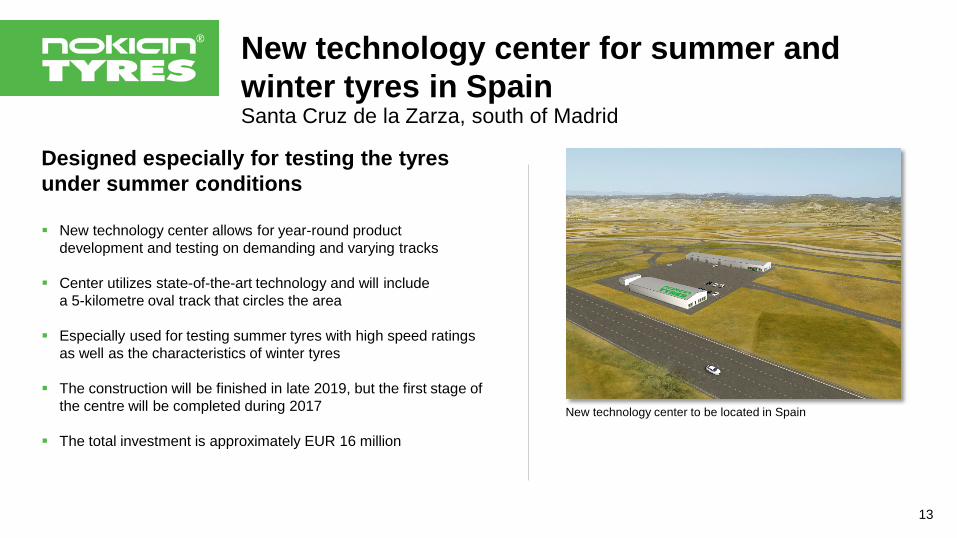
New technology center for summer and winter tyres in SpainSanta Cruz de la Zarza, south of Madrid
Designed especially for testing the tyresunder summer conditions
New technology center allows for year-round product development and testing on demanding and varying tracks
Center utilizes state-of-the-art technology and will include a 5-kilometre oval track that circles the area
Especially used for testing summer tyres with high speed ratings as well as the characteristics of winter tyres
The construction will be finished in late 2019, but the first stage of the centre will be completed during 2017
The total investment is approximately EUR 16 million
New technology center to be located in Spain
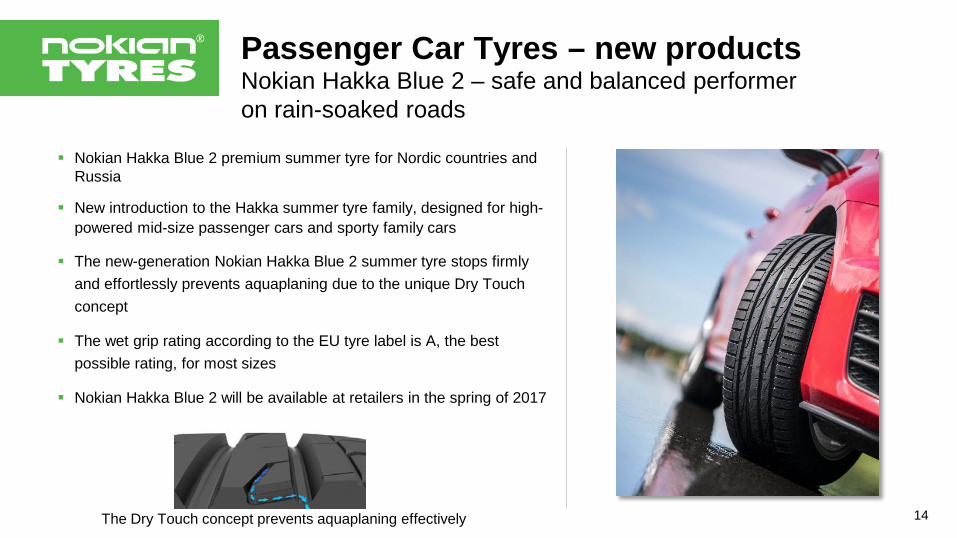
Nokian Hakka Blue 2 – safe and balanced performeron rain-soaked roads
Passenger Car Tyres – new products
14
Nokian Hakka Blue 2 premium summer tyre for Nordic countries and Russia
New introduction to the Hakka summer tyre family, designed for high-powered mid-size passenger cars and sporty family cars
The new-generation Nokian Hakka Blue 2 summer tyre stops firmly and effortlessly prevents aquaplaning due to the unique Dry Touch concept
The wet grip rating according to the EU tyre label is A, the best possible rating, for most sizes
Nokian Hakka Blue 2 will be available at retailers in the spring of 2017
The Dry Touch concept prevents aquaplaning effectively
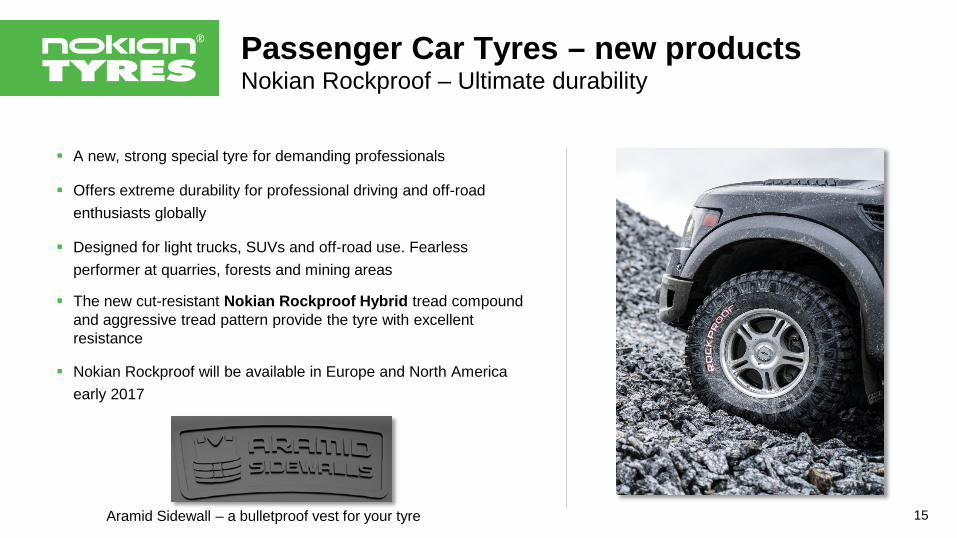
Passenger Car Tyres – new productsNokian Rockproof – Ultimate durability
Aramid Sidewall – a bulletproof vest for your tyre 15
A new, strong special tyre for demanding professionals
Offers extreme durability for professional driving and off-road enthusiasts globally
Designed for light trucks, SUVs and off-road use. Fearless performer at quarries, forests and mining areas
The new cut-resistant Nokian Rockproof Hybrid tread compound and aggressive tread pattern provide the tyre with excellent resistance
Nokian Rockproof will be available in Europe and North America early 2017
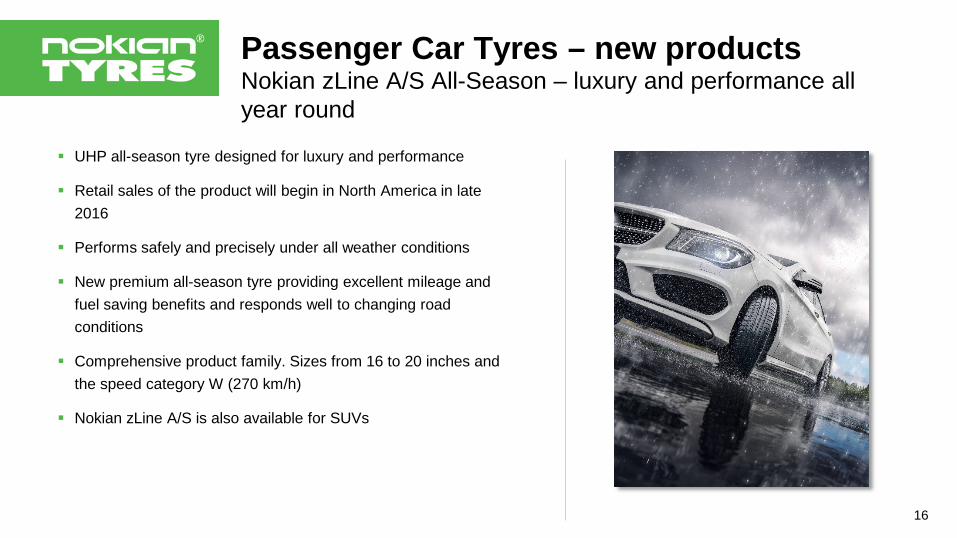
Passenger Car Tyres – new productsNokian zLine A/S All-Season – luxury and performance all year round
UHP all-season tyre designed for luxury and performance
Retail sales of the product will begin in North America in late 2016
Performs safely and precisely under all weather conditions
New premium all-season tyre providing excellent mileage and fuel saving benefits and responds well to changing road conditions
Comprehensive product family. Sizes from 16 to 20 inches and the speed category W (270 km/h)
Nokian zLine A/S is also available for SUVs
16
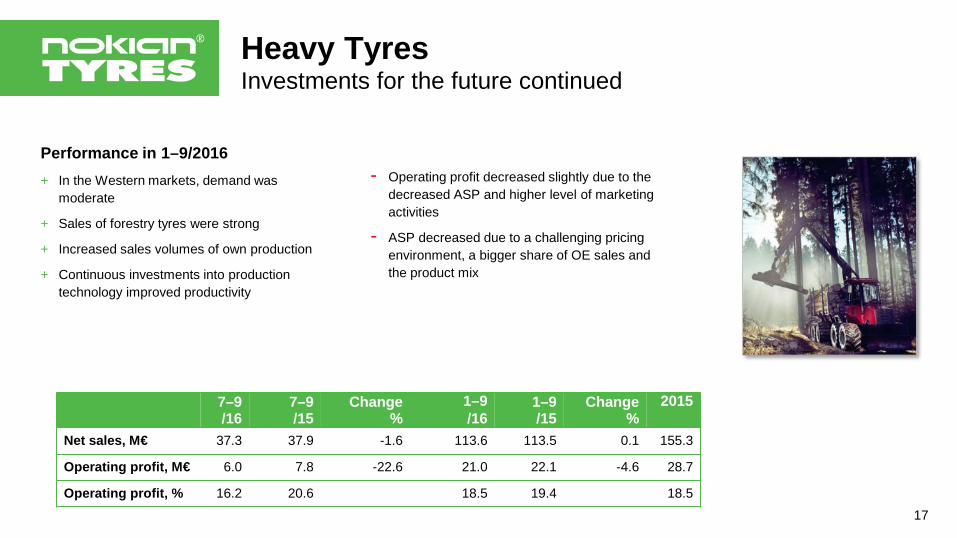
Heavy TyresInvestments for the future continued
Performance in 1–9/2016+ In the Western markets, demand was
moderate
+ Sales of forestry tyres were strong
+ Increased sales volumes of own production
+ Continuous investments into production technology improved productivity
- Operating profit decreased slightly due to the decreased ASP and higher level of marketing activities
- ASP decreased due to a challenging pricing environment, a bigger share of OE sales and the product mix
17
7–9/16
7–9/15
Change%
1–9/16
1–9/15
Change%
2015
Net sales, M€ 37.3 37.9 -1.6 113.6 113.5 0.1 155.3
Operating profit, M€ 6.0 7.8 -22.6 21.0 22.1 -4.6 28.7
Operating profit, % 16.2 20.6 18.5 19.4 18.5
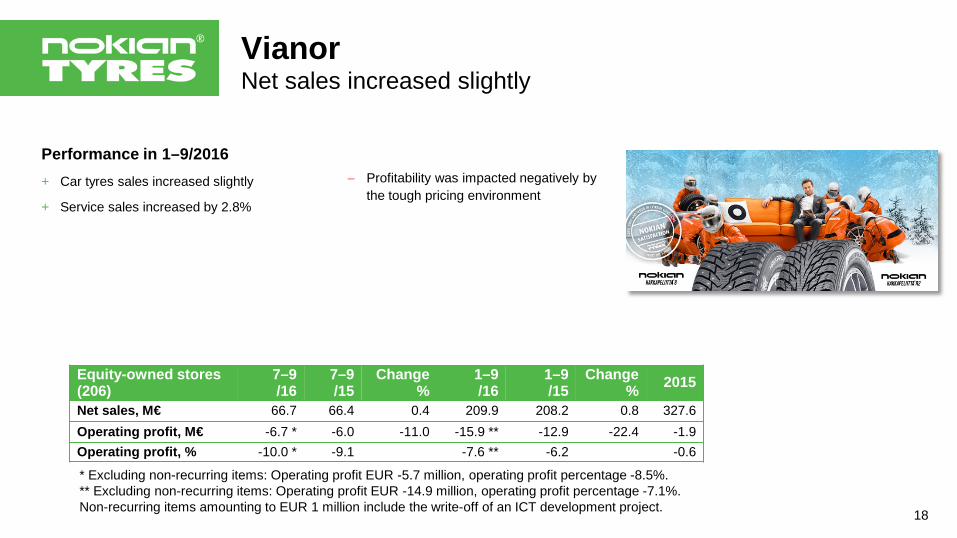
VianorNet sales increased slightly
Performance in 1–9/2016+ Car tyres sales increased slightly
+ Service sales increased by 2.8%
− Profitability was impacted negatively by the tough pricing environment
18
Equity-owned stores (206)
7–9/16
7–9/15
Change%
1–9/16
1–9/15
Change% 2015
Net sales, M€ 66.7 66.4 0.4 209.9 208.2 0.8 327.6Operating profit, M€ -6.7 * -6.0 -11.0 -15.9 ** -12.9 -22.4 -1.9Operating profit, % -10.0 * -9.1 -7.6 ** -6.2 -0.6
* Excluding non-recurring items: Operating profit EUR -5.7 million, operating profit percentage -8.5%.** Excluding non-recurring items: Operating profit EUR -14.9 million, operating profit percentage -7.1%.Non-recurring items amounting to EUR 1 million include the write-off of an ICT development project.
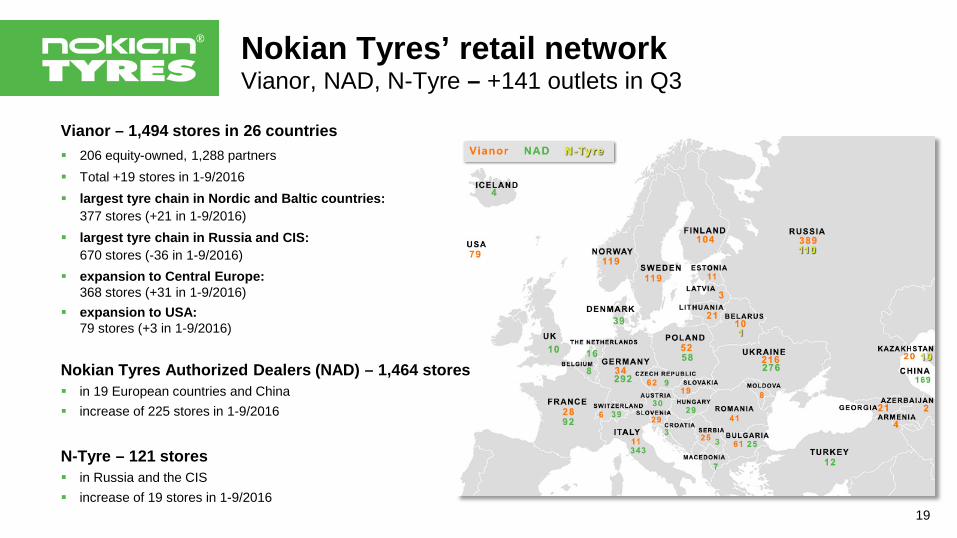
Nokian Tyres’ retail networkVianor, NAD, N-Tyre – +141 outlets in Q3
19
Vianor – 1,494 stores in 26 countries 206 equity-owned, 1,288 partners Total +19 stores in 1-9/2016 largest tyre chain in Nordic and Baltic countries:
377 stores (+21 in 1-9/2016) largest tyre chain in Russia and CIS:
670 stores (-36 in 1-9/2016) expansion to Central Europe:
368 stores (+31 in 1-9/2016) expansion to USA:
79 stores (+3 in 1-9/2016)
Nokian Tyres Authorized Dealers (NAD) – 1,464 stores in 19 European countries and China increase of 225 stores in 1-9/2016
N-Tyre – 121 stores in Russia and the CIS increase of 19 stores in 1-9/2016
20
1. General overview
2. Nokian Tyres financial performance
3. Business units
4. Nokian Tyres going forward
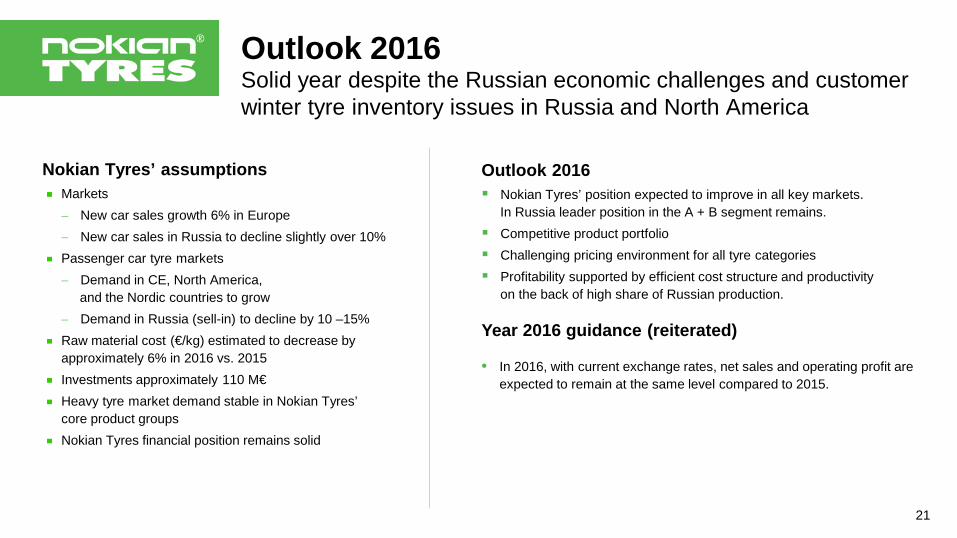
Nokian Tyres’ assumptions Markets− New car sales growth 6% in Europe− New car sales in Russia to decline slightly over 10%Passenger car tyre markets− Demand in CE, North America,
and the Nordic countries to grow− Demand in Russia (sell-in) to decline by 10 –15%Raw material cost (€/kg) estimated to decrease by approximately 6% in 2016 vs. 2015Investments approximately 110 M€Heavy tyre market demand stable in Nokian Tyres’core product groupsNokian Tyres financial position remains solid
Outlook 2016Solid year despite the Russian economic challenges and customer winter tyre inventory issues in Russia and North America
Outlook 2016 Nokian Tyres’ position expected to improve in all key markets.
In Russia leader position in the A + B segment remains. Competitive product portfolio Challenging pricing environment for all tyre categories Profitability supported by efficient cost structure and productivity
on the back of high share of Russian production.
Year 2016 guidance (reiterated)
• In 2016, with current exchange rates, net sales and operating profit are expected to remain at the same level compared to 2015.
21
Instructions to conference call attendees
Please press 0 and 1 to inform the operatorthat you have a question to the speaker.
22

Thank you!
Financial Statement Bulletin 2016
February 2, 2017
www.nokiantyres.com/investors

Nokian Tyres’ President & CEO to change
24
Stock exchange releaseSeptember 27, 2016
President & CEO Ari Lehtoranta has resigned his position in order to pursue new opportunities outside of Nokian Tyres
Ari Lehtoranta continues in his present position until the end of 2016
Company’s Board of Directors has started the recruitment process to select a new President & CEO for the company
Read more: https://www.nokiantyres.com/company/news-article/nokian-tyres-president-and-ceo-to-change/
President & CEO Ari Lehtoranta
Appendices
International Group
Biggest shareholders
Share price development
Competitor comparison
Magazine tests
Examples of new products
Winter tyre regulations
Personnel
Raw material consumption
Group Operating profit
Financing: Loans and Net Financial Expenses
Key figures
25
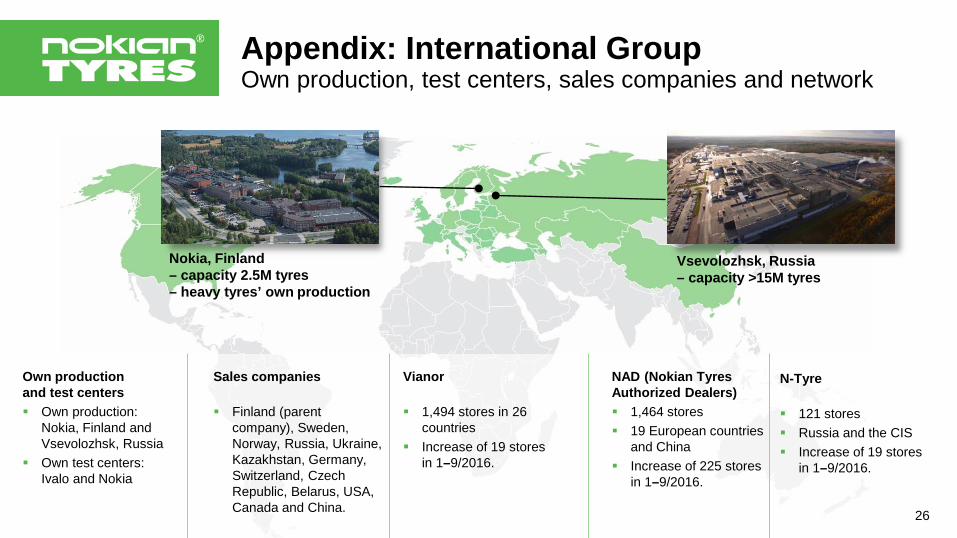
Appendix: International GroupOwn production, test centers, sales companies and network
Nokia, Finland– capacity 2.5M tyres– heavy tyres’ own production
Vsevolozhsk, Russia– capacity >15M tyres
Own productionand test centers Own production:
Nokia, Finland andVsevolozhsk, Russia
Own test centers:Ivalo and Nokia
Sales companies
Finland (parent company), Sweden, Norway, Russia, Ukraine, Kazakhstan, Germany, Switzerland, Czech Republic, Belarus, USA, Canada and China.
Vianor
1,494 stores in 26 countries
Increase of 19 storesin 1–9/2016.
NAD (Nokian Tyres Authorized Dealers) 1,464 stores 19 European countries
and China Increase of 225 stores
in 1–9/2016.
N-Tyre
121 stores Russia and the CIS Increase of 19 stores
in 1–9/2016.
26
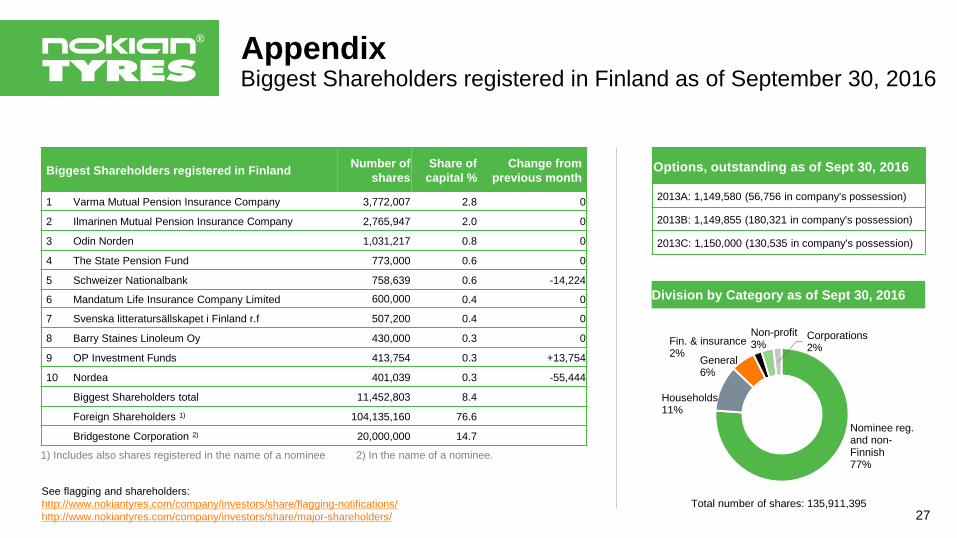
AppendixBiggest Shareholders registered in Finland as of September 30, 2016
27
Division by Category as of Sept 30, 2016
Options, outstanding as of Sept 30, 2016
2013A: 1,149,580 (56,756 in company's possession)
2013B: 1,149,855 (180,321 in company's possession)
2013C: 1,150,000 (130,535 in company's possession)
Biggest Shareholders registered in Finland Number of shares
Share of capital %
Change from previous month
1 Varma Mutual Pension Insurance Company 3,772,007 2.8 0
2 Ilmarinen Mutual Pension Insurance Company 2,765,947 2.0 0
3 Odin Norden 1,031,217 0.8 0
4 The State Pension Fund 773,000 0.6 0
5 Schweizer Nationalbank 758,639 0.6 -14,224
6 Mandatum Life Insurance Company Limited 600,000 0.4 0
7 Svenska litteratursällskapet i Finland r.f 507,200 0.4 0
8 Barry Staines Linoleum Oy 430,000 0.3 0
9 OP Investment Funds 413,754 0.3 +13,754
10 Nordea 401,039 0.3 -55,444
Biggest Shareholders total 11,452,803 8.4
Foreign Shareholders 1) 104,135,160 76.6
Bridgestone Corporation 2) 20,000,000 14.7
1) Includes also shares registered in the name of a nominee 2) In the name of a nominee.
See flagging and shareholders:http://www.nokiantyres.com/company/investors/share/flagging-notifications/http://www.nokiantyres.com/company/investors/share/major-shareholders/
Nominee reg. and non-Finnish77%
Households11%
General6%
Fin. & insurance2%
Non-profit3%
Corporations2%
Total number of shares: 135,911,395
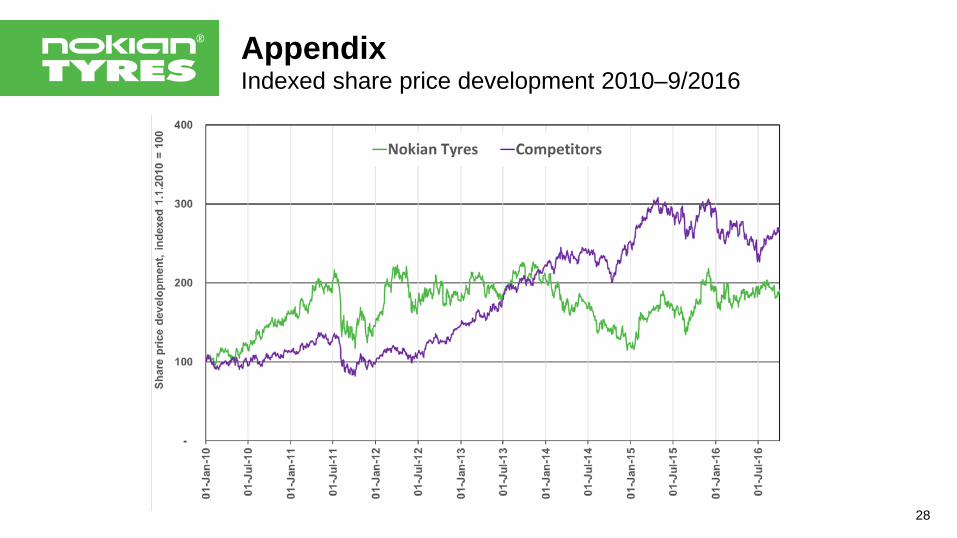
AppendixIndexed share price development 2010–9/2016
28
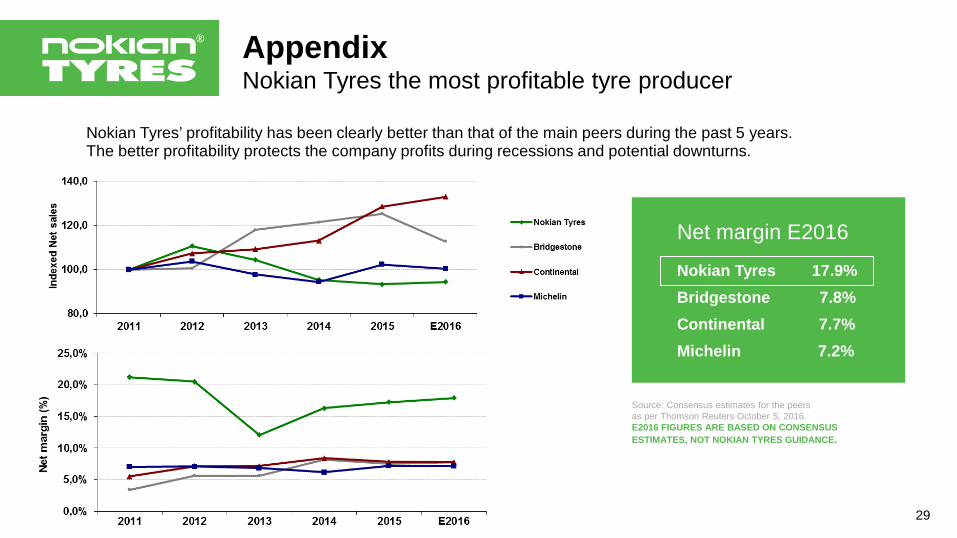
AppendixNokian Tyres the most profitable tyre producer
Nokian Tyres’ profitability has been clearly better than that of the main peers during the past 5 years. The better profitability protects the company profits during recessions and potential downturns.
Source: Consensus estimates for the peers as per Thomson Reuters October 5, 2016.E2016 FIGURES ARE BASED ON CONSENSUS ESTIMATES, NOT NOKIAN TYRES GUIDANCE.
29
Net margin E2016
Nokian Tyres 17.9% Bridgestone 7.8%Continental 7.7%Michelin 7.2%
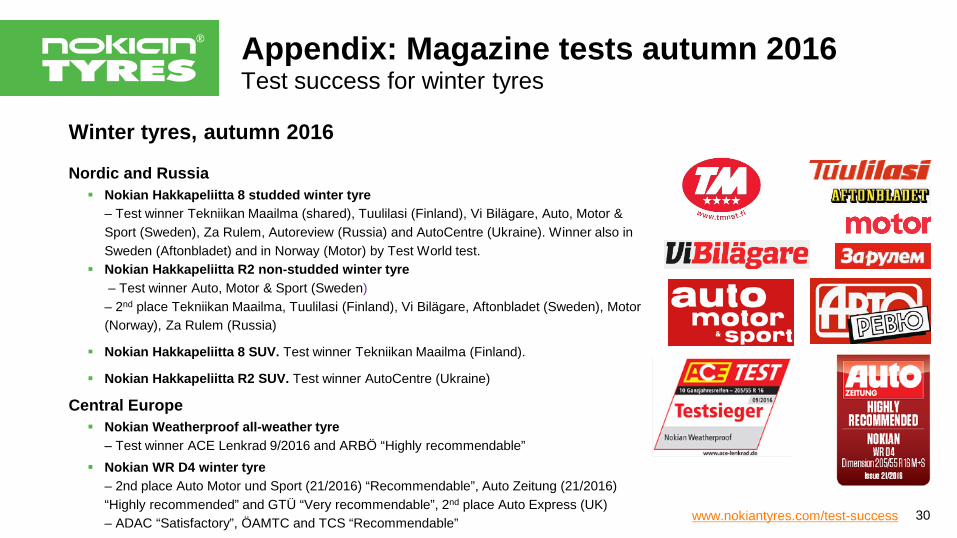
Test success for winter tyres
Winter tyres, autumn 2016
Nordic and Russia Nokian Hakkapeliitta 8 studded winter tyre
– Test winner Tekniikan Maailma (shared), Tuulilasi (Finland), Vi Bilägare, Auto, Motor & Sport (Sweden), Za Rulem, Autoreview (Russia) and AutoCentre (Ukraine). Winner also in Sweden (Aftonbladet) and in Norway (Motor) by Test World test.
Nokian Hakkapeliitta R2 non-studded winter tyre– Test winner Auto, Motor & Sport (Sweden)– 2nd place Tekniikan Maailma, Tuulilasi (Finland), Vi Bilägare, Aftonbladet (Sweden), Motor (Norway), Za Rulem (Russia)
Nokian Hakkapeliitta 8 SUV. Test winner Tekniikan Maailma (Finland).
Nokian Hakkapeliitta R2 SUV. Test winner AutoCentre (Ukraine)
Central Europe Nokian Weatherproof all-weather tyre
– Test winner ACE Lenkrad 9/2016 and ARBÖ “Highly recommendable” Nokian WR D4 winter tyre
– 2nd place Auto Motor und Sport (21/2016) “Recommendable”, Auto Zeitung (21/2016) “Highly recommended” and GTÜ “Very recommendable”, 2nd place Auto Express (UK) – ADAC “Satisfactory”, ÖAMTC and TCS “Recommendable” www.nokiantyres.com/test-success
Appendix: Magazine tests autumn 2016
30
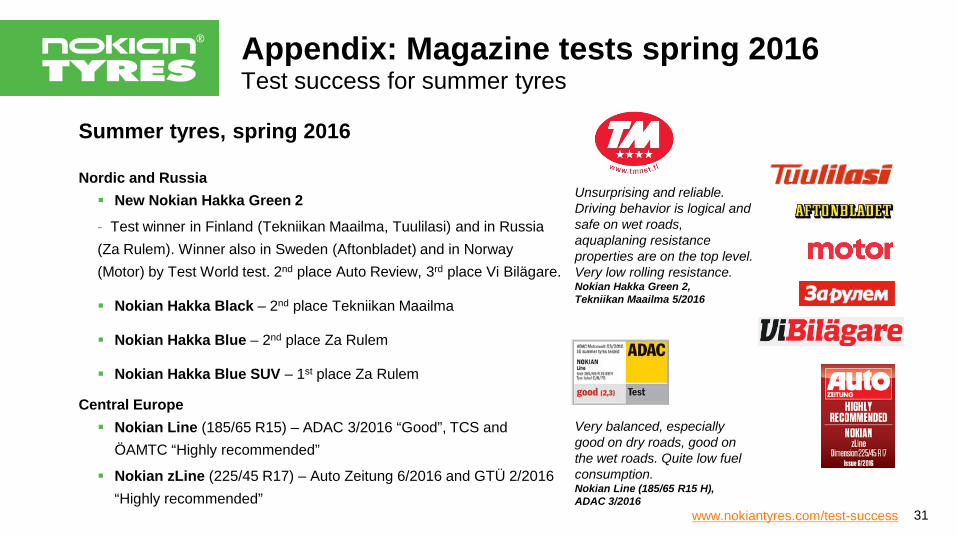
Test success for summer tyres
Summer tyres, spring 2016
Nordic and Russia New Nokian Hakka Green 2
- Test winner in Finland (Tekniikan Maailma, Tuulilasi) and in Russia (Za Rulem). Winner also in Sweden (Aftonbladet) and in Norway (Motor) by Test World test. 2nd place Auto Review, 3rd place Vi Bilägare.
Nokian Hakka Black – 2nd place Tekniikan Maailma
Nokian Hakka Blue – 2nd place Za Rulem
Nokian Hakka Blue SUV – 1st place Za Rulem
Central Europe Nokian Line (185/65 R15) – ADAC 3/2016 “Good”, TCS and
ÖAMTC “Highly recommended”
Nokian zLine (225/45 R17) – Auto Zeitung 6/2016 and GTÜ 2/2016 “Highly recommended”
31www.nokiantyres.com/test-success
Appendix: Magazine tests spring 2016
Unsurprising and reliable. Driving behavior is logical and safe on wet roads, aquaplaning resistance properties are on the top level. Very low rolling resistance. Nokian Hakka Green 2, Tekniikan Maailma 5/2016
Very balanced, especially good on dry roads, good on the wet roads. Quite low fuel consumption.Nokian Line (185/65 R15 H), ADAC 3/2016
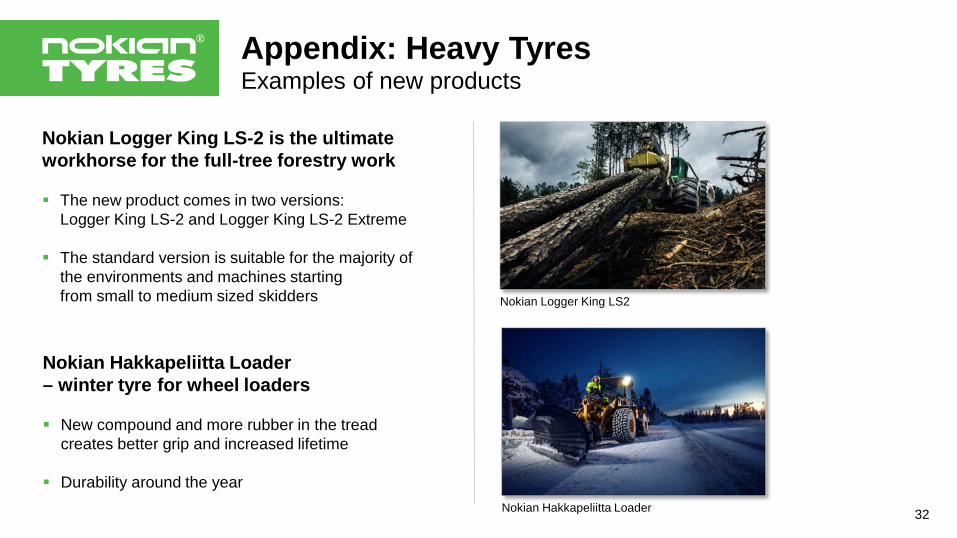
Appendix: Heavy TyresExamples of new products
32
Nokian Logger King LS-2 is the ultimate workhorse for the full-tree forestry work
The new product comes in two versions:Logger King LS-2 and Logger King LS-2 Extreme
The standard version is suitable for the majority of the environments and machines startingfrom small to medium sized skidders Nokian Logger King LS2
Nokian Hakkapeliitta Loader – winter tyre for wheel loaders
New compound and more rubber in the tread creates better grip and increased lifetime
Durability around the yearNokian Hakkapeliitta Loader
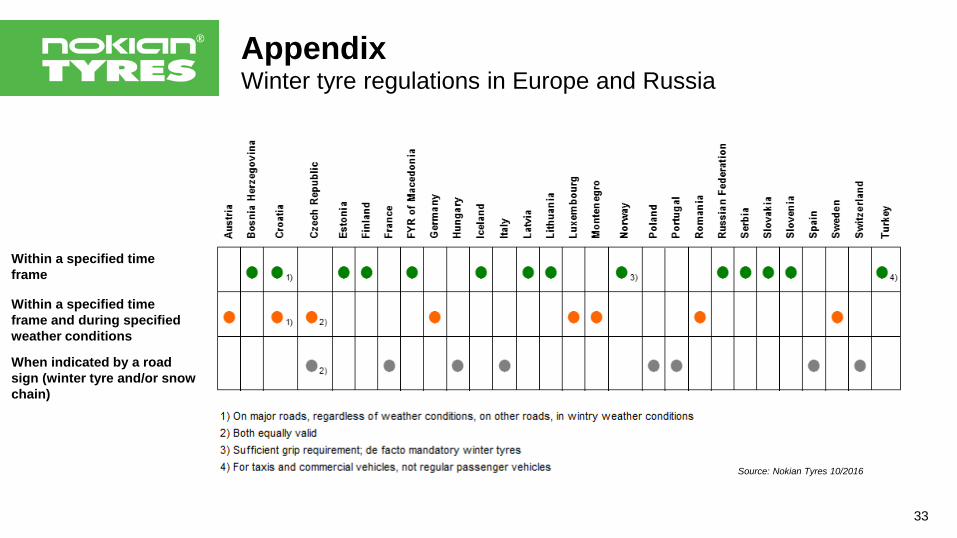
AppendixWinter tyre regulations in Europe and Russia
33
Within a specified time frame
When indicated by a road sign (winter tyre and/or snow chain)
Within a specified time frame and during specifiedweather conditions
Source: Nokian Tyres 10/2016
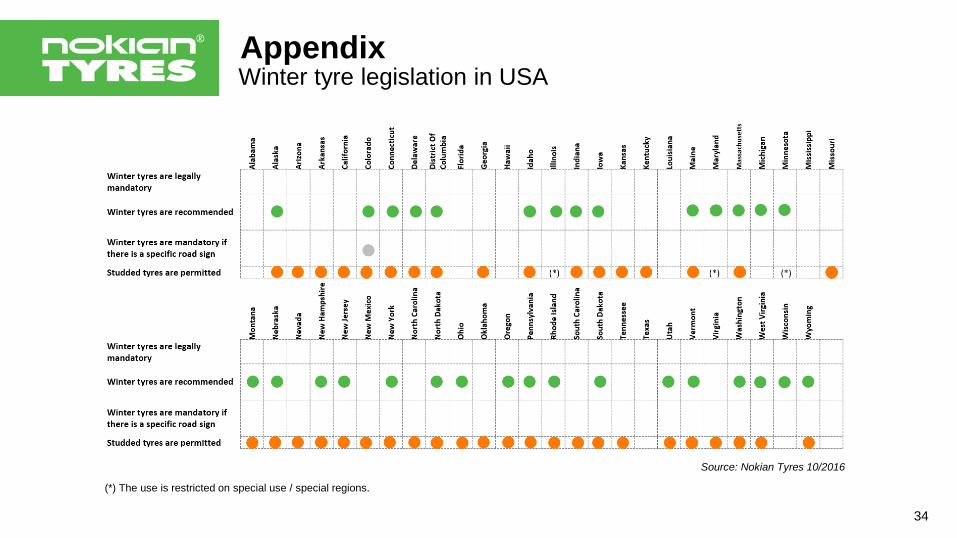
Winter tyre legislation in USA
(*) The use is restricted on special use / special regions.
Source: Nokian Tyres 10/2016
Appendix
34
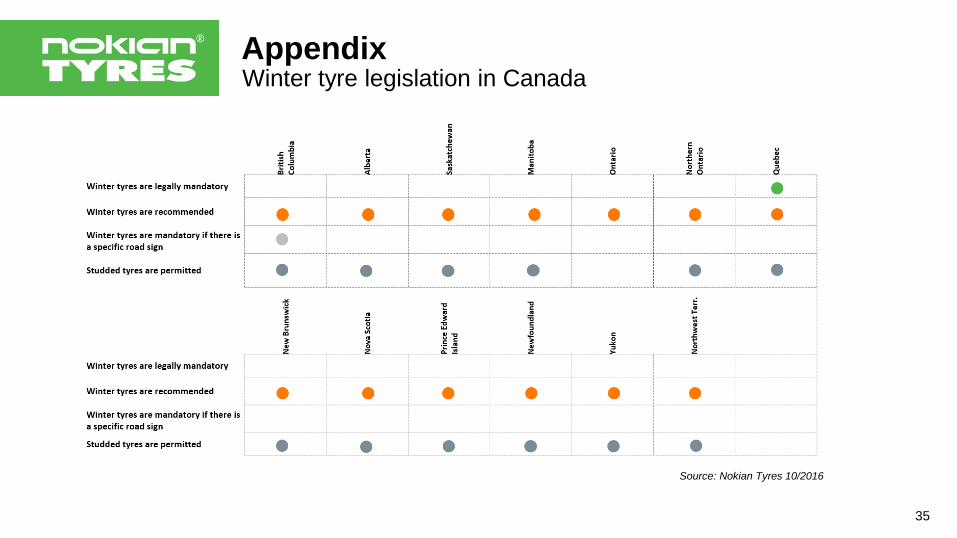
Source: Nokian Tyres 10/2016
35
AppendixWinter tyre legislation in Canada
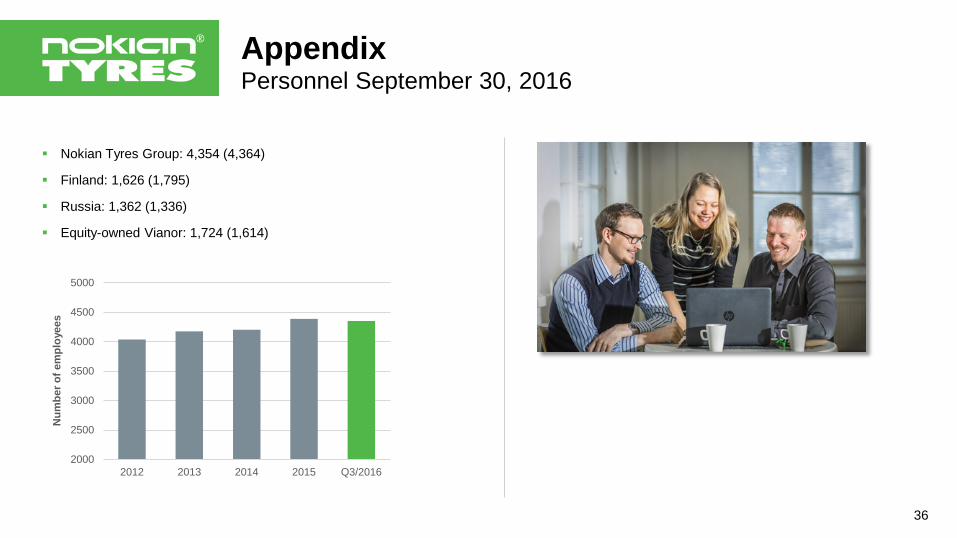
AppendixPersonnel September 30, 2016
Nokian Tyres Group: 4,354 (4,364)
Finland: 1,626 (1,795)
Russia: 1,362 (1,336)
Equity-owned Vianor: 1,724 (1,614)
36
2000
2500
3000
3500
4000
4500
5000
2012 2013 2014 2015 Q3/2016
Num
ber o
f em
ploy
ees
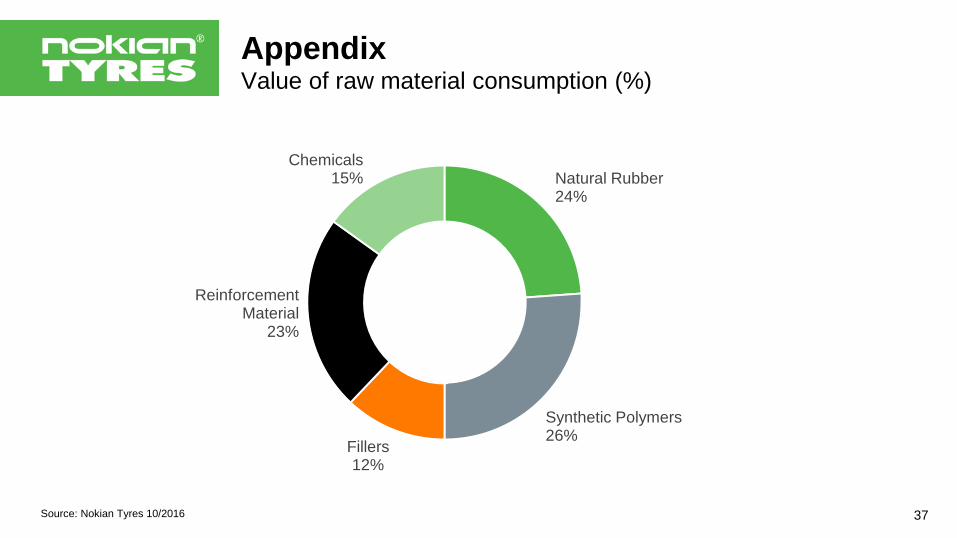
AppendixValue of raw material consumption (%)
37Source: Nokian Tyres 10/2016
Natural Rubber24%
Synthetic Polymers26%
Fillers12%
Reinforcement Material
23%
Chemicals15%
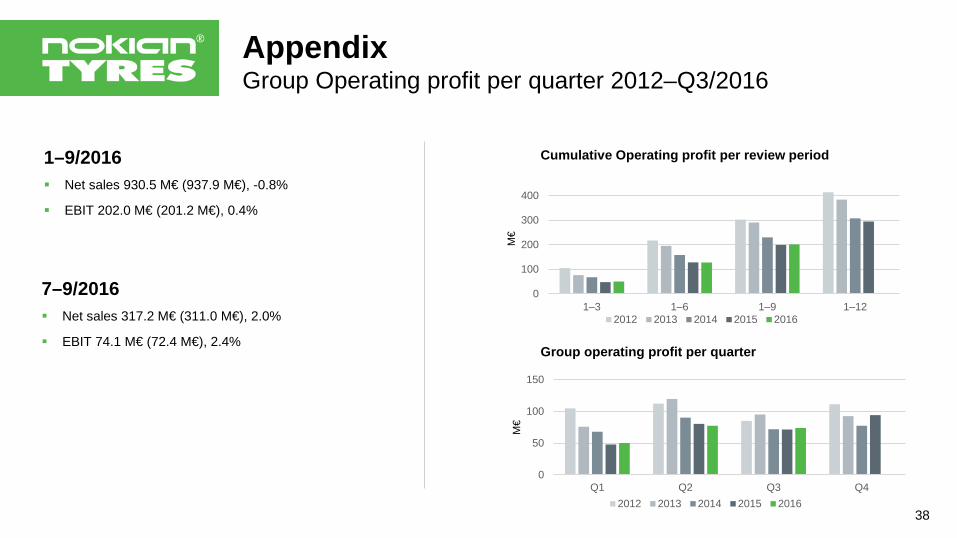
1–9/2016 Net sales 930.5 M€ (937.9 M€), -0.8%
EBIT 202.0 M€ (201.2 M€), 0.4%
AppendixGroup Operating profit per quarter 2012–Q3/2016
38
Cumulative Operating profit per review period
Group operating profit per quarter
7–9/2016 Net sales 317.2 M€ (311.0 M€), 2.0%
EBIT 74.1 M€ (72.4 M€), 2.4%
0
100
200
300
400
1–3 1–6 1–9 1–12
M€
2012 2013 2014 2015 2016
0
50
100
150
Q1 Q2 Q3 Q4
M€
2012 2013 2014 2015 2016
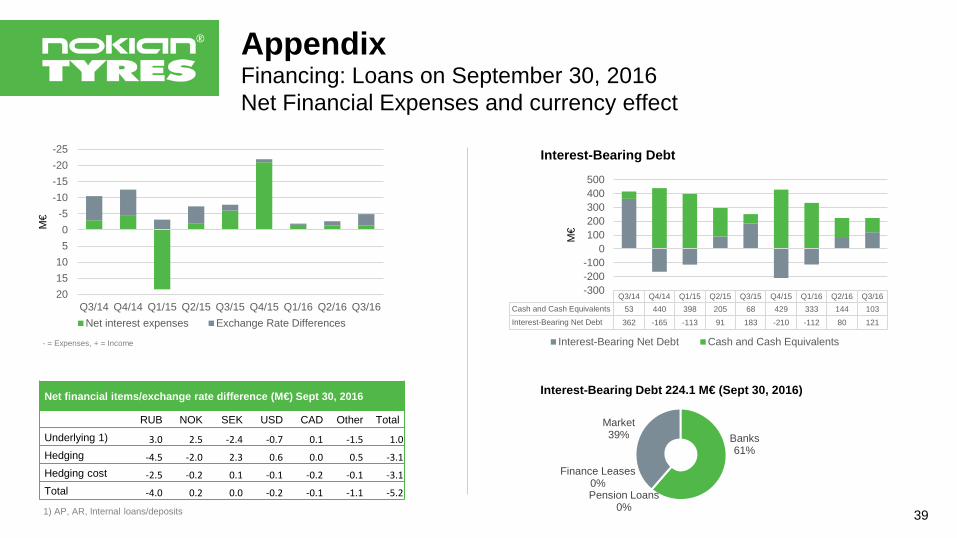
AppendixFinancing: Loans on September 30, 2016Net Financial Expenses and currency effect
39
Net financial items/exchange rate difference (M€) Sept 30, 2016
RUB NOK SEK USD CAD Other TotalUnderlying 1) 3.0 2.5 -2.4 -0.7 0.1 -1.5 1.0Hedging -4.5 -2.0 2.3 0.6 0.0 0.5 -3.1Hedging cost -2.5 -0.2 0.1 -0.1 -0.2 -0.1 -3.1Total -4.0 0.2 0.0 -0.2 -0.1 -1.1 -5.2
1) AP, AR, Internal loans/deposits
- = Expenses, + = Income
-25-20-15-10-505
101520
Q3/14 Q4/14 Q1/15 Q2/15 Q3/15 Q4/15 Q1/16 Q2/16 Q3/16
M€
Net interest expenses Exchange Rate Differences
Q3/14 Q4/14 Q1/15 Q2/15 Q3/15 Q4/15 Q1/16 Q2/16 Q3/16Cash and Cash Equivalents 53 440 398 205 68 429 333 144 103Interest-Bearing Net Debt 362 -165 -113 91 183 -210 -112 80 121
-300-200-100
0100200300400500
M€
Interest-Bearing Net Debt Cash and Cash Equivalents
Banks61%
Pension Loans0%
Finance Leases0%
Market39%
Interest-Bearing Debt 224.1 M€ (Sept 30, 2016)
Interest-Bearing Debt
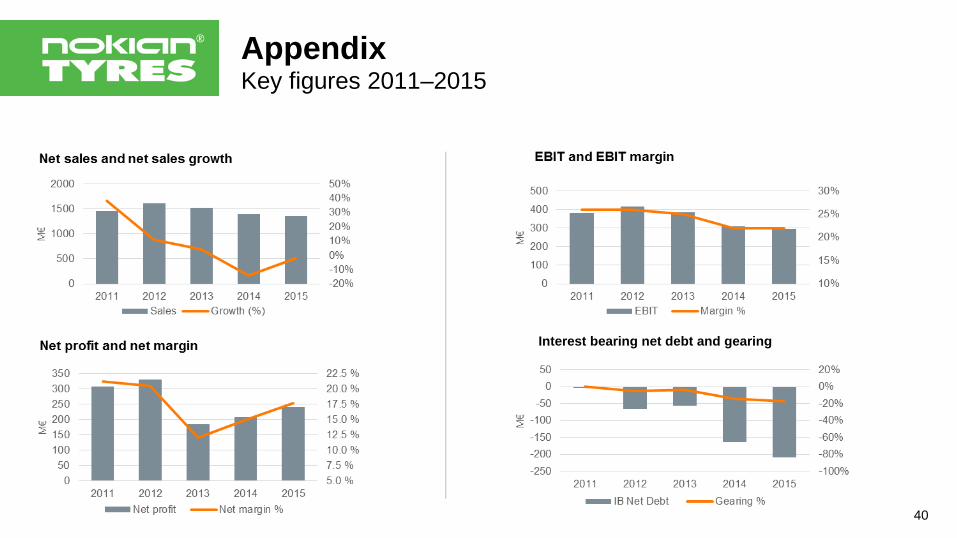
AppendixKey figures 2011–2015
Interest bearing net debt and gearing
40
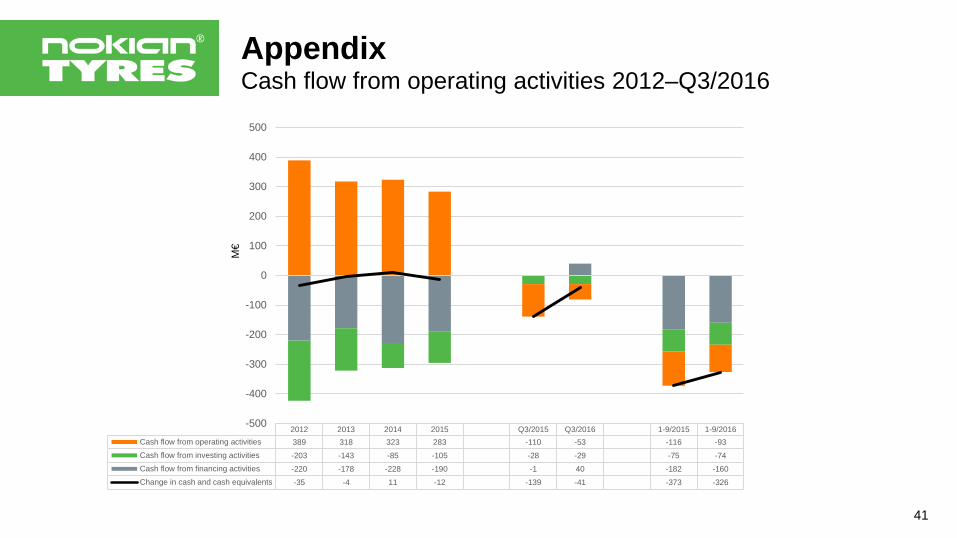
AppendixCash flow from operating activities 2012–Q3/2016
41
2012 2013 2014 2015 Q3/2015 Q3/2016 1-9/2015 1-9/2016Cash flow from operating activities 389 318 323 283 -110 -53 -116 -93Cash flow from investing activities -203 -143 -85 -105 -28 -29 -75 -74Cash flow from financing activities -220 -178 -228 -190 -1 40 -182 -160Change in cash and cash equivalents -35 -4 11 -12 -139 -41 -373 -326
-500
-400
-300
-200
-100
0
100
200
300
400
500
M€
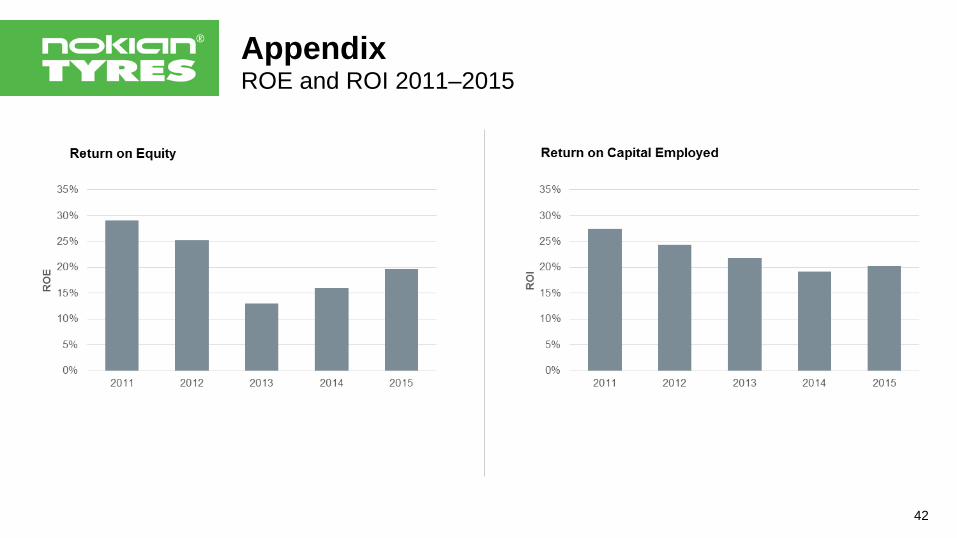
AppendixROE and ROI 2011–2015
42

Thank you!Financial Statement Bulletin2016
February 2, 2017
www.nokiantyres.com/investors