intercomparison of seawifs and meris marine products on ... · intercomparison of seawifs and meris...
TRANSCRIPT
Intercomparison of
SeaWiFS and MERIS marine products on Case 1 waters
Vincent Fournier-Sicre(1)
Simon Belanger(2)
(1) Email : [email protected]
ACRI-ST 260 Route du Pin Montard, BP 234 06904 Sophia Antipolis – France
(2) Email : [email protected]
ESA/ESRIN - Data Handling Division Via Galileo Galilei - Casella Postale 64
00044 Frascati - Italy
Introduction:
The objectives of this work were to get preliminary evaluations of differences between the SeaWiFS and MERIS case 1 water products. That meant that the inter comparisons were performed on water leaving reflectances, chlorophyll concentration and aerosol optical thickness at 865nm (even if this is not a marine product it cannot be decoupled since production of water products of sufficiently good quality is directly related to proper atmospheric corrections - atmosphere accounts for close to 90% of the TOA signal); epsilon and PAR are not considered in this analysis as MERIS and SeaWiFS products are not directly comparable (the SeaWiFS PAR is a daily estimate whereas the MERIS product is an instantaneous estimate).
Context: The first observations of ocean colour from space were carried out by the experimental Coastal Zone Colour Scanner (CZCS) from 1978 to 1986 aboard NASA's Nimbus-7 satellite. This instrument provided global and regional data sets which yielded a wealth of new information concerning the distribution and seasonal variability of primary productivity (Antoine, André and Morel, 1996). Since 1996, the availability of data from new ocean colour sensors (e.g. MOS, OCTS, POLDER, SeaWiFS and MODIS) allows such studies to be pursued. From those new sensors, SeaWiFS is now providing long-term global coverage of the oceans and its data are widely used by the scientific community. The MERIS mission provides global repetitive coverage of the Earth for a significant set of geo-physical parameters, relevant to a wide area of operational climatology research activities. The primary MERIS mission, namely Ocean colour, as well as climatological studies, require global, regional and local data sets, validated and consistent over long time periods. It is considered as the European contribution to an era of continuous observations, which started with SeaWiFS in September 1997. Availability of observations over long time periods is essential for monitoring phenomena directly affecting global warming such as the carbon fluxes. This is only possible if the measurements of successive space missions are combined together in a consistent manner. This consistency must be based on inter-comparisons like the ones initiated by the Sensor Inter comparison and Merger for Biological and Interdisciplinary Oceanic Studies (SIMBIOS - http://www.ioccg.org/general/simbios/simbios.html) programme. The ultimate objective of this programme is to integrate information from multiple satellite ocean colour sensors and to create scientific quality data sets for routine distribution to user community. In order to ensure continuity of the ocean monitoring, it is essential that studies investigating the discrepancies between the products obtained through the various sensors be conducted. The work that is presented describes an inter comparison between the SeaWiFS and MERIS marine products. It is known that some discrepancies in chlorophyll concentration between OCTS, POLDER and SeaWiFS in wide oligotrophic areas of the Mediterranean Sea have been observed (Bricaud et al., 2002). In addition, Bricaud et al. (2002)
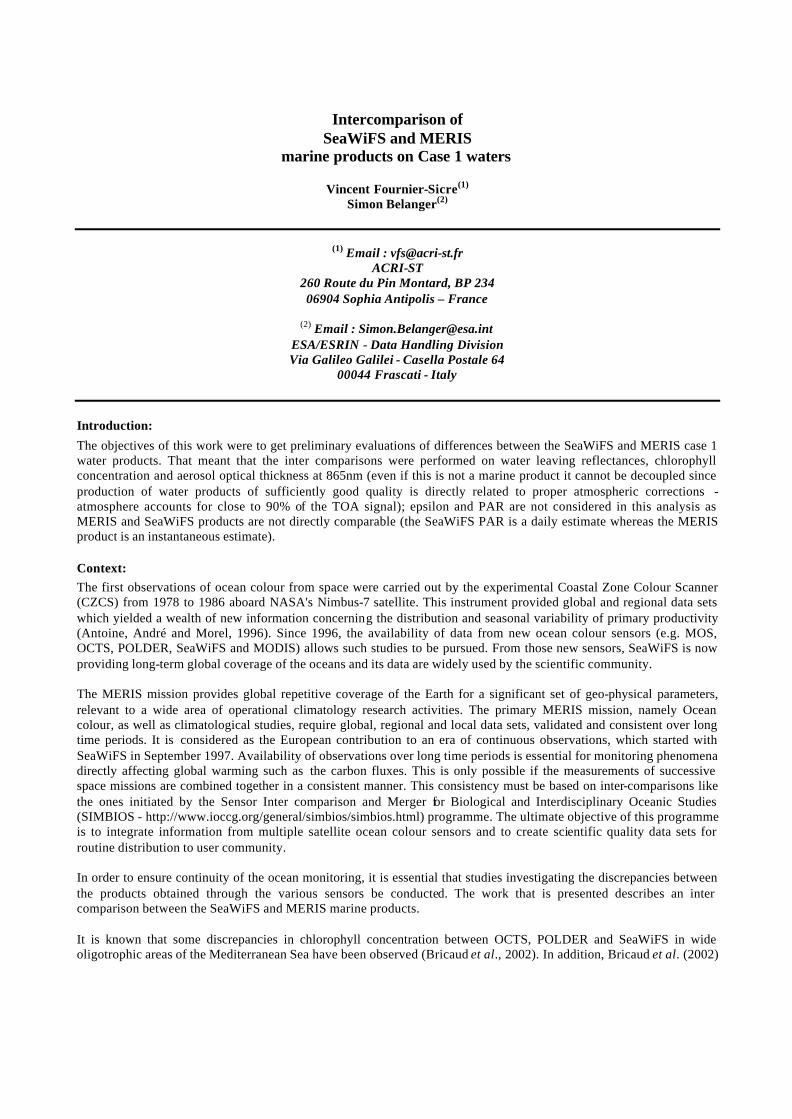
and Ortenzio et al (2002) showed that SeaWiFS bio-optical algorithms over-estimate chlorophyll concentration in many oligotrophic areas of the Mediterranean Sea. Inter comparison between ocean colour sensors is shown in the following graphics. These have been extracted from a PhD thesis defended in November 2002 (Emmanuel Bosc: Variations saisonnières et interannuelles de la biomasse phytoplanctonique et de la production primaire en Méditerranée: Evaluation et utilisation des données satellitales de couleur de l’océan - Nov. 2002 PhD - Laboratoire d’Océanographie de Villefranche sur Mer). The graphic presents the Mediterranean chlorophyll mean concentration taken over periods from 7 to 10 days all along a year and as estimated by different sensors. As it may be seen, typical differences between the chlorophyll concentrations is of the order of 10-15%.
Fig. 1 : Mediterranean mean chlorophyll concentration estimated by different sensors along a year.
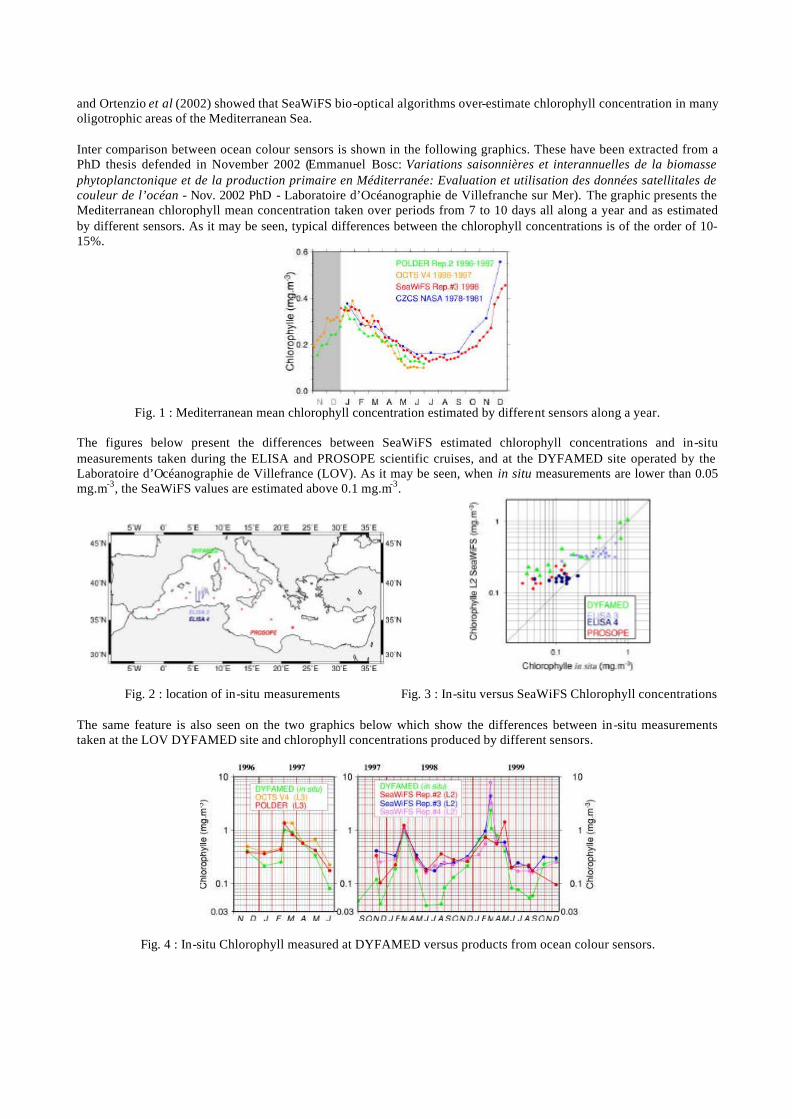
The figures below present the differences between SeaWiFS estimated chlorophyll concentrations and in-situ measurements taken during the ELISA and PROSOPE scientific cruises, and at the DYFAMED site operated by the Laboratoire d’Océanographie de Villefrance (LOV). As it may be seen, when in situ measurements are lower than 0.05 mg.m-3, the SeaWiFS values are estimated above 0.1 mg.m-3.
Fig. 2 : location of in-situ measurements Fig. 3 : In-situ versus SeaWiFS Chlorophyll concentrations The same feature is also seen on the two graphics below which show the differences between in-situ measurements taken at the LOV DYFAMED site and chlorophyll concentrations produced by different sensors.
Fig. 4 : In-situ Chlorophyll measured at DYFAMED versus products from ocean colour sensors.
Methodology:
The Level 2 images (LAC for SeaWiFS and RR for MERIS) that were selected had to be free of clouds, covered the same area, and were the closest in time (which is always around two hours and MERIS data being measured first). Any MERIS case 2 water identified pixel was excluded. The SeaWiFS water leaving radiances were first converted into normalized reflectances. Then, to take into account the BRDF and to simulate a signal measured at Nadir with a Sun at Nadir, reflectances of both instruments were rectified using the f/Q table used in the MERIS Level 2 processing. The bands that were compared are the bands that are the closest (therefore 6 bands out of the 7 first band of MERIS were retained:412, 442, 490, 510, 560, and 665 nm for MERIS – the 620nm band was not included in the analysis since this band is not present for SeaWiFS). The SeaWiFS chlorophyll concentration that was compared to is the one produced with the OC4 algorithm. The data (water leaving reflectances, aerosol optical thickness at 865nm, and chlorophyll concentration) were projected on a plate-carrée grid and averaged on 3.3x3.3 km2 (9-10 pixels were therefore averaged on both sides).
Configuration: The latest SeaDas version and configuration (Version 4.3p3 distributed in November 2002) and the latest MERIS Level 2 processing (MEGS Version 5.2p3 with the smile correction in its latest configuration, and with the minor updates of the Level 2 processing except for the transmittance improvements) were used. The configuration of the MERIS auxiliary products was the one used for reprocessing of the match-up data for the validation PIs.
Data Used:
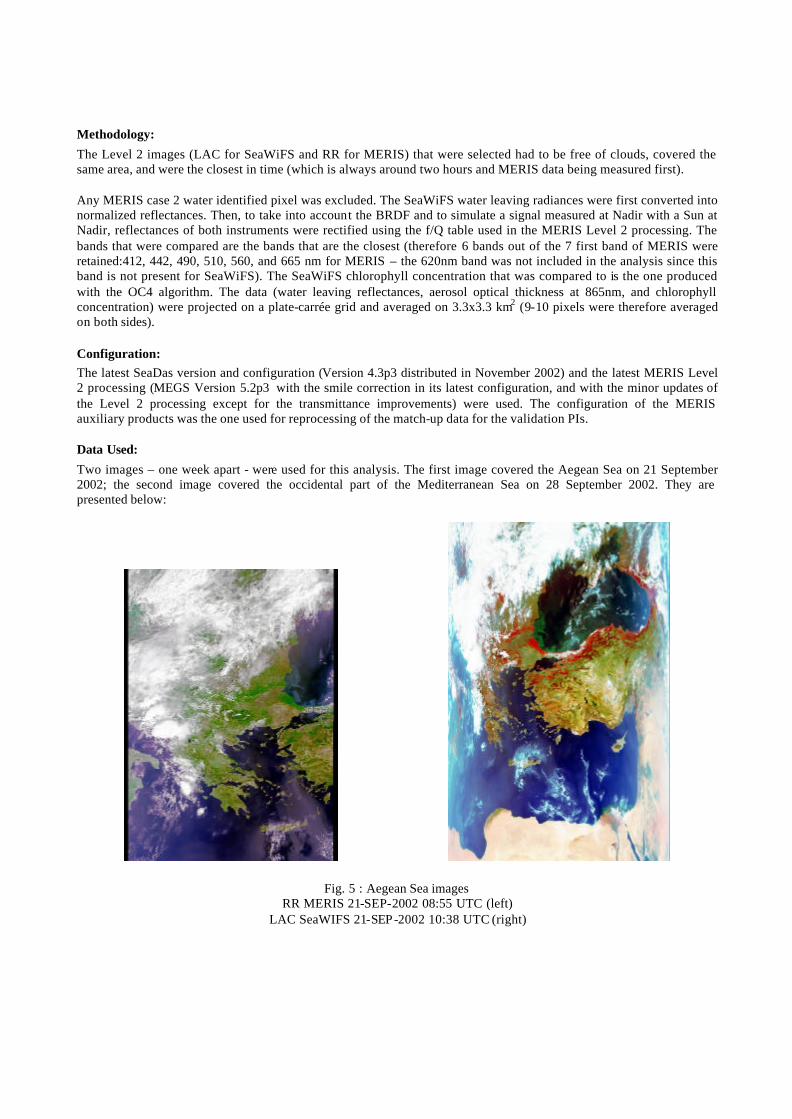
Two images – one week apart - were used for this analysis. The first image covered the Aegean Sea on 21 September 2002; the second image covered the occidental part of the Mediterranean Sea on 28 September 2002. They are presented below:
Fig. 5 : Aegean Sea images RR MERIS 21-SEP-2002 08:55 UTC (left)
LAC SeaWIFS 21-SEP-2002 10:38 UTC (right)
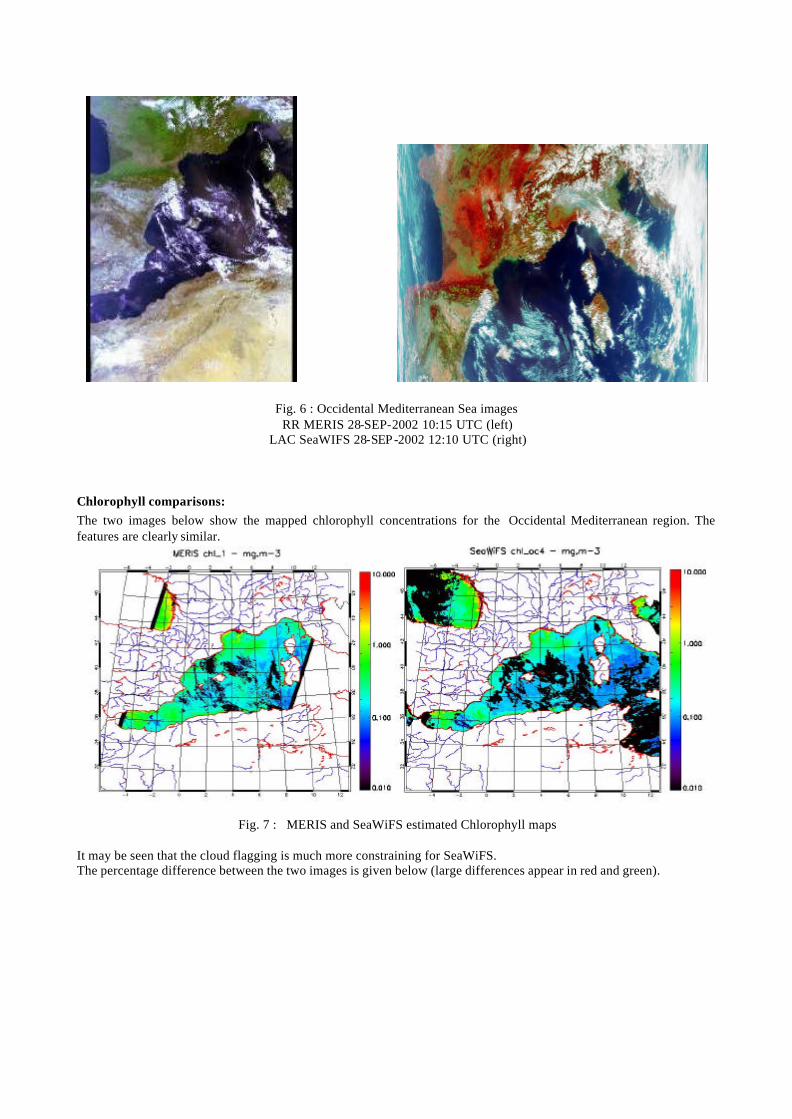
Fig. 6 : Occidental Mediterranean Sea images RR MERIS 28-SEP-2002 10:15 UTC (left)
LAC SeaWIFS 28-SEP-2002 12:10 UTC (right)
Chlorophyll comparisons: The two images below show the mapped chlorophyll concentrations for the Occidental Mediterranean region. The features are clearly similar.
Fig. 7 : MERIS and SeaWiFS estimated Chlorophyll maps It may be seen that the cloud flagging is much more constraining for SeaWiFS. The percentage difference between the two images is given below (large differences appear in red and green).
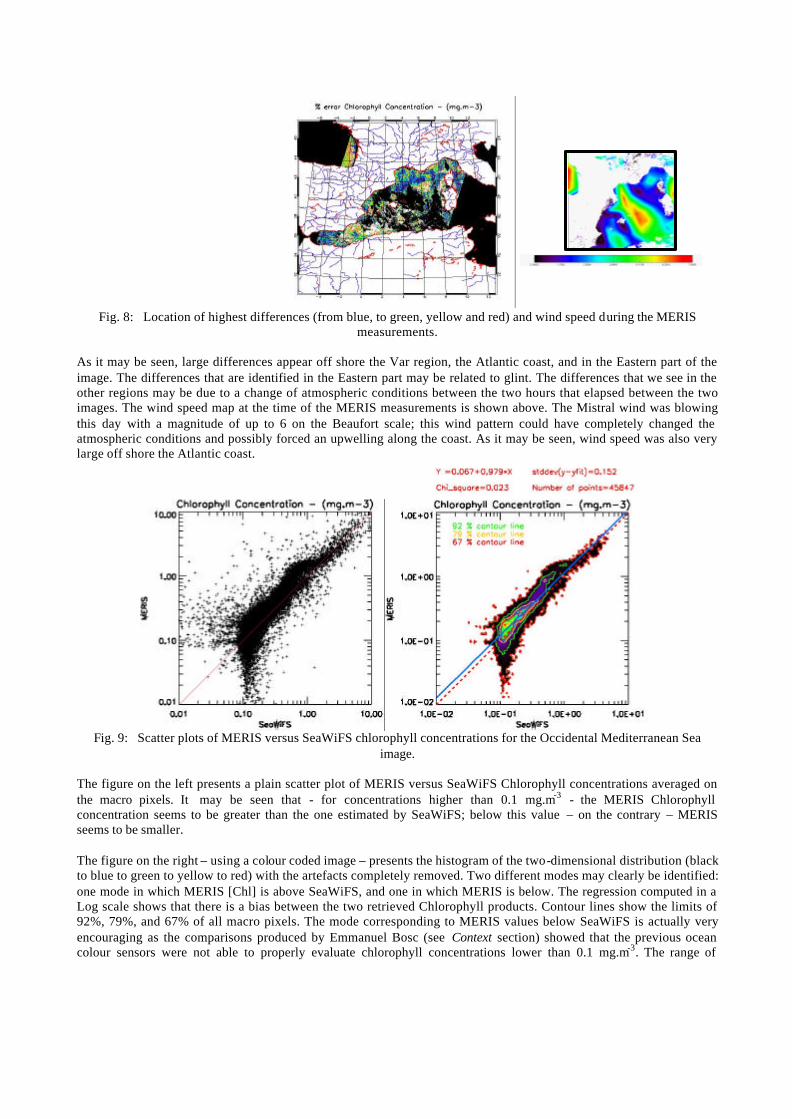
Fig. 8: Location of highest differences (from blue, to green, yellow and red) and wind speed during the MERIS
measurements. As it may be seen, large differences appear off shore the Var region, the Atlantic coast, and in the Eastern part of the image. The differences that are identified in the Eastern part may be related to glint. The differences that we see in the other regions may be due to a change of atmospheric conditions between the two hours that elapsed between the two images. The wind speed map at the time of the MERIS measurements is shown above. The Mistral wind was blowing this day with a magnitude of up to 6 on the Beaufort scale; this wind pattern could have completely changed the atmospheric conditions and possibly forced an upwelling along the coast. As it may be seen, wind speed was also very large off shore the Atlantic coast.
Fig. 9: Scatter plots of MERIS versus SeaWiFS chlorophyll concentrations for the Occidental Mediterranean Sea
image. The figure on the left presents a plain scatter plot of MERIS versus SeaWiFS Chlorophyll concentrations averaged on the macro pixels. It may be seen that - for concentrations higher than 0.1 mg.m-3 - the MERIS Chlorophyll concentration seems to be greater than the one estimated by SeaWiFS; below this value – on the contrary – MERIS seems to be smaller. The figure on the right – using a colour coded image – presents the histogram of the two-dimensional distribution (black to blue to green to yellow to red) with the artefacts completely removed. Two different modes may clearly be identified: one mode in which MERIS [Chl] is above SeaWiFS, and one in which MERIS is below. The regression computed in a Log scale shows that there is a bias between the two retrieved Chlorophyll products. Contour lines show the limits of 92%, 79%, and 67% of all macro pixels. The mode corresponding to MERIS values below SeaWiFS is actually very encouraging as the comparisons produced by Emmanuel Bosc (see Context section) showed that the previous ocean colour sensors were not able to properly evaluate chlorophyll concentrations lower than 0.1 mg.m-3. The range of
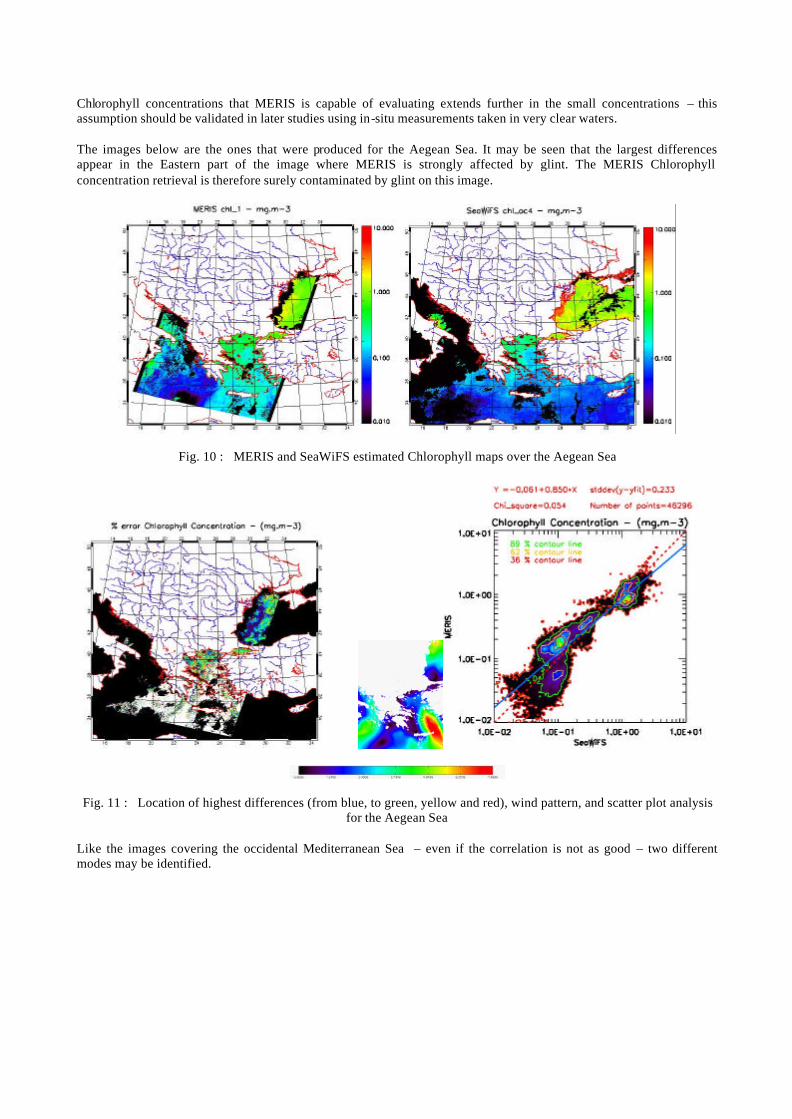
Chlorophyll concentrations that MERIS is capable of evaluating extends further in the small concentrations – this assumption should be validated in later studies using in-situ measurements taken in very clear waters. The images below are the ones that were produced for the Aegean Sea. It may be seen that the largest differences appear in the Eastern part of the image where MERIS is strongly affected by glint. The MERIS Chlorophyll concentration retrieval is therefore surely contaminated by glint on this image.
Fig. 10 : MERIS and SeaWiFS estimated Chlorophyll maps over the Aegean Sea
Fig. 11 : Location of highest differences (from blue, to green, yellow and red), wind pattern, and scatter plot analysis for the Aegean Sea
Like the images covering the occidental Mediterranean Sea – even if the correlation is not as good – two different modes may be identified.
865nm aerosol optical thickness comparisons: The following figures show the 865nm aerosol optical thickness maps for the occidental Mediterranean Sea images. The percentage difference together with the scatter plot is presented below.
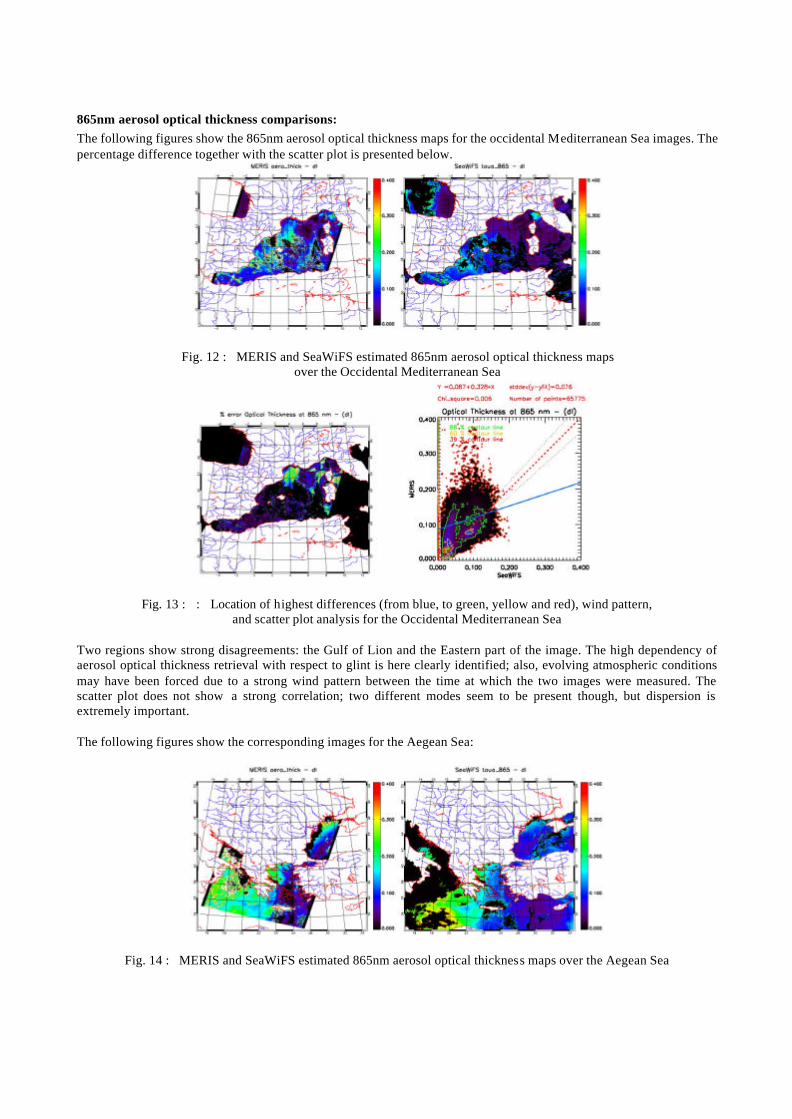
Fig. 12 : MERIS and SeaWiFS estimated 865nm aerosol optical thickness maps over the Occidental Mediterranean Sea
Fig. 13 : : Location of highest differences (from blue, to green, yellow and red), wind pattern, and scatter plot analysis for the Occidental Mediterranean Sea
Two regions show strong disagreements: the Gulf of Lion and the Eastern part of the image. The high dependency of aerosol optical thickness retrieval with respect to glint is here clearly identified; also, evolving atmospheric conditions may have been forced due to a strong wind pattern between the time at which the two images were measured. The scatter plot does not show a strong correlation; two different modes seem to be present though, but dispersion is extremely important. The following figures show the corresponding images for the Aegean Sea:
Fig. 14 : MERIS and SeaWiFS estimated 865nm aerosol optical thickness maps over the Aegean Sea
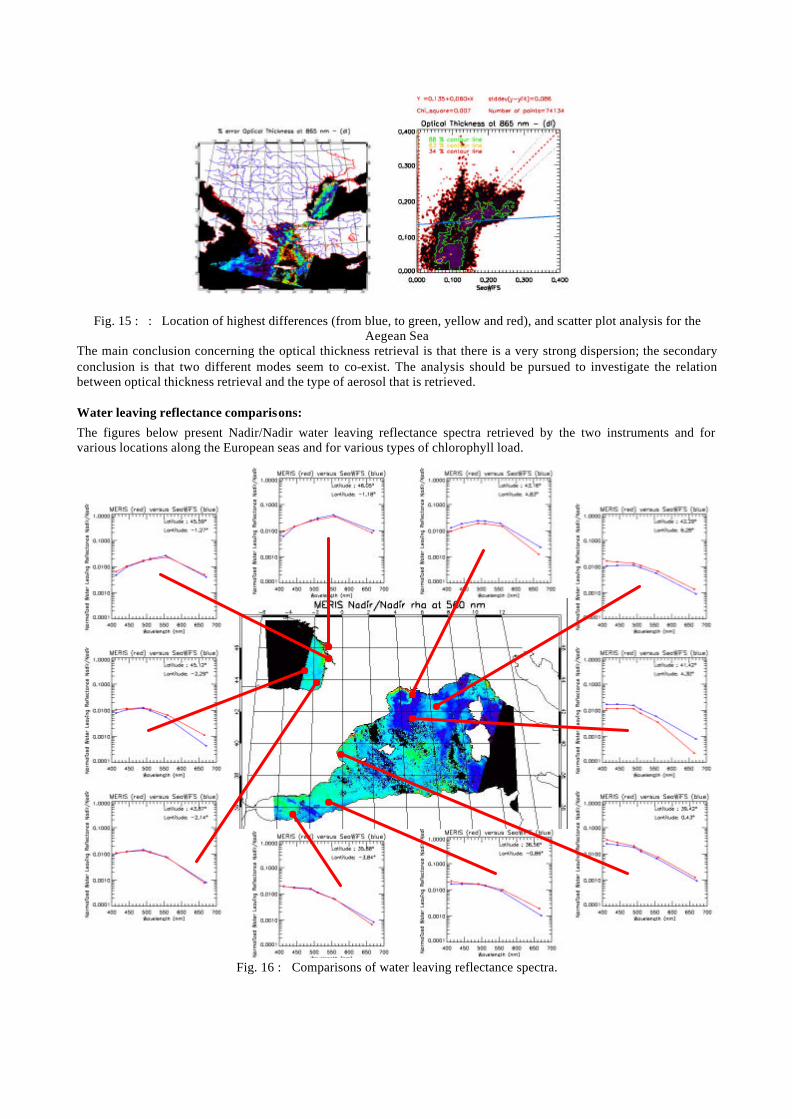
Fig. 15 : : Location of highest differences (from blue, to green, yellow and red), and scatter plot analysis for the Aegean Sea
The main conclusion concerning the optical thickness retrieval is that there is a very strong dispersion; the secondary conclusion is that two different modes seem to co-exist. The analysis should be pursued to investigate the relation between optical thickness retrieval and the type of aerosol that is retrieved.
Water leaving reflectance comparisons:
The figures below present Nadir/Nadir water leaving reflectance spectra retrieved by the two instruments and for various locations along the European seas and for various types of chlorophyll load.
Fig. 16 : Comparisons of water leaving reflectance spectra.
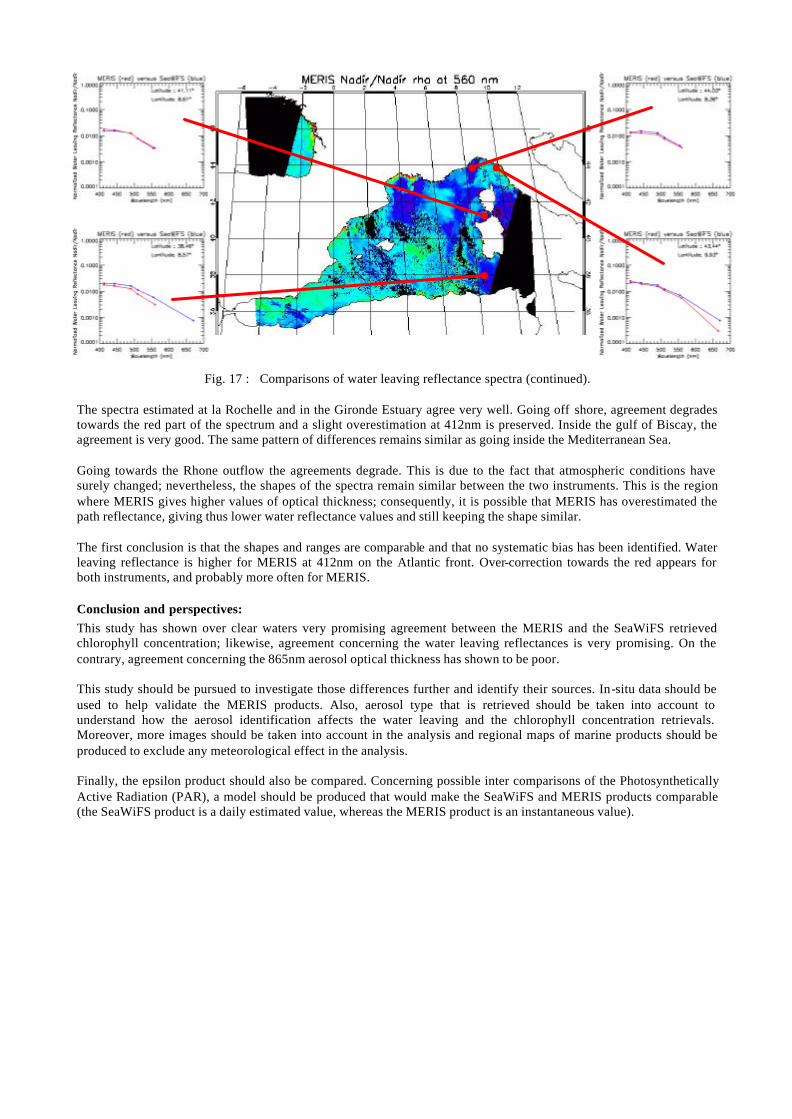
Fig. 17 : Comparisons of water leaving reflectance spectra (continued). The spectra estimated at la Rochelle and in the Gironde Estuary agree very well. Going off shore, agreement degrades towards the red part of the spectrum and a slight overestimation at 412nm is preserved. Inside the gulf of Biscay, the agreement is very good. The same pattern of differences remains similar as going inside the Mediterranean Sea. Going towards the Rhone outflow the agreements degrade. This is due to the fact that atmospheric conditions have surely changed; nevertheless, the shapes of the spectra remain similar between the two instruments. This is the region where MERIS gives higher values of optical thickness; consequently, it is possible that MERIS has overestimated the path reflectance, giving thus lower water reflectance values and still keeping the shape similar. The first conclusion is that the shapes and ranges are comparable and that no systematic bias has been identified. Water leaving reflectance is higher for MERIS at 412nm on the Atlantic front. Over-correction towards the red appears for both instruments, and probably more often for MERIS.
Conclusion and perspectives: This study has shown over clear waters very promising agreement between the MERIS and the SeaWiFS retrieved chlorophyll concentration; likewise, agreement concerning the water leaving reflectances is very promising. On the contrary, agreement concerning the 865nm aerosol optical thickness has shown to be poor. This study should be pursued to investigate those differences further and identify their sources. In-situ data should be used to help validate the MERIS products. Also, aerosol type that is retrieved should be taken into account to understand how the aerosol identification affects the water leaving and the chlorophyll concentration retrievals. Moreover, more images should be taken into account in the analysis and regional maps of marine products should be produced to exclude any meteorological effect in the analysis. Finally, the epsilon product should also be compared. Concerning possible inter comparisons of the Photosynthetically Active Radiation (PAR), a model should be produced that would make the SeaWiFS and MERIS products comparable (the SeaWiFS product is a daily estimated value, whereas the MERIS product is an instantaneous value).
References: 1. Antoine, D., J-M. André and A. Morel (1996) Oceanic primary production: II. Estimation at global scale from satellite (CZCS) chlorophyll. Global Geochem. Cycles, 10 (1), 57-69. 2. Barnes, R., D. K. Clark, W. E. Esaias, G. S. Fargion, G. C. Feldman, and C. R. McClain (2001) Development of a Consistent Multi-Sensor Global Ocean Color Time Series, International Workshop on Geo-Spatial Knowledge Processing for Natural Resource Management, Varese, Italy, 28-29 June. 3. Bricaud, A., E. Bosc and D. Antoine (2002) Algal biomass and sea surface temperature in the Mediterranean Basin Intercomparison of data from various satellite sensor, and implications for primary production estimates. Remote Sensing of Environment, 81 (2-3), 163-178. 4. D’Ortenzio, F., S. Marullo, M. Ragni, M. Ridera d’Alcalà, R. Santoleri (2002) Validation of empirical SeaWiFS algorithms for chlorophyll-a retrieval in Mediterranean Sea: A case stydy for oligothrophic seas. Remote Sensing of Environment, 82, 79-94 5. Gordon H, R. and M. Wang (1994) Retrieval of water-leaving radiance and aerosol optical thickness over oceans with SeaWiFS: a preliminary algorithm. Applied Optics, 33(3), 443-452. 6. Gregg W.W. (2001) Merging Ocean Color Data from Multiple Missions, SIMBIOS Project 2000 Annual Report (NASA/TM-2001), Ed. G.S. Fargion and C.R. McClain, 84-90. 7. Gregg W.W. (2002) Merging Ocean Color Data from Multiple Missions, SIMBIOS Project 2001 Annual Report (NASA/TM-2001), Ed. G.S. Fargion and C.R. McClain, 50-51. 8. Gregg W.W. and R.H. Woodward (1998), Improvements in Coverage Frequency of Ocean Color: Combining Data from SeaWiFS and MODIS, IEEE TGARS, 36 (4). 9. Kwiatkowska, E. J. and G. S. Fargion (2002) Merger of Ocean Color Data from Multiple Satellite Missions within the SIMBIOS Project, Remote Sensing of the Atmosphere, Ocean, Environment and Space, SPIE symposium, Hangzhou, China, 23-27 October. 10. Rossow, W.B., and L. Garder 1984. Selection of a map grid for data analysis and archival. J. Climate Appl. Meteor. 23, 1253-1257. 11. MERIS Algorithm Theoretical Basis Document (ATBD) PO- TN-MEL-GS-0005 12. MERIS Level 1B Detailed Processing Model (DPM) PO-TN-MEL-GS-0002 13. MERIS Level 2 Detailed Processing Model (DPM) PO-TN-MEL-GS-0006 14. MERIS Input/Output Data Definition Document (IODD) PO-TN-MEL-GS-0003 15. SeaWiFS Operational Archive Product Specifications, published by NASA Goddard Space Flight Centre 16. Bosc E., Variations saisonnières et interannuelles de la biomasse phytoplanctonique et de la production primaire en Méditerranée: Evaluation et utilisation des données satellitales de couleur de l’océan - Nov. 2002 PhD - Laboratoire d’Océanographie de Villefranche sur Mer