interactions of fully formulated epoxy with model cement hydrates
TRANSCRIPT
This article was downloaded by: [UQ Library]On: 07 September 2013, At: 06:41Publisher: Taylor & FrancisInforma Ltd Registered in England and Wales Registered Number: 1072954 Registeredoffice: Mortimer House, 37-41 Mortimer Street, London W1T 3JH, UK
Journal of Adhesion Science andTechnologyPublication details, including instructions for authors andsubscription information:http://www.tandfonline.com/loi/tast20
Interactions of fully formulated epoxywith model cement hydratesFatma Djouani a , Mohamed M. Chehimi a & Karim Benzarti ba Université Paris Diderot, Sorbonne Paris Cité, ITODYS, UMR CNRS7086, 15 rue J-A de Baïf, 75013, Paris, Franceb Université Paris-Est, IFSTTAR, MAT, F-75732, Paris, FrancePublished online: 06 Aug 2012.
To cite this article: Fatma Djouani , Mohamed M. Chehimi & Karim Benzarti (2013) Interactions offully formulated epoxy with model cement hydrates, Journal of Adhesion Science and Technology,27:5-6, 469-489, DOI: 10.1080/01694243.2012.687548
To link to this article: http://dx.doi.org/10.1080/01694243.2012.687548
PLEASE SCROLL DOWN FOR ARTICLE
Taylor & Francis makes every effort to ensure the accuracy of all the information (the“Content”) contained in the publications on our platform. However, Taylor & Francis,our agents, and our licensors make no representations or warranties whatsoever as tothe accuracy, completeness, or suitability for any purpose of the Content. Any opinionsand views expressed in this publication are the opinions and views of the authors,and are not the views of or endorsed by Taylor & Francis. The accuracy of the Contentshould not be relied upon and should be independently verified with primary sourcesof information. Taylor and Francis shall not be liable for any losses, actions, claims,proceedings, demands, costs, expenses, damages, and other liabilities whatsoever orhowsoever caused arising directly or indirectly in connection with, in relation to or arisingout of the use of the Content.
This article may be used for research, teaching, and private study purposes. Anysubstantial or systematic reproduction, redistribution, reselling, loan, sub-licensing,systematic supply, or distribution in any form to anyone is expressly forbidden. Terms &Conditions of access and use can be found at http://www.tandfonline.com/page/terms-and-conditions
Interactions of fully formulated epoxy with model cement hydrates
Fatma Djouania, Mohamed M. Chehimia* and Karim Benzartib
aUniversité Paris Diderot, Sorbonne Paris Cité, ITODYS, UMR CNRS 7086, 15 rue J-A de Baïf, 75013Paris, France; bUniversité Paris-Est, IFSTTAR, MAT, F-75732, Paris, France
(Received 14 April 2011; final version received 14 June 2011; accepted 14 February 2012)
The surface energy of cement paste components (calcium silicate hydrate [C-S-H],ettringite and portlandite) before and after treatment with an organic coating has beencharacterised by X-ray photoelectron spectroscopy (XPS) and inverse gas chromatogra-phy at 35 °C using n-alkanes, 1-alkene, chloroform, tetrahydrofuran, diethyl ether andCCl4 molecular probes. Complementary investigations on the interfacial chemistry werealso conducted by Fourier transform infrared spectroscopy and Differential scanning cal-orimetry analyses. Changes in the dispersion contribution to the surface energy (cds ) andacid–base interaction energies were found to be significantly reduced by the organiccoating. The XPS allowed the surface chemistry changes induced by the organic coatingto be monitored. In particular, the C1s spectra were peak fitted in order to deduce thecontribution of the organic coating materials to the total carbon content on the surface.This study showed not only the existence of hydrate-hardener donor–acceptor adductformation but also presence of interactions between the hydroxide groups OH of theepoxy and portlandite.
Keywords: C-S-H; ettringite; portlandite; cement paste; adhesives; adhesion; wetting; XPS;IGC; surface energy
1. Introduction
Organic materials are routinely used in civil engineering and building industry. Epoxy resinsare by far the most popular systems, due to their versatile properties and their good adhesionto concrete and other building materials. They can advantageously replace traditional hydrau-lic binders in a wide range of applications and are used for instance as:
(1) protective coatings, intended for consolidation, crack-bridging [1], vapour and waterbarrier effect/repellence [2] or anti-graffiti [3] purposes,
(2) polymer-based mortars [4] or modified cement slurries [5,6], prescribed for mainte-nance and repair operations on damaged infrastructures and
(3) adhesive systems, used in the bonding of fibre reinforced polymer composites on dam-aged concrete structures [6] or in the structural bonding of ultra-high performance con-crete (UHPC) elements [7] and other assemblies [8].
In the above-mentioned applications, an optimal level of adhesion is usually required betweenthe mineral substrate and the organic material to ensure the effectiveness of the protection/
*Corresponding author. Email: [email protected]
Journal of Adhesion Science and Technology, 2013Vol. 27, Nos. 5–6, 469–489, http://dx.doi.org/10.1080/01694243.2012.687548
� 2012 Taylor & Francis
Dow
nloa
ded
by [
UQ
Lib
rary
] at
06:
41 0
7 Se
ptem
ber
2013
repair and its long-term durability. It is, therefore, essential to investigate the surface interac-tions of epoxy components with cementitious substrates and, in particular, the dispersion andacid-base properties of the coated minerals.
Whilst much time and efforts have been spent in investigating the surface energy of resin-coated cement pastes, it is of fundamental importance to conduct studies on the interaction offormulated epoxy with synthetic model hydrates that are representative of the main hydrationproducts common to all cementitious matrices.
In this paper, we shall first review our published research work pertaining to cementpastes and their interactions with epoxy formulations and their components taken separately(epoxy resin and hardener). Second, we will briefly describe the chemical structure of themodel hydrates C-S-H, ettringite and portlandite. Third and finally, we will report new resultson the surface thermodynamic properties of three model hydrate compounds before and aftercoating with the epoxy resin of diglycidyl ether of bisphenol A type (DGEBA) with diethyl-enetriamine (DETA) as hardener. Inverse gas chromatography at infinite dilution (IGC-ID,in short IGC) was used to determine the surface energy of the bare and coated hydrates at35 °C. X-ray photoelectron spectroscopy (XPS) was employed to assess the elemental compo-sition at the surface of samples. XPS is often combined with IGC experiments, since the twotechniques provide complementary information and give an insight into the relationshipbetween the actual surface composition and surface energetics of the materials under test.Fourier transform infrared spectroscopy (FTIR) and Differential scanning calorimetry (DSC)were also used to study the interactions at the substrate–epoxy interface and the glass transi-tion temperature (Tg) of the polymer, respectively.
2. Cement pastes: surface energy and coating by components or fully formulatedepoxies
Almost 10 years ago we had undertaken a study of molecular interactions of cement pasteswith polar and apolar probes using IGC, an effective tool for characterising the surface energyof materials [9–13] and for estimating the reversible work of adhesion [14,15].
The characterisation of hardened cement pastes by IGC was reported for the first time atrealistic temperature conditions (35 °C) by Oliva et al. [16]. This study demonstrated thatthe compounds under investigation were fairly high surface energy materials (as judged bythe respective dispersion contribution to the surface energy (cds ) values). However, Adolphslater demonstrated that cds values decreased with the relative humidity [17]. Examination ofthe specific interactions suggested that the cement pastes are strongly amphoteric specieswith a predominant Lewis basicity. The surface thermodynamic properties of these materialswere correlated with the surface elemental composition as determined by XPS. Additionally,a surface carbonaceous contamination detected by XPS was found to lower the surfaceenergy.
Benzarti et al. [18] also determined the surface energy of cement pastes by contact anglemeasurements using the Owens and Wendt approach [19]. cds values determined via wettabilitymatched those assessed by IGC at infinite dilution, for initial water/cement (W/C) mass ratiosof 0.3 and 0.5. Strong amphoteric character was highlighted by contact angle measurementswhich permitted to anticipate that cement pastes strongly adsorb/chemisorb molecular andmacromolecular species. To address this question, we have investigated the adsorption ofepoxy resins and crosslinkers onto cement pastes. IGC revealed a depression of the surfaceenergy of the cement pastes due to coating by the epoxy resin (R) or the hardener (H). Suchchanges in the surface energy suggested a substantial wetting of the mineral surface by both Rand H. The organic coatings also influenced the specific interaction energies (Isp) of the
470 F. Djouani et al.
Dow
nloa
ded
by [
UQ
Lib
rary
] at
06:
41 0
7 Se
ptem
ber
2013
molecular probes with the cement pastes [20]. The surface thermodynamic properties were cor-related with the surface chemical composition as determined by XPS. This surface sensitivetechnique evidenced interfacial hydrogen bonding between the hardener (electron donor) andthe cementitious substrates acting as electron acceptors vis-à-vis the hardener [21].
These results paved the way for more complex situations involving fully formulatedepoxy with its hardener rather than the prepolymer adsorbed onto the minerals without anyhardener. In this regard, Djouani et al. [22] reported for the first time the effect of epoxy resinand hardener mixtures on the surface and interface properties of cement pastes. Stoichiometricand non-stoichiometric mixtures were coated from fresh chloroform solutions onto cementpaste powder particles. Chloroform was chosen as the casting solvent because it undergoesonly weak interactions with the amine groups compared to acetone which we used to employin previous studies [16]. Coating epoxy resin–hardener mixture resulted in a decrease of thesurface energy as a function of the mass loading of the organic material. Epoxy oligomersand DETA hardener were found to effectively cross-link at the surface of the mineral sub-strate, as evidenced by changes in the high resolution XPS C1s spectrum. XPS chemicalshifts of the N1s peak from the adsorbed hardener testified for the existence of interfacialdonor–acceptor interactions between the cement and hardener. Such a specific interaction isprobably responsible for the apparent increase in the Tg of the cross-linked epoxy near thecement substrate surface (DSC). Indeed, the cement–epoxy interface was also studied at IFST-TAR by micro-thermal analysis, μTA [23]. This sample was a prototype of cement pasteembedded in an epoxy cylinder. This study revealed indirectly the variations in the Tg of theepoxy at the interface due to the decrease in the macromolecular chain mobility resultingfrom possible specific interactions between the mineral and epoxy components.
Recently [24] and in order to consider more realistic situations, a prototype of hardenedcement paste embedded in a cross-linked epoxy resin was prepared and examined by smallarea XPS analysis of the interfacial region in order to determine the gradual changes in thechemical composition in this critical zone. Calcium and nitrogen were selected as specific ele-mental markers for the mineral and the polymer, respectively. Modifications of the Ca2p andN1s regions were observed, which suggests that this zone was the locus of chemical reactionsthat favoured mineral substrate–polymer adhesion. Small area XPS firmly showed the exis-tence of a diffuse interphase rather than a sharp cement paste–polymer interface.
3. Cement hydrates: chemical structure and surface energy
Cement pastes are made from W/C mixtures, usually with a W/C mass ratio in the 0.3–0.6range. The hydration of Portland cement is a chemical process involving several simultaneousreactions and leading to the formation of hydrates from the anhydrous cement powder andwater, the most important of which (in terms of weight content) are calcium silicate hydrate(C-S-H), ettringite and portlandite.
Hydrated cement paste is mainly composed of C-S-H which gives the material itschemical and mechanical properties. Calcium silicate hydrate (CaO–SiO2–H2O, also abbrevi-ated C-S-H) is formed during the reaction with water of tricalcium silicate (Ca3SiO5) andß-dicalcium silicate (Ca2SiO4). The formation of C-S-H takes place during cement hydrationby a dissolution–precipitation process.
There are various models proposed for the structure of C-S-H, many of which are basedon binary solid solution. A commonly accepted structure is characterised by layers separatedby an interlayer. Each layer is composed of three sheets and a pseudo-octahedral calciumplane between two tetrahedral silicate chains. The silicate chains form a dreierketten structure,
Journal of Adhesion Science and Technology 471
Dow
nloa
ded
by [
UQ
Lib
rary
] at
06:
41 0
7 Se
ptem
ber
2013
with silicate dimers connected by a bridging silicate tetrahedron which carries two silanolgroups [25].
Ettringite is a complex calcium salt, and its generally accepted stochiometrical formula is3CaO ·Al2O3 · 3CaSO4 · 32H2O. This mineral is usually the first product to precipitate. Its for-mation, stimulated by the addition of gypsum, slows down rapid setting by forming anettringite coating on cement grains.
Hydration of tricalcium silicate (C3S) and dicalcium silicate (C2S) leads to the formationof portlandite Ca(OH)2 which crystallises as hexagonal plates. Portlandite is present in thehardened cementitious matrix as a relatively pure phase. Its hexagonal platelets are mainlylocated in the interspaces between partially hydrated cement grains. Portlandite crystals formagglomerates whose size increases with the W/C ratio, as shown by Chaussadent et al. usingscanning electron microscopy [26]. Due to the large size of its crystals, portlandite is oftenconsidered as a compound presenting a low specific surface area.
The study of the interactions of the epoxy resin with the main hydrates taken separately(namely C-S-H, ettringite and portlandite) is one of the key issues for a better understandingof the complex cement paste–epoxy interface. Since the molecular interactions at interfacesdepend primarily on the surfaces of the interacting materials, it was thus important to experi-mentally study the surface composition, degree of hydration and surface energy of minerals.In this regard, Perruchot et al. [27] reported on the characterisation of surface thermodynamicproperties of three mineral hydrates namely Ca(OH)2, C-S-H and ettringite and a mineral fil-ler (CaCO3) by IGC at 35 °C. This study clearly demonstrated that these materials exhibit dif-ferent London dispersion components of the surface energy cds and acid–base properties.Indeed, they are found to be medium to high surface energy materials as judged by the cdsvalues ranging from 45.6 to 236mJ/m2. High cds values derived from IGC suggested that thesurface energy is not only dependent on the surface composition, but also on other parameterssuch as the water content and the micro-porosity of the materials. In addition, these mineralhydrates exhibit amphoteric properties with a predominant acidic character. The surface ther-modynamic properties have been correlated with the water content of the materials. XPS anal-yses showed that their surface chemical composition was consistent with that of the hardenedcement pastes. XPS experiments also revealed a surface carbonation of the samples (reactionof Ca(OH)2 with CO2), which may have an additional influence on the surface thermody-namic properties.
4. Experimental section
4.1. Materials
4.1.1. Synthetic cement hydrates
The three cement hydrates characterised in this work were calcium hydroxide (i.e. Ca(OH)2or portlandite), C-S-H and ettringite (i.e. 3CaO ·Al2O3 · 3CaSO4 · 32H2O). These were almostpure compounds which were synthesised at IFSTTAR (formerly Laboratoire Central des Pontset Chaussées, Paris, France) according to standard procedures described elsewhere byBenzarti et al. [18]. The chemical structure and purity of these products were determined byX-ray diffraction analyses (XRD) in the case of C-S-H only and thermogravimetric analysisfor all three products.
The XRD pattern (Figure not shown) indicates a main peak assigned to the major C-S-H.Some secondary peaks are related to the presence of calcium carbonate and carbonation ofthe surface of C-S-H.
472 F. Djouani et al.
Dow
nloa
ded
by [
UQ
Lib
rary
] at
06:
41 0
7 Se
ptem
ber
2013
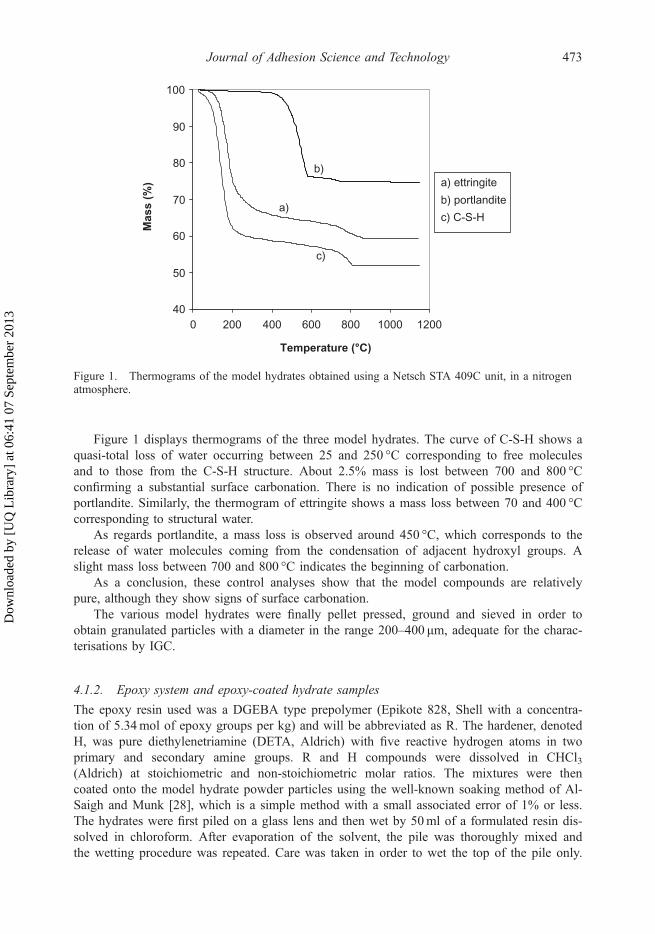
Figure 1 displays thermograms of the three model hydrates. The curve of C-S-H shows aquasi-total loss of water occurring between 25 and 250 °C corresponding to free moleculesand to those from the C-S-H structure. About 2.5% mass is lost between 700 and 800 °Cconfirming a substantial surface carbonation. There is no indication of possible presence ofportlandite. Similarly, the thermogram of ettringite shows a mass loss between 70 and 400 °Ccorresponding to structural water.
As regards portlandite, a mass loss is observed around 450 °C, which corresponds to therelease of water molecules coming from the condensation of adjacent hydroxyl groups. Aslight mass loss between 700 and 800 °C indicates the beginning of carbonation.
As a conclusion, these control analyses show that the model compounds are relativelypure, although they show signs of surface carbonation.
The various model hydrates were finally pellet pressed, ground and sieved in order toobtain granulated particles with a diameter in the range 200–400 μm, adequate for the charac-terisations by IGC.
4.1.2. Epoxy system and epoxy-coated hydrate samples
The epoxy resin used was a DGEBA type prepolymer (Epikote 828, Shell with a concentra-tion of 5.34mol of epoxy groups per kg) and will be abbreviated as R. The hardener, denotedH, was pure diethylenetriamine (DETA, Aldrich) with five reactive hydrogen atoms in twoprimary and secondary amine groups. R and H compounds were dissolved in CHCl3(Aldrich) at stoichiometric and non-stoichiometric molar ratios. The mixtures were thencoated onto the model hydrate powder particles using the well-known soaking method of Al-Saigh and Munk [28], which is a simple method with a small associated error of 1% or less.The hydrates were first piled on a glass lens and then wet by 50ml of a formulated resin dis-solved in chloroform. After evaporation of the solvent, the pile was thoroughly mixed andthe wetting procedure was repeated. Care was taken in order to wet the top of the pile only.
40
50
60
70
80
90
100
0 200 400 600 800 1000 1200
Temperature (°C)
a) ettringiteb) portlanditec) C-S-H
a)
c)
b)
Mas
s (%
)
Figure 1. Thermograms of the model hydrates obtained using a Netsch STA 409C unit, in a nitrogenatmosphere.
Journal of Adhesion Science and Technology 473
Dow
nloa
ded
by [
UQ
Lib
rary
] at
06:
41 0
7 Se
ptem
ber
2013
Indeed, the wetting solution must not touch the surface of the glass lens, either around orunder the pile. This method is time consuming but very accurate and does not require furtherchecking by thermal gravimetric analysis or ashing. Each formulation deposited on thesurface of hydrate samples is denoted by Rx +Hyst, where x stands for the mass loading ofDGEBA resin (in wt.%) and yst defines the DETA hardener content in the formulation (y isthe ratio between the actual and the theoretical stoichiometric H contents).
4.2. Experimental techniques
4.2.1. Inverse gas chromatography at infinite dilution
A Hewlett Packard HP 6890 gas chromatograph was used to determine the surface thermody-namic properties of the coated/uncoated hydrate samples. This equipment is fitted with aflame ionisation detector (FID) and an electronic flow control system. High purity nitrogenwas used as the carrier gas, with a flow rate set at 25mlmin�1. For the FID detector, highsignal to noise ratio was obtained using high purity hydrogen gas (flow rate set up at30mlmin�1) and compressed air fitted with moisture and hydrocarbon removal cartridges(flow rate set at 300mlmin�1). The injector and detector temperatures were set at 100 and150 °C, respectively. The chromatograms were collected with a Borwin acquisition system(version 1.21) and the retention times were determined at peak maxima. All IGC experimentswere carried out at 35 °C for all materials. Stainless steel columns (3mm outer diameter andc. 35 cm long) were filled with 0.8–1.2 g of the mineral under test. Prior to chromatographicmeasurements, the columns were conditioned overnight at the working temperature under anitrogen gas stream. Methane was used as a non-interacting marker for the determination ofthe column dead time. A range of non-polar, Lewis acidic and basic molecular probes (seeTable 1) were used to determine the surface thermodynamic properties of the solid materials.The probe vapours were injected manually, at least in triplicate, with an SGE gas-tight syr-inge. To achieve extreme dilution of the probes, the syringe was purged as many times asnecessary and thus the signals were recorded at the detection limit of the gas chromatograph(GC) equipment. The retention times were averaged over the number of injections. The prop-erties of the probes are reported in Table 1.
4.2.2. X-ray photoelectron spectroscopy
XPS spectra were recorded on an ESCALAB 250 spectrometer, equipped with a monochro-matic AlKα X-ray source (hν= 1486.6 eV, 650 μm spot size). A flood gun was used under a
Table 1. Probes used to characterise the various materials.
Probes Abbreviation Bp (°C) Supplier
n-Pentane C5 36.1 Prolabon-Hexane C6 68.7 Prolabon-Heptane C7 98.4 Prolabon-Octane C8 125.7 Flukan-Nonane C9 150.8 Fluka1-Hexene π6 63.3 AldrichChloroform CHCl3 61.2 AldrichCarbon tetrachloride CCl4 77.0 ProlaboTetrahydrofuran THF 66.0 ProlaboDiethyl ether DEE 35.0 Prolabo
474 F. Djouani et al.
Dow
nloa
ded
by [
UQ
Lib
rary
] at
06:
41 0
7 Se
ptem
ber
2013
stream of argon (partial pressure 2 × 10�8mbar) in order to obtain a perfectly uniform staticcharge over the sample area analysed. Binding energy positions were calibrated against themain C–C/C–H C1s component set at 285 eV.
4.2.3. Fourier transform infrared spectroscopy
The hydrate powder particles were pressed into KBr pellets and characterised by a Magna-860 FT-IR spectrometer (Nicolet Instrument Corp., Madison, WI, USA) equipped with aDTGS detector. The transmittance absorption spectra were scanned 64 times at 4 cm�1 spec-tral resolution. The spectra were baseline-corrected using OMNIC 6.1 internal software.
4.2.4. Differential scanning calorimetry
Tgs of the formulated epoxy alone or coated onto the mineral substrates were determinedusing an MDSC Q100 temperature modulated differential scanning calorimeter (TA Instru-ments Corp., Newcastle, DE, USA). A typical mass of 3–3.5mg was used for the materialsamples. A temperature ramp was applied to the sample from 20 to 250 °C at a heating rateof 1.5 °C/min and a temperature modulation (harmonic signal) was superimposed on the mainsignal (amplitude of 0.5 °C, period of 80 s). Evolutions of the reversible and irreversible heatflows were recorded continuously during these experiments. The glass transition phenomenonresulted in a jump in the reversible heat flow thermogram and the Tg value was identified byusing the midpoint-by-half-height method (point of the curve at half height of the heat flowstep) of the universal analysis software.
5. Results and discussion
5.1. X-ray photoelectron spectroscopy
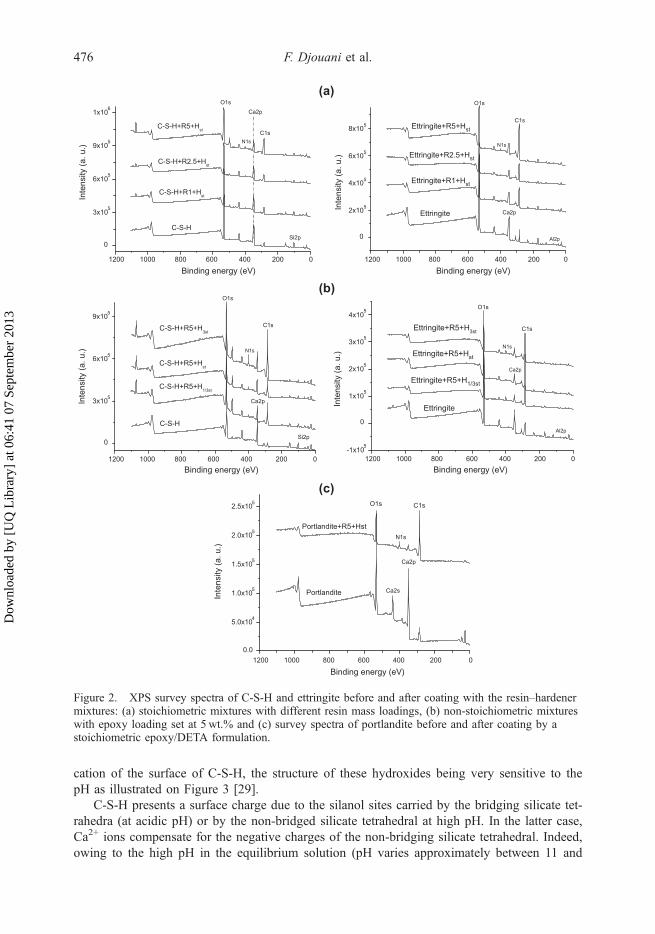
Figure 2 shows the XPS survey spectra of C-S-H, ettringite and portlandite before and aftercoating with stoichiometric and non-stoichiometric epoxy resin and hardener mixtures. Fig-ure 2(a) shows the influence of the mass loading of the epoxy resin (0–5 wt.%) for a stoichi-ometric initial concentration of hardener. Figure 2(b) illustrates the influence of the hardenerloading for a constant mass loading of R, set at 5%. Note that for portlandite, Figure 2(b) dis-plays only the spectrum corresponding to portlandite modified by a stoichiometric mixtureR5 +Hst.
The carbon content (%C) globally increases at the surfaces of C-S-H and ettringite follow-ing epoxy coating. Nitrogen is also detected on the coated substrates and increases with massloading of the epoxy resin for stoichiometric and non-stoichiometric mixtures. Moreover,increasing epoxy mass loading leads to increase of the C1s/Ca2p and N1s/Ca2p intensityratios. For R5%, the effect of the hardener mass loading is reflected in a significant change inthe Ca2p/Si2p intensity ratio in the case of C-S-H and Ca2p/Al2p intensity ratio in the caseof ettringite. For portlandite, coating a stoichiometric 5wt.% mixture in epoxy induces a dras-tic change at the surface which shifts from purely mineral to organic as evidenced by thestrong attenuation of the Ca2p peak at the expense of C1s and N1s.
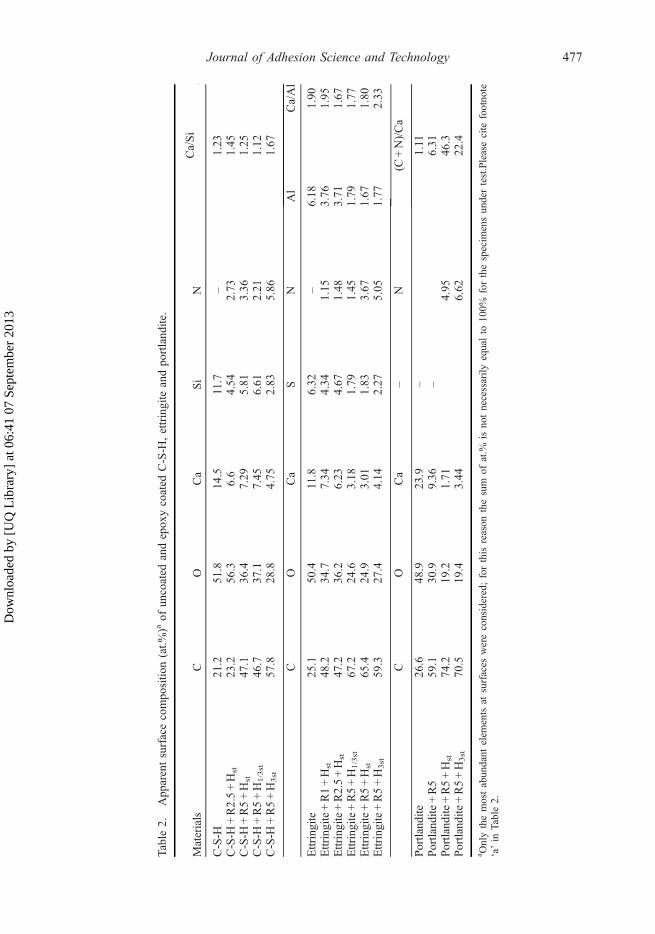
Table 2 reports the surface elemental composition (in at.%) for the uncoated and coatedC-S-H and ettringite.
With regard to the C-S-H samples, it is important to note that the Ca/Si ratio increasewith the hardener concentration. Indeed, Ca/Si ratio is equal to 1.24 in the uncoated C-S-Hwhile for the sample C-S-H +R5 +H3st it is 1.67. This evolution could result from a modifi-
Journal of Adhesion Science and Technology 475
Dow
nloa
ded
by [
UQ
Lib
rary
] at
06:
41 0
7 Se
ptem
ber
2013
cation of the surface of C-S-H, the structure of these hydroxides being very sensitive to thepH as illustrated on Figure 3 [29].
C-S-H presents a surface charge due to the silanol sites carried by the bridging silicate tet-rahedra (at acidic pH) or by the non-bridged silicate tetrahedral at high pH. In the latter case,Ca2+ ions compensate for the negative charges of the non-bridging silicate tetrahedral. Indeed,owing to the high pH in the equilibrium solution (pH varies approximately between 11 and
1200 1000 800 600 400 200 0
0
2x10⁵
4x10⁵
6x10⁵
8x10⁵
N1s
Ettringite+R5+Hst
Ettringite+R2.5+Hst
Inte
nsity
(a. u
.)
Binding energy (eV)
Al2p
O1s
Ca2p
C1s
Ettringite
Ettringite+R1+Hst
1200 1000 800 600 400 200 0
0
3x10⁵
6x10⁵
9x10⁵
O1s
C-S-H+R5+H3st
C-S-H+R5+Hst
Inte
nsity
(a. u
.)
Binding energy (eV)
N1s
Ca2p
C-S-H
C-S-H+R5+H1/3st
C1s
Si2p
1200 1000 800 600 400 200 0-1x10⁵
0
1x10⁵
2x10⁵
3x10⁵
4x10⁵O1s
Ettringite+R5+H3st
Ettringite+R5+Hst
Inte
nsity
(a. u
.)
Binding energy (eV)
Al2p
N1s
Ca2p
Ettringite
Ettringite+R5+H1/3st
C1s
1200 1000 800 600 400 200 00.0
5.0x10⁴
1.0x10⁵
1.5x10⁵
2.0x10⁵
2.5x10⁵
Ca2s
Inte
nsity
(a. u
.)
Binding energy (eV)
C1s
Ca2p
O1s
N1s
Portlandite
Portlandite+R5+Hst
1200 1000 800 600 400 200 0
0
3x10⁵
6x10⁵
9x10⁵
1x10⁶
C-S-H+R5+Hst
C-S-H+R2.5+Hst
Inte
nsity
(a. u
.)
Binding energy (eV)
Si2p
C1s
Ca2p
N1s
O1s(a)
(b)
(c)
C-S-H
C-S-H+R1+Hst
Figure 2. XPS survey spectra of C-S-H and ettringite before and after coating with the resin–hardenermixtures: (a) stoichiometric mixtures with different resin mass loadings, (b) non-stoichiometric mixtureswith epoxy loading set at 5 wt.% and (c) survey spectra of portlandite before and after coating by astoichiometric epoxy/DETA formulation.
476 F. Djouani et al.
Dow
nloa
ded
by [
UQ
Lib
rary
] at
06:
41 0
7 Se
ptem
ber
2013
Table
2.App
arentsurfacecompo
sitio
n(at.%
)aof
uncoated
andepox
ycoated
C-S-H
,ettringite
andpo
rtland
ite.
Materials
CO
Ca
Si
NCa/Si
C-S-H
21.2
51.8
14.5
11.7
–1.23
C-S-H
+R2.5+Hst
23.2
56.3
6.6
4.54
2.73
1.45
C-S-H
+R5+Hst
47.1
36.4
7.29
5.81
3.36
1.25
C-S-H
+R5+H1/3st
46.7
37.1
7.45
6.61
2.21
1.12
C-S-H
+R5+H3st
57.8
28.8
4.75
2.83
5.86
1.67
CO
Ca
SN
Al
Ca/Al
Ettringite
25.1
50.4
11.8
6.32
–6.18
1.90
Ettringite+R1+Hst
48.2
34.7
7.34
4.34
1.15
3.76
1.95
Ettringite+R2.5+Hst
47.2
36.2
6.23
4.67
1.48
3.71
1.67
Ettringite+R5+H1/3st
67.2
24.6
3.18
1.79
1.45
1.79
1.77
Ettringite+R5+Hst
65.4
24.9
3.01
1.83
3.67
1.67
1.80
Ettringite+R5+H3st
59.3
27.4
4.14
2.27
5.05
1.77
2.33
CO
Ca
–N
(C+N)/Ca
Portland
ite26
.648
.923
.9–
1.11
Portland
ite+R5
59.1
30.9
9.36
–6.31
Portland
ite+R5+Hst
74.2
19.2
1.71
4.95
46.3
Portland
ite+R5+H3st
70.5
19.4
3.44
6.62
22.4
a Onlythemostabun
dant
elem
ents
atsurfaces
wereconsidered;forthis
reason
thesum
ofat.%
isno
tnecessarily
equalto
100%
forthespecim
ensun
dertest.Pleasecite
footno
te‘a’in
Table2.
Journal of Adhesion Science and Technology 477
Dow
nloa
ded
by [
UQ
Lib
rary
] at
06:
41 0
7 Se
ptem
ber
2013
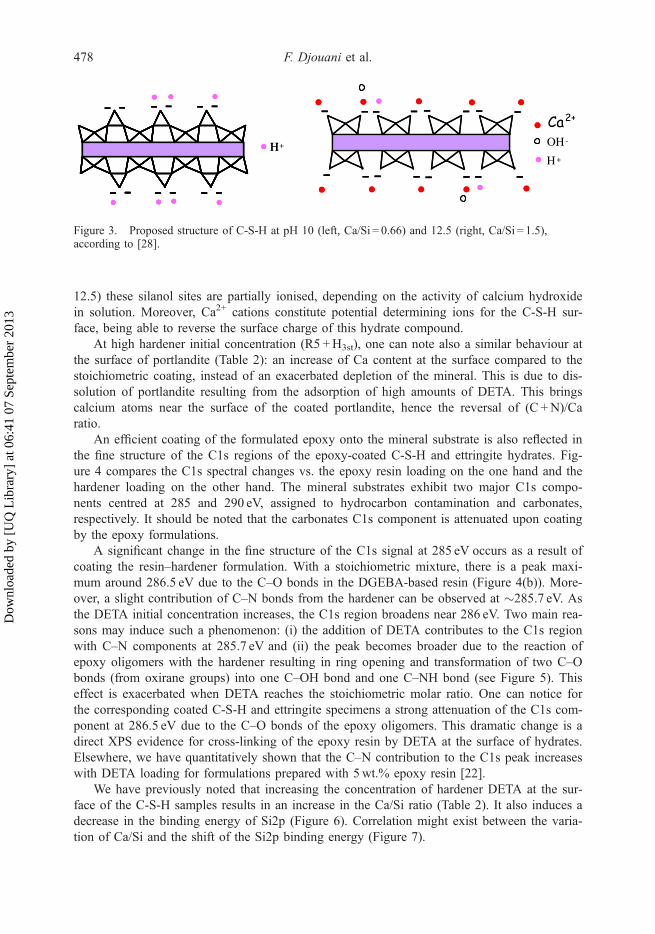
12.5) these silanol sites are partially ionised, depending on the activity of calcium hydroxidein solution. Moreover, Ca2+ cations constitute potential determining ions for the C-S-H sur-face, being able to reverse the surface charge of this hydrate compound.
At high hardener initial concentration (R5 +H3st), one can note also a similar behaviour atthe surface of portlandite (Table 2): an increase of Ca content at the surface compared to thestoichiometric coating, instead of an exacerbated depletion of the mineral. This is due to dis-solution of portlandite resulting from the adsorption of high amounts of DETA. This bringscalcium atoms near the surface of the coated portlandite, hence the reversal of (C +N)/Caratio.
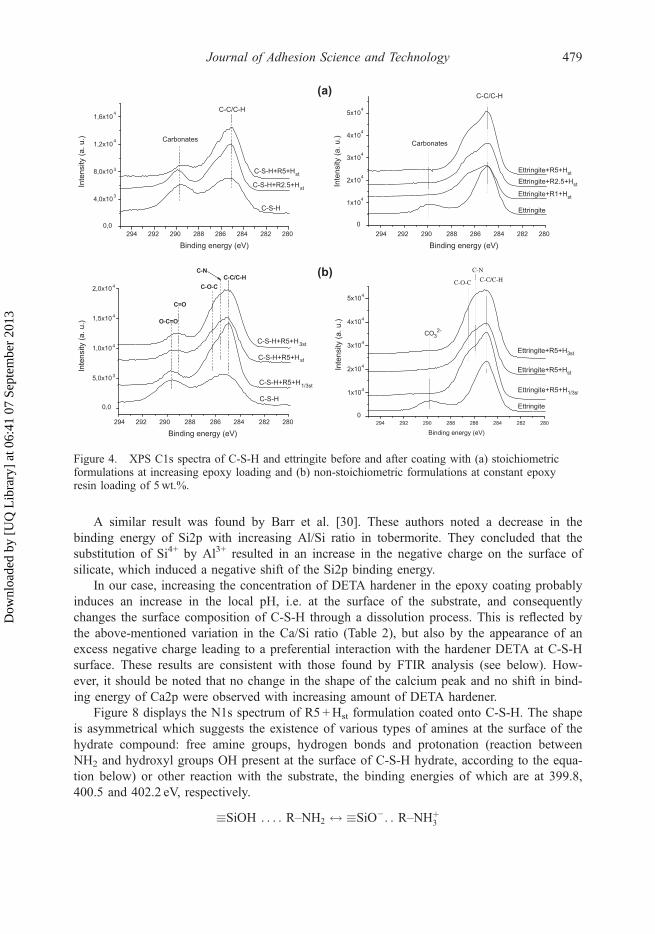
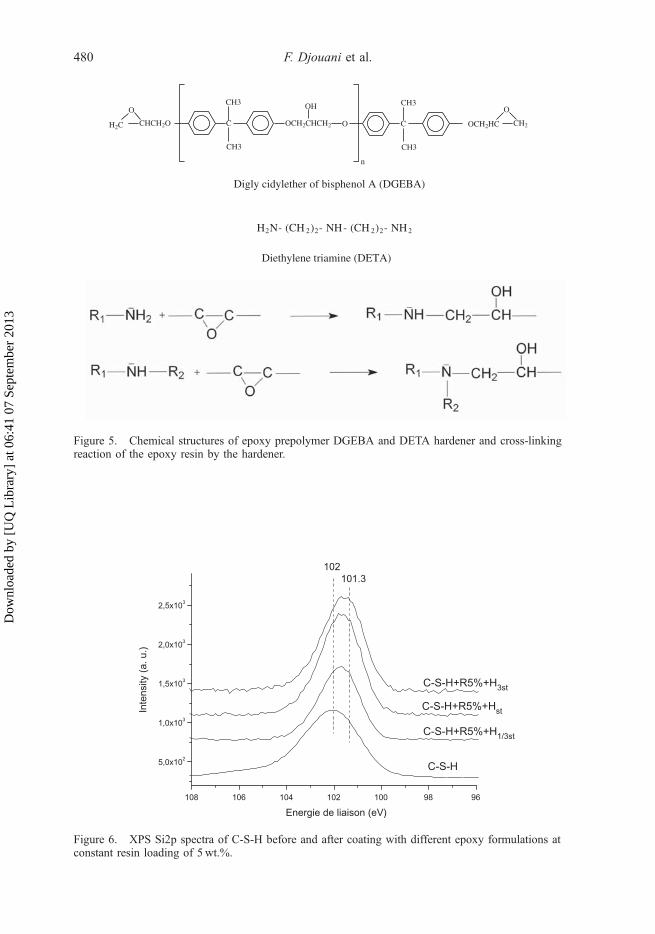
An efficient coating of the formulated epoxy onto the mineral substrate is also reflected inthe fine structure of the C1s regions of the epoxy-coated C-S-H and ettringite hydrates. Fig-ure 4 compares the C1s spectral changes vs. the epoxy resin loading on the one hand and thehardener loading on the other hand. The mineral substrates exhibit two major C1s compo-nents centred at 285 and 290 eV, assigned to hydrocarbon contamination and carbonates,respectively. It should be noted that the carbonates C1s component is attenuated upon coatingby the epoxy formulations.
A significant change in the fine structure of the C1s signal at 285 eV occurs as a result ofcoating the resin–hardener formulation. With a stoichiometric mixture, there is a peak maxi-mum around 286.5 eV due to the C–O bonds in the DGEBA-based resin (Figure 4(b)). More-over, a slight contribution of C–N bonds from the hardener can be observed at �285.7 eV. Asthe DETA initial concentration increases, the C1s region broadens near 286 eV. Two main rea-sons may induce such a phenomenon: (i) the addition of DETA contributes to the C1s regionwith C–N components at 285.7 eV and (ii) the peak becomes broader due to the reaction ofepoxy oligomers with the hardener resulting in ring opening and transformation of two C–Obonds (from oxirane groups) into one C–OH bond and one C–NH bond (see Figure 5). Thiseffect is exacerbated when DETA reaches the stoichiometric molar ratio. One can notice forthe corresponding coated C-S-H and ettringite specimens a strong attenuation of the C1s com-ponent at 286.5 eV due to the C–O bonds of the epoxy oligomers. This dramatic change is adirect XPS evidence for cross-linking of the epoxy resin by DETA at the surface of hydrates.Elsewhere, we have quantitatively shown that the C–N contribution to the C1s peak increaseswith DETA loading for formulations prepared with 5wt.% epoxy resin [22].
We have previously noted that increasing the concentration of hardener DETA at the sur-face of the C-S-H samples results in an increase in the Ca/Si ratio (Table 2). It also induces adecrease in the binding energy of Si2p (Figure 6). Correlation might exist between the varia-tion of Ca/Si and the shift of the Si2p binding energy (Figure 7).
- - - - - -••
H+
- - - - - -••
•
• •
•- - - - - -••
H
- - - - - -••
•
• •
•- - - - - -••
- - - - - -••
•
• •
• ••
- - - - - -••
•
• •- - - - - -••
•
• •
•- -
- -
- - - -
- - - -
• • •• •- -
- -•• • • •
•OH
•
• H
•
- -
- -
- - - -
- - - -
• • •• •- -
- -•• • • •
•-
•
• +
•
Figure 3. Proposed structure of C-S-H at pH 10 (left, Ca/Si = 0.66) and 12.5 (right, Ca/Si = 1.5),according to [28].
478 F. Djouani et al.
Dow
nloa
ded
by [
UQ
Lib
rary
] at
06:
41 0
7 Se
ptem
ber
2013
A similar result was found by Barr et al. [30]. These authors noted a decrease in thebinding energy of Si2p with increasing Al/Si ratio in tobermorite. They concluded that thesubstitution of Si4+ by Al3+ resulted in an increase in the negative charge on the surface ofsilicate, which induced a negative shift of the Si2p binding energy.
In our case, increasing the concentration of DETA hardener in the epoxy coating probablyinduces an increase in the local pH, i.e. at the surface of the substrate, and consequentlychanges the surface composition of C-S-H through a dissolution process. This is reflected bythe above-mentioned variation in the Ca/Si ratio (Table 2), but also by the appearance of anexcess negative charge leading to a preferential interaction with the hardener DETA at C-S-Hsurface. These results are consistent with those found by FTIR analysis (see below). How-ever, it should be noted that no change in the shape of the calcium peak and no shift in bind-ing energy of Ca2p were observed with increasing amount of DETA hardener.
Figure 8 displays the N1s spectrum of R5 +Hst formulation coated onto C-S-H. The shapeis asymmetrical which suggests the existence of various types of amines at the surface of thehydrate compound: free amine groups, hydrogen bonds and protonation (reaction betweenNH2 and hydroxyl groups OH present at the surface of C-S-H hydrate, according to the equa-tion below) or other reaction with the substrate, the binding energies of which are at 399.8,400.5 and 402.2 eV, respectively.
�SiOH . . . : R–NH2 $ �SiO�: : R–NHþ3
294 292 290 288 286 284 282 2800,0
4,0x10³
8,0x10³
1,2x10⁴
1,6x10⁴
Inte
nsity
(a. u
.)
Binding energy (eV)
294 292 290 288 286 284 282 280
Binding energy (eV)
294 292 290 288 286 284 282 280
Binding energy (eV)
C-S-H
C-S-H+R2.5+Hst
C-S-H+R5+Hst
Carbonates
C-C/C-H
0
1x10⁴
2x10⁴
3x10⁴
4x10⁴
5x10⁴
Ettringite+R5+Hst
Ettringite+R2.5+HstInte
nsity
(a. u
.)
Ettringite
Ettringite+R1+Hst
Carbonates
C-C/C-H
0,0
5,0x10³
1,0x10⁴
1,5x10⁴
2,0x10⁴
C-N
Inte
nsity
(a. u
.)
C-O-C
O-C=O
C-C/C-H
C=O
C-S-H
C-S-H+R5+H1/3st
C-S-H+R5+Hst
C-S-H+R5+H3st
294 292 290 288 286 284 282 2800
1x10⁴
2x10⁴
3x10⁴
4x10⁴
5x10⁴
Ettringite+R5+H3st
Ettringite+R5+Hst
Inte
nsity
(a. u
.)
Binding energy (eV)
Ettringite
Ettringite+R5+H1/3st
C-O-C
C-N
C-C/C-H
CO32-
(a)
(b)
Figure 4. XPS C1s spectra of C-S-H and ettringite before and after coating with (a) stoichiometricformulations at increasing epoxy loading and (b) non-stoichiometric formulations at constant epoxyresin loading of 5wt.%.
Journal of Adhesion Science and Technology 479
Dow
nloa
ded
by [
UQ
Lib
rary
] at
06:
41 0
7 Se
ptem
ber
2013
OCH2HC CH2
OCH3
CH3
OH CH3
CH3
CH2C CHCH2O
O
C OCH2CHCH2 O
n
Digly cidylether of bisphenol A (DGEBA)
H2N- (CH 2)2- NH- (CH 2)2- NH2
Diethylene triamine (DETA)
Figure 5. Chemical structures of epoxy prepolymer DGEBA and DETA hardener and cross-linkingreaction of the epoxy resin by the hardener.
108 106 104 102 100 98 96
5,0x10²
1,0x10³
1,5x10³
2,0x10³
2,5x10³
Inte
nsity
(a. u
.)
Energie de liaison (eV)
C-S-H
C-S-H+R5%+H1/3st
C-S-H+R5%+Hst
C-S-H+R5%+H3st
102101.3
Figure 6. XPS Si2p spectra of C-S-H before and after coating with different epoxy formulations atconstant resin loading of 5wt.%.
480 F. Djouani et al.
Dow
nloa
ded
by [
UQ
Lib
rary
] at
06:
41 0
7 Se
ptem
ber
2013
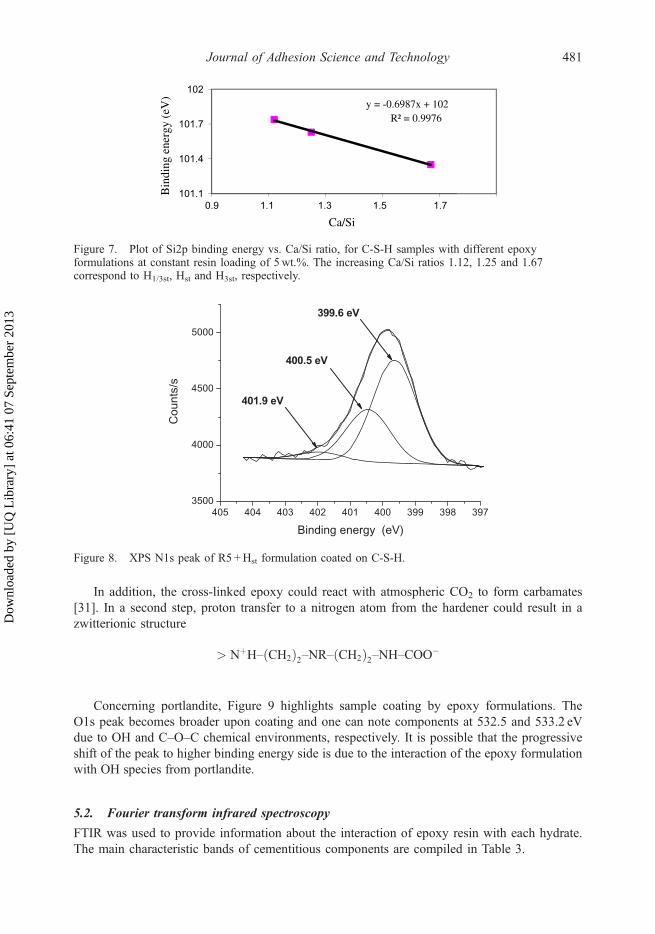
In addition, the cross-linked epoxy could react with atmospheric CO2 to form carbamates[31]. In a second step, proton transfer to a nitrogen atom from the hardener could result in azwitterionic structure
> NþH–ðCH2Þ2–NR–ðCH2Þ2–NH–COO�
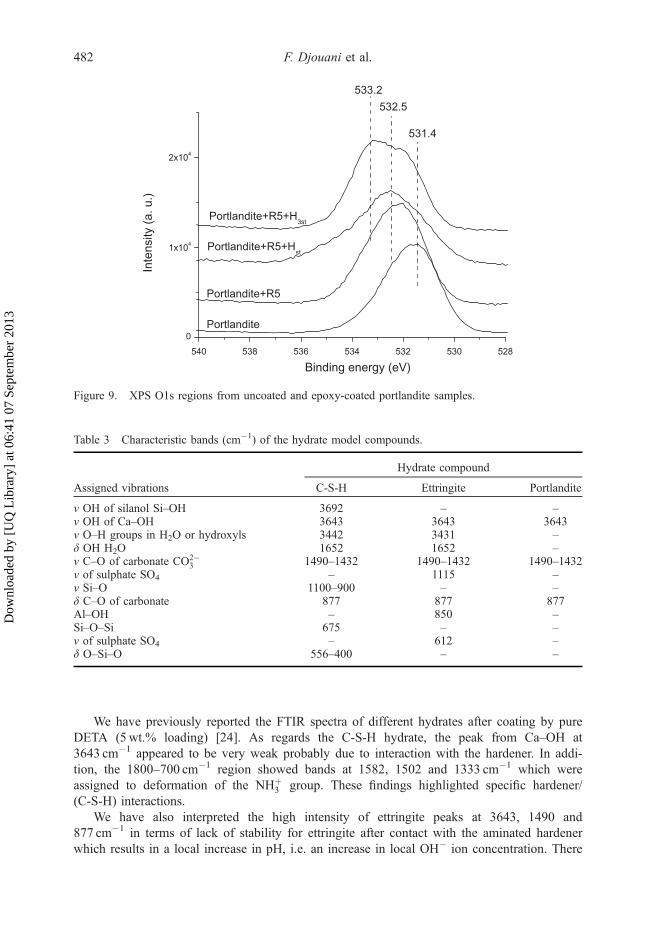
Concerning portlandite, Figure 9 highlights sample coating by epoxy formulations. TheO1s peak becomes broader upon coating and one can note components at 532.5 and 533.2 eVdue to OH and C–O–C chemical environments, respectively. It is possible that the progressiveshift of the peak to higher binding energy side is due to the interaction of the epoxy formulationwith OH species from portlandite.
5.2. Fourier transform infrared spectroscopy
FTIR was used to provide information about the interaction of epoxy resin with each hydrate.The main characteristic bands of cementitious components are compiled in Table 3.
405 404 403 402 401 400 399 398 3973500
4000
4500
5000
401.9 eV
400.5 eV
399.6 eV
Cou
nts/
s
Binding energy (eV)
Figure 8. XPS N1s peak of R5 +Hst formulation coated on C-S-H.
y = -0.6987x + 102R² = 0.9976
101.1
101.4
101.7
102
0.9 1.1 1.3 1.5 1.7
Bin
ding
ene
rgy
(eV
)
Ca/Si
Figure 7. Plot of Si2p binding energy vs. Ca/Si ratio, for C-S-H samples with different epoxyformulations at constant resin loading of 5wt.%. The increasing Ca/Si ratios 1.12, 1.25 and 1.67correspond to H1/3st, Hst and H3st, respectively.
Journal of Adhesion Science and Technology 481
Dow
nloa
ded
by [
UQ
Lib
rary
] at
06:
41 0
7 Se
ptem
ber
2013
We have previously reported the FTIR spectra of different hydrates after coating by pureDETA (5wt.% loading) [24]. As regards the C-S-H hydrate, the peak from Ca–OH at3643 cm�1 appeared to be very weak probably due to interaction with the hardener. In addi-tion, the 1800–700 cm�1 region showed bands at 1582, 1502 and 1333 cm�1 which wereassigned to deformation of the NHþ
3 group. These findings highlighted specific hardener/(C-S-H) interactions.
We have also interpreted the high intensity of ettringite peaks at 3643, 1490 and877 cm�1 in terms of lack of stability for ettringite after contact with the aminated hardenerwhich results in a local increase in pH, i.e. an increase in local OH� ion concentration. There
540 538 536 534 532 530 5280
1x10⁴
2x10⁴In
tens
ity (a
. u.)
Binding energy (eV)
Portlandite
Portlandite+R5
Portlandite+R5+Hst
Portlandite+R5+H3st
533.2
531.4
532.5
Figure 9. XPS O1s regions from uncoated and epoxy-coated portlandite samples.
Table 3 Characteristic bands (cm�1) of the hydrate model compounds.
Assigned vibrations
Hydrate compound
C-S-H Ettringite Portlandite
ν OH of silanol Si–OH 3692 – –ν OH of Ca–OH 3643 3643 3643ν O–H groups in H2O or hydroxyls 3442 3431 –δ OH H2O 1652 1652 –ν C–O of carbonate CO2�
3 1490–1432 1490–1432 1490–1432ν of sulphate SO4 – 1115 –ν Si–O 1100–900 – –δ C–O of carbonate 877 877 877Al–OH – 850 –Si–O–Si 675 – –ν of sulphate SO4 – 612 –δ O–Si–O 556–400 – –
482 F. Djouani et al.
Dow
nloa
ded
by [
UQ
Lib
rary
] at
06:
41 0
7 Se
ptem
ber
2013
are also three bands at 1582, 1502 and 1333 cm�1 which correspond to deformation of theNHþ
3 group due to the interaction between the amine groups of DETA and OH surface groupsof ettringite.
In the case of the portlandite, analyses showed not only the existence of donor–acceptorinteractions between the hydrate and the amine hardener [24] but also revealed the existenceof interactions between the hydroxide groups OH of the DGEBA resin and portlandite [24].Indeed, the interaction between the epoxy resin and portlandite induced an attenuation of theOH bands of the portlandite at 3643 cm�1, whilst the band at 3505 cm�1 assigned to OHgroups of DGEBA vanished.
Kim and Robertson [32] have also observed the existence of interactions between poly(vinylalcohol) and portlandite Ca(OH)2. Other studies on the modification of the structure of cementpastes in contact with the poly(vinyl acetate–vinyl versatate) – VA/VeoVa [33] showed that inter-actions occur via the portlandite located at the surface of the cement paste. Chemical interactionsbetween cement pastes and the ethylene/vinyl acetate (EVAc) have also been highlighted bySilva et al. [34]. These authors showed that the acetate group of EVAc induced alkaline hydroly-sis and Ca2+ ions interacted with the cement paste to form an organic salt (calcium acetate). Thisprocess is accompanied by a decrease in the amount of portlandite. Recently, Knapen and vanGemert [35] observed changes in the morphology of portlandite in contact with various poly-mers (polyvinyl alcohol–acetate, methylcellulose and hydroxyethylcellulose). Our results arethus consistent with the literature and highlight the strong affinity of portlandite with polymers.They also show that portlandite is able to interact not only with the amine hardener, but also withthe DGEBA prepolymer via its OH groups.
5.3. IGC characterisation of the surface energy
The dispersion and acid–base contributions to the surface energy of the uncoated and epoxy-coated hydrates were determined by IGC, using the methods proposed by Dorris and Gray [36]and Brookman and Sawyer [37]. IGC is indeed very well adapted to monitor subtle changes atsurfaces for a variety of materials including polymers [14,38,39], conductive polymers[11,15,40], cement pastes [16,20], pigments and fillers [41–44]. It has also been frequently usedto determine the surface energy of materials after coating by polymers [15,20,45–47].
Table 4 compiles the surface thermodynamic properties obtained for epoxy-coated anduncoated C-S-H and ettringite samples. �GCH2 stands for the free energy of adsorption of amethylene group, whereas cABIGC is defined as a geometric mean value of the IGC-determinedacid–base constants [44]:
cABIGC ¼ 2ðabÞ1=2 ðin kJ=molÞ;
where the Lewis acidity constant α= Isp(DEE) and the Lewis basicity constant β = Isp(CHCl3).
It may be noted that the value of the dispersion component cds increases significantly withthe concentration of hardener on the surface of the C-S-H substrate, from 41.0mJ/m2 for theuncoated substrate to a value of 87.2mJ/m2 for materials coated with R5 +H3st. This result high-lights the influence of the hardener component on cds and the interaction of amine groups of thehardener with the mineral surface.
In the case of ettringite, we can see that the epoxy formulation has no influence on the varia-tion of cds . The value of the coated samples remains practically constant. This value corresponds
Journal of Adhesion Science and Technology 483
Dow
nloa
ded
by [
UQ
Lib
rary
] at
06:
41 0
7 Se
ptem
ber
2013
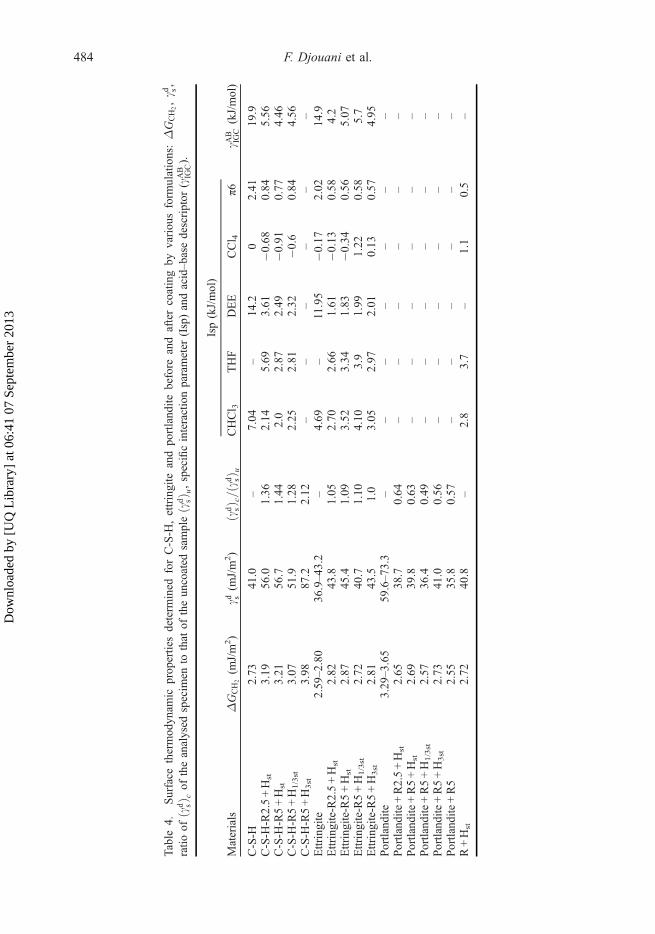
Table4.
Surface
thermod
ynam
icprop
ertiesdeterm
ined
forC-S-H
,ettringite
andpo
rtland
itebefore
andaftercoatingby
variou
sform
ulations:�G
CH
2,cd s,
ratio
ofðcd s
Þ cof
theanalysed
specim
ento
that
oftheun
coated
sampleðcd s
Þ u,specificinteractionparameter
(Isp)andacid–b
asedescriptor
(cAB
IGC).
Materials
�G
CH
2(m
J/m
2)
cd s(m
J/m
2)
ðcd sÞ c=
ðcd sÞ u
Isp(kJ/mol)
cAB
IGC(kJ/mol)
CHCl 3
THF
DEE
CCl 4
π6
C-S-H
2.73
41.0
–7.04
–14
.20
2.41
19.9
C-S-H
-R2.5+Hst
3.19
56.0
1.36
2.14
5.69
3.61
�0.68
0.84
5.56
C-S-H
-R5+Hst
3.21
56.7
1.44
2.0
2.87
2.49
�0.91
0.77
4.46
C-S-H
-R5+H1/3st
3.07
51.9
1.28
2.25
2.81
2.32
�0.6
0.84
4.56
C-S-H
-R5+H3st
3.98
87.2
2.12
––
––
––
Ettringite
2.59
–2.80
36.9–43.2
–4.69
–11.95
�0.17
2.02
14.9
Ettringite-R2.5+Hst
2.82
43.8
1.05
2.70
2.66
1.61
�0.13
0.58
4.2
Ettringite-R5+Hst
2.87
45.4
1.09
3.52
3.34
1.83
�0.34
0.56
5.07
Ettringite-R5+H1/3st
2.72
40.7
1.10
4.10
3.9
1.99
1.22
0.58
5.7
Ettringite-R5+H3st
2.81
43.5
1.0
3.05
2.97
2.01
0.13
0.57
4.95
Portland
ite3.29
–3.65
59.6–73.3
––
––
––
–Portland
ite+R2.5+Hst
2.65
38.7
0.64
––
––
––
Portland
ite+R5+Hst
2.69
39.8
0.63
––
––
––
Portland
ite+R5+H1/3st
2.57
36.4
0.49
––
––
––
Portland
ite+R5+H3st
2.73
41.0
0.56
––
––
––
Portland
ite+R5
2.55
35.8
0.57
––
––
––
R+Hst
2.72
40.8
–2.8
3.7
–1.1
0.5
–
484 F. Djouani et al.
Dow
nloa
ded
by [
UQ
Lib
rary
] at
06:
41 0
7 Se
ptem
ber
2013
to that of calcium carbonate on the surface of ettringite and confirms the existence of a surfacecarbonation.
Portlandite undergoes depression of the cds value upon epoxy coating. Interestingly, coatingthis mineral by the formulation R +H3st yields a relative increase in the cds value probably due tothe presence of dissolved calcium hydroxide in the coating. Portlandite is the most energetic sur-face. Interaction with high initial concentration of DETA (H3st) leaches calcium which is thenprobed by the n-alkanes.
The overall descriptors of surface acid–base properties cABIGC reflect the effect of epoxycoating on the specific properties of the minerals. Indeed, cABIGC descriptors provide evidencefor the minimisation of the acid–base character of the mineral substrates upon coating by theepoxy formulations. Unfortunately, we did not observe any trends in the cABIGC values for port-landite specimens upon coating and for this reason they are not reported here.
5.4. Differential scanning calorimetry
DSC was used to evaluate the effect of the cement paste–epoxy interfacial interactions on theTg of the epoxy. The Tg of a pure epoxy resin (R +Hst) prepared under the same conditionsas coating formulations (i.e. by mixing the DGEBA resin and amine hardener in a CHCl3solution and then removing the solvent by evaporation) was found to be at 48.7 °C.
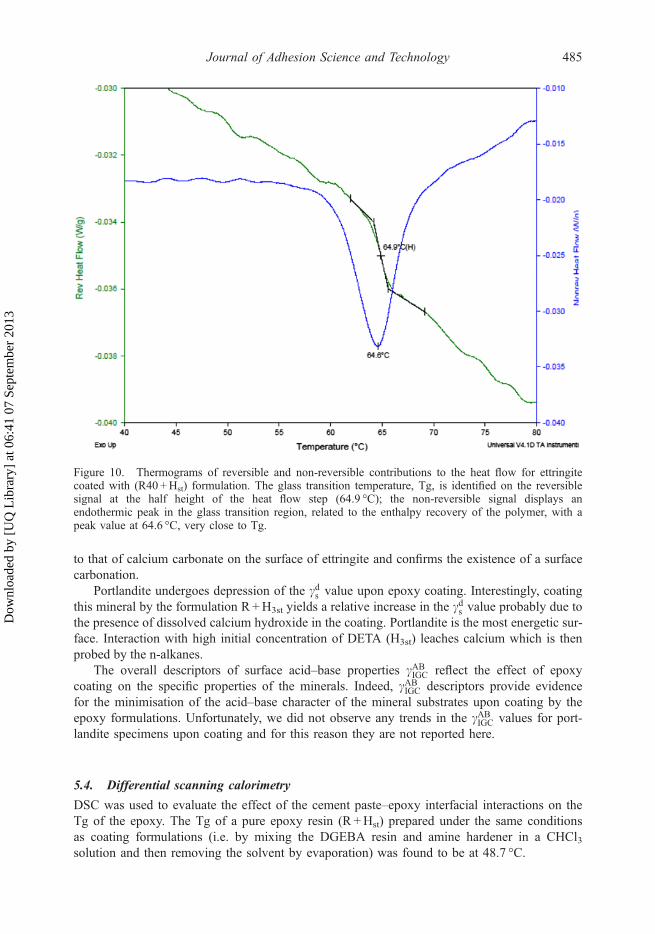
Figure 10. Thermograms of reversible and non-reversible contributions to the heat flow for ettringitecoated with (R40 +Hst) formulation. The glass transition temperature, Tg, is identified on the reversiblesignal at the half height of the heat flow step (64.9 °C); the non-reversible signal displays anendothermic peak in the glass transition region, related to the enthalpy recovery of the polymer, with apeak value at 64.6 °C, very close to Tg.
Journal of Adhesion Science and Technology 485
Dow
nloa
ded
by [
UQ
Lib
rary
] at
06:
41 0
7 Se
ptem
ber
2013
Tgs of formulated epoxies coated onto the model hydrates, i.e. C-S-H, ettringite and port-landite were then determined in order to reveal possible variations in the mobility of the poly-mer chains due to interfacial interactions. As an example, Figure 10 shows the thermogramsof the reversible/non-reversible contributions to the heat flow for the R40 +Hst coated ettring-ite sample (it should be noted that high epoxy resin loading was used for these DSC experi-ments, so that the glass transition could be detected in thermograms).
The Tg values obtained for the various coated hydrates were found to be 69.3, 64.9 and71 °C for C-S-H, ettringite and portlandite coated with (R40%+Hst), respectively. These Tgsare all significantly higher than 48.7 °C recorded for the pure (DGEBA+DETA) formulation.Moreover, significant differences were obtained between the coated specimens, as formulatedepoxy in contact with C-S-H and portlandite exhibited higher Tg values (and hence lowermolecular mobility) than that coated onto ettringite. Such results are consistent with previousFTIR findings (see above), which revealed specific interactions not only between hydroxylgroups of the mineral substrates and amine groups of the hardener, but also between OH ofthe DGEBA prepolymer and OH groups of Ca–OH (from portlandite and C-S-H).
6. Conclusion
In the present work, we investigated the interfacial chemistry between formulated epoxy sam-ples and model cement hydrates, namely C-S-H, ettringite and portlandite.
Stoichiometric and non-stoichiometric mixtures were coated from fresh chloroform solu-tions onto the mineral substrates. XPS revealed substantial surface modifications of the modelhydrates in contact with the epoxy formulations. In particular, a relative increase of the cal-cium content (with respect to Si and Al contents in the case of C-S-H and ettringite, respec-tively) was observed as the concentration of DETA hardener increased in the epoxyformulation. This result suggests a competition between N+ and Ca2+ ions at the surface ofthe substrates, possibly involving surface dissolution/complexation.
IR spectroscopy then confirmed the existence of specific interactions between the aminehardener and OH groups present at the surface of model hydrates, especially for portlandite.
Interactions were also revealed between OH groups present on molecules of DGEBA pre-polymer and OH groups from portlandite. Further analyses by DSC showed that the micro-structure of the formulated epoxy in contact with hydrates was significantly altered. Indeed,Tgs were significantly higher than that of the bulk formulated epoxy, suggesting a reducedmobility of the macromolecular chains at the mineral–epoxy interface, hence the existence ofspecific interactions between the formulated epoxy components and the mineral compounds.
Note1. Hydraulic binders are mineral compounds, such as cement, whose reaction with water leads to the
formation of hardened cementitious matrices.
References
[1] Delucchi M, Barbucci A, Cerisola G. Crack-bridging ability of organic coatings for concrete: influ-ence of the method of concrete cracking, thickness and nature of the coating. Progress in OrganicCoatings. 2004;49:336–41.
[2] Barbucci A, Delucchi M, Cerisola G. Organic coatings for concrete protection: liquid water andwater vapour permeabilities. Progress in Organic Coatings. 1997;30:293–7.
[3] Carmona-Quiroga PM, Rubio J, Sanchez MJ, Martinez-Ramirez S, Blanco-Varela MT. Surface dis-persive energy determined with IGC-ID in anti-graffiti-coated building materials. Progress inOrganic Coatings. 2011;71:207–12.
486 F. Djouani et al.
Dow
nloa
ded
by [
UQ
Lib
rary
] at
06:
41 0
7 Se
ptem
ber
2013
[4] Cestari AR, Vieira EFS, Tavares AMG, Andrade MAS. Cement-epoxy/water interfaces – energetic,thermodynamic, and kinetic parameters by means of heat-conduction microcalorimetry. Journal ofColloid and Interface Science. 2010;343:162–7.
[5] Cestari AR, Vieira EFS, Pinto AA, Da Rocha FC. Synthesis and characterization of epoxy-modi-fied cement slurries—kinetic data at hardened slurries/HCl interfaces. Journal of Colloid and Inter-face Science. 2008;327:267–74.
[6] Benzarti K, Chataigner S, Quiertant M, Marty C, Aubagnac C. Accelerated ageing behaviour ofthe adhesive bond between concrete specimens and CFRP overlays. Construction and Building 40Materials. 2011;25:523–38.
[7] Krelaus R, Wisner G, Freisinger-Schadow S, Schmidt M, Böhm S, Dilger K. Resistance of adhe-sive bonding of ultra-high performance concrete to hygrothermal, corrosive, and freeze-thawcycling environments. Journal of ASTM International. 2009;6:18pages. doi:10.1520/JAI101990.
[8] Mays GC, Hutchinson AR. Adhesives in Civil Engineering. Cambridge: Cambridge UniversityPress; 1992. pp. 243–93.
[9] Belgacem MN, Gandini A. Inverse gas chromatography as a tool to characterize dispersive andacid base properties of the surface of fibers and powders. Surfactant Science Series.1999;80:41–124.
[10] Demathieu C, Chehimi MM, Lipskier J-F. Inverse gas chromatographic characterization of func-tionalized polysiloxanes. Relevance to sensors technology. Sensors and Actuators B. 2000;62:1–7.
[11] Chehimi MM, Abel M-L, Perruchot C, Delamar M, Lascelles SF, Armes SP. The determination ofthe surface energy of conducting polymers by inverse gas chromatography at infinite dilution. Syn-thetic Metals. 1999;104:51–9.
[12] Perruchot C, Chehimi MM, Delamar M, Lascelles SF, Armes SP. A physicochemical study ofpolypyrrole-silica nanocomposites by inverse gas chromatography. Journal of Colloid and InterfaceScience. 1997;193:190–9.
[13] Voelkel A, Strzemiecka B, Adamska K, Milczewska K. Inverse gas chromatography as a source ofphysiochemical data. Journal of Chromatography A. 2009;1216:1551–66.
[14] Lara J, Schreiber HP. Specific interactions and adsorption of film-forming polymers. Journal ofCoatings Technology. 1991;63(801):81–90.
[15] Chehimi MM, Abel M-L, Sahraoui Z. An inverse gas chromatographic study of the PMMA/con-ducting polypyrrole interface. Journal of Adhesion Science and Technology. 1996;10:287–303.
[16] Oliva V, Mrabet B, Baeta Neves MI, Chehimi MM, Benzarti K. Characterization of cement pastesby inverse gas chromatography. Journal of Chromatography A. 2002;969:261–72.
[17] Adolphs J. Surface energies of hardened cement paste depending on relative humidity. Materialsand Structures. 2005;38(May):443–8.
[18] Benzarti K, Perruchot C, Chehimi MM. Surface energetics of cementitious materials and theirwettability by an epoxy adhesive. Colloids and Surfaces A. 2006;286:78–91.
[19] Owens DK, Wendt RC. Estimation of surface free energy of polymers. Journal of Applied PolymerScience. 1969;13:1741–7.
[20] Baeta Neves M-I, Chabut M, Perruchot C, Chehimi MM, Benzarti K. Interfacial interactions ofstructural adhesive components with cement pastes. Studies by inverse gas chromatography (IGC).Applied Surface Science. 2004;238:523–9.
[21] Baeta Neves M-I, Oliva V, Mrabet B, Chehimi MM, Connan C, Delamar M, Roberts A, Hutton S,Benzarti K. The surface chemistry of cement pastes. A study by X-ray photoelectron spectroscopy.Surface and Interface Analysis. 2002;33:834–41.
[22] Djouani F, Connan C, Chehimi MM, Benzarti K. Interfacial chemistry of epoxy adhesives onhydrated cement paste. Surface and Interface Analysis. 2008;40:146–50.
Journal of Adhesion Science and Technology 487
Dow
nloa
ded
by [
UQ
Lib
rary
] at
06:
41 0
7 Se
ptem
ber
2013
[23] Benzarti K, Gonon L, Baeta-Neves M-I, Chehimi MM. Interfacial areas between cement pastesand epoxy resins. A multi-technique approach. In: Proceedings of the 11th International Con-gress on Polymers in Concrete ICPIC’04 (ISBN 3-00-013706-8), Berlin (Germany): BAM;2004, pp. 547–54.
[24] Djouani F, Connan C, Delamar M, Chehimi MM, Benzarti K. Cement paste-epoxy adhesive inter-actions. Construction and Building Materials. 2011;25:411–23.
[25] Hamid SA. The crystal-structure of the 11-A natural tobermorite Ca2.25.[Si3O7.5(OH)1.5].1H2O.Zeitschrift für Kristallographie. 1981;154:189–98.
[26] Chaussadent T, Baroghel-Bouny V, Rafaï N, Ammouche A, Hornain H. Influence du rapport E/Csur l’hydratation, la microstructure et les déformations endogènes de pâtes de ciment durcies.Revue Européenne de Génie Civil. 2001;5:217–30.
[27] Perruchot C, Chehimi MM, Vaulay M-J, Benzarti K. Characterisation of the surface thermody-namic properties of cement components by inverse gas chromatography at infinite dilution. CementConcrete Research. 2006;36:305–19.
[28] Al-Saigh ZY, Munk P. Study of polymer-polymer interaction coefficients in polymer blends usinginverse gas chromatography. Macromolecules. 1984;17:803–9.
[29] Viallis-Terrisse H. Interaction des Silicates de Calcium Hydratés, principaux constituants du ciment,avec les chlorures d’alcalins. Analogie avec les argiles [PhD Thesis]. [France]: Université deBourgogne; 2000.
[30] Barr TL, Hoppe EE, Hardcastle S, Seal S. X-ray photoelectron spectroscopy investigations of thechemistries of soils. Journal of Vacuum Science and Technology A. 1999;17:1079–85.
[31] Debontridder F. Influence de l’acidité de surface sur les mécanismes précurseurs deformation d’uneinterphase dans les assemblages époxy-aluminium. Caractérisation des interactions avec une molé-cule modèle de durcisseur aminé [PhD Thesis]. [France]: Université Paris XI; 2001.
[32] Kin J-H, Robertson ER. Effects of polyvinyl alcohol on aggregate-paste bond strength and theinterfacial transition zone. Advanced Cement Based Materials. 1998;8:66–76.
[33] Marmorato Gomes CE, Ferreira OP, Fernandes MR. Influence of vinyl acetate-versatic vinylestercopolymer on the microstructural characteristics of cement pastes. Materials Research.2005;8:51–6.
[34] Silva DA, Roman HR, Gleize PJP. Evidences of chemical interaction between EVA and hydratingPortland cement. Cement Concrete Research. 2002;32:1383–90.
[35] Knapen E, van Gemert D. Cement hydration and microstructure formation in the presence ofwater-soluble polymers. Cement Concrete Research. 2009;39:6–13.
[36] Dorris GM, Gray DG. Adsorption of n-alkanes at zero surface coverage on cellulose paper andwood fibers. Journal of Colloid and Interface Science. 1980;77:353–62.
[37] Brookman DJ, Sawyer DT. Specific interactions affecting gas chromatographic retention for modi-fied alumina columns. Analytical Chemistry. 1968;40:106–10.
[38] Riedl B, Chtourou H. Interactions in cellulose-polyethylene papers as obtained through inverse gaschromatography. Surfactant Science Series. 1999;80:125–44.
[39] Al-Saigh ZY. Review: inverse gas chromatography for the characterization of polymer blends.International Journal of Polymer Analysis and Characterization. 1997;3:249–91.
[40] Al-Ghamdi A, Al-Saigh ZY. Surface and thermodynamic characterization of conducting polymersby inverse gas chromatography: I. Polyaniline. Journal of Chromatography A. 2002;969:229–43.
[41] Balard H, Papirer E. Characterization and modification of fillers for paints and coatings. Progressin Organic Coatings. 1993;22:1–17.
[42] Calhoun A, Chiang E. Determination of the surface energetics of surface modified calcium carbon-ate using inverse gas chromatography. Journal of Vinyl and Additive Technology. 2006;12:174–82.
488 F. Djouani et al.
Dow
nloa
ded
by [
UQ
Lib
rary
] at
06:
41 0
7 Se
ptem
ber
2013
[43] Mravčáková M, Boukerma K, Omastová M, Chehimi MM. Montmorillonite/Polypyrrole Nanocom-posites. The effect of organic modification of clay on the chemical and electrical properties. Materi-als Science and Engineering C. 2006;26:306–13.
[44] Boukerma K, Mičušík M, Mravčáková M, Omastová M, Vaulay MJ, Beaunier P, Chehimi MM.Surfactant-assisted control of the surface energy and interfacial molecular interactions of polypyr-role. Colloids and Surfaces A. 2007;293:28–38.
[45] Papirer E, Balard H, Rahmani Y, Legrand AP, Faccini L, Hommel H. Characterization by inversegas chromatography of the surface properties of silicas modified by poly(ethylene glycols) andtheir models (oligomers, diols). Chromatographia. 1987;23:639–47.
[46] Abel M-L, Chehimi MM, Fricker F, Delamar M, Brown AM, Watts JF. Adsorption of PMMA andPVC blends onto polypyrrole: a study by XPS, ToF-SSIMS and inverse gas chromatography. Jour-nal of Chromatography A. 2002;969:273–85.
[47] Hamieh T, Toufaily J, Mouneimné AH. Effect of the tacticity of PMMA adsorbed on Alumina andSilica on the specific entropy change of polymer by inverse GC. Chromatographia.2011;73:99–107.
Journal of Adhesion Science and Technology 489
Dow
nloa
ded
by [
UQ
Lib
rary
] at
06:
41 0
7 Se
ptem
ber
2013