interactions of bradykinin, calcium, g-protein and protein kinase in the activation of phospholipase...
TRANSCRIPT
Agents Actions 40 (1993) 0065-4299/93/020110-09 $1.50 + 0.20/( �9 1993 Birkh/iuser Verlag, Base
Interactions of bradykinin, calcium, G-protein and protein kinase in the activation of phospholipase A2 in bovine pulmonary artery endothelial cells
Dennis Ricupero, Linda Taylor and Peter Polgar
Boston University School of Medicine, Boston, MA 02118, USA
Abstract
Rise in free cytosolic calcium concentrations [Ca2+]i in response to bradykinin and guanosine 5'- O-thiotriphosphate (GTPzS) was related to the action of phospholipase A2 (arachidonic acid release). At 900 ~tM extracellular CaC12, bradykinin induced a typical Ca 2 § movement consisting of an initial [Ca 2 +]i peak at approximately 400 nM followed by a sustained increase in the steady-state cytosolic Ca 2 + level at approximately 290 nM. As the extracellular CaC12 concentration was reduced to 100 gM, the bradykinin induced initial spike was reduced followed by only a marginal increase in steady-state cytosolic Ca 2 § levels. Treatment of endothelial cells with saponin (0.002% w/w) did not increase [Ca2+]i and saponin treated cells exhibited a very similar pattern of Ca 2 + mobilization in response to bradykinin. However, with saponin treatment, GTPzS (100 txM) increased [Ca2+]i at an almost identical tracing exhibited with 50 nM bradykinin stimulation (in either the presence or absence of 0.002% saponin). No additive increase in [Ca2+]i was observed in cells stimulated with both 100 gM GTPzS and 50nM bradykinin or in bradykinin stimulated cells subsequently exposed to GTPzS. Pertussis toxin (PTX) did not affect the bradykinin induced Ca 2 + mobilization. However, as we showed previously [1], PTX inhibited bradykinin stimulated arachidonic acid release. These results indicate transduction of the bradykinin signal by G-protein for both phospholipase A2 (PLA2) activation and Ca 2 § mobilization but likely by different G~ subunits, a PTX sensitive and an insensitive subunit. Furthermore, the bradykinin and GTPzS stimulated release of arachidonic acid appears to be only partially dependent on [Ca2+]i. For example, 10 txM ionomycin, a calcium ionophore, did not release arachidonic acid at extracellular CaC12 concentrations below 300 ~tM while GTPzS stimulated a greater release of arachidonic acid at 300 and 100 ~tM CaC12 than at 900 txM CaC12. However, at 100 gM CaC12, ionomycin increased [Ca2+]i to the same level as bradykinin or GTPzS stimulated cells incubated in 900 gM CaClz. In previously published experiments [1], we showed that phorbol 12-myristate 13-acetate (TPA) augments bradykinin activated arachidonic acid release in endothelial cells. In the absence of bradykinin, TPA had little effect on arachidonic acid release by endothelial cells. However, in the saponin treated cells, TPA alone (in the absence of bradykinin) caused a marked release of arachidonic acid. The bradykinin and TPA activated arachidonic acid releases were additive. The TPA activated release did not require an increase in [Ca 2 +]i and occurred in the absence of any added extracellular CaCI2. TPA did not induce an increase in [Ca2+]i in either saponin treated or untreated endothelial cells. This TPA stimulated release of arachidonic acid was totally down-regulated by an 18 h preincubation of the cells in 500 nM TPA but was not inhibited by protein kinase C inhibitor H7.
Agents Actions 40 (1993) 111
Introduction
Perhaps the simplest and best understood brady- kinin responsive system is the vasculature where BK generally causes vasodilation and increases vascular permeability [51-53]. Bradykinin interac- tion with major blood vessels results in prostacyc- lin synthesis, particularly in endothelial cells [21]. In addition to its action in the vasculature, BK interacts with a variety of tissues and cell types, resulting in diverse biological activities. For these reasons BK is often used as an effector in studies on signal transduction. Bradykinin activated cellular response includes Ca 2+ mobilization [2, 3] and the release of unesterified arachidonic acid from cellular lipid stores [4]. Cumulative evidence indicates that the major source of the unesterified arachidonic acid utilized for prostaglandin syn- thesis is released from phospholipid stores by phos- phatide-2-acyl-hydrolase (phospholipase A2) [5-8]. The bradykinin induced cellular Ca 2+ movement is comprised of an initial spike, apparently due to the release of Ca 2 § from intracellular stores, fol- lowed by an increased steady state of the cytosolic Ca 2 + level, apparently due to the entry of extracel- lular Ca 2§ [9]. Electrophysiologic and channel blocking data using bovine aortic and pulmonary artery endothelial cells indicate that neither the rapid spike nor the increased steady-state level occur via voltage sensitive calcium channels [10, 11]. In fact, the bradykinin activated Ca 2 § influx may occur via receptor regulated channels [12, 13]. The role of Ca 2+ influx in the release of arachidonic acid and activation of phospholipase A 2 is important but not well understood [14-16]. In addition to Ca 2+ influx, bradykinin activates the hydrolysis of phosphatidyl inositoI 4,5-bisphos- phate (PIP2) by phospholipase C (PLC) to yield inositol 1,4,5-trisphosphate (IP3) and diacyl- glycerol [17, 18]. IP 3 mediates the release of Ca 2 + from intracellular stores and may be responsible for part or all of the Ca 2+ response following bradykinin stimulation. Diacylglycerol (DAG) is known to activate protein kinase C (PKC). But the function of DAG and PKC in the bradykinin stimulated arachidonic acid release has yet to be resolved. Additionally, mitogen activated protein (MAP) kinase has been reported to phosphorylate PLA2 [56]. In vascular endothelial cells, the bradykinin B2 receptors are probably coupled via G-proteins to a Ca 2+ de- pendent PLC, resulting in phosphoinositide break-
down, diacylglycerol formation, and enhanced cytosolic Ca 2+ levels [11, 18-20]. In a previous report we found that bradykinin and GTPzS caused the release of arachidonic acid in endothe- lial cells. In this series of experiments we investi- gate the effect of GTPzS and bradykinin on Ca 2 § mobilization and relate increases in cytosolic Ca 2+ concentration ([Ca2+]i) to the release of arachidonic acid. We also investigate further the interaction of bradykinin and TPA in the release of arachidonic acid and the activation of PLA2.
Materials and methods
Endothelial cells. Bovine pulmonary artery endo- thelial cells were isolated without the use of pro- teolytic enzymes as previously described [21] and were maintained in 25 cm 2 flasks containing 6 ml McCoy's 5A medium (Sigma, MO), 20% fetal bo- vine serum (FBS) (HyClone, UT), 50 ktg/ml strepto- mycin and 50 units/ml penicillin. The culture medium was replaced every 3 days and the cells passaged biweekly. The homogeneity of endothe- lial cell cultures was determined morphologically and histochemically.
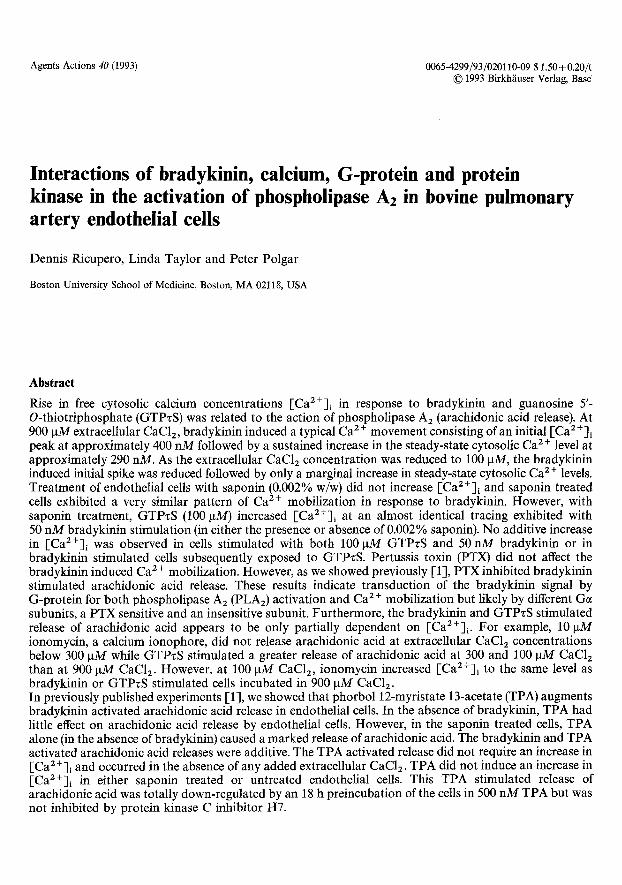
Treatment of cells with saponin. To allow entry of the nonhydrolyzable GTP analog, GTPzS (Boeh- ringer Mannheim, IN), into endothelial cells, monolayers or single cell suspensions were exposed to 0.002% (w/w) saponin (Sigma, MO) in McCoy's medium at room temperature for 3 min as pre- viously described [1, 22-24]. The saponin medium was removed, cells were washed and GTPzS was added at the indicated concentrations for the in- dicated times. The relationship between saponin concentration and the entry of extracellular Ca 2 § into the treated cells is shown in Fig. 1. At lower concentrations of saponin (0.001% and 0.002%), no detectable increase in [Ca 2§ ]i was observed. As the saponin was increased to 0.003%, [Ca 2 +]i be- gan to increase. At 0.005% saponin the cells were fully permeable to Ca z+. The peak level of cytosolic Ca 2 + of 4 gM reflects the maximal fluor- escence for the amount of fura 2 employed.
[Ca2+]i determinations. Single cell suspensions were made from confluent monolayers of endothe- lial cells. Cells were washed 2 • with Hank's bal- anced salt solution (GIBCO) and treated briefly with trypsin (0.08%) until they began to separate from the monolayer. Ceils were removed from
112 Agents Actions 40 (1993)
5000
0 r 0 [--
r
4000
3000
2000
1000
0 0
/",,, . . . . . .
005% / .004%
/.-4
.003%
~ " ' " " " .................... " ........ " ' . 0 0 2 ' ,
. . . . . . . . . . . . . . . . . . . . . . . . . . . . . . . . . . . . . . . . . . . . . . . . . . . . . . . . . . : , 0 0 1 % t i 1 i
5 0 1 O 0 1 5 0 2 0 0 2 5 0 3 0 0
TIME ( s e c o n d s ) Figure I Endothelial cells maintained at 900 I, tM CaC12 were loaded with fura-2 AM as described in the Methods section. Saponin 0.005% (solid line), 0.004% (dashed line), 0.003% (small dashed line), 0.002% (dotted line), or 0.001% (small dotted line) was added to the ceils at 56 s and the cytosolic Ca 2+ concentrations were determined as described in the Methods section.
the plate in HEPES buffered saline (HBS) (140 mM NaC1, 5 mM KC1, 1 mM MgC12, 10 mM glucose, 0.9mM CaC12, 0.1% BSA, 15mM HEPES pH 7.4) containing 10% FBS. The cell suspension was washed 2 x with serum free HBS and resuspended in serum free HBS at a final concentration of 107 cells/ml. Fura-2 AM (Molecu- lar Probes, Eugene, Oregon), diluted to 1 mM with DMSO, was added to the suspension in the dark to a final concentration of 1 laM. The cells were incu- bated in the dark for 30 rain at room temperature. The cell suspension was then diluted 10 x with HBS and incubated another 30 min at room tem- perature. The cells were pelleted and resuspended in HBS at a concentration of 4 x 10 6 cells/ml and were kept on ice until use (up to 1 h). For PTX experiments the monolayers were preincubated with 25 ng/ml PTX for 4 h at 37~ in 1% FBS. PTX was included during the Fura-2 AM loading procedure. Fluorescence was determined using a computer driven Perkin Elmer LS3B fluorescence spectrom- eter. Cells (1.5 x 10⁶) were added to a polystyrene cuvette in a total volume of 2 ml. The cell suspen- sion was continuously stirred using a magnetic stir bar. The temperature was maintained at 37 ~ with
a water bath. The excitation monochromator alter- nated between 340 and 380 nm and the emission was measured at 505 nm. The procedure cycled at 7 s intervals. After determining autofluorescence, the signal ratio at 340 and 380 nm was determined. [Ca 2 +] was obtained using the following equation [253:
[Ca 2 +] = Kd [ R -- Rmin)/(Rmax - - R) ]/[ Sf2/Sb2),
where Kd for the fura-2 Ca 2 + complex at 37 ~ was taken to be 225 nM. Rmax is the maximal fluor- escence ratio determined after addition of .005% saponin. Rmi, is the minimal ratio determined by the subsequent addition of EGTA to a final con- centration of 8 mM. S f 2 / S b 2 is the ratio of the fluorescence value at 380 nm excitation determined at Rm~n and Rmax.
Calcium electrode. The calcium content of the solutions containing various concentrations of CaCI2 was measured with a Ca 2§ ion selective macroelectrode by Dr. Simon Levy of the Physi- ology Department, Boston University, Boston, MA [26]. The electrode-determinated C a 2 + values agreed well at 900-10 laM CaC12. Buffers below 10 pM CaCI2 did not register reproducible values. This may be due to other salt impurities [20].
Release of 3H-arachidonic acid from cellular stores. Confluent monolayers of endothelial cells, grown in 24-well plates, were fed 2 days prior to the experiment. Eighteen hours before the experiment, cells were prelabeled with 3H-arachidonic acid (3H-ARA). Small aliquots of medium (50-100 ~tl) were removed from each well and pooled, aH-ARA was added to this medium and the medium was sterilized by filtration through a millipore filter (0.22 ~tm pore size). Aliquots were added back to the wells at 350 000 cpm per well. Eighteen hours later the medium was removed and counted to determine the percentage uptake. The cells were washed once with 0.5 ml/well warm McCoy's me- dium and incubated in a medium containing 1% FBS for 2 h. For Bordella pertussis toxin (PTX) experiments, the cells were incubated in a medium containing 1% FBS for 4 h at 37 ~ with indicated concentrations of PTX. The preincubation me- dium was removed and counted. The cells were washed again as before and incubated in McCoy's medium containing 2 mg/ml bovine serum albumin plus or minus other compounds. For
Agents Actions 40 (1993)
5oo
400
300 0
O co 2 0 0 o E-,
L.)
100
o o
Figure 2
A ............. + N i C l z I
B K
i i
I O0 2O0 300
TIME (seconds)
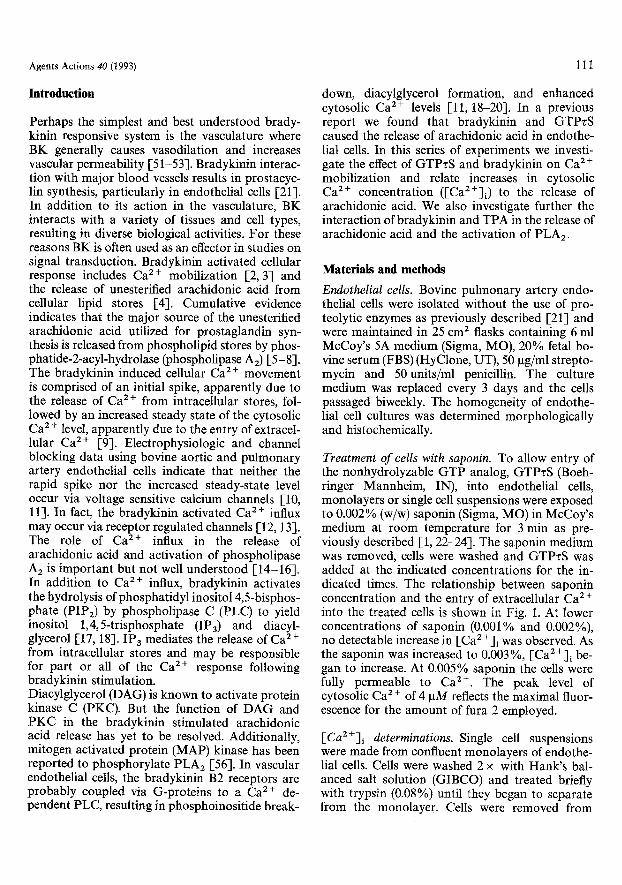
Endothelial cells were loaded with fura-2 AM as described in the Methods section. The cells were placed in a spectrofluorimeter in H B S c o n t a i n i n g 900 g M CaC12 (solid line) or in HBS containing 900/ , tM CaC12 plus 4 m M NiC12 (dashed line). Bradykinin at 50 n M final concentration was added to the cells at 105 s. Cytosolic Ca 2§ concentrations were determined as described in the Methods section.
113
1000
900
800
7 0 0
+ o o o
rO 5OO (_)
I i i
" ' - " 900p, M CaCl
BK IONOM~CIN 0 400 CO 0
300 ~-, 100/zM CaCl ~.)
20O
100
0 t i i i i i
50 100 150 200 250 300 350 400
TIME (seconds)
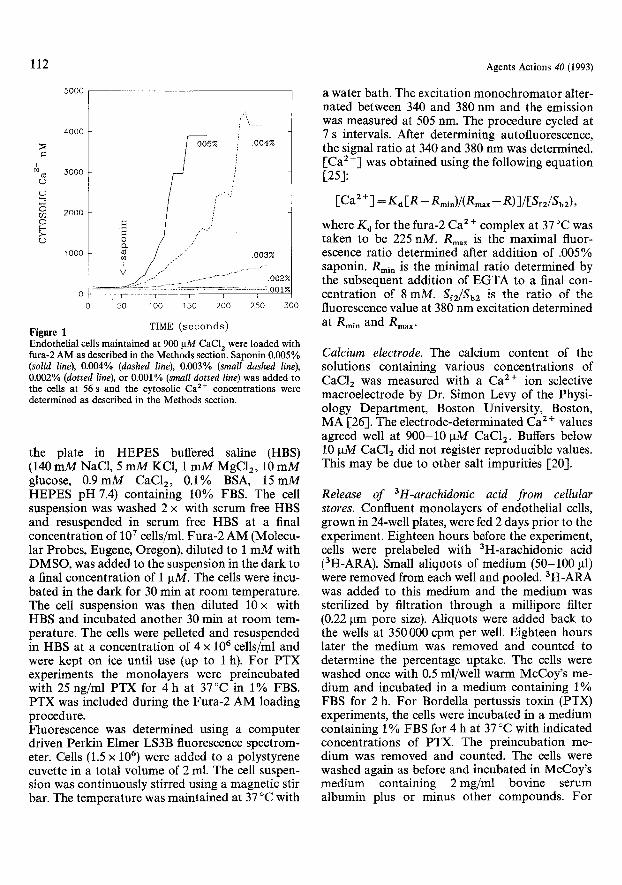
Figure 3 Endothelial cells were loaded with fura-2 AM as described in the Methods section. The cells were placed in a spectrofluorimeter in H B S c o n t a i n i n g 900 g M CaC12 (dashed line) or in HBS contain- ing 100 gM CaC12 (solid line). The cells were stimulated with 5 0 n M bradykinin at 77s and 101.tM ionomycin at 182s . Cytosolic Ca 2 + concentrations were determined as described in the Methods section.
experiments requiring varying CaC12 concentra- tions, McCoy's medium was replaced with modi- fied Hank's salt solution (HBSS) with 10 mM HEPES pH 7.4, 0.82 mM MgSO4, plus the in- dicated concentrations of CaC12. After 20 min at 37 ~ the medium was removed and transferred to 1.5 ml microfuge tubes. The medium was then cen- trifuged (2000 x g, 20 min) to pellet any loose cells. Radioactivity of an aliquot of the supernatant was determined in New England Nuclear Formula 963 (Boston, MA) using LKB Rackbeta counter.
Results
Bradykinin and C a 2 + f lux . The bradykinin stimu- lated Ca 2 § movement in endothelial cells is shown in Fig. 2. An aliquot of a single cell suspension of fura-2 loaded cells was stimulated with 50 nM bradykinin, inducing a sharp rise in intracellular Ca 2 + levels followed by an increased steady-state level of cytosolic Ca 2+, in agreement with other reports [10, 27]. The contribution of extracellular Ca 2 § to the bradykinin induced Ca 2 § movement is demonstrated in the same figure. The cells were incubated in buffer containing NiCI~, which is used to block the entry of extracullar Ca 2 § [28]. In the
presence of NiC12, the initial Ca 2+ spike in re- sponse to bradykinin was diminished. However, there was no increased steady-state level of cytosolic Ca 2 +. To determine the relationship of extracellular Ca 2 + concentrations to the bradykinin stimulated incease in [Ca2+]i, cells were incubated in buffer containing 900 or 100 ~tM CaC12. In cells incu- bated in buffer containing 900 laM CaC12, brady- kinin produced a Ca 2 § spike that peaked at about 390 nM, followed by a sustained increase of the steady-state cytosolic Ca 2 § level of approximately 280 riM. When the cells were subsequently stimu- lated with 10 gM ionomycin, the cytosolic [Ca 2 +] increased to 900 nM. In cells incubated in buffer containing 100 gM CaC12, bradykinin produced a Ca 2§ spike that peaked at about 200 nM, fol- lowed by a small increase in cytosolic Ca 2 +; sub- sequent stimulation with 10 gM ionomycin increased cytosolic [Ca 2+] to about 380nM, a concentration comparable to that found in brady- kinin stimulated cells incubated in 900 laM CaC12 (Fig. 3). Thus, ionomycin induced a Ca 2 + move- ment in cells incubated with 100gM CaC12 comparable to the Ca 2+ movement observed in bradykinin stimulated cells in 900 pM CaC12.
114 Agents Actions 40 (1993)
500 , , ,
450
4OO
550
+~ 3oo
2 5 0 , -3 , ~ .
o .................. ~;:::::..... In 200 o # .......
>" 150 r j
1 O0 - - - GTPTS +BK
50 - - BK
0 ~ I I 50 1 O0 150 2 0 0
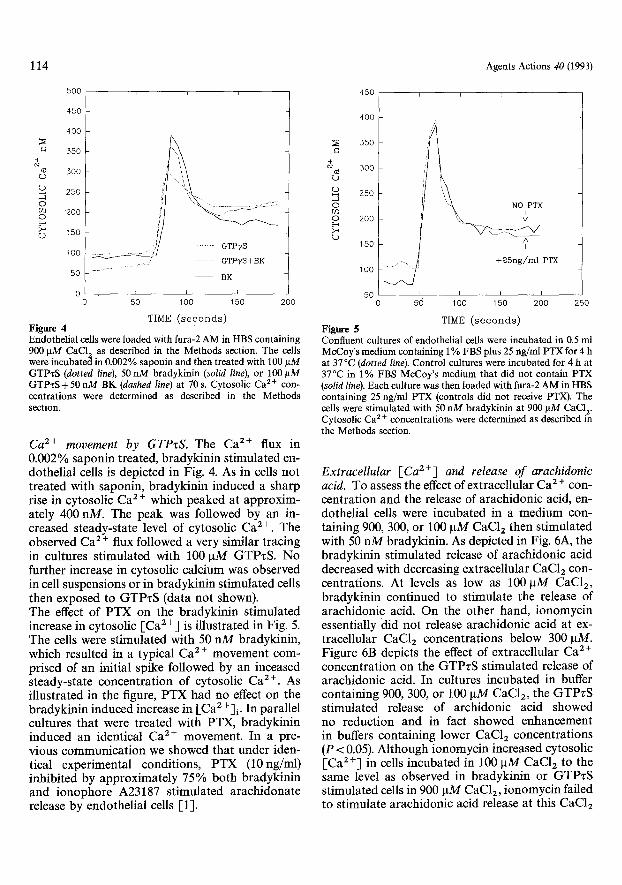
TIME ( s e c o n d s ) Figure 4 Endothel ia l cells were loaded with fura-2 A M in HBS conta in ing 900 ~tM CaC12 as described in the Methods section. The cells were incubated in 0.002% saponin and then t reated with 100 p M G T P z S (dotted line), 50 n M bradyk in in (solid line), or 100 ~tM G T P z S + 5 0 n M B K (dashed line) at 70 s. Cytosol ic Ca 2+ con- centra t ions were determined as described in the Methods section.
Ca 2+ movement by GTPzS . The Ca 2+ flux in 0.002 % saponin treated, bradykinin st imulated en- dothelial cells is depicted in Fig. 4. As in cells not treated with saponin, bradykinin induced a sharp rise in cytosolic Ca 2 + which peaked at approxim- ately 400 nM. The peak was followed by an in- creased steady-state level of cytosolic Ca 2+. The observed Ca 2 § flux followed a very similar tracing in cultures st imulated with 100 IxM GTPzS. No further increase in cytosolic calcium was observed in cell suspensions or in bradykinin st imulated cells then exposed to GTPzS (data not shown). The effect of PTX on the bradykinin st imulated increase in cytosolic [-Ca 2 +] is i l lustrated in Fig. 5. The cells were st imulated with 50 nM bradykinin, which resulted in a typical Ca 2 + movement com- prised of an initial spike followed by an inceased steady-state concentrat ion of cytosolic Ca 2+. As illustrated in the figure, PTX had no effect on the bradykinin induced increase in [Ca2 +] i. In parallel cultures that were treated with PTX, bradykinin induced an identical Ca 2§ movement. In a pre- vious communicat ion we showed that under iden- tical experimental conditions, PTX (10ng/ml) inhibited by approximate ly 75% both bradykinin and ionophore A23187 stimulated arachidonate release by endothelial cells [1].
4 5 0
400
35O
+ 3 0 0 o r,..)
2 5 0
0
0 2 0 0
L3 150
1 O0
5O 0 50
Figure 5
\'L NO i PTX
I
+25ng/ rn l P~X
I I I
1 O0 150 2 0 0
TIME ( s e c o n d s )
2 5 0
Confluent cultures of endothelial cells were incubated in 0.5 ml McCoy's medium containing 1% FBS plus 25 ng/ml PTX for 4 h at 37 ~ (dotted line). Control cultures were incubated for 4 h at 37~ in 1% FBS McCoy's medium that did not contain PTX (solid line). Each culture was then loaded with fura-2 AM in HBS containing 25 ng/ml PTX (controls did not receive PTX). The cells were stimulated with 50 nM bradykinin at 900 I-tM CaC12. Cytosolic Ca 2 + concentrations were determined as described in the Methods section.
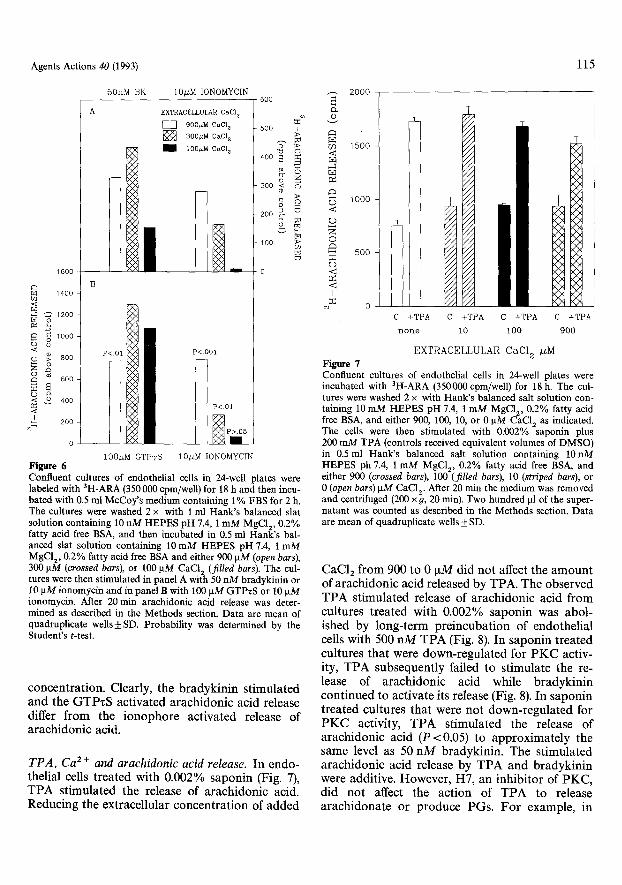
ExtracelluIar rCa 2+] and release o f arachidonic acid. To assess the effect of extracellular Ca 2 + con- centrat ion and the release of arachidonic acid, en- dothelial cells were incubated in a medium con- taining 900, 300, or 100 ~tM CaC12 then st imulated with 50 n M bradykinin. As depicted in Fig. 6A, the bradykinin stimulated release of arachidonic acid decreased with decreasing extracellular CaC12 con- centrations. At levels as low as 100 ~tM CaC12, bradykinin continued to stimulate the release of arachidonic acid. On the other hand, ionomycin essentially did not release arachidonic acid at ex- tracellular CaC12 concentrat ions below 300 IxM. Figure 6B depicts the effect of extracellular Ca 2 + concentrat ion on the GTPzS stimulated release of arachidonic acid. In cultures incubated in buffer containing 900, 300, or 100 IxM CaC12, the GTPzS stimulated release of archidonic acid showed no reduction and in fact showed enhancement in buffers containing lower CaC12 concentrations (P < 0.05). Although ionomycin increased cytosolic [Ca 2+3 in cells incubated in 100 I~M CaC12 to the same level as observed in bradykinin or GTPzS stimulated cells in 900 ~M CaC12, ionomycin failed to stimulate arachidonic acid release at this CaC12
Agents Actions 40 (1993) 115
1600
1400 < L~
o ~o0
ooo
~D ~ 800
~:~ 600
~ 400 < l 200
50nM BK 10/~M IONOMYCIN 600
EXTRACE~U~R CaCl 2
~3
l
900#M CaC12 500 SOO/zM CaCl z ~ ~E~
i O0/~M CaCl 2 4 % ~,oo ~
' ' ' I
01 1 P il I I P<01
IO~M IONOMYCIN I00#M GTPwS Figure 6 Confluent cultures of endothelial cells in 24-well plates were labeled with SH-ARA (350 000 cpm/well) for 18 h and then incu- bated with 0.5 ml McCoy's medium containing 1% FBS for 2 h. The cultures were washed 2 x with 1 ml Hank's balanced slat solution containing 10 nM HEPES pH 7.4, 1 mM MgC12, 0.2% fatty acid free BSA, and then incubated in 0.5 ml HanWs bal- anced slat solution containing 10 mM HEPES pH 7.4, i mM MgCI2, 0.2% fatty acid free BSA and either 900 gM (open bars), 300 gM (crossed bars), or 100 gM CaCI 2 (filled bars). The cul- tures were then stimulated in panel A with 50 nM bradykinin or 10 ~tM ionomycin and in panel B with i00 gM GTPxS or 10 gM ionomycin. After 20 min arachidonic acid release was deter- mined as described in the Methods section. Data are mean of quadruplicate wells_+ SD. Probability was determined by the Student's t-test.
c o n c e n t r a t i o n . Clearly, the b r a d y k i n i n s t i m u l a t e d a n d the G T P z S ac t i va t ed a r a c h i d o n i c ac id release differ f r o m the i o n o p h o r e ac t i va t ed release of a r a e h i d o n i c acid.
T P A , Ca 2 + and arachidonic acid release. I n e n d o - thel ia l cells t r e a t ed wi th 0 .002% s a p o n i n (Fig. 7), T P A s t i m u l a t e d the release of a r a c h i d o n i c acid. R e d u c i n g the ex t race l lu la r c o n c e n t r a t i o n of a d d e d
2000
U') 1500 ~// ~;~ ,<
"--] ~ 4>
1ooo <N
o
~E 500 <>4 <> t9 <M <)
o Z Z <a<~ C +TPA C +TPA C +TPA C +TPA none i0 100 900
EXTRACELLULAR CaCl z /r Figure 7 Confluent cultures of endothelial cells in 24-well plates were incubated with 3H-ARA (350000 cpm/well) for 18 h. The cul- tures were washed 2 x with Hank's balanced salt solution con- taining 10 mM HEPES pH 7.4, 1 mM MgC12, 0.2% fatty acid free BSA, and either 900, 100, 10, or 0 gM CaC12 as indicated. The cells were then stimulated with 0.002% saponin plus 200 mM TPA (controls received equivalent volumes of DMSO) in 0.5 ml Hank's balanced salt solution containing 10 nM HEPES [oh 7.4, 1 mM MgC12, 0.2% fatty acid free BSA, and either 900 (crossed bars), 100 (filled bars), 10 (striped bars), or 0 (open bars) gM CaCI 2. After 20 rain the medium was removed and centrifuged (200 x 9, 20 rain). Two hundred gl of the super- natant was counted as described in the Methods section. Data are mean of quadruplicate wells +_ SD.
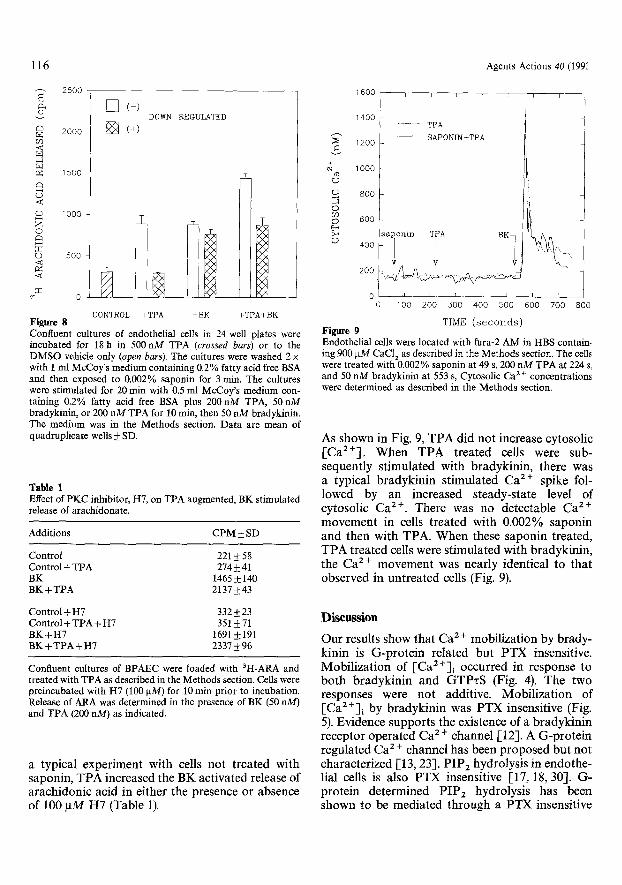
CaC1 z f r o m 900 to 0 g M d id n o t affect the a m o u n t of a r a c h i d o n i c acid re leased b y T P A . T h e o b s e r v e d T P A s t i m u l a t e d release of a r a c h i d o n i c acid f rom cu l tu res t r e a t ed wi th 0 .002% s a p o n i n was abo l - i shed by l o n g - t e r m p r e i n c u b a t i o n of endo the l i a l cells w i th 500 n M T P A (Fig. 8). I n s a p o n i n t r e a t ed cu l tu res t h a t were d o w n - r e g u l a t e d for P K C act iv- ity, T P A s u b s e q u e n t l y failed to s t imu la t e the re- lease of a r a c h i d o n i c ac id whi le b r a d y k i n i n c o n t i n u e d to ac t iva te i ts re lease (Fig. 8). In s a p o n i n t r e a t ed cu l tu res t h a t were n o t d o w n - r e g u l a t e d for P K C act ivi ty, T P A s t i m u l a t e d the release of a r a c h i d o n i c acid ( P < 0 . 0 5 ) to a p p r o x i m a t e l y the same level as 50 n M b r a d y k i n i n . T h e s t i m u l a t e d a r a c h i d o n i c acid release by T P A a n d b r a d y k i n i n were addi t ive . However , H7, a n i n h i b i t o r of P K C , d id n o t affect the a c t i o n of T P A to release a r a c h i d o n a t e or p r o d u c e PGs . F o r example , in
116 Agents Actions 40 (199."
2 5 0 0
2 0 0 0
<
1 5 0 0
~ 1000 Z o
o 5O0
I
0
Figure 8 CONTROL
[~ (-) DOWN-REGULATED
[] (+)
+TPA +BE +TPA+BK
Confluent cultures of endothelial cells in 24-well plates were incubated for 18 h in 500 nM TPA (crossed bars) or to the DMSO vehicle only (open bars). The cultures were washed 2 x with 1 ml McCoy's medium containing 0.2% fatty acid free BSA and then exposed to 0.002% saponin for 3 rain. The cultures were stimulated for 20 rain with 0.5 ml McCoy's medium con- taining 0.2% fatty acid free BSA plus 200riM TPA, 50 nM bradykinin, or 200 nM TPA for 10 rain, then 50 nM bradykinin. The medium was in the Methods section. Data are mean of quadruplicate wells • SD.
Table 1 Effect of PKC inhibitor, H7, on TPA augmented, BK stimulated release of arachidonate.
Additions CPM _+ SD
Control 221 • 58 Control + TPA 274 • 41 BK 1465 _ 140 BK+TPA 2137__.43
1 6 0 0 - - ~ I I r ~ - - i I - -
400 ............... TPA
, ~ 1 2 0 0 SAPONIN+TPA
+ 1 0 0 0
8 0 0
0 ~J3 0 6 0 0
>~ alonin iPA BK r..) 200400 �9 \ ~ ~
0 i i r i i i r 100 2 0 0 .300 4 0 0 5 0 0 6 0 0 7 0 0 8 0 0
TIME ( s e c o n d s ) Figure 9 Endothelial cells were located with fura-2 AM in HBS contain- ing 900 ~M CaC12 as described in the Methods section. The cells were treated with 0.002% saponin at 49 s, 200 nM TPA at 224 s, and 50 nM bradykinin at 553 s, Cytosolic Ca ~ § concentrations were determined as described in the Methods section.
As shown in Fig. 9, TPA did not increase cytosolic [Ca2+]. When TPA treated cells were sub- sequently stimulated with bradykinin, there was a typical bradykinin stimulated Ca 2 § spike fol- lowed by an increased steady-state level of cytosolic Ca 2+. There was no detectable Ca z+ movement in cells treated with 0.002% saponin and then with TPA. When these saponin treated, TPA treated cells were stimulated with bradykinin, the Ca 2 + movement was nearly identical to that observed in untreated cells (Fig. 9).
Control+ H7 332_ 23 Control + TPA + H7 351 + 71 BK+H7 1691 __.191 BK +TPA +H7 2337 •
Confluent cultures of BPAEC were loaded with 3H-ARA and treated with TPA as described in the Methods section. Cells were preincubated with H7 (100 gM) for 10 min prior to incubation. Release of ARA was determined in the presence of BK (50 nM) and TPA (200 riM) as indicated.
a typical experiment with cells not treated with saponin, TPA increased the BK activated release of arachidonic acid in either the presence or absence of 100 i.tM H7 (Table 1).
Discussion
Our results show that C a 2 + mobilization by brady- kinin is G-protein related but PTX insensitive. Mobilization of [Ca2+]~ occurred in response to both bradykinin and GTPzS (Fig. 4). The two responses were not additive. Mobilization of [Ca2+]~ by bradykinin was PTX insensitive (Fig. 5). Evidence supports the existence of a bradykinin receptor operated Ca 2 § channel 1-12]. A G-protein regulated Ca 2 § channel has been proposed but not characterized [13, 23]. PIP 2 hydrolysis in endothe- lial ceils is also PTX insensitive [17, 18, 30]. G- protein determined PIP2 hydrolysis has been shown to be mediated through a PTX insensitive
Agents Actions 40 (1993) 117
G,q G-protein subunit [31]. However, we showed in a previous communication that the stimulation of arachoidonate release by bradykinin or ionophore is inhibited by PTX [1]. Bradykinin stimulated arachidonic acid release is not driven by an increase in [Ca/+1 alone. For example, ionomycin mobilizes approximately the same amount of [Ca/+]i (400 nM), in buffer con- taining 100 gM CaCI2 as bradykinin or GTPzS in buffer containing 900 I, tM CaClz (Fig. 3). Yet, bradykinin and GTPzS increase arachidonic acid release at a much lower Ca 2 + concentration than ionomycin (Fig. 6). Whereas bradykinin still activ- ates arachidonic acid release at 100 ~tM CaCI/, and GTPzS activates maximum release at 300 gM CaCI/and remains very active at 100 gM CaC1/, ionomycin does not activate release below 300 gM CaC1/. Cumulative evidence indicates that in major vessel endothelial cells, PLA2 activity is primarily respon- sible for the generation of free arachidonic acid [5, 32, 33]. In a recent communication, our labor- atory illustrated that bradykinin increases mem- brane bound PLA/ activity in endothelial cells [46]. Isoelectric focusing and sucrose sedimenta- tion experiments illustrated that this PLA2 is either identical or very similar to the high molecular weight cytosolic PLAz cloned from human mono- blast U937 cells [34, 35]. GTPzS activates the release of arachidonic acid in endothelial cells [11. The actions of GTPzS and bradykinin are synergistic. Also, GTPzS affects the binding of bradykinin in viable cells. These results suggest that the bradykinin stimulated PLAz ac- tivity in endothelial cells is G-protein related. The cDNA for the B2 receptor has been isolated [36] and reveals a high degree of homology with other G-protein coupled receptors [36]. The bradykinin receptor can thus be envisioned as interacting with at least two types of G-protein, a PTX sensitive Gc~ subunit, possibly G,i/, and a PTX insensitive G, subunit, possibly G0~q. Upon interaction with the ligand, the c~ subunits would then activate PLA/ or PLC respectively. Furthermore, the liberated PTX insensitive subunit or perhaps the BY subunits could be interacting with a plasma membrane Ca / + transporter. Evidence exists that a /~z subunit participates in PLA/ activation [37, 38] perhaps by anchoring PLA/ to the membrane during its translocation.
By activating PLC, bradykinin generates diacyl- glycerol. The diacylglycerol could be a substrate for a lipase to release arachidonic acid [39, 40]. But the contribution of this pathway to the bradykinin stimulated release of arachidonic acid is minor [5, 6]. Diacylglycerol also activates PKC. The function of protein kinase C in the mechanism of bradykinin activation of arachidonate release is unclear. TPA, which mimics the action of DAG, activates PLA2 [46, 491. In intact cells, TPA en- hances the bradykinin stimulated release of arachidonic acid but does not activate arachidonic acid release in the absence of bradykinin or ionomycin [1]. However, when cells are treated with 0.002% saponin, bradykinin and TPA indi- vidually stimulate the release of arachidonic acid (Fig. 8), The release is additive and the TPA por- tion can be down-regulated (Fig. 8). Thus, activa- tion of PLA 2 by bradykinin and TPA are clearly separate events. Interestingly, TPA does not induce Ca 2+ move- ment in either intact or saponin treated ceils (Fig. 9). Also, when the CaC1/concentration of the incu- bation buffer is reduced from 900 to 0 ~tM added CaC12, the TPA stimulated release of arachidonic acid remains unhindered (Fig. 10). Thus, the TPA stimulated release of arachidonic acid is either not [Ca/+]i dependent or dependent on very small changes in [Ca / +1i not readily measurable. Experi- ments with cell free PLA/ preparations illustrate that TPA and Ca/+ ionophore A23187 activate PLA; differently [46]. Whereas the ionophore in- creases particulate PLA2 activity, TPA increases cytosolic PLA/ activity [46]. At least nine isozymes of PKC have been characterized [41-43], with various [CaS+]i dependencies [44, 45] includ- ing a [Ca/+li independent PKCe [47]. Alterna- tively, TPA may be activating MAP kinase, which in turn phosphorylates PLAz. MAP kinase has been implicated in PLA/ activation through phos- phorylation of serine 505 [56]. Also, activation of MAP kinase has been reported to take place by two routes: a calcium dependent, ionomycin re- lated path and a calcium independent path [54]. TPA has been reported to activate MAP-2 kinase in the presence of the PKC inhibitor, H7 [55]. We found that H7 does not inhibit the stimulatory role of TPA in PG synthesis (Table 1). The question remains as to the action of TPA in saponin treated and released cells. Interest- ingly, saponin at low concentration is known to cause membrane depolarization [48]. Membrane
118 Agents Actions 40 (19931
depolarization has been reported to cause translo- cation of PKC [50] and could be enabling translo- cation of the phosphorylated PLAn from the cytosol into the membrane. These results may have important implications with regard to the action of PLA2.
Acknowledgements
This work was supported by ata NIH grant HL25776 and AG 00115.
Received 13 July 1993; accepted by E. R. Pettipher, 9 September 1993
References
[1] D. A. Ricupero, L. Taylor, A. Tlucko, J. Navarro and P. Polgar, Mediat. Inflammation 1, 133 (1992).
[2] A. R. Whorton, S. L. Yong, J. L. Data, A. Barachowsky and R. S. Kent, Biochim. Biophys. Acta 712, 79 (1982).
[3] W. P. Schilling, L. Rajan and E. Strobl-Jager, J. Biol. Chem. 264, 12838 (1989).
[4] R.J. Flower and G. J. Blackwell, Biochem. Pharmacol. 25, 285 (1976).
[5] S. L. Hong and D. Deykin, J. Biol. Chem. 257, 7151 (1982). [6] S. L. Hong, N. J. McLaughlin, C. Tzeng and G. Patton,
Thrombin Res. 38, 1 (1985). [7] E. A. Jaffe, J. Grulich, B. B. Weks[er, G. Hampel and K.
Watanabe, J. Biol. Chem. 263, g557 (1987). [8] H. Kaya, G. M. Patton and S. L. Hong, J. Biol. Chem. 264,
4972 (1989). [9] S. Kremer, P. Harper, R. Hegele and K. Skorecki, Can. J.
Physiol. Pharmacol. 66, 43 (1987). [10] M. Colden-Stanfield, W. P- Schilling, A. K. Ritchie, S. G.
Eskin; L. T. Navarro and D. L. Kunze, Circ. Res. 61, 632 (1987).
[11] R. Morgan-Boyd, J. M. Stewart, F. J. Vavrek and A. Hassid, Am. J. Phys. 253, c588 (1987).
[12] P. C. Sternweis and I. Pang, Trends Neurosci. 13, 122 (1990). [13] L. Birnbaumer, J. Abramowitz and A. M. Brown, Biochem.
Biophys. Acta 1031, 163 (1990). [14] B. J. Buckley, A. Barachowsky, R. J. Dolor and A. R.
Whorton, Biochem. J. 280, 281 (1991). [15] A. Lfickhoff, U. Pohl, A. Mtilsch and R. Busse, Br. L
Pharaacol. 95, 189 (1988). [16] A. R. Whorton, C. E. Willis, R. S. Kent and S. L. Young,
Lipids 19, 17 (1984). [17] R.A. Voyno-Yasenetskaya, V. A. Tkachuk, E. G. Cheknyova,
M. P. Panchenko, G. Y. Grigorian, R. J. Vavrek, J. M. Stewart and U. S. Ryan, FASEB J. 3, 44 (1989}.
[18] T. L. Lambert, R, S. Kent mid A. R. Worton, J. Biol. Chem. 261, 15288 (1986).
[19] C. K. Derian and M. A. Moskowitz, J. Biol. Chem. 261, 3831 (1986).
[20] A. Lfickhoff, R. Zeh and R. Busse, Pfleiiegers Arch. 412, 654 (1988).
[21] M. Menconi, G. Hahn and P. Polgar, J. Cell. Physiol. 120, 163 (1984).
[22] G. Fiskum, Cell Calcium 6, 25 0985). 1"23] S. Chueh and D. L. Gill, J. Biol. Chem. 261. 13883 (1986).
[24] S. NakashJma, 3". Tohmatsu, H. Hattori, A. Suganuma and Y. Nozawa, J. Bioehem. 101, 1055 (1987).
[25] G. Grynkiewicz, M. Poenie and R. Y. Tsien, J. Biol. Chem. 260, 3440 (1985).
[26] S. Levy and A. Fein, J. Gen. Physiol. 85, 805 (1985). [27] A. Jones, T. W. Lategan, N. J. Lodge, U. S- Ryan, C. van
Breeman and D. J. Adams, Tissue and Cell 19, 733 (1987). [28] K. W. Buchan and W. Martin, Br. J. Pharmacol. 102, 35
(1991). [29] W. P. Schilling and S. J. Elliott, Am. J. Physiol. 262, H1617
(1992). [30] T.A. Voyno-Yasenetskaya, M. P. Panchenko, E. V. Nupenko,
V. O Rybin and V. A. Thachuk, FEBS Lett. 259, 67 (1989). [31] S- Gutowski, A. Smrcka, L. Nowak, D. Wu, M. Simon and P.
C. Sternweis, J. Biol. Chem. 266, 20519 (1991). [32] S- L. Hong and 13. Deykin, J. Biol. Chem. 254, 11463 (1979). [33] S. L Hong, Prog. Allergy 44, 99 (1988). [34] J. D. Sharp, D. L White, X. G. Chiou, T. Goodson, G. C.
Gamboa, D. McClure, S. Burgett, J. Hoskin, P. L. Skatrud, L. H. Kang, E. F. Robert and R. M. Krarner, J. Biol. Chem. 266, 1480 (1991).
[35] J. D. Clark, L.-L. Lin, R. W, Kriz, C. S. Ramesha, L. A. Sultzman, A. Y. Lin and J. L. Knopf, Cell 65, 1043 (1991).
[36] A- E. McEachern, E. R, Shelton, S. Bhakta, R- Obernolte, B. Chinh, P. Zuppan, J. Fujisaki, R. W. Aldrich and K. Jarnagin, Proc. Nail. Acad. Sci. USA 88, 7724 (1991).
[37] C. L. Jelsema and J. Axelrod, Proc. Natl. Acad. Sci. USA 84, 3623 (1987).
[38] D. Kim, D L Lewis, L Graziadei, E. J. Neer, D Bar-Sagi and D. E. Clapman, Nature 337, 557 (1989).
[39] R_ M. Burch, Mol. Neurobiol. 3, 155 (1989). [403 R- L. BeII, D. A. Kennedy, N. Stanford and P. W. Majerus,
Proc. Natl. Acad. Sci. USA 76, 3238 (1979). [41] Y Nishizuka, J. Am. Assoc. 262, 1826 (1989). [42] M. J. Berridge, J. Am. Med. Assoc. 262, 1834 (1989). [43] P- J. Parker, G. Kour, R. M. Marais, F. Mitchell, C. Pears, D.
Schaap, S. Stabel and C. Webster, Mol. Cell. Endocrinol. 65, 1 (1989).
[44] D. Schaap, P. J. Parker, A. Bristol, R. Kriz and J. Knopf, FEBS Lett. 243, 351 (1989).
[45] K. Sekiguchi, M. Tsukuda, K. Ogita, U. Kikkawa and Y. Nishizuka, Biochem. Biophys. Res. Commun. 145, 797 (1987).
[46] S. Paglin, R. Roy and P. Polgar, J. Biol. Chem. 268, 11697 (1993).
[47] K- S. Ha and J. H. Exton, J. Biol. Chem. 268, 10534 (1993). [48] J. Noireaud, C. M. Bright and D. Ellis, J. MoL Cardiok 21,
291-298 (1989). [49] A. Y. Lin, M. Wartman, L. Y. Lin, J. L. Kopf, A. Seth and R. J.
Davis, Cell 72, 269-278 (1993). [50] K. Ha-Soo and J. H. Exton, J. Biol. Chem. 268, 10534 (1989). [51] F. k Haddy, T. E. Emerson, J. B. Scott and R. M. Dougherty,
Handbook Exp. Pharmacol. 25, 362 (1970). [52] D. Regoli, N. Rhaleb, G. Drapeau, S. Dion, C. Tousignant
and P. D'OrleansOuste, Adv. Exp. Med. Biol. 236, 399 (1990). [53] T. Griesbacher and F. Lembeck, Br. J. Pharmacol. 92, 333
(1987). [54] T. S. Chao, K. L. Byron, K. M. Lee, M. Villereal and M. R.
Rosner, J. Biol. Chem. 267, 19876 (1992). [55] G. S. Campbell, L. Pang, T. Miyasaka, A. R. Saltiel and
C. Charter-Su, J. Biol. Chem. 267, 6074 (1992). [56] L L. Lin, M. Wartman, A. Y. Lin and J. L. Knopf, Cell 72, 269
(1993).